Structure of Clusters in Methanol-Water Binary Solutions ...
13
Structure of Clusters in Methanol-Water Binary Solutions Studied by Mass Spectrometry and X-ray Diffraction Toshiyuki Takamuku, Toshio Yamaguchi a , Masaki Asato b , Masaki Matsumoto b , and Nobuyuki Nishi c Department of Chemistry, Faculty of Science and Engineering, Saga University, Honjo-machi, Saga 840-8502, Japan a Department of Chemistry, Faculty of Science, Fukuoka University, Nanakuma, Jonan-ku, Fukuoka 814-0180, Japan b Department of Chemistry, Faculty of Science, Kyushu University, Hakozaki, Higashi-ku, Fukuoka 812-8581, Japan c Institute for Molecular Science, Myodaiji, Okazaki 444-8585, Japan Reprint requests to Prof. T. Y.; Fax: +81-92-865-6030; E-mail: [email protected] Z. Naturforsch. 55 a, 513-525 (2000); received February 11, 2000 The structure of clusters in methanol-water solutions in its dependence on the methanol mole fraction x M has been investigated by mass spectrometry on clusters isolated from submicron droplets by adiabatic expansion in vacuum and by X-ray diffraction on the bulk binary solutions. The mass spectra have shown that the average hydration number, (n m ), of m-mer methanol clusters decreases with increasing x M , accompanied by two inflection points at x M = ~0.3 and ~0.7. The X-ray diffraction data have revealed a similar change in the number of hydrogen bonds per water and/or methanol oxygen atom at ~2.8 A. On the basis of both results, most likely models of clusters formed in the binary solutions are proposed: at 0 < x M < 0.3 the tetrahedral-like water cluster is the main species, at 0.3 < x M < 0.7 chain clusters of methanol molecules gradually evolve with increasing methanol content, andfinally,at x M > 0.7 chain clusters of methanol molecules become predominant. The present results are compared with clusters previously found in ethanol-water binary solutions and discussed in relation to anomalies of the heat of mixing of methanol-water binary solutions. Keywords: Methanol-water Binary Solutions; Mass Spectrometry; X-ray Diffraction; Clusters; Hydrogen Bonds. 1. Introduction Solutions of alcohol and water are often used in chemical reactions, solvent extraction, high-perfor- mance liquid chromatography, etc. since their proper- ties can be varied for individual use by changing their composition. Franks and Ives [1] reviewed physico- chemical properties such as the enthalpy and entropy of mixing, and the partial molar volume for various alcohol-water mixtures. In these studies many authors have pointed out anomalies in the partial molar vol- ume [2], 'H-NMR chemical shift [3], dielectric re- laxation [4 - 6], aggregation behavior of chlorophyll [7], etc., and discussed their possible origin in terms of hydrogen bonding and hydrophobic interaction. Thus, structural investigations of methanol-water mixtures are essential for understanding their unique proper- ties. Various structural investigations have so far been made on neat methanol by X-ray [8 - 12] and neutron [13 - 18] diffraction and molecular dynamics simu- lation [19,20], Most of the authors reached the con- clusion that methanol molecules form chain clusters by hydrogen bonds. The structure of methanol-water mixtures has been investigated mostly by computer simulations [21 - 29], Pälinkäs and Bakö [27] made a molecular dynamics simulation on methanol, water, and their mixtures at methanol mole fractions x M = 0.1, 0.25 and 0.9, and estimated excess properties such as the potential energy and heat capacity of the mixtures. They found that the excess potential en- ergy of methanol-water mixtures has a minimum at 0932-0784 / 00 / 0500-527 $ 06.00 © Verlag der Zeitschrift für Naturforschung, Tübingen • www.znaturforsch.com
-
Upload
khangminh22 -
Category
Documents
-
view
0 -
download
0
Transcript of Structure of Clusters in Methanol-Water Binary Solutions ...

Structure of Clusters in Methanol-Water Binary Solutions Studied by Mass Spectrometry and X-ray Diffraction
Toshiyuki Takamuku, Toshio Yamaguchia, Masaki Asatob, Masaki Matsumotob, and Nobuyuki Nishic
Department of Chemistry, Faculty of Science and Engineering, Saga University, Honjo-machi, Saga 840-8502, Japan a Department of Chemistry, Faculty of Science, Fukuoka University,
Nanakuma, Jonan-ku, Fukuoka 814-0180, Japan b Department of Chemistry, Faculty of Science, Kyushu University,
Hakozaki, Higashi-ku, Fukuoka 812-8581, Japan c Institute for Molecular Science, Myodaiji, Okazaki 444-8585, Japan Reprint requests to Prof. T. Y.; Fax: +81-92-865-6030; E-mail: [email protected]
Z. Naturforsch. 55 a, 513-525 (2000); received February 11, 2000
The structure of clusters in methanol-water solutions in its dependence on the methanol mole fraction xM has been investigated by mass spectrometry on clusters isolated from submicron droplets by adiabatic expansion in vacuum and by X-ray diffraction on the bulk binary solutions. The mass spectra have shown that the average hydration number, (nm), of m-mer methanol clusters decreases with increasing xM, accompanied by two inflection points at xM = ~0.3 and ~0.7. The X-ray diffraction data have revealed a similar change in the number of hydrogen bonds per water and/or methanol oxygen atom at ~2.8 A. On the basis of both results, most likely models of clusters formed in the binary solutions are proposed: at 0 < xM < 0.3 the tetrahedral-like water cluster is the main species, at 0.3 < xM < 0.7 chain clusters of methanol molecules gradually evolve with increasing methanol content, and finally, at xM > 0.7 chain clusters of methanol molecules become predominant. The present results are compared with clusters previously found in ethanol-water binary solutions and discussed in relation to anomalies of the heat of mixing of methanol-water binary solutions.
Keywords: Methanol-water Binary Solutions; Mass Spectrometry; X-ray Diffraction; Clusters; Hydrogen Bonds.
1. Introduction
Solutions of alcohol and water are often used in chemical reactions, solvent extraction, high-perfor-mance liquid chromatography, etc. since their proper-ties can be varied for individual use by changing their composition. Franks and Ives [1] reviewed physico-chemical properties such as the enthalpy and entropy of mixing, and the partial molar volume for various alcohol-water mixtures. In these studies many authors have pointed out anomalies in the partial molar vol-ume [2], 'H-NMR chemical shift [3], dielectric re-laxation [4 - 6], aggregation behavior of chlorophyll [7], etc., and discussed their possible origin in terms of hydrogen bonding and hydrophobic interaction. Thus, structural investigations of methanol-water mixtures
are essential for understanding their unique proper-ties.
Various structural investigations have so far been made on neat methanol by X-ray [8 - 12] and neutron [13 - 18] diffraction and molecular dynamics simu-lation [19,20], Most of the authors reached the con-clusion that methanol molecules form chain clusters by hydrogen bonds. The structure of methanol-water mixtures has been investigated mostly by computer simulations [21 - 29], Pälinkäs and Bakö [27] made a molecular dynamics simulation on methanol, water, and their mixtures at methanol mole fractions xM = 0.1, 0.25 and 0.9, and estimated excess properties such as the potential energy and heat capacity of the mixtures. They found that the excess potential en-ergy of methanol-water mixtures has a minimum at
0932-0784 / 00 / 0500-527 $ 06.00 © Verlag der Zeitschrift für Naturforschung, Tübingen • www.znaturforsch.com
5 1 4 T. Takamuku et al. • Structure of Clusters in Methanol-Water Binary Solutions 514
xM = 0.25, which is close to a minimum (xM ä 0.3) of the heat of mixing at 25 °C [1]. To our knowl-edge, so far only neutron diffraction experiments on a methanol-water mixture at xu = 0.1 by using H/D substitution in methyl and water, were made [30], and it has been revealed that a definite hydration shell of water molecules exists at a distance of ~3.7 A from the methyl carbon atom. Neither X-ray nor neutron diffraction studies have been performed on methanol-water mixtures over the whole range of methanol con-centrations. We have previously made mass spectro-metric and X-ray diffraction measurements on etha-nol-water mixtures [31 - 33] and elucidated the com-position and structure of hydrogen bonded clusters formed in these mixtures.
In the present study, both mass spectrometric and X-ray diffraction experiments have been performed on binary solutions of water and methanol over a whole range 0 < xM < 1 to determine the composition and structure of predominant clusters. On the basis of the present findings, together with the previous results on ethanol-water mixtures, an effect of hydrophobic interaction on cluster formation in these water-alcohol mixtures is discussed. Finally, a change in heat of mixing for methanol-water mixtures is discussed from the structural point of view.
2. Experimental
2.7. Preparation of Samples
Methanol (Wako Pure Chemicals, extra grade) was dried with molecular sieves 4A 1/16 for several days. Dried methanol was refiuxed with a small amount of calcium oxide for several hours and distilled under ambient pressure. Doubly distilled water was used. The densities of the mixtures were determined at 25 °C with an electronic densimeter DMA 48 (An-ton Paar K.G.).
2.2. Mass Spectrometry
A method of adiabatic expansion of liquid droplets in vacuum has been described in [34 - 37], A flow of droplets was generated by hydrodynamic conversion of liquid from a notched small nozzle with a diame-ter of ~40 (im. These droplets were introduced into high vacuum chambers through two skimmers. We used two different mass spectrometers: a quadrupole mass spectrometer (Extrel 7-162-8 coupled with 311-12H) and a double focus spectrometer with electric
and magnetic sectors (Kratos Analytical, Profile). The ionizer of the latter system was modified with a home-made ion repeller. The central part of this repeller is made of a 25-(im wire mesh with a 90% transmit-tance. The droplet beam is directed perpendicular to the repeller electrode. Clusters generated through adi-abatic expansion in the ionizer region are ionized by electron impact of 40 eV and repelled into ion collect-ing lenses at a repelling voltage of 3400 V. The high ion energy can provide a spectrum with ion intensi-ties proportional to the cluster distribution produced by expansion. For some preliminary experiments we used a quadrupole mass filter because of its high sen-sitivity. However, the intensity distribution obtained with this filter is highly dependent on the rf frequency and the voltage. In this work we used a double focus-ing spectrometer.
The average temperature of the methanol-water droplets was estimated from the mass spectral change of an aqueous solution of propionic acid with xA = 0.005. The spectral pattern of this solution is highly temperature-dependent. Higher polymer hy-drates become dominant with decreasing temperature. The temperature dependence of the spectrum of this solution was carefully examined for a reference aque-ous solution of 2-butoxyethanol with xA = 0.05 that shows an anomalous spectral change due to phase sep-aration in the region between the lower critical tem-perature (49 °C) and the upper critical temperature (129 °C) [36, 37], Because the adiabatic expansion of liquid droplets requires sufficient internal energy, the lower limit of the average droplet temperature was found to be 30 °C under the present nozzle conditions. In the present measurements the temperature of the liquid droplets was set at 35 °C.
2.3. X-ray Diffraction
X-ray diffraction measurements were carried out at room temperature (25 °C) on water, methanol, and their mixtures over the range 0 < xM < 1 at 0.1 in-tervals. A rapid liquid X-ray diffractometer (DIP301, MAC Science), combined with an imaging plate (IP) (Fuji Film Co.) as a two-dimensional detector, was used in all measurements. Details of the diffrac-tometer and its performance have been described in [38, 39]. X-rays were generated at a rotary Mo anode operated at 50 kV and 200 mA, and then monochro-matized by a flat graphite crystal to obtain Mo Ka radiation (A = 0.7107 A). A sample solution sealed

T. Takamuku et al. • Structure of Clusters in Methanol-Water Binary Solutions 515
in a glass capillary of 1-mm inner diameter was ex-posed to X-rays for 3 h. The observed range of the scattering angle (29) was from 0.1 to 109 corre-sponding to a scattering vector s (= 47rA~'sin 6) of 0.02 to 14.4 A - 1 . X-ray intensities for an empty cap-illary were also measured for correction of the cell scattering.
2.4. X-ray Data Treatment
Two-dimensional X-ray intensities, Iobsd(x, y), for a sample solution and an empty capillary accumulated on IP were corrected for polarization and absorp-tion and then integrated into one-dimensional data, /obsd(0), as described in [38, 39]. The contribution of the sample solution was obtained by subtraction of the intensities for the empty capillary from those for the sample. The corrected intensities were then normalized to electron units in a stoichiometric vol-ume containing one water and/or methanol O atom by conventional methods [40 - 42], A structure function, i(s), and a radial distribution function (RDF) for each sample were obtained by usual methods as described in [32], These treatments of the X-ray diffraction data were carried out with program KURVLR [43].
To make a quantitative analysis on the above RDFs, two methods were employed in the present analysis; one is a peak separation procedure in r-space with Gaussian function, which was applied to a peak at ~2.8 A due mainly to nearest-neighbor hydrogen-bonded interaction, and the other is a comparison in s space between the experimental structure func-tion, si(s), and a theoretical one based on a structural model.
In the peak separation procedure the RDF in the form of D(r)/47rp0 was deconvoluted with Gaussian functions,
where Ar, r0l, and ar were adjustable parameters in the r-range between rmin and rm a x of interest.
On the other hand, a comparison between the ex-perimental structure function and the model struc-ture function was made between minimum and maxi-mum 5-values, smjn and smax , respectively, by a least-squares refinement procedure to search a minimum of an error square sum,
U = Y s2{®obsd(a) - «calcd(s)}2, (3) 5 m i n
The theoretical intensity, ica]cd(s), was calculated by
calcd(<s) —
Y y w i j f i W N s y ' z . r ' e x p( -k i j 5 z ) . sin(rjjs) ( ^
r-nS
_ _ 4TrÄ?
' j (4)
sin(i?js) — cos(RjS)
C M 3 exp(—BjS2).
Ar j j calcd^
47T/90 V ; yj7T j In 2
The first term of the right-hand side of (4) is related to the short-range interactions characterized by the interatomic distance rjj, the temperature factor bi} and the number of interactions n^ for an atom pair i-j. The second term arises from the interaction between a spherical hole and the continuum electron distribution beyond the hole. Rj is the radius of the spherical hole around atom j, and B} the softness parameter for emergence of the continuum electron distribution.
, r _ r o x 2-1 The least-squares refinements on structure functions exp — In 2 ^ —J j , ( l ) were made by program NLPLSQ [44].
where Ax is the peak area, tqx the peak position, and (Ti the half-width at half-height of the peak for the 2-th component of RDF. The peak area At corre-sponds to a coordination number, n, for an atom pair p-q. A comparison between observed and calculated D(r)s was made by a least-squares fitting procedure of minimizing an error square sum,
U = 1
47Tpo Y { D ( r ) - Y D f c \ r ) } \ (2)
3. Results and Discussion
3.1. Mass Spectrometry
Figure 1 shows typical mass spectra of clusters isolated from liquid droplets of methanol-water bi-nary mixtures at = 0.1, 0.4, and 0.9. The adiabatic expansion of droplets at 35 °C under a vacuum of 1 x 10 - 3 Pa is a fragmentation process of liquid into clusters and free molecules. Internal vibrational and

516 T. Takamuku et al. • Structure of Clusters in Methanol-Water Binary Solutions 516
250 300 350 400 450 500 550 600 650 700 750 800
M 1 2 W „ -
250 300 350 400 450 500 550 600 650 700 750 800
Mass Number ( m/Z )
Fig. 1. Mass spectra of the clusters isolated from liquid droplets of methanol-water binary mixtures at xM = 0.1, 0.4, and 0.9. MmWn stands for H+(CH30H)m(H20)„. All the binary clusters are observed as protonated ions. This indicates that several water or methanol molecules are lost statistically from original clusters by electron impact ioniza-tion at 40 eV (see [34]). Hydration sequences of methanol m-mer hydrates are shown with broken or dotted lines. Av-erage temperature of the droplets of the water rich solution (xM = 0.1) was estimated to be 35±5 °C.
rotational energies are converted to translational de-grees of freedom. Thus, the temperature of the clus-ters becomes very low. However, this cooling does not necessarily mean new intermolecular bond for-mation. Collisional association is a heat accumula-tion (or warming up) process. Collisions that could be seen by chance in the adiabatic expansion pro-cess are expected to break the clusters. Another factor causing cluster breaking is electron impact ionization. The ionization of methanol-water binary clusters can
be described as dissociation processes producing free water (W) or free methanol (M) and an OH radical:
M m W n + e~-* H+MmWn / + OH (5)
+ ( n - n ' - 1)W + 2e~
—> H + M m 'W n + OH (6)
+ (m - m' - 1)M + 2e~
Hereafter, binary ions of methanol m-mer hydrates H + M m W n are abbreviated as M m W n . A previous study on ethanol-water mixtures [31, 32] demon-strated that spectral patterns do not change on vary-ing the electron energies from 20 to 40 eV. In the present study a mass number (m/Z) range from 200 to 830 was measured to investigate clusters, since in the m/Z lower than 200, where small clusters such as monomer, dimer, trimer are concerned, ion-ized fragments formed by electron impact ionization at 40 eV become significant, whereas large clusters with m/Z > 830 are formed less often.
Cluster ions detected in mass spectra can be frag-ments of the liquid droplets. However, it should be born in mind that some hydrogen bonds originally weakened by intermolecular vibrational and rota-tional motions in the liquid can be strengthened by evaporation. Thus, the molecular composition of in-dividual clusters might not be completely identical to that of clusters in the solution. However, it has been found that the dimerization constants of carboxylic acid clusters obtained by adiabatic expansion of mix-tures of carboxylic acids and water are comparable with those determined by a calorimetric method on the corresponding bulk solutions [37]. Furthermore, our previous mass spectrometric and X-ray diffraction study on ethanol-water mixtures has shown a good co-incidence of inflection points of the hydration num-bers for clusters isolated from liquid droplets by mass spectrometry with those of the hydration numbers per oxygen atom of water and/or ethanol molecules ob-tained from X-ray diffraction on the bulk solutions [31 - 33]. Thus, it probably holds that the observed molecular composition of the clusters in the metha-nol-water mixtures are not very different from those of the associates in the bulk solutions, as subsequently discussed in detail.
As seen in Fig. 1, with increasing xM, the hydra-tion sequences of methanol m-mer hydrates become

T. Takamuku et al. • Structure of Clusters in Methanol-Water Binary Solutions 517
0 2 4 6 8 10 12 14 16 18
Hydration Number / n
Fig. 2. Mixing ratio dependence of the intensity distribu-tions of methanol 6-mer hydrates, M6Wn. Average hydra-tion numbers, (nm), are obtained by fitting the distribution with a r distribution function (see (7) and (8) in text). The estimates of error in the coefficient A, a, and b in (7) are 3.8%, 12.2%, and 7.4%, respectively, for = 0.9. For xM = 0.4, those are 7.4%, 5.2%, and 4.3%, respectively: for xM = 0.1, 12.6%, 6.2%, and 17.5%, respectively.
narrower, the intensity maxima shifting to clusters with smaller hydration numbers in the respective ra-mer series. This change in the degree of hydration contrasts with that found in ethanol-water mixtures [32], where the mass spectra showed only a small change in hydration with increasing water content. The most striking feature in the mass spectra of the methanol-water mixtures is the absence of signals for non-hydrated methanol clusters M m even at xM = 0.9. In the ethanol-water mixtures, strong signals for non-hydrated ethanol clusters with ra < 8 have been observed even at xE = 0.2 in each hydration sequence.
The hydration sequences of ethanol-water clus-ters were approximated with the Poisson distribution function. On the other hand, it has been found that the hydration sequences for the methanol-water mixtures are expressed with a F distribution function, Fm(n):
Fm{n) = A(rn)nam-1 exp(-ön). (7)
Here, n corresponds to the hydration number of a methanol ra-mer cluster, and a and b are constants. The extreme case with a = m~1 corresponds to the Boltzmann-type distribution function. An average hy-dration number, (nm) , is given as:
(nm) = am/b. (8) Figure 2 shows some examples of least-squares fits with the distribution function (7) to the hydration se-quences of methanol 6-mer clusters at xM = 0.1, 0.4, and 0.9, where the average hydration numbers were 9.4, 5.0, and 1.5, respectively. As seen in the figure, the model distribution function well describes the ob-served intensities.
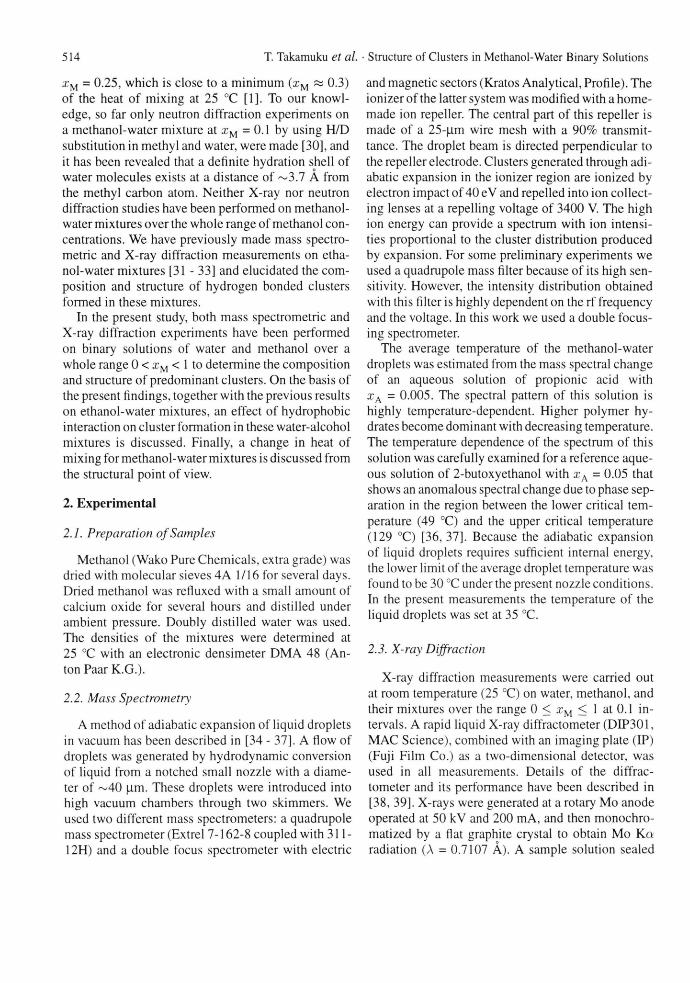
The average hydration numbers obtained for methanol 6, 8, 10, and 12-mers are shown in Fig. 3 as functions of xM . The average hydration numbers decrease gradually with increasing mole fraction of methanol, but there appear two inflection points at xM = ~0.3 and ~0.7. The two inflection points sug-gest three regimes where predominant clusters might differ in each regime, i.e. Regimes I (xM < 0.3), II (0.3 < x M < 0.7), and III (0.7 < xM < 1). It should be noted that the inflection point at xM = ~0.3 corre-sponds well to the composition where a minimum of heat of mixing at 25 °C has been observed [1],
The average hydration numbers in the three regi-mes can be reproduced empirically by the following equations: In Regime I,
(nm) = 3(ra-0.5)( .TW-0.3) 2+0.45(ra-3.8) , (9)
in Regime II,
(rim) =m(xw - 0.3)+ 1.4(ra - 3.8), (10)
and in Regime III,
(nm) = 4.3(ra — 3.8)a:w- (11)
These equations were obtained by the curve-fitting procedures for all experimental points over the xM
5 1 8 T. Takamuku et al. • Structure of Clusters in Methanol-Water Binary Solutions 518
30 F
25 -
< n > m 2 0 -
15 -
1 0 -
5 -
Region I Region II Region III
I
"T3--"D
i O
er
0.0 0.1 0.2 0.3 0.4 0.5 0.6 0.7 0.8 0.9 1.0
Fig. 3. Plots of average hydration numbers, (nm), for the methanol m-mer hydrates with m = 6 (•), 8 (•), 10(*), and 12(o) as functions of methanol mole fractions (xM). Dotted lines were obtained from the equations: (nm) = 3(m — 0.5)(xw — 0.3)2 + 0.45(m - 3.8) for Regime I (0 < xM < 0.3), (nm) = m(xw - 0.3)+ 1.4(m - 3.8) for Regime II (0.3 < xM < 0.7), and (n-m) = 4.3(m — 3.8)xw for Regime III (0.7 < xM < 1), where is the mole fraction of water. These equations were obtained by the curve-fitting procedures for all the experimental points in the respective regions. The values of 3a are 2.2 in Regime I, 2.3 in Regime II, and 1.7 in Regime III as indicated in the figure.
values investigated in the respective regions. In Regime I, the average hydration number of methanol m-mer unit increases quadratically with increasing water mole fraction, while it increases linearly in Regime II. Over the whole methanol composition the experimental data for methanol 12-mer were not well reproduced with these equations. This is because the individual mass signals for the methanol 12-mers were not well separated due to low signal resolution for clusters of high mass numbers. The 3a values in the observed data for methanol 12-mer are shown in Figure 3.
Here, we point out some differences in the trend of average hydration numbers with alcohol mole fraction between the methanol-water and ethanol-water [32] mixtures. For the ethanol-water mixtures only one but very sharp inflection point has been observed at xE = ~0.2, where the heat of mixing for ethanol-water mix-tures shows a minimum at 25 °C [1]. In our previous studies [31 - 33], it has been concluded that a drastic change in cluster structure in ethanol-water mixtures
occurs at xE = ~0.2. In contrast, the average hydration numbers for m-mer methanol clusters do not change very sharply with the mole fraction of methanol, and two inflection points have been observed.
Furthermore, the hydration numbers in the individ-ual ?n-mer methanol clusters are remarkably larger than those for ethanol clusters, e. g. ~ 9 and ~25 for the 6-mer and 12-mer methanol clusters, respectively, at xM = 0.1, while less than 2 and ~ 8 for the 6-mer and 12-mer ethanol clusters, respectively, at xE = 0.1 [32], These findings suggest that methanol clusters can ac-commodate a large amount of water molecules and that the cluster structures change moderately from the tetrahedral-like structure of water to a chain-like structure of methanol with an increase in methanol concentration.
3.2. X-ray Diffraction
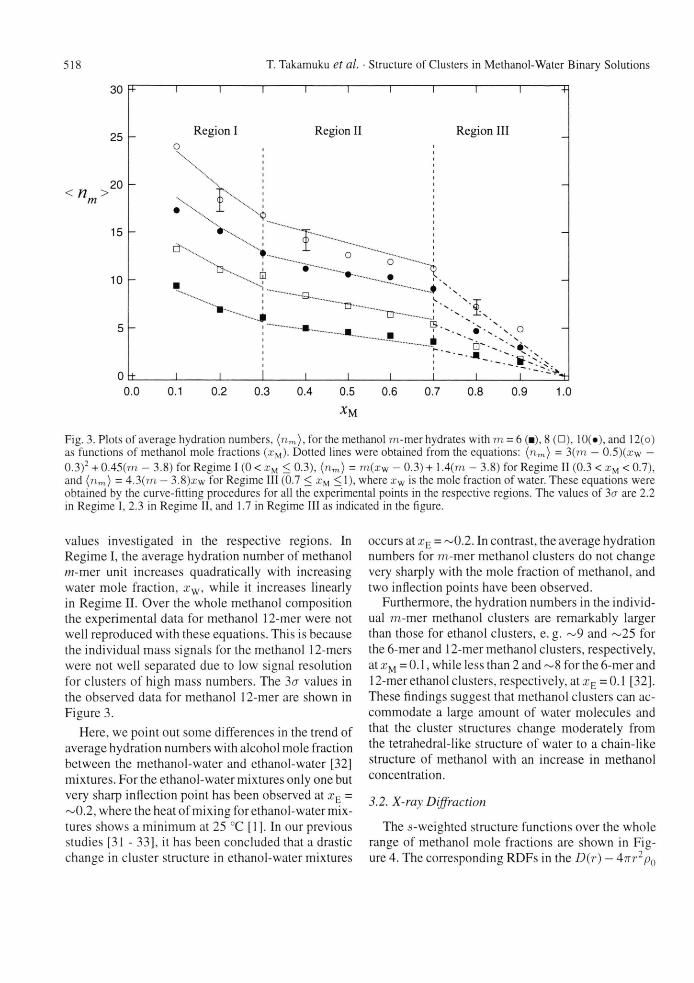
The s-weighted structure functions over the whole range of methanol mole fractions are shown in Fig-ure 4. The corresponding RDFs in the D(r) — 4irr2p{)
T. Takamuku et al. • Structure of Clusters in Methanol-Water
Fig. 4. Structure functions i(s) multiplied by s for pure methanol and water and methanol-water mixtures at various mole fractions of methanol xM. The dotted and solid lines are experimental and calculated ones, respectively.
form are depicted in Figure 5. Corrections for peri-odic ripples caused by the finite termination in the Fourier transform were made up to 2.2 A in the usual procedure [43] since the intramolecular structures of methanol [ 15] and water [45] have been established in the liquid phase and are not of concern in the present study. The employed interatomic distances within a methanol molecule were those previously determined by neutron diffraction measurements [15]; 0.990 A (O-H bond), 1.085 Ä (C-H), 1.435 Ä (C-O), 1.77 Ä (non-bonding H - H ) , 2.03 A (C - H(OH) interaction) and 2.07 A (non-bonding 0 -H(CH 3 ) ) . Other small periodic peaks observed in the r-range of 6 - 10 A, as seen in the RDFs of = 0.4 - 0.9, should not be assigned to any physically meaningful interactions, but to ripples due to the quality of experimental data because the long-range interactions in liquids usually give broad peaks. In the present analysis no further corrections of the ripples, e. g. data smoothing proce-dure, were made, however.
Binary Solutions 519
r/A
Fig. 5. Radial distribution functions in the form of D(r) — 4-7Tr2p0 for pure methanol and water and methanol-water mixtures at various mole fractions of methanol The solid and dotted lines are experimental and calculated ones, respectively.
3.3. Total RDFs
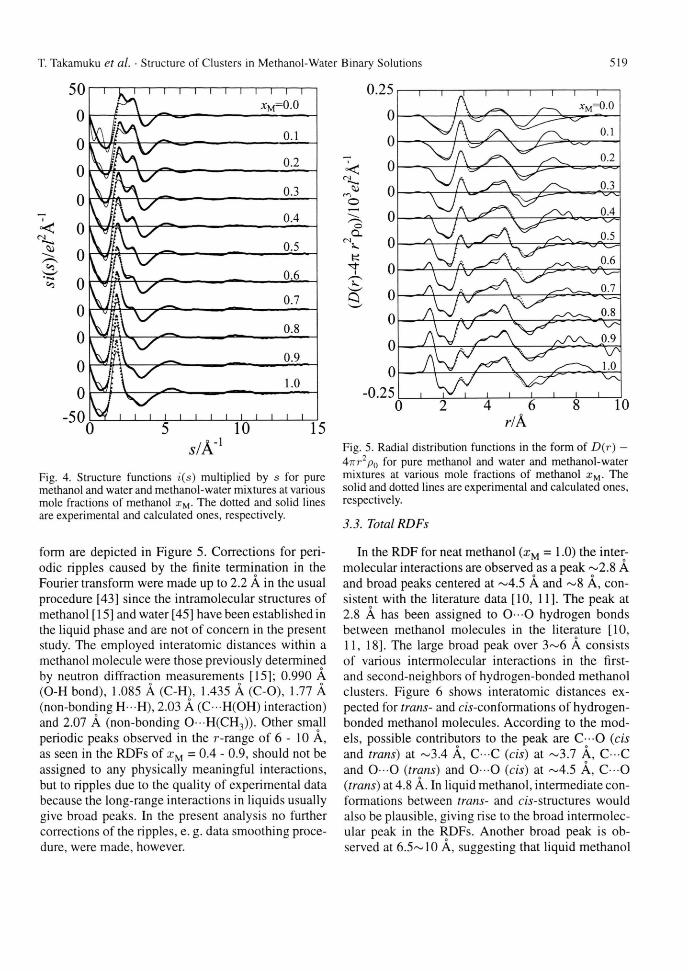
In the RDF for neat methanol (xM = 1.0) the inter-molecular interactions are observed as a peak ~2.8 A and broad peaks centered at ~4.5 A and ~ 8 A, con-sistent with the literature data [10, 11]. The peak at 2.8 A has been assigned to O - O hydrogen bonds between methanol molecules in the literature [10, 11, 18]. The large broad peak over 3~6 A consists of various intermolecular interactions in the first-and second-neighbors of hydrogen-bonded methanol clusters. Figure 6 shows interatomic distances ex-pected for trans- and c/s-conformations of hydrogen-bonded methanol molecules. According to the mod-els, possible contributors to the peak are C—O (eis and trans) at ~3.4 A, C C (eis) at ~3.7 A, C C and 0 - 0 (trans) and 0 - 0 (eis) at ~4.5 A, C - O (trans) at 4.8 A. In liquid methanol, intermediate con-formations between trans- and c/s-structures would also be plausible, giving rise to the broad intermolec-ular peak in the RDFs. Another broad peak is ob-served at 6.5~10 A, suggesting that liquid methanol
520 T. Takamuku et al. • Structure of Clusters in Methanol-Water Binary Solutions 520
Fig. 6. Structure models of methanol chains in trans- and eis-forms.
is structured up to the fourth-neighbor as discussed by Magini et al. [10].
The RDF for water (xM = 0.0) in Fig. 5 shows three typical peaks at 2.8,4.5, and 7 A, assigned to the first-, second-, and third-neighboring water molecules from a given molecule, respectively, within the tetrahedral-like ordering of water molecules in the bulk [46, 47],
When the mole fraction of methanol increases from xM = 0 to 1, there appear characteristic changes in the RDFs; (i) a gradual decrease in the 2.8-A peak due to the hydrogen bonding, (ii) a change in peak shape characteristic for water at ~4.5 A to that for methanol over 3 ~ 6 A, (iii) broadening and a shift to the longer distance of the third-neighbor peak over 6 ~ 9 A. These findings demonstrate that with in-creasing methanol concentration the tetrahedral-like structure of water is gradually ruptured, followed by evolution of the chain-like structure of methanol. It should be stressed that the overall feature of RDF does not change so drastically as has been observed for ethanol-water mixtures [32], This result is in good agreement with that obtained by mass spectrometry in the previous section.
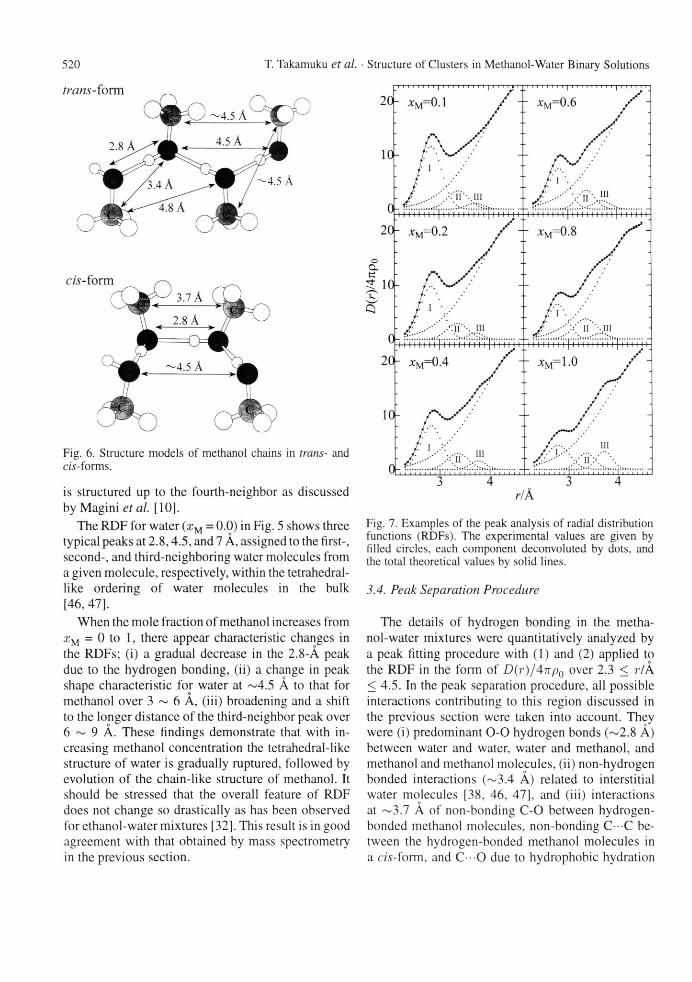
Fig. 7. Examples of the peak analysis of radial distribution functions (RDFs). The experimental values are given by filled circles, each component deconvoluted by dots, and the total theoretical values by solid lines.
3.4. Peak Separation Procedure
The details of hydrogen bonding in the metha-nol-water mixtures were quantitatively analyzed by a peak fitting procedure with (1) and (2) applied to the RDF in the form of D(r)/4irp0 over 2.3 < r/A < 4.5. In the peak separation procedure, all possible interactions contributing to this region discussed in the previous section were taken into account. They were (i) predominant 0 - 0 hydrogen bonds (~2.8 A) between water and water, water and methanol, and methanol and methanol molecules, (ii) non-hydrogen bonded interactions (~3.4 A) related to interstitial water molecules [38, 46, 47], and (iii) interactions at ~3.7 A of non-bonding C-0 between hydrogen-bonded methanol molecules, non-bonding C C be-tween the hydrogen-bonded methanol molecules in a c/s-form, and C O due to hydrophobic hydration
T. Takamuku et al. • Structure of Clusters in Methanol-Water Binary Solutions 5 2 1
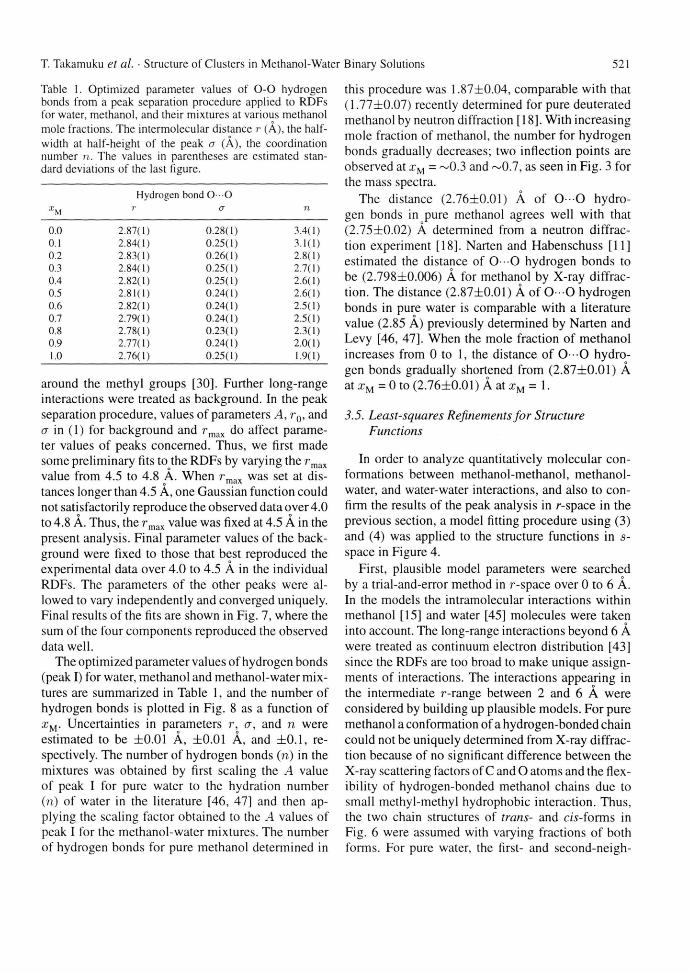
Table 1. Optimized parameter values of 0 - 0 hydrogen bonds from a peak separation procedure applied to RDFs for water, methanol, and their mixtures at various methanol mole fractions. The intermolecular distance r (A), the half-width at half-height of the peak a (A), the coordination number n. The values in parentheses are estimated stan-dard deviations of the last figure.
Hydrogen bond O -O XM r a n
0.0 2.87(1) 0.28(1) 3.4(1) 0.1 2.84(1) 0.25(1) 3.1(1) 0.2 2.83(1) 0.26(1) 2.8(1) 0.3 2.84(1) 0.25(1) 2.7(1) 0.4 2.82(1) 0.25(1) 2.6(1) 0.5 2.81(1) 0.24(1) 2.6(1) 0.6 2.82(1) 0.24(1) 2.5(1) 0.7 2.79(1) 0.24(1) 2.5(1) 0.8 2.78(1) 0.23(1) 2.3(1) 0.9 2.77(1) 0.24(1) 2.0(1) 1.0 2.76(1) 0.25(1) 1.9(1)
around the methyl groups [30]. Further long-range interactions were treated as background. In the peak separation procedure, values of parameters A, r0 , and a in (1) for background and rm a x do affect parame-ter values of peaks concerned. Thus, we first made some preliminary fits to the RDFs by varying the rm a x
value from 4.5 to 4.8 A. When rm a x was set at dis-tances longer than 4.5 A, one Gaussian function could not satisfactorily reproduce the observed data over 4.0 to 4.8 A. Thus, the rm a x value was fixed at 4.5 A in the present analysis. Final parameter values of the back-ground were fixed to those that best reproduced the experimental data over 4.0 to 4.5 A in the individual RDFs. The parameters of the other peaks were al-lowed to vary independently and converged uniquely. Final results of the fits are shown in Fig. 7, where the sum of the four components reproduced the observed data well.
The optimized parameter values of hydrogen bonds (peak I) for water, methanol and methanol-water mix-tures are summarized in Table 1, and the number of hydrogen bonds is plotted in Fig. 8 as a function of £ m . Uncertainties in parameters r, a, and n were estimated to be ±0.01 A, ±0.01 A, and ±0.1, re-spectively. The number of hydrogen bonds (n) in the mixtures was obtained by first scaling the A value of peak I for pure water to the hydration number (n) of water in the literature [46, 47] and then ap-plying the scaling factor obtained to the .4 values of peak I for the methanol-water mixtures. The number of hydrogen bonds for pure methanol determined in
this procedure was 1.87±0.04, comparable with that (1.77±0.07) recently determined for pure deuterated methanol by neutron diffraction [18]. With increasing mole fraction of methanol, the number for hydrogen bonds gradually decreases; two inflection points are observed at xu = ~0.3 and ~0.7, as seen in Fig. 3 for the mass spectra.
The distance (2.76±0.01) A of 0 - 0 hydro-gen bonds in pure methanol agrees well with that (2.75±0.02) A determined from a neutron diffrac-tion experiment [18]. Narten and Habenschuss [11] estimated the distance of 0 — 0 hydrogen bonds to be (2.798±0.006) A for methanol by X-ray diffrac-tion. The distance (2.87±0.01) A of 0 - 0 hydrogen bonds in pure water is comparable with a literature value (2.85 A) previously determined by Narten and Levy [46, 47]. When the mole fraction of methanol increases from 0 to 1, the distance of 0 — 0 hydro-gen bonds gradually shortened from (2.87±0.01) A at = 0 to (2.76±0.01) A at z M = 1.
3.5. Least-squares Refinements for Structure Functions
In order to analyze quantitatively molecular con-formations between methanol-methanol, methanol-water, and water-water interactions, and also to con-firm the results of the peak analysis in r-space in the previous section, a model fitting procedure using (3) and (4) was applied to the structure functions in s-space in Figure 4.
First, plausible model parameters were searched by a trial-and-error method in r-space over 0 to 6 A. In the models the intramolecular interactions within methanol [15] and water [45] molecules were taken into account. The long-range interactions beyond 6 A were treated as continuum electron distribution [43] since the RDFs are too broad to make unique assign-ments of interactions. The interactions appearing in the intermediate r-range between 2 and 6 A were considered by building up plausible models. For pure methanol a conformation of a hydrogen-bonded chain could not be uniquely determined from X-ray diffrac-tion because of no significant difference between the X-ray scattering factors of C and O atoms and the flex-ibility of hydrogen-bonded methanol chains due to small methyl-methyl hydrophobic interaction. Thus, the two chain structures of trans- and c/s-forms in Fig. 6 were assumed with varying fractions of both forms. For pure water, the first- and second-neigh-

522 T. Takamuku et al. • Structure of Clusters in Methanol-Water Binary Solutions 522
Table 2. Optimized parameter values of the interactions in water, methanol and their mixtures at various methanol mole fractions by a least-squares refinement on structure functions over the s-range 0.1 < s/A-1 < 14.4. The interatomic distance r (A), the temperature factor b (Ä2), the number of interactions n per molecule. The values in parentheses are estimated standard deviations of the last figure. The parameters without standard deviations were not allowed to vary in the calculations.
M Interaction Parameter 0.0 0.1 0.2 0.3 0.4 0.5 0.6 0.7 0.8 0.9 1.0
Linear hydrogen bond of water-water, methanol-water, and methanol-methanol O-O 2.826(2) 2.817(1) 2.816(1) 2.825(1)
106 15 3.24(2)
15 3.03(2)
17 n 3.43(3)
Interstitial water molecules 0 - 0 r 3.35
1036 15 n 1.0
1st neighbor of methanol-water and methanol-methanol
12 2.91(2)
3.35 30 1.0
3.35 30 0.8
3.35 30 0.8
C O 1036
3.40 3.40 25 25
n 3.0 3.0 1 st neighbor of methanol-methanol in ds-form C C r
1036
4.00 50 2.6
4.00 40 2.6
2nd neighbor of water-water O-O r 4.00
1036 90 n 3.0
2nd neighbor of water-water and methanol-water
O-O r 4.50 4.50 4.50 1036 90 40 40 n 3.0 1.5 1.5
2nd neighbor of methanol-methanol in frarc.T-form
C - C r 1036
3.40 25 3.0
4.00 40 2.4
4.50 40 1.5
2.822(2) 2.829(2) 9 8 2.64(3) 2.53(3)
3.35 30 0.5
3.40 25 3.0
4.50 40 1.5
4.50 40 0.3
3.35 30 0.5
3.40 25 3.0
3.70 30 0.8
4.50 40 1.5
4.50 40 0.3
2.822(2) 2.811(2) 8 8 2.45(2) 2.36(2)
3.40 25 3.0
3.70 30 1.3
4.50 40 1.5
4.50 40 0.8
3.40 25 2.8
3.70 30 1.3
4.50 40 1.5
4.50 40 0.8
2.812(2) 2.803(2) 2.771(4) 8 8 8 2.11(2) 1.90(2) 1.73(3)
3.38 25 2.5
3.70 30 1.3
4.50 40 1.5
4.50 40 0.8
3.38 25 2.2
3.70 30 1.5
4.50 40 1.5
4.50 40 1.3
3.36 25 2.0
3.70 30 2.0
4.50 40 1.5
4.50 40 1.5
bors of water molecules in the tetrahedral-like struc-ture were considered, together with interstitial water molecules at ~3.4 A. Models for the methanol-water mixtures were built up in r-space in a trial-and-error manner by modifying both the number of interatomic interactions and the temperature factor within the chain structure of neat methanol and the tetrahedral-like structure of water depending on the composition of the mixtures. Next, by using the structural models obtained in r-space, the least-squares fitting proce-dure with (3) and (4) was applied to the structure functions of methanol, water, and their mixtures over the s-range from 0.1 to 14.4 A - 1 .
The important optimized values of structure pa-rameters are listed in Table 2. In Figs. 4 and 5, the
theoretical si(s) and RDFs, calculated by using all the optimized values, reproduced the observed values well, except for the range of s < ~3.5 A - 1 and r > ~ 6 A for which the long-range interactions, not taken into account in the present analysis, are respon-sible. The distance (2.771 ±0.004) A of O - O hydro-gen bonds for pure methanol is in good agreement with those (2.76±0.01) and (2.75±0.02) A deter-mined by the peak separation procedure and a neutron diffraction experiment [18], respectively. The dis-tance (2.826±0.002) A of 0 - 0 hydrogen bonds for pure water is slightly shorter than (2.87±0.01) A from the peak separation procedure. This may arise from uncertainties inherent in both methods. However, the shortening of hydrogen bond O—O distances with

T. Takamuku et al. • Structure of Clusters in Methanol-Water Binary Solutions 523
Fig. 8. Methanol mole fraction dependence of the coordi-nation number per oxygen atom within both methanol and water molecules. The values determined by a peak separa-tion procedure are given by opened circles, those from a least-squares refinements by filled circles, together with the standard deviation of a values as error bars.
increasing methanol concentration has been clearly observed in both results. The number (3.43±0.03) of the hydrogen bond for pure water agrees well with a value previously determined [46, 47].
In the methanol-water mixtures, the number of hy-drogen bonds gradually decreases down to 1.73±0.03 for pure methanol with an increase in methanol con-centration. In Fig. 8 the numbers of hydrogen bonds at ~2.8 A from the model fits in s-space are plot-ted against the mole fraction of methanol, and are in satisfactory agreement with those by the peak separa-tion procedure. However, systematic differences in n-values, which are beyond estimated uncertainties, are obtained by both methods. These discrepancies may originate from ambiguities not completely solved in the present analyses, such as correlation among pa-rameters employed, etc. Nevertheless, we would like to emphasize that both results have shown two in-flection points at xM = ~0.3 and ~0.7, as reported in the literature [1 ,6 , 7]. Therefore, together with the result from the mass spectrometry, the present X-
ray diffraction data strongly suggest that predominant cluster structures in methanol-water mixtures change at these compositions.
Here, it should be mentioned that the present model given in Table 2 should be regarded as one of the models to reproduce the experimental data of the methanol-water mixtures. Neutron diffraction with H/D substitution in methanol and water mixtures would give more definite models of the mixtures.
All of the present results indicate that clusters are present in the methanol-water mixtures: as seen in Table 2, in the range of 0 < xM < 0.3 the first and sec-ond neighbor H 2 0-H t0 interactions as well as those for the interstitial water molecules, characteristic for bulk water, remain the same to a large extent, and that the first and second neighbor C-C interactions for methanol do not appear; thus, the tetrahedral-like structure of water is predominant in this concentra-tion range. The average hydration numbers, (n m ) , of individual m-mer methanol clusters, M m W n , es-timated from the mass spectrometry have shown that the methanol clusters are surrounded by about twice as many water molecules than methanol (Fig. 3); it is thus likely that methanol molecules can be embedded into the hydrogen-bonded network of water.
In the range of 0.3 < < 0.7, the numbers of the se-cond-neighbor and interstitial water molecules for the tetrahedral-like water structure decrease substantially or disappear when > 0.4. On the other hand, the numbers of the first- and second-neighbor C - C in-teractions in methanol chains gradually increase with increasing mole fraction of methanol. These data sug-gest that the chain-like clusters of methanol are gradu-ally evolved in the mixtures in the range of xM > ~0.3. It should be noted that such a structural transition is not so sharp as that observed for ethanol-water mix-tures. With further increase in from 0.7 to 1 the average hydration numbers of individual methanol clusters rapidly decrease, and the numbers of the first- and second-neighbor C - C interactions in the methanol chains further increase. It is thus concluded that the chain clusters of methanol are predominant in the mixtures when xM exceeds 0.7.
3.6. Heat of Mixing
The heat of mixing for methanol-water mixtures at 25 °C is negative over the whole range of a;M [1]. A minimum of AH = ~850 J mol - 1 appears at = ~0.3 [1]. In addition, there is another small inflection

524 T. Takamuku et al. • Structure of Clusters in Methanol-Water Binary Solutions 524
point at xM = ~0.7. These two inflection points in heat of mixing corresponds remarkably well to those for both the average hydration number for methanol clus-ters by mass spectrometry (Fig. 3) and the number of hydrogen bonds by X-ray diffraction (Fig. 8). It is thus most probable that the heat of mixing for methanol-water reflects the structure of clusters formed.
The negative heat of mixing probably arises from stabilization of methanol molecules in the tetrahe-dral structure of water by more strengthened hydro-gen bonds among methanol and/or water molecules than in neat methanol. Pälinkäs and Bakö [27] repro-duced stabilization of methanol molecules in methan-ol-water mixtures from excess potential energies by a molecular dynamics simulation. In the range of 0 < xM < 0.3, methanol molecules will be stabilized in the water structure without considerable disruption of the water structure and are most stabilized at xM = ~0.3, where a minimum of the heat of mixing is observed. Over the range of 0.3 < xM < 0.7, the inherent water structure is gradually broken and/or weakened by for-mation of methanol chains; thus, the heat of mixing gradually becomes less negative with increasing At xM > 0.7, the chain clusters of methanol become predominant, and the hydrogen-bonded network of water forms little; the stability of the methanol clus-ters will be lowered, resulting in a less negative heat of mixing.
For ethanol-water mixtures the heat of mixing at 25 °C is also negative over the whole mole fraction range with a minimum of AH = ~730 J mol - 1 at xE = ~0.2 [1], and again suggests stabilization of ethanol molecules in ethanol-water mixtures at xE < ~ 0.2. However, the heat of mixing for methanol-water mixtures is more negative and more gradually changes against xM over most of mole fractions than that for the ethanol-water mixtures. Hence, it is likely that the smaller hydrophobic methyl group of a methanol molecule is more stabilized in aqueous mixtures than
[1] F. Franks and D. J. G. Ives, Q. Rev. Chem. Soc. 20, 1 (1966).
[2] K. Nakanishi. Bull. Chem. Soc. Japan 33, 793 (1960). [3] A. Coccia. P. L. Inodovia, F. Podo, and V. Viti, Chem.
Phys. 7, 30(1975). [4] S. Mashimo, S. Kuwabara, S. Yagihara, and K. Higasi,
J. Chem. Phys. 90, 3292 (1989). [5] N. Asaka, N. Shinyashiki, T. Umehara, and S. Ma-
shimo, J. Chem. Phys. 93, 8273 (1990).
the ethyl group of an ethanol molecule, and that the larger hydrophobic groups of ethanol molecules more quickly disturb the tetrahedral structure of water with increasing mole fraction of ethanol, sandwich struc-ture clusters being formed by hydrophobic interaction at xE = ~0.2 [31 - 33],
4. Conclusion
Combined mass spectra and X-ray diffraction data have revealed a change in average clusters formed in methanol-water mixtures. At low methanol mole fractions (xM < 0.3) the mixture is governed by the tetrahedral-like water clusters, but at 0.3 < xM < 0.7 the inherent water clusters are gradually replaced by methanol clusters of chain structure without signif-icant disruption of the water structure, and finally at high alcohol mole fractions (xM > 0.7) the chain structure of methanol becomes predominant in the solutions. A comparison of the present results on the methanol-water mixtures with those of ethanol-water mixtures shows that the tetrahedral-like water struc-ture is broken down at a lower mole fraction (0.2) and more sharply in the ethanol-water mixtures than in the methanol-water mixtures due to the large hy-drophobic effect of ethanol. The behavior of the heat of mixing with alcohol concentration in the methanol-water mixtures is consistent with that of the average clusters formed in the mixtures, and thus anomalies in the physico-chemical data of alcohol-water probably originate from clusters formed in the mixtures.
Acknowledgements
This work was supported in part by a Joint Studies Program (1997 - 1998) of the Institute for Molecu-lar Science, by a Grant-in-Aid for Encouragement of Young Scientists (No. 09740444) (TT.), and a Grant-in-Aid B (No. 09440207) (T. Y.) from the Japanese Ministry of Education, Science, Sports and Culture.
[6] S. Mashimo, T. Umehara, and H. Redlin, J. Chem. Phys. 95, 6257 (1991).
[7] T. Oba, M. Mimuro, Z.-Y. Wang, T. Nozawa, S.Yoshida, and T. Watanabe, J. Phys. Chem. B 101, 3261 (1997).
[8] G. G. Harvey, J. Chem. Phys. 6, 111 (1938). [9] D. L. Wertz and R. K. Krüh, J. Chem. Phys. 47, 388
(1967). [10] M. Magini, G. Paschina, and G. Piccaluga, J. Chem.
Phys. 77. 2051 (1982).

T. Takamuku et al. • Structure of Clusters in Methanol-Water Binary Solutions 525
[11] A. H. Narten and A. Habenschuss, J. Chem. Phys. 80, 3387 (1984).
[12] S. Sarkar and R. N. Joarder, J. Chem. Phys. 99, 2032 (1993).
[13] D. G. Montague, J. C. Dore, and S. Cummings, Mol. Phys. 53, 1049 (1984).
[14] D. G. Montague and J. C. Dore, Mol. Phys. 57, 1035 (1986).
[15] Y. Tanaka, N. Ohtomo, and K. Arakawa, Bull. Chem. Soc. Japan 57, 644(1984).
[16] Y. Tanaka, N. Ohtomo, and K. Arakawa, Bull. Chem. Soc. Japan 58, 270 (1985).
[17] F. J. Bermejo, F. J. Mompeän, J. Santoro, D. C. Steytler, and J. C. Dore, J. Mol. Liquids 33, 183 (1987).
[18] T. Yamaguchi, K. Hidaka, and A. K. Soper, Mol. Phys. 26,1159 (1999).
[19] G. Pälinkäs, E. Hawlicka, and K. Heinzinger, J. Phys. Chem. 91, 4334(1987).
[20] G. Pälinkäs, Y. Tamura, E. Spohr, and K. Heinzinger, Z. Naturforsch. 43a, 43 (1988).
[21] G. Bolis, G. Corongiu, and E. Clementi, Chem. Phys. Lett. 86, 299 (1981).
[22] W. L. Jorgensen and J. D. Madura, J. Amer. Chem. Soc. 105, 1407 (1983).
[23] S. Okazaki, H. Touhara, and K. Nakanishi, J. Chem. Phys. 81, 890 (1984).
[24] P. F. W. Stouten and J. Kroon, Mol. Simul. 5, 175 (1990).
[25] M. Ferrario, M. Haughney, I. R. McDonald, and M. L. Klein, J. Chem. Phys. 93, 5156 (1990).
[26] G. Pälinkäs, I. Bakö, K. Heinzinger, and P. Bopp, Mol. Phys. 73, 897 (1991).
[27] G. Pälinkäs and I. Bakö, Z. Naturforsch. 46a, 95 (1991).
[28] H. Tanaka, J. Walsh, and K. E. Gubbins, Mol. Phys. 76, 1221 (1992).
[29] H. Tanaka and K. E. Gubbins, J. Chem. Phys. 97, 2626 (1992).
[30] A. K. Soper and J. L. Finney, Phys. Rev. Lett. 71,4346 (1993).
[31] N. Nishi, S. Takahashi, M. Matsumoto, A. Tanaka, K. Muraya, T. Takamuku, and T. Yamaguchi, J. Phys. Chem. 99, 462 (1995).
[32] M. Matsumoto, N. Nishi, T. Furusawa, M. Saita, T. Takamuku, M. Yamagami, and T. Yamaguchi, Bull. Chem. Soc. Japan 68, 1775 (1995).
[33] N. Nishi, M. Matsumoto, S. Takahashi, T. Takamuku, M. Yamagami, and T. Yamaguchi, Structures and Dy-namics of Clusters; T. Kondow, K. Kaya, and A. Te-rasaki, ed., Universal Academy Press, Inc. and Ya-mada Science Foundation, 1996, pp.l 13-120.
[34] N. Nishi, K. Koga, C. Ohshima, K. Yamamoto, U. Na-gashima, and K. Nagami, J. Amer. Chem. Soc. 110, 5246 (1988).
[35] N. Nishi, Z. Phys. D-Atoms, Mol. Clusters 15, 239 (1990).
[36] N. Nishi and K. Yamamoto, J. Amer. Chem. Soc. 109, 7353 (1987).
[37] K. Yamamoto and N. Nishi, J. Amer. Chem. Soc. 112, 549(1990).
[38] K. Yamanaka, T. Yamaguchi, and H. Wakita, J. Chem. Phys. 101, 9830(1994).
[39] M. Ihara, T. Yamaguchi, H. Wakita, and T. Mat-sumoto, Adv. X-Ray Anal. Japan 25, 49 (1994); T. Yamaguchi, H. Wakita, and K. Yamanaka, Fukuoka Univ. Sei. Reports 29, 127 (1999).
[40] K. Furukawa, Rep. Progr. Phys. 25, 395 (1962). [41] J. Krogh-Moe, Acta Crystallogr. 2, 951 (1956). [42] N. Norman, Acta Crystallogr. 10, 370 (1957). [43] G. Johanson and M. Sandström, Chem. Scr. 4, 195
(1973). [44] T. Yamaguchi, Doctoral Thesis, Tokyo Institute of
Technology, 1978. [45] K. Ichikawa, Y. Kameda, T. Yamaguchi, H. Wakita,
and M. Misawa, Mol. Phys. 73, 79 (1991). [46] A. H. Narten and H. A. Levy, J. Chem. Phys. 55, 2263
(1971). [47] A. H. Narten, J. Chem. Phys. 56, 5681 (1972).