Methanol Supply and Demand Issues from a California ...
8
TRANSPORTATION RESEARCH RECORD 1175 15 Methanol Supply and Demand Issues from a California Perspective KENNETH KOYAMA AND LISA DARLING Despite state policies aimed at reducing high levels of pe- troleum dependency and air pollution, California relies pri- marily on petroleum fuels for transportation. As an alternative to petroleum·based fuels, methanol has become increasingly important because of its potential for improving energy se- curity and air quality. A growing body of evidence also sug- gests that methanol could serve as a toxic substance control by displacing benzene in gasoline. In light of these findings, recent governmental and private-sector activities have been focused on methanol, creating a momentum that has substantially im- proved the prospects of this fuel for use In the transportation sector. Because this momentum could lead to greater demand for methanol fuel, questions of methanol supply, demand, and availability must be addressed. The staff of the California Energy Commission has recently begun a comprehensive eval- uation of the near- and long-term supply of methanol to the state. The objective of this effort ls to project the available supply and corresponding price of methanol for transportation use. In this paper findings of studies to date are summarized, and future research needs, as California moves into the 1990s, are described. Although much of this analysis remains prelimi- nary, It can be concluded that methanol has the potential to become a cost-competitive alternative to gasoline in the Cal- ifornia transportation sector. Energy demand in California's transportation sector has grown dramatically in the last 5 years as shown in Figure 1. Unfor- tunately, the market share of petroleum fuels dominates this energy demand, making the state highly vulnerable to supply disruptions. One of the major goals adopted by the state is to diversify the fuels used in all energy-using sectors. However, making a transition to alternative fuels for transportation has met with formidable barriers. Despite the many contraindications-including two major oil supply interrup- tions, a tripling of petroleum product prices during the last 15 years, and the existence of five areas in California that will not meet air quality standards as set by the Clean Air Act-the transportation sector remains stubbornly dependent on petroleum. Other fuel-using sectors in California have made substantial progress in diversifying their energy requirements. For exam- ple, the electric utility sector produces electricity from oil; natural gas; wind; biomass; and hydroelectric, solar, geother- mal, and nuclear energy. Figure 2 shows the diversity in elec- tricity generation between 1976 and 1986, a period when alter- native fuels became major contributors to electricity generation and petroleum use declined substantially. Federal legislation, California Energy Commission, 1516 Ninth Street, Sacramento, Calif. 95814-5512. 5800 5600 :;- w Ci5 en LL 5400 ::> 0 Cf) ...J z <( 0 ::J I- _J 0 a: 5200 I- I::. 4800 +--..--- .-----.--..,.---.-- -,-- .,..-- .-----.-----r 1976 1978 1980 1982 1984 1986 YEAR FIGURE 1 California transportation energy demand (J). such as the Public Utilities Resources and Power Act, has helped spur private investment in these alternative resources. The way that fuels are used in transportation markets differs substantially from the ways in which fuels are used to generate electricity. Fuel resources are exploited to produce electricity that, in tum, is used in an end-use application. The electricity acts as an intermediate transfer step in the delivery of working energy. No comparable intermediate fuel step is available for transportation. Technological limitations will most likely pre- vent future vehicles from using more than one or possibly two fuels. Fuel-supply infrastructure and vehicles that can use a specific fuel must be developed concurrently. To successfully achieve fuel diversity, then, substantially greater effort will be required in transportation than in other sectors. California has embarked on several programs designed to bolster the use of "clean" alternative fuels. The California Energy Commission (CEC) demonstration programs have made great strides in the technical design and drivability of vehicles that use these fuels (3). Also of great significance, many of the state's air pollution control districts have adopted air quality control plans that include a clean fuels component. In many instances, these plans identify methanol as the clean fuel of choice. A recent U.S. Department of Energy report (4) stated that methanol satisfies all of the criteria for a broad-use fuel in the
-
Upload
khangminh22 -
Category
Documents
-
view
2 -
download
0
Transcript of Methanol Supply and Demand Issues from a California ...

TRANSPORTATION RESEARCH RECORD 1175 15
Methanol Supply and Demand Issues from a California Perspective
KENNETH KOYAMA AND LISA DARLING
Despite state policies aimed at reducing high levels of petroleum dependency and air pollution, California relies primarily on petroleum fuels for transportation. As an alternative to petroleum·based fuels, methanol has become increasingly important because of its potential for improving energy security and air quality. A growing body of evidence also suggests that methanol could serve as a toxic substance control by displacing benzene in gasoline. In light of these findings, recent governmental and private-sector activities have been focused on methanol, creating a momentum that has substantially improved the prospects of this fuel for use In the transportation sector. Because this momentum could lead to greater demand for methanol fuel, questions of methanol supply, demand, and availability must be addressed. The staff of the California Energy Commission has recently begun a comprehensive evaluation of the near- and long-term supply of methanol to the state. The objective of this effort ls to project the available supply and corresponding price of methanol for transportation use. In this paper findings of studies to date are summarized, and future research needs, as California moves into the 1990s, are described. Although much of this analysis remains preliminary, It can be concluded that methanol has the potential to become a cost-competitive alternative to gasoline in the California transportation sector.
Energy demand in California's transportation sector has grown dramatically in the last 5 years as shown in Figure 1. Unfortunately, the market share of petroleum fuels dominates this energy demand, making the state highly vulnerable to supply disruptions. One of the major goals adopted by the state is to diversify the fuels used in all energy-using sectors. However, making a transition to alternative fuels for transportation has met with formidable barriers. Despite the many contraindications-including two major oil supply interruptions , a tripling of petroleum product prices during the last 15 years, and the existence of five areas in California that will not meet air quality standards as set by the Clean Air Act-the transportation sector remains stubbornly dependent on petroleum.
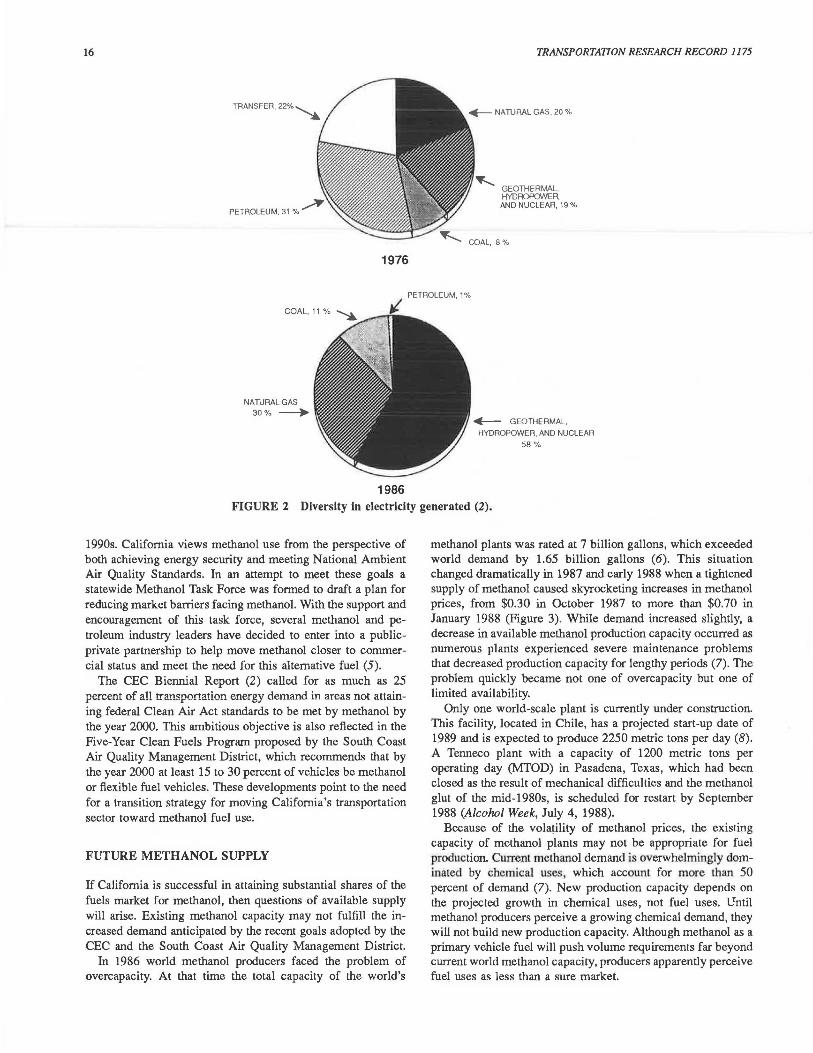
Other fuel-using sectors in California have made substantial progress in diversifying their energy requirements. For example, the electric utility sector produces electricity from oil; natural gas; wind; biomass; and hydroelectric , solar, geothermal, and nuclear energy. Figure 2 shows the diversity in electricity generation between 1976 and 1986, a period when alternative fuels became major contributors to electricity generation and petroleum use declined substantially. Federal legislation,
California Energy Commission, 1516 Ninth Street, Sacramento, Calif. 95814-5512.
5800
5600
:;-w Ci5 en LL 5400 ::> 0
Cf)
...J z <( 0
::J I- _J
0 a: 5200 I- I::.
4800 +--..--- .-----.--..,.---.-- -,--.,..--.-----.-----r 1976 1978 1980 1982 1984 1986
YEAR
FIGURE 1 California transportation energy demand (J).
such as the Public Utilities Resources and Power Act, has helped spur private investment in these alternative resources.
The way that fuels are used in transportation markets differs substantially from the ways in which fuels are used to generate electricity. Fuel resources are exploited to produce electricity that, in tum, is used in an end-use application. The electricity acts as an intermediate transfer step in the delivery of working energy. No comparable intermediate fuel step is available for transportation. Technological limitations will most likely prevent future vehicles from using more than one or possibly two fuels. Fuel-supply infrastructure and vehicles that can use a specific fuel must be developed concurrently. To successfully achieve fuel diversity, then, substantially greater effort will be required in transportation than in other sectors.
California has embarked on several programs designed to bolster the use of " clean" alternative fuels. The California Energy Commission (CEC) demonstration programs have made great strides in the technical design and drivability of vehicles that use these fuels (3). Also of great significance , many of the state's air pollution control districts have adopted air quality control plans that include a clean fuels component. In many instances, these plans identify methanol as the clean fuel of choice.
A recent U.S. Department of Energy report (4) stated that methanol satisfies all of the criteria for a broad-use fuel in the
16
1976
TRANSPORTATION RESEARCH RECORD 1175
......... GEOTHERMAL KYDOOPONER. AND NUCLEAR, 19 %
PETROLEUM, 1%
NA ll.JRAL GAS 30% _..
1986
+--- GEOTHERMAL,
HYDROPOWER, ANO NUCLEAR
58%
FIGURE 2 Diversity in electricity generated (2).
1990s. California views methanol use from the perspective of both achieving energy security and meeting National Ambient Air Quality Standards. In an attempt to meet these goals a statewide Methanol Task Force was formed to draft a plan for reducing market barriers facing methanol. With the support and encouragement of this task force, several methanol and petroleum industry leaders have decided to enter into a publicprivate partnership to help move methanol closer to commercial status and meet the need for this alternative fuel (5).
The CEC Biennial Report (2) called for as much as 25 percent of all transportation energy demand in areas not attaining federal Clean Air Act standards to be met by methanol by the year 2000. This ambitious objective is also reflected in the Five-Year Clean Fuels Program proposed by the South Coast Air Quality Management District, which recommends that by the year 2000 at least 15 to 30 percent of vehicles be methanol or flexible fuel vehicles. These developments point to the need for a transition strategy for moving California's transportation sector toward methanol fuel use.
FUTURE METHANOL SUPPLY
If California is successful in attaining substantial shares of the fuels market for methanol, then questions of available supply will arise. Existing methanol capacity may not fulfill the increased demand anticipated by the recent goals adopted by the CEC and the South Coast Air Quality Management District.
In 1986 world methanol producers faced the problem of overcapacity. At that time the total capacity of the world's
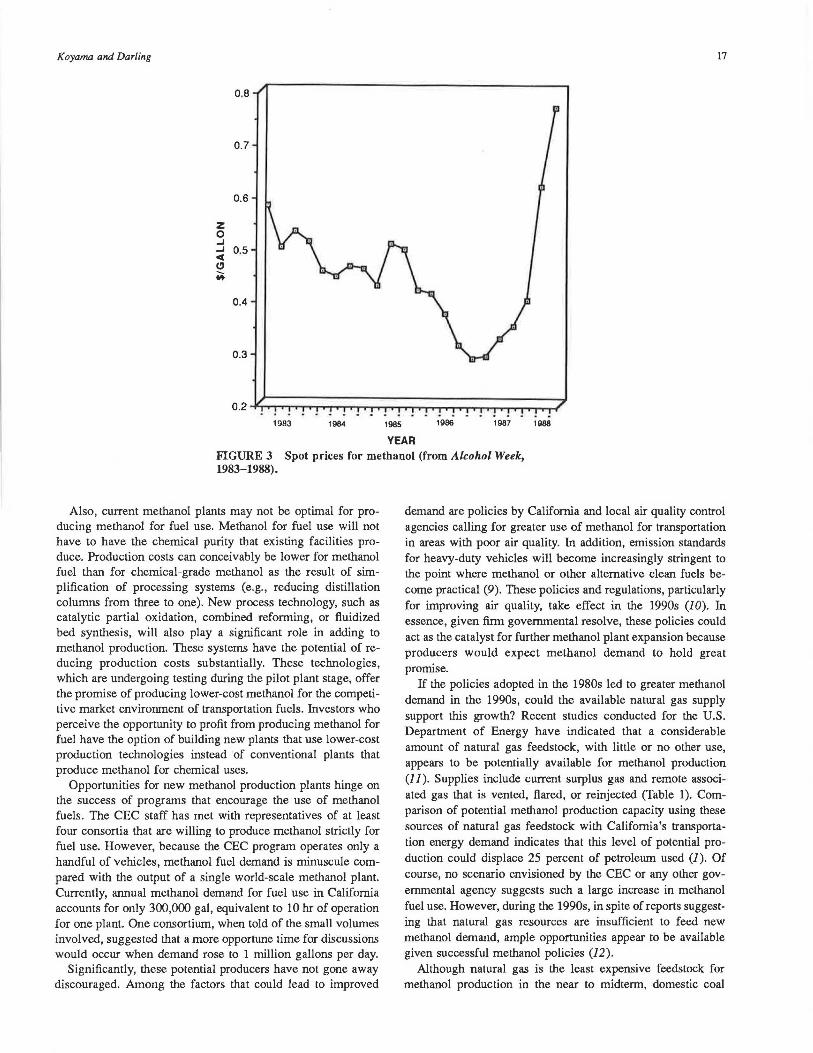
methanol plants was rated at 7 billion gallons, which exceeded world demand by 1.65 billion gallons (6). This situation changed dramatically in 1987 and early 1988 when a tightened supply of methanol caused skyrocketing increases in methanol prices, from $0.30 in October 1987 to more than $0.70 in January 1988 (Figure 3). While demand increased slightly, a decrease in available methanol production capacity occurred as numerous plants experienced severe maintenance problems that decreased production capacity for lengthy periods (7). The problem quickly became not one of overcapacity but one of limited availability.
Only one world-scale plant is currently under construction. This facility, located in Chile, has a projected start-up date of 1989 and is expected to produce 2250 metric tons per day (8). A Tenneco plant with a capacity of 1200 metric tons per operating day (MTOD) in Pasadena, Texas, which had been closed as the result of mechanical difficulties and the methanol glut of the mid-1980s, is scheduled for restart by September 1988 (Alcolwl Week, July 4, 1988).
Because of the vola~ility of methanol prices, the existing capacity of methanol plants may not be appropriate for fuel production. Current methanol demand is overwhelmingly dominated by chemical uses , which accounl for more than 50 percent of demand (7). New production capacity depends on the projected growth in chemical uses, not fuel uses. Until methanol producers perceive a growing chemical demand, they will not build new production capacity. Although methanol as a primary vehicle fuel will push volume requirements far beyond current world methanol capacity, producers apparently perceive fuel uses as less than a sure market.
Koyama and Darling 17
0.6
z 0 ..I ..I
""' 0.5
CJ M.
0.4
1983 1984 1985 1986 1987 1988
YEAR FIGURE 3 Spot prices for methanol (from Alcohol Week, 1983-1988).
Also, current methanol plants may not be optimal for producing methanol for fuel use. Methanol for fuel use will not have to have the chemical purity that existing facilities produce. Production costs can conceivably be lower for methanol fuel than for chemical-grade methanol as the result of simplification of processing systems (e.g., reducing distillation columns from three to one). New process technology, such as catalytic partial oxidation, combined reforming, or fluidized bed synthesis, will also play a significant role in adding to methanol production. These systems have the potential of reducing production costs substantially. These technologies, which are undergoing testing during the pilot plant stage, offer the promise of producing lower-cost methanol for the competitive market environment of transportation fuels . Investors who perceive the opportunity to profit from producing methanol for fuel have the option of building new plants that use lower-cost production technologies instead ·of conventional plants that produce methanol for chemical uses.
Opportunities for new methanol production plants hinge on the success of programs that encourage the use of methanol fuels. The CEC staff has met with representatives of at least four consortia that are willing to produce methanol strictly for fuel use. However, because the CEC program operates only a handful of vehicles, methanol fuel demand is minuscule compared with the output of a single world-scale methanol plant. Currently, annual methanol demand for fuel use in California accounts for only 300,000 gal, equivalent to 10 hr of operation for one plant. One consortium, when told of the small volumes involved, suggested that a more opportune time for discussions would occur when demand rose to 1 million gallons per day.
Significantly, these potential producers have not gone away discouraged. Among the factors that could lead to improved
demand are policies by California and local air quality control agencies calling for greater use of methanol for transportation in areas with poor air quality. In addition, emission standards for heavy-duty vehicles will become increasingly stringent to the point where methanol or other alternative clean fuels become practical (9). These policies and regulations, particularly for improving air quality, take effect in the 1990s (JO). In essence, given firm governmental resolve, these policies could act as the catalyst for further methanol plant expansion because producers would expect methanol demand to hold great promise.
If the policies adopted in the 1980s led to greater methanol demand in the 1990s, could the available natural gas supply support this growth? Recent studies conducted for the U.S. Department of Energy have indicated that a considerable amount of natural gas feedstock, with little or no other use, appears to be potentially available for methanol production (JJ). Supplies include current surplus gas and remote associated gas that is vented, flared, or reinjected (Table 1). Comparison of potential methanol production capacity using these sources of natural gas feedstock with California's transportation energy demand indicates that this level of potential production could displace 25 percent of petroleum used (1 ). Of course, no scenario envisioned by the CEC or any other governmental agency suggests such a large increase in methanol fuel use. However, during the 1990s, in spite of reports suggesting that natural gas resources are insufficient to feed new methanol demand, ample opportunities appear to be available given successful methanol policies (12).
Although natural gas is the least expensive feedstock for methanol production in the near to midterm, domestic coal

18
TABLE 1 ASSOCIATED GAS POTENTIAL METHANOL CAPACITY (11)
POTENTIAL VENTILATED REINJECTED TOTAL METHANOL FlAREDGA.S G\S G\S CAPACfTY
ca.NTRY (BC Fl (BC.Fl (BCF) (MM GALLONS)
LS 95 1,915 2,010 19,680
~ 90 425 51 5 4 ,886
MEXICO 108 NA 1 08 988
ARGENTINA 113 30 143 1 ,266
BRAZIL 33 35 68 667
CHILE 0 113 11 3 1 ,072
TRINIDAD 4 9 NA 49 487
/\LGERI/\ 160 1,822 1 ,982 1 q.q71
BAHRAIN 0 57 57 567
SAUDI ATRABIA 11 0 4 6 156 1 ,551
UAEMIRATES 224 55 279 2,774
INDIA 13 5 44 179 1 ,758
MALAYSIA 60 0 60 589
TOTAL 1 , 1 77 4 , 54,<? 5 .71 9 56,255
feedstock offers a measure of security against disruptions of feedstock or methanol supplies from foreign sources. However, methanol production from coal is not considered economical or attractive in the near future for a number of reasons. First, if coal were used as the primary feedstock for methanol production, the resulting environmental problems of pollution and global warming-the greenhouse effect-would have to be addressed (13, 14). Coal use significantly increases the amount of carbon dioxide released to the atmosphere, in comparison with the burning of other .hydrocarbons such as oil. Second, estimates of the cost of methanol from domestic coal are 20 to 40 percent higher than the cost of methanol from natural gas feedstock (15) . Therefore, in light of the abundance of natural gas resources, methanol production from coal would only be feasible , both economically and environmentally, in the long term.
OPPORTUNITIES TO LOWER METHANOL COSTS
Under present conditions, methanol prices far exceed what they would have to be for methanol to be competitive with gasoline. As suggested previously, methanol prices reflect tight chemical markets, not competitive fuel markets. Assuming that the methanol industry expands to include fuel markets, methanol must become more price competitive than it is at present. Significantly, opportunities to lower methanol production costs have become apparent. (The authors, of course, do not presume to substitute production costs for price. However, because capital investments make no sense when costs exceed prices, production costs represent the lowest point for methanol prices.)
The importance of lower methanol prices is indicated by the data in Table 2. This table gives gasoline equivalent prices at various landed costs to the Los Angeles harbor. With current
TRANSPORTATION RESEARCH RECORD 1175
TABLE 2 EQUIVALENT GASOLINE PRICES FOR VARIOUS LANDED COSTS (16)
LANDED PRICE OF METHANOL EQUIVALENT GASOLJNE
AT LOS ANGELJES HARBOR PRICE
(1987$ PER GALLON) (1987 $ PER GALLON)
$0 .30 $1.13
$0.40 $1.29
$0 ,50 $1 .45
$0.60 $1 61
$0.70 $1 77
spot prices at $0.70/gal, the equivalt:nl gasoline price of $1.77/ gal far exceeds present prices of all gasoline grades (16) . Unfortunately, spot prices, as indicated in Figure 3, show a definite trend toward higher prices rather than lower.
Methanol Production Plants
To change this trend, more capacity must be added. Increasing capacity involves either expansion of existing facilities or entirely new plants. Both methods could present opportunities to lower production costs. An expansion would typically involve building a second complete plant, located adjacent to an operating facility, instead of upgrading the older plant to higher production capacities. The older plant is limited by the steam reformer and engineered pressure levels that would require major overhaul to upgrade. A second plant on an adjacent site could take advantage of an already built infrastructure such as ports and utilities. In contrast to an entirely new plant, which may cost as much as $300 million, as indicated by the only plant under construction (8), an expansion may cost only $200 million to $240 million (12).
More promising for methanol producers are the new process technologies. For example, the Davy McKee Corporation has proposed a catalytic partial oxidation (CPO) process that takes advantage of an exothermic reaction using oxygen rather than steam. The reactions arc as follows:
CPO
Conventional steam reforming
Conventional steam reforming consumes more hydrogen, demineralized water, energy for plant operations, and plant area. Proponents suggest that a 2000-MTOD plant would cost approximately $90 million excluding costs for off-plot features . The major cost savings are attributable to lower demineralized water and power requirements (17).
Mitsubishi Gas Chemical has built a methanol production facility that uses a fluidized bed as the catalytic medium. Pilot plant results indicate that the process more efficiently converts

Koyama and Darling
methanol from methane using a secondary steam reformer. Although plant costs are roughly the same for a 2000-MTOD plant, the Mitsubishi process could increase plant capacity to 10 000 MTOD (3.33 million gallons per day) whereas the eil ctive fonic to a plant using conventional process technology is approximately 2500 MTOD. At this large scale, plant coses are roughly 70 percent of the cost of four conventional 2500-MTOD plants (18).
These plants and other new processes proposed by Brookhaven National Laboratories and Catalytica, Inc. , will require considerable upscale engineering before lower costs are realized. However, to compete as a transportation fuel, methanol probably requires these new processes and their lower production costs to attain competitive leverage.
Jn addition to the promise of new processing technology, the choice of incurring debt financing can play an important role in determining final production costs. Table 3 gives the capital
TABLE 3 METHANOL PLANT INVESTMENT CRITERIA
CAPITAL v NARGES CAPITAL INVESTMENT 100% EQUllY
1$MMl (CENTS/GALLON)
100 0,08 150 0.12 200 0, 15 250 0.19 300 0.23 350 0.27 400 0.30 450 0.34 500 0 38 550 0.42 600 0.46
ASSUMPTIONS: PROJECT LIFE · 15 YEARS OF OPERATION; TAX RATE · 35%; CONSTRUCTION PERIOD · 3 YEARS,
55% EOUITY (CENTS/GALLON)
0.06 0 09 0.12 0.16 0.19 0.22 0.25 0.29 0 32 0.35 0.39
1 ST YEAR - 20%, 2ND YEAR · 40%, 3RD YEAR · 40"!.; OPERATING AT 65% EFFICIENCY, 350 DAYS/YEAR; DEPRECIATION· 10 YEARS; FEEDSTOCK $0.50 MCF; R0 1·15%; 2500 TON/DAY CAPACITY; WORKING CAPITAL - $20 MM.
charges for new methanol plants using different baseline capital investment criteria. For the $300 million plant that uses conventional processing technology, incurring 45 percent debt at 10 percent interest will cut fixed costs from $0.23/gal to $0.19/ gal. In both cases the following assumptions have been made: 15 percent after-tax return on equity, 35 percent tax rate, 10-year straight line depreciation, 15-year project life, and 3-year construction period. In addition to debt assumption, the other variables, although consistent with major capital budget accounting standards, can also change production costs significantly. Longer construction periods such as 5 years, which some analysts have assumed, can raise these costs to $0.54/gal (12). Several other sources suggest that the investment criteria listed in Table 3 fall well within accepted industry standards (19-22).
Feedstock Costs
Feedstock costs also play an extremely important role in final production costs . As indicated earlier, U.S. Department of Energy (DOE) studies indicate that a considerable amount of
19
feedstock natural gas with low costs and little or no other uses is potentially available for methanol production plants (11 ).
DOE's analysis yielded estimates of the marginal production costs for the natural gas in individual countries. The researchers determined these costs by calculating the weighted average of the new nonassociated gas development costs and the currently unused associated gas reserves assumed to have no development costs because methanol production is subordinate to that of oil, the primary economic product.
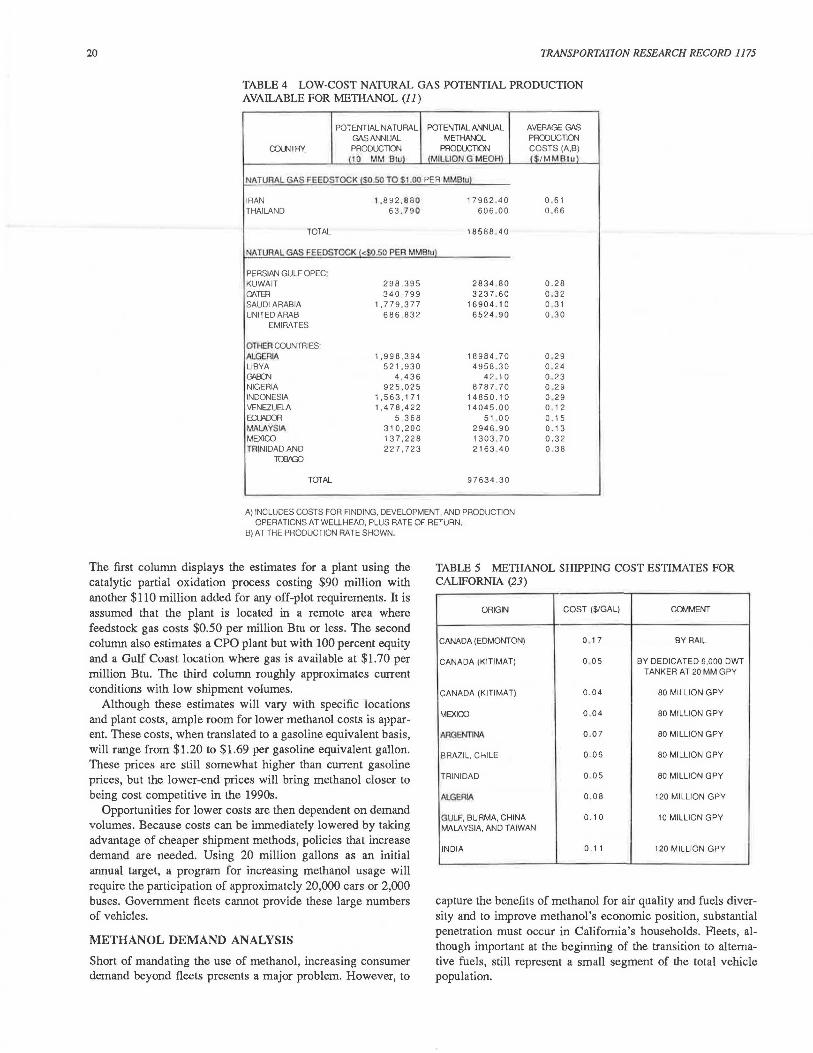
Table 4 gives a summary of the analysis and potential methanol from these resources. This table is limited to countries with marginal production costs of $1.00 per million Btu or less. Other countries with substantial natural gas reserves were excluded from this table because production costs were estimated to be above $1.00 per million Btu. The DOE study concluded that low-cost natural gas could produce 97 billion gallons annually if fully developed (4) . At higher costs other resource areas could provide additional methanol production potential.
As the data in Table 4 indicate, the OPEC countries could be large potential suppliers of methanol. Some have raised concerns that a methanol strategy will merely shift reliance on Persian Gulf oil to Persian Gulf methanol. However, subtracting the potential methanol capacity of Persian Gulf nations and Libya from the total potential capacity still leaves more than 60 billion gallons of annual capacity. This suggests that no one region can dominate price behavior because other areas can more than compensate for the marginal decline of the Persian Gulf nations and Libya in the event of a methanol supply shutdown in this volatile region.
Shipment of Methanol
How methanol is transported depends on the volumes shipped. By extension, the volume of methanol shipped depends on the demand for this product.
Currently, the CEC obtains methanol for its demonstration program from Canada. The methanol is shipped by rail tankers. Although rail tankers are an expensive method of shipping methanol, the program does not generate large enough volume demand to use cheaper forms of shipment. This results in a shipment cost of from $0.17 to $0.20 per gallon.
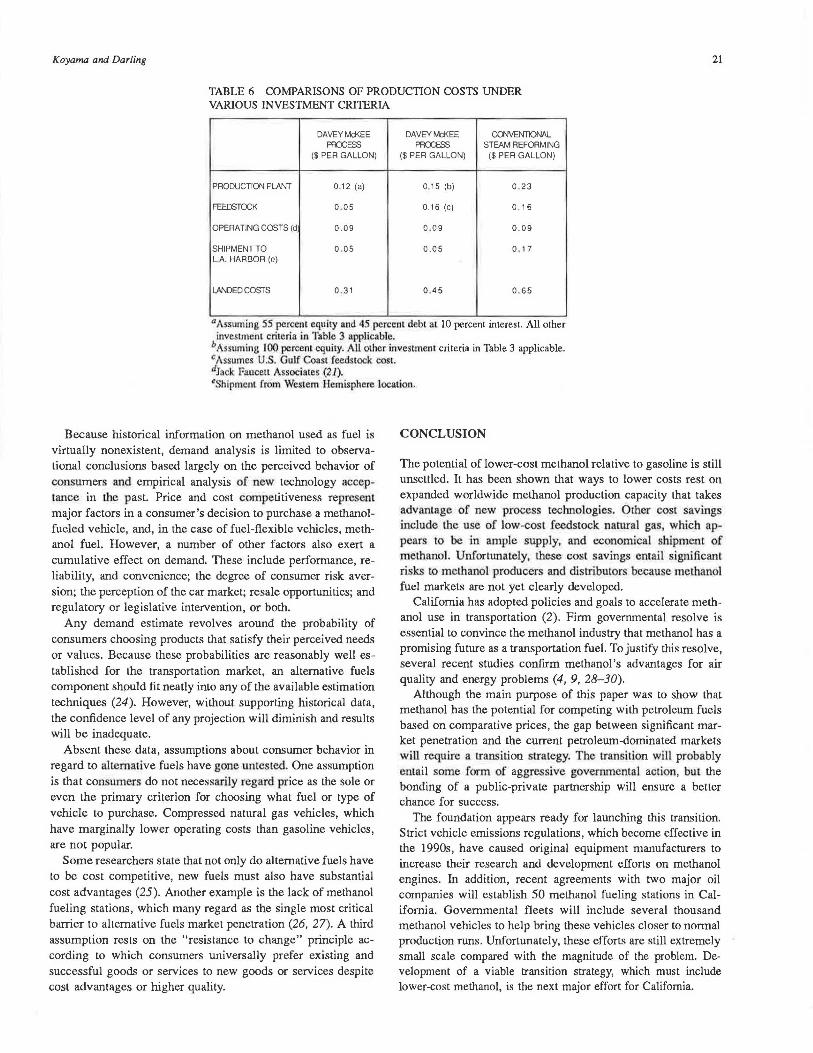
Tanker ships would be a more economical means of transport. A survey of shipping firms showed that the smallest tanker available would haul 6000 tons (2.0 million gallons) of methanol in 10 shipments per year. Assuming a western Canadian port, shipment costs to Los Angeles would be $0.05/gal, one-third to one-quarter the cost for rail. Table 5 gives the costs of shipping methanol at the minimum acceptable annual volumes from various ports (23).
California does not use tanker ships at this time because the methanol demonstration program uses only 300,000 gal per year. A single shipment would require bulk storage of 2.0 million gallons, a supply that would last at least 6 years. Added storage costs for 6 years would far exceed costs per gallon for shipment by rail at smaller volumes.
Estimate of Lower Production Costs
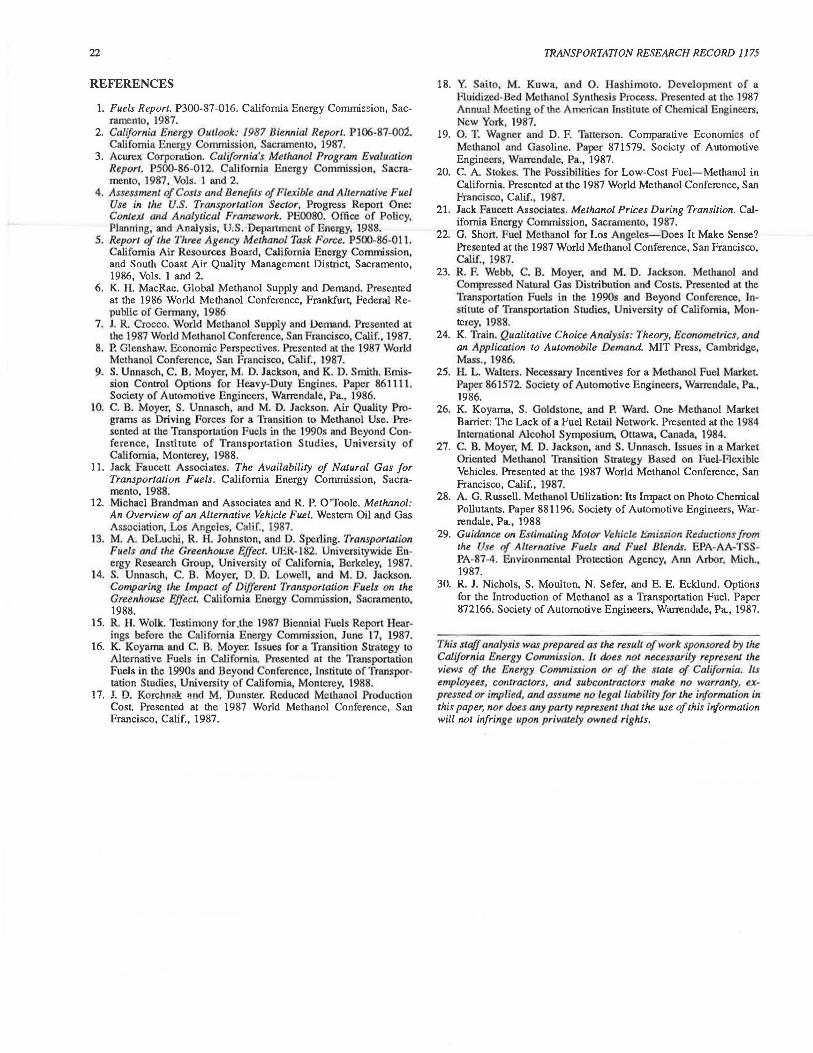
As a result of the preceding analysis, estimates of methanol production costs can be obtained. Table 6 gives a summary of these costs using different investment criteria and processes.
20 TRANSPORTATION RESEARCH RECORD 1175
TABLE 4 LOW-COST NATURAL GAS POTENTIAL PRODUCTION AVAILABLE FOR METHANOL (11)
POTENTIAL NATURAL POTENTIAL ANNUAL AVERAGE GAS GAS ANNUAL METI-!ANOL PRODUCllON
OOLNmY PRODUCllON PRODUCTION COSTS (A,B) 110 MM Blul !MILLION G MEOHl ($/M M B l ul
NATURAL GAS FEEDSTOCK 1$0.50 TO $1.00 PER MMBlul
IRAN 1.892.880 17982 . 40 0 . 61 THAILAND 63 . 790 606 .00 0 .66
TOTAL 18588 . 40
NATURAL G/IS FEEDSTOCK !<S0.50 PEA MMBtul
PERSIAN GULF OPEC· KUWAIT 298,395 2834 .80 0.28 Ql\Tm 3 4 0,799 3237 . 60 0 .32 SAUDI ARABIA 1,779.377 16904 . 10 0 . 31 UNITED ARAB 686,832 6 524 . 9 0 0 .30
EMIRATES
OTHER COUNTRIES: ALGERIA 1 ,998,394 18984 . 70 0 . 29 LIBYA 521,930 4958 . 30 0 . 24 GAB:)>J 4 ,436 42 . 10 0 23 NIGERIA 925,025 8787 . 70 0 .29 IN DON ES IA 1,563, 17 1 14850.10 0 . 29 VENEZUELA 1,47B,422 14045.00 0 . 12 ECUtlOC'fl 5 ,368 51 00 0 . 15 MALAYSIA 310,200 29 4 6. 90 0 . 13 MEXICO 137,228 1303 . 70 0.32 TRINIDAD AND 227.723 2163 . 40 0 .38
TaWXl
TOTAL 97634 . 30
A) INCLUDES COSTS FOR FINDING, DEVELOPMENT, AND PRODUCTION OPERATIONS AT WELLHEAD, PLUS RATE OF RETURN.
B) AT THE PRODUCTION RA TE SHOWN.
The first column displays the estimates for a plant using the catalytic partial oxidation process costing $90 million with another $110 million added for any off-plot requirements. It is assumed that the plant is located in a remote area where feedstock gas costs $0.50 per million Btu or less. The second column also estimates a CPO plant but with 100 percent equity and a Gulf Coast location where gas is available at $1.70 per million Btu. The third column roughly approximates current conditions with low shipment volumes.
Although these estimates will vary with specific locations and plant costs, ample room for lower methanol costs is apparent. These costs, when translated to a gasoline equivalent basis, will range from $1.20 to $1.69 per gasoline equivalent gallon. These prices are still somewhat higher than current gasoline prices, but the lower-end prices will bring methanol closer to being cost competitive in the 1990s.
Opportunities for lower costs are then dependent on demand volumes. Because costs can be immediately lowered by taking advantage of cheaper shipment methods, policies that increase demand are needed. Using 20 million gallons as an initial annual target, a program for increasing methanol usage will require the participation of approximately 20,000 cars or 2,000 buses. Government fleets cannot provide these large numbers of vehicles.
METHANOL DEMAND ANALYSIS
Short of mandating the use of methanol, increasing consumer demand beyond fleets presents a major problem. However, to
TABLE 5 METHANOL SHIPPING COST ESTIMATES FOR CALIFORNIA (23)
ORIGIN COST ($/GAL) Gav1MENT
CANADA (EDMONTON) 0 . 17 BY RAIL
CANADA (KITIMAT) 0 05 BY DEDICATED 6,000 DWT TANKER AT 20 MM GPY
CANADA (KITIMAT) 0 .04 BO MILLION GPY
MEXICO 0 .04 BO MILLION GPY
AAGE:NTINll 0 .0 7 BO MILLION GPY
BRAZIL, CHILE 0 . 06 80 MILLION GPY
TRINIDAD 0 . 0 5 80 MILLION GPY
ALGERIA 0 . 0 8 120 MILLION GPY
GULF, BURMA, CHINA 0.10 10 MILLION GPY MALAYSIA, AND TAIWAN
!NOIA 0 , 11 120 MILLION GPY
capture the benefits of methanol for air quality and fuels diversity and to improve methanol's economic position, substantial penetration must occur in California's households. Fleets, although important at the beginning of the transition to alternative fuels, still represent a small segment of the total vehicle population.
Koyama and Darling 21
TABLE 6 COMPARISONS OF PRODUCTION COSTS UNDER VARIOUS INVESTMENT CRITERIA
DAVEY McKEE DAVEY McKEE ca-NENTIONAL PRXESS PROCESS STEAM REFORMING
($ PER GALLON) ($ PER GALLON) ($ PER GALLON)
PRODUCTION PLANT 0.12 (a) 0.15 (b) 0 . 2 3
FEEDSTOCK 0 . 05 0. 16 (C) 0. 16
OPERATING COSTS (d 0.09 0 . 0 9 0 .0 9
SHIPMENT TO 0 .05 0. 05 0 . 17 L.A. HARBOR (e)
LANDED COSTS 0 .31 0 .45 0 . 6 5
0 Assuming 55 percenl equity nod 45 percent debl at 10 percent interest. All other investment criteria in Table 3 applicable.
b Assuming 100 percenl equily. AU other uwesunent criteria in Table 3 applicable. cAssumes U.S. Gulf Coast feedstock cost. dJnck foauc11a Associates (21). ~Shipment from Western Hemisphere location.
Because historical information on methanol used as fuel is virtually nonexistent, demand analysis is limited to observational conclusions based largely on the perceived behavior of consumers and empirical analysis of new technology acceptance in the past. Price and cost competitiveness represent major factors in a consumer's decision to purchase a methanolfueled vehicle, and, in the case of fuel-flexible vehicles, methanol fuel. However, a number of other factors also exert a cumulative effect on demand. These include performance, reliability, and convenience; the degree of consumer risk aversion; the perception of the car market; resale opportunities; and regulatory or legislative intervention, or both.
Any demand estimate revolves around the probability of consumers choosing products that satisfy their perceived needs or values. Because these probabilities are reasonably well established for the transportation market, an alternative fuels component should fit neatly into any of the available estimation techniques (24). However, without supporting historical data, the confidence level of any projection will diminish and results will be inadequate.
Absent these data, assumptions about consumer behavior in regard to alternative fuels have gone untested. One assumption is that consumers do not necessarily regard price as the sole or even the primary criterion for choosing what fuel or type of vehicle to purchase. Compressed natural gas vehicles, which have marginally lower operating costs than gasoline vehicles, are not popular.
Some researchers state that not only do alternative fuels have to be cost competitive, new fuels must also have substantial cost advantages (25). Another example is the lack of methanol fueling stations, which many regard as the single most critical barrier to alternative fuels market penetration (26, 27). A third assumption rests on the "resistance to change" principle according Lo which consumers universally prefer existing and successful goods or services to new goods or services despite cost advantages or higher quality.
CONCLUSION
The potential of lower-cost methanol relative to gasoline is still unsettled. It has been shown that ways to lower costs rest on expanded worldwide methanol production capacity that takes advantage of new process technologies. Other cost savings include the use of low-cost feedstock natural gas, which appears to be in ample supply, and economical shipment of methanol. Unfortunately, these cost savings entail significant risks to meihanol producers and distributors bccau e methanol fuel markets are not yet clearly developed.
California has adopted policies and goals to accelerate methanol use in transportation (2). Firm governmental resolve is essential to convince the methanol industry that methanol has a promising future as a transportation fuel. To justify this resolve, several recent studies confirm methanol's advantages for air quality and energy problems (4, 9, 28-30).
Allhough the main purpose of this paper was to show that methanol has the potential for competing with petroleum fuels based on comparative prices, the gap between significant market penetration and the current petroleum-dominated markets will require a transition strategy. The transition will probably entail some form of aggressive governmental action, but the bonding of a public-private partnership will ensure a better chance for success.
The foundation appears ready for launching this transition. Strict vehicle emissions regulations, which become effective in the 1990s, have caused original equipment manufacturers to increase their research and development efforts on methanol engines. In addition, recent agreements with two major oil companies will establish 50 methanol fueling stations in California. Governmental fleets will include several thousand methanol vehicles to help bring these vehicles closer to normal production runs . Unfortunately, these efforts are still extremely small scale compared with the magnitude of the problem. Development of a viable transition strategy, which must include lower-cost methanol, is the next major effort for California.
22
REFERENCES
I. Fuels Report. P300-87-016. California Energy Commission, Sacramento, 1987.
2. California Energy Outlook: 1987 Biennial Report. P106-87-002. California Energy Commission, Sacramento, 1987.
3. Acurex Corporati0n. California's Methanol Program Eva/uaJion Report. PS00-86-012. California Energy Commission, Sacramento, 1987, Vols. 1 and 2.
4. Assessment of Costs and Benefits of Flexible and AlternaJive F11el Use in the U.S. TramportaJirm Sector, Progress Repon One: Con/exJ and Analytical Framework. PE0080. Office of Policy, Planning, and Analysis, U.S. Department of Energy, 1988.
5. Report of the Three Agency Methanol Task Force. PS00-86-011. California Air Resources Board, California Energy Commission, and South Coast Air Quality Management District, Sacramento, 1986, Vols. 1 and 2.
6. K. H. MacRae. Global Methanol Supply and Demand. Presented at the 1986 World Methanol Conference, Frankfurt, Federal Republic of Germany, 1986
7. J. R. Crocco. World Methanol Supply and Demand. Presented at the 1987 World Methanol Conference, San Francisco. Calif., 1987.
8. P. Glcnshaw. Economic Perspectives. Presented ac the 1987 World Methanol Conference, San Francisco, Calif., 1987.
9. S. Unnasch, C. B. Moyer, M. D. Jackson, and K. D. Smith. Emission Control Options for Heavy-Duty Engines. Paper 861111. Society of Automotive Engineers, Warrendale, Pa., 1986.
10. C. D. Moyer, S. Unnasch, and M. D. Jackson. Air Quality Programs as Driving Forces for a Transition to Melhanol Use. Pre· sented at the Transporiation Fuels i11 the 1990s and Beyond Conference, Institute of Transportation S tudies. Univetsily of California, Monterey, 1988.
11. Jack Faucett Associates. The Availability of Natural Gas for Transportation Fuels. California Energy Commission, Sacramento, 1988.
12. Michael Brandman and Associates and R. P. O'Toole. Methanol: An Overview of an Alternative Vehicle Fuel. Western Oil and Gas Association, Los Angeles, Calif., 1987.
13. M. A. DeLuchi, R. H. Johnston, and D. Sperling. Transportation F11els and the Greenhouse Effect. UER-182. Universitywide Energy Research Group, University of California, Berkeley, 1987.
14. S. Unnasch, C. B. Moyer, D. D. Lowell, and M. D. Jackson. Comparing the Impact of Different Transportation Fuels on the Greenhouse Effect. Califom1a Energy Commission, Sacramento, 1988.
15. R. H. Wolk. Testimony for .the 1987 niennfal Fuels Report Hearings before the California Energy Commission, Jun.e 17, 1987.
16. K. Koyama and C. B. Moyer. Issues for a Transition Strategy to t\lternative Fuels in California Presented at the Transportation Fuels in the 1990s and Beyond Conference, Institute of Transportation Studies, University of California, Monterey, L988.
17. J. D. Korc.hna.k and M. Dunster. Reduced Methanol Production Cost. Presented at the 1987 World Methanol Conference, San Francisco, Calif., 1987.
TRANSPORTATION RESEARCH RECORD 1175
18. Y. Saico, M . Kuwa, and 0. Hasltimoto. Development of a Fluidized-Bed Methanol Synthesis Process. Presented at the 1987 Annual Meeting of the American Institute of Chemical Engineers, New York, 1987.
19. 0. T. Wagner and D. F. Tattcrson. Comparative Economics of Methanol and Gasoline. Paper 871579. Society of Automotive Engineers, Wanendale, Pa., 1987.
20. C. A. Stokes. The Possibilities for Low-Cost Fuel-Methanol in California. Presented at the 1987 World Methanol Conference, San Francisco, Calif., 1987.
21. Jack Faucett Associates. Methanol Prices During Transition. California Energy Commission, Sacramento, 1987.
22. G. Shon. Fuel Methanol for Los Angeles-Does It Make Sense? Presented at the 1987 World Methanol Conference, San Francisco, Calif., 1987.
23. R. F. Webb. C. B. Moyer, and M. D. Jackson. Methanol and Compressed Natural Gas Distribution and Costs. Presented at the Transportation Fuels in the 1990s and Beyond Conference, Institute of Transportation Studies, University of California, Monterey, 1988.
24. K. Train. Qualitative Choice Analysis: Theory, Econometrics, and an Application to Automobile Demand. MIT Press, Cambridge, Mass., 1986.
25. H. L. Walters. Necessary Jncentives for a Methanol Fuel Market. Paper 861572. Society of Automotive Engineers, Warrendale, Pa, 1986.
26. K. Koyama, S. Goldstone, and P. Ward. One Methanol Market Barrier: The Lack of a Fuel Retail Network. Presented at the 1984 Jn1crnational Alcohol Symposium, 011awa, Canada, 1984.
27. C. D. Moyer, M. D. Jackson, and S. Unnasch. Issues in a Market Oriented Methanol Transition Sttatcgy Based on Fuel-Flexible Vehicles. Presented at the 1987 World Methanol Conference, San Francisco, Calif., 1987.
28. A. G. Russell. Melhanol Utilization: Its Impact on Photo Chemical Pollutants. Paper 881196. Society of Automotive Engineers, Warrendale, Pa, 1988
29. Guidance on Estima1i11g Motor Vehicle Emission Reductions from the se of Alternative Fuels and Fuel Blends. EPA· AA-TSS· PA-87-4. Environmental Protection Agency, Ann Arbor, Mich., 1987.
30. R. J. Nichols, S. Moulton, N. Sefer, and E. E. Ecklund. Options for the Introduction of Methanol as a Transportation Fuel. Paper 872166. Society of Automotive Engineers, Warrendale, Pa, 1987.
This staff analysis was prepared as the result of work sponsored by the California Energy Commission. ft does not necessarily represent the views of the Energy Commission or of the ,rta1e of California. Its employees, contractors, and subcontractors make no warranty, expressed or implied, and assume no legal liability for the information in this paper, nor does any party represent that the use oj this information will not infringe 11pon privaiely owned rights.