Human small-intestinal epithelium contains functional natural killer lymphocytes
www.elsevier.com/locate/ygyno
Gynecologic Oncology 93 (2004) 59–68
Fourier transform infrared (FTIR) spectral mapping of the cervical
transformation zone, and dysplastic squamous epithelium
B.R. Wood,a,b L. Chiriboga,c H. Yee,c M.A. Quinn,d D. McNaughton,b and M. Diema,*
aDepartment of Chemistry and Biochemistry, Hunter College, City University of New York, New York, NY 10021, USAbCentre for Biospectroscopy and School of Chemistry, Monash University, Clayton, Victoria 3800, Australia
cDepartment of Pathology, Bellevue Hospital and New York University School of Medicine, New York, NY 10016, USAdDepartment of Obstetrics and Gynecology, Royal Women’s Hospital, Parkville, Victoria 3052, Australia
Received 1 July 2003
Abstract
Objective. This paper is aimed at establishing infrared spectral patterns for the different tissue types found in, and for different stages of
disease of squamous cervical epithelium. Methods for the unsupervised distinction of these tissue types are discussed.
Methods. Fourier transform infrared (FTIR) maps of the squamous and glandular cervical epithelium, and of the cervical transformation
zone, were obtained and analyzed by multivariate unsupervised hierarchical cluster methods. The resulting clusters are correlated to the
corresponding stained histopathological features in the tissue sections.
Results. Multivariate statistical analysis of FTIR spectra collected for tissue sections permit an unsupervised method of distinguishing
tissue types, and of differentiating between normal and diseased tissue. By analyzing different spectral windows and comparing the results
with histology, we found the amide I and II region (1740–1470 cm�1) to be very important in correlating anatomical and histopathological
features in tissue to spectral clusters. Since an unsupervised, rather than a diagnostic, algorithm was used in these efforts, no statistical
analysis of false-positive/false-negative results is reported at this time.
Conclusions. The combination of FTIR micro-spectroscopy and multivariate spectral processing provides important insights into the
fundamental spectral signatures of individual cells and consequently shows potential as a diagnostic tool for cervical cancer.
D 2004 Elsevier Inc. All rights reserved.
Keywords: Cervical cancer; Fourier transform infrared micro-spectroscopy; Unsupervised hierarchical clustering
Introduction
Until the early 1990s, cervical cancer was the most
frequent neoplastic disease among women in developing
countries, before breast cancer became the predominant
cancer site [1]. Each year, over 400,000 new cases of
invasive cervical cancer are diagnosed world wide, repre-
senting nearly 10% of all cancers in women [2]. Currently,
screening for cervical disease is carried out via the Papani-
colaou (PAP) smear test, in which squamous and glandular
epithelial cells are exfoliated with a Cytobrushk or Ayre
spatula from the cervical transformation zone, fixed in
ethanol, and stained with the Papanicolou stain. A definitive
diagnosis is obtained by cervical biopsy and examination of
0090-8258/$ - see front matter D 2004 Elsevier Inc. All rights reserved.
doi:10.1016/j.ygyno.2003.12.028
* Corresponding author. Department of Chemistry and Biochemistry,
Hunter College, City University of New York, 695 Park Avenue, New
York, NY 10021. Fax: +1-212-772-5332.
E-mail address: [email protected] (M. Diem).
the stained tissue. The predictive value of a biopsy is higher
than that of the PAP test because the anatomical arrange-
ment is preserved allowing evaluation of pathological fea-
tures in relation to histological architecture.
Cervical disease is classified using the two-tier Bethesda
system for PAP smears [3] (low- and high-grade squamous
intraepithelial lesions, LSIL and HSIL), and the three-tier
cervical intraepithelial neoplasia (CIN I, II and III) system
for surgical samples. Samples diagnosed as CIN II and CIN
III have a higher risk of proceeding to carcinoma in situ
(CIS). More recently, the presence of high-risk human
papilloma virus (HPV) genotypes has been associated with
cervical dysplasia and its progression to cancer [4–6,15].
This is now being used as an adjunct to detect cervical
lesions in conjunction with the PAP smear [7–9].
The PAP test has reduced the mortality of invasive
cervical cancer by up to 70% [10,11]. Despite its success,
cytological screening has limitations, the most important
being false-negative results. Reported false-negative rates

B.R. Wood et al. / Gynecologic Oncology 93 (2004) 59–6860
for the PAP smear vary widely; from as low as 1% to as high
as 93% [12–14]. The Consensus Development Conference
of Cancer of the Cervix, convened by the National Institutes
of Health (NIH), concluded that about half of the false-
negative PAP tests are due to inadequate specimen collec-
tion, with the other half due to failure of identifying or
interpreting the specimens correctly. Alternative techniques,
aimed at eliminating subjective diagnoses by cytological
screeners, have been pursued. One approach to minimize the
error rate in cervical cytology has been to use automated
image analysis systems coupled with artificial neural net-
works (ANNs) to reduce the labor and time necessary to re-
screen for false-negatives [16,17]. Another approach has
been to improve the quality of slide preparation through the
implementation of liquid-based or ‘‘thin-prep’’ methods
[18–20]. While automated image analysis systems have
fallen out of favor, liquid-based cytological methods have
gained a stronger presence in cytology laboratories [21].
The infrared alternative
The previous decade has witnessed the evolution of Four-
ier transform infrared (FTIR) spectroscopy as an independent
modality to discriminate between diseased and normal tissue.
Several comprehensive books and articles outline the field
[22–25]. One area that has received considerable attention
was the application of the FTIR technique to the diagnosis of
cervical neoplasia [26–35]. Early studies reported spectral
differences between exfoliated cells from patients diagnosed
normal and dysplastic by cytological [26,27] and histological
methods [28,30]. The essential differences were related to
changes in glycogen, nucleic acid, and protein content. Upon
further study, it became apparent that the spectral changes
observed between normal and diseased samples might not be
related to the presence of dysplastic cells per se, but rather to
non-specific factors such as localized inflammation effects
[31,36], the cell type being measured [32], and the non-
specific depletion of cytoplasmic glycogen. These studies
demonstrated that a detailed understanding of the spectral
features of the cell types, and spectral variations resulting
from differentiation, maturation, and cell cycle stages, is a
pre-requisite before interpreting the spectral differences be-
tween normal and dysplastic cytological diagnosed samples
[25]. Other factors that needed to be addressed were the
effects of potential confounding variables such as mucin,
erythrocytes, leukocytes, and other debris that can obscure
diagnostic regions of the spectra [31,36–38]. A study of
samples collected at different stages of the menstrual cycle
revealed dramatic changes due to variations in glycogen
concentration [39].
Since the majority of cervical neoplasia is believed to
arise in the transformation zone [40,41], an in-depth spec-
troscopic investigation into cytological ‘‘normal’’ cells of
the cervical transformation zone needed to be carried out.
This is best achieved by FTIR mapping or imaging of actual
cervical tissue sections obtained by punch biopsies or
hysterectomies and comparing the FTIR maps and/or
images with the corresponding stained sections.
This report presents preliminary results obtained from the
analysis of nearly 750,000 FTIR spectra obtained for
cervical biopsy samples. While the aim of this study was
to demonstrate that unsupervised multivariate statistical
methods can differentiate between tissue types found in
cervical biopsies, and distinguish normal from dysplastic
and neoplastic tissue areas, this study was not intended to
develop a diagnostic algorithm to analyze tissue sections.
However, the clusters of spectra produced during this study
are being used as input data for the development of a
diagnostic algorithm, based on an Artificial Neural Net-
work, to be reported at a later stage.
This report does not ‘‘search for distinct cancer markers’’
to diagnose cancerous areas of a biopsy, but utilizes math-
ematical procedures, which analyze subtle spectral differ-
ences in the entire spectra, to differentiate normal from
diseased tissue. Thus, a progression from mild to severe
cervical disease will not necessarily be manifested by a
progressive change in a spectral parameter. This paper
demonstrates, however, that these subtle differences exist,
and that normal and diseased areas of tissue can be distin-
guished spectroscopically.
Since a previous study demonstrated that patient-to-
patient variations of spectral patterns are smaller than those
encountered between different tissue types and stages of
disease [42], a relatively small set of 10 samples was
selected for an initial study. The spectral characteristics of
normal cervical tissue sections had been reported previously
[33]; consequently, the 10 samples reported here were
evenly divided between mild and severe dysplasia.
Methodology
Sample preparation
This study was carried out between October and Decem-
ber 2001, under an IRB approval (# 7XM, dated 5/15/2001)
from Hunter College. Cervical samples from 10 patients
obtained by either cone biopsy or hysterectomy were select-
ed from the cervical tissue data bank at Bellevue Hospital
(New York). The samples included five cases originally
diagnosed by cytology with HSIL and five with LSIL.
Samples for spectral imaging were prepared as follows. A
4-Am tissue section was cut from paraffin-embedded tissue
blocks, mounted on a glass slide, and stained with hematox-
ylin/eosin (H&E). Up to four adjacent sections (4-Am apart)
were re-hydrated and mounted on Ag/SnO2 coated infrared
reflective slides (Kevley Technologies) for FTIR mapping.
The stained slide is used as a template to identify normal, low-
and high-grade dysplastic areas and other interesting ana-
tomical features including inflammation (leukocyte prolifer-
ation), erythrocytes, blood vessels, and keratin pearls. For all
tissue sections, FTIR maps were collected for glandular and

B.R. Wood et al. / Gynecologic Oncology 93 (2004) 59–68 61
squamous epithelium, and of the cervical transformation
zone. Multiple images were recorded on all four adjacent
sections. Once the FTIR imaging was completed for all four
sections, the IR reflective slide was stained with H&E, and
the imaged areas were photographed so that the infrared
image could be directly correlated with the morphology. This
procedure ascertains that the exact same tissue features are
present in the photomicrographs and the IR images.
The stained slides were read by two histopathologists
whose comments form the basis of the discussion of each of
the pseudo-color maps and photomicrographs. In addition,
the original cytological diagnosis (LSIL/HSIL), which was
used to select the patients for biopsy, and the original
diagnosis of this biopsy, are incorporated in the discussion.
Data acquisition
Spectra were collected with a Bruker IRscope II IR
microscope (Bruker Optics Inc., Billerica, MA) equipped
with a liquid nitrogen cooled HgCdTe (MCT) detector, and
a 36� IR objective. The IRscope II is coupled to a Bruker
Vector 22 FTIR spectrometer, controlled by a personal
computer (Gateway 2000) incorporating a 200-MHz Pen-
tium processor running under OS/2 Warp. Data collection
was carried out using Bruker’s proprietary OPUS (version
3.0) software. The IRScope II and FTIR spectrometer were
continually purged with dry air from self-contained air
purifiers (Whatman, Inc.).
For FTIR mapping the rectangular aperture was set at
20 � 20 Am2 (accurate to about F3 Am). These settings
provided good signal-to-noise while maintaining excellent
spatial resolution. The IR mapping data were collected in
reflection mode by scanning the computer-controlled mi-
croscope stage in a raster pattern in increments of 10 Am.
Interferograms were collected double sided at a resolution of
6 cm�1. At each data point (pixel), eight interferograms
were co-added and Fourier transformed using a Happ-
Genzel apodization function, and a zero-filling factor of 4.
Data processing/computational procedures
From a biomedical perspective, histopathological diag-
nosis depends on visualization of the sample morphology. In
spectral diagnosis, additional and objective spectroscopic
data intrinsic to an area of tissue is collected while main-
taining the histopathological information. Thus, spectral
data sets contain thousands of individual spectra, where
each spectrum consists of wavelength and intensity infor-
mation and is associated with distinct x and y spatial
coordinates. This raw data set is called a spectral ‘‘hyper-
cube’’, and often contains hundreds of megabytes of data.
Each spectrum in the hypercube provides qualitative and
quantitative chemical information. To enable a visual inspec-
tion of the chemical information contained in these enormous
amounts of data, the individual spectra are converted into a
two-dimensional pseudo-color representation. This can be
accomplished by uni- or multivariate methods. In univariate
analyses, a spectral property for each spectrum (e.g., inten-
sity, integrated intensity, or intensity ratio at two wave-
lengths) is color coded, and represented as a function of
spatial coordinates to yield a two-dimensional pseudo-color
map. Different color hues represent different values of the
displayed spectral property.
However, the availability of thousands of FTIR spectra in
each hypercube also offers the possibility of applying mul-
tivariate methods to analyze the data. In multivariate meth-
ods, the information of the entire spectrum is used to create a
visualization of the data. In this study, we employ an
unsupervised clustering approach to investigate cervical
tissue. The unsupervised clustering approach is well de-
scribed in the literature [43–45] and only a brief overview
is given below.
In cluster analysis, a matrix is calculated that expresses
the similarity, or ‘‘distance’’, between each spectrum and all
other spectra of the data. For two spectra S and R in the data
hypercube, this distance is defined as the correlation coef-
ficient CSR according to
CSR ¼
Xi
ðSi � S̄ÞðRi � R̄ÞffiffiffiffiffiffiffiffiffiffiffiffiffiffiffiffiffiffiffiffiffiffiffiffiffiXi
ðSi � S̄ Þ2r ffiffiffiffiffiffiffiffiffiffiffiffiffiffiffiffiffiffiffiffiffiffiffiffiffiffiX
i
ðRi � R̄Þ2r ½i ¼ 1: : :M �
ð1Þ
Here, the spectra S and R are represented by 1-dimen-
sional vectors of M absorbance values, and S̄ and R̄ are the
mean values for each vector. The resulting CSR matrix, also
known as the covariance matrix, contains N2 entries, where
N is the total number of spectra within the data set.
However, since the matrix is symmetric, only N(N � 1) /
2 spectral distance elements CSR need to be computed.
Subsequently, the two most similar spectra in the hyper-
cube are merged into a ‘‘cluster’’, and a new distance matrix
column is calculated for the new cluster and all existing
spectra. The process of merging spectra or clusters into new
clusters is repeated, and the CSR is recalculated until all
spectra have been combined into a few clusters. This
process combines the most similar spectra into the same
cluster, while keeping track of which spectra have been
incorporated into each cluster. Pseudo-color maps based on
cluster analysis are created by assigning a color to each
spectral cluster, and displaying this color at the coordinates
at which each spectrum was collected. The mean spectra
were extracted for all clusters and used for the interpretation
of the chemical or biochemical differences between clusters.
The number of clusters was adjusted such that good
correspondence with the pathological images was obtained.
Reasonable noise in the spectral data does not affect
clustering process. In this respect, cluster analysis is much
more stable than other methods of multivariate analysis such
as principal component analysis (PCA), in which an in-

B.R. Wood et al. / Gynecologic Oncology 93 (2004) 59–6862
creasing amount of noise is accumulated in the less relevant
clusters. This present study may be viewed as an effort to
detect spectral differences by cluster analysis that, subse-
quently, may be analyzed via ANNs.
Cluster analysis was performed by importing data hyper-
cubes, in Bruker OPUS 3.0 format, into the CytoSpeckFTIR imaging software package [46]. The maps were
processed on a personal computer equipped with a 1.6-
GHz Athlon processor and 1.5 GByte of RAM. The first
step in the data processing was the removal of pixels with too
high or too low absorbance values, or with poor signal/noise
ratio from the data set. The remaining spectra are then cut to
include only values between 1800 and 800 cm�1, smoothed
or derivatized using a Savitsky–Golay algorithm, and base
line corrected within this region. All spectra that pass the
quality test are subsequently vector normalized between
1800 and 800 cm�1. Chemical (or functional group) maps
were created from these spectra by plotting various spectral
parameters (e.g., absorbance of the vsym(PO2�) band intensity,
the amide I band at 1653 cm�1, or ratios of integrated
intensities) as a function of x–y pixel position.
Unsupervised cluster analysis was performed on three
main spectral regions (1800–800, 1740–1570, 1200–1000
cm�1). It took between 15 and 20 min to calculate both the
distance and hierarchical cluster matrices, depending on the
number of spectra. In most maps, up to 10 clusters were
selected corresponding to the major anatomical features. For
each cluster map, the mean spectrum for each individual
cluster was extracted for comparison with those from differ-
ent clusters.
After FTIR analysis, the tissue section was stained with
Hematoxylin & Eosin (H&E). Photomicrographs were
recorded of the H&E-stained sections using a digital camera
fitted to an Olympus microscope. The digitized photographs
were rotated and cropped to size using Microsoft Photo-
Editor (2000).
Results
In this study over 90 spectral maps (comprising approx-
imately 750,000 spectra) were recorded from 52 different
regions of tissue from 10 different patients. This represents
an enormous data bank for multivariate analysis. The data
presented below are representative of the 10 samples inves-
tigated and show general spectral features that characterize
the cervical transformation zone and cervical epithelium
highlighting anatomical and histopathological features. Fur-
ther analysis of these data, including one that utilizes an
algorithm trained to recognize tissue abnormalities, will be
reported at a later stage.
Normal cervical transformation zone
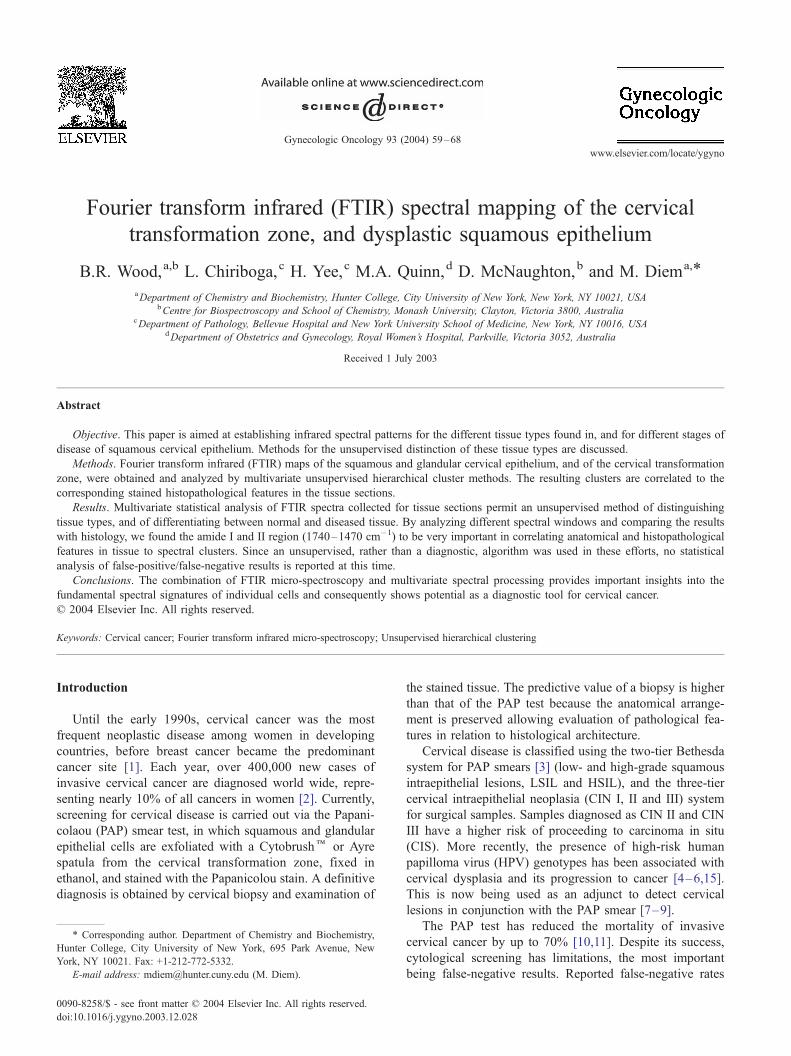
Figs. 1A and 1B show photomicrographs of the trans-
formation zone stained with H&E. The low magnification
photomicrograph (1A) shows a 500 � 500 Am area of the
ectocervical and endocervical epithelium and the squamo-
columnar junction (SCJ) along with red blood cells under-
lying the epithelium. The high magnification photomicro-
graph in Fig. 1B of the SCJ clearly shows columnar cells,
squamous cells, and red blood cells (see figure caption for
detail). Fig. 1C shows a spectral map based on univariate
analysis by displaying the relative intensity of the 1024-
cm�1 band. This band is due to glycogen, but glycoproteins
in mucous also contribute at this wave number. The spectra
of pure glycogen and glycoproteins were reported in the
literature previously [25,33,47,48]. In the 1000- to 1200-
cm�1 region, the glycogen spectrum exhibits three promi-
nent peaks at ca. 1151, 1078 and 1028 cm�1. These
features are visible as three distinct peaks in the blue traces
in Fig. 2E. The squamous region (red) predictably shows
high concentration of glycogen whereas the glandular epi-
thelium (bottom left, in light blue/yellow) shows contribu-
tions due to glycoproteins.
Unsupervised hierarchical clustering provides a more
useful image because it enables the identification of similar
spectral profiles and ‘‘clusters’’ them according to a simi-
larity criterion based on the relative distances of the spectra
in multivariate space. This approach yields maps that
highlight regions of similar spectra that can be readily
compared to anatomical features observed in H&E-stained
sections. Fig. 1D depicts a pseudo-color map obtained from
unsupervised hierarchical analysis of the 1800–800 cm�1
region. An inspection of Fig. 1D reveals excellent agree-
ment between the cluster demarcations, and the visually
observable tissue features, including the superficial layer of
squamous epithelium shown in red, the intermediate layer
(green) and the basal/parabasal layer (dark blue), as well as
columnar cells (orange). The medium blue regions corre-
spond to stromal (connective) tissue, and the light blue areas
to red blood cells.
Ectocervical epithelium
Fig. 2 depicts results for cervical squamous epithelium
from a patient diagnosed with LSIL. Panel A depicts a
photomicrograph of the tissue, stained and imaged after FTIR
data acquisition. The different layers of the squamous epi-
thelium can be seen clearly. Panels B–D illustrate the
sensitivity toward chemical composition afforded by cluster
analysis in different spectral regions, 1800–800 cm�1,
1740–1470 cm�1, and 1200–1000 cm�1. Cluster analysis
performed on the 1740–1470 cm�1 spectral range (Panel 2C)
results in a demarcation pattern most sensitive in the super-
ficial region of epithelium, where the glycogen content is
uniformly high. Thus, most of the differentiation is due to
variations in the protein bands. The 1200–1000 cm�1 spec-
tral range (Fig. 2D) loses some differentiation in the super-
ficial/intermediate layer, but is much better in distinguishing
the basal/parabasal layers and the stroma. This is an important
result since cervical disease frequently originates in the basal
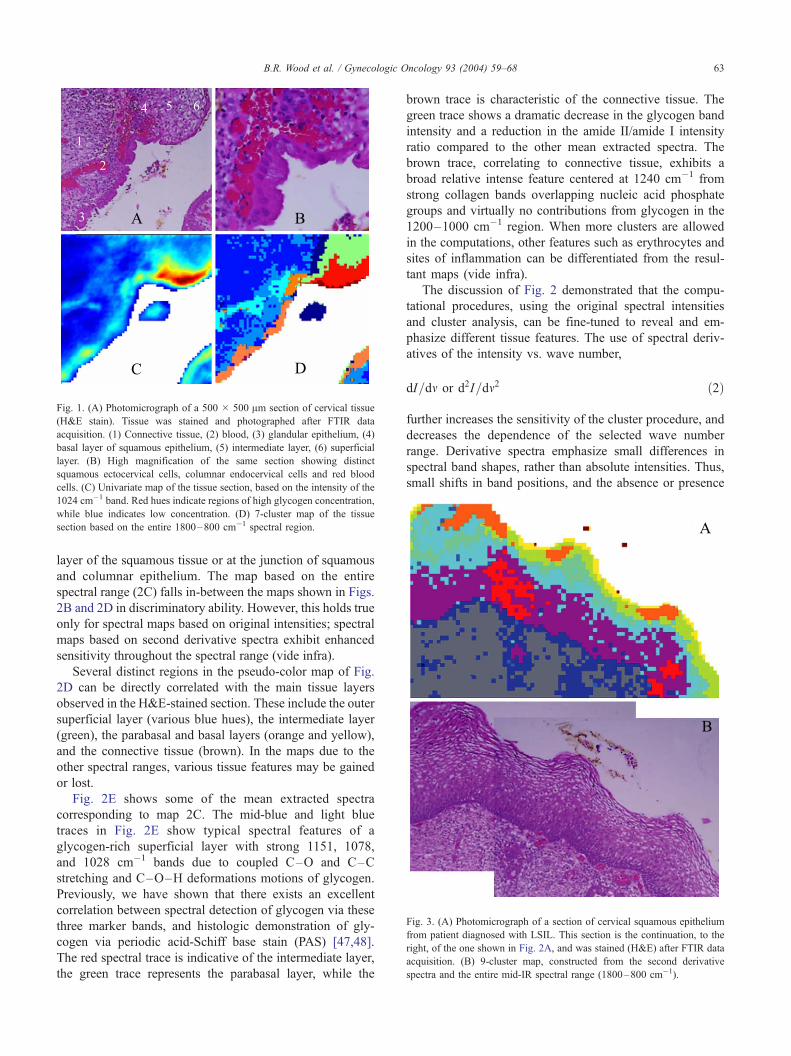
Fig. 3. (A) Photomicrograph of a section of cervical squamous epithelium
from patient diagnosed with LSIL. This section is the continuation, to the
right, of the one shown in Fig. 2A, and was stained (H&E) after FTIR data
acquisition. (B) 9-cluster map, constructed from the second derivative
spectra and the entire mid-IR spectral range (1800–800 cm�1).
Fig. 1. (A) Photomicrograph of a 500 � 500 Am section of cervical tissue
(H&E stain). Tissue was stained and photographed after FTIR data
acquisition. (1) Connective tissue, (2) blood, (3) glandular epithelium, (4)
basal layer of squamous epithelium, (5) intermediate layer, (6) superficial
layer. (B) High magnification of the same section showing distinct
squamous ectocervical cells, columnar endocervical cells and red blood
cells. (C) Univariate map of the tissue section, based on the intensity of the
1024 cm�1 band. Red hues indicate regions of high glycogen concentration,
while blue indicates low concentration. (D) 7-cluster map of the tissue
section based on the entire 1800–800 cm�1 spectral region.
B.R. Wood et al. / Gynecologic Oncology 93 (2004) 59–68 63
layer of the squamous tissue or at the junction of squamous
and columnar epithelium. The map based on the entire
spectral range (2C) falls in-between the maps shown in Figs.
2B and 2D in discriminatory ability. However, this holds true
only for spectral maps based on original intensities; spectral
maps based on second derivative spectra exhibit enhanced
sensitivity throughout the spectral range (vide infra).
Several distinct regions in the pseudo-color map of Fig.
2D can be directly correlated with the main tissue layers
observed in the H&E-stained section. These include the outer
superficial layer (various blue hues), the intermediate layer
(green), the parabasal and basal layers (orange and yellow),
and the connective tissue (brown). In the maps due to the
other spectral ranges, various tissue features may be gained
or lost.
Fig. 2E shows some of the mean extracted spectra
corresponding to map 2C. The mid-blue and light blue
traces in Fig. 2E show typical spectral features of a
glycogen-rich superficial layer with strong 1151, 1078,
and 1028 cm�1 bands due to coupled C–O and C–C
stretching and C–O–H deformations motions of glycogen.
Previously, we have shown that there exists an excellent
correlation between spectral detection of glycogen via these
three marker bands, and histologic demonstration of gly-
cogen via periodic acid-Schiff base stain (PAS) [47,48].
The red spectral trace is indicative of the intermediate layer,
the green trace represents the parabasal layer, while the
brown trace is characteristic of the connective tissue. The
green trace shows a dramatic decrease in the glycogen band
intensity and a reduction in the amide II/amide I intensity
ratio compared to the other mean extracted spectra. The
brown trace, correlating to connective tissue, exhibits a
broad relative intense feature centered at 1240 cm�1 from
strong collagen bands overlapping nucleic acid phosphate
groups and virtually no contributions from glycogen in the
1200–1000 cm�1 region. When more clusters are allowed
in the computations, other features such as erythrocytes and
sites of inflammation can be differentiated from the resul-
tant maps (vide infra).
The discussion of Fig. 2 demonstrated that the compu-
tational procedures, using the original spectral intensities
and cluster analysis, can be fine-tuned to reveal and em-
phasize different tissue features. The use of spectral deriv-
atives of the intensity vs. wave number,
dI=dm or d2I=dm2 ð2Þ
further increases the sensitivity of the cluster procedure, and
decreases the dependence of the selected wave number
range. Derivative spectra emphasize small differences in
spectral band shapes, rather than absolute intensities. Thus,
small shifts in band positions, and the absence or presence

Fig. 2. (A) Photomicrograph of a section of cervical squamous epithelium from patient diagnosed with LSIL. The section was stained (H&E) after FTIR data
acquisition. (1) Connective tissue, (2) basal layer, (3) parabasal layer, (4) intermediate layer, (5) superficial layer. (B) 9-cluster maps using the entire mid-IR
spectral range (1800–800 cm�1). (C) 9-cluster maps using the ‘‘protein region’’ (1740–1470 cm�1). (D) 9-cluster maps using the ‘‘glycogen/nucleic acid
region’’ (1200–1000 cm�1). (E) Mean cluster spectra from six of the seven clusters color coded to enable correlation with 2C. Note: the individual colors in
panels B–D are assigned by the algorithm for each data set and are not transferable between separate analyses.
B.R. Wood et al. / Gynecologic Oncology 93 (2004) 59–6864
of shoulders, can be readily detected. This is demonstrated
in Fig. 3, which depicts the continuation of the same
glandular tissue section shown in Fig. 2, adjacent to the
right of Fig. 2A.
The cluster map shown in Fig. 3A shows in exquisite
detail the different tissue layers, including stroma, basal
layer, and the maturation of cells within the parabasal,
intermediate and superficial layers. (Note that the colors in
Figs. 2 and 3 are not consistent, and may denote different
tissue types). Although the spectral differences in the
superficial layer are closely associated with increasing
glycogen concentration, three areas shown in orange in
the top layer correspond to low glycogen content. These
areas are found within the thickened parabasal/superficial
layer, and may be indications of early stages of parakeratosis
(a deposit of keratin in the epithelium). Most interesting is
the occurrence of the clusters shown in red in the thickened
epithelium. These red clusters correspond to areas of in-

Fig. 4. (A) Photomicrograph of glandular epithelium from a patient diagnosed with HSIL, stained (H&E) after FTIR data acquisition. The dark-staining areas
are associated with CIN II/CIN III. (B) 9-cluster map, constructed from the second derivative spectra and the entire mid-IR spectral range (1800–800 cm�1).
(C) Individual 2nd derivative spectra collected from regions indicated by the ellipses in B. See text for detail.
Fig. 5. (A) Photomicrograph of a metastatic inclusion within the tissue matrix form a patient diagnosed with HSIL, stained (H&E) after FTIR data acquisition.
(B) Cluster map of the metastatic inclusion. (C) Mean extracted spectra from the cluster map presented in B.
B.R. Wood et al. / Gynecologic Oncology 93 (2004) 59–68 65

B.R. Wood et al. / Gynecologic Oncology 93 (2004) 59–6866
flammatory response below the keratin deposits. Thus, the
spectral methods detect changes in the tissue layers below
the parakeratosis.
Fig. 4 shows a tissue section from a patient whose PAP
diagnosis was HSIL. The tissue diagnosis was CIN II/CIN
III. This figure demonstrates clearly that the differentiation
of tissue types is due to spectral changes that can be
visualized and interpreted, and not due to random noise or
other confounding factors. The blue traces (2nd derivative
spectra) shown in Panel 4C were selected from the light blue
areas on the left side of Panel 4B, whereas the red traces in
4C were from the light and dark red sections of the diseased
areas. The obvious spectral differences (band shifts and
intensity variations) cause the differentiation into clusters.
Fig. 4C also demonstrates why spectral mapping is possible
using different spectral windows. The red and blue traces in
Panel 4C exhibit concomitant changes in the amide I/amide
II band region (1800–1450 cm�1) and the low frequency
window between 1200 and 900 cm�1. Since all layers of
this tissue were found to be glycogen-free, we may assume
that the spectral differences in the low-frequency window
are mostly due to vibrations of the phosphate (–PO2�)
groups of DNA and RNA.
Fig. 5 depicts results from a section of connective tissue
from a patient whose PAP results indicated HSIL. Fig. 5A
shows a photomicrograph of a small metastasis adjacent to
a large area of diseased glandular epithelium (not shown).
Fig. 5B depicts the corresponding pseudo�color map, and
Fig. 5C shows the extracted mean cluster spectra. The
abnormal region of the micro-metastasis appears brown
and orange in the cluster map. The light blue cluster
highlights a region with many abnormal cells with irreg-
ular shaped nuclei varying considerably in size along with
some leukocytes. The mid-blue and dark blue colors are
indicative of different types of connective tissue. The
yellow highlights a region of erythrocytes and lymphocytes
in the sample. The spectra representative of the metastasis
(brown) exhibit a significant decrease in the amide II/
amide I intensity ratio compared to the surrounding tissue
matrix. This is indeed interesting and confirms the results
of an earlier study [28] investigating FTIR spectra of
exfoliated cervical cells with principal components analysis
(PCA). In that study, the amide II vibration was identified
as an important loading variable to distinguish normal
from diseased tissue.
Other features characteristic of this spectrum include the
pronounced symmetric and asymmetric phosphodiester
vibrations at 1244 and 1080 cm�1, respectively. This is in
agreement with earlier studies [26,27,30] on exfoliated
cervical cells, which correlated abnormality with an ob-
served increase in the intensity of phosphodiester vibrations.
In general, these bands appear more intense than the methyl
and methylene deformation modes (1450–1350 cm�1) in
areas of high-grade dysplasia in all samples investigated in
this study. The light blue spectrum is representative of
abnormal cells and leukocytes adjacent to the metastasis
and is very similar to the spectrum of the metastasis in terms
of the amide II/amide I ratio and the relative intensity of the
phosphodiester bands. This spectrum does differ slightly
from the metastasis spectrum in the 1100–1000 cm�1
region, the latter showing a more intense symmetric phos-
phodiester band at 1080 cm�1. The two clusters cor-
responding to connective tissue (mid blue and dark blue)
are significantly different in terms of the amide II/amide I
ratio and the intensity of the methyl and methylene defor-
mation modes (approximately 1400 cm�1) but similar in the
phosphodiester region (1200–1000 cm�1).
Discussion
The pursuit of an FTIR-based screening test for cervical
dysplasia has been marred by the inherent heterogeneity of
exfoliated sample specimens [31,36]. Hitherto, studies to
methodically assess this variability have been limited to
investigating cultured cell lines [49] or cells that can be
isolated from peripheral blood [36]. The combination of
FTIR microscopy with multivariate image processing pro-
vides a direct method to assess biological variability and
thereby add to the discriminating power of any diagnostic
algorithm. Because the spectral changes are analyzed by
unsupervised multivariate methods, the approach represents
a ‘‘blind’’ test of the methodology. Moreover, by directly
correlating the spectral maps with the anatomical and histo-
pathological features, the approach is intrinsically validated.
Central to the success of this approach has been the
incorporation of Ag/SnO2-coated microscope slides. The
slides have several advantages over more conventional
infrared substrates such as calcium or barium fluoride, or
zinc selenide. These include the low cost of the slides (US$
1, as compared to approximately hundred dollars for some
of the other substrates) and their suitability for routine
analysis. Samples on these slides can be inspected micro-
scopically by a cytologist or pathologist without interference
from the coating. Furthermore, the resulting spectra do not
require any mathematical transformation to remove the
specular reflection component inherent in conventional
FTIR reflection spectroscopy.
Consequently, a large spectral database could be con-
structed at low cost, and excellent histopathological corre-
lation was possible. The large database generated permitted
a multivariate statistical approach to the data analysis, which
resulted in important insights into the spectroscopy of the
different tissue types encountered in the histopathological
analysis of cervical tissue. By analyzing different spectral
regions, it became evident that the correlation between
anatomical features observed in stained tissue and the
principal demarcations in the cluster maps could be
achieved in two separate spectral windows. Since we
adopted a vector normalization approach for this study, we
negated the dependence on amide I normalization. Conse-
quently, we were able to use the protein amide I and II band
B.R. Wood et al. / Gynecologic Oncology 93 (2004) 59–68 67
features for cluster analysis. The differentiation of tissue
types is based on variations of band positions, intensities,
and half-widths in the amide II/amide I manifolds. Such
differences may indicate changes in protein abundance of
the individual cell types, as well as changes in protein
secondary structure. The dependence on the amide I and
II bands for classification is not surprising given the high
protein content of cells (approximately 60% of total dry
mass) and the sensitivity of the infrared technique to protein
concentration and secondary structure.
The variations in intensity of the asymmetric and sym-
metric phosphate stretching vibrations in the low-frequency
(1200–1000 cm�1) window, coupled with changes in the
glycogen concentration, result in a good correlation with
anatomical and histopathological features as well, in partic-
ular, if second derivative spectra are used. Most of the
variation is detected in the superficial layers where the
glycogen concentration dramatically decreases approaching
the intermediate layer. It is now well established that the
variation in glycogen concentration in cervical-exfoliated
cells and tissues renders this region almost useless for
diagnostic purposes [25,39].
The mean cluster spectra extracted for different patients
from regions with comparable histopathology are quite
similar. This confirms the results by Lasch et al. [44] who
reported patient-to-patient variations smaller than those due
to different tissue types and pathological diagnoses. The
spectra from areas of CIN had several characteristic features
including pronounced symmetric and asymmetric phosphate
bands at 1078 and 1240 cm�1, a significant reduction in
glycogen band intensity and a relatively small amide II/
amide I ratio. These spectra were similar to spectra extracted
from clusters that correlated well with leukocyte prolifera-
tion observed in the stained tissue. Although leukocyte
spectra are difficult to discern from CIN spectra by eye,
the unsupervised hierarchical clustering approach can easily
identify each type by subtle differences in the amide I and II
modes. Consequently, a multivariate approach is the best
way to distinguish tissue types and to detect disease cervical
tissue.
This paper demonstrates the clear potential of FTIR
absorption/reflection microscopy and unsupervised hierar-
chical clustering in the analysis of cervical tissue samples. A
significant development in the methodology is the applica-
tion of Ag/SnO2-coated IR reflective slides, which enable
both infrared analysis and light microscopic inspection of
the same stained samples. A data bank of all the important
cell signatures was retained from samples that were directly
re-assessed by pathologists and cytologists to obtain a gold
standard for comparison and validation. The results reveal
several insights into the spectroscopy of cervical cells, in
particular, they point to the importance of the amide bands
in cell identification and cytopathology. We plan to continue
this study using the mean extracted spectra as inputs to train
an ANN to identify various anatomical and histopatholog-
ical features in cervical tissue.
Acknowledgments
Partial support of this research through grants from the
National Institutes of Health (CA 81675 and GM 60654 to
MD) is gratefully acknowledged. A ‘‘Research Centers in
Minority Institutions’’ award RR-03037 from the National
Center for Research Resources of the NIH, which supports
the infrastructure of the Chemistry Department at Hunter, is
also acknowledged. This work was also supported by a
Commonwealth National Health and Medical Research
Council Grant (Application Number-236812).
References
[1] Parkin DM, Pisani P, Ferlay J. Estimates of the worldwide incidence
of 25 major cancers in 1990. Int J Gynecol Cancer 1999;80:827–41.
[2] Campaign CR Cancer of the cervix uteri. Commonwealth research
centre; 1995. Fact sheet 12.
[3] Solomon D, Davey D, Kurman R, Moriary A, O’Connor D, Prey M,
et al. The 2001 Bethesda System—Terminology for reporting results
of cervical cytology. JAMA 2002;287:2114–9.
[4] Schiffman MH, Bauer HM, Hoover RN, Glass AG, Cadell DM, Rush
BB, et al. Epidemiologic evidence showing that human papilloma
virus infection causes most cervical intraepithelial neoplasia. J Natl
Cancer Inst 1993;85:958–64.
[5] Furumoto H, Irahara M. Human papilloma virus (HPV) and cervical
cancer. J Invest Med 2002;49:124–33.
[6] Manos MM, Kinney WK, Hurley LB, Sherman ME, Shieh-Ngai J,
Kurman RJ, et al. Identifying women with cervical neoplasia-Using
human papillomavirus DNA testing for equivocal Papanicolaou
results. JAMA 1999;281:1605–10.
[7] Zielinski GD, Snijders PJF, Rozendaal L, Voorhorst FJ, van der Lin-
den HC, Runsink AP, et al. HPV presence precedes abnormal cytol-
ogy in women developing cervical cancer and signals false negative
smears. Br J Cancer 2001;85:398–404.
[8] Elfgren K, Jacobs M, Walboomers JMM, Meijer CJLM. Rate of
human papillomavirus clearance after treatment of cervical intraepi-
thelial neoplasia. Obstet Gynecol 2002;100:965–71.
[9] Gaarenstroom KN, Melkert P, Walboomers JMM, Van Den Brule
AJC, Van Bommel PFJ, Meyer CJLM, et al. Human papillomavirus
DNA and genotypes: prognostic factors for the progression of cervical
intraepithelial neoplasia. Int J Gynecol Cancer 1994;4:73–8.
[10] Williams GH, Romanowski P, Morris L, Madine M, Mills AD,
Stoeber K, et al. Improved cervical smear assessment using antibodies
against proteins that regulate DNA replication. Proc Natl Acad Sci
U S A 1998;95:14932–7.
[11] Larson NS. J Natl Cancer Inst 1994;86:6–7.
[12] Gay JD, Donaldson LD, Goellner JR. False-negative results in cervi-
cal cytologic studies. Acta Cytol 1985;29:1043–6.
[13] DiBonito L, Falconieri G, Tomasic G, Colautti I, Bonifacio D, Dudine
S. Cervical cytopathology. Cancer 1993;72:3002–6.
[14] MMWR. Regulatory closure of cervical cytology laboratories: recom-
mendations for a public health response. Atlanta: U.S. Department of
Health and Human Services; 1997 (December 19).
[15] Franco EL, Duarte-Franco E, Ferenczy A. Cervical cancer: epidemi-
ology, prevention and the role of human papilloma virus infection.
Can Med Assoc J 2001;164:1017–25.
[16] Fetterman BJ, Pawlick GF, Koo H, Hartinger JS, Gilbert C, Connell
S. Determining the utility and effectiveness of the NeoPath AutoPap
300 QC system used routinely. Acta Cytol 1999;43:13–21.
[17] Mango LJ, Valente PT. Neural Network-assisted analysis and micro-
scopic re-screening in presumed negative cervical cytologic smears.
Acta Cytol 1998;42:227–32.
B.R. Wood et al. / Gynecologic Oncology 93 (2004) 59–6868
[18] Wilbur DC. Location-guided screening of liquid-based cervical cytol-
ogy specimens. Am J Clin Pathol 2002;118:399–407.
[19] Baker JJ. Conventional and liquid-based cervico-vaginal cytology: a
comparison with clinical and histologic follow-up. Diagn Cytopathol
2002;27:185–8.
[20] Ring M, Bolger N, O’Donnell M, Malkin A, Bermingham N, Akpan
E, et al. Evaluation of liquid-based cytology in cervical screening of
high-risk populations: a split study of colposcopy and genito-urinary
medicine populations. Cytopathology 2002;13:152–9.
[21] Hartmann KE, Nanda K, Hall S, Myers E. Technologic advances for
evaluation of cervical cytology: is newer better? Obstet Gynecol
Surv 2001;56:765–74.
[22] Mantsch HH, Chapman D. Infrared spectroscopy of biomolecules.
New York: Wiley-Liss; 1996.
[23] Wetzel DL, LeVine SM. Biological applications of infrared micro-
spectroscopy. In: Gremlich HU, Yan B, editors. Biological applica-
tions of infrared micro-spectroscopy. New York: Marcel Dekker;
2001. p. 1–14.
[24] Shaw RA, Mansfield JR, Rempel SP, Low-Ying S, Kupriyanov VV.
Analysis of biomedical spectra and images: from data to diagnosis.
J Mol Struct (Theochem) 2000;500:129–38.
[25] Diem M, Boydston-White S, Chiriboga L. Infrared spectroscopy of
cells and tissues: shining light onto a novel subject. Appl Spectrosc
1999;53:148A–61A.
[26] Wong PTT, Wong RK, Caputo TA, Godwin TA, Rigas B. Infrared
spectroscopy of exfoliated human cervical cells: evidence of extensive
structural changes during carcinogenesis. Proc Natl Acad Sci U S A
1991;88:1088–10992.
[27] Wong PTT, Wong RK, Fung MFK. Pressure tuning FT-IR study of
human cervical tissues. Appl Spectrosc 1993;47:1058–63.
[28] Wood BR, Quinn MA, Burden FR, McNaughton D. An investigation
into FTIR spectroscopy as a biodiagnostic tool for cervical cancer.
Biospectroscopy 1996;2:143–53.
[29] Wood BR, Quinn MQ, Tait B, Romeo M, Mantsch HH. A FTIR
spectroscopic study to identify potential confounding variables and
cell types in screening for cervical malignancies. Biospectroscopy
1998;4:75–91.
[30] Fung MFK, Senterman M, Eid P, Faught W, Mikael NZ, Wong PTT.
Comparison of Fourier-transform infrared spectroscopic screening of
exfoliated cervical cells with standard Papanicolou screening. Gyne-
col Oncol 1997;66:15–9.
[31] Chiriboga L, Xie P, Vigorita V, Zarou D, Zakim D, Diem M. Infrared
spectroscopy of human tissue: II. A comparative study of spectra of
biopsies of cervical squamous epithelium and of exfoliated cervical
cells. Biospectroscopy 1997;4:55–9.
[32] Chiriboga L, Xie P, Yee H, Vigorita V, Zarou D, ZakimD, et al. Infrared
spectroscopy of human tissue: I. Differentiation and maturation of
epithelial cells in the human cervix. Biospectroscopy 1998;4:47–53.
[33] Chiriboga L, Xie P, Yee H, Zarou D, Zakim D, Diem M. Infrared
spectroscopy of human cells and tissues: IV. Detection of dysplastic
and neoplastic changes in human cervical tissue via infrared micros-
copy. Cell Mol Biol 1998;44:219–29.
[34] Cohenford MA, Godwin TA, Cahn F, Bhandare P, Caputo TA, Rigas
B. Infrared spectroscopy of normal and abnormal cervical smears:
evaluation by principal component analysis. Gynecol Oncol 1997;
66:59–65.
[35] Cohenford MA, Rigas B. Cytologically normal cells from neoplastic
cervical samples display extensive structural abnormalities on IR
spectroscopy: implications for tumor biology. Proc Natl Acad Sci
U S A 1998;95:15327–32.
[36] Wood BR, Quinn MA, Tait B, Hislop T, Romeo M. FTIR micro-
spectroscopic study of cell types and potential confounding cells
in screening for cervical malignancies. Biospectroscopy 1998;4:
75–91.
[37] Romeo M, Burden FR, Wood BR, Quinn MA, Tait B, McNaughton
D. Infrared micro-spectroscopy and artificial neural networks in the
diagnosis of cervical cancer. Cell Mol Biol 1998;44:179–87.
[38] Romeo M, Wood BR, Quinn MA, McNaughton D. The removal
of blood components from cervical smears: implications for can-
cer diagnosis using FTIR spectroscopy. Vibr Spectrosc 2002;28:
167–75.
[39] Romeo M, Wood BR, McNaughton D. Observing the cyclical
changes in cervical epithelium using infrared micro-spectroscopy.
Vibr Spectrosc 2002;28:167–75.
[40] Ostor AG. Studies on 200 cases of early squamous cell carcinoma. Int
J Gynecol Pathol 1993;12:193–207.
[41] Ostor AG, Mulvany N. The pathology of cervical neoplasia. Curr
Opin Obstet Gynecol 1996;8:69–73.
[42] Lasch P, Naumann D. FT-IR micro-spectroscopic imaging of human
carcinoma thin sections based on pattern recognition techniques. Cell
Mol Biol 1998;44:189–202.
[43] Mansfield JR, McIntosh LM, Crowson AN, Mantsch HH, Jackson M.
Appl Spectrosc 1999;53:1323–30.
[44] Lasch P, Haensch W, Lewis EN, Kidder LH, Naumann D. Charac-
terization of colorectal adenocarcinoma by spatially resolved FT-IR
micro-spectroscopy. Appl Spectrosc 2002;56:1–9.
[45] Diem M, Chiriboga L, Yee H. Infrared spectroscopy of human cells
and tissue: VIII. Strategies for analysis of infrared tissue mapping data
and applications to liver tissue. Biopolymers (Biospectroscopy) 2000;
57:282–90.
[46] P. Lasch, A Matlab based application for infrared imaging; see http://
www.cytospec.com for details.
[47] Chiriboga L, Yee H, Diem M. Infrared spectroscopy of human cells
and tissue. Part VI: a comparative study of histopathology and infra-
red micro-spectroscopy of normal, cirrhotic, and cancerous liver tis-
sue. Appl Spectrosc 2000;54:1–8.
[48] Chiriboga L, Yee H, Diem M. Infrared spectroscopy of human cells
and tissue. Part VII: FT-IR microscopy of DNAase- and RNAase-
treated normal, cirrhotic, and neoplastic liver tissue. Appl Spectrosc
2000;54:480–5.
[49] Boydston-White S, Gopen T, Houser S, Bargonetti J, Diem M. Infra-
red spectroscopy of human tissue: V. IR spectroscopic studies of
myoeloid leukemia (ML-1) cells at different phases of the cell cycle.
Biospectroscopy 1999;5:219–27.
Copyright © 2022 FDOKUMEN