Tristetraprolin targets Nos2 expression in the colonic epithelium
13
1 SCIENTIFIC REPORTS | (2019) 9:14413 | https://doi.org/10.1038/s41598-019-50957-9 www.nature.com/scientificreports Tristetraprolin targets Nos2 expression in the colonic epithelium Melanie A. Eshelman 1 , Stephen M. Matthews 1,2 , Emily M. Schleicher 1 , Rebecca M. Fleeman 1 , Yuka Imamura Kawasawa 3,4 , Deborah J. Stumpo 5 , Perry J. Blackshear 5,6 , Walter A. Koltun 2 , Faoud T. Ishmael 7 & Gregory S. Yochum 1,2 Tristetraprolin (TTP), encoded by the Zfp36 gene, is a zinc-finger protein that regulates RNA stability primarily through association with 3′ untranslated regions (3′ UTRs) of target mRNAs. While TTP is expressed abundantly in the intestines, its function in intestinal epithelial cells (IECs) is unknown. Here we used a cre-lox system to remove Zfp36 in the mouse epithelium to uncover a role for TTP in IECs and to identify target genes in these cells. While TTP was largely dispensable for establishment and maintenance of the colonic epithelium, we found an expansion of the proliferative zone and an increase in goblet cell numbers in the colon crypts of Zfp36 ΔIEC mice. Furthermore, through RNA-sequencing of transcripts isolated from the colons of Zfp36 fl/fl and Zfp36 ΔIEC mice, we found that expression of inducible nitric oxide synthase (iNos or Nos2) was elevated in TTP-knockout IECs. We demonstrate that TTP interacts with AU-rich elements in the Nos2 3′ UTR and suppresses Nos2 expression. In comparison to control Zfp36 fl/fl mice, Zfp36 ΔIEC mice were less susceptible to dextran sodium sulfate (DSS)-induced acute colitis. Together, these results demonstrate that TTP in IECs targets Nos2 expression and aggravates acute colitis. A single layer of epithelial cells lines the intestines and forms a physical barrier to protect underlying tissue from the microbiota and noxious contents of the lumen 1 . In the small intestine, the epithelium is arranged into villi, that protrude into the lumen and increase epithelial surface area, and invaginations, known as crypts of Lieberkühn, that form a protective niche for intestinal stem cells. e colon is void of villi but maintains the protective crypt structures. Within the colonic crypts, intestinal stem cells divide in order to self-renew and also produce transit-amplifying progenitor cells 2 . As transit-amplifying cells divide, they migrate up the crypt axis toward the lumen of the colon and differentiate along either an absorptive or secretory lineage. e absorptive lineage consists entirely of enterocytes, which absorb nutrients, vitamins, and water from the lumen. e secre- tory lineage consists of mucus-secreting goblet cells, hormone-secreting enteroendocrine cells, and tuſt cells 3 . e entire epithelium is replaced every three to five days, making the intestines one of the most regenerative organs in the body. us, IEC proliferation and differentiation must be precisely coordinated to maintain homeostasis. ere is mounting evidence demonstrating an integral role for post-transcriptional gene regulation in intesti- nal homeostasis and disease, including colitis and colorectal cancer 4 . RNA-binding proteins can either degrade or stabilize transcripts by associating with 3′ UTRs of target transcripts and recruiting multiprotein complexes. One such protein is tristetraprolin (TTP; also known as TIS11, NUP475, and G0S24), which is encoded by the Zfp36 gene 5 . TTP is the prototypical member of a small family of tandem CCCH zinc finger RNA-binding proteins that also includes ZFP36L1 and ZFP36L2, also known as TIS11B and TIS11D, respectively 5–7 . TTP binds AU-rich ele- ments in the 3′ UTR of target transcripts through the consensus binding motif, AUUUA 5 . Once bound, TTP stim- ulates mRNA degradation through recruitment of the DCP2/XRN1/EDC3 decapping complex and/or the NOT1/ CAF1/CCR4 deadenylation complex 8 . TTP has primarily been studied in macrophages, and many established TTP target genes encode immune modulators, such as TNFα 5 . Consequently, germline TTP knockout mice 1 Department of Biochemistry & Molecular Biology, Pennsylvania State University College of Medicine, Hershey, PA, 17033, USA. 2 Department of Surgery, Division of Colon & Rectal Surgery, Pennsylvania State University College of Medicine, Hershey, PA, 17033, USA. 3 The Institute for Personalized Medicine, Pennsylvania State University College of Medicine, Hershey, PA, 17033, USA. 4 Department of Pharmacology, Pennsylvania State University College of Medicine, Hershey, PA, 17033, USA. 5 Signal Transduction Laboratory, National Institute of Environmental Health Sciences, Research Triangle Park, NC, 27709, USA. 6 Departments of Medicine & Biochemistry, Duke University Medical Center, Durham, NC, 27710, USA. 7 Department of Allergy & Sleep Medicine, Mount Nittany Medical Group, State College, PA, 16803, USA. Correspondence and requests for materials should be addressed to G.S.Y. (email: [email protected]) Received: 31 December 2018 Accepted: 18 September 2019 Published: xx xx xxxx OPEN
-
Upload
khangminh22 -
Category
Documents
-
view
3 -
download
0
Transcript of Tristetraprolin targets Nos2 expression in the colonic epithelium

1Scientific RepoRtS | (2019) 9:14413 | https://doi.org/10.1038/s41598-019-50957-9
www.nature.com/scientificreports
tristetraprolin targets Nos2 expression in the colonic epitheliumMelanie A. eshelman1, Stephen M. Matthews1,2, emily M. Schleicher1, Rebecca M. fleeman 1, Yuka imamura Kawasawa 3,4, Deborah J. Stumpo5, perry J. Blackshear5,6, Walter A. Koltun2, faoud t. ishmael7 & Gregory S. Yochum1,2
tristetraprolin (ttp), encoded by the Zfp36 gene, is a zinc-finger protein that regulates RNA stability primarily through association with 3′ untranslated regions (3′ UtRs) of target mRnAs. While ttp is expressed abundantly in the intestines, its function in intestinal epithelial cells (iecs) is unknown. Here we used a cre-lox system to remove Zfp36 in the mouse epithelium to uncover a role for ttp in iecs and to identify target genes in these cells. While ttp was largely dispensable for establishment and maintenance of the colonic epithelium, we found an expansion of the proliferative zone and an increase in goblet cell numbers in the colon crypts of Zfp36Δiec mice. furthermore, through RnA-sequencing of transcripts isolated from the colons of Zfp36fl/fl and Zfp36Δiec mice, we found that expression of inducible nitric oxide synthase (iNos or Nos2) was elevated in ttp-knockout iecs. We demonstrate that ttp interacts with AU-rich elements in the Nos2 3′ UtR and suppresses Nos2 expression. in comparison to control Zfp36fl/fl mice, Zfp36Δiec mice were less susceptible to dextran sodium sulfate (DSS)-induced acute colitis. together, these results demonstrate that ttp in iecs targets Nos2 expression and aggravates acute colitis.
A single layer of epithelial cells lines the intestines and forms a physical barrier to protect underlying tissue from the microbiota and noxious contents of the lumen1. In the small intestine, the epithelium is arranged into villi, that protrude into the lumen and increase epithelial surface area, and invaginations, known as crypts of Lieberkühn, that form a protective niche for intestinal stem cells. The colon is void of villi but maintains the protective crypt structures. Within the colonic crypts, intestinal stem cells divide in order to self-renew and also produce transit-amplifying progenitor cells2. As transit-amplifying cells divide, they migrate up the crypt axis toward the lumen of the colon and differentiate along either an absorptive or secretory lineage. The absorptive lineage consists entirely of enterocytes, which absorb nutrients, vitamins, and water from the lumen. The secre-tory lineage consists of mucus-secreting goblet cells, hormone-secreting enteroendocrine cells, and tuft cells3. The entire epithelium is replaced every three to five days, making the intestines one of the most regenerative organs in the body. Thus, IEC proliferation and differentiation must be precisely coordinated to maintain homeostasis.
There is mounting evidence demonstrating an integral role for post-transcriptional gene regulation in intesti-nal homeostasis and disease, including colitis and colorectal cancer4. RNA-binding proteins can either degrade or stabilize transcripts by associating with 3′ UTRs of target transcripts and recruiting multiprotein complexes. One such protein is tristetraprolin (TTP; also known as TIS11, NUP475, and G0S24), which is encoded by the Zfp36 gene5. TTP is the prototypical member of a small family of tandem CCCH zinc finger RNA-binding proteins that also includes ZFP36L1 and ZFP36L2, also known as TIS11B and TIS11D, respectively5–7. TTP binds AU-rich ele-ments in the 3′ UTR of target transcripts through the consensus binding motif, AUUUA5. Once bound, TTP stim-ulates mRNA degradation through recruitment of the DCP2/XRN1/EDC3 decapping complex and/or the NOT1/CAF1/CCR4 deadenylation complex8. TTP has primarily been studied in macrophages, and many established TTP target genes encode immune modulators, such as TNFα5. Consequently, germline TTP knockout mice
1Department of Biochemistry & Molecular Biology, Pennsylvania State University College of Medicine, Hershey, PA, 17033, USA. 2Department of Surgery, Division of Colon & Rectal Surgery, Pennsylvania State University College of Medicine, Hershey, PA, 17033, USA. 3The Institute for Personalized Medicine, Pennsylvania State University College of Medicine, Hershey, PA, 17033, USA. 4Department of Pharmacology, Pennsylvania State University College of Medicine, Hershey, PA, 17033, USA. 5Signal Transduction Laboratory, National Institute of Environmental Health Sciences, Research Triangle Park, NC, 27709, USA. 6Departments of Medicine & Biochemistry, Duke University Medical Center, Durham, NC, 27710, USA. 7Department of Allergy & Sleep Medicine, Mount Nittany Medical Group, State College, PA, 16803, USA. Correspondence and requests for materials should be addressed to G.S.Y. (email: [email protected])
Received: 31 December 2018
Accepted: 18 September 2019
Published: xx xx xxxx
open
2Scientific RepoRtS | (2019) 9:14413 | https://doi.org/10.1038/s41598-019-50957-9
www.nature.com/scientificreportswww.nature.com/scientificreports/
develop a severe inflammatory syndrome and fail to thrive9. Despite robust TTP expression in the intestine, little is known about its function in IECs and whether it contributes to intestinal homeostasis or digestive diseases10.
Nitric oxide synthases (NOS) catalyze the conversion of arginine to citrulline and nitric oxide (NO)11. Unlike family members, neuronal NOS (nNOS or NOS1) and endothelial NOS (eNOS or NOS3), which are constitu-tively expressed in neurons and endothelial cells, respectively, expression of the third member, inducible NOS (iNOS or NOS2), is not tissue restricted and is induced by various cytokines or bacterial cell wall components11,12. Indeed, bacterial infection has been shown to increase expression of NOS2 in human colonic epithelial cells13. NOS2 localizes to the apical pole of IECs and is thought promote NO release into the lumen, where it has cyto-toxic effects on bacteria14,15. While NOS2 and NO have many beneficial functions in the intestines, NOS2 levels must be precisely controlled to prevent pathogenic levels of NO16–18.
In this study we sought to identify TTP targets in IECs and to uncover the role for epithelial TTP in intestinal homeostasis and acute colitis. We found that TTP is largely dispensable for the maintenance of the colonic epithe-lium, yet its loss alters the expression of a variety of transcripts. Indeed, we identified increased Nos2 expression in TTP-depleted IECs. Furthermore, we demonstrated that Nos2 is targeted by TTP through interactions with its 3′ UTR. These post-transcriptional alterations in TTP-depleted IECs protect mice from a model of acute colitis.
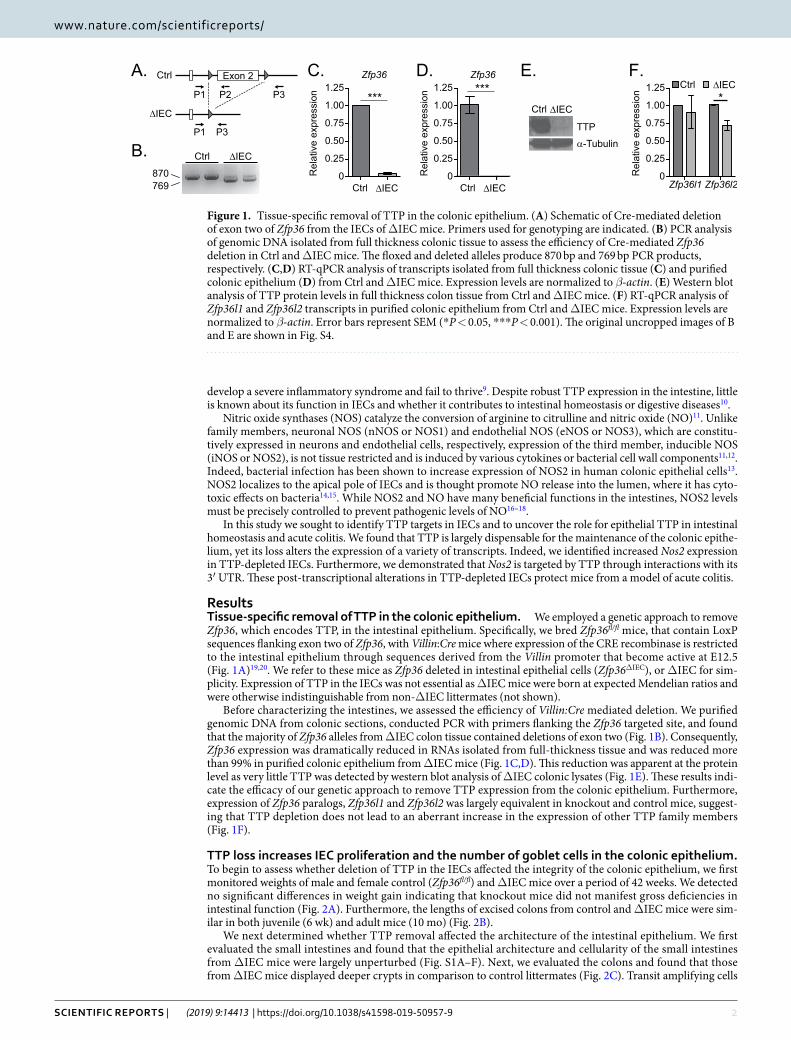
ResultsTissue-specific removal of TTP in the colonic epithelium. We employed a genetic approach to remove Zfp36, which encodes TTP, in the intestinal epithelium. Specifically, we bred Zfp36fl/fl mice, that contain LoxP sequences flanking exon two of Zfp36, with Villin:Cre mice where expression of the CRE recombinase is restricted to the intestinal epithelium through sequences derived from the Villin promoter that become active at E12.5 (Fig. 1A)19,20. We refer to these mice as Zfp36 deleted in intestinal epithelial cells (Zfp36ΔIEC), or ΔIEC for sim-plicity. Expression of TTP in the IECs was not essential as ΔIEC mice were born at expected Mendelian ratios and were otherwise indistinguishable from non-ΔIEC littermates (not shown).
Before characterizing the intestines, we assessed the efficiency of Villin:Cre mediated deletion. We purified genomic DNA from colonic sections, conducted PCR with primers flanking the Zfp36 targeted site, and found that the majority of Zfp36 alleles from ΔIEC colon tissue contained deletions of exon two (Fig. 1B). Consequently, Zfp36 expression was dramatically reduced in RNAs isolated from full-thickness tissue and was reduced more than 99% in purified colonic epithelium from ΔIEC mice (Fig. 1C,D). This reduction was apparent at the protein level as very little TTP was detected by western blot analysis of ΔIEC colonic lysates (Fig. 1E). These results indi-cate the efficacy of our genetic approach to remove TTP expression from the colonic epithelium. Furthermore, expression of Zfp36 paralogs, Zfp36l1 and Zfp36l2 was largely equivalent in knockout and control mice, suggest-ing that TTP depletion does not lead to an aberrant increase in the expression of other TTP family members (Fig. 1F).
ttp loss increases iec proliferation and the number of goblet cells in the colonic epithelium. To begin to assess whether deletion of TTP in the IECs affected the integrity of the colonic epithelium, we first monitored weights of male and female control (Zfp36fl/fl) and ΔIEC mice over a period of 42 weeks. We detected no significant differences in weight gain indicating that knockout mice did not manifest gross deficiencies in intestinal function (Fig. 2A). Furthermore, the lengths of excised colons from control and ΔIEC mice were sim-ilar in both juvenile (6 wk) and adult mice (10 mo) (Fig. 2B).
We next determined whether TTP removal affected the architecture of the intestinal epithelium. We first evaluated the small intestines and found that the epithelial architecture and cellularity of the small intestines from ΔIEC mice were largely unperturbed (Fig. S1A–F). Next, we evaluated the colons and found that those from ΔIEC mice displayed deeper crypts in comparison to control littermates (Fig. 2C). Transit amplifying cells
E.A. C.
0
0.50
1.00
Rel
ativ
e ex
pres
sion
0.75
0.25
1.25***
D.***
0
0.50
1.00
0.75
0.25
1.25
Rel
ativ
e ex
pres
sion
Zfp36 Zfp36
Ctrl ∆IEC Ctrl ∆IEC
F.
Zfp36l1 Zfp36l20
0.50
1.00
0.75
0.25
1.25*
Rel
ativ
e ex
pres
sion
Ctrl ∆IEC
Ctrl ∆IEC
TTP
α-Tubulin
870769
Ctrl ∆IEC
Exon 2
P1 P2 P3
P1 P3
Ctrl
∆IEC
B.
Figure 1. Tissue-specific removal of TTP in the colonic epithelium. (A) Schematic of Cre-mediated deletion of exon two of Zfp36 from the IECs of ΔIEC mice. Primers used for genotyping are indicated. (B) PCR analysis of genomic DNA isolated from full thickness colonic tissue to assess the efficiency of Cre-mediated Zfp36 deletion in Ctrl and ΔIEC mice. The floxed and deleted alleles produce 870 bp and 769 bp PCR products, respectively. (C,D) RT-qPCR analysis of transcripts isolated from full thickness colonic tissue (C) and purified colonic epithelium (D) from Ctrl and ΔIEC mice. Expression levels are normalized to β-actin. (E) Western blot analysis of TTP protein levels in full thickness colon tissue from Ctrl and ΔIEC mice. (F) RT-qPCR analysis of Zfp36l1 and Zfp36l2 transcripts in purified colonic epithelium from Ctrl and ΔIEC mice. Expression levels are normalized to β-actin. Error bars represent SEM (*P < 0.05, ***P < 0.001). The original uncropped images of B and E are shown in Fig. S4.

3Scientific RepoRtS | (2019) 9:14413 | https://doi.org/10.1038/s41598-019-50957-9
www.nature.com/scientificreportswww.nature.com/scientificreports/
produced by stem cells at the base crypt proliferate and migrate up the crypt axis towards the lumen2. By staining sections with anti-Ki67 antibodies, which mark proliferating cells, we detected an expansion of the proliferative zone in ΔIEC colons (Fig. 2D). Previously, we and others have shown that an increase in the numbers of prolif-erating cells can alter the composition and numbers of cells comprising the differentiated compartment21. Using periodic-acid Schiff (PAS) staining to detect goblet cells, we noted a slight increase in the number of these cells per crypt in the colons of knockout mice (Fig. 2E). Thus, while TTP deletion increased numbers of proliferative and goblet cells in the colon, overall colonic architecture was largely intact.
ttp suppresses expression of inducible nitric oxide synthase in the colonic epithelium. We next focused our efforts on identifying transcripts whose expression might be regulated directly by TTP in the colonic epithelium. We purified the colonic epithelia from control and ΔIEC mice, isolated RNA, and conducted RT-qPCR analysis on a panel of characterized TTP targets including Tnf, Myc, Vegfa, the chemokine Ccl2, and others5. While Tnf and Ccl2 levels were elevated in knockout epithelium, expression of other targets remained unchanged, suggesting that TTP may regulate expression of target genes in a tissue- or cell-specific manner (Fig. 3A). We therefore con-ducted RNA-deep sequencing analysis (RNA-Seq) on RNAs purified from control and knockout colons as a first step to define such targets. Overall, we identified 102 targets whose expression differed significantly (|log2(fold change) > 1.5|, q-value < 0.05, Table S1). Of these, 64 were upregulated 1.5-fold or greater and 38 were downregulated 1.5-fold or more in knockout versus control (Fig. 3B). Because TTP is a negative regulator of target transcripts, we focused on the 64 genes whose expression was upregulated in TTP knockout epithelium. To further narrow this list, we subjected them to an AU-rich element (ARE) scoring strategy which assesses the number of AREs and their proximity to one another
0
50
100
150
200
Ctrl
*
02468
10
Ctrl
*
0
25
50
75
100
i
Ctrl
*Ctrl
Ctrl
H&
EPA
SK
i67
C.
D.
E. ∆IEC
∆IEC
A.
4 8 12 16 20 24 28 32 36 405
1015202530354045
Week
Wei
ght (
g)
B.
6 wk 10 mo0
2
4
6
8
Col
on le
ngth
(cm
)
Cry
pt d
epth
(µm
)P
rolif
erat
ive
zone
dept
h (µ
m)
Gob
let c
ells
per
cry
pt
Ctrl∆IEC
Ctrl ∆IEC
Ctrl ∆IEC
∆IEC
∆IEC
∆IEC
Figure 2. TTP loss increases IEC proliferation and the number of goblet cells in the colonic epithelium. (A) Body weights of Ctrl (n = 7; 5 female and 2 male) and ΔIEC (n = 7; 5 female and 2 male) mice aged 3 weeks to 10 months old. (B) Colon lengths from Ctrl (n = 7) and ΔIEC (n = 7) mice aged 6 weeks or 10 months. (C) H&E, (D) Ki67, and (E) PAS staining of colon sections from 6-week-old Ctrl and ΔIEC mice. Scale bars indicate 50 μm. To the right of each panel, crypt depth, proliferative zone depth, and the number of goblet cells per crypt were quantified from 25 crypts per mouse in n = 5 mice per genotype. Each point indicates the average for an individual mouse. Error bars represent SEM (*P < 0.05).

4Scientific RepoRtS | (2019) 9:14413 | https://doi.org/10.1038/s41598-019-50957-9
www.nature.com/scientificreportswww.nature.com/scientificreports/
within the 3′ UTR22. After applying an ARE score cutoff of greater than 4 to eliminate low probability targets, 13 of the 64 passed this threshold (Table 1). Validating the accuracy of this approach, and our screen, the canonical TTP target, Tnf, was amongst the top candidates and we found that TTP associates with the 3′ UTR of each of the 13 identified targets (Fig. S2A–C).
We noticed that nitric oxide synthase 2 (iNos or Nos2) was amongst the targets on this refined list of differ-entially expressed genes. Expression of Nos2 in the colon must be tightly controlled in order to produce precise NO levels that promote a robust anti-microbial response without causing severe IEC cytotoxicity17. To determine
Tnf Nos2Zfp36
4
3
0
1
2
-6 4-2-4 0 2 6log2(fold change)
-log1
0(p-
valu
e)
A. B.
D. E.
0
1
2
TTPNOS2
NOS20
TTP
0.5
1.0
1.5
0
1
2
3
4
5 *
*
Zfp36
TnfCsf2 Il6
Ccl2Cxc
l1Myc
Vegfa
Rel
ativ
e ex
pres
sion
***
Ctrl∆IEC
Ctrl ∆IEC
0
***
Zfp36 Nos2 Tnf
1
2
3
4
5 * *
C.
Rel
ativ
e ex
pres
sion
***
***
α-Tubulin
Rel
ativ
e N
Ox l
evel
s
Ctrl∆IEC
Ctrl∆IEC
Ctrl∆IEC
F.
*
Rel
ativ
e pr
otei
n le
vels
Figure 3. TTP suppresses expression of inducible nitric oxide synthase in the colonic epithelium. (A) RT-qPCR analysis of transcripts corresponding to established TTP target genes in purified colonic epithelium from Ctrl (n = 4) and ΔIEC (n = 4) mice. Expression is normalized to β-actin mRNA levels. (B) Volcano plot displays genes whose expression was significantly upregulated (green) and downregulated (red) in RNA isolated from full thickness colonic tissue from ΔIEC mice, as compared to Ctrl mice. (C) RT-qPCR analysis of transcripts isolated from Ctrl (n = 4) and ΔIEC (n = 4) purified colonic epithelium. Expression is normalized to β-actin mRNA levels. (D) Representative western blot of NOS2 and TTP protein levels in mucosal scrapings from the colons of Ctrl and ΔIEC mice. (E) Quantification of multiple biological replicates of western blot data depicted in (D) (n = 3 per genotype). Levels are normalized to α-Tubulin. (F) Relative total nitrate/nitrite (NOx) levels in mucosal scrapings from the colons of Ctrl (n = 3) and ΔIEC (n = 3) mice. (*P < 0.05, ***P < 0.001). The original uncropped images of D are shown in Fig. S5.
GeneFold change (log2) P Value Q value
ARE score
# of 3′ UTR pentamers
Gm5615 4.10108 5.00E-05 3.82E-03 11.15 8
Nkx3-1 4.09307 5.00E-05 3.82E-03 4.3 4
Nos2 3.44267 5.00E-05 3.82E-03 4.1 3
Gata3 3.05621 1.50E-04 8.64E-03 9 6
Bmpr1b 3.01249 5.00E-05 3.82E-03 27.85 19
Mme 2.57852 5.00E-05 3.82E-03 10.4 8
Tnf 2.07707 5.00E-05 3.82E-03 14.9 8
Plagl1 1.91475 5.00E-05 3.82E-03 9.5 8
Pfkfb3 1.7947 5.00E-05 3.82E-03 11.2 7
Iigp1 1.65737 1.50E-04 8.64E-03 6.2 5
Egf 1.60653 5.00E-05 3.82E-03 6.5 5
Lrp8 1.57754 1.45E-03 4.05E-02 15.7 12
Slfn5 1.51546 5.00E-05 3.82E-03 10.8 9
Table 1. Candidate target genes regulated directly by TTP in the colonic epithelium.

5Scientific RepoRtS | (2019) 9:14413 | https://doi.org/10.1038/s41598-019-50957-9
www.nature.com/scientificreportswww.nature.com/scientificreports/
whether Nos2 is targeted by TTP, we first confirmed the RNA-Seq results using RT-qPCR and found that Nos2 transcripts were elevated in purified colonic epithelium from ΔIEC mice (Fig. 3C). Likewise, we detected ele-vated NOS2 protein levels in the epithelium of these mice (Fig. 3D,E). NOS2 converts arginine to citrulline and produces nitric oxide (NO) as a byproduct23. Therefore, to determine whether elevated NOS2 in the epithelium of ΔIEC mice increased NO production, we measured the total concentration of NO metabolites (NOx), which includes nitrite (NO2-) and nitrate (NO3-), in mucosal scrapings from control and ΔIEC mice. Importantly, we detected elevated NOx levels in ΔIEC epithelium indicating that the increases in Nos2 transcripts and NOS2 proteins are reflected by elevated colonic NO levels (Fig. 3F).
Given that we observed increased numbers of goblet cells in ΔIEC mice (Fig. 2E) and that NOS2 and NO can promote mucus secretion and intestinal epithelial barrier integrity we determined whether epithelial deletion of TTP altered barrier function24,25. Indeed, the ability of paracellular probe, FITC-dextran (FD4), to translocate through the epithelial barrier and into the bloodstream was impaired in ΔIEC mice (Fig. S3). Thus, removal of TTP from IECs promotes barrier integrity, potentially through enhanced expression of Nos2. Taken together, these data suggest that TTP may suppress Nos2 expression, either through direct interaction or through an indirect mechanism.
ttp regulates Nos2 expression through AREs embedded within its 3′ UtR. The downstream por-tion of the human NOS2 3′ UTR contains three AREs that are conserved in rat and mouse (Fig. 4A). To determine whether TTP binds Nos2, we first searched the TTP Binding Atlas, which contains datasets of transcripts that directly interact with TTP as identified through the Photoactivatable Ribonucleoside-Enhanced Crosslinking and Immunoprecipitation (PAR-CLIP) technique26. We uncovered evidence for robust TTP binding to the Nos2 3′ UTR in reported data from macrophages that were stimulated by lipopolysaccharide (LPS) treatment (Fig. 4B)26. To determine whether TTP associates with the Nos2 3′ UTR, we performed a biotinylated oligonu-cleotide pull-down assay. Probes designed to encompass the three AREs within the Nos2 3′ UTR were incubated with protein lysate from HEK293 cells that were first transfected with a plasmid harboring a cDNA encoding TTP. The complexes were precipitated with streptavidin conjugated magnetic beads, and eluted TTP was detected by western blot. Probes designed against the full TNF and Gapdh 3′ UTRs were included as positive and negative controls, respectively. We found that the Nos2 3′ UTR precipitated TTP, albeit not as strongly as the TNF 3′ UTR (Fig. 4C). Furthermore, the TTP-Nos2 interaction was ablated when the AREs in the Nos2 3′ UTR were mutated (Fig. 4C).
To determine whether TTP binding to the Nos2 3′ UTR stimulates transcript degradation, we employed a luciferase stability assay. We subcloned fragments of the Nos2 3′ UTR, as well as the 3′ UTRs of TNF and Gapdh as controls, downstream from the luciferase gene in the pmirGLO vector backbone (Fig. 4D). We found that the downstream portion of the Nos2 3′ UTR reduced luciferase levels in TTP transfected cells (Fig. 4E). This
A.
B. D.
10% Input Tnf Nos2 Gapdh
E.
AUUUA CUUUC
Luciferase
Luciferase
Luciferase
Luciferase
Luciferase
Luciferase
Luciferase
0.0 0.5 1.0
Relative luciferase activity
Vector TTP
hNos2 GTATTTAACTGCCTTGTGTACAGTTATTTATGCCTCTGTATTTAAAAAA-CTAACACCCA-GTCTGTTCCCCATGGCCACTTGGGTCTTCCCTGTATGATTCCTTGATGGAG-ATATTTACATGmNos2 ATACTTAGCTGCACTATGTACAGATATTTATACTTCA-TATTTAAGAAAACAGATACTTTTGTCTACTCCCAATGATGGCTTGGGCCTTTCCTGTATAATTCCTTGATGAAAAATATTTATATArNos2 ATATTTAGCTGCATTGTGTACAGATATTTATACTTTG-TATTTAAGAAAACAGATACCTTCGTCCACTCCCAACGACCGCTTGGCCCTTCCGTGTATAATTCCTTGATGAAG-ATATTTATATA ** *** **** * ******* ******* * * ******* *** * * ** *** **** * * ***** ** ***** *********** * ******* **
*
***
***
***
Nos2Mut
Vector
TNF 3’UTR
Nos2 3’UTR-A
Nos2 3’UTR-B
Nos2 3’UTR-BMut2
Nos2 3’UTR-BMut3
Gapdh 3’UTR
C.
TTP
AUUUA sites
39.3 39.4PAR-CLIP peaks
Position from Nos2 TSS (kb)
0
1
3
2
4
5
Cro
sslin
k ev
ents
(x10
3 )
39.239.139.0
Figure 4. TTP regulates Nos2 levels through AREs embedded within its 3′ UTR. (A) Sequence alignment of human, mouse, and rat NOS2 3′ UTRs. The TTP binding motifs are shaded in grey and conserved nucleotides are marked by asterisks. (B) PAR-CLIP binding profile for TTP on the full Nos2 3′ UTR in LPS stimulated macrophages. This data was obtained from the TTP Atlas26. TTP binding motifs and PAR-CLIP peaks are indicated below the graph. (C) Biotinylated RNA pulldown using the 3′ UTRs of the indicated transcripts as probes. The Nos2Mut probe contained mutations that changed the three AUUUA pentamers to CUUUC. Two replicate experiments are shown for each probe. (D) Schematic of luciferase 3′ UTR reporter constructs used in (E). TTP binding motifs are indicated by grey boxes, which contain an X if that motif has been mutated to CUUUC. (E) Luciferase assays using the indicated reporters in vector or TTP transfected HEK293 cells. Error bars represent SEM. (*P < 0.05, ***P < 0.001). The original uncropped images of C are shown in Fig. S6.

6Scientific RepoRtS | (2019) 9:14413 | https://doi.org/10.1038/s41598-019-50957-9
www.nature.com/scientificreportswww.nature.com/scientificreports/
reduction was nearly fully reversed when all three AREs were mutated (Fig. 4E). Thus, TTP binds the Nos2 3′ UTR and reduces levels of luciferase transcripts when fused downstream. Together, these results suggest that TTP targets Nos2 through the AREs within its 3′ UTR.
LpS induces ttp expression in iecs. IECs express toll-like receptor four (TLR4), which is a pattern rec-ognition receptor that upon binding LPS released from the cell wall of gram (-) bacteria, stimulates expression of pro-inflammatory cytokines including Tnf 27,28. While this pathway stimulates Zfp36 expression in macrophages, it is unknown whether this is also true in IECs29. To test this hypothesis, we stimulated the rat intestinal epithelial cell line, rIEC6, with LPS over a period of four hours, harvested cells at various time-points, and quantified Zfp36 expression. We also monitored Tnf induction, whose expression level reached maximal levels at 1 hr of treatment, indicating that the TLR4-signaling pathway was operational in these cells (Fig. 5A). Zfp36 transcripts were induced 8-fold at the 30-minute time-point and then decreased to base-line levels by four hours (Fig. 5A). This rapid decay in Zfp36 transcripts is consistent with the fact that TTP directly regulates the Zfp36 transcript itself 30–32. TTP protein levels were induced at one hour of treatment and then return to levels below baseline at four hours (Fig. 5B). We next monitored Nos2 levels and found that LPS treatment for 2 hours induced Nos2 expression 32-fold (Fig. 5C). Moreover, while there was no detectable NOS2 protein in untreated cells, LPS stimulated NOS2 protein levels at the two- and four-hour time points (Fig. 5D). Importantly, NOS2 levels were nearly absent in cells treated with LPS for six hours, indicating negative regulators tightly control its expression (Fig. 5D).
To test whether TTP negatively regulates Nos2 transcripts in rIEC6 cells, we created cell lines that express two shRNAs that target distinct regions of the Zfp36 transcript and a third expressing a scrambled shRNA sequence as a control. These shRNAs (denoted as shTTP1 and shTTP2) were placed under regulation of a doxycycline (Dox) inducible promoter. After treating cells with Dox for 72 hours, very little TTP proteins were detected (Fig. 5E). Next, we treated these cells with LPS for two hours and found that TTP-depletion led to a dramatic increase in Nos2 transcript levels (Fig. 5F). We next determined whether TTP suppressed Nos2 expression through its 3′ UTR by destabilizing the transcript. To test this mechanism, we transfected the Nos2 3′ UTR luciferase reporter plasmid into control and TTP-depleted IEC6 cells, inhibited transcription using actinomycin D, and measured the decay of the luciferase-Nos2 3′UTR fusion transcript. Depletion of TTP resulted in an approximately 5-fold increase in the half-life of this fusion transcript compared to control IEC6 cells (Fig. 5G).
B. D.A.
E. F.
C.
LPS (min)0 15 30 60 120 240
0.51248
163264
128 Zfp36Tnf ***
******
Rel
ativ
e ex
pres
sion
TTP0 421
LPS (hr)
α-Tubulin
0 642LPS (hr)
Nos2
α-Tubulin
- +shCtrl shTTP1shTTP2
- + - +TTP
α-Tubulin
shTT
P1
0
2
4
6
8
10**
*
shCtrl
shTT
P2Rel
ativ
e N
os2
expr
essi
on
shTT
P1
shCtrl
shTT
P2
0
0.5
1
1.5
Rel
ativ
e FD
4 co
nc.
****
G.
0 15 30 60 120 2400.5
1248
163264
128 Nos2***
LPS (min)
Rel
ativ
e ex
pres
sion
0
50
100
Per
cent
mR
NA
rem
aini
ng
0 2 4 6 8Actinomycin D (hr)
shCtrlshTTP2
T1/2 = 159.4 hr
T1/2 = 31.4 hr
H.
Figure 5. LPS induces TTP expression in IECs. (A) RT-qPCR analysis of Tnf and Zfp36 transcripts in RNA isolated from rIEC6 cells stimulated with LPS for the indicated times. Expression levels are normalized to β-actin. (B) Western blot analysis of TTP protein levels in rIEC6 cells stimulated with LPS for the indicated times. (C) RT-qPCR analysis of Nos2 transcripts in RNA isolated from rIEC6 cells stimulated with LPS for the indicated times. Expression levels are normalized to β-actin. (D) Western blot analysis of NOS2 protein levels in rIEC6 cells stimulated with LPS for the indicated times. (E) Western blot analysis of TTP protein levels in TTP-silenced rIEC6 cells. Ctrl- and TTP-specific shRNAs were induced by DOX for 72 hrs. (F) RT-qPCR analysis of transcripts isolated from TTP-silenced IEC6 cells after induction with LPS for 2 hours. Expression levels are normalized to β-actin mRNA levels. (G) Control and TTP-silenced IEC6 cells were transfected with the pmirGLO Nos2 3′ UTR-B construct. Nos2 3′ UTR-regulated firefly luciferase mRNA stability was assessed by RT-qPCR after treatment with actinomycin D for the indicated times. Expression levels are normalized to renilla luciferase mRNA levels. (H) FD4 permeability analysis of monolayers of rIEC6 cells with the indicated shRNA. Error bars represent SEM. (*P < 0.05, **P < 0.01, ***P < 0.001). The original uncropped images for B, D and E are shown in Fig. S7.

7Scientific RepoRtS | (2019) 9:14413 | https://doi.org/10.1038/s41598-019-50957-9
www.nature.com/scientificreportswww.nature.com/scientificreports/
Since we observed enhanced epithelial barrier integrity in ΔIEC mice, we examined whether this was an epi-thelial cell intrinsic phenomenon. Indeed, depletion of TTP from rIEC6 cells prohibited the paracellular translo-cation of FD4 through rIEC6 cells grown as a monolayer on transwell supports (Fig. 5H). These findings suggest that TTP participates in a negative feedback loop to control Nos2 expression in LPS-stimulated rIEC6 cells.
Δiec mice are less susceptible to DSS-induced colitis. Ulcerative colitis (UC) is a chronic inflam-matory condition affecting the large bowel33. Recently it was demonstrated that while NO derived from mac-rophages aggravated colitis, NO produced by IECs promoted recovery in a mouse model of UC34. A common model of acute colitis in mice involves supplying dextran sodium sulfate (DSS) in the drinking water which compromises the epithelial barrier and allows infiltration of luminal microbes35. Penetrating microbes elicit an immune response and IECs respond by regenerating the mucosal barrier36. Given our results that TTP negatively regulates Nos2, we predicted that ΔIEC mice may display an altered response to DSS colitis. To investigate this possibility, we supplied control and ΔIEC mice with 2% DSS in their drinking water for five days, after which we provided normal drinking water for five days to facilitate recovery (Fig. 6A). Whereas control mice steadily lost weight during the recovery period, ΔIEC mice initially lost weight and then began to recover during the latter stages of the protocol (Fig. 6B). We also monitored the disease activity index (DAI), which is a scoring system that accounts for weight loss, rectal bleeding, and stool consistency37. In comparison to controls, ΔIEC mice displayed significantly improved DAI scores from days five to ten (Fig. 6C). Shortening of the colon occurs in humans with UC and this phenotype accompanies acute DSS colitis in mice38,39. At the end of the protocol, colons were harvested and measured. The colons of ΔIEC mice were significantly longer than control mice consistent with observations that TTP deletion lessens the severity of DSS colitis (Fig. 6D,E).
B.
C.0 1 2 3 4 5 6 7 8 9 10
Treatment day
707580859095
100105
fl/fl∆IEC
** *** ******
2% DSS
E.
A. 2% DSS0 98765432 101Day:
0 1 2 3 4 5 6 7 8 9 100
1
2
3
Treatment day
***
*** *********
2% DSS*
fl/fl∆IEC
D.
012345
***
F.∆IEC
H&
E
G.
Alc
ian
blue
∆IEC
∆IECI.
Ly6G
∆IECH.
F4/8
0
Ctrl
Ctrl
Ctrl
Ctrl
% o
f ini
tial b
ody
wei
ght
DA
I sco
re
Col
on le
ngth
(cm
)
∆IECCtrl
∆IECCtrl
Water
Figure 6. ΔIEC mice are less susceptible to DSS-induced colitis. (A) Schematic of the DSS protocol, where 2% DSS was administered to 6-8-week-old female mice in the drinking water for 5 days, after which it was replaced with normal water for an additional 5 days. (B) Weight measurements of mice (Ctrl, n = 15; ΔIEC, n = 14) throughout the DSS protocol. (C) As in B, except disease activity indices (DAIs) were assessed. (D) Representative image of colons from Ctrl and ΔIEC mice at day 10. (E) Quantification of colon lengths at day 10 (Ctrl, n = 15; ΔIEC, n = 14). (F) H&E, (G) alcian blue, (H) F4/80, and (I) Ly6G staining of colonic sections from Ctrl and ΔIEC on day 10. Error bars represent SEM (*P < 0.05, **P < 0.01, ***P < 0.001).

8Scientific RepoRtS | (2019) 9:14413 | https://doi.org/10.1038/s41598-019-50957-9
www.nature.com/scientificreportswww.nature.com/scientificreports/
There are distinct histological changes in the colons of UC patients that are also seen in mouse models of colitis including crypt distortion, inflammation, increased bowel wall thickness, and loss of goblet cells33,39. Using IHC, we assessed these parameters in sections prepared from control and ΔIEC mice harvested at the end of the DSS-colitis protocol. Hematoxylin and eosin staining of sectioned colons revealed a largely normal colonic archi-tecture in ΔIEC mice, whereas control mice exhibited residual crypt distortion and ulceration, pronounced infil-tration of immune cells, and increased bowel wall thickness (Fig. 6F). Additionally, through Alcian blue staining, we observed that whereas goblet cells failed to repopulate control mice, they re-occupied their expected position along the crypt axes in knockout mice (Fig. 6G). Finally, we assessed the immune cell infiltration in the colon tis-sue at the end of the DSS-colitis. We identified fewer macrophages and neutrophils in ΔIEC mice by staining with anti-F4/80 and anti-Ly6G antibodies, respectively (Fig. 6H,I). Thus, loss of TTP expression in intestinal epithelial cells lessens the severity of acute colitis.
DiscussionGermline Zfp36 knockout mice (Zfp36-/-) fail to thrive due to systemic inflammation, demonstrating the crit-ical role of TTP in immune-response resolution9. A subsequent study demonstrated this phenotype was not fully recapitulated upon removal of TTP from myeloid cells, suggesting that a compendium of cell types require the immunomodulatory function of TTP19. Indeed, an immunoregulatory role for TTP has been described in keratinocyte-specific Zfp36 knockout mice and mammary epithelium-specific Zfp36 knockout mice40,41. However, this does not seem to be the primary role for TTP in all cell types. Indeed, Wang et al., reported that TTP expression in CD8+ T-cells instead restricts their proliferation42. Here, we also report IEC-specific Zfp36 deletion leads to expansion of the proliferative zone and increased goblet cell numbers in the colonic crypts. Therefore, it is critical to continue defining the cell-type specific functions of TTP.
Here we demonstrate that TTP controls Nos2 expression during intestinal homeostasis. Nos2 is regulated extensively at the post-transcriptional level by RNA-binding proteins (RBP) and microRNAs43. Fechir et al., were the first to report a role for TTP in Nos2 post-transcriptional regulation44. However, in their study, recombinant TTP was unable to directly bind to the human NOS2 3′ UTR in a UV crosslinking assay44. A later report from this group demonstrated that TTP stabilized the NOS2 transcript by sequestering another RBP, KSRP, which directly binds and destabilizes NOS245. Here we demonstrate that TTP is able to interact with the mouse Nos2 3′ UTR through three AREs. Furthermore, we found that TTP can suppress expression of a reporter gene containing the Nos2 3′ UTR and this depends largely on the presence of the three AREs. Because TTP has been predominantly shown to destabilize transcripts, we favor a model where TTP directly binds the Nos2 3′ UTR in intestinal epithe-lial cells. However, we cannot exclude the possibility that TTP is being tethered to Nos2 by another ARE-binding protein. This also raises the possibility that post-transcriptional gene regulation is finely tuned in distinct cellu-lar contexts through post-translational modification and precise coordination of a multitude of RNA-binding proteins and non-coding regulatory RNAs. Indeed, TTP and KSRP have also been shown to work in concert to destabilize the IL-8 3′ UTR46. Also, when comparing the transcriptomes of macrophages and neutrophils derived from Zfp36-/- mice, Ebner et al., found that Nos2 levels were only dysregulated in neutrophils47. The combination of a diverse set of RBPs, microRNAs, and RBP-modifying enzymes in each cell may dictate how each TTP target is regulated.
TTP has been shown to have important functions in many disease models, including endotoxin shock, pso-riasis, and diabetes19,40,48. In this study, we investigate the role of TTP in a model of colitis. We see that, surpris-ingly, loss of TTP from IECs did not aggravate the colitis-associated inflammation, but instead protected mice from colitis symptoms. This surprising result may be due to pleiotropic effects of TTP on several aspects of IEC biology. Indeed, three phenotypes observed in ΔIEC mice may contribute to a decreased colitis severity. First, we observed enhanced epithelial cell proliferation in ΔIEC mice, which could promote IEC regeneration after DSS-induced colitis. Second, we observed increased goblet cells numbers in ΔIEC mice, which could protect the epithelium from an insult or promote restitution of the mucosal barrier after an insult. Finally, we observed reduced epithelial barrier permeability in ΔIEC mice, which could diminish the effects of DSS on the epithelium and prevent translocation of microorganisms from the colonic lumen to the underlying tissue. While Nos2 may contribute to these phenotypes or provide an additional defense against severe DSS colitis, we cannot eliminate the possibility that other TTP target genes also contribute.
The role for NOS2 in intestinal disease has been controversial. There are studies demonstrating that NOS2 expression and NO production both aggravates and protects against pathologies associated with acute colitis16–18,49. There are at least two possible explanations for this discrepancy. First, the precise level of NOS2 expression is likely critical. NO production is essential in the intestines as it promotes mucus secretion24,50, epithelial cell migration51, barrier integrity52, and microbial cytotoxicity during bacterial infection13,15, while suppressing the function of resident immune cells16. However, high NO levels can induce IEC apoptosis, thus causing epithelial barrier dysfunction53. Some NO metabolites can also mutagenize the DNA of IECs, thus restriction of NO levels is critical to prevent tumorigenesis54. Here we show that TTP loss from IECs causes only a 2-fold increase in mucosal NOx levels, which is likely not high enough to be detrimental to the IECs. Second, the cell from which NOS2 is expressed contributes to its role in disease. Indeed, Stettner et al., demonstrated that increasing NO metabolism in IECs promotes recovery from colitis by reducing macrophage infiltration and tissue damage, yet NO production in macrophages leads to their activation and exacerbation of the disease34. We also show that mice producing NOS2 in IECs fare better in a model of experimental colitis. This may also explain why Joe et al., found that germline Zfp36-/- mice are slightly more susceptible to induced colitis55. In that study, while TTP is deleted from the IECs of Zfp36-/- mice, TTP is also lost in the macrophages, leading to elevation of Nos2 and other cytokines in these invading cells55. Therefore, the beneficial effect of deleting TTP from IECs is offset by the detrimental effect of macrophage-induced inflammation.

9Scientific RepoRtS | (2019) 9:14413 | https://doi.org/10.1038/s41598-019-50957-9
www.nature.com/scientificreportswww.nature.com/scientificreports/
In conclusion, our study is the first to ascribe a function to TTP in normal IECs. We show that TTP suppresses IEC proliferation, goblet cell numbers, and Nos2 expression. We also demonstrate that Nos2 is targeted by TTP through AREs in its 3′ UTR. TTP exacerbates the development of colitis, potentially through the suppression of Nos2. These findings raise interesting questions about the cell specific roles of both TTP and NOS2 in intestinal homeostasis and colitis. Stabilization of TTP is a promising therapeutic avenue in a variety of inflammatory con-ditions, yet our findings suggest that this approach should be carefully considered in a tissue-specific manner as it may be detrimental in some diseases, such as IBD56,57. Our results affirm the need for sustained research into the function of this pleotropic RNA-binding protein in additional cell types to fully understand its role in home-ostasis and disease.
Materials and MethodsMice. Villin:Cre mice were obtained from Jackson Laboratories and Zfp36fl/fl mice have been described previously19. Intestinal epithelial cell-specific TTP knockout mice, termed ΔIEC, were generated by crossing Zfp36fl/fl mice with Villin:Cre mice expressing CRE recombinase under the control of the Villin promoter. All experiments were performed using Zfp36fl/fl littermates as controls. Mice were routinely genotyped by isolat-ing genomic DNA from a 2 mm tail biopsy as described previously58. The floxed Zfp36 allele was amplified as described previously and the Cre transgene was amplified as recommended by Jackson Laboratories using the indicated primers (Table S2)19. Tissue-specific knockout was confirmed by first using the MyTaq Extract-PCR Kit (Bioline) to isolate genomic DNA from 2 cm of colon tissue. Subsequently, multiplexed PCR was used to amplify either the floxed or deleted Zfp36 alleles with the oligonucleotides described previously and listed in Table S219. Unless otherwise indicated, all experiments were performed on 6-8-week-old mice. All animal breeding and experiments were approved by the Institutional Animal Care and Use Committee (IACUC) at the Pennsylvania State University College of Medicine. All experiments were performed in accordance with relevant guidelines and regulations provided by the IACUC.
cell culture. rIEC6 (ATCC) and HEK293FT (Invitrogen) cell lines were maintained at 37 °C in 5% CO2 in DMEM supplemented with 10% FetalPlex (Gemini), 50 units/mL penicillin (Corning Mediatech), 0.1 mg/mL streptomycin (Corning Mediatech), and 2 mM Glutamax (ThermoFisher Scientific). HEK293FT cells were sup-plemented with 500 μg/mL G418 (VWR).
RnA isolation and Rt-qpcR. To assess gene expression in mouse colons, total RNA was isolated by pes-tle homogenization of 2 cm of tissue in TRIzol according manufacturer’s instruction. In rIEC6 cells, total RNA was isolated after treatment with 1 μg/mL LPS (Sigma) for the indicated times. The iScript cDNA synthesis kit (Bio-Rad, 170-8891) was used to synthesize cDNAs, in which gene expression was measured by quantitative PCR using the indicated primers (Table S2) and the SensiFAST kit (Bioline, Bio-96020) as described previously59. The data is presented as relative expression (2-ΔΔCt) with β-actin serving to normalize expression values.
Epithelial cell purification. Purified IECs were isolated from control and ΔIEC mice as described pre-viously60. Briefly, colons were opened longitudinally, washed thoroughly with PBS, and cut into 5 mm frag-ments. IECs were separated from stromal cells by incubation in cold chelation buffer (5.6 mM Na2HPO4, 8 mM KH2PO4, 96.2 mM NaCl, 1.6 mM KCl, 43.4 mM sucrose, 54.9 mM d-sorbitol, 0.5 mM dithiothreitol [DTT]) con-taining 2 mM EDTA, followed by mechanical disruption through repeated pipetting of the tissue fragments. IECs were collected and filtered through a 70 μm filter then pelleted by centrifugation at 850 × g for 5 min. Cells were resuspended in TRIzol and RNA was isolated as described above.
Western blot. To assess protein expression in mouse tissue, 2 cm of distal colon was suspended in RIPA buffer supplemented with protease inhibitors (10 μg/ml leupeptin, 10 μg/ml aprotinin, and 1 mM phenyl-methylsulfonyl fluoride) and homogenized using a pestle homogenizer. Mucosal scrapings were prepared from entire mouse colons after vigorous washing with PBS and were subsequently resuspended in RIPA buffer with protease inhibitors. Approximately 1 × 10⁶ rIEC6 cells were plated in a 10 cm dish, treated the following day with 1 μg/mL LPS for the indicated times, pelleted, and resuspended in RIPA buffer. Protein extracts were prepared as described previously and analyzed using western blot with the following antibodies and dilutions: anti-TTP (Millipore, ABE283, 1:500), anti-NOS2 (Abcam, ab178945, 1:1000), and anti-α-tubulin (Sigma T9026, 1:1000)61.
Histology and immunohistochemistry. Sections of colonic tissue were fixed in formalin overnight at room temperature and then transferred to 70% EtOH and stored at 4 °C until they were embedded in paraffin. For staining, slides were dewaxed with xylene and rehydrated by serial alcohol washes. For alcian blue staining, slides were incubated in 1% alcian blue in 3% acetic acid for 4 minutes and counterstained with nuclear fast red. For alkaline phosphatase staining, the Vector Laboratories BCIP/NBT AP substrate kit (SK-5400) was used according to the manufacturer’s instructions. For immunohistochemistry, antigen retrieval was performed by incubating slides in TE buffer (pH 9) for 20 minutes in a standard rice cooker. After cooling, slides were perox-idase quenched and blocked in 10% normal goat serum (Abcam). The slides were incubated overnight at 4 °C with the following primary antibodies: anti-Ki67 (Vector Laboratories, VP-RM04, 1:400), anti-lysozyme (Abcam, ab108508, 1:1000), anti-chromogranin A (Abcam, ab15160, 1:800), anti-F4/80 (Santa Cruz, sc-59171, 1:400), and anti-Ly6G (Biolegend, 1A8, 1:400). The following day, slides were incubated with either goat anti-rabbit or goat anti-rat secondary antibody (Vector Laboratories) for 1 hour at room temperature, detected with ABC and DAB kits (Vector Laboratories), and counterstained with hematoxylin. Periodic acid-Schiff (PAS) and Hematoxylin and eosin (H&E) staining was performed by the Morphological and Molecular Pathology Core Research Lab at the Penn State University College of Medicine.

1 0Scientific RepoRtS | (2019) 9:14413 | https://doi.org/10.1038/s41598-019-50957-9
www.nature.com/scientificreportswww.nature.com/scientificreports/
RnA-sequencing. Total RNA was isolated from 2 cm of full thickness colonic tissue by pestle homogeniza-tion in TRIzol according to the manufacturer’s instructions. RNA concentrations were measured on a NanoDrop (ThermoFisher) apparatus then synthesized into cDNA libraries using the NEXTflex Rapid Directional RNA Sequencing Kit (BioO Scientific). The libraries underwent quality control for quantity and fragment length size distribution then were sequenced using a HiSeq. 2500 according to the manufacturer’s instructions. Sequence read were trimmed and filtered using the FASTX-Toolkit then aligned to the mouse reference (mm10) using Tophat v2.0.9. Fragments Per Kilobase Of Exon Per Million Fragments Mapped (FPKM) values were calculated using Cufflinks v2.2.1 and differential expression analysis was done using CuffDiff. The RNA-Seq data was depos-ited on the Gene Expression Omnibus database and can be accessed using reference number, GSE123345.
Nitrate/nitrite measurements. Colons were excised, opened longitudinally, and washed with PBS. Mucosal scrapings were prepared using a microscope coverslip and subsequent homogenization in PBS using a pestle homogenizer. The samples were clarified by centrifugation at 10,000 × g for 20 minutes. Nitrate in the supernatant was converted to nitrite and measured using the Nitrate/Nitrite Colorimetric Assay Kit (Cayman Chemicals) following the manufacturer’s instructions.
intestinal permeability measurements. Control and ΔIEC mice were administered 44 mg/100 g body weight 4 kDa fluorescein isothiocyanate (FITC)-dextran (Sigma) by oral gavage as previously described62. After 4 hours, mice were euthanized, and blood samples were rapidly collected using cardiac puncture. Blood was allowed to clot for 30 minutes at room temperature in the dark, then serum was isolated by centrifugation. Serum was diluted 1:2 in PBS and the FITC-dextran concentration was measured using a fluorometer (BioTek, Synergy 2) (excitation wavelength, 485 nm; emission wavelength, 528 nm). For in vitro assessment of barrier function, approximately 1 × 10⁴ rIEC6 cells were seeded onto tissue culture treated 6.5 mm Costar transwell permeable supports in a 24 well plate. Cells were grown to confluence over 6 days in DMEM containing 1 μg/mL doxycycline to activate the shRNAs. Subsequently, the media in the upper chamber was replaced with 100 µL of DMEM sup-plemented with 1 μg/mL FD4. The plate was incubated for two hours at 37 °C, after which the FITC-dextran con-centration in the lower chamber was measured using a fluorometer (BioTek, Synergy 2) (excitation wavelength, 485 nm; emission wavelength, 528 nm).
plasmids. SMARTvector inducible lentiviral shRNA constructs were obtained from Dharmacon. The sequences and clone numbers are listed in Table S2. Construction of the pcDNA3-TTP vector was described previously63. For the luciferase reporter constructs, pmirGLO (Promega) was used as the vector backbone. The TNF 3′ UTR was amplified from human genomic DNA and the Nos2 and Gapdh 3′ UTRs were amplified from mouse genomic DNA using the indicated primers (Table S2). The PCR products were subcloned into pmirGLO as SacI-SalI fragments. ARE mutants were generated using the Q5 Site-Directed Mutagenesis Kit (NEB) and the indicated primers (Table S2). All inserts were verified by Sanger sequencing.
Biotin pulldown. Biotin pulldowns were performed as previously described63. Briefly, biotinylated probes were generated by amplifying the TNF, Nos2, and Gapdh 3′ UTRs from the respective pmirGLO plasmid using forward primers that contained a T7 RNA polymerase promoter sequence (Table S2). From this amplified DNA, biotinylated mRNAs were synthesized using the MAXIscript in vitro transcription kit (Ambion) per the manu-facturer’s instructions, using a ratio of 1:5 biotin-labeled CTP to unlabeled CTP. HEK293 cells were transfected with 5 μg of pcDNA3-TTP using lipofectamine. After 24 hours, cells were lysed with PLB supplemented with protease inhibitors (10 μg/ml leupeptin, 10 μg/ml aprotinin, and 1 mM phenylmethylsulfonyl fluoride). Lysates were cleared by centrifugation at 16,000 × g. Reactions containing 500 nM of biotinylated transcripts were mixed with 40 μg of TTP-transfected HEK293 cell lysate for 30 min at room temperature, then incubated with 15 μL streptavidin-dynabeads (Invitrogen) for 30 min, with periodic disruption for brief vortexing. The beads were washed twice with PBS with 500 mM NaCl, proteins were eluted by boiling in 1X SDS-PAGE loading buffer, and samples were separated by SDS-PAGE and analyzed by western blot using anti-TTP antibody (Millipore, ABE283, 1:500).
Luciferase assay. HEK293 cells were seeded on 24-well plates in quadruplicate. The following day, cells were transfected using Lipofectamine 2000 (Invitrogen). Each transfection contained 100 ng of the pmirGLO 3′ UTR reporter plasmid, which also expresses Renilla luciferase from a constitutive promoter, 50 ng of either pcDNA3 or pcDNA3-TTP expression plasmid, and 350 ng pBluescript. The next day, cells were lysed in 100 μl of 1 × passive lysis buffer (Promega), and luciferase levels were measured using a Firefly & Renilla Luciferase Single Tube Assay Kit (Biotium, 30081) on a GloMax 20/20 luminometer (Promega). Firefly luciferase levels were normalized to renilla luciferase levels to control for transfection efficiency.
Generation of stable rIEC6 cell lines. Lentiviral particles were produced by transfecting HEK293FT cells with packaging vectors, pMD2 (2.8 μg) and psPAX2 (5.2 μg), and 5 μg of the respective SMARTvector shRNA construct using Lipofectamine 2000 (Life Technologies). Media containing virus was harvested at 48 and 72 h following transfection and cleared of cell debris by centrifugation at 1500 × g for 5 min. The media was supplemented with 6 μg/mL hexadimethrine bromide (Sigma) and added to rIEC6 cells for 10 h on subsequent days. The media containing virus was replaced with fresh DMEM after each infection. Media was supplemented with 3 μg/mL puromycin (Sigma) 24 hours after the second infection, and cells were selected for 1 week. Stable pools were maintained with 1 μg/mL puromycin. Control and Zfp36-specific shRNAs were induced in rIEC6 cells with 1 μg/mL doxycycline (Acros Organics) for 72 hours prior to experimental analysis.

1 1Scientific RepoRtS | (2019) 9:14413 | https://doi.org/10.1038/s41598-019-50957-9
www.nature.com/scientificreportswww.nature.com/scientificreports/
Measurement of RnA stability. IEC6 cells were seeded on 60 mm dishes. The following day, control and Zfp36-specific shRNAs were induced in rIEC6 cells with 1 μg/mL doxycycline (Acros Organics). After 24 hours cells were transfected with 4 μg of the pmirGLO Nos2 3′ UTR-B reporter plasmid and 4 μg pBluescript. The next day, cells were treated with 5 μg/mL Actinomycin D (MP Biomedicals) for 0, 4, or 8 hours. Subsequently, total RNA was isolated and converted to cDNA, as described above, and firefly luciferase transcript levels were measured by quantitative PCR using the indicated primers (Table S2). The data is presented as percent mRNA remaining with renilla luciferase expression serving to normalize values.
DSS colitis. Acute colitis was induced by administering 2% DSS (TdB Consulting, DB001) to 6-8-week-old female control (Zfp36fl/fl) and ΔIEC mice in their drinking water for 5 days. Afterwards, the mice were provided normal drinking water and allowed to recover for 5 additional days. Throughout the protocol, mice were weighed daily and disease activity indices (DAIs) were assessed on a scale from 0 to 4, with 4 being the most severe as described previously37. This score was based on body weight loss, stool consistency, and rectal bleeding and is presented as an average score of these parameters each day. At the end of the protocol, colon length was measured, and distal colonic tissue samples were collected, fixed in formaldehyde, and paraffin-embedded.
Statistical analysis. Values are presented as mean ± standard error of the mean, with the number of inde-pendent replicates indicated by n. Statistical comparisons between groups was done using two-tailed, unpaired student’s t-tests. Differences in weight and DAI score over the course of the DSS protocol were compared using a 2-way ANOVA with multiple comparisons.
Data AvailabilityAll data generated or analyzed during this study are included in this published article and its Supplementary Information Files.
References 1. Vancamelbeke, M. & Vermeire, S. The intestinal barrier: a fundamental role in health and disease. Expert Rev. Gastroenterol. Hepatol.
11, 821–834 (2017). 2. Barker, N. Adult intestinal stem cells: Critical drivers of epithelial homeostasis and regeneration. Nat. Rev. Mol. Cell Biol. 15, 19–33
(2014). 3. Gehart, H. & Clevers, H. Tales from the crypt: new insights into intestinal stem cells. Nat. Rev. Gastroenterol. Hepatol, https://doi.
org/10.1038/s41575-018-0081-y (2018). 4. Chatterji, P. & Rustgi, A. K. RNA Binding Proteins in Intestinal Epithelial Biology and Colorectal Cancer. Trends Mol. Med. 24,
490–506 (2018). 5. Brooks, S. A. & Blackshear, P. J. Tristetraprolin (TTP): Interactions with mRNA and proteins, and current thoughts on mechanisms
of action. Biochim. Biophys. Acta - Gene Regul. Mech. 1829, 666–679 (2013). 6. Baou, M., Jewell, A. & Murphy, J. J. TIS11 family proteins and their roles in posttranscriptional gene regulation. J. Biomed. Biotechnol.
2009, 1–11 (2009). 7. Sanduja, S., Blanco, F. F. & Dixon, D. A. The roles of TTP and BRF proteins in regulated mRNA decay. Wiley Interdiscip. Rev. RNA 2,
42–57 (2011). 8. Lykke-Andersen, J. & Wagner, E. Recruitment and activation of mRNA decay enzymes by two ARE-mediated decay activation
domains in the proteins TTP and BRF-1. Genes Dev. 19, 351–361 (2005). 9. Taylor, G. A. et al. A pathogenetic role for TNFα in the syndrome of cachexia, arthritis, and autoimmunity resulting from
tristetraprolin (TTP) deficiency. Immunity 4, 445–454 (1996). 10. Carrick, D. M. & Blackshear, P. J. Comparative expression of tristetraprolin (TTP) family member transcripts in normal human
tissues and cancer cell lines. Arch. Biochem. Biophys. 462, 278–285 (2007). 11. Forstermann, U. & Sessa, W. C. Nitric oxide synthases: regulation and function. Eur. Heart J. 33, 829–837 (2012). 12. Forstermann, U. et al. Nitric Oxide Synthase Isozymes. Hypertension 23, 1121–1131 (1994). 13. Witthöft, T., Eckmann, L., Kim, J. M. & Kagnoff, M. F. Enteroinvasive bacteria directly activate expression of iNOS and NO
production in human colon epithelial cells. Am. J. Physiol. 275, G564–G571 (1998). 14. Rumbo, M., Courjault-Gautier, F., Sierro, F., Sirard, J. C. & Felley-Bosco, E. Polarized distribution of inducible nitric oxide synthase
regulates activity in intestinal epithelial cells. FEBS J. 272, 444–453 (2005). 15. Eckmann, L. et al. Nitric Oxide Production by Human Intestinal Epithelial Cells and Competition for Arginine as Potential
Determinants of Host Defense Against the Lumen-Dwelling Pathogen Giardia lamblia. J. Immunol. 164, 1478–1487 (2000). 16. Wallace, J. L. & Miller, M. J. S. Nitric oxide in mucosal defense: A little goes a long way. Gastroenterology 119, 512–520 (2000). 17. Kubes, P. Inducible nitric oxide synthase: A little bit of good in all of us. Gut 47, 6–9 (2000). 18. Kolios, G., Valatas, V. & Ward, S. G. Nitric oxide in inflammatory bowel disease: A universal messenger in an unsolved puzzle.
Immunology 113, 427–437 (2004). 19. Qiu, L.-Q., Stumpo, D. J. & Blackshear, P. J. Myeloid-Specific Tristetraprolin Deficiency in Mice Results in Extreme
Lipopolysaccharide Sensitivity in an Otherwise Minimal Phenotype. J. Immunol. 188, 5150–5159 (2012). 20. Pinto, D., Robine, S., Jaisser, F., El Marjou, F. & Louvard, D. Regulatory sequences of the mouse villin gene that efficiently drive
transgenic expression in immature and differentiated epithelial cells of small and large intestines. J. Biol. Chem. 274, 6476–6482 (1999).
21. Konsavage, W. M. Jr. & Yochum, G. S. The Myc 3′ Wnt-Responsive Element Regulates Homeostasis and Regeneration in the Mouse Intestinal Tract. Mol. Cell. Biol. 32, 3891–3902 (2012).
22. Spasic, M. et al. Genome-wide assessment of AU-rich elements by the AREScore algorithm. PLoS Genet. 8, e1002433 (2012). 23. Nathan, C. & Xie, Q. Nitric oxide synthases: Roles, tolls, and controls. Cell 78, 915–918 (1994). 24. Schreiber, O. et al. iNOS-dependent increase in colonic mucus thickness in DSS-colitic rats. PLoS One 8, e71843 (2013). 25. Jädert, C., Phillipson, M., Holm, L., Lundberg, J. O. & Borniquel, S. Preventive and therapeutic effects of nitrite supplementation in
experimental inflammatory bowel disease. Redox Biol. 2, 73–81 (2014). 26. Sedlyarov, V. et al. Tristetraprolin binding site atlas in the macrophage transcriptome reveals a switch for inflammation resolution.
Mol. Syst. Biol. 12, 868 (2016). 27. Abreu, M. T. et al. TLR signaling at the intestinal epithelial interface. J. Endotoxin Res. 9, 322–330 (2003). 28. Ruemmele, F. M. et al. Lipopolysaccharide modulation of normal enterocyte turnover by toll-like receptors is mediated by
endogenously produced tumour necrosis factor α. Gut 51, 842–848 (2002). 29. Chen, Y.-L. et al. Transcriptional regulation of tristetraprolin by NF-κB signaling in LPS-stimulated macrophages. Mol. Biol. Rep. 40,
2867–2877 (2013).

1 2Scientific RepoRtS | (2019) 9:14413 | https://doi.org/10.1038/s41598-019-50957-9
www.nature.com/scientificreportswww.nature.com/scientificreports/
30. Brooks, S. A., Connolly, J. E. & Rigby, W. F. C. The Role of mRNA Turnover in the Regulation of Tristetraprolin Expression: Evidence for an Extracellular Signal-Regulated Kinase-Specific, AU-Rich Element-Dependent, Autoregulatory Pathway. J. Immunol. 172, 7263–7271 (2004).
31. Tchen, C. R., Brook, M., Saklatvala, J. & Clark, A. R. The stability of tristetraprolin mRNA is regulated by mitogen-activated protein kinase p38 and by tristetraprolin itself. J. Biol. Chem. 279, 32393–32400 (2004).
32. Lai, W. S., Stumpo, D. J., Qiu, L., Faccio, R. & Blackshear, P. J. A knock-in tristetraprolin (TTP) zinc finger point mutation in mice: Comparison with complete TTP deficiency. Mol. Cell. Biol. MCB. 00488–17, https://doi.org/10.1128/MCB.00488-17 (2017).
33. DeRoche, T. C., Xiao, S.-Y. & Liu, X. Histological evaluation in ulcerative colitis. Gastroenterol. Rep. 2, 178–192 (2014). 34. Stettner, N. et al. Induction of Nitric-Oxide Metabolism in Enterocytes Alleviates Colitis and Inflammation-Associated Colon
Cancer. Cell Rep. 23, 1962–1976 (2018). 35. Wirtz, S., Neufert, C., Weigmann, B. & Neurath, M. F. Chemically induced mouse models of acute and chronic intestinal
inflammation. Nat. Protoc. 2, 541–546 (2007). 36. Laroui, H. et al. Dextran sodium sulfate (DSS) induces colitis in mice by forming nano-lipocomplexes with medium-chain-length
fatty acids in the colon. PLoS One 7, e32084 (2012). 37. Raup-Konsavage, W. M., Cooper, T. K. & Yochum, G. S. A Role for MYC in Lithium-Stimulated Repair of the Colonic Epithelium
After DSS-Induced Damage in Mice. Dig. Dis. Sci. 61, 410–422 (2016). 38. Geffan, N., Darnborough, A., De Dombal, F. T., Watkinson, G. & Goligher, J. C. Radiological signs of ulcerative colitis assessment of
their reliability by means of observer variation studies. Gut 9, 150–156 (1968). 39. Kim, J. J., Shajib, M. S., Manocha, M. M. & Khan, W. I. Investigating Intestinal Inflammation in DSS-induced Model of IBD. J. Vis.
Exp. 60, e3678 (2012). 40. Andrianne, M. et al. Tristetraprolin expression by keratinocytes controls local and systemic inflammation. JCI Insight 2, e92979
(2017). 41. Goddio, M. V. et al. Expression of the mRNA stability regulator Tristetraprolin is required for lactation maintenance in the mouse
mammary gland. Oncotarget 9, 8278–8289 (2018). 42. Wang, Q. et al. Tristetraprolin inhibits macrophage IL-27-induced activation of antitumour cytotoxic T cell responses. Nat.
Commun. 8, 867 (2017). 43. Pautz, A. et al. Regulation of the expression of inducible nitric oxide synthase. Nitric Oxide 23, 75–93 (2010). 44. Fechir, M. et al. Tristetraprolin Regulates the Expression of the Human Inducible Nitric-Oxide Synthase Gene. Mol. Pharmacol. 67,
2148–2161 (2005). 45. Linker, K. et al. Involvement of KSRP in the post-transcriptional regulation of human iNOS expression-complex interplay of KSRP
with TTP and HuR. Nucleic Acids Res. 33, 4813–4827 (2005). 46. Winzen, R. et al. Functional Analysis of KSRP Interaction with the AU-Rich Element of Interleukin-8 and Identification of
Inflammatory mRNA Targets. Mol. Cell. Biol. 27, 8388–8400 (2007). 47. Ebner, F. et al. The RNA-binding protein tristetraprolin schedules apoptosis of pathogen-engaged neutrophils during bacterial
infection. J. Clin. Invest. 127, 2051–2065 (2017). 48. Sawicki, K. T. et al. Hepatic tristetraprolin promotes insulin resistance through RNA destabilization of FGF21. JCI Insight 3, e95948
(2018). 49. Kubes, P. & McCafferty, D.-M. Nitric oxide and intestinal inflammation. Am. J. Med. 109, 150–158 (2000). 50. Phillipson, M. et al. The gastric mucus layers: constituents and regulation of accumulation. AJP Gastrointest. Liver Physiol. 295,
G806–G812 (2008). 51. Rhoads, J. M. et al. Arginine stimulates intestinal cell migration through a focal adhesion kinase dependent mechanism. Gut 53,
514–522 (2004). 52. Katsube, T., Tsuji, H. & Onoda, M. Nitric oxide attenuates hydrogen peroxide-induced barrier disruption and protein tyrosine
phosphorylation in monolayers of intestinal epithelial cell. Biochim. Biophys. Acta - Mol. Cell Res. 1773, 794–803 (2007). 53. Sandoval, M. et al. Nitric oxide induces apoptosis in a human colonic epithelial cell line, T84. Mediators Inflamm. 4, 248–250 (1995). 54. Vanini, F., Kashfi, K. & Nath, N. The dual role of iNOS in cancer. Redox Biol. 6, 334–343 (2015). 55. Joe, Y. et al. Tristetraprolin mediates anti-inflammatory effect of carbon monoxide against DSS-induced colitis. PLoS One 9, e88776
(2014). 56. Patial, S. et al. Enhanced stability of tristetraprolin mRNA protects mice against immune-mediated inflammatory pathologies. Proc.
Natl. Acad. Sci. 113, 1865–1870 (2016). 57. Patial, S. & Blackshear, P. J. Tristetraprolin as a Therapeutic Target in Inflammatory Disease. Trends Pharmacol. Sci. 37, 811–821
(2016). 58. Lopez, M. E. A Quick, No Frills Approach to Mouse Genotyping. Bio-Protocols 2, 1–6 (2012). 59. Rennoll, S., Eshelman, M., Raup-Konsavage, W., Kawasawa, Y. & Yochum, G. The MYC 3′ Wnt-Responsive Element Drives
Oncogenic MYC Expression in Human Colorectal Cancer Cells. Cancers (Basel). 8, 52 (2016). 60. Konsavage, W. M. Jr. & Yochum, G. S. The Myc 3′ Wnt-Responsive Element Suppresses Colonic Tumorigenesis. Mol. Cell. Biol. 34,
1659–1669 (2014). 61. Eshelman, M. A., Shah, M., Raup-Konsavage, W. M., Rennoll, S. A. & Yochum, G. S. TCF7L1 recruits CtBP and HDAC1 to repress
DICKKOPF4 gene expression in human colorectal cancer cells. Biochem. Biophys. Res. Commun. 487, 716–722 (2017). 62. Gupta, J. & Nebreda, A. R. Analysis of Intestinal Permeability in Mice. Bio-Protocol 4, 1–4 (2014). 63. Roff, A. N., Panganiban, R. P., Bond, J. S. & Ishmael, F. T. Post-transcriptional Regulation of Meprin α by the RNA-binding Proteins
Hu Antigen R (HuR) and Tristetraprolin (TTP). J. Biol. Chem. 288, 4733–4743 (2013).
AcknowledgementsWe thank members of the Yochum and Koltun Labs for insightful discussions during the course of this work. This work was supported through funds provided from the Department of Biochemistry & Molecular Biology (Penn State University of College of Medicine), the Department of Medicine (Penn State University College of Medicine), the Peter and Marshia Carlino Fund for IBD research, and in part by the Intramural Research Program of the National Institute of Environmental Health Sciences, National Institutes of Health (D.J.S. and P.J.B.).
Author contributionsM.A.E. and G.S.Y. conceived and designed the experiments; M.A.E., S.M.M., E.M.S., R.M.F. and Y.I.K. performed the experiments; M.A.E., S.M.M., E.M.S., R.M.F., W.A.K., D.J.S., P.J.B., F.T.I. and G.S.Y. analyzed the data; M.A.E., S.M.M., and G.S.Y. interpreted the results; M.A.E. and G.S.Y. wrote the manuscript.
Additional informationSupplementary information accompanies this paper at https://doi.org/10.1038/s41598-019-50957-9.Competing Interests: The authors declare no competing interests.

13Scientific RepoRtS | (2019) 9:14413 | https://doi.org/10.1038/s41598-019-50957-9
www.nature.com/scientificreportswww.nature.com/scientificreports/
Publisher’s note Springer Nature remains neutral with regard to jurisdictional claims in published maps and institutional affiliations.
Open Access This article is licensed under a Creative Commons Attribution 4.0 International License, which permits use, sharing, adaptation, distribution and reproduction in any medium or
format, as long as you give appropriate credit to the original author(s) and the source, provide a link to the Cre-ative Commons license, and indicate if changes were made. The images or other third party material in this article are included in the article’s Creative Commons license, unless indicated otherwise in a credit line to the material. If material is not included in the article’s Creative Commons license and your intended use is not per-mitted by statutory regulation or exceeds the permitted use, you will need to obtain permission directly from the copyright holder. To view a copy of this license, visit http://creativecommons.org/licenses/by/4.0/. © The Author(s) 2019