
Unfolding Various Concepts of Junctional Epithelium - Thieme ...
Upload
khangminh22Category
view
3download
0
1
Zinc in the Retinal Pigment Epithelium and
Choriocapillaris Interface
A Thesis Submitted to University College London for the
degree of Doctor of Philosophy
Sabrina Cahyadi
BSc
Department of Ocular Biology and Therapeutics
Institute of Ophthalmology
University College London
2012

2
Declaration
I, Sabrina Cahyadi confirm that the work presented in the thesis titled “Zinc in the
Retinal Pigment Epithelium and Choriocapillaris Interface” is my own work.
Where information has been derived from other sources, I confirm that this has
been indicated in the thesis.
______________
Sabrina Cahyadi
Date: 14 November 2011

3
Acknowledgements
“For wisdom will enter your heart and knowledge will be pleasant to your soul;
discretion will guard you, understanding will watch over you.”
First and foremost, I would like to thank my supervisors Professor Phil Luthert and
Dr. Imre Lengyel for accepting me as their student, and the enormous support, help
and guidance they have provided.
I would also like to thank the Dorothy Hodgkin Postgraduate Award, the Mercer
Fund and Professor Alan Bird for their very generous studentship which enabled
me to do this PhD. The funding I receive from the Special Trustees of Moorfields
Eye Hospital allowed me to do my day-to-day lab works. I thank Peter Marshall
who ensured that the funds reach me in time. I must also thank Dr. Peter Munro,
Cynthia Langley, Alexandra Boss, and Dr. Virginia Calder for all the help and
moral supports I have received.
I cannot believe how much have happened in the past three years. The people at the
Institute of Ophthalmology have supported me through all the amazing, good, bad,
ho-hum, and heartbreaking episodes of my PhD. My fellow lab members Neda
Barzegar-Befroei and Ashraf Gango, who provided so much help and advice.The
UCL students whom I have had the greatest privilege to work with, Bhavika Patel,
Yemsrach Tadesse, Anishka Wilwaraachachii and Alexia Phedonos. Thank you for
all of your help with the cell biology studies and supports throughout.
I thank members of the Ohnuma, Bhattacharya and Shima lab, Asma Aslam and
Meihua Ju for showing the very clueless student that I was when I started how to
manage and run a lab without glitches. I thank Margaret Dellett, Wanzhou Hu,
Vasia Papadaki and Michelle Kim for constantly telling me to fight for my PhD and
providing shoulders to cry on (literally speaking). I thank Amna Shah, Anna Rose,
Sancy Low, Wendy Mustill, Liza Sharmini, and Giovanna Alfano for teaching me
all the cloning aspects, for all the encouragement and for what seemed to be an
infinite cake supply during my time in their office. To all my King’s girls, Saleha
Hassan, Rebecca Alade, Appitha Arulappu, Natasha Khalife, and Mehnaz Hossain,
need I say more, you guys are truly the best.

4
Special thanks go to Prof. Christer Hogstrand from King’s College London who
took me as his student for my final year undergraduate project. It was also because
of your recommendation that this PhD is possible. Tom Carroll, Josef Rasinger and
Valentina Reffatto, former Hogstrand Lab PhD students who instilled the
confidence in me that I am worthy enough of a PhD.I am grateful for my friends
Vania Kusworo and Marco Japutra for all the 12 years that I have known you both.
I thank our collaborators Dr. Elod Kortvely, Matteo Gorza and Jennifer Behler from
Helmholtz Zentrum Munchen for useful discussions, sheltering me for a month in
your lab and pointing out a crucial error in my experimentation which would have
otherwise been detrimental. I thank Professor Richard Thompson for taking some
of his valuable time to read the drafts of the manuscript and for some very useful
discussions about zinc stoichiometry.
I am indebted to the people closest to me, my parents who have been my ardent
supporters for all 23 years of my life, my brother and my sisters for their emotional
and financial support during my undergraduate and PhD degree. To my sister
Janice, thank you for all the frozen Bolognese sauce tubs and banana cakes you
made when cooking seemed to be the last thing on my mind. I also thank Winardi
Suhali for five years of endless support, and encouragement. You have seen me at
my best and at my worst, and thank you for sticking around for me.
Finally, I thank my examiners Prof. John Greenwood and Dr. Kathryn Taylor for
their interest in my thesis and a valuable opportunity to discuss it with them.

5
List of Posters and Publications
Barzegar-Befroei, Neda, Cahyadi, Sabrina, Gango, Ashraf, Peto, Tunde, and
Lengyel, Imre 2011. Zinc in Eye Diseases. Zinc in Human Health. Amsterdam: IOS
Press.
Sabrina Cahyadi, Bhavika J. Patel, Meihua Ju, Alexia Phedonos, Anishka
Wilwaraarachchi, and Imre Lengyel.
Effect of Zinc on Fenestrae Formation in Cultured Endothelial Cells.Poster
presentation at the Association of Research in Vision and Ophthalmology (ARVO)
annual meeting 2011.
Sabrina Cahyadi, Bhavika Patel, Meihua Ju and Imre Lengyel
Effect of zinc on fenestra formation in cultured endothelial cells. Poster
presentation at the Young Researcher Vision Camp in Liebertingen June 25-27
2010.
Zinc in the RPE-Choroid Interface
Presentation at the Zinc-UK meeting 2010

6
Abbreviations
AE – Acrodermatitis Enteropathica
AD – Alzheimer’s Disease
AKT – Serine Threonine Kinase
AMD – Age-Related Macular Degeneration
AMG - Autometallography
APS – Ammonium Persulfate
AREDS – Age-Related Eye Disease Study
BCA – Bichinconinic Assay
BSA – Bovine Serum Albumin
CDK4 – Cell division kinase 4
CRALBP - Cellular retinaldehyde binding protein
CFH – Complement Factor H
DNA – Deoxyribonucleic Acid
ERK - Extracellular-signal-Regulated Kinases
E-Cadherin – Epithelial Cadherin
FAM - 6-carboxyfluoroscein
FGF – Fibroblast Growth Factor
GABA - Gamma-Aminobutyric Acid
GAPDH - Glyceraldehyde 3-Phosphate Dehydrogenase
GDP – Guanosine Diphosphate
GFP – Green Fluorescent Protein
GPx – Glutathione Peroxidase

7
GTP – Guanosine Triphosphate
HMDS - Hexamethyldisilazone
HRP – Horseradish Peroxidase
HUVECs - Human umbilical vein endothelial cells
IL6 – Interleukin 6
IP3 - Inositol 1,4,5-Trisphosphate
kDa - Kilodalton
KDR - Kinase insert Domain Receptor
LA – Latrunculin A
LB- Luria-Bertani
N-Cadherin – Neural Cadherin
nM – Nano molar
MDCK – Madin-Darby Canine Kidney cell line
MMLV- Moloney Murine Leukemia Virus
MT – Metallothionein
MTF - Metal Responsive Element Binding Transcription Factor 1
NEAA – Non-Essential Amino Acid
NO – Nitric Oxide
NK – Natural Killer
PEDF – Pigment Epithelium Derived Factor
PDGF - Platelet- Derived Growth Factor
PCR – Polymerase Chain Reaction
PFA – Paraformaldehyde
8
PI3K - phosphoinositol-3-Kinase
PV-1 – Plasmalemma Vesicle Associated Protein
PVDF - Polyvinylidene Fluoride
QPCR- Quantitative Polymerase Chain Reaction
RNA – Ribonucleic Acid
RPE- Retinal Pigment Epithelium
RT-PCR – Reverse Transcription Polymerase Chain Reaction
SOC – Super Optimal Broth with glucose
SDS- Sodium Dodecyl Sulfate
TER – Transepithelial Resistance
TBS – Tris-Buffered Saline
TBST- Tris- Buffered Saline Tween
TPEN - N,N,N',N'-tetrakis (2 pyridylmethyl) ethylenediamine
TEMED - ,,′,′-Tetramethylethylenediamine
TGF-b - Transforming Growth Factor – beta
UBC – Ubiquitin C protein
VEGF – Vascular Endothelial Growth Factor
YWHAZ - Tyrosine 3-monooxygenase/tryptophan 5-monooxygenase activation
protein
ZIP – ZRT/IRT-like proteins
ZNT – also known as cation diffusion facilitator proteins
ZO-1 – Zona Occludin 1 protein
ZONAB – ZO-1 associated nucleic acid binding protein

9
Abstract
The highest concentration of zinc in human tissues is found in the retinal pigment
epithelium (RPE)-choroid complex. Despite the association of zinc deficiency with
age-related macular degeneration (AMD) and the widespread use of zinc
supplementation to slow the progression ofAMD, very little is known about how
zinc affects the RPE and the choroid. Molecular and cell biology techniques were
used to uncover how changes in zinc levels could play a role in regulating the RPE-
choroid complex.
First, QRT-PCR was used to assess the expressions of all 24 known zinc
transporters in cadaveric human RPE, cultured RPE cells and cells isolated from
other parts of the retina, ZIP12 was identified as a potentially important transporter
to regulate zinc levels at the RPE-choroid interface. As there is very little published
about ZIP12, bioinformatics and data mining were used to understand how this
protein might function. Confirmation of these predictions was achieved through the
cloning and expression of V5-tagged ZIP12 protein in different cell lines. Based on
these experiments, we concluded that ZIP12 is a plasma membrane transporter that
mediates zinc influx.
In parallel, we tested the hypothesis that extracellular zinc levels in Bruch’s
membrane might be involved in regulating both the RPE as well as the fenestrated
choroidal capillaries using cultures of ARPE19 and bEND5 cells respectively. The
presence of extracellular zinc in the growth media affected the characteristics of
ARPE19 cells as well as fenestrae formation in bEND5 cells.
In summary, the range of zinc transporter at the RPE-choroid interface was defined
and properties of one particular transporter, ZIP12 which may have a specific role
at this site, were elucidated. Using cellular systems some of the effects of zinc on
the RPE-choroid complex were investigated. Future studies are required to
elucidate the role of zinc in the AMD pathogenesis.

10
Table of Contents
Declaration ................................................................................................................. 2
Abstract ...................................................................................................................... 9
Acknowledgements .................................................................................................... 3
List of Posters and Publications ................................................................................. 5
Abbreviations ............................................................................................................. 6
List of Tables ........................................................................................................... 14
List of Figures .......................................................................................................... 15
1. General Introduction ............................................................................................ 17
1.1. Zinc Overview .............................................................................................. 17
1.1.1. Biological functions of Zinc ..................................................................... 17
1.1.2. Zinc Homeostasis ...................................................................................... 19
1.2. Zinc Transporters .......................................................................................... 21
1.2.1. SLC30A Family of Transporters .............................................................. 21
1.2.2. SLC39A ZIP FAMILY OF TRANSPORTERS ....................................... 22
1.3. Overview of the Structure of the Eye ........................................................... 25
1.4. Zinc in the Eye .............................................................................................. 27
1.4.1. Retina, RPE, Choroid ................................................................................ 28
1.4.2. RPE Barrier Function ................................................................................ 34
1.4.3. Zinc in Retinal Cellular Function ............................................................. 37
1.4.4. Bruch’s Membrane.................................................................................... 40
1.4.5. Cornea and Sclera ..................................................................................... 40
1.4.6. Lens and Iris .............................................................................................. 41
1.4.7. Vitreous and Optic Nerve ......................................................................... 42
1.5. Consequences of Zinc Deficiency and Overload in the Body and Eye ........ 43
1.5.1. Zinc Deficiency ......................................................................................... 43
1.5.2. Zinc Overload ........................................................................................... 44
1.6. Age-Related Macular Degeneration ............................................................. 45
1.6.1. Overview of Age-Related Macular Degeneration .................................... 45
1.6.2. AMD Pathogenesis ................................................................................... 48
1.6.3. Use of Zinc in AMD ................................................................................. 51
1.7. Aims of the Thesis ........................................................................................ 53
2. Materials and Methods ......................................................................................... 54
2.1. Reagents ....................................................................................................... 54
2.2. Buffers, Solutions and Gel Preparations....................................................... 54
2.3. Antibodies ..................................................................................................... 59
2.4. Sample Preparation ....................................................................................... 59
2.4.1. Cadaveric tissue dissection ....................................................................... 59

11
2.4.2. Tissue Preparation ..................................................................................... 59
2.4.3. Cadaveric Human RPE Preparation .......................................................... 59
2.4.4. Cell culture preparation............................................................................. 60
2.5. RNA Studies ................................................................................................. 60
2.5.1. RNA isolation ........................................................................................... 60
2.5.2. Quantification and integrity analysis ........................................................ 61
2.6. DNA Work ................................................................................................... 61
2.6.1. cDNA synthesis ........................................................................................ 61
2.6.2. Quantitative RT-PCR ................................................................................ 62
2.6.3. DNA clean up ........................................................................................... 64
2.6.3.1. EtOH precipitation ................................................................................... 64
2.6.3.2. Millipore Montage system ........................................................................ 64
2.6.4. Agarose gels .............................................................................................. 64
2.6.5. DNA sequencing ....................................................................................... 65
2.7. Protein Studies .............................................................................................. 65
2.7.1. Western Blot ............................................................................................. 65
2.7.2. In Vitro Translation................................................................................... 66
2.7.3. Bichinconinic Assay ................................................................................. 66
2.7.4. Transient Expression of protein in cells .................................................... 66
2.8. Cell Culture .................................................................................................. 67
2.8.1. Cell lines ................................................................................................... 67
2.8.2. Propagation and Freezing ......................................................................... 67
2.8.3. Cytotoxicity Assay .................................................................................... 68
2.8.4. Cell Proliferation Assay ............................................................................ 68
2.8.5. Wholemount TEM preparation ................................................................. 68
2.8.6. Transepithelial Resistance Measurement .................................................. 69
2.9. Immunohistochemistry /Immunocytochemistry and Zinc Visualization ..... 69
2.9.1. Fixation ..................................................................................................... 69
2.9.2. Immunohistochemistry (Only BEND5) .................................................... 70
2.9.3. Immunohistochemistry (All other cell lines) ............................................ 70
2.9.4. Zinc probes................................................................................................ 71
2.10. Cloning Strategies ..................................................................................... 71
2.10.1. Cloning Primer Designs ............................................................................ 71
2.10.2. Cloning PCR ............................................................................................. 72
2.10.3. Expression vectors .................................................................................... 72

12
2.10.4. Transformation of ccdB cells/ E.Coli ....................................................... 73
2.10.5. Purification of Proteins ............................................................................. 73
2.10.6. Glycerol Stock .......................................................................................... 74
2.10.7. Restriction Digests .................................................................................... 74
2.11. Statistical Analysis .................................................................................... 74
3. Expression of Mammalian Zinc Transporters in the RPE and Choroid .............. 75
3.1. Intracellular Zinc Transport .......................................................................... 76
3.1.1. SLC30A Family of Transporters .............................................................. 76
3.1.2. SLC30A1 / ZnT1 ...................................................................................... 76
3.1.3. SLC30A2/ ZnT2 ....................................................................................... 77
3.1.4. SLC30A3/ ZNT3 ...................................................................................... 78
3.1.5. SLC30A4/ ZnT4 ....................................................................................... 79
3.1.6. SLC30A5/ ZnT5 ....................................................................................... 79
3.1.7. SLC30A6/ ZnT6 ....................................................................................... 80
3.1.8. SLC30A7/ ZnT7 ....................................................................................... 80
3.1.9. SLC30A8/ZnT8 ........................................................................................ 81
3.1.10. SLC30A9/ ZnT9, SLC30A10/ ZnT10 ...................................................... 81
3.1.11. SLC39A ZIP FAMILY OF TRANSPORTERS ....................................... 81
3.1.12. SLC39A1/ZIP1 ......................................................................................... 81
3.1.13. SLC39A2 / ZIP2 ....................................................................................... 82
3.1.14. SLC39A3/ ZIP3 ........................................................................................ 82
3.1.15. SLC39A4/ ZIP4 ........................................................................................ 83
3.1.16. SLC39A5/ ZIP5 ........................................................................................ 83
3.1.17. SLC39A6/ ZIP6 ........................................................................................ 84
3.1.18. SLC39A7/ ZIP7 ........................................................................................ 84
3.1.19. SLC39A8/ ZIP8 ........................................................................................... 84
3.1.20. SLC39A9/ ZIP9 ........................................................................................ 85
3.1.21. SLC39A10/ ZIP10 .................................................................................... 85
3.1.22. SLC39A12/ ZIP12 .................................................................................... 85
3.1.23. SLC39A13/ ZIP13 .................................................................................... 85
3.1.24. SLC39A14/ ZIP14 .................................................................................... 85
3.2. Aims ............................................................................................................. 88
3.3. Expression of SLC30A SLC39A Transporters in RPE Cells ....................... 88
3.4. Expression of SLC30A SLC39A Transporters in non RPE Cells ................ 95
3.5. Confirmation of high SLC39A12 Expression in Cadaveric Tissue ............. 98
3.6. Evidence of Cross-Contamination in Cadaveric Samples ............................ 99
3.7. Discussion ................................................................................................... 101

13
3.7.1. Zinc Transporters in Human Cadaveric and Cultured Retinal Pigment
Epithelium Cells and non-RPE cell lines ............................................................... 101
3.7.2. Zinc transporters in the choroid and fenestrated endothelial cells .......... 109
3.7.3. Zinc Transporters in the Retina............................................................... 109
3.7.4. Eye Phenotype in Zinc Transporter Knockout Animals ......................... 110
3.8. Future Plans ................................................................................................ 110
Conclusion ............................................................................................................. 111
4. Characterisation of ZIP12: Structure, Function and Localisation...................... 112
4.1. SLC39A12 Isoforms ................................................................................... 112
4.2. The ZIP12 protein ....................................................................................... 114
4.3. Specific Expression of SLC39A12 in Tissues ............................................ 121
4.4. Aims ........................................................................................................... 121
4.5. Cloning and expression of ZIP12 ............................................................... 124
4.6. Generation and Characterisation of Antibodies for ZIP12 ......................... 128
4.7. Localisation of ZIP12 ................................................................................. 138
4.8. Function of ZIP12 ....................................................................................... 150
4.9. Discussion ................................................................................................... 152
4.10. Future Directions .................................................................................... 155
5. Potential Role of Extracellular Zinc on RPE Cell Differentiation .................... 158
5.1. Introduction ................................................................................................ 158
5.2. Aims and Hypothesis .................................................................................. 160
5.3. Calculating the Zinc Concentration in DMEM/F12 ................................... 160
5.4. Effect of Extracellular Zinc on TER of Cultured ARPE19 Cells ............... 162
5.5. Effect of Extracellular Zinc on ZO-1 Distribution in ARPE19 Cells......... 164
5.6. Cell Proliferation Assay using alamarBlue ................................................ 166
5.7. Zinc Induced Changes in ARPE19 Gene Expression ................................. 168
5.8. Discussion and Future Perspectives ........................................................... 171
5.9. Future Plans ................................................................................................ 174
6. Effect of Zinc on Fenestrae Formation: an in Vitro Study using bEND5 Cells . 175
6.1. General Introduction ................................................................................... 176
6.1.1. The Endothelium ..................................................................................... 176
6.1.2. PV-1 Protein............................................................................................ 177
6.1.3. Importance of Endothelium in RPE-choroid Interface ........................... 177
6.2. Aims and Hypothesis .................................................................................. 178
6.3. Treatment with ZnSO4 can Induce PV-1 Protein Rearrangement .............. 182
6.4. Electron Microscopy Confirmation of Zinc Induced Fenestration ............. 188
6.5. Cell Viability Assays .................................................................................. 192
6.6. Treatment of bEND5 Cells with Other Divalent Metals ............................ 194
6.7. Possible Signalling Pathway(s) Involved in Zinc – Induced Fenestration . 199
6.8. Discussion ................................................................................................... 202
6.9. Further research .......................................................................................... 208
6.10. Conclusion .............................................................................................. 208
7. General Discussion ............................................................................................ 209

14
8. Appendices ......................................................................................................... 214
8.1. Appendix 1 – Antibodies ............................................................................ 214
8.2. Appendix 2: Cell Lines ............................................................................... 216
8.3. Appendix 3 – Primer List ........................................................................... 217
8.3.1. Cloning Primers ...................................................................................... 217
8.3.2. Sequencing Primers ................................................................................ 217
8.4. QRT-PCR Primer Sequences (Primer Design, Southampton, UK) ........... 218
8.4.1. Mouse Primers ........................................................................................ 218
8.5. Appendix 4: PCR and DNA Sequencing Conditions ................................. 219
8.5.1. Cloning PCR Cycling Conditions ........................................................... 219
8.5.2. DNA Sequencing Conditions .................................................................. 219
8.6. Appendix 5: Plasmids Used ........................................................................ 220
9. References .......................................................................................................... 223
List of Tables
Table 1-1- Total zinc concentration in tissues ........................................................... 27
Table 3-1- Expression of SLC30A1-10, SLC39A1-14 in RPE cells ......................... 91
Table 3-2 - Human primer sequences for SLC30A family and SLC39A family ...... 93
Table 3-3 - Expression of SLC30A1-10, SLC39A1-14 in non- RPE cells................ 96
Table 3-4–Confirmation of SLC39A12 expression using TaqMan-style Probe........ 99
Table 3-5 – Cross contamination in human cadaveric samples ............................... 100
Table 3-6- Summary of zinc transporter expression in various RPE cels ............... 103
Table 4-1- Five isoforms of SLC39A12 (ZIP12)..................................................... 113
Table 4-2 - Details of Sequence Motif Found in ZIP12 Protein Sequence .............. 120
Table 6-1 - Total fenestrae formed in ZnSO4 and LA treated groups...................... 191
Table 6-2 - Overlapping pathways between VEGFA, zinc and nicotine. ................ 201

15
List of Figures
Figure 1-1 -Structure of SLC30 family and SLC39 family of zinc transporters. ...... 23
Figure 1-2- Schematic diagram of the eye ................................................................. 26
Figure 1-3–Organisation of the retina/RPE/choroid complex ................................... 30
Figure 1-4- Transmission electron micrograph picture of a normal RPE .................. 33
Figure 1-5- The retinal cycle ...................................................................................... 39
Figure 1-6- Fundus photograph and pathological features of AMD .......................... 47
Figure 3-1- Distribution of zinc transporters in RPE-choroid complex ..................... 87
Figure 3-2- Confirmation of QRT-PCR using 1% agarose gels ................................ 92
Figure 3-3 – Diagram representation of QRT-PCR data for RPE cells ..................... 94
Figure 3-4- Diagram representation of QRT-PCR data for non-RPE cells ............... 97
Figure 3-5- Zinc transporters in RPE-Choroid. ....................................................... 108
Figure 4-1- Five isoforms of ZIP12 ......................................................................... 113
Figure 4-2 - Phylogenetic tree of SLC39 families. .................................................. 115
Figure 4-3 – Multiple alignments of ZIP12 peptide sequences. .............................. 115
Figure 4-4 – Hydrophobic plot for ZIP12 protein.................................................... 116
Figure 4-5– Annotated sequence of ZIP12 protein .................................................. 119
Figure 4-6– Expression Profile Analysis for SLC39A12 ........................................ 122
Figure 4-7–EST profile and for Slc39a12 and expression of Slc39a12 in brain ..... 123
Figure 4-8– Gateway Recombination Cloning Technology .................................... 125
Figure 4-9– Polymorphism found in retinal cDNA for screening ........................... 125
Figure 4-10– ZIP12 transfection in HEK293 cells .................................................. 127
Figure 4-11–Optimisation of ZIP12-5194 and ZIP12-5193 in Jurkat lysate ........... 130
Figure 4-12 – Peptide incubation of ZIP12-5193 and ZIP12-5194 ......................... 131
Figure 4-13–Cell-free production of ZIP12 protein ................................................. 133
Figure 4-14- Staining using V5 and ZIP12 antibodies ............................................ 134
Figure 4-15–Sonication fails to remove protein aggregates .................................... 136
Figure 4-16– Aggregation of ZIP12 ......................................................................... 137
Figure 4-17–Immunostaining of HEK293 and CHO cells ....................................... 139
Figure 4-18–ZIP12 protein is present on the plasma membrane of HEK293 cells. 142
Figure 4-19–ZIP12 protein is present on the plasma membrane of CHO cells. ...... 143
Figure 4-20–Organelle localization of ZIP12 protein in HEK293 cells .................. 144
Figure 4-21–ER localization of ZIP12 in CHO cells ............................................... 145

16
Figure 4-22–Transfection of ZIP12 in ARPE19 cells .............................................. 147
Figure 4-23–ZIP12 is localized on the plasma membrane of ARPE19 cells ........... 148
Figure 4-24–Organelle localization of ZIP12 protein in ARPE19 cells .................. 149
Figure 4-25–Function of ZIP12 ............................................................................... 151
Figure 5-1– Zinc measurement using ZnAF2 in DMEM/F12 growth medium ....... 161
Figure 5-2- TER measurement in ARPE19 ............................................................. 163
Figure 5-3–Immunostaining for ZO1 on ARPE19 cells .......................................... 165
Figure 5-4 – Percentage reduction of alamarBlue in ARPE19 cells ........................ 167
Figure 5-5- QPCR data showing relative expression of RPE specific genes ........... 169
Figure 5-6 – Logarithmic relative expression of RPE specific genes ...................... 170
Figure 6-1- Types of endothelia ............................................................................... 176
Figure 6-2- LA induces fenestrae formation ............................................................ 181
Figure 6-3- Measurement of free intracellular zinc using ZnAF2. ........................... 182
Figure 6-4 – 125 µM added ZnSO4 cause PV-1 protein rearrangement ................. 184
Figure 6-5 – Treatment of bEND5 cells with 100-200µM of added ZnSO4 ........... 185
Figure 6-6 – Time course treatment with 125µM of added ZnSO4 ......................... 187
Figure 6-7 – TEM pictures showing fenestrae formation ........................................ 189
Figure 6-8 – Sizes of fenestrae were ........................................................................ 191
Figure 6-9–Calcein assay and propidium iodide staining in bEND5 cells .............. 193
Figure 6-10 – Effect of divalent metals on fenestrae formation .............................. 196
Figure 6-11- Effect of divalent metals on fenestrae formation ................................ 197
Figure 6-12–Effect of divalent metals on fenestrae formation (TEM) .................... 197
Figure 6-13–Relationship between VEGF, nicotine and zinc .................................. 200
Figure 6-14–Phosphorylation of ERK1/2 is not involved in fenestrae formation ... 201
Figure 6-15–Bioavailable zinc in Bruch’s membrane ............................................. 207
Figure 7-1–Schematic model of normal and diseased RPE ..................................... 213

17
1. General Introduction1
1.1. Zinc Overview
1.1.1. Biological functions of Zinc
Zinc is an indispensable and ubiquitous trace element present in many tissues in a
wide range of organisms. The total amount of zinc found in human body is
estimated to be 1.4-2.3 grams, with an average of approximately 20-30 µg/g zinc
present in non-pathological human tissues (Karcioglu, 1982). The highest tissue
concentrations of zinc in man are found in the retina and choroid complex, where,
464 and 472 µg/g of zinc is found respectively (Galin et al., 1962).
Zinc requirements for the body differ with gender and age. The National Institutes
of Health established a recommended daily allowance (RDA) of 2-3 mg for infants,
9 mg for adult female, and 11 mg for adult male. For pregnant and lactating
women, the RDA is raised to 12-13 mg (http://ods.od.nih.gov/factsheets/Zinc-
HealthProfessional/). Within the body, zinc is predominantly obtained through
dietary means. Food sources rich in zinc include oyster, red meat such as beef, as
well as pulses and beans (http://ods.od.nih.gov/factsheets/Zinc-
HealthProfessional/). Dietary zinc absorption occurs in the gastrointestinal tract;
however, the level of absorption can be affected by the presence of as phytate.
Phytate, an indigestible molecule present in majority of grains and legumes is able
to form stable complexes with various metal cations such as zinc, copper, nickel,
cobalt, manganese, iron and calcium (Rink, L (ed) 2011, Zinc in Human Health,
Amsterdam). This results in poor absorption of these metals, causing a possibility
of zinc and other metal deficiency if phytate is consumed in large quantities.
Zinc is able to bind into other proteins through interactions with other amino acids.
It predominantly binds through the sulphur residue in cysteine, oxygen present in
glutamate and aspartate, as well as nitrogen present in histidines (Rink, L (ed) 2011,
Zinc in Human Health, Amsterdam). The affinity of zinc metal to the other atoms is
1 Some elements of this chapter have been published in:
Barzegar-Befroei, N., Cahyadi, S., Gango, A., Peto, T., and Lengyel, I. 2011. Zinc
in Eye Diseases. Zinc in Human Health. Amsterdam: IOS Press.

18
determined by the presence of hydrogen bonds in the structure. This has been
shown in the case of carbonic anhydrase, one of the strongest binders of zinc metal.
Carbonic anhydrase has 4 ligands for zinc, all of which are connected with
hydrogen bonds with the side chains. This greatly increases the affinity of the
binding site for zinc (Lesburg and Christianson, 1995). Zinc has been widely
implicated as a structural component of metal-binding proteins such as
metalloproteinases (Vallee and Falchuk, 1993). The zinc-binding metalloproteins
such as protein kinase C (PKC) and superoxide dismutase (SOD) are involved in
cellular proliferation, signalling, and structural functions. Furthermore, the binding
of zinc to domains and motifs such as zinc finger, zinc cluster and zinc twist,
enables specific gene regulatory processes to be activated (Vallee and Falchuk,
1993). Most strongly bound zinc form part of the structural component of proteins.
If zinc affinity in the metal binding site is weak, the metal may participate in
catalytic activities by acting as nucleophiles. For instance, alcohol dehydrogenases
possess zinc binding site within the structure of the enzyme. The presence of zinc
allows the transfer of negatively charged hydride ion from NADH to acetaldehyde
(CH3CHO), ultimately resulting in production of ethanol (CH3CH2OH). This is
achieved through stabilisation of the oxygen residue in acetaldehyde, which in turn
create a positive charge on the carbonyl residue of acetaldehyde where the hydride
ion is transferred to (Kimura, Koike, and Shionoya, 1997).
Phagocytosing leukocytes such as natural killer (NK) cells, neutrophils and
macrophages require zinc in order to function properly as a part of innate immunity.
In adaptive immunity, CD4T+ T cell maturation is induced when intracellular zinc
level is reduced (Murakami and Hirano, 2008). Furthermore, in mammals, SOD
activity converts O2•-
to H2O2, which reduces oxidative stress within the cell.
Neuronal death following axonal injury was increased in Cu/ZnSOD-/-mice
(Reaume et al., 1996).
Zinc has an anti-inflammatory effect on cells through negatively regulating NFκB.
Nuclear factor kappa-light-chain-enhancer of activated B cells (NF-κB) is a
transcription factor that mediate both pro- and anti-apoptotic genes (Uzzo, et al.,
2006) in cells. Under normal condition, NF-κB protein complex is retained in the
cytosol by IkB, a negative regulator of NF-κB. Under cellular stress, IkB

19
degradation occurs, subsequently translocating NF-κB into the nucleus, activating a
series of transcription of transcription factor and genes (Uzzo et al., 2006). Zinc is
able to interfere with the activation of NF-κB through reducing expression of the
pro-inflammatory cytokine TNF-α (Prasad, 2008, Uzzo et al., 2006). Studies using
pulmonary artery-derived endothelial cells showed that zinc deficiency aggravate
production of IL-6, a pro-inflammatory cytokines triggered by exposure to TNF-α
(Hennig 1999, activation zinc in porcine). Furthermore, zinc is able to interact with
pro-apoptotic caspase 3 and reduce the activity of the enzyme (Clegg et al., 2005).
Previous reports have demonstrated the ability of zinc to act as a neurotransmitter
as well as a second messenger. Synaptic vesicles have been shown to contain zinc.
Glutamate and gamma-aminobutyric acid (GABA) receptors contain zinc binding
sites which enable synaptic vesicles to store zinc and they also have zinc
transporters that facilitate the release of zinc into the cytoplasm (Ueno et al., 2002,
Hosie et al., 2003). Redenti and Chappell reported the presence of zinc transporter 3
(ZnT3) as specific for the brain synaptic vesicles (Redenti and Chappell, 2004b).
Zinc binding to calcium activated potassium channels may cause oxidative stress
and lead to brain toxicity (Sensi et al., 2000). Zinc may also have an intracellular
signalling effect. In dendritic cells lipopolysaccharide binding to toll-like receptor
induces dendritic cell maturation as well as activation of CD4+ T- cells through up-
regulation of zinc exporters and downregulation of zinc importers (Kitamura et al.,
2006).
1.1.2. Zinc Homeostasis
Intracellularly, the bioavailable zinc concentration is maintained at a nanomolar
level through uptake, storage and secretion (Bozym et al., 2010). Studies have
indicated that zinc transporters are likely to be the main mechanism of zinc
movement in various mammalian cells, although diffusion of zinc ions may occur
under physiological conditions (Reyes, 1996). In mammals, there are two zinc
transporter families one composed of solute-linked carrier genes, ZRT or IRT-like
proteins (also known as ZIP proteins) and the other of cation diffusion facilitators
(CDFs, also known as ZnT proteins)(Kambe et al., 2004). So far, at least 14 ZIPs
and 10 CDFs (Kambe et al., 2004) havebeen identified.

20
Metallothioneins are small metal-binding proteins that have the capability to bind
zinc, and act as a buffer against oxidative stress. This allows metallothionein to
become the first line of defense when the concentration of intracellular zinc rises.
For instance, it has been shown that the expression of metallothionein mRNA is
induced after cells from a human colonic epithelial cell line are exposed to zinc
(Kindermann et al., 2005). Bobilya and colleagues constructed a blood-brain barrier
model using porcine brain capillary endothelial cells and demonstrated that a 50
µm/L Zn2+
exposure increased the expression of metallothionein and protein level
in 12 hours, suggesting that metallothionein is crucial to limit zinc concentration in
the brain capillary endothelial cells (Bobilya et al., 2008).
The majority of zinc is bound with a high affinity to metalloproteins, and so is said
to be non-bioavailable. Approximately 40% of putative zinc-binding proteins are
transcription factors possessing zinc-binding domains such as zinc finger motifs.
Other proteins are zinc transporters or enzymes. Many groups of enzymes require
zinc binding to function properly. Hydrolases and phosphatases utilise zinc to
induce a nucleophilic attack on substrate. Kinases use zinc mainly for structural
support. Ligases, isomerases, and oxidoreductases also join the zinc-binding group.
Furthermore, zinc is also needed for proteins involved in gene regulatory processes
such as DNA repair, transcription, translation and signalling protein (Andreini et
al., 2006).
In blood serum, approximately 19 µm of Zn2+
is found bound to zinc-binding
albumin. Endothelial cells were reported to have zinc-bound albumin receptors.
When Zn65
uptake was measured, endothelial cells specifically transported only
albumin with zinc bound to it. After endocytosis, the albumin appears to be
recycled to the cytosol (Rowe and Bobilya, 2000).

21
1.2. Zinc Transporters
Zinc transporters are likely to be the main method of maintaining the appropriate
zinc concentrations within the cells. Alternatively, calcium channels (Reyes, 1996)
and proton pumps can also transport zinc. They can also be transported by calcium
channels or proton pumps (Sekler et al., 2007). There are two zinc transporter
families belonging to solute-linked carrier genes, ZRT or IRT-like proteins (also
known as ZIP proteins) and cation diffusion facilitators (CDFs, also known as ZNT
proteins). So far, research has identified at least 14 ZIPs and 10 ZnTs (Kambe et al.,
2004). In this thesis, we will refer to the protein under the name ZIP and ZnT, with
its genes named SLC39A, and SLC30A respectively.
1.2.1. SLC30A Family of Transporters
The SLC30 gene codes for a family of zinc transporters (ZnTs) which are
ubiquitously expressed in all organisms (Liuzzi and Cousins, 2004b). There are
three subfamilies of which the ZnTs are assigned to, and the 10 members of the
mammalian ZnT proteins belong in subfamily 2 and 3 whereby non-mammalian
transporters are grouped in subfamily 1. The ZnT family of transporters specifically
promotes the transport of zinc from the cytosol to extracellular environment or
compartmentalise zinc into organelles within the cell thereby reducing the
concentration of zinc within the cells. Most ZnTs, with the exception of ZnT5
possess six transmembrane domains with a variable region between domains III and
IV, which contains many histidine residues able to bind zinc (See Figure 1.1). Loss
of these histidine residues due to gene mutations or incorrect translation of mRNA
has been reported to result in various pathological conditions, which may include
embryonic lethality, incorrect absorption of zinc, reduced body fat and weight in
mice (Huang et al., 2007) and lethal milk syndrome caused by a mutation in the
SLC30A4 gene encoding the ZnT4 protein. In lethal milk syndrome, the milk
produced by the dams were devoid of zinc, causing death of pups (Murgia et al.,
2006). Mutations in ZnT8 has been associated with Type I diabetes (Wenzlau et al.,
2007). The distribution of ZnTs is widespread; although some are cell-specific
(Redenti and Chappell, 2004b, Palmiter and Huang, 2004).

22
1.2.2. SLC39A ZIP FAMILY OF TRANSPORTERS
The SLC39 genes encode a family of zinc transporters (ZIPs) that are ubiquitously
expressed in all organisms. Structurally, ZIP proteins are composed of eight
transmembrane domains with a cytoplasmic loop between domain III and IV
composed of histidine residues. It is further divided into 4 subfamilies, with ZIP9 in
subfamily I, ZIP1, ZIP2 and ZIP3 in subfamily II, ZIP11 in subfamily III (also
known as gufA). The rest of the transporters belong in LIV-1 subfamily, with ZIP7
and ZIP13 further characterized as HKE4 family members (Taylor et al., 2004).
Figure 1.1 shows a typical structure of the LIV-1 subfamily of ZIP transporters with
8 transmembrane domains. The HIS labeling is predicted to be histidine-rich
regions, the symbol represents N-linked glycan sites. Transmembrane 4 and 5
contains histidine rich sequences (NH and HHE in the diagram) thought to be
involved in transporting zinc (Taylor et al., 2004). ZIP family of zinc transporters
promote the transport of zinc from the extracellular environment into the cytoplasm
or from the cellular organelles to the cytoplasm (Liuzzi and Cousins, 2004b).
Mutations in protein or genetic level of SLC39/ZIP family members may lead to
the development of various pathological conditions such as acrodermatitis
enteropathica (AE), an autosomal recessive metabolic disorder caused by mutations
in ZIP4 (Dufner-Beattie et al., 2003). Overexpression of SLC39A2 (encoding ZIP2
protein) has been implicated in asthmatic infants (Xu et al., 2009). The
overexpression of ZIP7 is upregulated in tamoxifen-resistant breast cancer cell line
(Taylor et al., 2008) and a mutation in ZIP13 has been implicated in Ehlers-Danlos
syndrome (Fukada et al., 2008).

23
Figure 1-1 -Structure of SLC30 family and SLC39 (LIV-1) family of zinc
transporters.
(A) The typical structure of SLC30 (ZnT protein) family member shows the 6
transmembrane domain with a histidine rich region between transmembrane 4 and
5. (B) The typical figure of the LIV-1 subfamily of ZIP proteins shows the 8
transmembrane domains along with histidine rich regions (His) and N-linked
gylcan sites. Transmembrane 4 and 5 contains histidine rich regions which have
been predicted as zinc binding sites. Picture taken from (Eide, 2006, Taylor et al.,
2004).

24
No studies have so far addressed the question as to why mammalians need 24
mammalian zinc transporters to regulate zinc homeostasis. Cousins and Lichten
have suggested that this could be due to the vast requirement of zinc within the
human body compared to other metals such as copper or iron. As it has been
explained in section 1.1.1, zinc is involved in structural, enzymatic as well as
becoming a part of the transcription factor which requires a tight homeostasis.
Furthermore, studies have shown that zinc can co-transport other metals. ZIP8 has
been shown to co-transport manganese (He et al., 2006), ZIP14 is able to transport
iron, furthermore, studies using Arabidopsis Thaliana have suggested that zinc
transporters belonging to this species can transport other metals such as iron or
copper (Robinson, 2007, Lin et al., 2003).

25
1.3. Overview of the Structure of the Eye
The human eye is an organ that receives external light, converting it into signals,
which are then transmitted along the optic nerve head towards the brain. The brain
further processes the information and generates visual perception.
Human eyes are spherical and approximately 24 mm diameter. They are formed of
three layers, (1) the external layer is comprised of the cornea at the front and the
sclera posteriorly. The cornea is 8mm in diameter and its transparent structure
allows light to enter the eye. The white fibrous sclera provides structural support for
the rest of the eye. (2) The highly vascular ‘uveal’ layer lies internal to the sclera
and is comprised of iris, ciliary body and choroid. The rich vasculature of this layer
mainly provides oxygen and nutrients to the eye and clears waste products. (3) The
neural layer is comprised of the retina. The retina contains photoreceptor cells and
other neurons which are crucial in detecting light stimuli and converting them into
visual signals (see next section).
Inside the eye globe, there are three chambers present (see Figure 1.2). The anterior
chamber lies just behind the cornea. Directly behind the anterior chamber is the
posterior chamber in which the lens is located. The largest chamber is the vitreous
cavity, which contains vitreous humor, a clear gel material that is almost devoid of
cells and composed mainly of collagen and hyaluronic acid. The vitreous functions
to maintain ocular shape and contributes to the forces that hold the retina and
choroid in place.

26
Figure 1-2- Schematic diagram of the eye
Schematic diagram of the eye (Image obtained from Remington, Lee Ann. Clinical
Anatomy of the Visual System. Newton, Massachusetts: Butterworth-Heinemann,
1998.

27
1.4. Zinc in the Eye
The eye contains the highest concentration of zinc, compared to other tissues
including bone, muscle, liver, pancreas and kidney. In 1962, Galin extensively
reviewed the concentration of zinc in ocular tissues, concluding that the highest
concentration of zinc is present in the retina and choroid (see Table 1.1), followed
by the ciliary body and the optic nerve. The concentration of zinc in the cornea, iris
and sclera are significantly lower compared to the other parts of the eye (Galin et
al., 1962). While majority of zinc found within the eye is tightly bound to zinc-
binding proteins, a substantial amount is termed exchangeable owing to its dynamic
nature and involvement in various biological processes (Maret, 2008, Colvin et al.,
2010).
Table 1-1- Total zinc concentration in tissues
Total zinc concentration in the ocular tissue, bone, muscle, liver, pancreas and
kidney (Galin et al., 1962, McBean et al., 1972). Parts per million is equivalent to
µg/g of dry mass.
Parts Per Million (PPM) Reference
Cornea 25-35 Galin 1962
Iris 17-26 Galin 1962
Ciliary Body 189-288 Galin 1962
Retina 385-571 Galin 1962
Choroid 419-562 Galin 1962
Optic Nerve 67-161 Galin 1962
Sclera 47-52 Galin 1962
Lens 17-29 Galin 1962
Bone 218 McBean 1972
Muscle 197 McBean 1972
Liver 179 McBean 1972
Pancreas 115 McBean 1972
Kidney 194 McBean 1972

28
1.4.1. Retina, RPE, Choroid
This thesis is concerned with zinc at the RPE-choroid interface and in this section a
review of the currently available literature on zinc in the retina, RPE and choroid is
presented with some coverage of zinc metabolism in other parts of the eye. The
human neural retina is highly structured and may be considered to be formed of
multiple layers: the inner limiting membrane (ILM), nerve fibre layer (NFL),
ganglion cell layer (GCL), inner plexiform layer (IPL), inner nuclear layer (INL),
outer plexiform layer (OPL), outer nuclear layer (ONL), external limiting
membrane (ELM) and photoreceptor layer (See Figure 1.2). The retina rests on the
RPE. The inner limiting membrane is at the interface between the vitreous humor
and the retina. Here astrocytes as well as Muller cells (cells which span the length
of the retina) can be found. Within the GCL, ganglion cells are present. These
transmit visual information from the outer retina to the brain. The axonal
projections of ganglion cells can be found in the NFL. In the IPL dendritic
projections of the ganglion cells synapse with amacrine cells and bipolar cells, two
other neuronal cells within the retina. The OPL contains synapses from
photoreceptor cells to bipolar and horizontal cells. The ONL contains the cell
bodies and the inner fibres of the two classes of photoreceptor cell, the rods and
cones. The ELM is not a true membrane but is formed by junctions between the
outer ends of the Muller cells and the photoreceptors. The photoreceptor outer
segment contains visual pigment. The rods are much more abundant than cones and
optimally detect light in the dark whereas cones mediate colour vision in daylight
(Clinical Anatomy of The Visual System – Page 49-75). Cones are most abundant
at the macula, a region within the retina, which processes the high-resolution
central visual field. Atrophy of photoreceptor cells within the macula results in loss
of vision in AMD.

29
The retina contains the second-highest concentration of total zinc after the choroid
(Grahn et al., 2001, Galin et al., 1962) and Figure 1.3 annotates the localisation of
total as well as bioavailable zinc within the retina. The effect of zinc on
neuromodulation in the retina has been demonstrated by Rosenstein and Chappell,
where activation of glutamate-dependent gamma-aminobutyric acid (GABA)
receptors in bipolar cells of skate was successfully blocked by the addition of 1µM
zinc (Rosenstein and Chappell, 2003). Furthermore, depolarisation of rat retinal
cells was associated with increased exchangeable zinc concentration within the
OPL and photoreceptor inner segments as measured using zinc-selective dye
Newport Green (Redenti and Chappell, 2005). Within the OPL and IPL,
bioavailable zinc was has been visualised using autometallography in various cells
in the INL, Muller cells and the Golgi apparatus of the horizontal and amacrine
cells (Akagi et al., 2001, Kaneda et al., 2005, Redenti and Chappell, 2004b).
Bioavailable zinc labeling in the outer segment discs has been reported in several
studies (Hirayama, 1990, Wang et al., 2006b). Here zinc is involved in stabilization
of photoreceptor discs (Bettger, 1993).

Figure 1-3–Organisation of the retina/RPE/choroid complex
A simplified diagram depicting the cellular organization of the retina/RPE/choroid
complex: Cho, choroid; BM, Bruch’s membrane; RPE, retinal
OS, outer segment; IS, inner segment; ONL, outer nuclear layer; OPL, outer
plexiform layer; INL, inner nuclear layer; IPL, inner plexiform layer and GC,
ganglion cell layer. The shaded bar on the right represent exchangeable zinc level
in the different layers based on
2005, Wang et al., 2006b
bar on the left represents total zinc levels based on
al., 1962, Tam et al., 1976
1990, Fabe et al., 2000
2009).
Picture taken from Barzegar
Lengyel, I. 2011. Zinc in Eye Diseases.
Press.
Organisation of the retina/RPE/choroid complex
A simplified diagram depicting the cellular organization of the retina/RPE/choroid
: Cho, choroid; BM, Bruch’s membrane; RPE, retinal pigment epithelium;
OS, outer segment; IS, inner segment; ONL, outer nuclear layer; OPL, outer
plexiform layer; INL, inner nuclear layer; IPL, inner plexiform layer and GC,
ganglion cell layer. The shaded bar on the right represent exchangeable zinc level
in the different layers based on various studies (Akagi et al., 2001
Wang et al., 2006b, Ugarte and Osborne, 2001, Wu et al., 1993
bar on the left represents total zinc levels based on(Bowness et al., 1952
Tam et al., 1976, Eckhert, 1983, Koumantakis et al., 1983
Fabe et al., 2000, Bentley and Grubb, 1991, Wills et al., 2008
Barzegar-Befroei, N., Cahyadi, S., Gango, A., Peto, T., and
Lengyel, I. 2011. Zinc in Eye Diseases. Zinc in Human Health. Amsterdam: IOS
30
A simplified diagram depicting the cellular organization of the retina/RPE/choroid
pigment epithelium;
OS, outer segment; IS, inner segment; ONL, outer nuclear layer; OPL, outer
plexiform layer; INL, inner nuclear layer; IPL, inner plexiform layer and GC,
ganglion cell layer. The shaded bar on the right represent exchangeable zinc levels
Akagi et al., 2001, Kaneda et al.,
Wu et al., 1993). The shaded
Bowness et al., 1952, Galin et
Koumantakis et al., 1983, Ulshafer et al.,
Wills et al., 2008, Erie et al.,
Befroei, N., Cahyadi, S., Gango, A., Peto, T., and
. Amsterdam: IOS

31
The RPE is a monolayer of hexagonal cells present underneath the photoreceptor
outer segments (POS) of the retina (Figure 1.4). The main function of the RPE is to
scavenge POS through its phagocytic capability. Much of the phagocytosed outer
segment material is recycled but some accumulates in lysosomes to form lipofuscin
and may ultimately be extruded into the sub-RPE space. From here, some material
may gain access to the choroidal circulation (Strauss, 2005). Another function of
the RPE cell is to mediate the retinal cycle (see section 1.4.3 on the retinal cycle). It
also forms the outer blood-retina barrier. The majority of zinc within the RPE is
tightly bound to zinc-binding proteins such as metallothionein, melanin, as well as
enzymes responsible for the retinal cycle (Bok, 1993). Pigment granules have been
associated with protection from oxidative stress as well as regulating
phagolysosomal activity (Schraermeyer et al., 1999). Zinc is stored within melanin
granules in the RPE cells, and hypopigmentation of the RPE has been linked to
AMD. The RPE and choroid is rich in bioavailable zinc, significant amounts of
which can be found within the Golgi apparatus (Huang et al., 2007), melanosomes
and lysosomes (Ugarte and Osborne, 2001, Ulshafer, 1989). Zinc deficiency in the
RPE predominantly compromises its anti-oxidative capacity, where cytotoxicity,
reduced cellular proliferation and lowered metallothionein concentration have been
observed (Tate et al., 1995, Tate et al., 1997). Furthermore, the failure in control of
zinc homeostasis may contribute to aggregation of immunoproteins such as CFH
found in sub-RPE deposits (Nan et al., 2008), ultimately leading to diseases like
AMD.
The choriocapillaris is located directly underneath the RPE and Bruch’s membrane.
It is composed of a unique vascular network which provides nutrients and fluid for
the RPE and the retina (Bernstein and Hollenberg, 1965). The abundance of
fenestrations on the RPE aspect of the choriocapillaris endothelium makes this
vascular bed much leakier than non-fenestrated vessels (Bernstein and Hollenberg,
1965). It is thought that the fenestration is maintained through VEGF secretion
(Saint-Geniez et al., 2009b) from the RPE. A compromised interface can result in
various abnormalities such as choroidal neovascularisation (CNV) and age-related
macular degeneration (Lutty et al., 2010).

32
The choroid contains 416-572µg/g total zinc concentration, the highest within the
eye (Galin et al., 1962, Wills et al., 2009). Discrepancies are present in studies
attempting to measure the total zinc concentration in AMD or other non-AMD
condition. A study by Wills et al reported an increase of total zinc concentration in
human AMD eyes compared to control eyes (Wills et al., 2009). The result has
been disputed by Erie, whose study reported reduced concentration of total zinc
within the RPE and choroid in human AMD eyes. Unlike the retina, very little is
known regarding the function of zinc within the choriocapillaris. However, both the
RPE and choroid are heavily pigmented and pigmentation has been known to act as
a mechanism for zinc storage (Kokkinou et al., 2004). The potential effect of zinc
on a cellular model for fenestrated endothelium will be reported within this thesis
(see Chapter 6).

33
Figure 1-4- Transmission electron micrograph picture of a normal RPE
A TEM picture showing normal RPEwhich is situated between the photoreceptor
outer segments (POS) and the choriocapillaris (CH). On its apical side, the
microvilli projection (V) aids the scavenging of POS by RPE. Within the
intracellular region of the RPE, melanin granules (M), nucleus (N) and lysosomes
(L) are present. On the basal side of the RPE, Bruch’s membrane (B) separates the
RPE from the CH. (Schraermeyer et al., 1999).

34
1.4.2. RPE Barrier Function
The retinal pigment epithelium (RPE) maintains the outer blood-retinal barrier
function through expression of cell to cell junctions, secretion of growth factors and
polarisation of its various receptor or proteins. An impairment of function in any of
these functions can lead to RPE abnormalities.
Two main types of cell to cell junctions present in the RPE are tight and adherens
junctions, each made up of complexes of transmembrane and non-transmembrane
proteins. The functions of these junctions in the RPE include maintaining the
integrity and polarity of epithelial cells and prevent leaking of fluid into the cells.
Located between the apical/ basolateral interface, tight junctions efficiently controls
transportation of solutes, ions and immune cells between the cells (Hartsock, and
Nelson, 2008). The two major transmembrane proteins forming tight junctions
include claudin and occludin, as well as cytoskeletal connecting proteins such as
zona occludens 1 (ZO-1) proteins. Tight junctions are important in maintaining
cellular permeability which controls material diffusion in RPE cells. Occludins, a
group of approximately 65kDa integral proteins were first reported by Furuse and
colleagues (Furuse, et al., 1993). Occludins are indispensable in maintaining the
characteristically high measurement of transepithelial resistance in epithelial cells.
In MDCK cells, transfection with a mutant non-functioning occludin protein fails to
form proper tight junctions as measured by the low transepithelial resistance.
(Balda, et al., 1996). Occludins are known as the binding partner of various tight
junction proteins, especially ZO-1 protein (Furuse, et al 1994). Peripheral
membrane protein ZO-1 is important to maintain paracellular permeability as well
as regulating cellular signalling through transcription factor ZO-1-associated
nucleic-acid-binding protein (ZONAB) (Balda, and Matter, 2000). Claudins are a
group of ubiquitous proteins of about 20-27 kDa in size with four transmembrane
domains (Balkovetz, 2006). Claudins are also responsible in regulating
permeability of the tight junction, whereby mice lacking claudin-1 failed to survive
after birth due to dehydration caused by lack of epidermal barrier (Furuse, et al.,
2002) meanwhile overexpression of claudin-2 protein in MDCK cells was found to
increase permeability of the cells to cations (Amasheh, 2002).

35
Adherens junction mediates cell adhesion, intracellular signalling as well as
regulating the actin cytoskeleton in epithelial cells. They are located underneath
tight junctions and are composed of two groups of protein complexes, namely
cadherin-catenin complex and nectin-afadin complex. Nectins and afadins bind to
actin cytoskeleton meanwhile cadherins bind to a group of catenins, most
commonly α and β-catenin. Through catenins, cadherins are able to mediate the
intracellular signalling pathway, most notably through the Wnt signalling pathway
which controls mouse RPE morphogenesis (Niessen, 2007, Westenkow, Piccolo
and Fuhrmann, 2009). There are various types of cadherins, although the RPE
predominantly expresses the neural cadherin (N-cadherin) and later during
development the epithelial cadherin (E-cadherin) (Burke, et al., 1999). Despite it
being a late onset, the expression of E-cadherin is crucial for differentiation of
cultured primary cultures of human RPE and formation of adherens junction
(Burke, et al., 1999).
Other than cellular junctions, the RPE is unique that it secretes a myriad of factors
including vascular endothelial growth factor (VEGF), fibroblast growth factor
(FGF), platelet derived growth factor (PDGF), epidermal growth factor (EGF) as
well as pigment epithelium derived factor (PEDF). The main function of these
factors is to mediate RPE metabolism, as well as the adjacent choriocapillaris.
Arguably the most widely studied growth factor in RPE research, VEGF is secreted
by the RPE to affect the choriocapillaris (Saint-Geniez 2009). The paracrine
secretion of VEGF by the RPE has been shown to induce fenestration (Saint-Geniez
2009, Shimomura et al., 2009), and without RPE, choriocapillaris development fails
to occur in mice (Marneros, et al., 2005). VEGF signalling is maintained through
the polarised expression of VEGF receptors. In the RPE-choroid interface of human
RPE primary cultures, expression of VEGF receptor can be found towards the RPE
side (VEGFR 2 and 3), as well as within the choriocapillaris (VEGFR1)
(Blaauwgeers, et al., 1999).
PEDF was first described in 1991 by Tombran-Tink and colleagues as an anti-
angiogenic factor which promotes differentiation and neuroprotection in the retina
(Tombran-Tink, Chader, and Johnson 1991, Barnstable and Tombran-Tink, 2004).
PEDF counteracts the action of VEGF. Studies in rat shows that neovascularisation
triggered by photocoagulation upregulates the expression of both PEDF and VEGF,

36
but expression of PEDF was maintained for three weeks in contrast to VEGF
expression receded after a week, suggesting that PEDF protects against oxidative
stress in the RPE (Ogata, et al., 2002). Polarisation of the RPE increased the level
of expression and secretion of VEGF and PEDF significantly. PEDF is
predominantly located apically in polarized cells meanwhile basolateral localization
is preferred in non-polarised cells (Sonoda, et al., 2010). The research for PEDF
receptor has not been as extensive as VEGFR research. However, the receptor for
PEDF has been reported in neural retina (Aymerich et al., 2001).
Other than VEGF receptor, the expression of Na,K-ATPase is strictly confined to
the apical RPE membrane. This receptor is responsible in providing energy for the
purpose of transepithelial transport (Gundersen, 1991). Na,K-ATPase functions
through transporting 3 sodium ions out and 2 potassium ions influx gradient which
is mediated by ATP. This process ensures that the RPE has the energy to able to
perform transport of solutes and molecules in and out of RPE cells (Preben-Morth
et al., 2011). It has been suggested that Na,K-ATPase can interact with tight
junction. Localisation of of Na, K-ATPase in the apical and basolateral membrane
can be affected by Na, K-ATPase. Inhibition of Na, K-ATPase activity using
ouabain was found to reduce transepithelial resistance value in cultured human RPE
cells and associated with reduced permeability as there is no formation of tight
junctions and another cellular junction desmosome (Rajasekaran, et al., 2001)
37
1.4.3. Zinc in Retinal Cellular Function
The retinal cycle is required for vision (Figure 1.5) and zinc is needed for the retinal
cycle to function properly, as many of the retinal cycle enzymes are zinc-binding
proteins. In the outer segment of the rod photoreceptor cells in the retina, 11-cis-
retinal is tightly bound to opsin, producing a molecule called rhodopsin. The
absorption of a photon of light induces the 11-cis retinal to undergo
transisomerisation, which allows it to be transported into the RPE cell as all-trans-
retinal. This occurs as the photoreceptors do not possess the cis-trans isomerase
needed for the isomerisation of 11-cis-retinal to all-trans-retinol. The activated
rhodopsin in turn activates transducin and the phototransduction cascade is
initiated. Through phosphorylation of rhodopsin by rhodopsin receptor kinase and
arrestin, all-trans-retinal is released, and transported through the disc membrane by
the ATP binding cassette protein (ABCR). Using chaperones RPE65, CRBP, and
LRAT the all-trans-retinal is converted to all-trans-retinyl ester. Isomerohydrolase
converts the molecule to 11-cis-retinol and using NAD/NADP as substrate, through
the action of retinol dehydrogenase 5 (RDH5), this gets converted to 11-cis-retinal
to be transported back to photoreceptor outer segments (Strauss, 2005).
As majority of enzymes and other proteins involved in the retinal cycle require zinc
to function properly, sub-RPE deposits found between the RPE cell and Bruch’s
membrane may indicate impaired activity of several zinc-related proteins. In
summary, zinc is required for the proper functioning of proteins involved in the
retinal cycle, and if proteins of the retinal cycle become disrupted, vision is
disrupted.
Enzymes that aid phagocytosis of photoreceptor outer segments require zinc to be
activated: Α-mannosidase is a lytic enzyme found in RPE cell lysosomes which
degrade photoreceptor outer segment. Wyszynski and colleagues reported that
increasing the level of zinc induces the activity of α-mannosidase. The enzymatic
activity of α-mannosidase, as determined by a decreased Vmax was also shown to
decrease with older age. The Km value of the enzyme does not decrease. This
suggested impairment in the degradation of photoreceptor outer segments in the
retina with older age, which may lead to constant accumulation of debris in the

38
cells (Wyszynski et al., 1989, Tate et al., 1995). In addition, another report
demonstrated that 0.25 µM of zinc was sufficient to induce a reduction in enzymes
catalase and alkaline phosphatase and antioxidant metallothionein.
Neovascularisation is one of the hallmarks of late stage AMD. In order for blood
vessels to breach Bruch’s membrane, its remodelling must be disturbed with net,
albeit focal, breakdown. The process of remodelling requires several protein-
degrading enzymes namely matrix metalloproteinases (MMPs), suggesting that
MMPs may have significant function in morphological changes of Bruch’s
membrane. MMPs are zinc-binding proteins. It has been reported that MMP3
inhibits angiogenesis in endothelial cell chemotaxis (Anand-Apte et al., 1997).

39
Figure 1-5- The retinal cycle
The retinal cycle (Diagram adapted from Olaf Strauss 2005).
RPECell
PhotoreceptorOuterSegment
11-cis-retinol
RDH5NAD+NADP
11-cis-retinal
11-cis-retinal
Opsin
RhodopsinRhodopsin
ActivatedRhodopsin
Phototransduction
LightAbsorption
SODRDH5
All-trans-retinal
All-trans-retinol
ATP bindingcassetteprotein &
RDH
CRBPLRAT
RPE65
All-trans-retinyl esterIsomerohydrolase

40
1.4.4. Bruch’s Membrane
Bruch’s membrane is a connective matrix structure linking the RPE and the
choriocapillaris as a part of the blood-ocular barriers. Bruch’s membrane has 5
layers, formed of RPE basement membrane, inner collagen fibre layer, elastic fibre
sheet, outer collagen fibre layer and basement membrane of the choriocapillaris
(Sumita, 1961). It is heavily involved in controlling solutes and micronutrients
passing between the two interfaces but restricts diffusion of large molecules
(Cunha-Vaz, 1979). The thickening of Bruch’s membrane, which can be followed
by formation of protein aggregates (sub-RPE deposits) in aged-related diseases,
could obstruct this material exchange. Very little is known about the presence of
zinc in Bruch’s membrane although the macula of normal BM contains 137ppm
zinc, increasing to 254ppm in macula of AMD subjects (Lengyel et al., 2007).
Information about zinc concentration in each respective layer is not available.
1.4.5. Cornea and Sclera
The cornea and sclera are interconnected and form the outer coat of the eye. The
cornea is a clear and curved structure, which is involved in light transmission and
light refraction. The cornea absorbs oxygen from the environment. Despite
containing five layers within its structure, the cornea remains transparent; any
opacity would compromise its function. The transparency of the cornea is
maintained in part through the lack of blood vessels present within its structure. As
a result of this, the cornea obtains its nutrition from the aqueous humor located in
the anterior chamber as well as from vessels at the limbus (Clinical Anatomy of
The Visual System – Page 19-25). As the concentration of zinc within the cornea is
low (Karcioglu, 1982), studies have suggested that zinc delivery to the cornea is
achieved through tears and systemically but not through the aqueous humor
(Anderson et al., 1987). Zinc is required within the cornea to promote the process
of wound healing. Neovascularisation has been observed in cornea of rats subjected
to zinc deficiency (Leure-Dupree, 1986). Enzymes such as matrix-
metalloproteinases are highly zinc-dependent (Takahashi et al., 2000) suggesting
the involvement of zinc in corneal wound healing. Indeed, zinc deficiency in Wistar
rats was found to lead to reduced microvilli on the corneal epithelium, an
abnormality which was able to be reversed with zinc supplementation. Reduced

41
microvilli can promote tear film breakage which can compromise corneal immunity
(Gong et al., 2004).
The sclera makes up the rest of the outermost layer of the eye. Formed of a layer of
vascularised tissue and a robust fibrous layer of connective tissue, the sclera
provides internal and structural support for the eye. The scleral fibers are composed
of collagen fibrils arranged in an irregular way which contributes to its white colour
and opacification (Clinical Anatomy of The Visual System – Page 24). Zinc may
have a function in the connective tissue turnover in the sclera as zinc has been
shown to affect collagen (Berman and Manabe, 1973) and matrix
metalloproteinases in the anterior segment of the eye (Gaton et al., 1999).
1.4.6. Lens and Iris
Similar to the cornea, the lens is an avascular, transparent structure which functions
to project light onto the retina. Approximately a third of the lens structure is
protein, with water making up the rest. The cells within the lens continue to divide
in one’s lifetime; meanwhile the cells present are not removed but are instead
compressed into thin layers. This results in increased lens weight and size
throughout life, which can result in formation of cataract and impaired ocular optics
(Clinical Anatomy of The Visual System – Page 79). The zinc content in the lens is
lower than in the retina-choroid. However, studies have shown a possible
correlation between zinc deficiency and formation of cataract in both animal
models and man (Ketola, 1979, Richardson et al., 1985, Racz et al., 1979, Barash et
al., 1982). Loss of zinc-copper superoxide dismutase activity has been associated
with cataract (Behndig et al., 1998), suggestive of the loss of zinc mediated
protection in cataract cases. However, zinc supplementation was not found to
prevent progression of cataract (Seddon, 2007).
The iris is a pigmented structure which controls the amount of light that passes
through the eye by altering the diameter of the pupil. Iris colour is determined by
the amount of pigmentation present. Darker-coloured irides contain more
melanocytes and melanosomes than those that are blue or lighter-coloured
(Kokkinou et al., 2004). As melanin binds zinc, Newsome and colleagues have
reported that the amount of melanin in the RPE can affect the uptake and

42
accumulation of zinc (Newsome et al., 1992). Melanin and zinc concentrations in
the tissue are both reduced with age (Kokkinou et al., 2004).
1.4.7. Vitreous and Optic Nerve
The vitreous humor fills the large space in the posterior segment of the eye between
the lens and retina. The gel-like substance contains 98.5-99.7% water, salt, soluble
proteins and a network of fibers made up of type II collagen fibers and hyaluronic
acid. The viscosity of the vitreous humor enables it to function as an effective
shock absorber to prevent retinal damage. While few cells are found within the
vitreous, hyalocytes and fibroblasts are thought to aid in the synthesis of
glycoproteins and collagen (Clinical Anatomy of the Visual System page 95-99).
The amount of zinc found within the vitreous humor can be affected by disease
states such as cataract and diabetes (Nourmohammadi et al., 2006, Konerirajapuram
et al., 2004). It has been suggested that zinc forms a part of the immune-defence
mechanism through its anti-oxidative property (Bhooma et al., 1997).
Axons from the ganglion cells concentrate at the optic nerve head and signals are
transmitted to the nervous system (Clinical Anatomy of the Visual System page
230-233). Rat models of zinc deficiency showed reduced myelinated axons and
thinner myelin sheaths (Gong and Amemiya, 2001). The same observation was
seen in monkeys treated with ethambutol, a tuberculosis drug which chelates zinc
(Graham et al., 1998). The reduction in myelination was unable to be recovered
with zinc supplementation, suggesting that zinc deficiency can lead to permanent
loss of vision (Gong and Amemiya, 2001).

43
1.5. Consequences of Zinc Deficiency and Overload in the Body and Eye
1.5.1. Zinc Deficiency
Under normal conditions, cellular zinc concentration is very tightly controlled
within a range of tolerable concentrations. Zinc homeostasis is achieved by
regulating zinc-sequestering proteins such as metallothioneins, and albumin, or
changing the expression of zinc transporter proteins which transports zinc in and
out of the cell or intracellular compartments. It is also worth noting that the
majority of zinc is bound with high affinity in the metal-binding domain of
proteins.
Many diseases are associated with zinc deficiency caused by the failure of
regulating proteins important for zinc homeostasis or dietary zinc deficiency. One
of the most well-known zinc-associated disorders is acrodermatitis enteropathica, a
condition caused by missense mutation in SLC39A4, the gene that encodes the
ZIP4 importer protein, which is highly expressed in the apical part of jejunum and
duodenum of small intestine. The onset of the disease often occurs during early
childhood, often not long after weaning from breast milk (Cameron and McClain,
1986). The mutated ZIP4 protein does not possess the capability to bind zinc and
hampers zinc absorption from the small intestine, leading to severe zinc deficiency
(Muga and Grider, 1999). In addition to severe diarrhoea, skin lesions and growth
retardation, there are ocular abnormalities associated with the disease. Decrease in
thickness and polarity of the corneal epithelium, loss of Bowman’s membrane,
severe degeneration of the RPE, loss of optic nerve fibres and loss of ganglion cells
have all been reported (Cameron and McClain, 1986). In 1963, Prasad reported the
occurrence of growth stunting, and hypogonadism in Iranian patients with zinc
deficiency (Prasad et al., 1963). Chronic alcohol consumption can lead to reduced
serum zinc concentration which can cause impaired immunity, diarrhoea and
depression. Ocular abnormalities associated with chronic alcohol consumption
include impaired dark adaptation and night vision (McClain et al., 1986). Iron
chelation therapy using desferoxamine in patients with thalassemia major has been
associated with growth retardation, reduced hair and leukocyte zinc. Furthermore,
increased urinary zinc was observed in patients treated with desferoxamine over the
period of 1 month (De Virgillis, 1998). Many of the diseases are systemic and can

44
be improved by zinc supplementation (Grahn et al., 2001). However, supplements
need to be prescribed with caution as excessive zinc can result in impaired copper
absorption, leading to copper deficiency (Yolton, 1981).
Zinc deficiency results in various conditions in mammals. Animal studies using rats
have shown that zinc deficiency leads to increased lipid peroxidation in the retinal
pigment epithelium (RPE), as well as reduced metallothionein in the retina and
RPE as visualised using electron microscopy (Miceli et al., 1999, Kindermann et
al., 2005). Furthermore, developmental problems, increased cellular death and
aberrant gestation have been seen (Jankowski et al., 1995). Rats subjected to
marked zinc deficiency during gestation produced pups with severe eye disorders.
Anopthalmia has also been reported in the pups (Rogers and Hurley, 1987, Grahn et
al., 2001). Furthermore, in rat kidneys of animals subjected to a zinc deficient diet
for 60 days, decreased number of glomeruli and increased nitric oxide synthase
were observed. Increased nitric oxide synthase is a risk factor for vascular and renal
diseases (Tomat et al., 2005).
1.5.2. Zinc Overload
Compared to the significant health problems associated with zinc deficiency, zinc
overload does not generally cause health issues. In vitro experiments have
documented the dual role of zinc in rabbit retinas. Isolated rabbit retinas treated
with 500µM zinc released GABA and NMDA resulting in increased neurotoxicity
in the eye. This condition could be reversed by adding equimolar concentration of
the zinc chelator diethyldithiocarbamate (Ugarte and Osborne, 2001). Proteomics
experiments showed that increasing the zinc concentration to cytotoxic level (10
ppm) results in reduced expression of eleven genes involved in the electron
transport chain, and subsequently lower adenosine triphosphate (ATP) levels in
cells (Kindermann et al., 2005).
The physiological effects of zinc overload are not very well documented. However,
it was noted that increased zinc concentration may cause copper deficiency, which
may result in anemia, neutropenia, arthritis, arterial disease and osteoporosis in
humans (Danks, 1988). Cells respond to increased intracellular zinc concentration
by upregulating the expression of zinc exporters and metallothioneins, in addition
to down-regulating zinc importer expression (Miceli et al., 1999).

45
1.6. Age-Related Macular Degeneration
1.6.1. Overview of Age-Related Macular Degeneration
Age-related Macular Degeneration (AMD) is a multifactorial disease which is
characterised by pathological changes such as pigment (RPE) remodelling, with
hypertrophy and depigmentation associated with the formation of soft drusen, hard
drusen and eventually in some cases geographical atrophy of RPE cells. The
disease is presently the most common cause of blindness in the developed world,
occurring in >35% in people over 75 years of age (Stone, 2007). Exudative
choroidal neovascularisation occurs in approximately 10% of patients and
cumulates in vision loss (Stone, 2007). Focal sub-RPE deposits, or drusen protein-
rich aggregates of > 63µm - <124µm diameter and areeither diffuse,and covering a
large area (soft drusen) or punctate, brighter and smaller (hard drusen). Figure 1.6
shows the four stages of AMD as viewed with fundus photography (top panel) or
immunohistochemical staining (panel below), with early AMD (A) showing several
small deposits but lacking atrophy of cells and generally causing no extensive
vision problems. Intermediate AMD (panel B) showed a markedly increased
number of deposits with some coalescing as well as areas of early geographic
atrophy. Advanced AMD can result from widespread geographic atrophy, and/or
choroidal neovascularisation (CNV). Widespread geographic atrophy that affects
the fovea will result in the loss of cone photoreceptor cells required for producing
high resolution and colour vision. What triggers the onset of CNV in 10-15% of
AMD subjects is unknown, however around 80% of vision loss is associated with
CNV (Jager et al., 2008).
There are several known predisposing factors for AMD. Genetic factors have
included polymorphisms at AMD susceptibility loci on chromosome 1 and 10q26.
High risk polymorphisms in Complement Factor H (CFH) (Klein et al., 2005),
ARMS2 (Kanda et al., 2007), HTRA1 (Dewan et al., 2006), all located within these
loci have been shown to predispose an individual to AMD (Stone, 2007, Francis
and Klein, 2011). Other genetic associations have included polymorphisms in
Apolipoprotein E (ApoE), ATP-binding cassette A4 (ABCA4), and Chemokine 3
Receptor 1 (CX3CR1) (Francis and Klein, 2011). Smoking strongly predisposes

46
one to AMD, and therefore has been considered an environmental risk factor
(Stone, 2007, Francis and Klein, 2011).
Current treatment options are limited for AMD patients. In early and late stage
AMD, zinc supplement containing zinc and antioxidants have been prescribed to
patients (2001). Geographic atrophy at present is untreatable. CNV has been widely
treated with laser ablation therapy as well as antibodies against vascular endothelial
growth factor (VEGF) such as Lucentis and Avastin (Rattner and Nathans, 2006).
Attempts have been made to transplant RPE cells into AMD patients to restore the
dysfunctional RPE cells (Binder et al., 2007).

47
Figure 1-6- Fundus photograph and pathological features of AMD
The fundus photographs (top panels) and histopathological micrographs (lower
panels) shows three stages of AMD, starting from early AMD (A), characterised by
the presence few small-medium sized deposits. Intermediate AMD (B) with a few
large deposits and a much increased number of small-medium sized deposits. The
end stages of AMD showed either geographic atrophy (C), or neovascularisation
(D). (Image from (Jager et al., 2008)

48
1.6.2. AMD Pathogenesis
The pathogenesis of age-related macular degeneration (AMD) is likely to be
multifactorial, involving a complicated range of events. Prior studies have shown that
the pathogenesis of AMD involves a combination of biological processes happening in
the RPE, as well as other extrinsic factors. These events cumulatively result in damage
to the RPE, choriocapillaris, as well as the thickening of Bruch’s membrane. The
changes in the RPE-choroid interface triggers inflammatory events in the interface,
resulting in formation of large sub-RPE deposits, geographic atrophy and choroidal
neovascularisation, the three hallmarks of advanced AMD.
The eye is highly susceptible to the presence of light-induced oxidative stress. The
visual phototransduction occurring in the retina means that the region is regularly
exposed to damaging blue light as well as oxygen, rendering it highly susceptible to
light induced-oxidative stress (Beatty, et al., 1999). One of the functions of the RPE is
to combat against oxidative stress by absorbing damaging blue/ultraviolet light through
the presence of melanosomes in the RPE (Burke, 2011) and photoreceptor pigments
such as such as lutein and zeaxanthin (Schupp, et al., 2004). The presence of
lysosomes and phagosome in the RPE helps digests the photoreceptor outer segments
(POS) to promote regular turnover. Under increased cellular stress, the failure to digest
and remove the POS promotes the crosslinking of proteins. This crosslinking of
proteins produces pigmented, insoluble aggregates termed lipofuscin (Jung, Bader, and
Grune, 2007).
Lipofuscin is one of the two main cellular debris found in the RPE-choroid interface,
the other being drusen (Nowak, 2006). One of the major effects of lipofuscin is its
ability to reduce proteosomal activity of the RPE. One of the main substituent of
lipofuscin is -retinylidene--retinylethanolamine (A2E). The presence of A2E has
been shown to interfere with the ability of the RPE cells to phagocytose
photoreceptors, thereby increasing the presence of debris in the RPE. The disruption of
RPE metabolism can potentially be implicated in the pathogenesis of AMD
(Finnemann, 2002). In addition, A2E favours the formation of reactive oxygen species
which promote more aggregate formation. In vitro, the presence of A2E in ARPE19
cells exacerbated the cellular damage and apoptosis caused by exposure to blue light
(Sparrow et al., 2002). While lipofuscin is characteristic of AMD, whether it is a

49
secondary effect or a causative effect of AMD is unknown although there is an age-
related increase in lipofuscin formation. (Swaroop, 2009). Recently, a publication
indicated that rat subjected to zinc-deficient diet showed a much more prominent
lipofuscin aggregation than those with zinc-replete diet although the mechanism is yet
to be uncovered (Biesemeier, et al., 2011)
Apart from damages caused by oxidative stress, there are other factors which could
influence and indirectly predispose an individual to AMD. These extrinsic factors
include age, genetics, and personal habits such as smoking. AMD predominantly
occurs in people of age > 65 years old, making it the most common cause of legal
blindness in the aging population. Numerous studies have uncovered the susceptibility
loci in Chromosome 10q26, where the presence of several genes including ARMS2,
PLEKH1, and HTRA1 may predispose certain group of population to developing
AMD (Jakobsdottir, et al., 2005). As of late 2008, studies have also named people with
mutations in Complement Factor H (CFH) to be predisposed to AMD (Nan, et al
2008). Regular turnover of the extracellular matrix of Bruch’s membrane by matrix
metalloproteinases is crucial to maintain an optimal thickness of the matrix. Smoking
is a strong contributor to the pathogenesis of AMD, with the AREDS study reporting
smoking as the strongest extrinsic risk factor for AMD (AREDS, 2001).
Another hallmark of AMD is the formation of protein deposits between the RPE and
Bruch’s membrane termed drusen. Numerous publications have suggested that the
source of drusen is inflammation occurring in the RPE. (Hageman et al., 2002,
Anderson et al., 2002, Johnson et al., 2001) It is possible that the initiation of oxidative
stress exacerbated immune reaction from the RPE/choroid which amplified the
pathogenesis of AMD. Studies have reported of the upregulation of inflammatory
cytokines and immune-related proteins in AMD patients such as IL1, IL6, and TNF-α.
A recent study shows that the upregulation of IFN-γ caused by photooxidative stress of
the ARPE19 also resulted in the upregulation of CFH. CFH is an inhibitor of the
complement system which triggers pro-inflammatory complement cascade (Lau, et al.,
2011). Positive immunostaining of coagulating-factor proteins such as thrombin,
acute-phase proteins, immune-related proteins such as complement proteins, and
amyloid-β has been seen in drusen (Hageman, et al 2001). In 2005, publications
showed that a Tyr502His mutation in the CFH gene is related to increased risk of

50
developing AMD (Klein, et al., 2005, Edwards, et al., 2005). Furthermore it is possible
that in aging population, the reduction of immune function results in lowered ability to
combat oxidative stress, leaving the tissue more susceptible to AMD. The thickening
of Bruch’s membrane has been attributed to increase in tissue inhibitor of matrix
metalloproteinases (TIMP-3). Activity of TIMP-3 is crucial to regulate extracellular
matrix turnover. TIMP-3 level is increased with aging and in human AMD subjects
(Kamei, and Hollyfield, 1999).
It is crucial that the RPE functions optimally to absorb damaging blue light as well as
recycling photoreceptor outer segments. Failure to do so may result in increased
formation of drusen and lipofuscin.The presence of drusen and lipofuscin resulted in
morphological and cellular changes within the RPE, Bruch’s membrane and choroid
interface. These changes include, but are not limited to pigmentation changes in the
RPE where hypo/hyperpigmentation can occur, and failure to phagocytose
photoreceptor outer segment which affects RPE metabolism (McLeod et al 2009). The
choriocapillaris experiences a reduction in lumen diameter as well as a loss of
fenestration (McLeod et al 2009). Death of RPE cells can trigger a secondary loss of
choriocapillaris (Mullins et al., 2011, McLeod et al 2009).
51
1.6.3. Use of Zinc in AMD
Zinc modulates many antioxidants which protect against oxidative stress that might
be triggered in AMD. Antioxidants present in the Retinal Pigment Epithelium
(RPE) include catalase, metallothionein (MT) and glutathione peroxidase (GPx).
Low levels of zinc result in lowered antioxidants that leave the RPE vulnerable to
oxidative injury which in turn may trigger AMD. Tate and colleagues reported that
a reduced level of MT in cells results in less zinc being stored, and antioxidant
levels were also found to be reduced. Similarly, pigmented mice fed with a low zinc
diet were found to have increased lipid peroxidation as measured by the
thiobarbituric acid reactive assay (TBARS). The group also found a reduced MT
level in liver, RPE-choroid and retina (Miceli et al., 1999). Furthermore, lowered
zinc may affect superoxide dismutase (SOD), a zinc protein that converts O2•-
to
H2O2 to prevent harmful oxidative damage to the cellular environment (Miceli et
al., 1999). A 24% reduction in zinc concentration was found in the RPE-choroid
complex of older patients, suggesting that zinc supplementation might have a
beneficial effect in preventing AMD (Erie et al., 2009).
Clinical trials have reported mixed results regarding the use of zinc
supplementation in AMD patients. The AREDS report number eight indicated that
the consumption of 80 mg zinc oxide for 80 months in a late stage AMD clinical
trial with 312 people resulted in improvement of vision and prevents night
blindness. Furthermore, a follow-up study showed that lower oxidised cysteine or
cystine was found in subjects who took zinc supplementation for AMD. This may
indicate better protection against oxidative stress (Moriarty-Craige et al., 2007).
Conversely, a similar study with 3654 patients with early stage AMD consuming
zinc supplementation over a period of five years did not report a protective effect
against AMD (Flood et al., 2002).
Excessive intracellular zinc can result in cytotoxicity, and therefore zinc
concentration needs to be restrained within tolerable limits (Bozym et al., 2010).
Wood and Osborne (2003) reported that in human RPE cell culture, zinc
concentrationsof 25 µM are toxic if not chelated. Toxicity is likely to be caused by
production of oxidative radicals. A concentration of 18 µM of zinc reduces cell

52
viability in human RPE cell culture to 50% which is reversed once supplemented
with metabolic substrates and antioxidants (Wood and Osborne, 2003).
Intriguingly, the concentration of zinc in the RPE-choroid complex is very high, but
under normal conditions, the cells do not appear to undergo significant oxidative
stress.
The varied results found in clinical trials indicate that further studies are required
before zinc supplementation is introduced routinely as a preventative treatment of
AMD. A recent study found that sub-RPE deposits contain a very high amount of
bio-available zinc. Bruch’s membrane was found to contain 254 ppm of zinc,
meanwhile the macula contains 130 ppm and in the peripheral region of the choroid
123 ppm (Lengyel et al., 2007). However, presently there is a lack of knowledge
regarding the source of zinc in these sub-RPE deposits. It was suggested that sub-
RPE deposits may obtain its zinc from the choroid complex, and through Bruch’s
membrane. It was found that drusen form around choroidal intercapillary pillars in
older patients (Lengyel et al., 2004). With the knowledge that the overall zinc level
in the sub-RPE deposits is very high, it is interesting to speculate on the mechanism
responsible for transport of zinc to the vicinity of sub-RPE deposits. Zinc
transporter activity or expression might be improperly regulated in AMD patients.

53
1.7. Aims of the Thesis
The highest tissue concentration of zinc in man is found in the RPE/choroid
complex (Grahn et al., 2001, Karcioglu, 1982). Here zinc is required for regulating
a myriad of enzymes involved in the retinal cycle, in the phagocytic activity of the
RPE as well as the oxidative processes that are so important at the RPE-choroid
complex. We understand a great deal about the role zinc plays in enzymes and
transcription factors, but how zinc levels are regulated intra- and extracellularly in
the eye is largely unknown. As zinc deficiency had been associated with serious eye
diseases like AMD (Grahn et al., 2001) it is perhaps not surprising that zinc
supplementation is one of the most widely used preventive therapies for AMD,
despite the mixed results of recent international clinical trials (Mitchell et al., 1995,
2001, Ho et al., 2011b). In 2004, work in our laboratory reported that sub-retinal
RPE deposits, the hallmark of AMD, contained a surprising>500 ppm of zinc in the
extracellular Bruch’s membrane (Lengyel et al., 2007). How accumulation in
drusen and decrease in Bruch’s membrane and RPE cells contribute to AMD,
however is largely unexplored.
The work described thesis aimed to elucidate potential mechanisms of zinc
transport in the posterior eye and to explore the effects of altering extracellular
zinc concentration on vascular endothelium and retinal pigment epithelium.
We embarked on a series of experiments that were designed to address how the
RPE, the choroid and Bruch’s membrane change their properties in an altered zinc
environment. We used molecular and cell biology and bioinformatics as well as
studies on human cadaveric tissues to gather information on how zinc might be
involved in normal and pathological processes at the RPE/choroid interface.
1. First we aimed to identify the zinc transporter(s) at the RPE/choroid interface
in cadaveric tissues and cultured cells.
2. Then we aimed to characterize how RPE/choroid specific transporter(s)
contribute to altered zinc balance.
3. Finally, we aimed at investigating how cells respond to the modulation of
extracellular zinc environment using cellular models for RPE as well as the
fenestrated choroidal endothelium.

54
2. Materials and Methods
2.1. Reagents
Four percent paraformaldehyde (PFA) was freshly prepared using 32% PFA
(Electronic Microscopy Sciences, Hatfield, USA) diluted in Phosphate Buffer
Saline 1x concentration with neutral pH (Gibco Invitrogen, Paisley, UK). Ethanol
(VWR International, Lutterworth, UK) used are molecular biology grade with
99.9% purity.
2.2. Buffers, Solutions and Gel Preparations
4% Paraformaldehyde
7 parts deionised water
1 part 32% Paraformaldehyde
Tris-Buffered Saline 10x
200mM Trizma (Sigma-Aldrich, Gillingham, UK)
1500mM NaCl (Sigma-Aldrich, Gillingham, UK)
Make up 600 ml solution with deionised water and adjust pH to 7.4. Top up volume
with dH2O to 1000ml.
Tris-Buffered Saline Tween (TBST) 1x
900ml Deionised H2O
100ml TBS 10x
Tween20 0.1% (v/v)
SDS-Polyacrylamide Gels (10%)
For one gel, materials added in consequence:
Stacking Gel
2ml deionised water

55
1.65ml Acrylamide-Bis 30%
1.25ml Tris pH 6.8
50µl SDS10% (w/v)
25µl Ammonium Persulphate (APS) 10% (w/v)
10µl ,,′,′-Tetramethylethylenediamine (TEMED)
Resolving Gel
2ml deionised water
1.65ml Acrylamide-Bis 30%
1.25ml Tris pH 8.8
50µl SDS10% (w/v)
25µl Ammonium Persulphate (APS) 10% (w/v)
10µl ,,′,′-Tetramethylethylenediamine (TEMED)
Ammonium Persulfate (APS) 10%
10g APS (Sigma-Aldrich, Gillingham, UK)
100ml deionised H2O
Aliquot and frozen at -20oC
Sodium-Dodecyl Sulfate (SDS) 10%
10g SDS (Sigma-Aldrich, Gillingham, UK)
100ml deionised H2O

56
Blotting Buffer 10x
1500mM Glycine (Sigma-Aldrich, Gillingham, UK)
20mM Trizma
Blotting Buffer 1x
For 500ml
350ml deionised water
100ml Methanol (20% v/v)
50ml Blotting buffer 10x
5ml 0.02% SDS
Western Blot Blocking Solution
5g Non-fat Dry Milk (Bio-Rad, Hemel Hampstead, UK)
100ml TBST 1x
Running Buffer 1x
192mM Glycine (Sigma-Aldrich, Gillingham, UK)
25mM Trizma
0.1% (w/v) SDS
Ponceau S Stain 10X
1g PonceauS (Sigma-Aldrich, Gillingham, UK)
50% Acetic Acid (Fisher-Scientific, Horsham, UK)
In order to use, dilute 1:10. Stain PVDF membrane for 5 minutes with gentle
agitation before rinsing with H2O for 30 minutes on the shaker at room
temperature.

57
Lysis Buffer for Western Blot
50 mM Tris pH 7.4
150 mM NaCl
0.5% NP40
10% Protease Inhibitor Cocktail (Sigma-Aldrich, Gillingham, UK)
5x Laemmli Buffer (Sample Buffer)
250mM Tris-Cl pH 6.8
5%(w/v) Sodium Dodecyl Sulfate (SDS)
50% (v/v) Glycerol
500 mM β-Mercaptoethanol
0.02% (w/v) Bromophenol Blue
Top up with deionised water to appropriate volume
Luria-Bertani Broth (LB Broth)
4g Tryptone (Merck, Feltham, UK)
2g Yeast extract (Merck, Feltham, UK)
4g NaCl
400ml deionised water and autoclave
Luria-Bertani Agar
2g Tryptone
1g Yeast extract
1.6g NaCl
3g Agar
200ml deionised water and autoclave

58
Whenever appropriate, antibiotics were used for agar and broth at concentrations:
Ampicillin 100µg/ml
Chloramphenicol 170µg/ml
Zeocin 30µg/ml
Glycerol Stock
20µl Glycerol
80µl unpelleted bacterial culture
Immunocytochemistry Blocking Solution for All Cell Lines Apart from
BEBD5 cells.
1.16g Bovine Serum Albumin (BSA) (Sigma-Aldrich, Gillingham, UK)
0.5g Glycine
200ml PBS 1x
Immunocytochemistry Permeabilisation Solution for All Cell Lines Apart
from BEBD5
0.3% BSA
0.3% TritonX-100
In PBS 1x
Immunocytochemistry Blocking Solution for BEBD5 cells.
0.2% Fish skin gelatin (Sigma-Aldrich, Gillingham, UK)
5% Normal goat serum (Sigma-Aldrich, Gillingham, UK)
In PBS 1x

59
Immunocytochemistry Permeabilisation Solution for BEBD5 cells
0.1% TritonX-100 in PBS 1x
2.3. Antibodies
Please see Appendix 1 for a list of all the antibodies used in this study.
2.4. Sample Preparation
2.4.1. Cadaveric tissue dissection
Human cadaveric eyes not exceeding 30 hours post-mortem were used. In instances
where sclera was still attached to the back of eye, the whole eye was placed on a
Petri dish under an inverted microscope. Following removal of the lens, the ora
serrata was cut 3mm circumferentially and iris removed to facilitate the removal of
the vitreous humor. Neurosensory retina (NS) attached to the vitreous humour was
carefully isolated. Retinal pigment epithelium (RPE) cells were collected for RNA
isolation using 600 µl of lysis buffer applied directly into the eye cup. Remaining
choroid was rinsed with PBS and collected. For RNA work, RNAlater (Qiagen
GmbH, Germany) was used to preserve the quality of RNA in choroid samples and
deactivate RNAses. In order to preserve structure and morphology, tissues were
treated with 4% PFA and stored in 4oC temperature for future use.Remaining
tissues were returned back to the Department of Pathology at Institute of
Ophthalmology to be disposed of in accordance with best practise guidelines.
2.4.2. Tissue Preparation
Tissues were generally stored in RNAlater, which preserves RNA. A piece of tissue
< 30 mg in weight was dissected,and placed in a sterile blue homogenizing tube and
using hand pestle or hand held rotor, ground well to produce homogenous lysate.
2.4.3. Cadaveric Human RPE Preparation
The retina, RPE and choroid were removed in subsequent order for RNA isolation.
The anterior pole was removed from the posterior pole before removing the
vitreous from the retina. The RPE and choroid was flatmounted. Using pipette, PBS
was carefully applied onto the RPE layer to dissociate the cells. The RPE was
placed on microcentrifuge tubes before spun at highest setting (14000rpm) for 10

60
minutes to pellet it. The choroid and retina was cut to < 30mg sections for RNA
isolation purpose. 600 µl of lysis buffer or alternatively RNAlater was applied to
per 30mg tissue. The cell lysate was collected and transferred into sterile and
RNAse free 2ml tube and mixed well either by pipetting or vortexing.
2.4.4. Cell culture preparation
Cell cultures were rinsed twice with PBS 1x to remove any traces of cell culture
medium. 700 µl of lysis buffer containing protein denaturant guanidine thiocyanate
(RLT) was added to the cell culture dish. A cell scraper (BD Biosciences, USA)
was used to gather the lysate, which was then mixed by pipetting up and down in
the cell culture dish. This was then followed by standard RNA isolation procedure
as described in the manufacturer’s protocol (See section 2.5.1).
2.5. RBA Studies
2.5.1. RNA isolation
Prior to starting the procedure, RNAseZap and DNAZap (Ambion Inc, USA) was
always used to prevent contamination from genomic DNA and degradation of
RNA. The addition of β-mercaptoethanol in the lysis buffer (RLT) further
prevented RNAse activity. All RNA isolation was done using RNeasy Mini Kit
(Qiagen GmbH, Germany) following the manufacturer’s protocol. The cell or tissue
lysate collected (700µl) was transferred onto a QIAshredder column (Qiagen
GmbH, Germany), centrifuged for two minutes at 14000rpm and combined with 1x
volume of 70% ethanol. The ethanol-lysate mixture was then transferred onto the
spin column and centrifuged for 15 seconds at 10000rpm, washed once using wash
buffer RW1, followed by 15 minutes of DNAse digestion step (Qiagen GmbH,
Germany). The column was then washed again once with buffer RW1 and twice
with buffer RPE. The RNA was eluted using DNAse/RNAse free water. The
integrity of the RNA was tested using Bioanalyser (Bio-Rad, Germany) and only
samples with RNA quality indicator (RQI) value of > 7 were used. Samples derived
from cell culture regularly reach RQI value of 10, however due to potential post-
mortem RNA degradation, RQI value from cadaveric tissues do not reach RQI of
10. In order to check for potential cross-contamination between the RPE, retina and
choriocapillaris, qRT-PCR was performed with rhodopsin, RPE65 and Vascular

61
Endothelial Cadherin (VE-cadherin) for photoreceptor, RPE and endothelial
specific genes respectively. The lower RQI number and evidence for cross-
contamination (for data and explanation, refer to section 3.6) in cadaveric tissue
indicated that our results need to be perceived carefully and that a false positive
result for ZIP12 expression in RPE cannot be completely ruled out.
2.5.2. Quantification and integrity analysis
RNA concentration was measured using NanoDrop (ThermoScientific, Horsham,
UK) and only RNA with 260/280nm ratio above 1.8 was used for all experiments.
RNA integrity was assessed Bio-Rad Experion (Bio-Rad, Hemel Hampstead, UK).
2.6. DBA Work
2.6.1. cDNA synthesis
Precision Reverse Trancription Kit (PrimerDesign, Southampton UK) was used for
cDNA synthesis according to the manufacturer’s guide. For every cDNA synthesis
reaction, 2.5 µg RNA template was used. A mixture of oligo-dT primers and
random nonamer primers (2 µl), dNTP (1µl), RNA and water were added in a thin-
walled 500 µl microcentrifuge tubes. Samples were heated with lids closed for 5
minutes at 65oC, followed by immediate cooling on ice before 4 µl of MMLV 5x
buffer, 5.2 µl of RNA-DNAse-free water, and 0.8 µl of MMLV enzyme were
added. The reaction was placed on 42oC hot block for 60 minutes and following
that stored at -20oC until used. See below for detailed protocol.
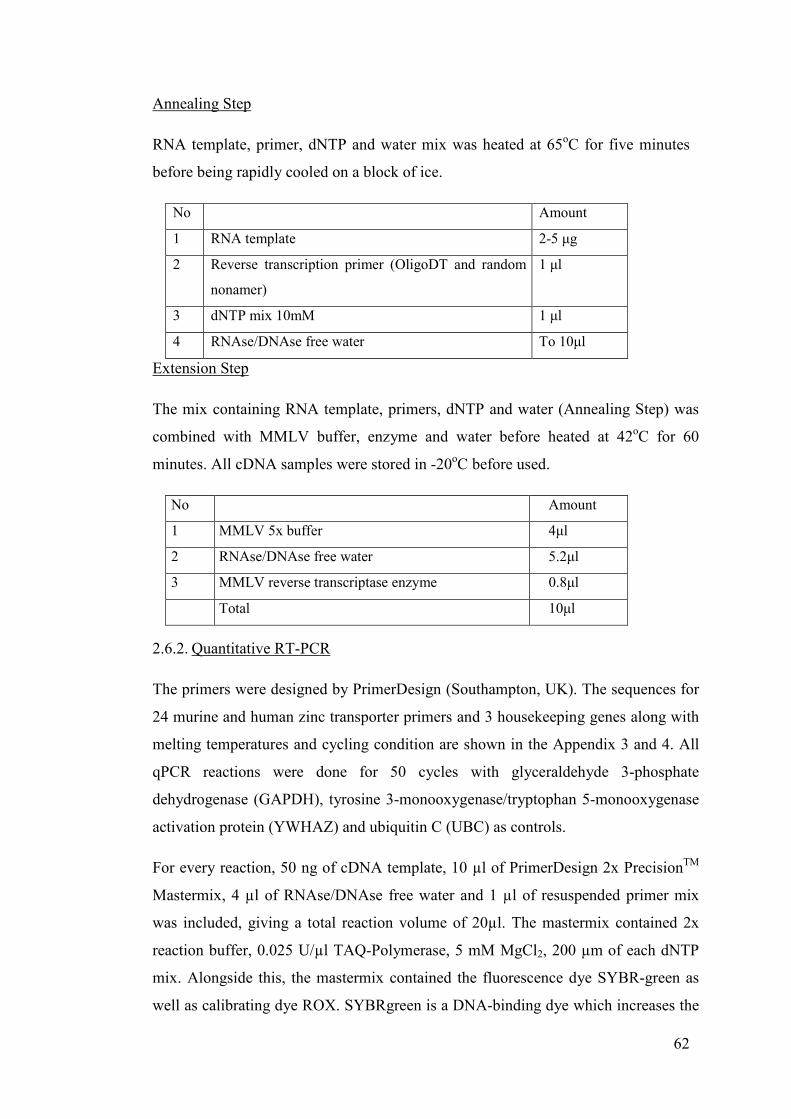
62
Annealing Step
RNA template, primer, dNTP and water mix was heated at 65oC for five minutes
before being rapidly cooled on a block of ice.
No Amount
1 RNA template 2-5 µg
2 Reverse transcription primer (OligoDT and random
nonamer)
1 µl
3 dNTP mix 10mM 1 µl
4 RNAse/DNAse free water To 10µl
Extension Step
The mix containing RNA template, primers, dNTP and water (Annealing Step) was
combined with MMLV buffer, enzyme and water before heated at 42oC for 60
minutes. All cDNA samples were stored in -20oC before used.
No Amount
1 MMLV 5x buffer 4µl
2 RNAse/DNAse free water 5.2µl
3 MMLV reverse transcriptase enzyme 0.8µl
Total 10µl
2.6.2. Quantitative RT-PCR
The primers were designed by PrimerDesign (Southampton, UK). The sequences for
24 murine and human zinc transporter primers and 3 housekeeping genes along with
melting temperatures and cycling condition are shown in the Appendix 3 and 4. All
qPCR reactions were done for 50 cycles with glyceraldehyde 3-phosphate
dehydrogenase (GAPDH), tyrosine 3-monooxygenase/tryptophan 5-monooxygenase
activation protein (YWHAZ) and ubiquitin C (UBC) as controls.
For every reaction, 50 ng of cDNA template, 10 µl of PrimerDesign 2x PrecisionTM
Mastermix, 4 µl of RNAse/DNAse free water and 1 µl of resuspended primer mix
was included, giving a total reaction volume of 20µl. The mastermix contained 2x
reaction buffer, 0.025 U/µl TAQ-Polymerase, 5 mM MgCl2, 200 µm of each dNTP
mix. Alongside this, the mastermix contained the fluorescence dye SYBR-green as
well as calibrating dye ROX. SYBRgreen is a DNA-binding dye which increases the

63
level of fluorescence when encountering double stranded DNA. ROX was included
as a baseline for the RT-PCR, normalising for pipetting error. Furthermore, for
SLC39A12, a TaqMan style primer was designed to confirm observations from the
SYBRgreen primer. The Applied Biosystems 7900 HT RT-PCR machine was used
for all experiments. The cycling condition for the RT-PCR was done in four steps,
comprising enzyme activation at 95oC for 10 minutes, 50 cycles of enzyme
denaturation for 15 seconds at 95oC and data collection using the SYBRgreen dye for
60 seconds at 60oC. This was followed by a melt curve analysis to check specificity.
At least duplicates and a non-template control were performed for every single
primer.
The data were analysed using the relative quantification method. The relative
quantification method measures the fold difference in gene expression through ratio
of crossing point (Ct) values normalized to ratio Ct values for the housekeeping
genes. This method was chosen, as it does not require standards with known
concentration as needed by the absolute quantification method, the accuracy of
which is often disputed. The algorithm for the relative quantification is shown as
follows:
Relative Expression = 2-(∆∆Cp)
∆∆Cp = ∆CpGene of Interest - ∆CpCalibrator
∆CpGene of Interest = CpGene of Interest – Average Ct Housekeeping genes
∆CpCalibrator = Cp calibrator – Average Ct Housekeeping genes
Equation 1–The relative expression between two genes is calculated using the
relative expression formula.
64
The relative expression for two genes was calculated by measuring the ∆Ct for the
calibrator and gene of interest separately. The calibrator can be any other genes in the
set of genes. In general, we made a comparison with the same gene from different
sample. We use three housekeeping genes as normalisers, GAPDH, UBC and
YWHAZ. These three genes were chosen based on geNorm software analysis against
12 other reference genes performed by PrimerDesign (Southampton, UK) on retinal
cDNA to represent eye samples. GAPDH, UBC and YWHAZ were the three most
stable reference genes and were therefore chosen for this study. The raw cyclic data
for the three genes were averaged using the GeoMean function in Microsoft Excel.
2.6.3. DNA clean up
2.6.3.1. EtOH precipitation
For every 10µl of the sequencing reaction, 40µl of 80% ethanol was added and the
whole mixturevortexed. The mixture was left on ice for 10 minutes before
centrifuging for 10 minutes at 4oC. After aspirating the 80% ethanol, 180µl of 70%
ethanol was added before 5 minutes of centrifugation at maximum speed at 4oC. 25µl
Millipore filtered water was used to resuspend the dried DNA pellet.
2.6.3.2. Millipore Montage system
This was used as per the company protocol. In brief, the DNA product to be purified
was applied onto the Millipore blue plate, vacuumed to dryness before two washes of
25µl each with the washing buffer was carried out.
2.6.4. Agarose gels
DNA/ PCR samples were run on 1% (w/v) agarose gels dissolved in 1x TAE buffer
at 100V with 1% Orange G in glycerol as a loading buffer. Ethidium Bromide was
incorporated into the gel for visualisation under ultraviolet light. See below for
agarose gel preparation.
3g Agarose (Sigma-Aldrich)
300ml deionised H2O
After boiling in a microwave oven the solution was left to cool slightly and ethidium
bromide added at 0.5µg/ml

65
2.6.5. DNA sequencing
All sequencing was performed using Applied Biosystems 3730 DNA Analyzer. Each
of the sequenced DNA sample contained 3µl of plasmid DNA, 2.5µl of sequencing
buffer, 0.5µl of BigDye 3.1, 0.5µl of 100µM primer and deionised water to 20µl total
volume. The reaction mix was then placed at 96oC for 10 seconds, 50
oC for 5
minutes and 60oC for 4 minutes for 25 cycles before purified either using ethanol
precipitation or Millipore montage system. For detailed information on sequencing
condition and materials, see Appendix 4.
2.7. Protein Studies
2.7.1. Western Blot
Most of the experiments were carried out on BioRad AnyKD precast gels or 10%
SDS-Polyacrylamide gels (for gel preparation, please see section 2.2). Cells and
tissues were lysed in lysis buffer (See section 2.2) on a rotator at 4oC for one hour.
Lysed tissues or cells were denatured with 5x Laemmli buffer and boiled for 5
minutes at 90oC before being run on polyacrylamide gels. Twenty micrograms of
sample were used unless stated and triplicates of experiments were performed unless
stated. The self-casted gels were run at 70V for 30 minutes before the voltage was
increased to 100V. The precasted gels were run at 120V until the smallest molecular
weight marker reached the end of the gel. The gels were sandwiched with a PVDF
membrane (Bio-Rad) between four sheets of Whatman filter paper (two on each
side). Protein immobilisation was done on Bio-Rad Criterion system at 90-100V for
90 minutes each time at 4oC. Following this, 1x Ponceau S solution was used to
visualise and check protein transfer and rinsed before placing the membrane on
blocking solution for at least 30 minutes. Depending on the antibody, antibody
incubation was carried out at room temperature for two hours, or at 4oC overnight
with rotation. Secondary antibody incubation (anti-HRP) was done at room
temperature for one hour. All incubation procedures were followed by three washing
steps of ten minutes each with TBST 1x. The protein was visualised using ECL
(Calbiochem) and films (Amersham).

66
2.7.2. In Vitro Translation
Each in vitro translation reaction contained:
20 µl TNT Quick Mastermix
0.5 µl Methionine 1mM
1 µl DNA template (1µg)
3.5µl Nuclease free H2O
Incubation was carried out at 30oC for 90 minutes, and the reaction mixture stored in
-20oC prior to use.
In order to determine the molecular weight of the protein, TNT Quick Coupled
Translation system was used. The pcDNA3.1 vector which was amplified,
contained the T7 polymerase promoter required for the translation system. All
materials were assembled in a microcentrifuge tube and left to incubate at 30oC for
90 minutes. The resulting product was diluted 1:4 before being run on gel as per
described in the Western blot protocol in Section 2.7.1.
2.7.3. Bichinconinic Assay
The Bichinconinic Assay (BCA) assay was used to determine protein concentration
in tissue lysates for Western blot. The tissues were lysed as per normal, and BSA
standards were serial-diluted in the lysis buffer ranging from 0-2000 µg/ml. The
proprietary BCA working solution was mixed with CuSO4 solution at 1:50 dilution.
Equal amounts of sample/ standard were mixed with the working solution and
incubated at 37oC for 30 minutes. Two µl of samples and standards were measured
on the Protein BCA program on the Nanodrop. None of the materials in the lysis
buffer were found to interfere with the assay.
2.7.4. Transient Expression of protein in cells
The plasmid DNA generated was used to transfect various cell lines with different
success rate. HEK293T and CHO cells were relatively easier to transfect than RPE
cell lines. A day before transfection, cells were grown on 24 well plates with
coverslips. BEND5 and ARPE19 cells were seeded at 30000 cells density. HEK293

67
cells were seeded at 60000 cells. All cells transfected were grown to a density of
80-90% in media supplemented with fetal calf serum but without antibiotics. Eight
hundred ng of DNA was used with four µl of Lipofectamine2000 diluted in Opti-
Mem reduced serum media. After incubation for four hours, the transfection media
was topped up with twice as much media and left for 24-48 hours.
2.8. Cell Culture
2.8.1. Cell lines
All of the cell lines were cultured in 37oC humidified chamber with 95% air and
5% CO2. For complete list of cells used in this study, and their growing conditions,
see Appendix 2.
2.8.2. Propagation and Freezing
Frozen vials were rapidly warmed and warmed supplemented media added. The
cells were left overnight to attach before changing to fresh media. Confluent cells
were detached with 1x Trypsin-EDTA, neutralised with serum-supplemented
DMEM and centrifuged at 800rpm for three minutes before being resuspended and
seeded at appropriate density. The density of the cells was determined using a
haemocytometer after dilution of 1:1 with trypan blue. In order to ensure there were
enough nutrients for the cells, for every cm2 in a confluent flask, 0.3 ml of complete
medium was added.
On average, 3x10⁶
cells were frozen in a vial. Following standard trypsin-EDTA
detachment and centrifugation, the cell pellets were resuspended inmedium
comprising of of 50% DMEM, 40% FCS, 10% DMSO filtered in 0.2 µm Millipore
syringe. Following this the cells were transferred to a 1.8 ml cryovial (Fisher
Scientific, Loughborough, UK) cell freezing container (Nalgene) and placed in -
80oC for a day before transferring to liquid nitrogen.

68
2.8.3. Cytotoxicity Assay
The calcein assay was used to determine cell death. A 1mM stock of calcein dye
(Invitrogen, Paisley UK) was diluted 1:1100 with warm 1x PBS. Propidium iodide
was added at 1:400. The solution was used to incubate cells for 15-20 minutes at
37C (standard cell culture condition) before visualised with a fluorescence
microscope. Positive propidium iodide staining indicated non-viable cells as the
dye is cell impermeant. The calcein dye shows viable cells.
2.8.4. Cell Proliferation Assay
AlamarBlue solution was purchased from ABDSerotec (Kidlington, UK). Cells
were seeded at 5000 cells per well on a 96-well plate to match the cell density in
the other experiments with 200µl growth media. After incubation for 1-6 days to
identify with the other experimental conditions, 10% (volume of media to volume
of Alamar Blue added) of undiluted AlamarBlue solution was added and left to
incubate for 2 hours before its absorbance measured at 600nm and 450nm on a
plate reader. Calculations for the absorbance were made according to the equation
provided by the manufacturing company and presented as percentage reduction of
AlamarBlue. As controls, cells without zinc treatment were used and as blanks,
absorbance of growth media without zinc added was measured. It was pre-
determined that the addition of zinc does not affect AlamarBlue absorbance.
2.8.5. Wholemount TEM preparation
Nickel grids 3.05mm (TAAB Microscopy, Aldermaston, UK) were rinsed in
acetone to remove grease. The grids were then placed on top of 1% formvar film
floating on a glass container before being covered with sterile coverslips; averaging
three grids per coverslip. A non-coated glass slide was then used to sweep the film-
grid-coverslip layer from the water. The resulting product was left to dry under a
culture hood for 24 hours. The film-grid-coverslip layer was then carbon-coated
before being sterilised for 30 minutes under the ultraviolet lamp. Following this, the
sterilised coated grids were covered with 1% gelatine for 30 minutes under the cell
culture hood before aspirated and rinsed with PBS 1x once. Twenty five thousand
cells were seeded onto the grids overnight before media containing 125 µM
ZnSO4in growth media was applied onto the cells for a further 20 hours. As a

69
negative control, untreated samples were used, and as a positive control for
fenestrae formation, cells were treated with 1.25µM Latrunculin A diluted in
growth media for three hours. Post-treatment, the cells were immersed in
Karnovsky’s solution and left fixing overnight at 4oC. The cells were then washed
twice for five minutes each with PBS1x solution. Freshly diluted 1% osmium
tetroxide (OsO4) was used to post-fix the cells for 30 minutes. Care was taken to
remove and discard the OsO4 waste, and cells were washed in distilled water for
three times five minutes each. Cells were then placed on serial ethanol dilution for
five minutes each time, going from 30%, 50%, 70%, 80%, 90%, 95%, 100%, 100%
and a final 100%. Cells were rinsed and incubated for three minutes in
hexamethyldisilazone (HMDS) at room-temperature before any solutions were
aspirated and the coverslips left to dry overnight.
2.8.6. Transepithelial Resistance Measurement
Transepithelial resistance measurements of ARPE19 cells were done using ECIS
Zθ Disposable 8-Electrode Array (Applied Biophysics, USA). Prior to seeding with
cells, each of the 8 wells in the array was incubated in a 10mM cell-culture grade
cysteine solution (Sigma Aldrich, UK). Following cysteine treatment, the wells
were washed once with sterile distilled water and incubated in media for 30 minutes
at standard incubating condition before 20,000 cells were seeded on each well. The
arrays were then attached to the ECIS Zᶿ machine and placed in an incubator. The
use of the ECIS Zθ machine prevented the arrays from being removed as this would
introduce inconsistencies in the reading, therefore, the arrays were not taken off and
media was not replaced for the period of 6 days of which measurements were taken.
2.9. Immunohistochemistry /Immunocytochemistry and Zinc Visualization in
vitro
2.9.1. Fixation
PFA/Triton
Cells were fixed with freshly diluted 4% PFA in 1x PBS at room temperature for 20
minutes. PFA solution was discarded, and 300µl of 1x PBS-Triton (See Section
2.2) was added per well in a 24 well plate. Following this, blocking buffer was

70
used to wash the cells twice, before incubating in the same buffer for at least 20
minutes.
Methanol
Ice cold methanol was added onto cells and immediately placed in a -20oC freezer
for five minutes. After methanol was aspirated, cells were rinsed once with PBS
before beingreplaced with PBS for at least 5 minutes at room temperature. Blocking
buffer (as described in section 2.2) was used to block the cells for at least 20
minutes.
2.9.2. Immunohistochemistry (Only BEND5)
The cells were seeded at 3.3x10⁴cell density on glass coverslips in 24 well
platewith 1% bovine gelatine as coating. Cells were left overnight to allow the cells
to attach before being treated with either various ZnSO4 concentrations or 1.25 µM
Latrunculin A (LA) for 20 or 3 hours respectively and left to incubate at 37oC.
Freshly made 4% PFA was used to fix all the cells for 10 minutes followed by two
PBS 1X washes and stored at 4oC. Before staining, the cells were treated with 0.1%
Triton X-100 in PBS1x to permeabilise cells for 15 minutes. The antibodies were
diluted in blocking buffer (see section 2.2) and incubated for one hour with both
primary and secondary layers before washing three times with washing buffer (see
section 2.2) for two minutes each. The rinsed coverslips were placed cell side down
on a glass microscopic slide with 10 µl of Vectashield mounting media containing
DAPI stain (Vector Laboratories). All images were taken usingfluorescence or
LSM700 confocal microscopy.
2.9.3. Immunohistochemistry (All other cell lines)
The cells were seeded at optimum density on glass coverslips in 24-well plate. Cells
were left overnight to allow the cells to attach. Freshly made 4% PFA or ice cold
methanol was used to fix the cells for 20 minutes at room temperature or 5 minutes
at -20oC, followed by two PBS 1X washes and stored at 4
oC. Before staining, the
cells were treated with 0.3% Triton X-100 in PBS1x to permeabilise them for 5
minutes. The antibodies were diluted in blocking buffer (see section 2.2) and
incubated for two hours (primary) and one hour (secondary) before washing three
times with washing buffer (see section 2.2) for two minutes each. The rinsed

71
coverslips were placed cell side down on a glass microscopic slide with 10 µl of
Vectashield mounting media containing DAPI staining (Vector Laboratories). All
images were taken using fluorescence or confocal microscopy.
2.9.4. Zinc probes
Prior to treatment, cells were washed twice with pre-warmed PBS1x solution to
remove traces of phenol red. A 5mM stock of zinc selective dye ZinPyr-1 was
diluted to 1µM concentration in pre-warmed DMEM high glucose media without
phenol red. The cells were incubated with the dye for 10 minutes at 37oC standard
incubating conditions. Following three washes in DMEM-high glucose media
without phenol red, preparations was immediately visualised live using Olympus
BX51 using 20 x magnifications. All images were using the same exposure. Image
analysis was done using Image J.
2.10. Cloning Strategies
ZIP12 was cloned using Gateway Technology (Invitrogen, Carlsbad USA).
SLC39A12 was cloned by PCR using retinal cDNA (gift from Dr. Amna Shah).
The PCR was performed using specially designed AttB primers. Fifty fmol of the
PCR product was purified using ethanol precipitation and incorporated into the
entry and expression vectors using BP clonase and LR clonase enzymes
respectively. The transformed bacteria were plated on LB agar containing the
appropriate antibiotics selection. A single colony was picked and incubated in LB
broth also with appropriate antibiotics before purification using miniprep and
maxiprep kits. The clones were checked for mutations and correct insertions by
using restriction enzymes and sequencing. Upon sequencing, it was discovered that
the retinal cDNA had a known silent polymorphism, as this do not change the
amino acid sequence, the resulting clones continued to be used.
2.10.1. Cloning Primer Designs
The PCR primers (for list see Appendix 3) were designed according to criteria from
Invitrogen. The forward primers contained four guanine residues at the 5’ to promote
binding, a 25bp attB1 sequence and a TC base pair to maintain the reading frame.
This was followed by a Kozak sequence (ACCATG), which aids the expression of
eukaryotic proteins and the first 25bp of SLC39A12 sequence. A similar design

72
procedure was applied to the reverse primers, with also four guanine residues, 25 bp
of attB2 sequence and an additional base pair to maintain the reading frame. For N-
terminal fusion proteins, the stop codon remained a part of the 25bp SLC39A12
used, for the C-terminal fusion proteins, it is important to remove the stop codon to
allow translation of the tag protein.
2.10.2. Cloning PCR
Each Cloning PCR reaction contained
2.5µl 2mM dNTPs
1.0µl 25mM MgSO4
2.5µl 10 x KOD-PCR buffer
0.75µl AttB-Forward primer 0.3µM final concentration
0.75µl AttB-Reverse primer 0.3µM final concentration
0.5 µl Enzyme – Kod Polymerase (1.0 U/µl)
1.0 µl CDNA/ Plasmid DNA template
PCR grade nuclease free water was used to make up to 25µl
A Veriti (Applied Biosystem, UK) thermal cycler was used. The PCR conditions
comprised a two minute denaturation step at 95oC and 35 cycles of 15 seconds at
95oC, 30 seconds primer annealing step at 60
oC and 41 seconds elongation step at
72oC.
2.10.3. Expression vectors
For figures of vectors, please refer to Appendix 6.
pDONR201/Zeo (Invitrogen) was used to create the entry clone for full-length
ZIP12 protein.
pcDNA3.2/V5-DEST (Invitrogen) was used to create the full-length ZIP12 with C-
terminal V5 tag fusion protein.
pcDNA-DEST47 (Invitrogen) was used to create the full-length ZIP12 with C-
terminal GFP tag fusion protein.

73
2.10.4. Transformation of ccdB cells/ E.Coli
Transformation of competent cells with DNA was performed according to the
manufacturer’s protocol. One aliquot (200µl) of DH5α (Invitrogen, UK) was
defrosted on ice and the completed BP/LR Clonase reaction added and incubated
for 30 minutes. Following a 45 second heat shock step at 42oC, super optimal broth
(SOC) media was added and the sample placed at 37oC shaking cabinet for one
hour. The transformed cells were pelleted before being re-suspended and plated
onto LB agar plates with antibiotic supplements.
2.10.5. Purification of Proteins
A single colony was picked using a plastic picker, and immediately transferred onto
a 5ml LB broth with appropriate supplementation of antibiotics (See section 2.2 for
concentrations) before incubated at 37oC with 200rpm agitation for at least 16
hours. Following this, Wizard Plus SV Miniprep (Promega, UK) was used to purify
the plasmid. Two ml of the overnight culture was centrifuged to produce a pellet,
which was re-suspended, lysed and neutralised with the buffers provided by the kit.
After centrifugation, the supernatant was collected and transferred to the miniprep
column before endotoxin removal solution and multiple washes were performed to
purify the protein. Proteins were eluted in nuclease free H2O, and protein content
measured with NanoDrop. Upon sequencing and restriction analysis to confirm the
right orientation and sequence of clone, a maxiprep was done to produce enough
plasmid for transfection. Fifty µl of glycerol stock was added to five ml of LB broth
before placing in the 37oC shaker for six hours and transferred onto 100ml LB broth
and incubated for 16 hours. GenElute HP Endotoxin-Free Plasmid Maxiprep Kit
(Sigma Aldrich, UK) was used to isolate DNA for maxipreps following the
protocol provided. The culture was then pelleted and re-suspended before being
lysed.The supernatant was purified through the syringes provided and washed to
remove contaminants. Nuclease free water was used to elute the DNA. The
resulting DNA was precipitated using ethanol precipitation and the concentration
measured using NanoDrop. All plasmid constructs were aliquoted and stored at
-80oC.

74
2.10.6. Glycerol Stock
Glycerol was added to bacterial culture at a ratio of 1:4 before transferring into -
80oC freezer for storage.
2.10.7. Restriction Digests
All enzymes used were supplied by Promega (UK).
Each restriction digest contained:
1µl of plasmid construct (approximately 0.5µg)
0.5µl of restriction endonucleases
1.0µl Buffer (depends on endonuclease used)
Water to 10µl
DNA digests were run for one hour at 37oC and resulting digest product was run on
1% agarose gel and visualised under UV light.
2.11. Statistical Analysis
Data presented in figure 4.25 is average fluorescence value ± standard deviation
Statistical analysis for figure 4.25 was performed using Student’s T-test, between
sham and transfected group and P value (< 0.01) was observed.

75
3. Expression of Mammalian Zinc Transporters in
the RPE and Choroid
There is little known about the presence and expression of zinc transporters in
the eye. The work described in this chapter aimed to use quantitative RT-PCR
to catalogue the presence and determine the relative expression levels of the 10
SLC30A (ZnT) and 14 SLC39A (ZIP) mammalian zinc transporters in the
retinal pigment epithelium and choroid. For this, we used RBA isolated from
ARPE19 (spontaneously immortalised human RPE cell line), SHEF-1 cells (a
human embryonic stem cell-derived human RPE cell line), primary human
RPE cells at passages (4 and 12), primary cultures of Muller cells, and human
retina, RPE and choroid dissected from cadaveric eyes. The primers were
designed and optimised by PrimerDesign Ltd and all data were normalised
against three housekeeping genes, GAPDH, YWHAZ and UBC. After
cataloguing the relative expression levels of the 24 zinc transporters, we found
widespread expression of the majority of zinc transporters, although
expression levels did vary between different cell types. Through this
comparison, we identified one striking anomaly in expression levels that may
have relevance for zinc homeostasis at the RPE-choroid interface. We found
that the expression of SLC39A12 gene encoding zinc transporter ZIP12 is
highly expressed in freshly isolated cadaveric RPE cells but absent in the
cultured cells tested. Based on this observation, we specifically analysed this
gene and its protein product in Chapter 4.2
2Several parts of this chapter (Section 3.6) have been published in Barzegar-
Befroei, N., Cahyadi, S., Gango, A., Peto, T., and Lengyel, I. 2011. Zinc in Eye
Diseases. Zinc in Human Health, Editor: Lothar Rink.IOS Press Amsterdam (see
Appendix)

76
3.1. Intracellular Zinc Transport
3.1.1. SLC30A Family of Transporters
The SLC30 gene codes for a family of zinc transporters (ZnTs) which are
ubiquitously expressed in all organisms (Liuzzi and Cousins, 2004b). The ZnT
family of transporters specifically promotes the transport of zinc from the cytosol to
extracellular environment or compartmentalise zinc into organelles within the cell.
ZnTs possess six transmembrane domains with a variable region between domains
III and IV, which contains many histidine residues able to bind zinc. Loss of zinc
transporters due to gene mutations or incorrect translation of mRNA has been
reported to result in various pathological conditions, which may include embryonic
lethality, incorrect absorption of zinc, reduced body fat and weight in mice (Huang
et al., 2007) and lethal milk syndrome caused by a mutation in the SLC30A4 gene
encoding the ZnT4 protein (Murgia et al., 2006). The distribution of ZnTs is
widespread; although some are cell-specific (Redenti and Chappell, 2004b,
Palmiter and Huang, 2004).
3.1.2. SLC30A1 / ZnT1
The SLC30A1 gene codes for the ZnT1 protein, which is an ubiquitous zinc
exporter protein that functions to reduce intracellular zinc concentration and that
has been described as “conferring resistance to zinc” (Palmiter and Findley, 1995).
Northern blot analysis showed that in rat, SLC30A1 mRNA was present in the
kidney, small intestine, adipose tissue, liver, spleen and thymus tissues (Liuzzi et
al., 2001b). The protein was found in placenta, kidney, small intestine, and
moderately expressed in adipose tissue, liver, spleen and thymus. In the mouse
gastrointestinal tract, ZnT1 was found to be differentially expressed within the
small intestine, where it was found in the basolateral membrane of the epithelium of
esophagus, duodenum of the small intestine and cecum of large intestine (Yu et al.,
2007). Within the brain, ZnT1 is expressed in the choroid plexus of mice and rat
(Wang et al., 2004b, Chowanadisai et al., 2005).
The evidence that ZnT1 is very widely expressed in almost all tissues on the plasma
membrane suggests that ZnT1 protein acts as the main form of transporter involved
in absorption or zinc transfer (Liuzzi et al., 2001b). The importance of ZnT1 was

77
shown by knock-out studies using Drosophila melanogaster where removal of ZnT1
caused failure of development, and death of larvae due to zinc deficiency (Wang et
al., 2009b). ZnT1 expression is only activated under excessive zinc condition,
where N,N,N',N'-tetrakis(2-pyridylmethyl) ethylenediamine (TPEN) treatment in
HeLa cells was found to increase gene expression of other zinc transporters but not
ZnT1 (Devergnas et al., 2004). Transcription of SLC30A1 is under the control of
MTF1 (Kambe et al., 2004, Palmiter and Huang, 2004). The expression of
SLC30A1 is sensitive to the concentration of extracellular zinc where animal
studies have shown that cells treated with low concentration of zinc upregulated
expression of SLC30A1. It is thought that the upregulation of intracellular zinc may
be caused by zinc absorption or zinc export from intracellular organelles (Bury et
al., 2008).
In disease states, expression of SLC30A1 was upregulated for 24 hours after
ischemic shocks but decreased afterwards (Tsuda et al., 1997). Decreased
immunolabeling of ZnT1 was observed in preclinical Alzheimer’s disease in human
brain samples which points to the involvement of zinc and dysregulation of zinc
homeostasis in the development of AD (Lyubartseva et al., 2010). Huang and
colleagues reported that there is a concentrated immunolabeling of many ZnT
transporters including ZnT1 in Aβ plaques in the cortex of brains of Alzheimer’s
disease subjects. As these were more concentrated in the plaques, it was
hypothesised that there is increased transport of zinc by the transporters (Zhang et
al., 2008).
3.1.3. SLC30A2/ ZnT2
SLC30A2 gene codes for the ZnT2 zinc transporter protein. The mRNA expression
of this gene was reported in the small intestine, kidney, placenta, prostate,
mammary gland and liver using Northern blot analysis (Palmiter and Huang, 2004).
ZnT2 protein is located on endosomal vesicles and functions to reduce the cytosolic
zinc concentration (Liuzzi and Cousins, 2004b). In enterocytes, ZnT2 was shown to
be located in the apical surface of microvilli, with vesicles nearby (Kambe et al.,
2004). ZnT2 is located in the vesicles in M1 human fibroblast cells and functions to
move zinc to lysosomes, replacing the role of M1 protein in cells (Falcon-Perez and
Dell'Angelica, 2007). There are two isoforms of ZnT2 protein which codes for

78
proteins of 42 and 35 kDa respectively. The 42 kDa ZnT2 is localized to the
endosomal compartment and is the major zinc transporter. The 35 kDa ZnT2 is
located on the plasma membrane, and shows lower expression compared to the
larger, 42 kDa isoform. Overexpression of these proteins lead to sequestration of
zinc (Lopez and Kelleher, 2009).
ZnT2 mRNA expression is sensitive to changes in zinc concentration, and ZnT2
has been suggested to mainly function in protecting cells from sudden increases in
intracellular zinc concentration (Liuzzi et al., 2001b). Zinc rich diet in rats led to
370% increase of ZnT2 mRNA in the small intestine and kidney although its
expression was negligible under a zinc deficient diet. Exposure of porcine capillary
endothelial cells to 50 µM/L zinc causes upregulation of ZnT2 which remains for
96 hours (Bobilya et al., 2008).
3.1.4. SLC30A3/ ZNT3
The SLC30A3 gene codes a 40 kDa ZnT3 protein. The mRNA has been detected in
both the brain and testis of rodents, although so far, the protein has only been
detected in the brain. ZnT3 mRNA has been found as early as three days before
birth, and reaches its expression peak three weeks post-natally. ZnT3 localises to
the synaptic vesicles, which indicated that they may aid in the process of
neuromodulation, or zinc storage (Liuzzi and Cousins, 2004b). Lysosomal
localisation of ZnT3 protein has been reported (Wang et al., 2004b). This lysosomal
immunolabeling was found in fenestrated endothelial cells of the mouse choroid
plexus. Furthermore, zinc-selenide metallography was able to detect bioavailable
zinc in the apical membrane of mouse choroid plexus endothelial cells which
suggests that ZnT3 aids in regulating zinc homeostasis in the choroid plexus of the
brain (Wang et al., 2004b).
In the brain, zinc has been widely acknowledged as one of the key factors in the
elongation of aggregated amyloid-β protein, which leads to the development of
Alzheimer’s disease. A ZnT3 knock out mouse model was found to be protected
from the aggregation of amyloid-β protein (Kambe et al., 2004). In INS1-E rat
pancreatic β-cell cultures, there is a positive correlation between glucose
concentration in the media and expression of ZnT3 but not many other zinc

79
transporters. This implies that in a high glucose environment, ZnT3 plays an
important role in zinc and glucose metabolism, which may be crucial in diabetes
(Sondergaard et al., 2005).
3.1.5. SLC30A4/ ZnT4
The SLC30A4 gene is highly expressed in various epithelial cells especially those
involved with absorption, such as the small and large intestine. Consistent but low
expression was found in liver, kidney, spleen, thymus, muscle, adipose tissue and
mammary glands (Liuzzi et al., 2001b). ZnT4 proteins are localised in the vesicles,
golgi apparatus and endosome. Immunohistochemistry revealed ZnT4 expression in
the large intestine in mice (Yu et al., 2007) and in the apical part of fenestrated
choroid plexus epithelial cells (Wang et al., 2004b). ZnT4 has also been found in
basal cell vesicles of mouse polarised Caco-2 intestinal cells. Studies in humans
and rats have shown that SLC30A4 gene expression is not elevated in zinc
sufficient or enriched conditions (Liuzzi and Cousins, 2004b). Based on this, it is
suggested that ZnT4 aids absorption of zinc and sequestration into vesicles, until it
is needed by the cell (Murgia et al., 2006).
A mutation in SLC30A4 gene has been associated with lethal milk syndrome in
mice. The recessive single-point mutation in the termination codon results in the
formation of defective protein (Murgia et al., 1999).
3.1.6. SLC30A5/ ZnT5
The SLC30A5 gene encodes zinc transporter ZnT5 protein, which is selectively
expressed on the apical side of insulin containing pancreatic-β cells as opposed to
insulin secreting acinar and α-cells (Palmiter and Huang, 2004). Two splice
variants differ in their C and N terminal regions. Variant A has been expressed in
the Golgi, meanwhile variant B ZnT5 protein can be seen in the cytosol as well as
the plasma membrane (Thornton et al., 2011).
ZnT5 mRNA is found in the duodenum and in the parietal cells of the stomach,
while the protein can be found in the gastric mucosa as well as the crypts of
Lieberkuhn (Yu et al., 2007). ZnT5 is involved in the reabsorption of zinc in the
gastrointestinal tract, as well as delivery of alkaline phosphatase in the secretory
pathway (Yu et al., 2007). In a human intestinal cell line, CACO-2, ZnT5 isoform

80
B was found to be expressed in the cell’s plasma membrane. The study showed that
ZnT5 isoform B was able to decrease as well as increase intracellular zinc
concentration (Thornton et al., 2011).
3.1.7. SLC30A6/ ZnT6
SLC30A6 mRNA has been shown to be expressed in the liver, kidney and brain,
but the protein is only detected in the brain and lung (Palmiter and Huang, 2004).
The function of ZnT6 protein is to transport zinc from the trans-Golgi network to
cell periphery (Kambe et al., 2004). In mouse gastrointestinal tract, ZnT6 mRNA
expression was found in the goblet cells of stomach, and columnar epithelial cells,
where the protein is concentrated in the perinuclear and peripheral part of the crypts
of the columnar epithelial cells (Yu et al., 2007). Immunochemistry showed that
the ZnT6 protein is expressed in the epithelial cells of choroid plexus (Wang et al.,
2004b). In preclinical Alzheimer’s disease in human brain samples, it was shown
using immunostaining for tau-protein marker, that ZnT6 was increased significantly
(Lyubartseva et al., 2010) possibly indicating involvement of ZnT6 protein in AD.
3.1.8. SLC30A7/ ZnT7
SLC30A7 mRNA expression is found in various tissues, but the protein is only
present in the small intestine and lung. In contrast to other ZnT family of
transporters that are required for absorption process, ZnT7 is located in the
perinuclear vesicles of the Golgi apparatus. In mouse choroid plexus,
immunoreactivity of ZnT7 is strongest on the cis-side of the Golgi apparatus
(Liuzzi and Cousins, 2004b). In the gastrointestinal tract of mice, immunochemistry
showed that ZnT7 mRNA is expressed in all parts of the small and large intestine,
Goblet cells in cecum, colon and rectum stain heavily for the ZnT7 protein,
presumably reflecting a role in zinc reabsorption in the gastrointestinal tract (Liuzzi
and Cousins, 2004b). ZnT7 is also required in mice for fat metabolism and zinc
homeostasis. ZnT7 null mice were found to have lowered zinc concentration in the
serum, liver, duodenum, brain, bone and low body weight and body fat for age
(Huang et al., 2007).

81
3.1.9. SLC30A8/ZnT8
ZnT8 mRNA can be detected in brain and liver (Palmiter and Huang, 2004) and
two SNPs are highly correlated with incidence of type 2 diabetes in Han Chinese.
Chimienti et al reported the specific expression of ZnT8 in the pancreas as well as
its localisation in pancreatic beta-cells which produce insulin (Chimienti et al.,
2006, Chimienti et al., 2005).
3.1.10. SLC30A9/ ZnT9, SLC30A10/ ZnT10
Not much is known regarding the genes SLC30A9 and SLC30A10, which encode
for proteins ZnT9 and ZnT10 respectively. In a phylogenetic tree constructed by
Seve and colleagues (2005), ZnT10 was shown to have the closest phylogeny to
ZnT1. It is the only zinc transporter so far which is embryonic-specific; at birth
ZnT10 diminishes, and expression of ZnT1 starts, implying that the two may have
similar functions and are homologous (Seve et al., 2004).
3.1.11. SLC39A ZIP FAMILY OF TRANSPORTERS
The SLC39 genes encode a family of zinc transporters (ZIPs) that are ubiquitously
expressed in all organisms. Structurally, ZIP proteins are composed of eight
transmembrane domains with a cytoplasmic loop between domain III and IV
composed of histidine residues. The ZIP family of zinc transporters promote the
transport of zinc from the extracellular environment into the cytoplasm or from the
cellular organelles to the cytoplasm (Liuzzi and Cousins, 2004b). Loss of
ZIPproteins may lead to the development of various pathological conditions such as
acrodermatitis enteropathica (AE), an autosomal recessive metabolic disorder
(Dufner-Beattie et al., 2003).
3.1.12. SLC39A1/ZIP1
SLC39A1 encodes for ZIP1 protein, whichis widely expressed (Liuzzi and Cousins,
2004b). Human ZIP1 protein is localised to the endoplasmic reticulum and plasma
membrane. In K562 and PC3 cells, ZIP1 mainly localizes on the plasma membrane.
In COS-7 and HepG2 cell lines, a perinuclear endoplasmic reticulum staining
pattern was observed (Milon et al., 2001).

82
Animal studies have shown that ZIP1 expression was detected as early as day 14 of
gestation, and that it is localised to the apical membrane of epithelial cell villi.
Expression increases until day 20 of gestation and continues postnatally. Changing
the level of zinc does not alter the level of ZIP1 mRNA in gestation or postnatal
dam and pup intestine and expression of ZIP1 mRNA was unchanged after dietary
zinc supplementation in human small intestine enterocytes (Cragg et al., 2005,
Huang et al., 2006). In a blood-brain barrier model, exposure to 50 µm/L zinc in
cell culture did not affect ZIP1 expression (Bobilya et al., 2008).
3.1.13. SLC39A2 / ZIP2
ZIP2 mRNA encoded by the SLC39A2 gene is expressed in mouse liver, spleen,
small intestine and bone marrow, as well as human peripheral blood monocytes
(Liuzzi and Cousins, 2004b). The protein localises to the plasma membrane. Under
zinc deficient conditions, a marked upregulation of ZIP2 expression and
downregulation of metallothionein was observed (Eide, 2004). A paediatric study
showed that ZIP2 mRNA is the only transporter overexpressed in asthmatic infants
compared to the rest of the transporters which were analysed, including ZnT1,
ZnT3, ZnT4, and ZIP1 (Xu et al., 2009). In cultures of human THP-1 cells and
human peripheral blood monocytes, ZIP2 gene expression was increased under zinc
deficient conditions following treatment with TPEN (Cao et al., 2001).
3.1.14. SLC39A3/ ZIP3
The SLC39A3 gene is highly expressed in bone marrow, spleen and intestine
(Liuzzi and Cousins, 2004b), liver (Liuzzi et al., 2005) and to a lesser extent in the
fetal and neonatal intestine. A study by Kambe and colleagues (2003) showed that
the ZIP3 protein is upregulated only under zinc deficient conditions. It was shown
that ZIP1, ZIP2 and ZIP3 mouse knock-outs had 80% abnormality of the embryos
under zinc deficient conditions, but did not cause major effects when zinc
concentration was adequate. These effects highlighted how crucial the functions of
zinc importers are during pregnancy, at least in animal models (Kambe et al.,
2008). This effect was corroborated by a study by Wang and colleagues (2004),
who found that mouse ZIP1 and ZIP3 protein is not endocytosed and degraded
easily from the plasma membrane under zinc deficient conditions. Cells which were

83
treated with TPEN were found to retain a higher amount of zinc (Wang et al.,
2004a).
3.1.15. SLC39A4/ ZIP4
The SLC39A4 gene expression is confined to the small intestine, colon, stomach
and kidney, but not in the liver presumably reflecting a role in the absorption of
zinc from dietary sources (Dufner-Beattie et al., 2003). ZIP4 protein is located in
the apical membrane of enterocytes and endodermal cells (Liuzzi et al., 2005).
Various studies have emphasised the importance of ZIP4 protein in gastrointestinal
absorption of zinc. The expression of ZIP4 is required during gestation and
lactation in mice; ZIP4 mRNA was expressed starting from day 18 and reached its
peak at day 20 (Huang et al., 2006). In Acrodermatitis Enteropathica (AE),
mutations yielding a premature termination codon that leads to failure of ZIP4
protein to transport zinc (Liuzzi et al., 2005).
Studies have demonstrated that zinc affects the stability of SLC39A4 mRNA. Zinc
sufficiency caused ZIP4 to be engulfed in enterocytes and get degraded. Under zinc
deficiency conditions, ZIP4 mRNA accumulates in the cytoplasm and ZIP4 protein
gets transported to the apical membrane. This tightly controlled mechanism implies
that ZIP4 is important for zinc absorption from diet (Weaver et al., 2007).
3.1.16. SLC39A5/ ZIP5
Previous research has indicated that the SLC39A5 gene is mainly expressed in the
gastrointestinal tract of mice and from immunohistochemistry its protein is
localised to basolateral membranes. During gestation, ZIP5 expression was first
detected at day 16, and it remains expressed until birth. During lactation, expression
of ZIP5 is very strong in intestines from both dams and pups, and remains
unchanged even in response to a zinc deficient diet (Huang et al., 2006). ZIP5
functions to prevent excessive amount of intracellular zinc. Zinc deficiency
increases ZIP5 mRNA expression and leads to shuttlling of the translated proteins
to the lateral and basolateral membrane of enterocytes meanwhile zinc sufficient
conditions prevent translation of ZIP5 and sends membrane to the degradation
pathway (Weaver et al., 2007).

84
3.1.17. SLC39A6/ ZIP6
The SLC39A6 gene was found to be expressed in prostate, placenta and mammary
gland cells. ZIP6, the protein coded by SLC39A6 gene is also called LIV-1 (Taylor
et al., 2003). Immunohistochemistry has shown the protein’s expression on the
apical or plasma membrane of neuroblastoma cell line and CHO cells (Taylor et al.,
2003, Chowanadisai et al., 2005). In mice subjected to zinc deficient diet, increased
expression of ZIP6 was observed, indicative of its crucial function in regulating
zinc homeostasis in the brain (Chowanadisai et al., 2005). ZIP6 may also have
potential role in breast cancers (Taylor et al., 2007).
3.1.18. SLC39A7/ ZIP7
ZIP7 is currently the only ZIP family transporter found in the ER. The relationship
betweenZIP7 expression and breast cancer has been explored by Taylor et al where
ZIP7 expression was higher in tamoxifen resistant breast cancer cells compared to
wild type cells. Up-regulation of ZIP7 causes increase of zinc influx into the
cytosol with subsequent increase in phosphorylation of epidermal growth factor
receptors due to inactivation of phosphatases and activation of downstream
signaling cascades including MAPK and Erb pathways (Hogstrand et al., 2009,
Taylor et al., 2008).
3.1.19. SLC39A8/ ZIP8
The SLC39A8 gene encodes ZIP8 protein found in lysosomes, endosomes and
mitochondria (Besecker et al., 2008, Kambe et al., 2004). Studies have shown its
involvement in the regulation of the immune system. Aydemir and colleagues
(2008) reported that human T-cells are activated by 15 mg zinc per day
supplementation for 4 days. SiRNA suppression ofZIP8 expression reduced IFN-y
secretion by 66%. Furthermore, incubating T cells in increased zinc caused a
reduction of calcineurin and an increase in CREB phosphorylation, ultimately
resulting in increased IFN-y secretion (Aydemir et al., 2009). TNF-α exposure to
lung epithelia can induce SLC39A8 expression. The increase of ZIP8 is thought to
provide protection for the lung epithelium in inflammatory conditions (Besecker et
al., 2008).

85
3.1.20. SLC39A9/ ZIP9
SLC39A9 localises in the trans-golgi network in HeLa cells. In the DT40 chicken
cell line, knocking out ZIP9 did not cause apoptosis, and nor did it affect cytosolic
zinc homeostasis as measured through zinquin staining. Secretory pathway function
is often measured through alkaline phosphatase. ZIP9 overexpression was found to
decrease ALP activity in wild type and ZIP9 -/- cells. (Matsuura et al., 2009).
3.1.21. SLC39A10/ ZIP10
SLC39A10 was found to encode a zinc transporter found in rat renal brush border
membrane.The gene itself was found to be widely expressed, particularly in small
intestine, pancreas, testis, brain, liver and kidney of rats. The protein was found to
immunolocalise at the plasma membrane in LLC-PK1 cells (Kaler and Prasad,
2007).
3.1.22. SLC39A12/ ZIP12
Preliminary studies have implicatedSLC39A12 within schizophrenia possibly
through serine to glycine mutations in residue 213 of the transporter protein
(A213G S36G)(Bly, 2006).
3.1.23. SLC39A13/ ZIP13
Fukada and colleagues reported that a mutation in SLC39A13 is linked to Ehler
Danlos Syndrome, which results from defective collagen synthesis and improper
connective tissue development. The protein localises to the perinuclear region
(Golgi apparatus) of different connective tissue cells. Mouse knockouts of the
SLC39A13 gene resulted in abnormal connective tissue development, poor bone
mineral density including dentin, and curvature of the spine resulting in a
hunchback appearance of SLC39A13 KO mice. A craniofacial abnormality was
characterised by sunken eyes. Decreased collagen synthesis also results in poor skin
development (Fukada et al., 2008).
3.1.24. SLC39A14/ ZIP14
ZIP14 protein expression has been found on the apical surface of the epithelium of
transfected MDCK cells. Girijashanker and colleagues reported that ZIP14 and

86
ZIP8 have high homology which may explain both transporters’ involvement in the
acute-phase response. In mice, lipopolysaccharide and turpentine, major antigens
for activation of the immune system, were found to increase the expression of
ZIP14 in the mouse liver. Furthermore, it was noted that the increase in ZIP14 was
triggered by inflammatory cytokine IL-6 and TNF-α. IL-6 null mice did not show
any inflammation, which indicated that ZIP14 expression is required to trigger
immune response in the liver (Liuzzi et al., 2005). Apart from zinc, the protein is
also able to transport cadmium and manganese (Fujishiro et al., 2009).
Relatively little is known about the distribution of zinc transporters in the eye
despite the fact that the RPE and choroid probably have the highest amount of zinc-
per gram of tissue in the whole body. Also, it is well accepted that zinc plays a role
in visual processing in the health and disease of the retina (Ugarte and Osborne,
2001). Currently available literature on expression of zinc transporters is
summarised in Figure 3.1.

87
Figure 3-1- Distribution of zinc transporters in RPE-choroid complex
Distribution of zinc transporters in the RPE-choroid complex based on various
publications. ER- Endoplasmic reticulum, MT - metallothionein (Leung et al.,
2008a, Redenti and Chappell, 2003, Wang et al., 2006b)

88
3.2. Aims
The aim of this chapter was to provide extensive expression profiling of all
SLC30A and SLC39A zinc transporters in various cultured RPE, and non RPE cell
lines, as well as in human cadaveric retina, RPE and choroid using:
1. Quantitative real time PCR using SYBRGreen detection system for all the 24
zinc transporters
2. Quantitative real time PCR with TaqMan probes to clarify and confirm findings
related to the expression of SLC39A12
3.3. Expression of SLC30A SLC39A Transporters in RPE Cells
Methods
In order to catalogue the expression levels in cells and tissues derived from the
retina/ RPE/ choroid complex, RNA was isolated from ARPE19, SHEF-1 (Kind
gift from Dr. Amanda Jayne Carr), primary human RPE cells, freshly isolated
cadaveric human RPE and choroid. The expression levels of all 24 mammalian zinc
transporters were measured using gene specific primers labeled with SYBRGreen
(Table 3.1). Sequences are available in Table 3.2. The primers were designed,
synthesised and optimised by PrimerDesign (Southampton, UK) (Sequences for
these primers are available in Appendix 3). RNA quantification was done using
NanoDrop (ThermoScientific, UK), and RNA integrity was assessed by BioRad
Experion system. Relative gene expression levels were calculated based on the
comparative Ct method (Schmittgen and Livak, 2008). This was achieved by
normalising the cycle (Ct) values (the cross-over threshold value where the signal
was first detected in a qPCR assay) of the gene of interest to the housekeeping
genes, thereby giving a ∆ Ct value (shown in Table 3.1). Higher∆Ct values indicate
lower expression. Genes were grouped according to three arbitrary thresholds: ∆Ct
values below 5 were considered to be high to medium (in red), ∆Ct between 5-10
were low (in yellow), and ∆Ct above 10, at which point the genes were probably
not expressed as judged by the dissociation curves from each PCR product in grey.
The results are the averages of at least 2 independent experiments carried out in
duplicate. The low numbers of experiments are not enough to provide an accurate
data as the variability of the qPCR data can be high. It is recommended that 3
independent experiments are carried out in the future.

89
As mentioned, the results were verified by closely examining the dissociation
curves and running the PCR products on 1% agarose gels. Following
electrophoretic separation, the ethidium bromide labeled PCR products were
visualised under UV light (Figure 3.2). Non-template controls (amplification in the
absence of cDNA) were run alongside the samples for the identification of primer
dimers and non-specific products. While we included in Table 3.1 the ∆Ct values
for the genes from human cadaveric tissues, we could not apply similar threshold
categories defined above as the housekeeping genes Ct values for the cadaveric
tissues were unexpectedly high. This was probably due to variable post-mortem
degradation of RNA. Nonetheless, comparing ∆Ct values to each other allows the
identification of potentially highly expressed genes. For ease of interpretation, the
data is also presented in an additional format, with the same colour scheme as
previously described (Figure 3.3).
Results
Following the q-RT-PCR experiments, most zinc transporters appear to be
expressed in all cell lines. SLC30A3, SLC30A6, SLC30A7, SLC39A3, and
SLC39A11 were expressed at a low level, while SLC30A9, SLC39A1, SLC39A7,
and SLC39A13 were expressed at the medium to high levels in all cell lines.
SLC30A8, SLC30A10 and SLC39A12 did not seem to be expressed in any of the
RPE cell lines. There appeared to be some discernable differences in expression
levels in the different cell lines: highest expression was observed for SLC39A4 in
ARPE19, for SLC39A6 in SHEF1 and SLC30A1 in primary cultures, SLC30A2
expression was very low or absent in ARPE19, but present in SHEF1 and primary
cultures. SLC39A2 was only expressed in SHEF1 cells, but not in ARPE19 and
primary cultures. SLC39A5 was expressed in ARPE19 and SHEF1 cells but not in
primary cultures. The absence of genes such as SLC30A8, SLC30A10 and
SLC39A12 in these cell lines was confirmed by separating the PCR product on 1%
agarose gels (Figure 3.2).
In cadaveric samples the presence of zinc transporter expression was visualised on
1% agarose gels. Those without a clear band or those where bandsco-migrated with
the non-template controls, andgave similar fluorescence intensity bands to that of
the non-template control (See Figure 3.2)were deemed to be non-expressed. Based

90
on this, SLC39A2 and SLC39A9 were not expressed in human cadaveric RPE and
while probably present there was very low expression levels of SLC39A10 and
SLC39A11. In contrast, we found that the expression of SLC39A12, whose
expression was absent in all cell lines, appeared to be very high in human cadaveric
RPE.

91
Table 3-1- Expression of SLC30A1-10, SLC39A1-14 in RPE cells
Expression of SLC30A1-10, SLC39A1-14 in ARPE19, human embryonic stem cell
derived RPE cells (SHEF-1), primary cultures of human RPE, as well as cadaveric
human RPE. Data was expressed in ∆Ct format with mean standard deviation
values. The results were derived from averaged values from 2-4 independent
experiments carried out in duplicates. QPCR experiments were conducted on
Applied Biosystem HT7900 system. The colours red indicated high expression
(∆Ct < 5), yellow indicated medium expression (∆Ct 5-10), and grey (∆Ct >10)
indicated low or no expression as assessed by ∆Ct values and melt curve analysis.
ARPE19 SHEF-1 Primary
hRPE Cad. HRPE
n n n n
SLC30A1/ ZnT1 4 7.7+1.7 4 7.8+1.8 2 5.0+0.5 4 1.3+1.9
SLC30A2/ZnT2 4 11.0+1.8 4 8.2+0.6 2 7.8+0.4 4 1.9+5.9
SLC30A3/ZnT3 3 9.2+0.7 3 8.6+1.0 2 8.2+0.3 4 0.9+3.2
SLC30A4/ZnT4 3 9.4+1.7 3 10.6+1.7 2 8.8+0.9 4 1.5+3.4
SLC30A5/ZnT5 2 5.2+0.2 2 4.0+0.0 2 5.0+0.4 4 1.1+3.4
SLC30A6/ZnT6 2 6.9+0.1 2 5.5+0.0 2 6.8+1.0 4 2.0+6.7
SLC30A7/ZnT7 2 6.8+0.1 2 5.9+0.5 2 6.4+0.5 4 0.9+6.0
SLC30A8/ZnT8 4 14.0+1.3 4 12.3+0.4 2 11.8+0.0 4 3.7+4.0
SLC30A9/ZnT9 2 3.9+0.2 2 3.1+0.2 2 3.6+0.2 4 0.9+5.4
SLC30A10/ZnT10 5 15.8+1.2 5 10.6+1.6 2 16.1+1.3 4 1.6+2.8
SLC39A1/ZIP1 2 2.4+1.1 2 2.0+1.3 2 3.4+0.6 4 1.2+3.1
SLC39A2/ZIP2 5 14.4+1.8 5 8.8+1.8 2 13.4+0.1 4 4.2+4.8
SLC39A3/ZIP3 3 7.3+2.2 3 6.3+1.9 2 5.8+0.0 4 0.9+5.8
SLC39A4/ZIP4 2 4.0+0.6 2 5.7+0.0 2 5.1+0.7 4 0.9+2.6
SLC39A5/ZIP5 3 7.9+1.6 3 5.7+0.6 2 10.2+0.4 4 3.2+3.2
SLC39A6/ZIP6 2 5.7+1.3 2 3.1+2.4 2 7.7+0.6 4 3.2+6.4
SLC39A7/ZIP7 2 3.3+1.2 2 2.0+1.3 2 5.1+0.9 4 1.9+5.6
SLC39A8/ZIP8 2 6.6+1.0 2 5.5+1.0 2 4.8+0.2 4 1.8+4.0
SLC39A9/ZIP9 2 5.5+1.5 2 4.9+1.6 2 10.2+0.0 4 2.8+3.7
SLC39A10/ZIP10 2 6.3+1.2 2 3.4+1.3 2 6.5+0.1 4 3.2+3.8
SLC39A11/ZIP11 2 7.4+1.1 2 5.6+1.1 2 6.4+0.1 4 4.0+0.9
SLC39A12/ZIP12 5 14.5+2.2 5 11.7+1.6 2 12.3+0.1 4 0.9+0.2
SLC39A13/ZIP13 2 3.5+1.3 2 4.1+0.9 2 3.9+1.2 4 2.1+3.0
SLC39A14/ZIP14 2 5.7+0.5 2 3.6+1.0 2 4.2+0.4 4 3.0+3.6

92
Figure 3-2- Confirmation of QRT-PCR using 1% agarose gels
The PCR products were run on 1% agarose gel and visualised using ethidium -
bromide. The results for ARPE19 are shown in panels A,B,C, primary human RPE
culture (passage 4) in D,E,F and cadaveric human RPE in G, H, I. The zinc
transporters and the housekeeping genes for each sample are labeled, with the
corresponding non-template controls on its right hand side. The 200 and 300 bp size
markers are labeled on the pictures. For image purpose, the gene names have been
replaced by protein names, for explanation refer to page 91.

93
Table 3-2 - Human primer sequences for SLC30A family and SLC39A family
of zinc transporters
Primer Sequences Homo sapiens
Gene Accession Number Forward Reverse BP
SLC30A1 NM_021194 AAGACCCCAGCAGTTAGCA AGGTTGTTTGTTTGGCATGTTT 129
SLC30A2 NM_001004434 GAGAAGTCGTTGGTGGGTAC GAGGGAGAAGAGGCTGATGA 104
SLC30A3 NM_003459 CTTTGGCTGGCACCGTTCA CTCGATGTGGTAGTCGCTGTG 124
SLC30A4 NM_013309 GCACATTTGGAGTCCCTTTTC CATTGTTACCCTACTCTGATTCTTAG
96
SLC30A5 NM_022902 TTATAGAGCAGTTTGGATGGTTCA
TTCATATTCTGGTGGCAATCTCA
137
SLC30A6 NM_017964 CATTTGGGTTTGAAAGATTAGAAGTC
GTGTGTATCTCGGGCTGTTC
124
SLC30A7 NM_133496 TCCTGTGCCTGAACCTCTC
AGTCGGAAATCAAGCCTAAGC
81
SLC30A8 NM_173851 AGGGAGATTTTAAGGATTTTGAGATG
AGGGAAAGGGTAATGGGAGAG
104
SLC30A9 NM_006345 TCCATCCAGCCAGAACAAGT
TGTAACAACTCGCCCATCAAA
150
SLC30A10 NM_018713 ATATCAAGATGCCAGCACAAAAAT
GGGTTCCTTCAAGTCCACATT
97
SLC39A1 NM_014437 AGGAACAAGAGATGGTCAAGTC
GTATAGTGTCCAACCTCTGATTCT
96
SLC39A2 NM_014579 TTTGGAGTCGCTGGCATTG
TTTGAGGGTGAGGGTAAATGTC
126
SLC39A3 NM_144564 TTTGGAGGAGGGGTGTTTCT
GGGTAGTCGGTGCTGATGT
107
SLC39A4 NM_01167 GCTGCTGCTGTCCCTGTAC
GGTTTCTGGGCTGTAGGTTTG
107
SLC39A5 NM_173596 GGGGAGAATAGGAGCCAGAA
AAGACGACCCACACACAGAA
105
SLC39A6 NM_012319 ACTACCATCATATTCTCCATCATCA
CATCACCCATTATCACCATCCA
132
SLC39A7 NM_006979 GTTCTCCAAGGTCCAGTTTCC
CCCCAATCACTCCCAAATCAG
144
SLC39A8 NM_022154 CTCTCCTCGGATTGATTTTGACT
AATGCCTCTGGAATAAGTTGGAA
130
SLC39A9 NM_018375 AGTGGTTGTGGGTGAATAAAGG
GAAATTAACAGCCAAGGGAATGAT
120
SLC39A10 NM_001127257 TGGTGATGGTGACAATGAAGAA
GCAAATCCAAAGAGCAATCCTAA
84
SLC39A11 NM_139177 CTGAAATGTCCCTATAAAGAATGAGT
TTGCTACCCCTGTTGGAGAA
86
SLC39A12 NM_152725 CTTGCCTTCCCCAGACTACT
CCAGAGAGTGTTGAGGAGTTG
103
SLC39A13 NM_001128225 ATCGTGGTAATGGTGCTGTTC
CCCTCTCTGCCTCTCACATAT
126
SLC39A14 NM_015359 TTGCCGCTTCCATAAATCAAAG
AAACCCATCTGTAGCATAATCATTAG
127

94
Figure 3-3 – Diagram representation of QRT-PCR data for RPE cells
Representation of QRT-PCR data for RPE cells in bullet format, separating the high
(red), medium (yellow) and no expression (grey) for both SLC30 and SLC39
family of zinc transporter genes. From left to right, data for ARPE19, Shef-1 and
primary hRPE are presented.

95
3.4. Expression of SLC30A SLC39A Transporters in non RPE Cells
We also assessed the expression of the 24 zinc transporters in other cells and tissues
including those isolated from rat or human retina (see Table 3.3 and pictorial
representation Figure 3.4) namely the murine endothelioma cell-line bEND5,
primary rat retinal ganglion cells (kindly provided by Dr. Richard Foxton), human
primary cultures of Muller cells (RNA kindly provided by Dr. Astrid Limb) and
human cadaveric choroid. Similarly, threshold categories defined above as the
housekeeping genes Ct values for the cadaveric tissues were unexpectedly high as
described before. In addition human embryonic kidney HEK293 cells were also
assayed (This cell line will be extensively used in the Chapter 4). In bEND5 cells
out of the 24 transporters only SLC30A8, SLC30A10 and SLC39A12 were not
expressed. In primary rat retinal ganglion cells (RGC) out of the 24 transporters
only SLC30A7, SLC30A8, SLC39A2, and SLC39A12 were not expressed. In
human primary cultures of Muller cells the genes which were not expressed were
SLC30A8, SLC30A10, SLC39A5, and SLC39A12. In the HEK293 human
embryonic kidney cell line it appeared that except SLC39A12 all other zinc
transporters are detectable, although sometimes at very low levels of expression.
The presence of SLC30A10 expression was one of the results which could only be
confirmed after analysis of the dissociation curve. In human cadaveric choroid,
based on dissociation curve analysis, SLC30A2, SLC30A8, and SLC39A2 genes
are not expressed.

96
Table 3-3 - Expression of SLC30A1-10, SLC39A1-14 in non- RPE cells
Expression of SLC30A1-10, SLC39A1-14 in murine BEND5, rat retinal ganglion
cells, HEK293 cells and human primary cultures of Muller cells. Data were
expressed in ∆Ct format with mean and standard deviation values. The results were
derived from averaged values from 2/3 independent experiments carried out in
duplicates. QPCR experiments were conducted on anApplied Biosystem HT7900
system. * Left blank due to presence of non-specific product in NTC, see
confirmation performed using Taqman. The colours red indicated high expression
(∆Ct < 5), yellow indicated medium expression (∆Ct 5-10), and grey (∆Ct >10)
indicated low or no expression as assessed by ∆Ct values and melt curve analysis.
mBEND5 rRGC HEK293 hMuller Cad. hChoroid
n n n n n
SLC30A1 3 4.6+1.8 2 7.0+0.4 2 6.7+0.5 2 7.2+0.1 4 2.9+2.8
SLC30A2 3 7.1+2.6 2 7.0+0.8 2 3.9+0.0 2 8.7+2.9 4 5.8+2.5
SLC30A3 3 8.1+2.8 2 7.0+0.5 2 5.0+0.1 2 6.9+0.3 4 2.1+4.8
SLC30A4 3 3.5+2.1 2 6.8+0.1 2 7.9+1.1 2 8.2+0.3 4 3.4+2.9
SLC30A5 3 4.8+0.8 2 6.7+0.1 2 2.9+0.6 2 4.5+0.2 4 3.0+1.4
SLC30A6 3 5.6+1.4 2 6.8+0.9 2 6.6+0.3 2 6.4+0.7 4 5.5+2.2
SLC30A7 3 5.2+0.3 2 10.9+2.6 2 9.6+0.3 2 6.4+0.1 4 4.8+2.3
SLC30A8 3 10.8+1.1 2 11.5+8.8 2 5.6+0.7 2 13.0+1.0 4 5.8+4.8
SLC30A9 3 3.9+0.9 2 5.9+0.6 2 3.6+0.2 2 4.4+0.7 4 4.5+1.0
SLC30A10 3 11.6+0.2 2 6.4+0.1 2 10.6+0.2 2 13.6+1.6 4 4.9+4.2
SLC39A1 3 2.7+0.5 2 6.5+1.5 2 4.0+0.2 2 3.8+0.1 4 1.9+2.1
SLC39A2 3 7.9+1.9 2 10.1+7.3 2 5.3+0.0 2 12.2+3.8 4 6.8+4.5
SLC39A3 3 6.3+1.0 2 6.5+0.0 2 3.4+0.1 2 6.1+0.8 4 3.4+2.2
SLC39A4 3 8.0+1.9 2 6.8+0.4 2 4.1+0.3 2 7.2+0.3 4 3.2+2.0
SLC39A5 3 8.8+2.6 2 8.3+0.2 2 4.7+1.2 2 10.0+2.8 4 5.9+4.1
SLC39A6 3 6.6+0.1 2 6.2+0.2 2 5.1+0.2 2 5.6+5.1 4 6.3+3.3
SLC39A7 3 3.4+0.7 2 7.1+0.4 2 4.6+0.1 2 2.8+0.4 4 3.5+0.9
SLC39A8 3 6.0+0.7 2 6.0+0.1 2 5.8+0.2 2 6.8+0.8 4 4.9+2.0
SLC39A9 3 7.5+1.4 2 6.9+0.3 2 9.3+0.0 2 6.8+1.2 4 4.4+2.9
SLC39A10 3 6.2+2.0 2 9.4+1.8 2 9.3+0.1 2 8.3+4.5 4 5.5+2.6
SLC39A11 3 4.6+0.4 2 6.1+0.3 2 6.4+0.1 2 6.8+0.2 4 4.6+2.8
SLC39A12 3 11.5+3.2 2 11.6+3.1 2 *4.7+2.0 2 14.2+1.1 4 2.1+2.9
SLC39A13 3 4.1+1.4 2 7.1+0.1 2 6.2+0.5 2 4.5+0.9 4 3.3+2.0
SLC39A14 3 9.3+0.8 2 5.9+0.1 2 4.9+0.0 2 3.2+0.8 4 3.9+2.4
TaqMan
SLC39A12
15.3

97
Figure 3-4- Diagram representation of QRT-PCR data for non-RPE cells
Representation of QRT-PCR data for non-RPE cells in bullet format, separating the
high (red), medium (yellow) and no expression (grey) for both SLC30 and SLC39
family of zinc transporter genes. From left to right, data for mBend5, rRGC,
HEK293 and hMuller are presented.

98
3.5. Confirmation of high SLC39A12 Expression in Cadaveric Tissue Using a
TaqMan Style Probe
Methods
SYBR-Green dye-based detection is a highly efficient method to quantify the
expression of the zinc transporters. This means that no specific probes are required,
which reduces assay setup time and running costs. However, because SYBR Green
dye binds to any double-stranded DNA, including nonspecific double-stranded
DNA sequences, it has a potential to generate false positive signals and we showed
that generation of signals from primer dimers does interfere with the detection of
lowly expressed gene amplification products. This appeared to be the case for
SLC39A12 in cultured cells. To overcome this problem, the TaqMan-based
detection of gene amplification was employed. This method is based on specific
hybridization between a probe and its target generating a gene amplification
specific signal. The disadvantage of the TaqMan chemistry is that the synthesis of
different probes is required for different sequences, making this method less cost
effective. The probes were labelled with a fluorescent dye (in our case it was 6-
carboxyfluoroscein (FAM) and a quencher that extinguishes fluorescence while
both attached to the probe. During the polymerisation reaction the probe is cleaved
and this releases the fluorescent dye from the quencher. As PCR product
accumulates, fluorescence intensity increases, allowing quantitation of the
generated PCR products. Table 3.4 shows the fold difference in expression
compared to ARPE19 cells generated by first calculating the ∆Ct values compared
to the housekeeping genes (GAPDH, UBC, and YWHAZ) and then calculating the
∆∆Ct values by comparing the ∆Ct values for the gene of interest to ∆Ct
SLC39A12 in ARPE19 for normalisation.
Results
The values obtained by using SYBRGreen and TaqMan based detection systems
were similar. The expression of SLC39A12 was 3-4 orders of magnitude higher in
cadaveric samples and about 2 orders of magnitude higher in primary RPE cultures
compared to expression in ARPE19. Currently we are confirming the results with
further experimentations with the TaqMan-based probe for SLC39A12.

99
Table 3-4–Confirmation of SLC39A12 expression using TaqMan-style Probe
The level of expression of SLC39A12 measured by using SYBR-Green based
detection or TaqMan -based detection. Cadaveric tissues and primary RPE cultures
contain higher level of SLC39A12 expression than ARPE19 cells do.
n SYBRgreen TaqMan
ARPE19 3 1.0 1.0
hRetina 3 2530.4 2014.9
hRPE 3 1708.7 1922.6
hChoroid 3 13378.5 12147.5
Primary RPE 3 375.0 355.3
3.6. Evidence of Cross-Contamination in Cadaveric Samples
Method:
QRT-PCR using RPE65 as RPE specific gene, VE-cadherin as endothelial specific
gene and rhodopsin as retinal specific gene was used to validate for possible cross-
contamination problem present in cadaveric human samples (Table 3.5). Primers
for VE-cadherin was kindly provided by Dr. Jenny McKenzie, primers for RPE65
was kindly provided by Dr. Amanda Jayne Carr and primers for rhodopsin was
purchased commercially from Applied Biosystem (Carlsbad, USA). The results
presented here are the results from three or four separate experiments. Furthermore,
in order to determine whether the expression of SLC39A12 increased with
pigmentation, comparison was made between pigmented and non-pigmented
ARPE19 cells. Three cDNA samples were kindly provided by Dr. Ahmed Ahmado
and Dr. Amanda Jayne Carr. The data was presented as a delta Ct format as
previously described. With low/ no expression having delta Ct >10 (grey), medium
expression with delta Ct 5-10 (yellow) and high expression with delta Ct < 5 (red).

100
Results:
Table 3-5 – Cross contamination in human cadaveric samples
Cross-contamination present in human cadaveric samples and expression of ZIP12
in pigmented and non-pigmented ARPE19. Data is presented as the delta Ct value
for each samples.
Choroid VE-cadherin 10.60
Choroid RPE65 1.91
Choroid Rhodopsin 10.02
RPE VE-cadherin 16.05
RPE RPE65 3.66
RPE Rhodopsin 8.80
Retina VE-cadherin 13.36
Retina RPE65 7.61
Retina Rhodopsin 2.14
ARPE19 pigmented SLC39A12 17.29
ARPE19 non-pigmented
SLC39A12 21.46
In RPE samples, there is very little contamination from the choroid as assessed
using endothelial specific VE-Cadherin primers, with a delta Ct of 16.05. There is
moderate contamination (delta Ct 8.80) from the retina as assessed with retinal
specific rhodopsin. The expression analysis for RPE65 is highest as expected in
RPE samples with delta Ct of 3.66. In retina samples there is also minimal
contamination from the choroid, (delta Ct 13.36), moderate contamination from
RPE65 (delta Ct 7.61). The expression analysis for rhodopsin is highest in retinal
samples with delta Ct of 2.14. The cross-contamination, particularly those present
in choroid indicated that the results have to be taken with careful consideration. In
pigmented ARPE19 cells, the expression of SLC39A12 is marginally increased
(delta Ct of 17.29) compared to non pigmented (delta Ct of 21.46). However, as the
changes are minimal and expression level remains very low, the results will have to
be verified using other means.

101
3.7. Discussion
The ocular tissues contain exceptionally high concentrations of zinc (See Chapter 1
– Introduction) suggesting that zinc plays an important role in physiology and,
potentially, pathology of the eye (Ugarte and Osborne, 2001). The primary
mechanism(s) mediating zinc homeostasis in these cells is likely to involve at least
some of the 10 ZnT exporters and the 14 ZIP importers encoded by the SLC30A
and SLC39A solute-linked carrier families of transmembrane proteins (Liuzzi and
Cousins, 2004a). While studies in other tissues have underlined the importance of
these transporters in health and disease (Taylor et al., 2007, Zhang et al., 2008,
Fukada et al., 2008, Dufner-Beattie et al., 2003), little is known about the
distribution and function of these transporters in the eye. Here we examine the
expression profile of all 24 zinc transporters in several cell lines, primary cell
cultures and cadaveric samples from the retina/RPE/choroid complex to gain a
better understanding of their distribution.
3.7.1. Zinc Transporters in Human Cadaveric and Cultured Retinal Pigment
Epithelium Cells and non-RPE cell lines
The RPE is one of the most commonly studied cell type in ocular research.
Previous studies have described the expression levels of zinc transporters in
ARPE19 cells as well as primary RPE cell cultures from human adults and foetuses
(Leung et al., 2008a, Rezaei et al., 2008a). ARPE19 is a spontaneously
immortalised human RPE cell line. While it is widely used for RPE research,
expression of RPE specific genes and several phenotypic characteristics of ARPE19
differ from those of RPE in vivo (Cai and Del Priore, 2006, Vugler et al., 2008). In
their publication in 2008, Leung et al (Leung et al., 2008a) determined the
expression of 23 zinc transporters (with exception to SLC30A10) in ARPE19 cells,
as well as primary cultures derived from human foetuses and adults (summarized in
Table 3.6). Another study (Rezaei et al., 2008a) analysed the expression of the 14
SLC39A genes (coding for ZIP importers). In our work we analysed the expression
of all 24 zinc transporters in ARPE19, primary RPE cell cultures and RPE isolated
from cadaveric eyes (data summarized in Figure 3.2). While the results obtained by
Leung et al and Rezaei et al on cultured cells are not dissimilar, neither groups
examined expression in cadaveric tissues. This is perhaps not surprising,
considering the large variability in RNA samples we found in human cadaveric

102
RPE, which caused quantitative analysis impossible. This variability was probably
due to post-mortem degradation of RPE and tissue handling. In recent experiments
we were able to limit RNA degradation by doing a very thorough tissue disruption
combining both hand held mortar and pestle tube as well as using Qiashredder
tubes (Qiagen GmBH, Germany). Furthermore, retinal samples require complete
removal of any vitreous humor attached before lysing.
However, analysing the dissociation curve from QRT-PCR experiments and
separating of gene products on 1% agarose gels allowed us to draw some
conclusion even on the difficult samples. In these SLC39A2, 9, 10 and 11 were
either absent or had a very low level of expression while others appeared to be
present with differing expression levels. Interestingly, in ARPE19 (and many other
cultured cells, see later) the expression of SLC39A12 was absent while there is
clear expression in cadaveric tissue derived RPE and primary RPE cells at passage
1 (Leung et al., 2008a) and low expression at passage 4 samples (our experiments).
This raised the possibility that studying the role of ZIP12 protein might be possible
by transfection of cultured RPE, which is discussed in details in the next chapter
(Chapter 4).

103
Table 3-6- Summary of zinc transporter expression in various RPE cels
Summary of zinc transporter expression in various RPE cells based on the work of
three different laboratories: a (Leung et al., 2008b); b (Rezaei et al., 2008b) and our
own (Cahyadi, Berzegar-Befroei and Lengyel, unpublished). Black represents high,
gray low and white no expression of a gene based on qRT-PCR experiments.
Expression levels are compared to selected housekeeping genes. Abbreviations:
RPE, retinal pigment epithelium; h, human; hf, human fetal; ha human adult; r, rat;
m mouse; ND, not determined.

104
While information about the function of zinc transporters in the RPE is very
limited, we combined our and the previously mentioned expression data with what
is known about the location and function of zinc transporters in other cells, and
have generated a speculative working model suggesting where zinc transporters
might be. This is discussed below and depicted on Figure 3.5.
The discovery of ZnT1, the first zinc transporter identified (Palmiter and Findley,
1995) caused a major change in the understanding of zinc transport. It was
discovered that overexpression of ZnT1 confers resistance to zinc pretreatment
which was attributed to its plasma membrane localization. This allows the protein
to constantly pump zinc to the extracellular space. ZnT1 is expected to be found on
apical cell as well as basal membrane of RPE cells, although it has also been found
around the perinuclear area of RPE cells (Kirschke and Huang, 2008, Wang et al.,
2009a) (Leung et al., 2008b). The protein is unique compared to other plasma
membrane transporters, as it is ubiquitously expressed compared to ZnT2 and ZnT5
which have a more limited expression and this led to the belief that it functions as
the primary zinc exporter in cells. This was supported by the finding that the ZnT1
knockout mouse is embryonic lethal due to failure to remove excess zinc from cells
(Langmade et al., 2000). Based on its pronounced expression in the RPE, ZnT1 is
likely to be a plasma membrane exporter in RPE cells.
ZnT2 has been found in various tissues (Palmiter and Huang, 2004). Its localisation
has been reported on endosomal vesicles, lysosomes, apical surface of microvilli
and mitochondria (Kambe et al., 2004, Falcon-Perez and Dell'Angelica, 2007)
(Kelleher and Lopez, 2008). The protein function is likely to be to reduce zinc
concentration in the cytosol by transporting zinc into intracellular stores. Zinc
treatment in various studies demonstrated an increase in ZnT2 at gene expression
and protein levels (Falcon-Perez and Dell'Angelica, 2007, Bobilya et al., 2008).
Within the RPE itself, it is possible that ZnT2 localisation in the vesicle/phagosome
may indicate an involvement in phagocytosis of photoreceptor outer segments and
degradation of opsins (Gleim et al., 2009). While we did not observe the expression
of ZnT2 in our ARPE19 samples, gene expression of ZnT2 was reported by Leung
and colleagues (Leung et al., 2008b, Liuzzi et al., 2001a).

105
ZnT3 protein is located on the apical membrane of the endothelial cells (Wang et
al., 2004b). ZnT3 is usually associated with synaptic vesicles but has also been
shown to be present in non-neuronal cells (Palmiter et al., 1996). In the human RPE
cell lines, mRNA of ZnT3 was found to be expressed in ARPE-19 and human adult
RPE, but not in human fetal RPE (Leung et al., 2008a), where our study reported no
expression of ZnT3. If ZnT3 was present in RPE cells then it would be expected to
be associated with vesicles around the apical plasma membrane. However, ZnT3
expression will need further verification as we were unable to confirm this
observation.
In the eye, ZnT4 expression is found in all types of RPE cell cultures, ARPE-19,
human fetal RPE, and human adult RPE (Leung et al., 2008a). It is expected that
ZnT4 would be localised in the vesicles. In 2003, Henshall et al reported the
localisation of ZnT4 in the vesicles and on the plasma membrane, indicative of its
function to mediate efflux from the cells (Henshall 2003).
ZnT5 expression was absent in the study by Leung et al (Leung et al., 2008b) but
present in the eye based on in silico data (Seve et al., 2004) and it was observed by
us in all RPE cells analysed. This transporter is reported to be involved in vesicular
zinc loading as well as associated with apical membranes, yet the direction of zinc
transport through this transporter is not clear probably because of alternative
splicing (Jackson et al., 2007, Valentine et al., 2007, Kambe et al., 2002). The
expression of ZnT6,7 and 9 was observed both by us and Leung et al (Leung et al.,
2008a). ZnT6 and 7 are involved in translocation of cytoplasmic zinc into the Golgi
network (Kirschke and Huang, 2003), while ZnT9 is ubiquitously distributed in
cells it was thought to be involved also in zinc transport into the nucleus (Sim and
Chow, 1999, Sim et al., 2002). As intracellular immunoreactivity of ZnT7 in RPE is
very high, transporting zinc into the Golgi might be important for appropriate RPE
function.
The expression of ZnT7 in the retina of albino mice is localized to the axons and
dendrites of ganglion cells,where reactivity was highest in the somata of ganglion
cell layer, and moderate immunoreactivity was present in nerve fiber layer and
inner nuclear layer. Weak staining was noted in the inner plexiform layer.
Intracellularly, ZnT7 localizes to the perinuclear area, or Golgi apparatus (Kirschke

106
and Huang, 2003). In the RPE, expression of ZnT7 was reported by both our study
and Leung (Leung et al., 2008a).
None of the RPE cells analysed in this study expressed ZnT8 mRNA. Previous
studies have indicated the specific tissue localisation of ZnT8, where it is located in
the pancreatic beta-cells. While we do not see the expression of ZnT8 in any of the
tissues that we have analysed, Leung et al reported the expression of ZnT8 in
human cultured fetal RPE, suggesting that this gene may have a developmental
role. Studies from pancreatic beta-cells have shown vesicular localisation of ZnT8
(Chimienti et al., 2006), suggesting that if this protein is present in the RPE, it is
likely to be localised in the same compartment.
Both Leung et al and our study observed a high expression of ZnT9 in RPE cells.
While little functional data have been found for this protein, reports have associated
the protein’s localisation to the nucleus (Sim and Chow 1999,(Sim et al., 2002).
None of the studies reported the expression of ZnT10 although our data on 1%
agarose gel seemed to indicate the presence of ZnT10 in human cadaveric samples.
Seve has indicated that ZnT10 is embryonic specific, although no data are available
on its function and localisation (Seve et al., 2004).
Relatively little is known about ZIP transporters. ZIP1-6, 8, 12 and 14 have been
shown to be located on the plasma membrane and probably mediate zinc transport
into RPE cells. ZIP7 is localized to the ER and Golgi, ZIP8 is present on vesicles
and mitochondria and ZIP13 regulates zinc levels in the Golgi (Taylor et al., 2008,
Aydemir et al., 2009, Fukada et al., 2008). In chapter 4, we will show the
localization of ZIP12 protein on cultured cells.
ZIP1 protein is expressed in the ARPE19 cell line, as well as human fetal RPE and
human adult cell lines (Leung et al., 2008a). Belloni-Olivi and colleagues have
reported the dual localization of ZIP1 on the plasma membrane as well as
intracellular vesicles under excessive zinc condition (Belloni-Olivi et al., 2009).
ZIP2 expression was observed in the ARPE-19 cell line and human fetal RPE, but
not present in human adult RPE cells (Leung et al., 2008a). Increase in extracellular
zinc levels in ARPE19 cells can increase the expression of ZIP2 and enzymes
involved in glutathione synthesis to provide protection against oxidative stress in

107
RPE cells (Ha et al., 2006, Rezaei et al., 2008b). Expression of ZIP2 was also
induced by various neurotrophic factors (Leung 2008). Studies by Rezaei and
Leung both reported the expression of ZIP2 mRNA in ARPE19 cells, although we
did not observe the expression in our studies. We postulate that this could be caused
by differences in primers used. The expression of ZIP2 appears to be
developmentally regulated and can be altered by neurotropic factors in RPE cells
(Leung et al., 2008a) therefore it might be very important for normal and
pathological processes in the eye.
ZIP3 expression has been found in both ARPE19 cell line and human cadaveric
RPE in our studies. In addition to this, Leung et al and Rezaei et al have both
reported expression of ZIP3 in ARPE19, human fetal and adult RPE cell cultures
(Leung et al., 2008a).
ZIP12 is probably the least studied zinc transporter protein. Its gene expression is
reported to be localized to the retina, kidney and brain according to the EST
database (http://www.ncbi.nlm.nih.gov/nucest) (See section 4.7). Leung et al.
(Leung et al., 2008a) reported that the expression of SLC39A12 was found in
primary cultures of human fetal RPE, as well as human adult RPE but not in ARPE-
19 cells. Rezaei et al (Rezaei et al., 2008a) and our work (Figure 3.2) confirms the
absence of mRNA for ZIP12 in ARPE-19 cells. However, using TaqMan based
detection we showed that its expression is 2-4 order higher in primary cultures and
cadaveric RPE cells than in ARPE19, a finding that is strongly supported by the
results of Booij et al (Booij et al., 2010b). They have shown that ZIP12 is not only
expressed in RPE, but categorised it is one of the RPE specific genes. Given the
important role for zinc in RPE cells, we have attempted to characterize this protein
(see chapter 4) in order to understand the mechanism of zinc transport.

Figure 3-5- Zinc transporters in RPE
Based on the literature
this figure summarizes our understanding of where zinc transporters may be located
in RPE cells and includes potential zinc buffering or muffling compartments. For
simplicity, on this figure endosomes, lysosomes, and secretory vesicles are labeled
as “Vesicles” despite
melanosomes; MT metallothionein; ER, endoplasmic reticulum.
Picture taken from Barzegar
Lengyel, I. 2011. Zinc in Eye Diseases.
Press.
Zinc transporters in RPE-Choroid.
literature on other cell types and gene expression studies on RPE cells
mmarizes our understanding of where zinc transporters may be located
in RPE cells and includes potential zinc buffering or muffling compartments. For
simplicity, on this figure endosomes, lysosomes, and secretory vesicles are labeled
as “Vesicles” despite their vastly differing functions. Abbreviations: Me,
melanosomes; MT metallothionein; ER, endoplasmic reticulum.
Barzegar-Befroei, N., Cahyadi, S., Gango, A., Peto, T., and
Lengyel, I. 2011. Zinc in Eye Diseases. Zinc in Human Health. A
108
n other cell types and gene expression studies on RPE cells
mmarizes our understanding of where zinc transporters may be located
in RPE cells and includes potential zinc buffering or muffling compartments. For
simplicity, on this figure endosomes, lysosomes, and secretory vesicles are labeled
. Abbreviations: Me,
Befroei, N., Cahyadi, S., Gango, A., Peto, T., and
. Amsterdam: IOS

109
3.7.2. Zinc transporters in the choroid and fenestrated endothelial cells
Because of the difficulty of obtaining high quality RNA from cadaveric tissues, we
could only generate information in relationship to the choroid through analysing
zinc transporter expression in bEND5 cells. These cells are used to model fenestrae
formation in endothelial and in Chapter 6 we will study the effects of zinc in this
specialized system. While bEND5 cells are derived from rat they provide some
indication about zinc transporter expression in fenestrated endothelial cells. The
gene expression profile of bEND5 cells was very similar to that of ARPE19 cells.
Many transporters appeared to be expressed in these cells although ZnT2, 3, 8, 10
and ZIP2 and 12 were not. Despite the lack of expression of SLC39A12 in bEND5
cells, the expression of this protein in cadaveric choroidal tissue is very high
compared to the other tissues we examined. Given that Boiij et al found that ZIP12
is highly enriched in RPE cells compared to choroid in laser micro-dissected human
cadaveric samples, the higher expression of SLC39A12 in choroid samples
compared to the RPE in our experiments remains to be experimentally validated
(Booij et al., 2010b).
3.7.3. Zinc Transporters in the Retina3
“Relatively little is known about zinc transporters in other parts of the eye. Our
QRT-PCR data suggest that Muller cells express 8 out of the 10 ZnTs and 11 out of
the 14 ZIPs, while primary retinal ganglion cells express 9 out of the 10 ZnTs and
13 out of the 14 ZIPs (see Figure 3.1). Redenti et al (Redenti and Chappell, 2004a)
found ZnT3 protein in several layers of the retina, namely the inner segments and
outer limiting membrane of photoreceptors, the inner nuclear layer and outer
plexiform layer and the strongest labeling was present in both ganglion and Muller
cells. This associates ZnT3 and therefore zinc with neuronal transmission (Palmiter
et al., 1996). The only other transporter whose immunolabeling has been reported
in the literature is ZnT7 (Wang et al., 2006a). Immunolabeling for ZnT7 is present
in optic nerve fibers, ganglion cells, inner and outer plexiform layers, horizontal
3 Barzegar-Befroei, N., Cahyadi, S., Gango, A., Peto, T., and Lengyel, I. 2011. Zinc
in Eye Diseases. Zinc in Human Health. Amsterdam: IOS Press.

110
and amacrine cells and the photoreceptor outer segments (Wang et al., 2006a),
suggesting that ZnT7 plays a wide ranging role in the retina.”
3.7.4. Eye Phenotype in Zinc Transporter Knockout Animals4
“The role of zinc and zinc-dependent mechanisms in development (Prasad, 1998)
indicated that appropriate zinc homeostasis might be important for normal eye
development. In support of this, the examination of eye phenotypes of transgenic
animals showed that an array of developmental abnormalities is associated with the
lack of zinc transporter genes. For example, in ZIP4 knockout mice, exencephalia,
severe growth retardation, and hydrocephaly, was accompanied by unilateral or
bilateral anophthalmia. The manifestations of these could be exacerbated with zinc
deficiency and ameliorated by zinc supplementation in heterozygous but not in
homozygous embryos (Dufner-Beattie et al., 2007). Fukada et al reported that
ZIP13 is crucial in connective tissue development. ZIP13 knockout caused sunken
eyes which were also associated with down slanting palpebral fissures (Fukada et
al., 2008). The abnormalities were attributed to a decrease in dermal collagen fibril
sizes and thinning of corneal stroma. ZIP13 knockout effects also extended to
improper osteogenesis and craniofacial tissue development.”
3.8. Future Plans
One of the original goals of this thesis was to compare the expression of zinc
transporters in AMD and control subjects to improve our understanding of how zinc
homeostasis can be affected in diseased conditions. However, experiments on
cadaveric tissues presented several problems, which we are just managing to
resolve. Therefore, in the near future we will analyse zinc transporter expression in
a selection of cadaveric samples. A comprehensive analysis of immunolocalisation
of transporters would also be of interest. In a genetics study (in collaboration with
Professor John Yates), we are examining the results from genome wide association
studies to identify potential single nucleotide polymorphisms on the 24 zinc
transporters. Based on preliminary data it appears that there are potential
association between zinc transporter SNPs and AMD (data not shown) though
4 Barzegar-Befroei, N., Cahyadi, S., Gango, A., Peto, T., and Lengyel, I. 2011. Zinc
in Eye Diseases. Zinc in Human Health. Amsterdam: IOS Press.

111
further sampling and verification by PCR will be required before solid conclusions
could be drawn (data not shown).
The results presented in this chapter needs to be taken with caution due to cross-
contamination, lower quality RNA due to post-mortem tissue processing,
particularly in the RPE and choroid samples. Future experiments will have to
address cross-contamination issues, possibly through creation of very early passage
primary cultures of human RPE. Furthermore, better dissection procedure need to
be adopted for cadaveric RNA isolation, particularly in choroidal samples as QRT-
PCR results indicated that there is heavy contamination from the RPE. Possible
method to alleviate this problem may include laser microdissected samples from
human cadaveric tissue.
Conclusion
Using SYBRGreen and TaqMan based detection assays we were able to start the
cataloguing of zinc transporter expression in the retina/RPE/choroid complex.
While this work is far from complete, it helped us and others to identify some
potentially important zinc transporters for RPE cells. We became particularly
interested in ZIP12 because of its unusually high expression in freshly isolated RPE
cells and very low or non-existent expression in cultured cells although major
caution needs to be exercised during interpretation of the result due to
contamination from the corresponding tissue as well as low replication number of
experiments.

112
4. Characterisation of ZIP12: Structure, Function
and Localisation
As we showed in the previous chapter, several zinc transporters are expressed in
the RPE-choroid interface. ZIP12 appears to be an exception. Its gene
expression was either very low or absent in all cultured cells, including human
primary RPE cultures, but was highly expressed in human cadaveric tissues.
This finding was supported by recent findings on laser dissected human RPE
cells, suggesting that SLC39A12 is one of the RPE specific genes (Booij et al.,
2010b). We argue here that ZIP12 is a potentially important candidate gene for
regulating zinc fluxes at the RPE-choroid interface and its lack of expression
under culturing conditions might contribute to the phenotypic anomalies
observed in in vitro experiments using ARPE19 cells. As ZIP12 is probably the
least studied zinc transporter, we first examined how this transporter might
function. Available information on ZIP12 was collected through data mining
and bioinformatic tools to understand the protein structure before the cellular
localisation of the protein was observed through transiently expressing it in
various cell lines. Finally the possible relationship(s) between ZIP12 and RPE
was explored.
There is very little published information on ZIP12 or its gene SLC39A12. Reports
have linked ZIP12 to schizophrenia (Bly, 2006), Alzheimer’s disease (Grupe et al.,
2006) and cancer (Sotiriou et al., 2006). Despite the paucity of published peer
reviewed information on ZIP12, we explored what can be found out about ZIP12 and
its gene SLC39A12 in existing databases.
4.1. SLC39A12 Isoforms
SLC39A12 (UniProt accession Q504YO), is located on chromosome 10p12.33.
There are 5 splice variants of SLC39A12 (www.ensembl.org) which is summarised
in Table 4.1.

113
Table 4-1- Five isoforms of SLC39A12 (ZIP12).Data obtained from
www.ensembl.org
Name Amino Acid Length Transcript Length
SLC39A12-001 690 2725 bps
SLC39A12-002 654 2639 bps
SLC39A12-201 691 2808 bps
SLC39A12-202 611 2483 bps
SLC39A12-203 557 1900 bps
Figure 4-1- Five isoforms of ZIP12
Five isoforms of ZIP12 protein are shown, with the longest SLC39A12-201 isoform
having 691 amino acid residues, SLC39A12-001 containing 690 amino acid
residues with a deletion of residue K474. SLC39A12-002 contained a deletion
between transmembrane III and IV, between residues 474-510 resulting in a protein
with 654 amino acid residues. SLC39A12-202 has 611 amino acid residues, with
truncation in the first 80 amino acids. SLC39A12-203 contains truncation in the
first 134 amino acids.

114
4.2. The ZIP12 protein
Based on sequence homologies using ClustalW
(http://www.ebi.ac.uk/Tools/msa/clustalw2/) the ZIP protein family was divided
into four subfamilies where ZIP12 belongs to the LIV-1 subfamily (Figure 4.2).
LIV-1 family members are thought to facilitate zinc uptake or influx (Taylor et al.,
2007). There are three defining features of the LIV-1 subfamily:
-LIV-1 members are expected to have 8 transmembrane domains and are localised
predominantly on the plasma membrane.
-All members should contain a histidine-rich motif, which has been suggested to be
directly involved in zinc transport.
-All members should contain a highly conserved CPALLY domain at the N-
terminal extracellular domain, whose function is currently unknown (Taylor et al.,
2007).
Using Compute pI/Mw program from Expasy (http://web.expasy.org/compute_pi/),
the molecular weight of the 691 amino acid long ZIP12 protein was predicted to be
76 kDa with an isoelectric point of 5.85. Based on prediction by DAScurve
(http://mendel.imp.ac.at/sat/DAS/DAS.html), PSIPRED
(http://bioinf.cs.ucl.ac.uk/psipred/) and TMPRED
(http://www.ch.embnet.org/software/TMPRED_form.html) confirmed that ZIP12 is
a protein with 8 transmembrane domains (Figure 4.4). However, Sosui
(http://bp.nuap.nagoya-u.ac.jp/sosui/sosui_submit.html), that uses hydrophobicity
features of the amino acid sequences to predict helical structures, returned with five
transmembrane domains and TMHMM (http://www.cbs.dtu.dk/services/TMHMM/
) returned seven transmembrane domains on ZIP12. All the transmembrane
domains are located at the C-terminal half of the protein and the N-terminus is
predicted to form a large part of the extracellular domain. There is a putative signal
peptide sequence between residues 1-23 (http://www.cbs.dtu.dk/services/SignalP/)
which could aid the insertion to the membrane. Overall the ZIP12 protein is
expected to be a plasma membrane protein. As we will show later a C-terminal
tagged form of ZIP12 is indeed localized to the plasma membrane (Figure 4.18).

Figure 4-2 - Phylogenetic tree of SLC39 families.
SLC39 family of zinc transporters a
belong to ZIP Subfamily II, ZIP
subfamily, ZIP4, 5, 6, 7, 8, 10, 12, 13 and 14 belong to the largest subfamily called
LIV-1. ZIP7 and 13 is
Image was created using ClustalW and edited in Adobe Photoshop CS4.
Figure 4-3 – Multiple alignments of ZIP12 peptide sequences among six common
mammals human, mouse, rat, horse, pig and
Phylogenetic tree of SLC39 families.
mily of zinc transporters aredivided into 4 subfamilies. ZIP1, 2, and 3
ZIP Subfamily II, ZIP 4 and 9 belong to Subfamily I, ZIP11 to gufA
subfamily, ZIP4, 5, 6, 7, 8, 10, 12, 13 and 14 belong to the largest subfamily called
1. ZIP7 and 13 is further grouped into HKE4 within the LIV
Image was created using ClustalW and edited in Adobe Photoshop CS4.
Multiple alignments of ZIP12 peptide sequences among six common
human, mouse, rat, horse, pig and cow.
115
ivided into 4 subfamilies. ZIP1, 2, and 3
nd 9 belong to Subfamily I, ZIP11 to gufA
subfamily, ZIP4, 5, 6, 7, 8, 10, 12, 13 and 14 belong to the largest subfamily called
further grouped into HKE4 within the LIV-1 subfamily.
Image was created using ClustalW and edited in Adobe Photoshop CS4.
Multiple alignments of ZIP12 peptide sequences among six common

Figure 4-4 – Hydrophobic plot for ZIP12 protein
Hydrophobic plot created using TMpred program showed the presence of 10 peaks
above the threshold. Combining t
transmembrane domains prediction programs indicated the potential presence of 8
transmembrane domains
transmembrane domains are located in the second half of the pr
approximately residues 400
made after comparing various secondary structure prediction programs (see section
4.2). TMPred returns with 2 additional transmembrane domains before
transmembrane I, however, this was not shared by the other programs.
Hydrophobic plot for ZIP12 protein
Hydrophobic plot created using TMpred program showed the presence of 10 peaks
above the threshold. Combining the plot with results obtained from other
transmembrane domains prediction programs indicated the potential presence of 8
transmembrane domains in ZIP12 protein (annotated on the graph). All the
transmembrane domains are located in the second half of the protein structure from
approximately residues 400-691. The annotation for transmembrane domains was
made after comparing various secondary structure prediction programs (see section
4.2). TMPred returns with 2 additional transmembrane domains before
brane I, however, this was not shared by the other programs.
116
Hydrophobic plot created using TMpred program showed the presence of 10 peaks
he plot with results obtained from other
transmembrane domains prediction programs indicated the potential presence of 8
in ZIP12 protein (annotated on the graph). All the
otein structure from
The annotation for transmembrane domains was
made after comparing various secondary structure prediction programs (see section
4.2). TMPred returns with 2 additional transmembrane domains before
brane I, however, this was not shared by the other programs.

117
A histidine-rich HXXHXHH sequence can be found between transmembrane
domains III and IV and a CPALLY-like domain is located adjacent to the TMI on the
extracellular domain of ZIP12 (Figure 4.5). It is interesting to note that in isoform
SLC39A12-002 a deletion of 35 amino acids between TMIII and IV eliminated the
HXXHXHH residues, a histidine-rich sequence which has been suggested to bind
zinc (Taylor, 2000). NetPhos3.8 program (http://www.cbs.dtu.dk/services/NetPhos/)
predicted that there are 38 serine, 7 threonine and 6 tyrosine phosphorylation sites
(data not annotated). One of these is Ser36, the amino acid residue that can be altered
from serine into glycine, and this polymorphism has been associated with
schizophrenia (Bly, 2006). This site is a consensus phosphorylation site for glycogen
synthase kinase-3, suggesting that ZIP12 might be a target for GSK-3 signalling.
Interestingly, GSK-3 signalling is thought to play a role in the pathogenesis of
Alzheimer’s disease (Takashima, 2006). This phosphorylation site is just
downstream of a potential peptidase cleavage site located between residues 23 and
24 (http://www.cbs.dtu.dk). Annotated in pink are 6 potential glycosylation sites, all
of which are found on the extracellular domain. In TMV, there is a conserved
HEXXHEXGD metalloprotease-like domain, which is also present in other LIV-1
family members.
Table 4.2 highlights the sequence motifs or relevant sequences found in ZIP12
human protein sequence. Amino acids 1-20 show the sequence recognised by the
Abcam (commercial) antibody which is used in this chapter. This sequence
coincides with the signal peptide which would be cleaved in ZIP12 protein. We
have used this antibody on cells and sections. Optimisation protocols using various
fixation methods on ZIP12-transfected cells as well as various antigen-retrieval
steps such as pressure cooker and microwaving sections did not produce any
specific staining (data not shown). Upon enquiring with Abcam, it was determined
that the antibody would not have worked as it coincides with the signal peptide. A
potential cleavage site is located on residues 23-24 just after the signal peptide. A
few of glycosylation sites (highlighted in pink) are present, all of which are located
on the N-terminal of the protein. There is a potential GSK-3 beta phosphorylation
site on residue 27-31 (red, underlined). In order to understand the function of ZIP12
further, we designed an antibody which recognises residues 294-305, which will
subsequently be called ZIP12-5193 and ZIP12-5194 (red, highlighted). Soon after

118
the ZIP12 -5193/5194 sequence is a LIV-1 family-specific CPALLY motif (in
green). Transmembrane I and II are located between residues 362-393 and 399-420.
The histidine-rich region between residues 421-447 contains four histidine residues
which is may have the capability to bind zinc. Transmembrane III is located
between residues 448-469, and transmembrane IV from residues 540-563. Residues
474-510 contain a metal-binding motif HXXHXHH. The deletion of this residue in
the truncated isoform of ZIP12 may have importance in function. Transmemrane V
is located from residues 540-563. Within transmembrane V from 570-593 there is a
metalloprotease domain HEIPHEMGD. The rest of the protein contains
transmembranes VI, VII and VIII.
All five splice variants of ZIP12 protein share the same sequences, with no
polymorphisms within conserved peptide sequences, with only deletions and
truncations present. The longest variant has 691 amino acids (SLC39A12-201). The
splice variant with the closest homology to SLC39A12-001 is SLC39A12-001
containing 690 amino acids with a deletion of a lysine residue at position 474
(www.ensembl.org). SLC39A12-002 contained a deletion between transmembrane
III and IV, between residues 474-510 resulting in a protein with 654 amino acid
residues where the histidine rich motif HXXHXHH is located. This result was also
confirmed using GenBank. Histidine is an amino acid which has the capability to
bind zinc through its imidazole ring. The loss of histidine-rich sequence in
SLC39A12-002 creates an opportunity for functional analysis to see whether the
truncation alters zinc transport capability as the sequence harbors a histidine rich
motif HXXHXHH. Interestingly, sequence alignment using ClustalW2 shows that
mouse does not have the human equivalent of sequence 474-510, meanwhile this
sequence is preserved in other species such as pig, horse and rat.
SLC39A12-202 has 611 amino acid residues, with truncation in the first 80 amino
acids. SLC39A12-203 is the shortest isoform of the five, with truncation in the first
134 amino acids. Alignments of SLC39A12 peptide sequences (Figure 4.3) in
various species including human (Homo sapiens), mouse (Mus musculus), rat (Rattus
norvegicus), pig (Sus scrofa), cow (Bos Taurus), and horse (Equus cabalus) showed
similar protein sizes with often different but conserved amino acid residues
(www.ensembl.org ). There are three sub-branchings, with pig and bovine ZIP12
located on separate branches, the third sub-branch comprised of human, horse and

119
another smaller sub-branch containing rat and mouse ZIP12 sequences (see Figure
4.3)
1 MCFRTKLSVS WVPLFLLLSR VFSTETDKPS AQDSRSRGSS GQPADLLQVL SAGDHPPHNH
Abcam Antibody Cleavage S36G GSK-3
61 SRSLIKTLLE KTGCPRRRNG MQGDCNLCFE PDALLLIAGG NFEDQLREEV VQRVSLLLLY
121 YIIHQEEICS SKLNMSNKEY KFYLHSLLSL RQDEDSSFLS QNETEDILAF TRQYFDTSQS
181 QCMETKTLQK KSGIVSSEGA NESTLPQLAA MIITLSLQGV CLGQGNLPSP DYFTEYIFSS
241 LNRTNTLRLS ELDQLLNTLW TRSTCIKNEK IHQFQRKQNN IITHDQDYSN FSSSMEKESE
ZIP12-5193/5194 site
301 DGPVSWDQTC FSARQLVEIF LQKGLSLISK EDFKQMSPGI IQQLLSCSCH LPKDQQAKLP
CPALLY
361 PTTLEKYGYS TVAVTLLTLG SMLGTALVLF HSCEENYRLI LQLFVGLAVG TLSGDALLHL
TMI TMII
421 IPQVLGLHKQ EAPEFGHFHE SKGHIWKLMG LIGGIHGFFL IEKCFILLVS PNDKQGLSLV
TMIII
481 NGHVGHSHHL ALNSELSDQA GRGKSASTIQ LKSPEDSQAA EMPIGSMTAS NRKCKAISLL
Lost in SLC39A12-002
541 AIMILVGDSL HNFADGLAIG AAFSSSSESG VTTTIAILCH EIPHEMGDFA VLLSSGLSMK
TMIV TMV
601 TAILMNFISS LTAFMGLYIG LSVSADPCVQ DWIFTVTAGM FLYLSLVEML PEMTHVQTQR
TMVI TMVII
661 PWMMFLLQNF GLILGWLSLL LLAIYEQNIK I
TMVIII
Figure 4-5– Annotated sequence of ZIP12 protein
The protein sequence for ZIP12 shows 8 potential transmembrane domains
(underlined sequences labeled TMI-VIII), a classic CPALLY motif (labeled green),
the HxxHxH zinc site (labeled blue) inside a a cleavage site between residue 23
and 24 (labeled with magenta), as well as potential phosphorylation site for
Glycogen Synthase Kinase 3 (GSK-3) SRGSS (labeled red), between 421-447
(labeled brown) is the histidine-rich region (data obtained from various sources).

120
Table 4-2 - Details of Sequence Motif Found in ZIP12 Protein Sequence
Sequence
Number
Sequence Potential Motif/
Structure
1-20 MCFRTKLSVSWVPLFLLLSR Abcam Antibody
1-17 MCFRTKLSVSWVPLFLL Signal Peptide
23-24 ST Potential cleavage site
59-62, 134-
137, 162-165,
201-204, 242-
245, 290-293
NHSR, NMSN, NETE, NEST, NRTN,
NFSS
Glycosylation sites
27-31 SRGSS GSK3-beta
phosphorylation site
294-305 SMEKESEDGPVS ZIP12-5193/4
Sequence
310-349 CLIPIIQC CPALLY domain
362-393 PTTLEKYGYSTVAVTLLTLG
SMLGTALVLF HSC
TMI
399-420 LI LQLFVGLAVG TLSGDALLHL TM II
421-447 IPQVLGLHKQ EAPEFGHFHE SK
GHIWK
Histidine Rich Region
448-469 LMG LIGGIHGFFL IEKCFILLVS TM III
474-510
KQGLSLVNGHVGHSHHLALN
SELSDQAGRGKSASTIQ
Deleted in truncated
isoform with 654
amino acids
493-499 HVGHSHH HXXHXHH
540-563 LAIMILVGDSL HNFADGLAIG AAF TM IV
570-593 GVTTTIAILCH EIPHEMGDFA VLLSS TM V
570-575 HEIPHEMGD Metalloprotease
domain
607-625 FISS LTAFMGLYIG LSVSA TM VI
642-665 DWIFTVTAGM FLYLSLVEML
PEMTH
TM VII
666-689 LLQNF GLILGWLSLL LLAIYEQNIK TM VIII

121
4.3. Specific Expression of SLC39A12 in Tissues
Based on the EST database, SLC39A12 mRNA is expressed in brain, retina and
kidney, throughout foetal, juvenile and adult life in human tissues (Figure 4.7)
(http://ncbi.nlm.nih.gov/UniGene/ESTProfileViewer). Gene microarray data from
mouse (http://biogps.gnf.org) showed that ZIP12 is expressed in the retinal pigment
epithelium, the ciliary body, iris, and the eyecup (Figure 4.6). In situ hybridisation of
mouse brain located ZIP12 to the brain ventricles (see figure 4.7 arrow). It has been
known that ventricles harbor a high concentration of MTF-1 (Hao et al., 1994),
which suggests that zinc can be released here and taken up by the brain probably
through the involvement of zinc transporters.
4.4. Aims
In chapter 3, we showed the absence of ZIP12 expression in cultured cell lines and
its high expression in cadaveric tissue. This chapter aims to study how ZIP12 is
involved in regulating zinc using the following strategy:
1. Clone ZIP12 and generate tagged versions to express ZIP12 in different cell lines.
2. Raise and characterise antibodies against ZIP12.
3. Characterise commercially available ZIP12 antibodies.
4. Express ZIP12 protein in ARPE19 cells to understand how the expression affects
the cells’ phenotype.
5. Analyse available Genome-Wide Association studies or Microarray studies to
develop further working hypotheses concerning the potential role of ZIP12 in the
RPE.

Figure 4-6– Expression Profile Analysis for SLC39A12
Expression profile analysis done on mouse microarray data and acces
BioGPS (http://biogps.gnf.org
present in various areas of the brain and the spinal cord. Within the eye, expression
of SLC39A12 is detected
Expression Profile Analysis for SLC39A12
Expression profile analysis done on mouse microarray data and acces
http://biogps.gnf.org) indicated that the expression of SLC39A12 is
present in various areas of the brain and the spinal cord. Within the eye, expression
of SLC39A12 is detected in the RPE, iris, ciliary body, eyecup and lens.
122
Expression profile analysis done on mouse microarray data and accessed from
) indicated that the expression of SLC39A12 is
present in various areas of the brain and the spinal cord. Within the eye, expression
, eyecup and lens.

123
Figure 4-7–EST profile and for Slc39a12 and expression of Slc39a12 in brain
Expression of ZIP12 mRNA is highest in the brain ventricle of mouse (From Allen’s
brain atlas) http://mouse.brain-map.org/. Expression sequence tag (EST) profile
analysis showed that the expression of SLC39A12 is limited to the brain, embryonic
tissue and the eye, as well as being present during organogenesis as well as juvenile
and adult state. EST profiles approximate gene expression levels from various cDNA
library sources. The number on the right (125372, 291299, 995094, etc) refers to the
total number of EST in pool, meanwhile on its left (2, 5, 19, etc) refers to the number
of Slc39a12 transcript present in the EST pool. The leftmost number (15, 27, 21 etc)
refers to the number of transcript per million EST, thereby allowing comparison to be
made between samples.

124
4.5. Cloning and expression of ZIP12
The cloning of ZIP12 protein was done using Gateway® recombination cloning
technology(Invitrogen, UK). The method differs from usual cloning using
restriction enzymes in that preferred DNA fragments can immediately be inserted
to expression vectors without the need of restriction endonucleases or DNA ligases.
There are several advantages of using the Gateway Technology in contrast to
standard way of cloning:
1. Improved accuracy and easier procedures as the use of restriction enzymes and
ligases are not required. The design also prevents shifts in reading frames.
2. Once a donor clone has been generated, the donor clone can be used to produce
other fusion proteins by immediate insertion to other expression vectors.
3. The insertion of attB-flanked PCR product to the donor vector or “entry clone”
only takes 3-4 hours before the entry clone is ready to be plated on Zeocin agar
plates and is therefore much faster than normal cloning strategies.
As none of our tested cell lines had ZIP12 expression, commercially purchased
retinal cDNA (kind gift from Rebecca Kaye) was used as a template for cloning
(Figure 4.8). The cDNA was used as a template for PCR using a specialised 25 base
pair primer containing proprietary “attB” sequences and a Kozak sequence for the
forward primer (for further details see materials and methods section as well as
appendix). In the case where a C-terminal fusion protein was desired, the primer
design did not incorporate the stop codon nucleotides to allow translation of the
fusion proteins. The PCR template was inserted to a donor vector pDONR/Zeo
through the use of proprietary BP clonase enzyme. The “entry clone” generated
could then be used for insertion of a variety of expression vectors. Using LR-
clonase, a similar recombination step was performed to insert the flanked ZIP12 to
the expression vectors (see Appendix 5). ZIP12 proteins were created with the
longest ZIP12 isoform containing 691 amino acids. The resulting expression vector
containing ZIP12 was then amplified according to the protocol described in the
materials and methods section before thoroughly screened for possible mutations
using T7 promoter, and 5 primers, which screened overlapping sequences of the
entire SLC39A12 gene

125
Figure 4-8– Gateway Recombination Cloning Technology
Gateway Technology is a two-step method to create a plasmid DNA containing the
gene of interest. The process is started by using a DNA template (in our case,
retinal cDNA) to create a PCR product flanked with proprietary attB cassette
sequences. The use of BP clonase enzyme allows “swapping” between the attB and
attP sites in the donor vector, inserting the attB flanked gene of interest into the
donor vector and creating the attL sites inside the new entry clone (Panel A). This
step also produced a by-product of attR flanked ccdB sensitivity gene cassette. The
entry clone is a platform to generate plasmid DNAs that will generate fusion
proteins. The recombination step of entry clone and destination vector involves the
enzyme LR clonase, which generates the expression clone containing the gene of
interest and the by-product of ccdB gene cassette inside what was originally the
donor vector.
Figure 4-9– Polymorphism found in retinal cDBA for screening
The retinal cDNA used for creating the clones was found to have a silent mutation
T33C which codes for the same amino acid residue aspartic acid. The mutation is a
known SNP for SLC39A12 (rs691112).

126
Screening the human retinal cDNAresulted in the finding of a synonymous mutation
(GAT GAC) in amino acid residue 33 caused by a known SNP(rs691112) for
SLC39A12 (Figure 4.9). As this did not change the amino acid sequence, the retinal
cDNA was used in our experiments.
Two C-terminally tagged ZIP12 fusion proteins were generated (V5 affinity tag and
GFP). Overexpression was only achieved with the C-terminally V5 tagged ZIP12
protein. The failure of expression of C-terminally tagged GFP-ZIP12 might possibly
be caused by the interference of the large (27kD) GFP protein with folding and
insertions into the membrane, a problem that had been previously reported for other
GFP-fused membrane proteins (Pedelacq et al., 2006).
Transient expression of ZIP12-V5 fusion protein was first achieved through
transfection of HEK293 cells. Transfection efficiency was assessed by using 200,
400, 800, 1000ng plasmid DNA and 2, 4, and 8µl of LipofectamineLTX (data not
shown). Following this optimization step, HEK293 cells were routinely transfected
with 800ng pcDNA3.1-ZIP12-V5 in the presence of 4µl of LipofectamineLTX
(Invitrogen, UK) per 70,000 cells (Figure 4.10). The cells were incubated with the
LipofectamineLTX-DNA complex for 30 hours at 37 °C before being fixed with ice
cold MeOH for 5 minutes at -20 °C. As controls, sham transfections (where only
LipofectamineLTX reagent was used) were performed following the same protocol
except DNA was excluded. Transfection efficiency was checked by q-RT-PCR,
which confirmed ZIP12 fusion protein overexpression with 800ng plasmid and by
immunolabeling with a V5 and ZIP12 specific antibodies (Figure 4.10) (for antibody
characterisation see later).

Figure 4-10– ZIP12 tr
HEK293 cellswere either
subjected to sham transfection with only the transfection reagent present. The cells
were fixed with MeOH and stained with ZIP12
(Panels B,F,J)(Invitrogen).
594 meanwhile V5 antibody was
cells showed positive staining with V5 and ZIP12
transfected cells show
5194. Quantitation of fluorescence was not performed. Nuclear sta
performed using DAPI. For higher magnification of HEK293 cells transfected with
ZIP12-V5 protein labeled with V5 and ZIP12
and C. All images were viewed
magnification.
ZIP12 transfection in HEK293 cells
HEK293 cellswere either transfected with C-terminally tagged ZIP12
subjected to sham transfection with only the transfection reagent present. The cells
were fixed with MeOH and stained with ZIP12-5194 (Panels C,G,K)
(Invitrogen). ZIP12-5194 antibody was conjugated
594 meanwhile V5 antibody was conjugated with Alexa-Fluor 488.
cells showed positive staining with V5 and ZIP12-5194, meanwhile sham
transfected cells show no staining with V5 and background staining with ZIP12
5194. Quantitation of fluorescence was not performed. Nuclear sta
performed using DAPI. For higher magnification of HEK293 cells transfected with
V5 protein labeled with V5 and ZIP12-5194, refer to figure 4.17 panels B
All images were viewed using LSM700 confocal microscopy with
127
terminally tagged ZIP12-V5 protein or
subjected to sham transfection with only the transfection reagent present. The cells
(Panels C,G,K) and V5
with Alexa-Fluor
Fluor 488. Transfected
5194, meanwhile sham
no staining with V5 and background staining with ZIP12-
5194. Quantitation of fluorescence was not performed. Nuclear staining was
performed using DAPI. For higher magnification of HEK293 cells transfected with
94, refer to figure 4.17 panels B
using LSM700 confocal microscopy with 20x
128
4.6. Generation and Characterisation of Antibodies for ZIP12
Methods
Antibodies were generated commercially by Biogenes GmBH (Germany). After
exploring potential epitopes, considering the position of functional domains, and
cleavage sites, antibodies were raised in two rabbits against residues 294-305 on
ZIP12 protein which are located directly before the conserved, extracellular
CPALLY domain on the N-terminal of the protein. The polyclonal antibodies
generated in the two rabbits were termed ZIP12-5193 and ZIP12-5194. The
antibodies were tested on Jurkat cell lysate, purchased from Abcam (Cambridge,
UK) (Abcam, Cat No AB64463), ZIP12-V5 over-expressed in HEK293 cells and
ZIP12-V5 over-expressed using a cell-free in vitro translational system.
Simultaneously, immunocytochemistry was carried out on different cell lines using
all three antibodies for ZIP12 (ZIP12-5193, ZIP12-5194 and Abcam) in transfected
and fixed cells. The Jurkat lysate have been suggested to contain ZIP12 using a
commercially available antibody against ZIP12 (Abcam, Cat No AB64463).
Results
Five µg protein of the Jurkat lysate was loaded onto precast AnyKD polyacrylamide
gels from BioRad before being blotted onto PVDF (BioRad) membranes and probed
with ZIP12-5193 and, ZIP12-5194. The antibodies (undiluted immunosera) were
diluted between 1:7,000 and 1:30,000 (Figure 4.12). At 1:7,000 dilution we could
identify two bands on SDS-PAGE with both antibodies one at ~80 kDa and the other
at ~130 kDa. With dilution the band intensities decreased but to different degrees by
the two antibodies. ZIP12-5194 labeled the 80 kDa band more strongly while the
ZIP12-5193 labeled the 130 kDa band more strongly. No other bands were labeled in
Jurkat cell lysate in this experiment (Figure 4.11). However, none of these antibodies
labeled the 75kDa protein band identified by the commercial ZIP12 antibody (Figure
4.12)

129
In order to verify that the two bands observed on Figure 4.11 are both ZIP12, a
peptide competition experiment was carried out using the synthetic peptide fragment
we raised the antibodies against. For this, 1µg/1ml of peptide solution was used to
deplete the 1:7000 dilutions of antibodies and blots containing five µg Jurkat lysate
were probed with this peptide and antibody complex. Following visualization by
electrochemiluminescence (ECL) the 80 kDa band was absent, but the 130kDa band
remained strongly labeled using both of our antibodies. Incubating the PVDF
membranes with the preimmune serum which demonstrates of any non-specificsignal
showed no labeling (Figure 4.12). Interestingly, ZIP12-5193 this time labeled three
bands, a ~ 130 kDa, a ~80 kDa and a ~60 kDa band. Peptide incubation of ZIP12-
5193 did not block the labeling of the 60 kDa band.

130
Figure 4-11–Optimisation of ZIP12-5194 and ZIP12-5193 in Jurkat lysate
Optimisation of ZIP12-5194 (Panel A) and ZIP12-5193 (Panel B) using diluted
Jurkat lysate showed the presence of two bands just above 100kD and 75kD. 5µl of
diluted lysate was used in every single lane. With dilution, the 100kD band was
able to be seen. This is in contrast with Panel B, where incubation with antibody
ZIP12-5193 showed that dilution of antibody removed the 75kDa band. Using
peptide incubation, we had previously determined that the 75kDa band was able to
be removed after incubation with peptide.

131
Figure 4-12 – Peptide incubation of ZIP12-5193 and ZIP12-5194
Incubation of ZIP12-5193 and ZIP12-5194 in Jurkat lysate at 1:7000 dilution show
three bands and two bands at just above 100, 75 and 50 kD respectively. Peptide
incubation for both ZIP12-5193 and ZIP12-5194 indicated that the band just above
100 kD was removed. This strongly indicated that the removed band is ZIP12
protein. Preimmune sera showed no bands. Antibody dilution used for both
antibodies was 1:7000. ZIP12-Abcam shows a single band at 75kDa. Antibody
dilution for ZIP12-Abcam was 1:1000.

132
To clarify further whether the different antibodies recognise ZIP12 protein the
ZIP12-V5 plasmid was expressed using TnT® Quick Coupled
Transcription/Translation System (Promega, UK).
Methods
This system uses a bacterial expression system to synthetically produce eukaryotic
proteins from plasmid DNA sources without the need for cellular transfection. The
protein products were run on SDS gels and blotted onto PVDF membrane as before,
then labeled with a commercially available V5 antibody (Invitrogen, Paisley, UK)
following the manufacturer’s instructions.
Results
At higher concentrations of proteins we noticed two bands; a high molecular weight
diffuse band at ~175 kDa and one at ~65kDa (Figure 4.13). Dilutions of the protein
lysate with lysis buffer helped the dissolution of the high molecular weight band
and above 1:64 dilutiononly the ~65 kDa band was apparent. In the negative
control, which did not contain the ZIP12-V5 plasmid, no bands were detected
(Figure 4.14). However, probing the ZIP12-V5 protein with ZIP12 Abcam or ZIP-
5193 and ZIP12-5194 antibodies resulted in no specific immunoreactivity (Figure
4.14). While we have no clear explanation for this discrepancy, it is probable that
the lack of cellular mechanisms required for appropriate folding and
posttranslational modifications (phosphorylation, methylation, glycosylation) could
have led to the unsuccessful immunolabeling with the ZIP12 antibodies. The
apparent lower than expected molecular weight for ZIP12 in this cell free system
appears to support this.

133
Figure 4-13–Cell-free production of ZIP12 protein
TnT® Quick Coupled Transcription/Translation System (Promega, UK) was used
to synthetically produce eukaryotic proteins from plasmid DNA sources using a
proprietary bacterial expression system. Protein products generated using C-
terminally tagged ZIP12-V5 were diluted with lysis buffer and sample buffer to
final dilution of 1:16 (Lane A), 1:32 (Lane B), 1:64 (Lane C), 1:128 (Lane D),
1:256 (Lane E) and negative control which does not contain plasmid DNA. Five µl
of the products was loaded onto SDS-polyacrylamide gels, transferred onto PVDF
membrane and immunoblotted using HRP antibody before visualising using ECL.

134
Figure 4-14- Staining using V5 and ZIP12 antibodies of TnT Quick coupled
transcription Translation System
Staining using V5 and ZIP12 antibodies of TnT Quick coupled transcription
Translation System produced proteins showing a single band at ~60kDa as seen
using V5 antibody (Panel V5). The negative control shows no labeling of V5
antibody (Panel V5 -). Labeling with ZIP12-5194 and ZIP12 Abcam showed no
labeling both with plasmid DNA included and without (Panels ZIP12 5194, ZIP12
5194 -, ZIP12 ABCAM, ZIP12 ABCAM-). ZIP12 5193 antibody detected a similar
band at ~60kDa, however negative control for this antibody showed a positive
signal of the same size. Dilution used in this experiment is 1:16 and 5µl of diluted
lysate was used.

135
HEK293 cells over-expressing ZIP12-V5 fusion protein were used to overcome the
lack of posttranslational modifications and folding of ZIP12 protein. Following
lysis, 10 µg/lane cell lysates were run on SDS gels, blotted onto PVDF membranes
and probed with the V5 and the ZIP12 antibodies and in some cases with an
antibody against actin (Santa Cruz BT, UK). As expected actin migrated to 43kDa,
corresponding to the size of the protein. V5 staining showed a diffuse band at about
~175kDa, a similar band to that seen in theTnT® Quick Coupled
Transcription/Translation System, but no presence of a lower molecular weight
band. This is unlikely to be caused by failure of all proteins to migrate, as clear
labeling of appropriately migrated actin was observed. It is possible that the reason
for this single high molecular weight band is protein aggregation of the
overexpressed ZIP12-V5 protein with other proteins or itself. Therefore, we tried to
disassemble this complex by sonication (Figure 4.15) or the use of different
reducing agent and detergents (Figure 4.16) like beta-mercaptoethanol, Nonidet-
P40 and TritonX-(100). However, none of these alleviated the presence of high-
molecular weight protein aggregates (Figure 4.16B). Most importantly, while V5
antibody was able to detect the protein aggregates, none of the ZIP12 antibodies
manage to label the protein complexes (Figure 4.16) though our antibodies detected
the ~130 kDa and the ~80 kDa bands shown in Jurkat cell lysates even in those
cells that had not been transfected, indicating that these bands are unlikely to be
ZIP12.

136
Figure 4-15–Sonication fails to remove protein aggregates
Twenty µg of transfected HEK293 lysate with C-terminal V5 ZIP12 protein was
loaded on SDS-page gels before being either sonicated (S) or non-sonicated (NS).
Membrane strips were blotted with V5 antibody, ZIP125193, ZIP12-5194 and
ZIP12-Abcam with their respective negative controls (untransfected cells). V5
labeling produced a high molecular weight smear on both S and NS samples,
ZIP12-5193 showed the presence of two bands similar to figure 4.11 in both
conditions, although the same labeling was seen in the negative controls. ZIP12-
5194 labeling showed three bands in NS samples, and only one band in S samples.
Again, the same labeling was seen in the negative controls. ZIP12 Abcam showed
no staining.

137
Figure 4-16–Aggregation remains after treatment with reducing agent and
detergents,
Transfected HEK293 cells with ZIP12-V5 protein produced large aggregates which
did not resolve on polyacrylamide gels. Panel A shows dilutions of 5, 2,5 and 1µg
protein run and labeled with V5 (left) and beta-actin (right). Actin staining
indicated that no abnormalities in protein running or transfer occurred. Dilution of
10µg samples 1:1 (total 5µg in each lane) with lysis buffers containing (A) 0.5%
NP40 + 0.5M β-mercaptoethanol, (B) 0.5% NP40+1.0M β-mercaptoethanol, (C),
1% NP40, (D) 0.5% NP40 + 0.5% Igepal, (E) 0.5% NP40 + 0.5% TX-100.

138
4.7. Localisation of ZIP12
Methods
In parallel with experiments on cell lysates, the localization of ZIP12 was examined
in ZIP12-V5 transfected cells. We used HEK293, CHO and ARPE-19 cells for
these experiments. HEK293 and CHO cells were transfected as described
previously, and immunostaining performed first on methanol fixed cells with V5
antibody (green) and ZIP12-5194 (red) or V5 antibody (green) and ZIP12-Abcam
(red) (Figure 4.17).
Results
Labeling with the V5 antibody resulted in a plasma membrane, perinuclear and
punctate cytosolic staining in HEK293 and CHO cells (Figure 4.17, B,F,J).
Labeling with ZIP12-5194 resulted in similar staining to that of V5 (Figure 4.17,
C,G). The use of ZIP12-5193 antibody did not result in immune-labeling (data not
shown). The ZIP12-Abcam antibody failed to label HEK293 cells when fixed with
MeOH (Figure 4.17, K) or 4% Paraformaldehyde (PFA) (data not shown).
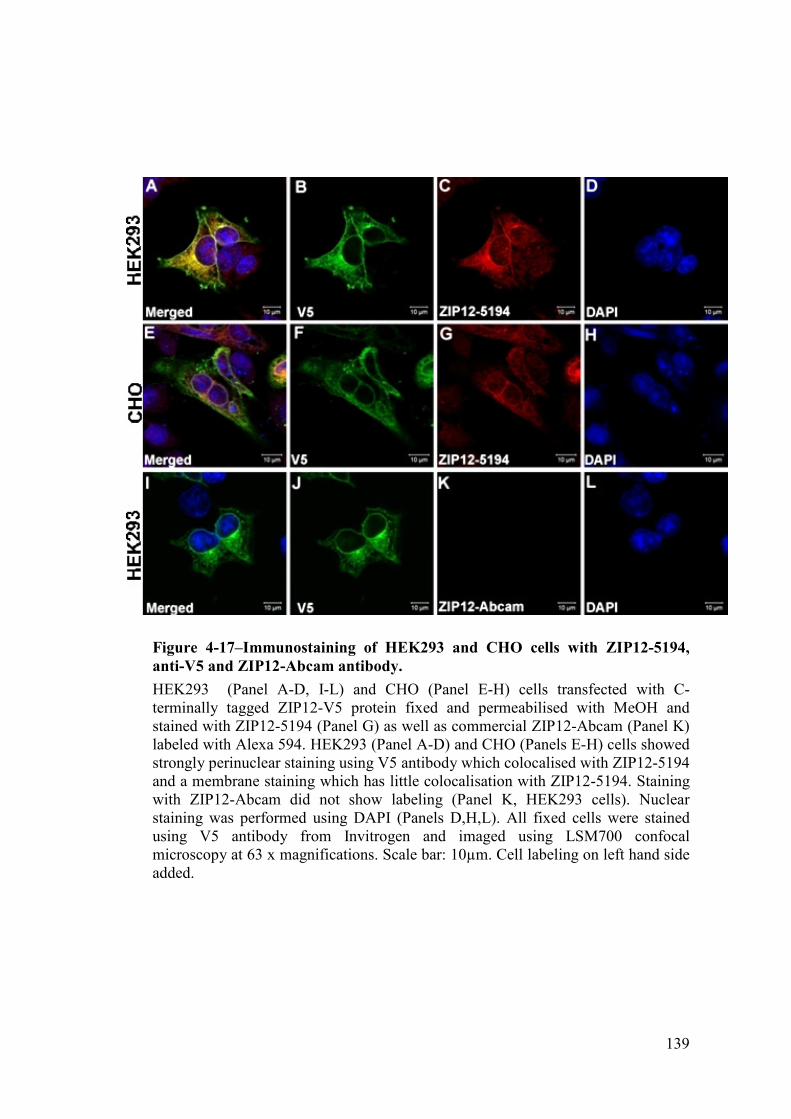
139
Figure 4-17–Immunostaining of HEK293 and CHO cells with ZIP12-5194,
anti-V5 and ZIP12-Abcam antibody.
HEK293 (Panel A-D, I-L) and CHO (Panel E-H) cells transfected with C-
terminally tagged ZIP12-V5 protein fixed and permeabilised with MeOH and
stained with ZIP12-5194 (Panel G) as well as commercial ZIP12-Abcam (Panel K)
labeled with Alexa 594. HEK293 (Panel A-D) and CHO (Panels E-H) cells showed
strongly perinuclear staining using V5 antibody which colocalised with ZIP12-5194
and a membrane staining which has little colocalisation with ZIP12-5194. Staining
with ZIP12-Abcam did not show labeling (Panel K, HEK293 cells). Nuclear
staining was performed using DAPI (Panels D,H,L). All fixed cells were stained
using V5 antibody from Invitrogen and imaged using LSM700 confocal
microscopy at 63 x magnifications. Scale bar: 10µm. Cell labeling on left hand side
added.

140
Methods
As ZIP12 appeared to be present on the plasma membrane on MeOH fixed samples,
further confirmation for their membrane localization was done on 4% PFA fixed
HEK293 and CHO cells. Cells were plated onto glass cover slips and transfected as
described earlier. Four percent freshly prepared PFA was used to fix half of the
cover slips and cells were rinsed before being treated with 0.1% Triton-X100 in
PBS solution. The second half of the coverslips was treated with PBS only.
Results
Permeabilised HEK293 cells showed the previously described cytosolic labeling
with both ZIP12-5194 (red) and V5 (green) antibodies (Figure 4.18, B,C).
However, in non-permeabilised cells the labeling was restricted to the plasma
membrane (Figure 4.18, F,G). Identical immunolabeling was observed on ZIP12-
V5 transfected CHO cells (Figure 4.19 A-H).
In addition to localisation of the ZIP12 protein to the plasma membrane, the
intracellular localisation of ZIP12 was examined. Transfected HEK293 cells were
fixed with MeOH before being immunostained with V5 antibody, then conjugated
with Alexa 488 and antibodies specific to endoplasmic reticulum (ER), Golgi or
Lysosomes (Fig 4.20). Anti-Alpha-6-Isomerase antibody was used as an ER
marker, anti-9.3Golgi antibody for Golgi marker and anti-CathepsinD as lysosomal
marker (kindly provided by Professors Karl Matter and Claire Futter). Anti-V5
antibody labeling of fixed HEK293 cells shows perinuclear and plasma membrane
staining, as observed earlier which showed colocalisation with the ER marker
(Figure 4.20, A), but no co-localisation was observed with Golgi, (Figure 4.20, D)
or the lysosome (Figure 4.20, G), although this could possibly be due to poor
staining of both organelles which was caused by the small size of the cytosol of
HEK293 cells. In order to confirm the ER colocalisation seen on HEK293 cells,
ZIP12-V5 transfected CHO cells were also labelled with V5 and the ER marker
alpha-6-isomerase antibody. There was a strong co-localisation in the perinuclear
area (Fig 4.21, A). The densest staining is regularly observed between the dividing
cells. The densest staining was observed between the cells, although this is not
specific to the particular area. It needs to be determined whether the localisation to
the ER is caused by overexpression artefact or whether endogenous ZIP12 is indeed

141
localised in the ER. However, this requires fully characterised ZIP12-specific
antibody, which we currently do not have.

Figure 4-18–ZIP12 protein is present on the plasma membrane of HEK293
cells.
HEK293 cellswere transfected with C
fixed with 4% PFA before either
A-D) or not treated (Panels E
ZIP12-5194. Permeabilised cell
cytosolic staining. Non
membrane staining. Colocalisation was both observed in permeabilised and non
permeabilised samples.
Invitrogen and imaged using LSM700 confocal microscopy
10µm.
ZIP12 protein is present on the plasma membrane of HEK293
transfected with C-terminally tagged ZIP12
fixed with 4% PFA before either being permeabilised with TX-100 in PBS
D) or not treated (Panels E-H). All cells were stained with anti
Permeabilised cells (Panel A-D) showed perinuclear staining and
cytosolic staining. Non-permeabilised samples (Panel E-F) showed plasma
membrane staining. Colocalisation was both observed in permeabilised and non
permeabilised samples. All images were stained using anti-V5 antibody from
Invitrogen and imaged using LSM700 confocal microscopy at 63 x. S
142
ZIP12 protein is present on the plasma membrane of HEK293
terminally tagged ZIP12-V5 protein and
100 in PBS (Panels
anti-V5 antibody and
D) showed perinuclear staining and
F) showed plasma
membrane staining. Colocalisation was both observed in permeabilised and non-
V5 antibody from
at 63 x. Scale bar:

Figure 4-19–ZIP12 protein is present on the plasma membrane of CHO cells.
CHO cellswere transfected with C
with 4% PFA before either being permeabilised with TX
or not treated (Panels E
5194. Permeabilised cell
Non-permeabilised samples (Panel
Colocalisation was both
All images were stained using V5 antibody from Invit
LSM700 confocal microscopy
ZIP12 protein is present on the plasma membrane of CHO cells.
transfected with C-terminally tagged ZIP12-V5 protein
before either being permeabilised with TX-100 in PBS (Panels A
or not treated (Panels E-H). All cells were stained with V5 antibody and ZIP12
5194. Permeabilised cells (Panel A-D) showed intracellular staining in the cytosol.
permeabilised samples (Panel E-H) showed plasma membrane staining.
both observed in permeabilised and non-permeabilised samples.
All images were stained using V5 antibody from Invitrogen and imaged using
LSM700 confocal microscopy at 63 x. Scale bar: 10µm.
143
ZIP12 protein is present on the plasma membrane of CHO cells.
V5 protein and fixed
100 in PBS (Panels A-D)
. All cells were stained with V5 antibody and ZIP12-
D) showed intracellular staining in the cytosol.
) showed plasma membrane staining.
permeabilised samples.
rogen and imaged using

Figure 4-20–Organelle localization of ZIP12 protein in HEK293 cells
HEK293 cells were
fixed with MeOH showed
colocalisation with either
was performed using antibody against ER
for Golgi was performed
done using antibody against CathepsinD, a lysosome
staining was performed using DAPI.
antibody from Invitrogen and imaged using LSM700 confocal microscopy
magnification. Scale bar:
Organelle localization of ZIP12 protein in HEK293 cells
were transfected with C-terminally tagged ZIP12
showed partial colocalisation with ER (panel A),
either Golgi (panel D), or lysosomes (panel G). Staining for ER
using antibody against ER-specific Alpha-P 63 Isomerase. Staining
performed using golgi-specific 9.3 Golgi. Staining for lysosomes was
done using antibody against CathepsinD, a lysosome-specific organelle.
staining was performed using DAPI. Images A,B,D,E,G,H were stained using V5
trogen and imaged using LSM700 confocal microscopy
ale bar: 10µm.
144
Organelle localization of ZIP12 protein in HEK293 cells
IP12-V5 protein and
colocalisation with ER (panel A), and no
lysosomes (panel G). Staining for ER
P 63 Isomerase. Staining
specific 9.3 Golgi. Staining for lysosomes was
specific organelle. Nuclear
were stained using V5
trogen and imaged using LSM700 confocal microscopy at 63 x

Figure 4-21–ER localization of ZIP12 in CHO cells
CHO cells transfected with ZIP12
V5 (Panels A-D) antibody showed partial colocalisation on the perinuclear area.
The staining is not specific
interesting observation that the densest staining was
stained using anti-V5 antibody from Invitrogen and all picture was imaged using
LSM700 confocal microscopy
ER localization of ZIP12 in CHO cells
cells transfected with ZIP12-V5, fixed with MeOH and stain
D) antibody showed partial colocalisation on the perinuclear area.
The staining is not specific to the area between the cells, although it is an
interesting observation that the densest staining was observed there.
V5 antibody from Invitrogen and all picture was imaged using
confocal microscopy at 63 x magnification. Scale bar: 10µm.
145
and stained with ER and
D) antibody showed partial colocalisation on the perinuclear area.
to the area between the cells, although it is an
observed there. Image (C) was
V5 antibody from Invitrogen and all picture was imaged using
10µm.

146
Our ultimate aim is to understand the role ZIP12 plays in RPE cells. Transfection of
ARPE19 cells with ZIP12-V5 fusion protein would allow the study of zinc transport
as well as observing the phenotypical changes associated with the presence of ZIP12
protein on these RPE model cells. The high mRNA expression has been observed in
vivo (See Chapter 3) and the absence of ZIP12 gene expression in vitro in ARPE19
cells provides the ideal system to study this. In order to achieve this, the SCL39A12
gene must be delivered efficiently and ZIP12 protein must be expressed with a good
efficacy in ARPE19 cells. However, our attempts at transfecting ARPE19 with
ZIP12-V5 did not result in a high-enough efficiency for functional assays. The
transfection efficiency in ARPE-19 cells was < 20 cells per coverslip (100 mm
diameter) but it allowed us to label the cells with the V5 antibody. As expected,
ZIP12 protein was localised to the perinuclear and intracellular organelle(s) in
MeOH fixed cells (Figure 4.22, B). Similar labeling was observed with our ZIP12-
5194 antibody (Figure 4.22, C). Labeling of ARPE-19 cells following 4% PFA
fixation, but without permeabilisation confirmed that ZIP12 is present on the plasma
membrane in ARPE-19 cells (Figure 4.23, D,E).
After co-labeling with organelle specific antibodies, a modest co-localisation of
ZIP12 with ER (Figure 4.24, A), good co-localisation with the Golgi apparatus
(Figure 4.24, D) but no co-localisation with lysosomes (Figure 4.24, G) was
apparent. While transfected HEK293 or CHO cells remainedviable, transfected
ARPE-19 cells show nuclear blebbings and abnormally shaped nuclei suggesting that
the present transfection protocol of ARPE19 will need to be refined.

Figure 4-22–Transfection of ZIP12 in ARPE19 cells
ARPE19 transfected with C
MeOH showed perfect colocalisation between ZIP12
antibody. Nuclear staining performed using DAPI showed cellular debris as well as
poor morphology of the nucleus indicating cytotoxicity.
preparations stained using
LSM700 confocal microscopy
Transfection of ZIP12 in ARPE19 cells
ARPE19 transfected with C-terminally tagged ZIP12-V5 protein
MeOH showed perfect colocalisation between ZIP12-5194 antibody and V5
antibody. Nuclear staining performed using DAPI showed cellular debris as well as
poor morphology of the nucleus indicating cytotoxicity. All images were
ned using anti-V5 antibody from Invitrogen and imaged using
LSM700 confocal microscopy at 63 x magnification. Scale bar: 10µm.
147
V5 protein and fixed with
5194 antibody and V5
antibody. Nuclear staining performed using DAPI showed cellular debris as well as
All images were of
V5 antibody from Invitrogen and imaged using
10µm.

Figure 4-23–ZIP12 is localized on the plasma membrane of ARPE19 cells
ARPE19 transfected with C
PFA before either not
PBS. Permeabilised cell (Panel A
with punctate staining. Non
membrane staining. Nuclear staining performed using DAPI showed cellular debris
as well as poor morphology of the nucleus indicating cytotoxicity.
stained using V5 antibody from Invi
microscopy at 63 x magnifications. S
ZIP12 is localized on the plasma membrane of ARPE19 cells
PE19 transfected with C-terminally tagged ZIP12-V5 protein and fixed with 4%
PFA before either not being permeabilised or being permeabilised with TX
PBS. Permeabilised cell (Panel A-C) showed intracellular staining in the cytosol
ning. Non-permeabilised samples (Panel D-F) showed plasma
membrane staining. Nuclear staining performed using DAPI showed cellular debris
as well as poor morphology of the nucleus indicating cytotoxicity.
stained using V5 antibody from Invitrogen and imaged using LSM700 confocal
at 63 x magnifications. Scale bar: 10µm.
148
ZIP12 is localized on the plasma membrane of ARPE19 cells
and fixed with 4%
permeabilised with TX-100 in
C) showed intracellular staining in the cytosol
F) showed plasma
membrane staining. Nuclear staining performed using DAPI showed cellular debris
as well as poor morphology of the nucleus indicating cytotoxicity. All images were
trogen and imaged using LSM700 confocal

149
Figure 4-24–Organelle localization of ZIP12 protein in ARPE19 cells
ARPE19 transfected with C-terminally tagged ZIP12-V5 protein and fixed with
MeOH showed colocalisation with ER (panel A), very partial colocalisation with
golgi (panel D), and no colocalisation with lysosomes (panel G). Staining for ER
was done using antibody against ER-specific Alpha-P 63 Isomerase. Staining for
golgi was done using golgi-specific 9.3 Golgi. Staining for lysosomes was done
using antibody against CathepsinD, a lysosome-specific organelle. Nuclear staining
(in blue) was performed using DAPI. All images were stained using V5 antibody
from Invitrogen and imaged using LSM700 confocal microscopy at 63 x
magnification. Scale bar: 10µm.

150
4.8. Function of ZIP12
To date, no studies have shown the function of ZIP12 in vivo or in vitro although its
localization to plasma membrane and the functional annotation based on the LIV-1
family where ZIP12 is assigned suggests that this protein is a potential zinc
importer. Based on this, we expected that zinc content in transfected cells might be
higher than without transfection. Therefore, cells were loaded with 5µM ZinPyr1, a
zinc selective, high affinity fluorescent sensor, (Walkup et al., 2000) for 10 minutes
under standard culturing conditions as described in the Materials and Methods
section. After extensive washing with culture media the cells were imaged live
using epifluorescence (excitation 488, emission 525 nm, Olympus) at 20x
magnification. Fluorescence intensities of at least 10 images from triplicate
experiments were analysed using ImageJ software (http://rsb.info.nih.gov/ij/). The
fluorescence intensities of transfected cells were significantly higher than in non-
transfected cells (5.65 ± 1.99 vs 14.30 ± 1.35, p<0.01, Student t-test) (Figure 4.25).
Pretreatment with 10µM TPEN, a zinc selective cell permeable chelator for 10
minutes prior the application of ZinPyr1 resulted in a definite decrease of basal
fluorescence (2.0+0.1) and complete attenuation of the fluorescence in transfected
cells (1.9+0.1), suggesting that in cells expressing ZIP12, zinc influx is increased.

151
Figure 4-25–Function of ZIP12
Transfected HEK293 cells were probed with ZinPyr-1 which recognises
bioavailable zinc. Under basal state, the transfected cells have higher signals of zinc
within the cells, indicative of zinc influx (Panel C) occurring in the cells compared
to basal state (Panel A). Treatment of 10µM TPEN for 10 minutes removed
majority of the zinc signal in both sham and transfected group (Panels B,D). Data
shown came from average ± standard deviation values of 12 pictures repeated three
times. Student’s T-test was performed between sham group and ZIP12-V5
transfected group (p<0.0001).

152
4.9. Discussion
ZIP12 is probably the least studied zinc transporter to date. It has been linked to
schizophrenia (Bly, 2006), Alzheimer’s disease (Grupe et al., 2006) and cancer
(Sotiriou et al., 2006).
Previous studies have shown that the SLC39A12 gene is the most highly expressed
zinc transporter gene in the retina (Nishimura and Naito, 2008). In addition, ZIP12
was found to be one of the most highly RPE specific genes amongst the 114 genes
which have at least 2.5 fold higher expression in the RPE than the choroid or
photoreceptors, placing the gene on par with more widely recognized RPE-specific
genes such aslecithin retinol acyltransferase (LRAT) or retinaldehyde-binding
protein 1 (RLBP1)(Booij et al., 2010b). The observation that a zinc transporter has
the same high RPE expression level may indicate its potential importance in the RPE
although we would still have to confirm this result through better RNA isolation
process for the cadaveric RPE cells.
The bioinformatics predictions at the beginning of this chapter (Section 4.1)
suggested that ZIP12 is an 8 transmembrane domain protein whose likely
localisation is the plasma membrane. Its large N-terminal domain (52% of the
protein) and its C-terminal short tail were predicted to be in the extracellular space.
In order to confirm these we generated a C-terminal V5-tagged plasmid for
expressing ZIP12 in cells that do not normally express it. In addition, we raised
antibodies against an N-terminal extracellular domain next to transmembrane
domain I. As expected, the V5 specific antibody labeled the plasma membrane of
transfected, non-permeabilised cells, suggesting that not only our prediction that
ZIP12 is, at least partly, a plasma membrane protein was correct but also confirmed
that the C-terminal tail is pointing to the extracellular space. Labeling of
permeabilised cells with the V5 antibody showed that ZIP12 protein might also be
present on the membranes of ER and the Golgi. However, currently we cannot rule
out that the ER localisation is an artefact caused by protein overexpression. The
antibody we raised against the N-terminal domain of ZIP12 (5193 and 5194)
provided mixed results. Experiments on cell lysates could not demonstrate that our
polyclonal antibodies which were raised in rabbits can detect ZIP12 reliably
although immunolabeling of transfected cells showed a very good correlation
between ZIP12-5194 and V5 antibody labeling. For this reason further studies are

153
planned to purify and better characterize our ZIP12 antibodies for immunolabeling.
Nevertheless, we could confirm that the C-terminus, where the V5 tag is positioned,
is indeed in the extracellular space and if the protein is confirmed to be an 8
transmembrane domain structure then the N-terminal large domain is also in the
extracellular space. The structure of LIV-1 subfamily transporters (See Figure 4.2)
is highly conserved and usually have three features which define their homology:
the histidine-rich loop between transmembrane domains III and IV, a histidine rich
metalloproteinase-like sequence on transmebrane domain V (Loomans et al., 1998)
and the so-called CPALLY domain just before transmembrane domain I. The
histidine rich loop between transmembrane III and IV is not strictly limited to the
LIV-1 subfamily, but is also present in other SLC39 family members (Guerinot,
2000). Following our results that show ZIP12 on the plasma membrane we believe
that this loop is located in the cytosol and, together with the metalloprotease-like
sequence in transmembrane V (Taylor and Nicholson, 2003) facilitates zinc import
into cells. The exact function of the CPALLY domain is still not known. It might be
involved in the localisation of ZIP12 to the plasma membrane since ZIP7 and
ZIP13, both of which lack this motif, are localised to intracellular membranes but
not the plasma membrane (Taylor et al., 2007, Fukada et al., 2008). It is possible to
speculate that cleavage of the large N-terminal domain might cause the migration of
ZIP12 to intracellular membranes although future experiments using truncated
ZIP12 expression will be required to test this idea. The V5 tagged ZIP12 can
certainly be detected on intracellular membranes, but whether this is the result of
regulated protein processing cannot be determined from these experiments. The
localisation of ZIP12 protein to the ER can certainly be the result of the
overexpression of the protein in our experiments.
Following expression of V5 tagged ZIP12 protein in an artificial translational
system (TnT Quick Coupled Translation System) and in cells we found that ZIP12
may form aggregates with either itself or some other proteins. This can be the
caused by overexpression but may also indicate that ZIP12 forms homo or hetero
dimers with other proteins. Proteomic characterisation of these large aggregates
(Figure 4.16) is being planned together with co-immunoprecipitation assays using
anti-V5 agarose affinity gels (Sigma-Aldrich A7345) to identify ZIP12 interacting
proteins.Interestingly, the protein derived from the Quick Coupled Translation

154
System migrated to ~60 kDa while ZIP12 protein expressed in HEK293 cells has
an apparent molecular weight of ~80 kDa. This suggests that appropriate folding
and/or posttranslational modification is important for the ZIP12 protein. As there
are many potential posttranslational modification sites on ZIP12 (see Section 4.2
earlier) further experiments will need to clarify which potential sites may play a
role in the function of ZIP12. One of the candidates for functional modification is at
S36, a potential glycogen synthase kinase 3 phosphorylation site, that had been
associated with schizophrenia through a S36G mutation (Bly, 2006), suggesting
that phosphorylation at this site might be important for ZIP12 function.
The histidine-rich regions between transmembrane III and IV, which is involved in
transporting zinc into the cells, appear to be highly conserved in LIV-1 family
transporters (Taylor and Nicholson, 2003, Taylor et al., 2007). Therefore, the
plasma membrane location and the orientations of the transmembrane domains
suggested that ZIP12 will transport zinc into cells. To test this hypothesis we over
expressed ZIP12-V5 in HEK293 cells and measured basal zinc accumulation by the
high affinity zinc selective fluorescence probe, ZinPyr1 (Walkup et al., 2000). The
specificity of an increase in fluorescence intensity to zinc was assessed by treatment
with TPEN, a cell permeable zinc selective chelator (Figure 4.25). The source for
zinc influx into the HEK293 cell is the culturing medium. DMEM complete
medium contains ~1.5 uM added zinc (manufacturer’s data sheet) that is further
enhanced by the zinc contained in fetal calf serum (Bozym et al., 2010). While this
total zinc level translates to nanomolar levels of bioavailable zinc in the medium
(Bozym et al., 2010) this level is far higher than the picomolar intracellular free
zinc (Bozym et al., 2006) reported in cells. Nanomolar levels of extracellular zinc
had been shown to elevate intracellular levels after transfection of cells with zinc
transporters (Gaither and Eide, 2001, Leung et al., 2008a, Liuzzi et al., 2005), and
we expected this to be the same for ZIP12 transfected HEK293 cells. While
HEK293 cells do not express ZIP12 in their native state, they express several other
zinc transporters on their plasma membrane. Therefore it is not surprising that there
is a basal level of TPEN chelatable zinc in these cells (Figure 4.25). However,
when cells were transfected with ZIP12 the intracellular level of ZinPyr1
fluorescence increased significantly. As this increase could be completely abolished

155
by pretreatment with TPEN, we concluded that this fluorescence signal represented
zinc influx.
In summary, we were able to provide evidence that ZIP12 is indeed a zinc importer
that is, at least partly, located on the plasma membrane as an 8 transmembrane
domain protein. Its importance for RPE however, could not be investigated due to
difficulties with transfection of ARE19 cells and problems with commercial
antibodies and antibodies raised ourselves. Further experiments are being planned
to clarify the role ZIP12 plays in cells in general and specifically in RPE.
4.10. Future Directions
ARPE19 cells were transfected with the ZIP12-V5 plasmid to assess where the
protein is expressed and how this expression might affect the phenotype of the
cells. While we were able to transfect some cells with low efficiency, a transfection
method with better efficacy and less toxicity to ARPE19 cells will have to be
implemented. Recently a non-viral transfection method using a combination of
cationic lipid, plasmid DNA and magnetic nanoparticles was reported for ARPE-19
cells (Fujii et al., 2010) and we are in the process of implementing this in our
laboratory. Furthermore, a study recently reported the use of the Nucleofection
(Amaxa AG, Koln Germany) method, which resulted in 78% transfection of
ARPE19 cells in contrast to 5% observed with LipofectamineLTX, which we used
in our studies. Creating a stably transfected cell line would be highly beneficial in
order to understand the function of ZIP12 protein; however ARPE19 is an unlikely
candidate for this. The Nucleofection method is non-viral and therefore does not
create constitutively expressed gene, however, expression was observed at least 7
days post transfection, which might be sufficient for functional assays like
measurement of trans epithelial resistance, gene expression and monitoring
pigmentation. The transfected ARPE19 cells would be useful in measuring the zinc
influx from different extracellular zinc compartments on polarised cells cultured on
transwell membranes.
We will also attempt to disaggregate the high molecular weight aggregates
correlated with overexpression of ZIP12 in cells through optimisation of buffers
and reagents. Furthermore, proteomics characterisation of the large aggregates
shown in Figure 4.16 would identify the interacting proteins involved in the

156
formation of aggregates. Optimisation and characterisation of the antibodies which
were generated and purchased should help us to uncover the localisation and
possible involvement of ZIP12 with cellular processes and disease states. For this
we will try to further optimize our immunolabeling and purify our ZIP12
antibodies. In addition, efforts will be made to isolate RPE RNA free from
contamination from neighboring tissue compartments. Potential method for this
include very early passage of human RPE cultures.
There are over 100 potential polymorphisms of the SLC39A12 gene
(www.ensembl.org). Whether any of these are associated with AMD is now under
scrutiny in collaboration with Professor John Yates and Dr Valentina Cipriani at the
UCL Insitute of Ophthalmology using Genome Wide Association Studies data on
AMD patients. Our preliminary analysis indicated that some polymorphisms are
associated with AMD but this requires further statistical analysis to confirm the
results. Further analysis of existing microarray data using data mining tools have
identified potential protein networks ZIP12 protein is involved in. Together with
the planned proteomics studies, this will highlight the molecular interactions
between ZIP12 and other proteins.
It will be important to measure zinc influx by modifying extracellular zinc levels
and controlled expression of ZIP12. Initial experiments suggested that addition of
100µM ZnSO4 which elevated the extracellular zinc levels in the media to >100 nM
is toxic to the transfected cells we tried. At these concentrations, we observed
reduced cellular density and the appearance of cellular debris in the culturing
medium in HEK293 cells that were transfected with ZIP12-V5 (data not shown). It
is expected that most cells are unable to cope with hundreds of nanomolar
bioavailable zinc (Bozym et al., 2006, Bozym et al., 2010) so these preliminary
data are probably not surprising. Interestingly, as we will show in the next two
chapters, similarly high extracellular levels of zinc are well tolerated by ARPE19
cells or bEND5 cells used as a model for fenestrae formation.
Apart from being bound to proteins like metallothioneins, zinc is likely to be stored
in intracellular stores. It is believed that metallothionein will bind zinc almost
immediately after it enters the cell and shuffle zinc into intracellular stores a

157
process termed muffling (Colvin et al., 2010). The muffling process is transient,
and therefore zinc can be released should there be a need for zinc within the cells.
Various zinc-binding proteins or cellular organelles such as lysosomes,
mitochondria, endoplasmic reticulum or Golgi may serve as intracellular stores
(Colvin et al., 2010). It will be important to examine in detail where and how zinc
regulation occurs in these cells and how transfection with ZIP12 will affect these
shuttling mechanisms.

158
5. Potential Role of Extracellular Zinc on RPE Cell
Differentiation In Vitro: A Preliminary Study
The experimental part of this study was conducted under my supervision by Ms.
Yemsrach Tadesse as a part of her MSc. I was responsible for experimental design;
and data analysis was performed jointly.
In vitro studies of cultured RPE cells have generated much valuable
information. However, the culture media used to grow cells often contains fetal
calf serum (FCS), which contains high-affinity metal binding proteins such as
albumin (Maret and Li, 2009), which in turn may render the cells zinc
deficient. Since RPE cells are located adjacent to a large and potentially
mobile pool of zinc, we hypothesise that the addition of zinc to the medium of
cultured RPE cells will alter RPE behavior including transepithelial resistance
(TER), ZO-1 protein staining and the expression of RPE-associated genes.
Majority of the data presented here came are intended to be observational and
most came from a single experiment and therefore drawing any major
conclusion from these data would not be warranted before sufficient
replication of data.
5.1. Introduction
The RPE is a monolayer of highly uniform cells located between the photoreceptor
outer segments of the retina and Bruch’s membrane. General characteristics of the
RPE cells have previously been described in section 1.3.1. Cultured RPE cells have
served as a valuable model for RPE cell behaviour and there are various
immortalised cell lines commonly used in ocular research in addition to primary
RPE cultures. Some of the more commonly used cell lines include hARPE19 (Dunn
et al., 1996), hTERT-RPE1 (Bodnar et al., 1998), hD407 (Davis et al., 1995), mBR-
RPE07 (Chen et al., 2008) and rRPE-J (Nabi et al., 1993). These cells are either
spontaneously arising (hARPE19, hD407, mBR-RPE07), or transformed (hTERT-
RPE1, rRPE-J) cell lines. Since its introduction in 1996 by Dunn et al (Dunn et al.,
1996), ARPE19 has been the most widely used in ophthalmic research as an in vitro
model of the RPE.

159
Dunn et al, demonstrated that ARPE19 cells form polarised epithelial monolayers
and express the RPE-specific genes CRALBP, and RPE65. Transepithelial
resistance of the ARPE19 cells reached about 50-100Ωcm2 after 4 weeks in culture
(Dunn et al., 1996, Dunn et al., 1998). However, despite the extensive use of
ARPE19 cells, there are discrepancies between these cells and native RPE. RPE65
protein was not found in cultured ARPE19 cells despite its mRNA being present
(Vugler et al., 2008), although pigmentation and expression of RPE65 has can be
induced (Ahmado et al., 2011). While the original study (Dunn et al., 1996)
reported pigmentation in ARPE19 cells after 4 weeks in culture, various studies
struggled to demonstrate pigmentation even after prolonged periods of culture
(Amemiya et al., 2004, Biesemeier et al., 2010, Sonoda et al., 2009). Furthermore,
studies comparing primary cultures of human RPE and ARPE19 cells have
demonstrated that TER values are consistently higher in primary cultures of human
RPE cells >500 Ω cm2
vs 50-100 ohms cm2
(Sonoda et al., 2009, Geisen et al.,
2006).
Several groups have sought to enhance the differentiation of ARPE19 cells by
placing them in an environment that better mimics the in vivo condition. The use of
porcine lens capsule as a way to create extracellular matrix akin to Bruch’s
membrane improved the distribution of tight junction proteins ZO-1 and occludin,
and increased the TER values and the phagocytic capability of ARPE19 cells
(Turowski et al., 2004). Co-cultures of ARPE19 cells with choroidal endothelial
cells (Geisen et al., 2006), retinal neurons (German et al., 2008) and glial cells
(Constable and Lawrenson, 2009) have also been shown to improve ARPE19 cells
differentiation.
ARPE19 cells are usually cultured in the presence of 10% fetal calf serum (FCS) as
first described by Dunn et al (1986). Serum contains many different proteins,
including albumin, transferring, antibodies and complement factors (Adkins et al.,
2002). Serum albumin is known to bind zinc with a kD of ~45nM (Maret and Li,
2009) as do several other FCS proteins (Harris and Stenback, 1988). Therefore, we
speculated that the addition of 10% FCS to the culture media might create a zinc
deficient environment which may affect the phenotype of the ARPE19 cells.

160
5.2. Aims and Hypothesis
Hypothesis:
In this chapter, we hypothesise that elevation of extracellular zinc in the growth
media will affect the phenotype of ARPE19 cells.
Methods:
To test this hypothesis, ARPE19 cells were cultured in the presence of ZnSO4
enriched growth media and the phenotypic changes induced by the inclusion of zinc
were assessed by measuring TER, ZO-1 immunoreactivity and RPE specific gene
expression.
5.3. Calculating the Zinc Concentration in DMEM/F12
Methods
As discussed, zinc binds to proteins in tissue culture media (Maret and Li, 2009,
Harris and Stenback, 1988). ZnAF2 (Neurobiotex, Galveston, TX, USA), a zinc-
selective fluorescent probe was used to measure the zinc buffering capacity of the
DMEM/F12 with 10% FCS (complete media) added. A standard curve was
generated by dissolving increasing concentrations (1-1000 nM) of ZnSO4 in
deionised water before 5 µM ZnAF2 was added. Fluorescence intensities were
measured in a specifically designed fluorometer (Neurobiotex, Galveston, TX,
USA) (Excitation: 460-490nm, emission: 515-525nm). Then, 0, 50, 100, 250 and
500µM of ZnSO4 were added to the complete media and fluorescence changes used
to calculate free zinc concentration using the standard curve. Background
autofluorescence was measured before the addition of ZnAF2, a high affinity
Zn2+
probe (Kd 2.7 nM) and subtracted from test readings.
Results
The resulting bioavailable zinc concentrations in the growth media were
approximately ~10 nM, 100nM, 255nM, 755nM and 1550nM respectively (Figure
5.1). Therefore, in subsequent experiments ARPE19 cells were cultured in the
presence of 0, 50, 100, 150 and 175µM added ZnSO4. At higher concentrations
altered morphology and cellular detachment was evident (data not shown),
indicating toxicity.

161
Figure 5-1– Zinc measurement using ZnAF2 in DMEM/F12 growth medium
Zinc measurements were performed in 1µM ZnAF2 diluted in solution containing
ZnSO4 in DMEM/F12 phenol-red free media supplemented with 10%FCS.

162
5.4. Effect of Extracellular Zinc on TER of Cultured ARPE19 Cells
Methods:
Measurements of transepithelial resistance (TER) were conducted on ECIS real time
cell growth monitoring system (Applied Biophysics, Troy, NY, USA) placed into an
incubator over a six day period. Care was exercised to not remove the electrode array
chips from the TER measuring device in order to prevent inconsistency and artefacts
in TER impedance measurement. During this period, growth media was not replaced
and enough media was placed on the cells to ensure cellular viability was not
compromised. The data collected were normalised to the TER values measured at
time 0 (i.e. time when the electrode array was placed in impedance measurement
device) and data measured the end of the 6 days period. The results (Figure 5.2) are
the averages of at least 2 independent measurements.
Results:
Over the 6 day period, adding increased concentrations of zinc delayed the
development of TER (Figure 5-2). Without zinc,TER reached a half maximal value
by 68 hours in culture then a plateau after 96 hours. In the presence of zinc the half
maximal values were reached after 74 hours in the presence of 50µM, 90 hours in the
presence of 100µM, 120 hours with 150µM and 130 hours in the presence of 175µM
ZnSO4. Despite the initial delays, TER reached a similar maximum as the controls
within 6 days.

163
Figure 5-2- TER measurement in ARPE19
TER measurement was done on 8-electrode array chips (Wolf Labs, UK) over 6
days without changing the media. The addition of zinc into the growth media
seemed to delay the attachment and growth phase, resulting in lowered
transepithelial resistance, although the TER value reached plateau after 6 days in all
of the samples. The experiment was repeated 3 times and results averaged.Data are
normalized against TER for control culture at 6 days.

164
5.5. Effect of Extracellular Zinc on ZO-1 Distribution in ARPE19 Cells
Methods:
The TER measurements indicated that the development of tight junctions might be
affected by extracellular zinc. Therefore, immunocytochemistry using an antibody
against tight junction protein was performed on cultured ARPE19 cells receiving
the same treatment as section 5.4. There are several tight junction proteins
including ZO-1, claudin and occludin (Balda and Matter, 2008). In this study, we
have chosen to use an antibody against ZO-1, a widely used marker for tight
junctions (Sonoda et al., 2009).ARPE19 cells were fixed with 4% PFA after 1 and 3
weeks in culture and labeled with ZO-1 antibody (BD Biosciences, UK) and
fluorescent-labelled with FITC secondary antibody.
Results:
After 1 week of culture, the cells had reached confluency independent of zinc
concentration, as indicated by cobblestone-like appearance of the cells (Figure 5.3).
A continuous ZO-1 band of immunoreactivity can be seen in control samples,
which contain no added zinc. However, in the presence of increasing concentrations
of zinc the ZO-1 staining became more and more discontinuous after 1 week
treatment (Figure 5.3). At 3 weeks in culture the ZO-1 stain had a continuous
appearance in the controls, but in the presence of added zinc at all concentrations
the ZO-1 labeling was discontinuous (Figure 5.3).

Figure 5-3–Immunostaining for ZO1 on ARPE19 cells
Immunostaining for
week after culturing (Panel A) which p
in DMEM/F12. The addition of zinc at 50µM (Panel C) did not show any
difference compared to non
(Panel D), discontinuous ZO
concentration of zinc for 1 week (Panel E, G) and 3 weeks (Panel F, H).
Immunostaining was conducted using ZO
dilution and fluorescent stained with FITC (BD Biosciences) at 1:300. Images were
taken using epifluorescence microscope BX51 (Olympus) at 63x magnification.
Immunostaining for ZO1 on ARPE19 cells
ZO1 on ARPE19 shows clear formation of tight
week after culturing (Panel A) which persists after 3 weeks of culturing (Panel B)
in DMEM/F12. The addition of zinc at 50µM (Panel C) did not show any
difference compared to non-zinc treated cells in Week 1. Although after 3 weeks
(Panel D), discontinuous ZO-1 staining was observed in cells g
concentration of zinc for 1 week (Panel E, G) and 3 weeks (Panel F, H).
Immunostaining was conducted using ZO-1 antibody (BD Biosciences) at 1:400
dilution and fluorescent stained with FITC (BD Biosciences) at 1:300. Images were
g epifluorescence microscope BX51 (Olympus) at 63x magnification.
165
ZO1 on ARPE19 shows clear formation of tight-junctions 1
ersists after 3 weeks of culturing (Panel B)
in DMEM/F12. The addition of zinc at 50µM (Panel C) did not show any
zinc treated cells in Week 1. Although after 3 weeks
1 staining was observed in cells grown with higher
concentration of zinc for 1 week (Panel E, G) and 3 weeks (Panel F, H).
1 antibody (BD Biosciences) at 1:400
dilution and fluorescent stained with FITC (BD Biosciences) at 1:300. Images were
g epifluorescence microscope BX51 (Olympus) at 63x magnification.

166
5.6. Cell Proliferation Assay using alamarBlue
Methods:
As the TER measurements and ZO-1 staining was done in sub-confluent cells to
observe effect of zinc immediately after seeding, a cell proliferation assay was
performed to confirm that immunostaining results are not caused by effect of zinc
on cellular proliferation. AlamarBlue solution was purchased from ABDSerotec
(Kidlington, UK). ARPE19 cells were seeded at 5000 cells per well on a 96-well
plate with 200µl growth media to match the experimental conditions in the previous
sections. After incubation for 1-6 days, 10% of alamarBlue solution was added and
left to incubate for 2 hours before its absorbance measured at 600nm and 450nm.
Calculations for the absorbance were made according to the equation provided by
the manufacturing company and presented as percentage reduction of alamarBlue.
As controls, cells without zinc treatment was used and as blanks, growth media
without zinc added was used. It was pre-determined that the addition of zinc does
not affect AlamarBlue absorbance.
Results:
After 1-3 days (Figure 5.4), percentage reduction of alamarBlue is reduced as the
concentration of zinc added increased. Cell viability was very low after addition of
150µM zinc on day 1, although the level slowly increased as the growth time
increase. However, towards the end of 6 days, the reduction levels of alamarBlue
reached approximately the same level with exception of ARPE19 cells grown in the
presence of 150µM ZnSO4 which shows reduction in cell viability after 6 days.
Treatment with 200 and 250µM of ZnSO4 resulted total loss of cellular viability
(data not shown). The result suggests that zinc delays cellular proliferation, which
may possibly affect the ZO-1 staining pattern seen.

167
Figure 5-4 – Percentage reduction of alamarBlue in ARPE19 cells
Percentage reduction of alamarBlue in ARPE19 cells cultured in DMEM/F12
supplemented with increasing concentration of ZnSO4 (0-150µM). In the first 3
days there is a lower reduction of alamarBlue with increasing zinc concentration,
after 3 days, the changes become less pronounced, eventually level of cellular
viability reaches the same level after 6 days with the exception of cells with 150µM
added zinc which had less alamarBlue reduced.

168
5.7. Zinc Induced Changes in ARPE19 Gene Expression
Methods:
The effect of extracellular zinc addition to DMEM/F12 complete media on gene
expression of RPE marker genes was assessed. Quantitative RT-PCR was carried
out to monitor changes in RPE65, RLBP1, SILV, BEST1 and TJP1 expression.
RPE65 is a protein involved in the visual cycle where it aids the conversion of all-
trans-retinol to 11-cis-retinol (Strauss, 2005). RLBP1 is a gene encoding for a
retinaldehyde binding protein 1, which binds 11-cis-retinal in the visual cycle.
SILV encodes the protein PMEL17, which is expressed in the RPE and is present in
melanosome precursors. BEST1 encodes for bestrophin1 protein, which forms
basolateral, calcium activated chloride ion channels (Kunzelmann et al., 2007). The
TJP1 gene is not RPE-specific but codes for a tight junction protein and is a marker
for differentiated RPE cells.
ARPE19 cells were plated at a density of 12000 cells/cm2. RNA samples were
isolated weekly for 6 weeks using the RNEasy Kit (Qiagen, Crawley, UK), assayed
for RNA quality and stored at -80C until being analysed by Q-RT-PCR. The culture
medium was prepared as explained above by adding 50µM, 100µM and150µM
ZnSO4. Similar to the methods used in Chapter 3, gene expression changes were
evaluated by the comparative delta CT method (Schmittgen and Livak, 2008).
Expression was compared to 3 housekeeping genes: GAPDH, YWHAZ and UBC
and fold expression was calculated by expression= 2^-∆∆Ct. It is important to
highlight here that this experiment provided only a single point for every
measurement; therefore statistical evaluation be carried out.
Results:
It appears that addition of zinc has a marked, concentration dependent effect on
RPE65 gene expression at week 1 and 2 (Figures 5.5 and 5.6). RPE65 gene
expression (red) was stimulated by up to one order of magnitude by 150 uM zinc.
At week 2, BEST1 expression was up-regulated by almost one order of magnitude
and at week 6, TJP1 expression was up-regulated by 1.5 orders of magnitude,
although this was not apparent at week 3, 4, and 5 (Figure 5.5, 5.6). While there
appears to be a down-regulation of some of the other genes at week one and two
(Figure 5.6), the decreases were small and possibly not of significance.

169
Figure 5-5- QPCR data showing relative expression of RPE65, TJP1, SILV,
BEST and CRLBP1 in ARPE19 cells
QPCR data showing relative expression of RPE65, TJP1, SILV, BEST and
CRLBP1 in ARPE19 cells cultured over the period of 6 weeks after addition of 100
and 150µM ZnSO4 in the growth media. The results were normalised against
values obtained for untreated ARPE19 cells (relative expression = 1). After 1 week
of culture, only expression of RPE65 was 7.5x higher compared to untreated cells, a
trend which continues in week 2. However, results were markedly more variable at
weeks 3-6. The experiment was repeated once. Red: RPE65, Blue: BEST1, TJP1:
Green, RLBP1: Black, SILV: Black.

170
Figure 5-6 – Logarithmic relative expression of RPE65, TJP1, SILV, BEST
and CRLBP1 in ARPE19 cells
Logarithmic relative expression of RPE65, TJP1, SILV, BEST and CRLBP1 in
ARPE19 cells cultured over the period of 6 weeks after addition of 100 and 150µM
ZnSO4 in the growth media. The results were normalised against values obtained
for untreated ARPE19 cells (relative expression = 1). After 1 week of culture, only
expression of RPE65 was 7.5x higher compared to untreated cells, a trend which
continues in week 2. However, results were markedly more variable at weeks 3-6.
The experiment was repeated once. Red: RPE65, Blue: BEST1, TJP1: Green,
RLBP1: Black, SILV: Black.
171
5.8. Discussion and Future Perspectives
We hypothesized that culturing ARPE19 cells in a culture medium that contains
10% FCS potentially places the cells into an environment that is deficient in
biologically available zinc. As zinc has been shown to be important for the
appropriate function of cultured RPE cells (Tate et al., 1995), we set out to explore
whether or not elevated extracellular zinc altered the morphology or cause gene
expression changes to these cells. In order to show this, we assessed the effect of
zinc on TER, distribution of ZO-1 immunoreactivity and the expression of RPE65,
RLBP1, TJP1, BEST1 and SILV genes in pilot experiments.
The RPE depends on a fine regulation of material diffusion through expression of
cellular junctions. The expression of tight junctions results in the formation of high
transepithelial resistance. These are characterized by formation of specific tight
junction proteins ZO-1, occludin and claudins (Geisen, et al., 2006). The
localization of tight junctions on the apical-basolateral membrane of RPE cells
ensures control of material diffusion. ZO-1 protein is crucial for the formation of
tight junction, where it binds to other proteins such as those belonging to the
occludin family and forms a support structure for tight junction (Sonoda, et al.,
2009). The function of ZO-1 protein is not only limited to its structural capacity,
ZO-1 has been shown to maintain cellular signaling by controlling ZO-1 associated
nucleic acid binding protein (ZONAB), a transcription factor which controls
proliferation of epithelial cells through interaction with cell division kinase 4
(CDK4) (Balda, Garrett, and Matter, 2003). Based on the importance of ZO-1 in
epithelial functions, we have used ZO-1 as a marker for tight junction formation for
our studies.
Our results show that after 1 week of culture, all ARPE19 cells cultured in the
presence of zinc had reached confluency. However, with increasing zinc
concentration, the staining of ZO-1 was more discontinuous. The same results were
repeated after 3 weeks of culture but the staining of ZO-1 was becoming
increasingly discontinuous. This indicated that addition of zinc at 50-150µM
concentration is associated with lowered permeability of RPE. The failure for tight
junctions to mature in those cultured in the presence of zinc may pose several
problems for the RPE to function appropriately.

172
The failure of tight junctions to form properly can result in the loss of polarity to
RPE cells. The loss of polarity in the RPE can affect the paracellular signaling
between the RPE/choroid interface. As discussed in section 1.4.2, RPE barrier
function requires optimal balance between secretion of pro-angiogenic factor
VEGF as well as anti-angiogenic factor PEDF. Non-polarized cells show markedly
lower expression and secretion of VEGF and PEDF (Sonoda, et al., 2010). The
secretion of VEGF is required to mediate the fenestration in the adjacent
choriocapillaris (St. Geniez, et al., 2009). The lowered of VEGF secretion will
reduce material diffusion presumably mediated by the fenestrated choriocapillaris.
Furthermore, there is a synergy between the formation of tight junction protein and
localization of Na, K-ATPase channel, which is responsible to generate ATP for
RPE metabolism. In human RPE primary cultures, the reduced function of Na, K-
ATPase channel caused by potassium deficiency resulted in lowered transepithelial
resistance (Rajasekaran, et al., 2003).
The increase in cellular permeability has been related to increase in the metastatic
potential in cancer (Martin and Jiang 2008). The increase in permeability has been
attributed to reduced expression levels of tight junction proteins (Liu, et al., 2008)
In RPE cells, it is possible that the loss of polarity and increased permeability may
lead to migration of RPE cells. It is known that disruption of tight junction can
result in RPE cells adopting the characteristic epithelial-mesenchymal transition
commonly encountered in cancer. Intra retinal RPE migration cases have been
reported in AMD patients (Ho, et al., 2010).
It is still uncertain why zinc seems to reduce the staining of ZO-1 protein after 3
weeks in culture. The preliminary data presented in this chapter does not seem to
support the use of zinc in culturing ARPE19 cells as zinc addition correlates with
poor tight junction maturation and thus affecting RPE permeability. Furthermore,
our data with alamarBlue assay indicated that RPE proliferation seems to be
delayed by the presence of zinc in the first 6 days of culture. If the results presented
here are indicative of what happened in vivo, keeping in mind the highly
preliminary nature of the data, it may possibly mean that further research need to be
carried out in order to determine how oral zinc supplementation (Newsome, 1988)
affects the RPE/choroid interface in early AMD subjects where disruptions to the
RPE are still minimal. Zinc supplementations are thought to improve immune

173
function that is deficient in aging subjects, yet minimal studies have been done on
the effect of zinc on cellular junctions of RPE cells. The study presented here
would greatly benefit from having further optimization of the amount of zinc added
to ARPE19 cells. It is possible that the ~200-500nM free zinc available in cultured
ARPE19 with 125µM ZnSO4 added is already providing too much stress for the
cultured cells. Furthermore, this study was done on non-differentiated ARPE19
cells and thus it would be feasible to repeat the study using differentiated ARPE19
cells, optimized zinc concentration, and correlating the study with measurements of
transepithelial resistance of ARPE19 cells.
Hu and Bok have reported that reducing concentration of FCS used in culturing
media to 1% is essential for human fetal RPE cell culture differentiation. The
culturing condition was maintained for one month in which the cells finally reached
maturation (Hu and Bok, 2001). As previously discussed, the presence of strong
zinc binding proteins in serum can potentially create a zinc deficient environment
for cellular growth. The DMEM/F12 media contained 1.5µM of ZnSO4, meanwhile
the protocol used by Hu and Bok contained 5µM of ZnSO4. This suggests that the
reduction of FCS may increase free zinc concentration due to lowered buffering
capacity which pushes cells towards in vivo phenotype. However, as serum
contains a lot of of other components, this is fairly speculative. Therefore, in order
to confirm the effect of zinc on RPE cells, it is recommended that a culture media
supplemented with appropriate substitutions for FCS are used to confirm the effect
of zinc addition to growth media.
In parallel with TER measurement and the ZO-1 immunostaining, the expression of
some RPE specific gene was monitored. The qPCR measurements showed that at
least in the case of the RPE65 gene, zinc has a concentration-dependent enhancing
effect on expression. RPE65 protein is a highly important enzyme, which converts
all-trans-retinyl ester into 11-cis retinol (Moiseyev et al., 2006) without which the
visual cycle cannot be completed. Mutations in RPE65 have been associated with
blindness (Thompson et al., 2000) and RPE65 deficiency has been associated with
severe loss of photoreceptors (Rohrer et al., 2003). Based on this, zinc is potentially
important in maintaining visual function through modulation of RPE65.

174
5.9. Future Plans
A recent publication by Ahmado et al (Ahmado et al., 2011a) has exhaustively
sought the most optimal conditions under which to culture RPE cells. They reported
that DMEM high glucose with the addition of pyruvate generated better
differentiated ARPE19 cells when compared to DMEM/F12 or DMEM high
glucose without pyruvate. Furthermore, phagocytic function, pigmentation and
expression of RLBP1, RPE65 and PMEL17 proteins were most prominent in
ARPE19 cells grown in DMEM high glucose. It would be interesting to examine
the TER measurements, ZO-1 staining and RPE-associated gene expression caused
by adding zinc to DMEM high glucose with pyruvate. It is warranted that
experiments be carried out on confluent cells in order to eliminate the false positive
result caused by the effect of zinc on cell proliferation. It would also be of interest
to explore the effects of growing cells in Matrigel (BD Biosciences, Oxford) and
reducing the concentration of FCS to 1% as described by Ahmado and colleagues
(Ahmado et al., 2011b). The decrease of FCS content would be expected to increase
the concentration of freely available zinc.
In the future, it will be important to check whether coating of culturing surfaces and
the use of serum deprivation are necessary to differentiate ARPE19 cells into a
more in vivo-like phenotype. It will also be important to assess whether there is a
need for the presence of extracellular zinc when plating the cells or whether
addition of zinc would achieve a better phenotype when added after the cells
reached confluence. A further question is whether addition of zinc to polarised cells
(cells cultured to confluence on Transwell membranes) will affect cell
differentiation depending on whether zinc is added apically or basally. Once
appropriate conditions are found experiments using externally elevated zinc need to
return to the basic characterisation of the cells in which TER, gene expression
changes and pigmentation changes are monitored for an extended period of time to
see the long term effect of zinc supplementation on RPE cells. Despite the many
questions raised by this pilot experiment we propose that an appropriate zinc
environment might be important for the development of appropriate RPE
phenotype.

175
6. Effect of Zinc on Fenestrae Formation: an in
Vitro Study using bEBD5 Cells
The fenestrated choriocapillaris plays a crucial role in the clearance of
unwanted material from the retina and the RPE. In pathologic conditions such
as AMD fenestration of the capillaries is compromised but the mechanism
behind this is not fully understood. In this chapter we explore the effect of zinc
(ZnSO4) on the formation of fenestrae in bEBD5 cells, a murine cellular
endothelial model system for fenestrae formation. Fenestrae formation was
assessed through immunofluorescence staining for PV-1 protein, a
glycoprotein found in the diaphragm of fenestrae (Stan et al., 1999). Actin
immunoreactivity was used to monitor changes in the cytoskeleton. We found
that treatment of bEBD5 cells with~400nM bio-available zinc for 20 hours
induced PV-1 rearrangement into the so called “sieve plates”, an indicator of
fenestrae formation. Fenestrae formation itself was confirmed by whole mount
electron microscopy. The sizes of zinc-induced fenestrae were found to be
~60nm which corresponded to their size in vivo and when chemically induced
(Latrunculin A) in vitro. To assess the specificity of zinc treatment bEBD5 cells
were exposed to equimolar levels of various divalent metals. Treatment with
calcium, nickel and iron was able to induce fenestration but the extent of this
fenestration was marginal when compared to that following treatment with
zinc. Magnesium sulphate did not induce fenestrae formation and copper and
cadmium were highly toxic to bEBD5 cells. Bioavailable zinc is present at high
concentration in Bruch’s membrane adjacent to the choriocapillaris, therefore
it could affect the endothelial cells and modulate the formation of fenestrae in
vivo. The discovery that zinc can induce fenestrae suggests that maintaining an
optimum level of bio-available zinc within Bruch’s membrane might be crucial
for the optimal function of the choriocapillaris and that entrapment of zinc in
sub-RPE deposits in AMD might be involved in the defenestration seen in this
disease.

176
6.1. General Introduction
6.1.1. The Endothelium
Endothelium is classified according to whether or not fenestrations are present. In
the fenestrated capillaries, discontinuous and fenestrated endothelia are found.
(Aird, 2007). Two types of fenestrae may be present; one with and one without thin
3-5 nm diaphragms (See Figure 6.1) (Braet and Wisse, 2002). Continuous
capillaries are found in the myocardial vasculature (Predescu et al., 1994), central
nervous system as a part of the blood-brain-barrier (Hofman et al., 2001), lung and
skeletal muscle (Schnitzer, 1992). Discontinuous fenestrations are found in the liver
sinusoids (Braet and Wisse, 2002), spleen and bone marrow (Satchell and Braet,
2009). Continuous fenestrated capillaries are present in the kidney glomeruli,
digestive system (Satchell and Braet, 2009) and the choriocapillaris (Mancini et al.,
1986). There is a marked difference in fenestrae diameter and density, especially in
man (diameters ranging from 50-300 nm in diameter and density from 15-25
fenestrations per µm2
(Braet and Wisse, 2002). This is in contrast to other animals
such as rat, mouse and chicken, all of which have fenestrations with a tight range of
diameters from around 80-100 nm (Braet and Wisse, 2002).
Figure 6-1- Types of endothelia
Types of endothelia: continous (a, b, c, d), fenestrated (e), and discontinuous (f).
Picture accessed from http://www.cvphysiology.com/Microcirculation/M016.htm
date:20 06 11

177
6.1.2. PV-1 Protein
PV-1, a protein coded by Plasmalemmal Vesicle Associated Protein (PLVAP) gene
is a specific protein present in the stomatal diaphrams of fenestrated endothelia
(Stan, 2004, Stan, 2007). In its monomeric form, the molecular weight of PV-1
protein is 50-60kD, although the protein usually forms dimers (Stan, 2004, Stan,
2007). Northern blot analysis of human tissues suggested that the expression of
PV1 is ubiquitous, with expression highest in the thyroid gland and small intestines
(Stan et al., 2001). EST data from NCBI has indicated that tissue expression for
PLVAP gene was found in all states of development and its expression is highest in
the mammary gland, nerve, spleen and thyroid. Furthermore, the expression is also
associated with various tumors. The protein PV-1 is present as a dimer in the
fenestrae diaphragms (Stan, 2004). Formation of fenestrae is highly dependent on
PV1 expression. Treatment of endothelial cells in culture with Phorbol Myristate
Acetate (PMA) was found to upregulate both the protein levels as well as its
expression. Activation of ERK1/2 kinase pathway is crucial for the formation of
fenestrae as inhibiting ERK1/2 prevented PV-1 upregulation (Stan, 2004). It is also
known that PLVAP expression is dependent on kinases p38, PI3K but not MEK1
(Strickland et al., 2005). Expression of PV-1 has been associated with pathological
states. Immunohistochemical staining of ischaemic human brain showed that PV-1
expression peaked 7 days post ischemia (Shue et al., 2008). In another study, the
expression of PLVAP was found in various malignant neoplastic tissues, including
kidney, colon, pancreatic carcinoma and non-small cell lung carcinoma (Strickland
et al., 2005). PV-1 is a highly valuable marker for fenestrae formation as its
homogenous distribution within cells changes into the so-called “sieve plates” once
fenestration starts.
6.1.3. Importance of Endothelium in RPE-choroid Interface
The choriocapillaris is outside of the tight blood-retinal barriers at the vessels of the
neural retina and the retinal pigment epithelium (Cunha-Vaz, 1979). The
choriocapillaris has fenestrations mainly on the side facing Bruch’s Membrane and
the RPE. The main function of the choriocapillaris is presumed to be to mediate
transport of solutes and nutrients to the outer retinal layers through the RPE
(Bernstein and Hollenberg, 1965) and clear the debris generated through the

178
processing of photoreceptor outer segments (Bok, 1993). The transport between the
RPE and choroid is highly dependent on signalling by the RPE. Esser et al showed
that epithelial cells associated with fenestrated endothelium continuously express
VEGF as a way to control angiogenesis and fenestration (Esser et al., 1998).
Interestingly, a mutant mouse which expresses solely VEGF188 but not the
VEGF164 and VEGF120 present in the RPE was devoid of choroidal fenestration
and had a thickened endothelium at 12 months of age (Saint-Geniez et al., 2009a),
highlighting the specificity of VEGF isoforms in fenestration. Apart from pro-
angiogenic factors, the RPE also mediates the prevention of neovascularisation,
possibly by releasing and maintaining level of pigment-epithelium derived factor
(PEDF) (Ida et al., 2003, Mori et al., 2001, Park et al., 2011).
Maintaining proper interaction between the choroidal endothelium and the RPE is
likely to be crucial to the maintaintenance of normal function(s) at this interface.
Several studies have indicated that ageing compromises the integrity of the RPE-
choriocapillaris interface. Animal studies haveshown that vasculature density and
fenestrations decrease with age (Burns and Hartz, 1992).
Structural changes in AMD affect the morphology of the RPE and the. McLeod et
al (McLeod, et al 2009 IOVS) concluded that significant loss of the RPE and
vasculature occurred in human AMD eyes with geographic atrophy compared to
aged non-AMD eyes. They also showed that no fenestrations could be observed in
the region of RPE loss (McLeod et al., 2009). The presence of sub-retinal RPE
deposits is thought to contribute to these changes as they interrupt the
communication between RPE and the choroidal capillaries. Various environmental
and non-environmental factors like diet and lifestyle factors (Wright et al., 1983),
alcohol (Wang et al., 2005), smoking and nicotine (Espinosa-Heidmann et al.,
2006, Yang et al., 2010) can interfere with fenestrae formation. Here we present
evidence that zinc is important for fenestrae formation as well.
6.2. Aims and Hypothesis
Fenestration of the choroidal capillaries is maintained through the release of VEGF,
and probably other biomolecules, by the RPE(Roberts and Palade, 1995). The
thickening of Bruch’s membrane and the development of sub-RPE deposits is
thought to interfere with the diffusion of these intermediaries (Booij et al., 2010a)

179
causing the defenestration and eventually the atrophy of the choriocapillaris.
Impaired nutrient exchange and product removal then leads to the degeneration of
the RPE. As zinc, both bound and bio-available, is present in Bruch’s membrane in
high concentrations (Lengyel et al., 2007), we hypothesised that zinc is one of the
biomolecules involved in fenestrae formation. Totest this hypothesis we:
1. Used a cellular model system for fenestrae formation.
2. Exposed cells to extracellular zinc, and monitored fenestrae formation using
immunocytochemistry and TEM.
3. Determined the specificity of zinc-induced fenestration by treating bEND5 cells
with equimolar concentrations of other divalent metals.
4. Identified the signalling pathway(s) involved in zinc induced fenestrae formation
using bioinformatic tools
Latrunculin A treatment of bEBD5 cells as a Model for Fenestration
Methods:
In this study, we followed the protocol of Ioannidou et al (2006) who used cultured
bEnd5 cells and Lantrunculun A (LA) treatment to induce fenestrae formation
(Ioannidou et al., 2006). Latrunculin A is a toxin isolated from Latrunculia
magnifica,or red sea sponge (Coue et al., 1987). Latrunculin A (1.25uM)has been
shown to bind to actin leading to the disruption of the cytoskeleton (Ioannidou et
al., 2006). As a consequence LA induces a widespread relocation of PV-1 proteins
and, fenestrae formation (Ioannidou et al., 2006).
Results:
Figure 6.2 summarizes the results of 1.25 µM LA on bEND5 cells. PV-1
immunoreactivity (panel B) highlights typical “sieve plates”, an indication that PV-
1 protein was redistributed. A counterstain with Rhodamine Phalloidin shows that
the cytoskeleton was disrupted. Actin staining shows bands of immunoreactivity in
the control samples, which were replaced by punctate, dotty linear staining. Using
whole-mount transmission electron microscopy (TEM), we were able to reproduce
Ioannidou’s results and show that not only PV-1 redistributed into “sieve plates”

180
but that it also led to formation of fenestrae. Figure 6.2 shows uniform fenestration
resulting from Latrunculin A treatment. The average diameter of the fenestrae was
74±19nm, similar to the 60-80nm reported by Ioannidou et al (see Figure 6.8). At
higher magnification, the cores of each fenestration become apparent (Figure 6.2
Panel F). The structure holds the size of the fenestration and is present in every
single fenestra. In this chapter, we will highlight the effect of zinc and various other
metals in inducing fenestrae formation, and Latrunculin A treatment will be used as
a control for each of the reactions.

Figure 6-2- LA induces fenestrae formation
Treatment of bEND5 cells with 1.2
(Panel B) and actin (Panel C).
63x magnification, scale bar 10µM.
uniform layers full of fenestration (Panel D, 800x magnification
magnification, scale bar: 0.5µM
diaphragms (Panel F, 12000x magnification
LA induces fenestrae formation
Treatment of bEND5 cells with 1.25µM of Latrunculin A resulted in rearrangement of PV
(Panel B) and actin (Panel C). Panel A, B,C were taken using LSM700 confocal microscope with
63x magnification, scale bar 10µM. TEM analysis showed typical actin rearrangement forming thin
orm layers full of fenestration (Panel D, 800x magnification, scale bar: 1µM
, scale bar: 0.5µM). High magnification shows the presence of typical fenestrae
diaphragms (Panel F, 12000x magnification, scale bar: 200 nm)
181
5µM of Latrunculin A resulted in rearrangement of PV-1 protein
Panel A, B,C were taken using LSM700 confocal microscope with
TEM analysis showed typical actin rearrangement forming thin
, scale bar: 1µM, Panel E, 5000x
). High magnification shows the presence of typical fenestrae

182
6.3. Treatment with ZnSO4 can Induce PV-1 Protein Rearrangement
Methods:
The bEND5 cells were cultured in DMEM with added glutamine and pyruvate
supplemented with 10% FCS, 1% penicillin streptomycin, 1x NEAA, and 50µl of
50mM β-mercaptoethanol. Zinc, in the form of ZnSO4, was added to this media. As
some of the constituents of this media can bind added zinc we calculated the
buffering capacity (with the help of Prof. Richard Thompson, University of
Maryland, USA) and measured bioavailable extracellular zinc concentration using
ZnAF2 (see Chapter 5) and found that bioavailable zinc levels detected were below
1µM, with up to 250 µM added ZnSO4 (Figure 6.3). At 100, 150, 175, 200 and
250µM added ZnSO4, the concentration of free zinc detected was 447±68, 600±73,
629±33, 698±50, and 926±214 nM respectively. Based on the calculation, the total
amount of zinc present in growth media of bEND5 cells at 125µM is 516 nM.
Figure 6-3- Measurement of free intracellular zinc using ZnAF2.
The presence of zinc buffering constituents in the growth media of cells buffered
zinc. Addition of 100, 150, 175, 200 and 250µM ZnSO4 resulted in 447±68, 600±73,
629±33, 698±50, and 926±214 nM respectively. R2= 0.97.

183
Results:
In untreated (control) samples (Figure 6.4, panel C), the cytoskeleton appears normal
and PV-1 is distributed homogenously, apart from dense perinuclear staining. When
cells were exposed to 125µM ZnSO4, (a concentration chosen based on the
experiments in Chapter 5 on RPE cells), corresponding to ~370-500 nM bioavailable
zinc, for 20 hours, rearrangement of PV-1 became apparent (Figure 6.4, panel E,F).
However, no rearrangement of actin was apparent. Compared to LA treatment, which
produced widespread “sieve plates” formation and a substantial rearrangement of
actin, zinc treatment induced the formation of smaller clusters of sieve plates without
apparent actin rearrangement (Figure 6.4, panel E,F).
Next we explored how different concentrations of zinc affect “sieve plate” formation.
Cells were treated with 50, 100, 125, 150, 175 and 200µM of added ZnSO4 for 20
hours at 37oC with 5% CO2. PV-1 rearrangements were only seen starting at 100µM
(50µM data not shown), in the form of very fine PV-1 rearrangements inside the cells
close to the plasma membrane of the cells (Figure 6.5 Panels E-H). At 125µM, more
defined clusters of sieve plates were produced (Figure 6.4 Panels E-F). At 150µM
and 175µM, sieve plates did not increase compared to 125µM (Figure 6.5 Panels I-
P). At 200µM added zinc evidence of cells losing membrane integrity was apparent
(Figure 6.5 Q-T). In pilot studies 250µM ZnSO4 treatment resulted in clear
indications of toxicity with cells shrinking, as well as nuclear condensation and
blebbing (Data not shown). This confirms the notion that there is a narrow range of
“bioavailable” zinc that can be tolerated by cells.
In order to minimise the possibility of zinc toxicity, it was decided that the lowest
concentration that could induce PV-1 rearrangement, namely 125µM, would be used
for subsequent experiments.

184
Figure 6-4 – 125 µM added ZnSO4 cause PV-1 protein rearrangement
Treatment of bEND5 cells with 125µM of added ZnSO4 for 20 hours caused PV-1
protein rearrangement and formation of sieve plates (Panels E-L) compared to
untreated cell (Panel A-D). Actin staining using Rhodamine Phalloidin indicated
the lack of cytoskeletal changes (Panels C, G, K). Panels E-H showed a more
extensive PV-1 rearrangement compared to Panels I-L. Pictures were taken using
LSM700 confocal microscope at 60x magnification. All scale bars = 10µm.

185
Figure 6-5 – Treatment of bEBD5 cells with 100-200µM of added ZnSO4
Treatment of bEND5 cells with 100-200µM of added ZnSO4 caused varying levels
of PV-1 protein rearrangement and formation of sieve plates (Panels E-T)
compared to untreated cell (Panel A-D). Actin staining using Rhodamine Phalloidin
(Panels C, G, K, O, S) indicated the lack of cytoskeletal changes. Pictures were
taken using LSM700 confocal microscope at 60x magnification. All scale bars =
10µm.

186
Next the time-course of fenestrae formation was investigated. The cells were
exposed to 125 uM added zinc for 3, 6, 9, and 20 hours. While fenestration could be
seen as early as 3 hours, 9 hours of zinc treatment was required for consistent
fenestrae formation. Untreated samples again showed diffuse and homogenous
staining of PV-1 protein across the cytoplasm with normal staining of actin and
DAPI. At three hours of treatment, minor changes in PV-1 staining could be
observed. After six hours, there was rearrangement of PV-1 where diffuse PV-1
staining could be seen around the cells (Figure 6.6 Panels I-L). At 9 hours and 20
hours, several clusters of sieve plates could be seen (Figure 6.6 Panels M-T).

187
Figure 6-6 – Time course treatment with 125µM of added ZnSO4
Treatment of bEND5 cells with 125µM of added ZnSO4 for 3-20 hours showed
rearrangement of PV-1 protein from 3 hours (Panel E-H), however, sieve plates
formation were only apparent in cells treated with zinc for 9 and 20 hours (Panels
M-P and Q-T). Actin staining (Panels C, G, K, O, S) was conducted using
Rhodamine Phalloidin Dye. PV-1 staining was done using anti-PV1 antibody and
Alexa 488 secondary antibody. Pictures were taken using LSM700 confocal
microscope at 60x magnification. All scale bars = 10µm.

188
6.4. Electron Microscopy Confirmation of Zinc Induced Fenestration
PV-1 immunoreactivity is a reliable indicator of PV-1 protein translocation but by
light microscopy we cannot confirm that this has led to fenestrae formation.
Therefore fenestrae formation was monitored by whole mount transmission electron
microscopy.
Methods:
bEND5 cells were grown overnight on formvar coated nickel TEM grids in the
presence of standard culture media supplemented with 10% FCS and 1% penicillin-
streptomycin. The cells were then treated either with LA for three hours or 125µM
ZnSO4 for 20 hours or were left untreated as controls. The timing of the LA
treatment was synchronized with the 20 hours zinc treatment, meaning that LA
treatment commenced 3 hour before the zinc treatment finished. Therefore, all
reactions were stopped at the same time by fixing the cells. Following fixation, the
cells were treated with osmium tetroxide and were viewed using a JEOL10TEM
microscope.
Results:
Cells treated with LA showed the expected rearrangement of actin and formation of
fenestrae. The endothelial cells have multiple sieve plates arranged around
cytoskeletal actin bundles which radiated from the nucleus (Figure 6.7 Panel A). At
5000x and 12000x magnification (Figure 6.7 Panel B and C), the fenestration formed
by LA treatment showed uniform pattern. These fenestrae formed by ZnSO4 and LA
all possessed central diaphragms (Figure 6.7, Panel C and I). Limited spontaneous
fenestrae formation was apparent in untreated control cells but they were very small
(Figure 6.7, Panel E). Cells treated with 125µM ZnSO4 for 20 hours were
consistently fenestrated (Figure 6.7, Panel G-I) and sieve plates were present (Figure
6.7, Panel G). These sieve plates covered smaller areas than in LA-treated cells.
This confirms our findings with PV-1 antibody labeling.

189
Figure 6-7 – TEM pictures showing fenestrae formation
Transmission electron microscopy showed fenestrae formation after treatment with
1.25µM Latrunculin A (LA) (Panels A,-C) and 125µM added ZnSO4 (Panels G-I).
Fenestration was not observed in untreated cells (Panels D-F). Panels A-G showed
formation of fenestrae at 800x magnification, where extensive changes in cellular
cytoskeleton was observed in cells treated with LA (Panel A), zinc treatment forms
smaller areas of fenestration without extensive cytoskeletal arrangements (Panel G).
At higher magnifications, LA treatment forms highly uniform fenestration pores
(Panel B 5000x, scale bar 1µm. Panel C 12000x, scale bar 0.5µm) and zinc
treatment forms smaller areas of fenestration, also with uniform size (Panel H
5000x, Panel I 12000x, scale bar 200nm). Images taken with JEOL10TEM.

190
Furthermore, we would like to compare the size of fenestrae formed ZnSO4
treatment compared to those formed by LA.
Methods:
Six pictures and four pictures of 12000x magnification were randomly taken from
LA and zinc sulphate treated bEND5 cells from three different experiments
respectively. Areas with fenestrae were imported into ImageJ software. After
removal of speckles and outliers, the area and diameter of individual fenestrae were
determined. Objects less than 40nm in diameter were rejected as it had been
determined from manual observations that the smallest of the fenestrae assessed
was 46nm in diameter.
Results:
The size of 393 fenestrae from ZnSO4 treated samples, and 775 fenestrae from LA
treated samples were estimated. Fenestrae of LA-treated cells were 74+19 nm in
diameter and those from ZnSO4 treated cells were 67+14 nm.
The size distributions for zinc and LA-treated cells are as follows. In zinc treated
samples, 20.9% of the fenestrations formed were of 45-64nm in size, compared to
9.7% in LA treated group. 22.4% were of 55-65nm size in ZnSO4 treated samples
compared to 23.0% in LA treated group. Most fenestrations formed were 65-74nm
diameter, with 31% of ZnSO4 treated group and 24.8% of LA treated group falling
into this category. 13.0% of ZnSO4 treated group formed fenestrations 75-84nm in
size compared to 24% in LA treated group. The data indicate that the sizes of
fenestrae formed are variable in both treated groups. Zinc induced fenestration
formed more fenestrae in the 45-54nm group compared to LA which have more
fenestrae in the 75-84nm range (Table 6.1, Figure 6.8).

191
Table 6-1 - Total fenestrae formed in ZnSO4 and LA treated groups. Four and
6 pictures were analysed for ZnSO4 and LA- treated groups respectively.
% of Total Fenestrae Formed
125 uM ZnSO4 1.25 uM LA
45-54 20.9 9.7
55-64 22.4 23.0
65-74 31.0 24.8
75-84 13.0 24.0
85-94 8.7 8.1
95-104 2.0 4.4
105-114 0.5 1.9
115-124 0.5 1.7
125-134 0.3 0.9
135-144 0.0 0.4
145-154 0.0 0.1
155-164 0.0 0.3
165-174 0.0 0.4
>175 0.8 0.4
Fenestrae
analysed 393 775
Pictures analysed 4 6
Figure 6-8 – Sizes of fenestrae were measured in ZnSO4 and LA treated bEBD5
cells. Treatment with ZnSO4 and LA resulted in formation of fenestrae of
various sizes. Data are expressed as percentage of total fenestrations formed
against the diameter in nm and summarised in Table 6.1

192
6.5. Cell Viability Assays
ZnSO4 treatment to up to 150µM was not found to be overtly toxic. Based on
MINEQL (Environmental Research Software, Hallowell, USA) calculation, the
bio-available zinc concentration present in DMEM high glucose used for bEND5
cells is <1.0µM zinc (Professor Richard Thompson, personal communication). We
have shown here that using ZnAF2 measurement, addition of 125µM added ZnSO4
the bioavailable zinc concentration is ~370-500 nM. However above, 200 µM of
added ZnSO4 abnormal nucleus shape signalled cell toxicity.
Methods:
To gain a better understanding of cellular viability, calcein AM and propidium
iodide staining were used to measure the extent of cell death in our assays.
Propidium iodide is a DNA intercalating agent, which stains the nucleus of necrotic
or apoptotic cells. In contrast to the cell-impermeant nature of propidium iodide,
Calcein AM is a highly cell-permeant fluorescent dye, which fluoresces strongly
selectively in live cells.
Results:
Figure 6.8 shows that bEND5 cells untreated, treated with 1.25 µM LA or125µM
ZnSO4 for three hours or treated with 125µM ZnSO4 for 20 hours showed no sign
of cell death. In all four groups, the green Calcein AM staining could be seen
clearly highlighting the shape of the cells.The two main phenotypes of the cells, a
smaller more elongated shape and larger more rounded cells were present in all four
tested groups. In LA treated groups, the rearrangement of cytoskeletal network
could be seen through the calcein dye.
Qualitative assessment of the cells does not indicate a difference in the cell
numbers as assessed through calcein staining, while the lack of propidium iodide
staining showed no evidences of cell death. No floating cells were observed in any
of the experiments.

193
Figure 6-9–Calcein assay and propidium iodide staining in bEBD5 cells
The use of propidium iodide and calcein AM allows the differentiation between
dead and live cells. Panel A shows bEND5 cells treated with 1.25µM LA, Panel B
shows untreated cells. Panel C and D shows cells treated with 125µM ZnSO4 for 3
and 20 hours respectively. The calcein staining (green) shows that cell viability was
preserved after zinc treatment (Panel C and D), and there is a lack of propidium
iodide staining in all treated and untreated groups. Representative images taken
from 3 independent experiments. Scale bar 100µm.

194
6.6. Treatment of bEBD5 Cells with Other Divalent Metals
In order to explore the specificity of zinc, the effects of various divalent metals on
fenestrae formation was examined. The selection of metals was based on results
obtained on synchrotron X-ray fluorescent studies on Bruch’s membrane and sub-
RPE deposits which showed that apart from zinc, there is an accumulation of
copper, iron, nickel, calcium, magnesium and cadmium (Lengyel unpublished data)
(Wills et al., 2009).
Methods:
Equimolar (125 uM) concentration of CaSO4, FeSO4, CuSO4, NiSO4, MgSO4 and
CdSO4 were used to treat bEND5 cells for 20 hours. Treatment of cells with 125µM
CuSO4 and 30uM CdSO4 severely compromised cell viability. Cadmium sulphate
treatment caused all the cells to die (data not shown), while CuSO4 treated samples
had visible nuclear blebbing, shrinking cells and compromised actin structure
(Figure 6.11 M-P). Therefore these metals were not examined further in any detail.
To assess the effectiveness of divalent metals in inducing fenestrae formation we
followed the characterisation steps described for zinc. Namely we visualized
changes in PV-1 and actin distribution followed by whole mount TEM to determine
whether fenestrae were formed. Results were compared to untreated, 125 µM
ZnSO4 treated and 1.25 uM LA treated cells.
Results:
Treatment of bEND5 cells with CaSO4 (Figure 6.10 Panel I-L) showed PV-1
rearrangement but only at the edges of the cells.TEM results confirmed the
presence of fenestration here (Figure 6.12 Panel E-F), but these fenestrae were
much sparser, though similarly sized,to those formed in the presence of zinc
(~65nm diameter). Following treatment with FeSO4, PV-1 formed large clumps
rather than sieve plates (Figure 6.11 Panel E-H) although fenestrae formation is
clearly visible on TEM (Figure 6.12 Panel G-H). These fenestrae, however, were
sparsely distributed, just like in the case of CaSO4, and there were several areas
with only misshapen but very large fenestrae. Nickel sulphate treatment produced
sieve plate formation only rarely (approximately 10 cells per cover slips) (Figure

195
6.10 Panels M-P). However, in these cells sieve plates looked similar to those seen
with zinc. Despite the similarity in sieve plate formation in NiSO4 treated cells we
could not see fenestrae by TEM (Figure 6.12 Panels I-J). Magnesium sulphate
(Figure 6.11 I-L) did not lead to sieve plate or fenestrae formation. Visible change
in actin staining could be observed in some of the metal treated cells, most visibly
in CuSO4, CaSO4 and MgSO4 treated samples. In CuSO4 treated samples, changes
in actin staning could be seen in the cytoskeletal changes related to the cell death.
In CaSO4 and MgSO4 treated cells, there is visible activation of stress fibers as seen
through rhodamine phalloidin staining of the actin cytoskeleton.
We also showed that confluent cell layers behave similarly to disperse invididual
cells. Treatment of bEND5 cells with equimolar concentrations of with ZnSO4,
CaSO4 and NiSO4 (125µM) shows the same observation as before (Data not
shown). Treatments with these metals but not LA produced cells with normal actin
structures and normal nuclear staining. Treatment with 125µM FeSO4 and 125µM
MgSO4 did not provoke fenestration (Data not shown).

196
Figure 6-10 – Effect of divalent metals on fenestrae formation
Treatment of bEND5 cells with equimolar concentrations of 125µM added
ZnSO4(Panels E-H), CaSO4(Panels I-L), and NiSO4 (Panels M-P) for 20 hours
showed rearrangement of PV-1 protein which is not seen in the untreated cells
(Panels A-D). Actin staining conducted using Rhodamine Phalloidin does not show
cytoskeletal rearrangements (Panels C,G,O) with the exception of calcium (Panel
K), which shows activation of stress fibers. with exception of CaSO. Pictures were
taken using LSM700 confocal microscope at 60x magnification. All scale bars =
10µM.
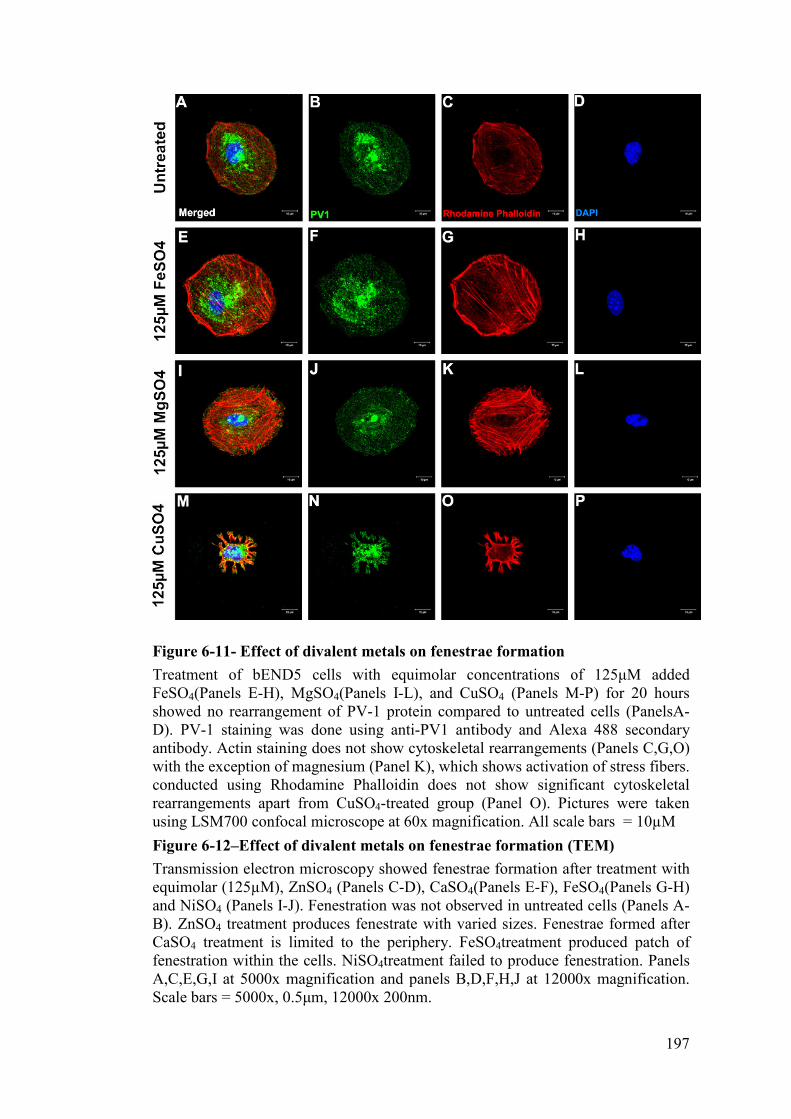
Figure 6-11- Effect of divalent metals on fenestrae formation
Treatment of bEND5 cells with equimolar concentrations
FeSO4(Panels E-H), MgSO
showed no rearrangement of PV
D). PV-1 staining was done using anti
antibody. Actin staining
with the exception of magnesium (Panel K), which shows activation of stress fibers.
conducted using Rhodamine Phalloidin does not show significant cytoskeletal
rearrangements apart from Cu
using LSM700 confocal microscope at 60x magnification. All scale bars = 10µM
Figure 6-12–Effect of divalent metals on fenestrae formation (TEM)
Transmission electron microscopy
equimolar (125µM), ZnSO
and NiSO4 (Panels I-J). Fenestration was not observed in untreated cells (Panels A
B). ZnSO4 treatment produces f
CaSO4 treatment is limited to the periphery. FeSO
fenestration within the cells. NiSO
A,C,E,G,I at 5000x magnification and pane
Scale bars = 5000x, 0.5µm, 12000x 200nm
Effect of divalent metals on fenestrae formation
Treatment of bEND5 cells with equimolar concentrations of 125µM added
H), MgSO4(Panels I-L), and CuSO4 (Panels M
showed no rearrangement of PV-1 protein compared to untreated cells (PanelsA
staining was done using anti-PV1 antibody and Alexa 488 secondary
n staining does not show cytoskeletal rearrangements (Panels C,G,O)
with the exception of magnesium (Panel K), which shows activation of stress fibers.
conducted using Rhodamine Phalloidin does not show significant cytoskeletal
rearrangements apart from CuSO4-treated group (Panel O). Pictures were taken
using LSM700 confocal microscope at 60x magnification. All scale bars = 10µM
Effect of divalent metals on fenestrae formation (TEM)
lectron microscopy showed fenestrae formation after treatment with
equimolar (125µM), ZnSO4 (Panels C-D), CaSO4(Panels E-F), FeSO
J). Fenestration was not observed in untreated cells (Panels A
treatment produces fenestrate with varied sizes. Fenestrae formed after
treatment is limited to the periphery. FeSO4treatment produced patch of
fenestration within the cells. NiSO4treatment failed to produce fenestration. Panels
5000x magnification and panels B,D,F,H,J at 12000x magnification.
Scale bars = 5000x, 0.5µm, 12000x 200nm.
197
of 125µM added
(Panels M-P) for 20 hours
1 protein compared to untreated cells (PanelsA-
PV1 antibody and Alexa 488 secondary
does not show cytoskeletal rearrangements (Panels C,G,O)
with the exception of magnesium (Panel K), which shows activation of stress fibers.
conducted using Rhodamine Phalloidin does not show significant cytoskeletal
treated group (Panel O). Pictures were taken
using LSM700 confocal microscope at 60x magnification. All scale bars = 10µM
Effect of divalent metals on fenestrae formation (TEM)
showed fenestrae formation after treatment with
F), FeSO4(Panels G-H)
J). Fenestration was not observed in untreated cells (Panels A-
enestrate with varied sizes. Fenestrae formed after
treatment produced patch of
treatment failed to produce fenestration. Panels
12000x magnification.

198

199
6.7. Possible Signalling Pathway(s) Involved in Zinc – Induced Fenestration
Activation of extracellular-signal-regulated kinases (ERK1/2) kinase pathway is
crucial for formation of fenestrae as inhibiting ERK1/2 prevented PV-1 up-
regulation (Stan, et al 2004). It is also known that expression of PLVAP, the gene
for PV-1, is dependent on kinases such as p38 and phosphatidylinositol 3-kinases
(PI3K) (Strickland et al Pathology 2005). In fact, these proteins are part of the
signalling cascade for VEGF, that stimulates fenestrae formation, as well as
nicotine that inhibits it. In addition these molecules are affected by zinc itself. In
this section we aim to understand whether phosphorylation of ERK is involved in
zinc induced fenestration.
Methods:
To identify the molecules involved in zinc-induced fenestrae formation we explored
information available in Ingenuity Pathway Analysis (IPA, Ingenuity Systems, Inc.,
California, USA). Using the “grow” and then the “connect” functions in pathway
builder in IPA the molecules shared by VEGF, nicotine and zinc signalling
pathways were explored (Figure 6.13). Amongst the several overlapping molecules
there were ERK1/2, IP3 and NFkB that were shared by all three molecules. Akt is
shared between VEGFand nicotine while Src is shared between VEGFA and zinc.
Interestingly, p38 is only connected to zinc. Naturally, IPA may not contain all
possible relevant data, but nevertheless indicated that molecules that have been
suggested to be involved in PV-1 regulation and fenestrae formation are shared by
these signalling molecules.
The way some of these molecules are involved in signalling is through
phosphorylation. Therefore, we treated bEND5 cells with 125 uM zinc for 20 hours
then lysed the cells and proteins were separated on SDS-PAGE, blotted to
Nitrocellulose and probed for phospho-specific antibodies and antibodies that
detect both the phospho- and non-phospho- forms of ERK1/2, PI3K,, P38, and
AKT.

200
Results:
Our results indicated that phosphorylation of ERK1/2 or pERK1/2 at all time points
(Figure 6.14) does not seem to be involved in zinc-induced fenestration suggesting
that other kinases would be responsible. However, beta-actin expression seems to
gradually increase up to one hour and returns back to normal at 20 hours. The
pictures are representative diagrams from three independent experiments.
Figure 6-13–Relationship between VEGF, nicotine and zinc
Ingenuity Pathway (IPA) software showed relationship of VEGF, nicotine and zinc,
the three molecules which have been shown to be involved in AMD. Using the
“grow” and “connect” functions, various signalling pathways were explored.
VEGFA affected KDR, 1,4,5-IP4, PI3K, ANGPT2, AKT, SRC, ERK1/2,
bevacizumab and ranibizumab. Zinc affects PI3K, IL6, SRC, ERK1/2, P38, NFқB,
and caspase. Nicotine affects SRC, PI3K, Akt, Pkc, ERK1/2 and NFқB. Shared and
overlapping pathways have been summarised in table 6.2.

201
Table 6-2 - Overlapping pathways between VEGFA, zinc and nicotine.
Bo VEGFA Zinc Bicotine
1 PI3K PI3K PI3K
2 ERK1/2 ERK1/2 ERK1/2
3 NFkB NFkB
4 AKT AKT
5 SRC SRC
6 PKC* PKC
7 P38
Figure 6-14–Phosphorylation of ERK1/2 is not involved in fenestrae formation
Probing of 10µg untreated (first lane) and 125µM ZnSO4 treated for 1, 5, 10, 30, 60
minutes and 20 hours revealed that there is no increase in ERK1/2 phosphorylation,
nor of its phosphorylated form pERK1/2. Beta-actin expression seems to increase
after 1 minute and sustained up to 1 hour before decreasing again at 20 hour time
point. Picture is representative from three independent experiments.

202
6.8. Discussion
The hypothesis to be tested in this chapter was that zinc was involved in fenestrae
formation in endothelial cells. Data presented support this in that zinc can induce
fenestration. Furthermore, elements of the signal transduction cascade that is
involved in the zinc induced signalling leading to fenestration have been identified.
To our knowledge this is the first demonstration of zinc-dependent fenestrae
formation.
Zinc and VEGF
The choroidal vasculature differs from the retinal vasculature in that it is fenestrated
(Bernstein and Hollenberg, 1965). In 1986, Mancini et al published that the
fenestrations found in the choriocapillaris were not randomly distributed, but they
were found predominantly in the endothelium closest to the RPE (Mancini et al.,
1986)(Mancini et al 1986). The endothelium thickens further away from the RPE
and it was speculated that there might be a signal from the RPE that “polarizes” the
endothelium and induces the fenestration formation (Mancini et al., 1986).
Fenestrae initially increase with age but in advanced age the number of fenestrae
decreases (Burns and Hartz, 1992). This is further affected by age related
pathologies like AMD (McLeod et al., 2009). At present the major signal that
controls fenestration is believed to be Vascular Endothelium Growth Factor
(VEGF). Esser et al described VEGF basally secreted by RPE as a regulator of
angiogenesis and vascular permeability (Esser et al., 1998). When adrenal cortex
capillary endothelial cells were co-cultured with epithelial cells transfected with
VEGF 164 and VEGF120 many fenestrae were induced on the endothelium (Esser
et al., 1998). Furthermore, treatment of adrenal cortex endothelial cells with
VEGF165 or fibroblast growth factor (FGF) showed that fenestrations could be
induced by VEGF but not FGF (Saint-Geniez et al., 2009b). There are three VEGF
isoforms but only VEGF120 and VEGF164 can induce fenestration VEGF188
cannot (Saint-Geniez et al., 2009b),(Saint-Geniez 2009 PNAS). Loss of fenestration
in the VEGF188 expressing animal model led to formation of sub-RPE deposits
providing evidence that supports the notion of a link between fenestrationin AMD
(Saint-Geniez et al., 2009b). There is an inverse correlation between zinc levels and
VEGF production. Treatment of PC-3 and DU-145 prostate cancer cell lines with

203
TPEN, a zinc selective chelator, at 2-8µM for 2 hours suppressed VEGF levels
(Golovine et al., 2008). Zinc chelation in HT-29, another prostate cancer cell line,
also reduced the level of VEGF (Gurusamy et al., 2011). Overexpression of hZIP1
protein, a plasma membrane zinc transporter that imports zinc into cells, also
inhibited VEGF production (Golovine et al., 2008). The mechanism behind the
effect of zinc on lowering VEGF levels is thought to be through the inhibition of
transcription of hypoxia inducible factor (HIF-1) a pro-angiogenic factor often
associated with the aggressiveness of tumours (Nardinocchi et al., 2010).
Zinc and PV-1
In our experiments a surrogate marker for fenestrae formation was the
redistribution of Plasmalemmal Vesicle Associated Protein-1 (PV-1) into the so
called sieve plates. PLVAP (the gene encoding PV-1) encodes a TypeII
transmembrane glycoprotein that is associated with the caveolae of fenestrated
microvascular endothelial cells. It is normally expressed in the lung, liver, kidney,
immature brain and in the eye (Stan, 2007). This protein is only associated with
fenestraethat have diaphragms, these being formed by PV-1 dimers (Stan, 2007).
RNA silencing of PLVAP expression led to large variability in fenestrae diameter
providing support that this protein does controls the size of fenestrae (Ioannidou et
al., 2006). The fact that the diameter of zinc-induced fenestrae was similar to those
requiring PV-1 in vivo or following LA treatment suggested zinc-induced
fenestration does involve PV-1. It is not known whether zinc or any metals could
directly affect PV-1 or PLVAP. Our search did not locate any metal response
element transcription factor up to 1000bp upstream of the 5’ un-translated region of
PLVAP gene therefore it is not very likely that altered zinc balance would lead to
regulation of gene expression and recent zinc supplementation experiments in our
laboratories did not demonstrate changes in PLVAP expression of this gene
(Barzegar-Befroei and Lengyel, personal communication). It seems probable,
therefore, that sieve plate formation and formation of fenestrae does not involve
direct PV-1/zinc interaction.
It is believed that the formation of fenestrae requires the reorganization of the
cytoskeleton. It had been reported that zinc, and several other divalent metals, can
affect polymerisation of actin, although only at very high (>300 uM) concentrations

204
(Strzelecka-Golaszewska et al., 1978). At the levels of bio-available zinc in our
experiments (~200 nM) we did not see discernable evidence for actin remodelling,
although we cannot rule out local changes in the cytoskeleton around the zinc-
induced sieve plates. Therefore we assume that fenestrae formation in our
experiments is unlikely to be due to a direct zinc/cytoskeleton interaction.
Zinc can be toxic to cells (Bozym et al., 2010). However, treatment of bEND5 cells
with up to 150 µM externally added ZnSO4 did not appear to be toxic to these cells,
as shown by a calcein/propidium iodide assay. Similar concentrations of
extracellular zinc have been widely used in other studies with success. Richard et
al added 150µM of zinc chloride to cultured human skin fibroblasts and noted that
these concentrations,in the presence of FCS, lowered the concentration of
thiobarbituric acid reactants as a marker of lipid peroxidation (Richard et al.,
1993). In Chinese Hamster Ovary (CHO) cells, addition of up to 100µM zinc
chloride to media supplemented with FCS increased metallothionein levels within
the cells without inducing toxicity (Wallace et al., 1995). It is particularly important
to emphasize that the high concentration of externally added zinc does not translate
to equal amount of bio-available zinc. We and others (Bozym et al., 2006, Bozym
et al., 2010) found that growth media with FCS very strongly buffered zinc levels,
keeping bio-available zinc < 1 uM. It is interesting to note that in the absence of
added zinc, but in the presence of FCS, cells are potentially in a zinc deficient
environment (Bozym et al., 2010, Bozym et al., 2006). This might need to be taken
into account when results on cultured cells are interpreted. Overall, it appears
unlikely that the zinc-induced fenestration of bEND5 cells would, per se be
associated with toxicity.
We have also examined the specificity of zinc-induced fenestrae formation by
treating bEND5 cells with CaSO4, FeSO4, NiSO4, MgSO4, CdSO4 and CuSO4.
While CdSO4 and CuSO4 were toxic to cells, other divalent metals except Mg SO4
were able to induce either PV-1 rearrangement, fenestrae formation or both.
However, these effects were marginal compared to the reliable sieve plate and
fenestrae formation seen in the presence of zinc. Interestingly NiSO4 was able to
induce sieve plate formation in a few cells, but this was not accompanied by
fenestrae formation. This suggests that PV-1 reorganization is not sufficient to

205
induce fenestration. Based on the results with divalent metals it is concluded that
fenestrae formation was not specific to zinc but is most prominent in zinc-treated
cells.
The formation of stress fibers observed in CaSO4, and MgSO4 treated cells may be
mediated through activation of Rho GTPases. The activation of Rho GTPases is
particularly important in cellular movement, particularly in cellular migration
through extension of lamellipodium, and cell contraction (Manneville and Hall,
2002). The cellular movement and contraction is achieved through changes in stress
fibers, a structure formed of myosin II, and actin filaments (Nobes and Hall, 1995).
Studies have reported the role of calcium and magnesium in regulating Rho
GTPases in various cells. Katoh and colleagues reported that isolated stress fibres
in vitro can be activated using calcium and ATP through phosphorylation of myosin
light chain (Katoh et al., 1998). Calcium has also been shown in regulating Rho
GTPases in adrenal chromaffin cells (Gasman et al., 1999), and plant pollen tubes
(Yan, Xu, and Yang, 2009). It is known that Rho-GTPases induce endothelial cell
permeability (Wójciak-Stothard et al., 2001) and magnesium is essential for activity
of Rho-GTPase activating proteins (Zhang et al., 2000). As we did not observe
fenestration in either magnesium or calcium, it is possible that these two metals
have effect on proliferation of or activate other mechanism in bEND5 cells. Such
effect has been seen in human umbilical vein endothelial cells (HUVECs) treated
with physiologically viable millimolar concentrations of magnesium. Increased
proliferation was observed, as well as increased nitric oxide level, suggesting that
magnesium treatment may have vasodilatative effect on endothelial cells (Maier, et
al., 2004). It would be interesting to do functional assay on Rho-GTPase activation
on magnesium or calcium treated bEND5 cells to observe how these metals affect
the cell line.
Twenty hours treatment of bEND5 cells with >30µM CdSO4 results in nuclear
blebbing, major cell contraction and cytoskeletal rearrangement. This is probably
not surprising, considering various other studies have reported on the toxicity of
cadmium on endothelial cells. Loss of stress fibers and cytoskeletal rearrangement
have been reported in MDCK cells treated with very high (500µM) concentration
of cadmium (Hernandez et al., 1989). Using egg yolk angiogenesis assay, it was

206
shown that treatments with as low as 1µM cadmium chloride reduces angiogenesis
and wound healing, an effect possibly mediated by lowered production of nitric
oxide (Kolluru, et al., 2006). It needs to be stressed that unlike the zinc
concentration, we did not optimize the concentration of cadmium. It is likely that
>30µM of cadmium exceeds the buffering capacity of bEND5 cells which activated
the pro-apoptotic mechanisms
The fenestration induced by zinc appears to be a relatively slow process as we did
not observe sieve plate formation by light microscopy until 9 hours after the start of
the treatment. However, formation of some fenestrae can be seen as early as 3 hours
of zinc treatment by TEM. The process appears to be concentration dependent
requiring the increase in bio-available zinc to ~200 nM for a reliable and repeatable
effect. This corresponds to 125 µM added zinc. The environment the choroidal
capillaries are nested in is high in zinc including bio-available zinc (Lengyel et al.,
2007). Indeed, bio-available zinc can be readily detected adjacent to the fenestrated
choroidal capillaries in ex vivo human eyes (Figure 6.15, courtesy of Gango and
Lengyel, Unpublished) by autometallography, providing evidence that zinc is
present around the choriocapillaris and potentially able to initiate a cascade of
events leading to fenestration. Based on literature data on fenestrae formation and
signalling by VEGF (inducing fenestration), nicotine (inhibiting fenestration) and
zinc we developed a model using IPA to explore whether phosphorylation is
involved in zinc-induced fenestrae formation. We identify here that ERK1/2 is not
involved in regulating zinc-induced fenestration in bEND5 cells, suggesting that
fenestration is mediated by other kinases or cellular processes.
Taken together, it is feasible to speculate that both zinc and VEGF are involved in
regulating fenestration of the choroidal endothelium and individually or
synergistically regulate fenestration at places like the RPE/choroid interface where
there is high enough concentration of zinc to exert an effect. The potential for a
dual regulation of fenestrae formation had not been previously described. This
would allow both zinc and VEGF to participate in the health, and in fact pathology,
of the outer retina-blood barrier.

207
Figure 6-15–Bioavailable zinc in Bruch’s membrane
Autometallography on ex vivo human eyes shows the presence of bioavailable zinc
in the RPE-Bruch’s membrane area (electron dense speckles) (Figure A, B)
adjacent to the choriocapillaris (CC). Oblique sections show the presence of
fenestrated endothelium (Figure A) between the BM and CC, where the diaphragm
of the each fenestra is apparent at higher magnification (Figure B). RPE: Retinal
Pigment Epithelium, BM: Bruch’s Membrane, CC: Choriocapillaris. Scale bars:
Figure A, 200nm, Figure B, 100nm.

208
6.9. Further research
Further experiments will be required to decide whether the model for dual action
through both zinc and VEGF does really fit the in vivo situation. We will need to
explore how fenestrae formation is affected when VEGF and zinc are present in the
growth medium, an experiment that is already in the planning. It will also be
interesting to see whether in vivo zinc deficiency in animals would alter fenestration
of the choroidal capillaries and we are collaborating with Professor John Beattie at
the Rowette Institute in Scotland to induce controlled zinc deficiency in mice. Zinc
deficiency had been associated with loss of endothelial cell permeability (Di Cello
et al., 2005). Whether in the choriocapillaristhis translates to loss of fenestrae will
be exciting to explore. The generation of zinc deficiency in mice study is about to
be finished and we will have the chance to analyse eyes for molecular and
morphological changes. We will also need to explore further the molecular
networks involved zinc-induced fenestration. Experiments are ongoing to identify
the changes in protein phosphorylation in cell homogenates as well as in cells.
6.10. Conclusion
In conclusion we propose here that the under normal conditions, optimal zinc and
VEGF levels are required to maintain a healthy outer retina-blood barrier including
appropriate fenestration of the choriocapillaris. Pathological changes like
thickening of Bruch’s membrane or development of sub-RPE deposits will prevent
VEGF and/or zinc to reach the choroidal microvessels as well as lead to entrapment
of zinc in proteinaceous aggregates the impairment of clearance through the loss of
fenestration will be seriously compromised. As sub-RPE deposit formation has
been strongly associated with the choroidal capillaries (Lengyel et al., 2004,
Mullins et al., 2011) the issue of altered zinc availability will probably need to be
addressed. In fact, zinc supplementation has a positive effect on progression to end
stage disease in AMD as described in the AREDS study no 8 (2001) and zinc
supplementation had been shown to directly affect the RPE/choroid interface one of
the steps in this positive effect might be through the reopening of fenestrae to
provide better clearance of waste products.

209
7. General Discussion
Zinc is an indispensable and ubiquitous trace element present in many tissues in a
wide range of organisms. The overall amount of zinc found in the human body is
estimated to be 1.4-2.3 grams (Strauss, 2005). The highest tissue concentration of
zinc in man is found in the RPE-choroid complex where the zinc content is 472
µg/g dry weight (Karcioglu, 1982). The high zinc concentration of zinc in the RPE-
choroid complex is likely to be required for its function in regulating enzymes
involved in the retinal cycle, phagocytic activity of the RPE and combating free
radicals present in the RPE-choroid complex.
In 2004, Lengyel et al reported that sub-retinal RPE deposits contained a very
high>500 ppm of zinc (Lengyel et al., 2007). This observation raises questions
about where zinc in the RPE-choroid interface is coming from, and how it reaches
the sub-RPE space. Furthermore, it remains unknown whether the bioavailable zinc
found in Bruch’s membrane (see Figure 6.15) is needed for RPE function, or
whether it is involved in pathological processes. It is known that zinc deficiency is
associated with age-related macular degeneration (AMD) (Newsome et al., 1988)
and clinical trials have reported that zinc supplementation can delay AMD-
associated vision loss (Ho et al., 2011a). This has highlighted the need to better
understand how zinc is metabolised and transported at the RPE/choroid interface.
At the outset of this study, we aimed at obtaining support for this idea by examining
three major areas.
We set out to study the largely unexplored zinc transporters at the RPE-choroid by
determining the expression for all the 24 known zinc transporters genes at this site.
In parallel with our work two other groups published partial characterisation of zinc
transporter expression (Leung et al., 2008a, Rezaei et al., 2008a), highlighting
potential antioxidative functions of zinc transporter proteins (Rezaei et al., 2008a).
Throughout this basic characterisation we identified ZIP12 protein as a potentially
important zinc transporter at the RPE-choroid interface based on its gene
expression in cadaveric RPE. We acknowledge the major caveat contributed by the
cross-contamination present within the cadaveric samples, and thereby suggest
improvements in isolating RNA from cadaveric tissues to be carried out to improve
the data presented in this thesis and to confirm that ZIP12 is indeed expressed in the

210
RPE. Other studies have suggested that ZIP12 protein appears to be specific to
RPE, as shown by the Bergen group (Booij et al., 2010b). Based on this and the
lack of published data on ZIP12, after a careful consideration we carried out a
series of experiments to learn more of the function of this protein. ZIP12 turned out
to be a zinc importer located at least partly on the plasma membrane. Therefore, it
is likely that if ZIP12 is confirmed to be present in the RPE, it is likely to be
involved in loading, or reloading zinc into RPE cells. While the association of
ZIP12 polymorphisms or mutations with AMD was not examined in this thesis, we
have started to analyze results of genome-wide association studies to look at
whether polymorphism of SLC39A12, the gene for ZIP12, could be associated with
AMD (in collaboration with Professor John Yates). In order to understand the
protein’s potential function, we started the characterisation of commercially
available antibody as well as generating an antibody against ZIP12 to monitor the
localisation and potential reorganisation of ZIP12 in tissue sections. The plasma
membrane localisation predicted from sequence data was confirmed (Chapter 4) but
further characterisation of the antibodies and its distribution in disease is awaited.
This part of the project still has to overcome several obstacles as none of the
antibodies could unambiguously detect ZIP12.
The high concentration of zinc present in the extracellular matrix between the RPE
and the fenestrated choroidal capillaries called Bruch’s membrane (Lengyel et al.,
2007) gave rise to the speculation that zinc could be directly involved in
modulating the RPE and/or the choriocapillaris. To explore one possible action, we
exposed both epithelial and fenestrated endothelial cell lines to elevated
extracellular zinc and found that both responded to increased zinc. ARPE19 cells
changed their transepithelial resistance and RPE specific gene expression profile in
response to zinc treatment. However, it is likely that the changes in transepithelial
resistance are mediated by the effect of zinc on cell proliferation as assessed
through alamarBlue assay. In parallel, using immunocytochemistry and electron
microscopy we found that the presence of extracellular zinc by itself can induce
fenestrae formation. These show that if bioavailable (free or easily releasable) zinc
levels reach ~200-500 nM in Bruch’s membrane it could directly affect both of
these cell types. It has already been mentioned earlier that this concentration could

211
potentially be present in Bruch’s membrane (Lengyel et al., 2007), and an even
higher concentration might be available locally (Nan et al., 2011, Nan et al., 2008).
Based on the information above and data we obtained from literature we developed
a model for zinc regulation and deregulation at the RPE-choroid interface (Figure
7.1). This model is based on the assumption that under normal conditions zinc
(Figure 7.1 –A), derived from the RPE or the blood, can be maintained at a
concentration that is sufficient for the regulation of enzymes like matrix
metalloproteinases that play an important role in the maintenance of elasticity and
permeability of Bruch’s membrane (Hussain et al., 2011). The presence of zinc
transporters on the plasma membrane will help to maintain zinc influx into the cells
in order to create a “healthy” zinc balance. We speculate that this zinc balance will
be important for maintaining the phenotype of the surrounding cells will help to
maintain pigmentation and optimal functioning of RPE and will facilitate the
maintenance of the fenestration of the choroidal endothelium.
In diseases like AMD this balance could be altered in several ways: As AMD is
associated with systemic zinc deficiency, replenishment of zinc in Bruch’s
membrane from the circulation will be compromised. Possibly, a negative gradient
could develop triggering the removal of zinc from Bruch’s membrane. Zinc levels
in the RPE have also been shown to decrease in AMD (Tate et al., 1995, Tate et al.,
1999, Newsome et al., 1988) possibly due to decrease in pigment in parallel with
accumulation of lipofuscin (Biesemeier et al., 2010, Schraermeyer et al., 1999)
therefore replenishment from this source could also be compromised. A third factor
that could contribute to the loss of biologically active zinc in Bruch’s membrane is
its entrapment in sub-RPE deposits (Lengyel et al., 2007).
Once the bio-available zinc levels dip below functionally required levels the
reorganization of Bruch’s membrane by metalloproteinases will be altered,
potentially contributing to the thickening of Bruch’s membrane. Furthermore, the
loss of bio available zinc may trigger VEGF production in the RPE by signalling to
the RPE that fenestration requires more VEGF. Zinc deficiency in Bruch’s
membrane could directlylead to elevated VEGF levels through the lack of
regulation of VEGF expression by zinc (Golovine et al., 2008, Nardinocchi et al.,
2010) in RPE. These eventually could lead to the development of choroidal

212
neovascularisation (CNV) or so-called wet AMD. Alternatively, through its
potential direct effects on the RPE, zinc deregulation could lead to cell atrophy and
the development of dry AMD.
Zinc supplementation could therefore have several direct or indirect effects on the
RPE-choroid interface. By elevating zinc levels in the circulation (2001) zinc could
potentially reverse the zinc deficiency in Bruch’s membrane. While we do not
know whether this happens, systemic injection of radioactive zinc has been shown
to reach the RPE (Newsome et al., 1992). The most likely route for the selective
enrichment of zinc in RPE is through the bloodstream/ choroidal capillaries and
therefore Bruch’s membrane. Elevated zinc might help to bring VEGF levels under
control and help the reforming of fenestration to allow better clearance of waste
material and the availability of zinc to regulate proteases could help the clearance
process. Therefore, it is probably not surprising that zinc was able to slow the
progression to blindness in wet AMD (2001)(AREDS report number 8).
In conclusion, we have shown the expression of zinc transporters in the RPE-
choroid interface, as well as potential effects of altering extracellular zinc
concentration on cellular models of vascular endothelium and retinal pigment
epithelium. Based on our results, we have tried to model how zinc can affect the
RPE-choroid interface. While the studies require further experimentation, it is
hoped that the model and the results presented within this PhD will perhaps help
refine our current understanding and treatment strategies for AMD.

213
Figure 7-1–Schematic model of normal and diseased RPE
Schematic model of the normal RPE (A) and the diseased (AMD) RPE (B). In the
normal RPE (A), melanin, metallothionein (MT) and phagocytic activities of the
RPE are optimal. No thickening of Bruch’s membrane is observed, and fenestrated
capillaries allow material transport to occur. In diseased RPE (B), studies have
shown that there is reduced melanin (Me) and metallothionein (MT), accumulation
of lipofuscin (Lf) material, and thickening of Bruch’s membrane. In AMD, sub-
RPE deposits develop between Bruch’s membrane and the RPE. The loss of
fenestration which has been observed in AMD cases can further obstruct material
transport from occurring, leading to a vicious cycle which cumulatively results in
RPE atrophy. Figure legends: MT- metallothionein, Me – melanin, Lf – Lipofuscin,
ER – endoplasmic reticulum.

214
8. Appendices
8.1. Appendix 1 – Antibodies
Bo Bame of
Antibody
Reacting
Species
Staining Dilution Source
1 Alpha-P 63
Isomerase
Rabbit
Polyclonal
ER 1:500 ICC Kind gift from
Prof. Karl Matter
2 9.3 Golgi Rabbit
Polyclonal
Golgi 1:500 ICC Kind gift from
Prof. Karl Matter
3 ERGIC53
(Intermediate
Compartment
of Golgi)
Mouse
Monoclonal
Golgi 1:200 ICC Kind gift from
Prof. Karl Matter
4 GI50059 Mouse
Monoclonal
Lysosomes 1:50 ICC Kind gift from
Prof. Karl Matter
5 CathepsinD Rabbit
Polyclonal
Lysosomes 1:200 ICC Kind gift from
Dr. Claire Futter
6 TGN46 Sheep
Polyclonal
Lysosomes 1:300 ICC Kind gift from
Dr. Claire Futter
7 V5 Mouse
Monoclonal
V5 peptide 1:200 ICC
1:10000
WB
Invitrogen
8 ZIP12
ab64463
Rabbit
Polyclonal
ZIP12
protein
1:200 ICC
1:1000 WB
Abcam
9 ZIP12 first
bleed 5193
Rabbit
polyclonal
ZIP12
protein
1:200 ICC
1:7500 WB
BioGene Germany
10 ZIP12 first
bleed 5194
Rabbit
polyclonal
ZIP12
protein
1:200 ICC
1:7500 WB
BioGene Germany
11 ZIP12 final
bleed 5193
Rabbit
polyclonal
ZIP12
protein
1:200 ICC
1:7500 WB
BioGene Germany
12 ZIP12 final
bleed 5194
Rabbit
polyclonal
ZIP12
protein
1:200 ICC
1:7500 WB
BioGene Germany
13 Actin C2 Mouse
Monoclonal
Actin 1:500 WB Santa Cruz
Biotechnology
14 PV-1 Rat
monoclonal
PV-1
protein
1:400 Kind gift from
Prof. David Shima
15 GFP B2 Mouse
Monoclonal
GFP
protein
1:500 WB Santa Cruz
Biotechnology
16 Horseradish
Peroxidase
Goat-anti-
Mouse
HRP
protein
1:7500 WB Jackson
ImmunoResearch
17 Horseradish
Peroxidase
Goat-anti-
Rabbit
HRP
protein
1:7500 WB Jackson
ImmunoResearch
18 RhodamineP
halloidin
- Actin 1:300 ICC Invitrogen
19 Phospho-
p44/42
MAPK
Rabbit
monoclonal
Phospho
ERK1/2
1:1000 WB Cell Signalling
20 p44/42
MAPK
Rabbit
monoclonal
ERK1/2 1:1000 WB Cell Signalling
21 Phospho-Akt
(SER473)
#9271
Rabbit
monoclonal
Phospho
AKT
1:1000 WB Cell Signalling
22 Akt Antibody
#9272
Rabbit
monoclonal
AKT 1:1000 WB Cell Signalling

215
23 Phospho-
PI3K p85
(Tyr458)
/p55
(Tyr199)
Rabbit
monoclonal
Phospho
PI3K
1:1000 WB Cell Signalling
24 p38 MAPK
Antibody
#9212
Rabbit
monoclonal
P38 1:1000 WB Cell Signalling
25 Phospho-p38
MAPK
(Thr180/Tyr1
82) Antibody
#9211
Rabbit
monoclonal
Phospho
Pp38
1:1000 WB Cell signalling
26 Src 184Q20 Mouse
Monoclonal
Src 1:400 WB Invitrogen
27 SRC [Py418] Rabbit
Polyclonal
PhosphoSr
c
1:1000 WB Invitrogen
27 ZO-1 Mouse
Monoclonal
Primary
Antibody
1:400 BD Biosciences
28 FITC Goat anti
Mouse
Secondary
Antibody
1:300 ICC BD Biosciences
29 Alexa 488 Goat anti
Rat
Secondary
Antibody
1:1000 ICC Invitrogen
30 Alexa 568 Goat anti
Rabbit
Secondary
Antibody
1:1000 ICC Invitrogen
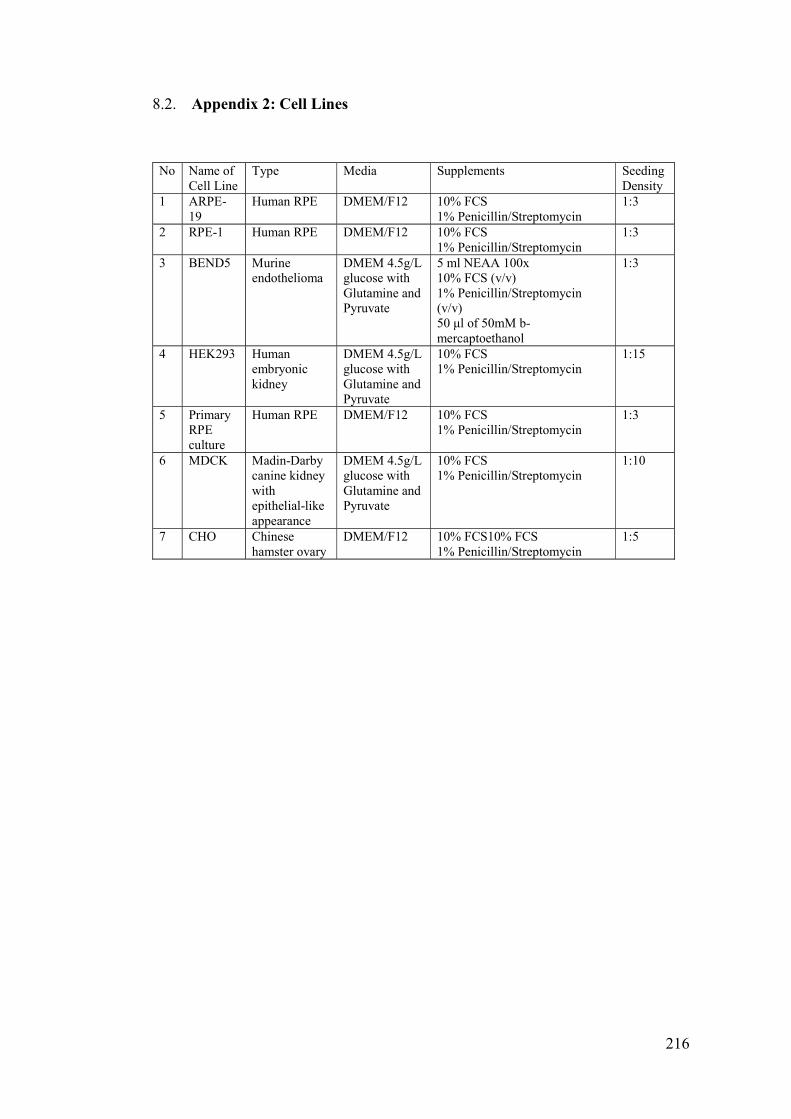
216
8.2. Appendix 2: Cell Lines
No Name of
Cell Line
Type Media Supplements Seeding
Density
1 ARPE-
19
Human RPE DMEM/F12 10% FCS
1% Penicillin/Streptomycin
1:3
2 RPE-1 Human RPE DMEM/F12 10% FCS
1% Penicillin/Streptomycin
1:3
3 BEND5 Murine
endothelioma
DMEM 4.5g/L
glucose with
Glutamine and
Pyruvate
5 ml NEAA 100x
10% FCS (v/v)
1% Penicillin/Streptomycin
(v/v)
50 µl of 50mM b-
mercaptoethanol
1:3
4 HEK293 Human
embryonic
kidney
DMEM 4.5g/L
glucose with
Glutamine and
Pyruvate
10% FCS
1% Penicillin/Streptomycin
1:15
5 Primary
RPE
culture
Human RPE DMEM/F12 10% FCS
1% Penicillin/Streptomycin
1:3
6 MDCK Madin-Darby
canine kidney
with
epithelial-like
appearance
DMEM 4.5g/L
glucose with
Glutamine and
Pyruvate
10% FCS
1% Penicillin/Streptomycin
1:10
7 CHO Chinese
hamster ovary
DMEM/F12 10% FCS10% FCS
1% Penicillin/Streptomycin
1:5

217
8.3. Appendix 3 – Primer List
8.3.1. Cloning Primers
ZIP12-attB
CTerminal
FWD GGGGACAAGTTTGTACAAAAAAGCAGGCTTCACCAT
GTGCTTCCGGACAAAGCTCTCAG
REV GGGGACCACTTTGTACAAGAAAGCTGGGTGTATTTTA
ATATTTTGCTCATATATA
ZIP12-attB
NTerminal
FWD GGGGACAAGTTTGTACAAAAAAGCAGGCTTCACCAT
GTGCTTCCGGACAAAGCTCTCAG
REV GGGGACCACTTTGTACAAGAAAGCTGGGTGTTATATT
TTAATATTTTGCTCATAT
8.3.2. Sequencing Primers
No Name Sequence
1 T7 Promoter TAATACGACTCACTATAGGG
2 V5 ACCGAGGAGAGGGTTAAGGGAT
3 M13
Forward
GTAAAACGACGGCCAG
4 M13 Reverse CAGGAAACAGCTATGAC
5 ZIP12-
FWD1
ATGTGCTTCCGGACAAAGCTC
6 ZIP12-
FWD2
CTATTACATTATTCATCAGGA
7 ZIP12-
FWD3
CAGTTCCTTGAATCGTACGAA
8 ZIP12-
FWD4
CATAGCTGTGAGGAGAACTAC
9 ZIP12-
FWD5
CATAGGAGCAGCCTTCTCATC
10 ZIP12-REV1 CCTCCAGCTATTAGTAATAGT
11
ZIP12-REV2 TTATATTTTAATATTTTGCTCATAT
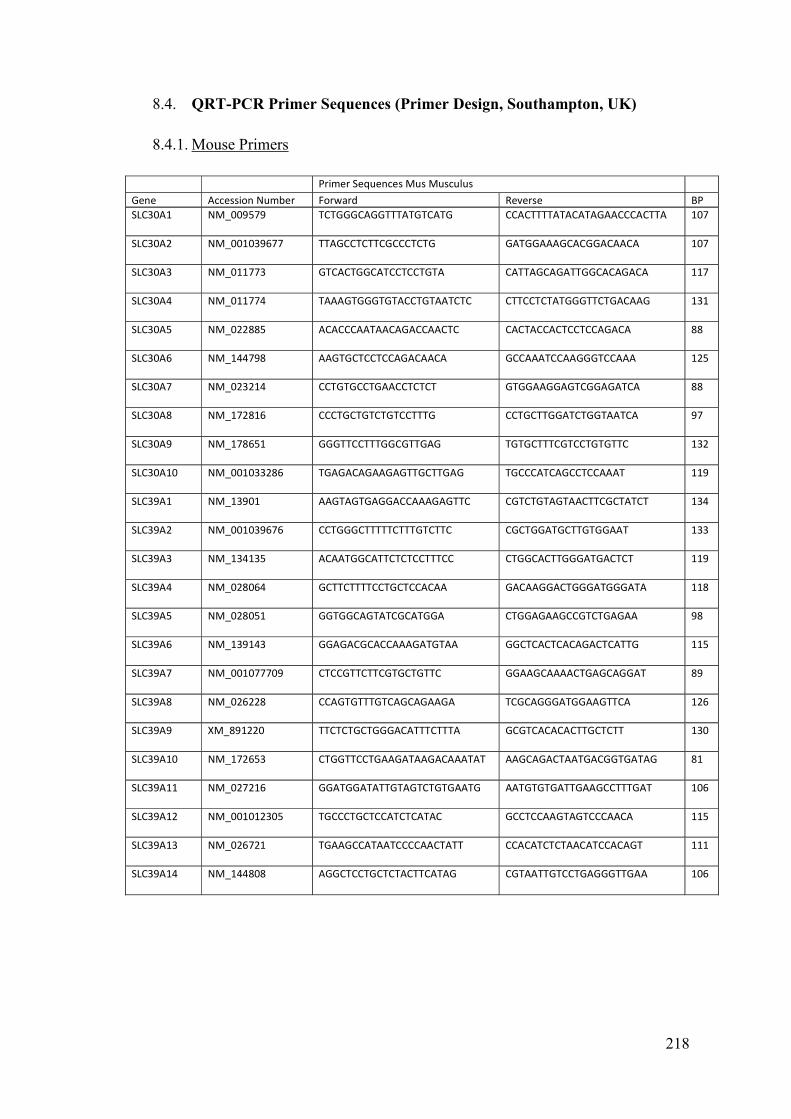
218
8.4. QRT-PCR Primer Sequences (Primer Design, Southampton, UK)
8.4.1. Mouse Primers
Primer Sequences Mus Musculus
Gene Accession Number Forward Reverse BP
SLC30A1 NM_009579 TCTGGGCAGGTTTATGTCATG
CCACTTTTATACATAGAACCCACTTA 107
SLC30A2 NM_001039677 TTAGCCTCTTCGCCCTCTG GATGGAAAGCACGGACAACA
107
SLC30A3 NM_011773 GTCACTGGCATCCTCCTGTA
CATTAGCAGATTGGCACAGACA
117
SLC30A4 NM_011774 TAAAGTGGGTGTACCTGTAATCTC
CTTCCTCTATGGGTTCTGACAAG
131
SLC30A5 NM_022885 ACACCCAATAACAGACCAACTC
CACTACCACTCCTCCAGACA
88
SLC30A6 NM_144798 AAGTGCTCCTCCAGACAACA
GCCAAATCCAAGGGTCCAAA
125
SLC30A7 NM_023214 CCTGTGCCTGAACCTCTCT
GTGGAAGGAGTCGGAGATCA
88
SLC30A8 NM_172816 CCCTGCTGTCTGTCCTTTG
CCTGCTTGGATCTGGTAATCA
97
SLC30A9 NM_178651 GGGTTCCTTTGGCGTTGAG
TGTGCTTTCGTCCTGTGTTC
132
SLC30A10 NM_001033286 TGAGACAGAAGAGTTGCTTGAG
TGCCCATCAGCCTCCAAAT
119
SLC39A1 NM_13901 AAGTAGTGAGGACCAAAGAGTTC
CGTCTGTAGTAACTTCGCTATCT
134
SLC39A2 NM_001039676 CCTGGGCTTTTTCTTTGTCTTC
CGCTGGATGCTTGTGGAAT
133
SLC39A3 NM_134135 ACAATGGCATTCTCTCCTTTCC
CTGGCACTTGGGATGACTCT
119
SLC39A4 NM_028064 GCTTCTTTTCCTGCTCCACAA
GACAAGGACTGGGATGGGATA
118
SLC39A5 NM_028051 GGTGGCAGTATCGCATGGA
CTGGAGAAGCCGTCTGAGAA
98
SLC39A6 NM_139143 GGAGACGCACCAAAGATGTAA
GGCTCACTCACAGACTCATTG
115
SLC39A7 NM_001077709 CTCCGTTCTTCGTGCTGTTC
GGAAGCAAAACTGAGCAGGAT
89
SLC39A8 NM_026228 CCAGTGTTTGTCAGCAGAAGA
TCGCAGGGATGGAAGTTCA
126
SLC39A9 XM_891220 TTCTCTGCTGGGACATTTCTTTA
GCGTCACACACTTGCTCTT
130
SLC39A10 NM_172653 CTGGTTCCTGAAGATAAGACAAATAT
AAGCAGACTAATGACGGTGATAG
81
SLC39A11 NM_027216 GGATGGATATTGTAGTCTGTGAATG
AATGTGTGATTGAAGCCTTTGAT
106
SLC39A12 NM_001012305 TGCCCTGCTCCATCTCATAC
GCCTCCAAGTAGTCCCAACA
115
SLC39A13 NM_026721 TGAAGCCATAATCCCCAACTATT
CCACATCTCTAACATCCACAGT
111
SLC39A14 NM_144808 AGGCTCCTGCTCTACTTCATAG
CGTAATTGTCCTGAGGGTTGAA
106

219
8.5. Appendix 4: PCR and DBA Sequencing Conditions
8.5.1. Cloning PCR Cycling Conditions
95’C 95’C 60’C 72’C 75’C
2’ 15” 30” 41” 2’05”
Denaturation Annealing Elongation Hold
35 Cycles
Name of Primers Product Size Optimisation
time
MgCl/MgSO4 DMSO
1 ZIP12-attBForward-CTerm
ZIP12-attBReverse-CTerm
2000 kb X =60’C
A=41”
B=2’05”
2 mM No
2 ZIP12-attBForward-NTerm
ZIP12-attBReverse-NTerm
2000 kb X =60’C
A=41”
B=2’05”
2 mM No
8.5.2. DNA Sequencing Conditions
95’C 96’C 50’C 60’C 10’C
5’ 10” 5’ 4’ ∞
25 Cycles
Bo Materials Amount
1 BigDye 3.1 0.5 µl
2 Sequencing buffer 2.5 µl
3 Sequencing Primer (100 µM) 0.5 µl
4 Plasmid DNA 3.0 µl
5 Deionised nuclease free H2O 16.5 µl
20 µl
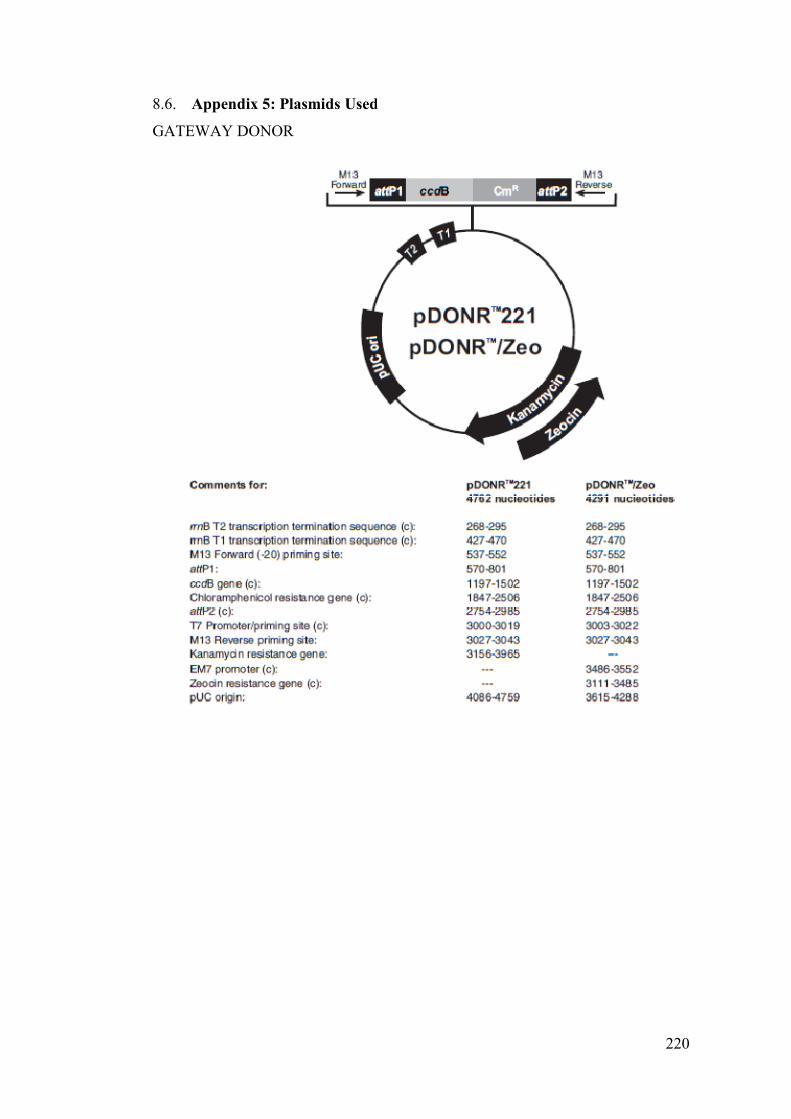
220
8.6. Appendix 5: Plasmids Used
GATEWAY DONOR

221
DESTINATION CLONES

222

223
9. References
2001. A randomized, placebo-controlled, clinical trial of high-dose supplementation
with vitamins C and E, beta carotene, and zinc for age-related macular
degeneration and vision loss: AREDS report no. 8. Archives of ophthalmology,
119, 1417-36.
ADKINS, J. N., VARNUM, S. M., AUBERRY, K. J., MOORE, R. J., ANGELL, N.
H., SMITH, R. D., SPRINGER, D. L. & POUNDS, J. G. 2002. Toward a
human blood serum proteome: analysis by multidimensional separation
coupled with mass spectrometry. Molecular & cellular proteomics : MCP, 1,
947-55.
AHMADO, A., CARR, A. J., VUGLER, A. A., SEMO, M., GIAS, C., LAWRENCE,
J. M., CHEN, L. L., CHEN, F. K., TUROWSKI, P., DA CRUZ, L. &
COFFEY, P. J. 2011a. Induction of differentiation by pyruvate and DMEM in
the human retinal pigment epithelium cell line ARPE-19. Investigative
ophthalmology & visual science, 52, 7148-59.
AIRD, W. C. 2007. Phenotypic heterogeneity of the endothelium: I. Structure,
function, and mechanisms. Circulation research, 100, 158-73.
AKAGI, T., KANEDA, M., ISHII, K. & HASHIKAWA, T. 2001. Differential
subcellular localization of zinc in the rat retina. The journal of histochemistry
and cytochemistry : official journal of the Histochemistry Society, 49, 87-96.
AMASHEH, S., MEIRI, N., SHONEBERG, T., MANKERTZ, J., SCHULZKE, J.D.
& FROMM, M. 2002. Claudin-2 expression induces cation-selective channels
in tight junctions of epithelial cells. Journal of cell science, 115, 4969-4976.
AMEMIYA, K., HARUTA, M., TAKAHASHI, M., KOSAKA, M. & EGUCHI, G.
2004. Adult human retinal pigment epithelial cells capable of differentiating
into neurons. Biochemical and biophysical research communications, 316, 1-5.
ANAND-APTE, B., PEPPER, M. S., VOEST, E., MONTESANO, R., OLSEN, B.,
MURPHY, G., APTE, S. S. & ZETTER, B. 1997. Inhibition of angiogenesis

224
by tissue inhibitor of metalloproteinase-3. Investigative ophthalmology &
visual science, 38, 817-23.
ANDERSON, A. R., KASTL, P. R. & KARCIOGLU, Z. A. 1987. Comparison of
aqueous humour and serum zinc levels in humans. The British journal of
ophthalmology, 71, 212-4.
ANDREINI, C., BANCI, L., BERTINI, I. & ROSATO, A. 2006. Counting the zinc-
proteins encoded in the human genome. Journal of proteome research, 5, 196-
201.
AYDEMIR, T. B., LIUZZI, J. P., MCCLELLAN, S. & COUSINS, R. J. 2009. Zinc
transporter ZIP8 (SLC39A8) and zinc influence IFN-gamma expression in
activated human T cells. Journal of leukocyte biology, 86, 337-48.
AYMERICH, M.S., ALBERDI, E.M., MARTINEZ, A. & BECERRA, S.P. 2001.
Evidence for pigment epithelium-derived factor receptors in the neural retina.
Investigative ophthalmology visual science, 42, 3287-3293.
BALDA, M. S. & MATTER, K. 2008. Tight junctions at a glance. Journal of cell
science, 121, 3677-82.
BALDA, M., WHITNEY, J.A., FLORES, J.A., GONZALEZ, S., CEREIJIDO, M. &
MATTER, K. 1996. Functional dissociation of paracellular permeability and
transepithelial electrical resistance and disruption of the apical-basolateral
intramembrane diffusion barrier by expression of a mutant tight junction
membrane protein. Journal of cell biology, 134, 1031-1049.
BALKOVETZ, D. 2006. Claudins at the gate: determinants of renal epithelial tight
junction. American journal of physiology and renal physiology, 290, F572-
F579.
BARASH, H., POSTON, H. A. & RUMSEY, G. L. 1982. Differentiation of soluble
proteins in cataracts caused by deficiencies of methionine, riboflavin or zinc in
diets fed to Atlantic salmon, Salmo salar, rainbow trout, Salmo gairdneri, and
lake trout, Salvelinus namaycush. The Cornell veterinarian, 72, 361-71.

225
BEATTY, S., BOULTON, M., HENSON, D., KOH, H.H. & MURRAY, I.J. 1999.
Macular pigment and age-related macular degeneration. British journal of
ophthalmology, 83, 867-877.
BEHNDIG, A., SVENSSON, B., MARKLUND, S. L. & KARLSSON, K. 1998.
Superoxide dismutase isoenzymes in the human eye. Investigative
ophthalmology & visual science, 39, 471-5.
BELLONI-OLIVI, L., MARSHALL, C., LAAL, B., ANDREWS, G. K. &
BRESSLER, J. 2009. Localization of zip1 and zip4 mRNA in the adult rat
brain. Journal of neuroscience research, 87, 3221-30.
BENTLEY, P. J. & GRUBB, B. R. 1991. Effects of a zinc-deficient diet on tissue zinc
concentrations in rabbits. Journal of animal science, 69, 4876-82.
BERMAN, M. B. & MANABE, R. 1973. Corneal collagenases: evidence for zinc
metalloenzymes. Annals of ophthalmology, 5, 1193-5 passim.
BERNSTEIN, M. H. & HOLLENBERG, M. J. 1965. Fine structure of the
choriocappillaris and retinal capillaries. Investigative ophthalmology, 4, 1016-
25.
BESECKER, B., BAO, S., BOHACOVA, B., PAPP, A., SADEE, W. & KNOELL, D.
L. 2008. The human zinc transporter SLC39A8 (Zip8) is critical in zinc-
mediated cytoprotection in lung epithelia. American journal of physiology.
Lung cellular and molecular physiology, 294, L1127-36.
BETTGER, W. J. 1993. Zinc and selenium, site-specific versus general antioxidation.
Canadian journal of physiology and pharmacology, 71, 721-4.
BHOOMA, V., SULOCHANA, K. N., BISWAS, J. & RAMAKRISHNAN, S. 1997.
Eales' disease: accumulation of reactive oxygen intermediates and lipid
peroxides and decrease of antioxidants causing inflammation,
neovascularization and retinal damage. Current eye research, 16, 91-5.
BHUTTO, I.A., UNO, K., MERGES, C., ZHANG, L., MCLEOD, S. & LUTTY, G.A.
2008. Reduction of endogeneous angiogenesis inhibitors in Bruch’s membrane

226
of the submacular region in eyes with age-related macular degeneration.
Archives ophthalmology, 126, 670-678.
BIESEMEIER, A., KREPPEL, F., KOCHANEK, S. & SCHRAERMEYER, U. 2010.
The classical pathway of melanogenesis is not essential for melanin synthesis
in the adult retinal pigment epithelium. Cell and tissue research, 339, 551-60.
BINDER, S., STANZEL, B. V., KREBS, I. & GLITTENBERG, C. 2007.
Transplantation of the RPE in AMD. Progress in retinal and eye research, 26,
516-54.
BLAAUWGEERS, H.G., HOLTKAMP, G.M., RUTTEN, H., WITMER, A.N.,
KOOLWIJK, P., PARTANEN, T.A., ALITALO, K., KROON, M.E.,
KIJLSTRA A., VAN HINSBERGH, V.W. & SCHLINGEMANN, R.O. 1999.
Polarized vascular endothelial growth factor secretion by human retinal
pigment epithelium and localization of vascular endothelial growth factor
receptors on the inner choriocapillaris. Evidence for a trophic paracrine
relation. American journal of pathology, 155, 421-428.
BLY, M. 2006. Examination of the zinc transporter gene, SLC39A12. Schizophrenia
research, 81, 321-2.
BOBILYA, D. J., GAUTHIER, N. A., KARKI, S., OLLEY, B. J. & THOMAS, W. K.
2008. Longitudinal changes in zinc transport kinetics, metallothionein and zinc
transporter expression in a blood-brain barrier model in response to a
moderately excessive zinc environment. The Journal of nutritional
biochemistry, 19, 129-37.
BODNAR, A. G., OUELLETTE, M., FROLKIS, M., HOLT, S. E., CHIU, C. P.,
MORIN, G. B., HARLEY, C. B., SHAY, J. W., LICHTSTEINER, S. &
WRIGHT, W. E. 1998. Extension of life-span by introduction of telomerase
into normal human cells. Science, 279, 349-52.
BOK, D. 1993. The retinal pigment epithelium: a versatile partner in vision. Journal of
cell science. Supplement, 17, 189-95.

227
BOOIJ, J. C., BAAS, D. C., BEISEKEEVA, J., GORGELS, T. G. & BERGEN, A. A.
2010a. The dynamic nature of Bruch's membrane. Progress in retinal and eye
research, 29, 1-18.
BOOIJ, J. C., TEN BRINK, J. B., SWAGEMAKERS, S. M., VERKERK, A. J.,
ESSING, A. H., VAN DER SPEK, P. J. & BERGEN, A. A. 2010b. A new
strategy to identify and annotate human RPE-specific gene expression. PloS
one, 5, e9341.
BOWNESS, J. M., MORTON, R. A., SHAKIR, M. H. & STUBBS, A. L. 1952.
Distribution of copper and zinc in mammalian eyes. Occurrence of metals in
melanin fractions from eye tissues. The Biochemical journal, 51, 521-30.
BOZYM, R. A., CHIMIENTI, F., GIBLIN, L. J., GROSS, G. W., KORICHNEVA, I.,
LI, Y., LIBERT, S., MARET, W., PARVIZ, M., FREDERICKSON, C. J.
&THOMPSON, R. B. 2010. Free zinc ions outside a narrow concentration
range are toxic to a variety of cells in vitro. Experimental biology and
medicine, 235, 741-50.
BOZYM, R. A., THOMPSON, R. B., STODDARD, A. K. & FIERKE, C. A. 2006.
Measuring picomolar intracellular exchangeable zinc in PC-12 cells using a
ratiometric fluorescence biosensor. ACS chemical biology, 1, 103-11.
BRAET, F. & WISSE, E. 2002. Structural and functional aspects of liver sinusoidal
endothelial cell fenestrae: a review. Comparative hepatology, 1, 1.
BRUBAN, J., GLOTIN, A., DINET, V., CHALOUR, N., SENNLAUB, F., JONET,
L., AN, N., FAUSSAT, A.M. & MASCARELLI, F. 2009. Amyloid- (1-42)
alters structure and function of retinal pigmented epithelial cells. Aging cell, 8,
162-177.
BURKE, J.M., KACZARA, P., SKUMATZ, C.M.B., ZAREBA, M., RACITI, M.W.
& SARNA, T. 2011. Dynamic analyses reveal cytoprotection by RPE
melanosomes against non-photic stress. Molecular vision, 17, 2864-2877.
BURKE, J.M., CAO, F., IRVING, P.E. & SKUMATZ, C.M.B. 1999. Expression of E-
Cadherin by human retinal pigment epithelium: delayed expression in vitro.
Investigative ophthalmology and visual science, 40, 12.

228
BURNS, M. S. & HARTZ, M. J. 1992. The retinal pigment epithelium induces
fenestration of endothelial cells in vivo. Current eye research, 11, 863-73.
BURY, N. R., CHUNG, M. J., STURM, A., WALKER, P. A. & HOGSTRAND, C.
2008. Cortisol stimulates the zinc signaling pathway and expression of
metallothioneins and ZnT1 in rainbow trout gill epithelial cells. American
journal of physiology. Regulatory, integrative and comparative physiology,
294, R623-9.
CAI, H. & DEL PRIORE, L. V. 2006. Gene expression profile of cultured adult
compared to immortalized human RPE. Molecular vision, 12, 1-14.
CAMERON, J. D. & MCCLAIN, C. J. 1986. Ocular histopathology of acrodermatitis
enteropathica. The British journal of ophthalmology, 70, 662-7.
CAO, J., BOBO, J. A., LIUZZI, J. P. & COUSINS, R. J. 2001. Effects of intracellular
zinc depletion on metallothionein and ZIP2 transporter expression and
apoptosis. Journal of leukocyte biology, 70, 559-66.
CHEN, M., MUCKERSIE, E., ROBERTSON, M., FRACZEK, M., FORRESTER, J.
V. & XU, H. 2008. Characterization of a spontaneous mouse retinal pigment
epithelial cell line B6-RPE07. Investigative ophthalmology & visual science,
49, 3699-706.
CHIMIENTI, F., DEVERGNAS, S., PATTOU, F., SCHUIT, F., GARCIA-CUENCA,
R., VANDEWALLE, B., KERR-CONTE, J., VAN LOMMEL, L.,
GRUNWALD, D., FAVIER, A. & SEVE, M. 2006. In vivo expression and
functional characterization of the zinc transporter ZnT8 in glucose-induced
insulin secretion. Journal of cell science, 119, 4199-206.
CHIMIENTI, F., FAVIER, A. & SEVE, M. 2005. ZnT-8, a pancreatic beta-cell-
specific zinc transporter. Biometals : an international journal on the role of
metal ions in biology, biochemistry, and medicine, 18, 313-7.
CHOWANADISAI, W., KELLEHER, S. L. & LONNERDAL, B. 2005. Zinc
deficiency is associated with increased brain zinc import and LIV-1 expression
and decreased ZnT-1 expression in neonatal rats. The Journal of nutrition, 135,
1002-7.
229
CLEGG, M.S., HANNA, L.A., NILES, B.J., MOMMA, T.Y., & KEEN, C.L. Zinc
deficiency-induced cell death. 2005. IUBMB LIFE, 57, 661-669.
COLVIN, R. A., HOLMES, W. R., FONTAINE, C. P. & MARET, W. 2010.
Cytosolic zinc buffering and muffling: their role in intracellular zinc
homeostasis. Metallomics : integrated biometal science, 2, 306-17.
CONSTABLE, P. A. & LAWRENSON, J. G. 2009. Glial cell factors and the outer
blood retinal barrier. Ophthalmic & physiological optics : the journal of the
British College of Ophthalmic Opticians, 29, 557-64.
COUE, M., BRENNER, S. L., SPECTOR, I. & KORN, E. D. 1987. Inhibition of actin
polymerization by latrunculin A. FEBS letters, 213, 316-8.
CRAGG, R. A., PHILLIPS, S. R., PIPER, J. M., VARMA, J. S., CAMPBELL, F. C.,
MATHERS, J. C. & FORD, D. 2005. Homeostatic regulation of zinc
transporters in the human small intestine by dietary zinc supplementation. Gut,
54, 469-78.
CUNHA-VAZ, J. 1979. The blood-ocular barriers. Survey of ophthalmology, 23, 279-
96.
DANKS, D. M. 1988. Copper deficiency in humans. Annual review of nutrition, 8,
235-57.
DAVIS, A. A., BERNSTEIN, P. S., BOK, D., TURNER, J., NACHTIGAL, M. &
HUNT, R. C. 1995. A human retinal pigment epithelial cell line that retains
epithelial characteristics after prolonged culture. Investigative ophthalmology
& visual science, 36, 955-64.
DEVERGNAS, S., CHIMIENTI, F., NAUD, N., PENNEQUIN, A., COQUEREL, Y.,
CHANTEGREL, J., FAVIER, A. & SEVE, M. 2004. Differential regulation of
zinc efflux transporters ZnT-1, ZnT-5 and ZnT-7 gene expression by zinc
levels: a real-time RT-PCR study. Biochemical pharmacology, 68, 699-709.
DEWAN, A., LIU, M., HARTMAN, S., ZHANG, S. S., LIU, D. T., ZHAO, C., TAM,
P. O., CHAN, W. M., LAM, D. S., SNYDER, M., BARNSTABLE, C., PANG,

230
C. P. & HOH, J. 2006. HTRA1 promoter polymorphism in wet age-related
macular degeneration. Science, 314, 989-92.
DI CELLO, F., SIDDHARTHAN, V., PAUL-SATYASEELA, M. & KIM, K. S. 2005.
Divergent effects of zinc depletion in brain vs non-brain endothelial cells.
Biochemical and biophysical research communications, 335, 373-6.
DUFNER-BEATTIE, J., WANG, F., KUO, Y. M., GITSCHIER, J., EIDE, D. &
ANDREWS, G. K. 2003. The acrodermatitis enteropathica gene ZIP4 encodes
a tissue-specific, zinc-regulated zinc transporter in mice. The Journal of
biological chemistry, 278, 33474-81.
DUFNER-BEATTIE, J., WEAVER, B. P., GEISER, J., BILGEN, M., LARSON, M.,
XU, W. & ANDREWS, G. K. 2007. The mouse acrodermatitis enteropathica
gene Slc39a4 (Zip4) is essential for early development and heterozygosity
causes hypersensitivity to zinc deficiency. Hum Mol Genet, 16, 1391-9.
DUNN, K. C., AOTAKI-KEEN, A. E., PUTKEY, F. R. & HJELMELAND, L. M.
1996. ARPE-19, a human retinal pigment epithelial cell line with differentiated
properties. Experimental eye research, 62, 155-69.
DUNN, K. C., MARMORSTEIN, A. D., BONILHA, V. L., RODRIGUEZ-BOULAN,
E., GIORDANO, F. & HJELMELAND, L. M. 1998. Use of the ARPE-19 cell
line as a model of RPE polarity: basolateral secretion of FGF5. Investigative
ophthalmology & visual science, 39, 2744-9.
ECKHERT, C. D. 1983. Elemental concentrations in ocular tissues of various species.
Experimental eye research, 37, 639-47.
EHSANI, S., HUO, H., SALEHZADEH, A., POCANSCHI, C. L., WATTS, J. C.,
WILLE, H., WESTAWAY, D., ROGAEVA, E., ST GEORGE-HYSLOP, P. H.
& SCHMITT-ULMS, G. 2011. Family reunion--the ZIP/prion gene family.
Progress in neurobiology, 93, 405-20.
EIDE, D. J. 2004. The SLC39 family of metal ion transporters. Pflugers Archiv :
European journal of physiology, 447, 796-800.
231
EIDE, D.J. 2006. Zinc transporters and the cellular trafficking of zinc. Biochimica et
biophysica acta, 1763, 711-72.
ERIE, J. C., GOOD, J. A., BUTZ, J. A. & PULIDO, J. S. 2009. Reduced zinc and
copper in the retinal pigment epithelium and choroid in age-related macular
degeneration. American journal of ophthalmology, 147, 276-282 e1.
ESPINOSA-HEIDMANN, D. G., SUNER, I. J., CATANUTO, P., HERNANDEZ, E.
P., MARIN-CASTANO, M. E. & COUSINS, S. W. 2006. Cigarette smoke-
related oxidants and the development of sub-RPE deposits in an experimental
animal model of dry AMD. Investigative ophthalmology & visual science, 47,
729-37.
ESSER, S., WOLBURG, K., WOLBURG, H., BREIER, G., KURZCHALIA, T. &
RISAU, W. 1998. Vascular endothelial growth factor induces endothelial
fenestrations in vitro. The Journal of cell biology, 140, 947-59.
ETIENNE-MANVILLE, S. & HALL, A. 2002. Rho-GTPases in cell biology. ature,
420, 629-635.
FABE, J. S., GRAHN, B. H. & PATERSON, P. G. 2000. Zinc concentration of
selected ocular tissues in zinc-deficient rats. Biological trace element research,
75, 43-52.
FALCON-PEREZ, J. M. & DELL'ANGELICA, E. C. 2007. Zinc transporter 2
(SLC30A2) can suppress the vesicular zinc defect of adaptor protein 3-depleted
fibroblasts by promoting zinc accumulation in lysosomes. Experimental cell
research, 313, 1473-83.
FINNEMANN, S.C., LEUNG, L.W. & RODRIGUEZ-BOULAN, E. 2002. The
lipofuscin component A2E selectively inhibits phagolysosomal degradation of
photoreceptor phospholipid by the retinal pigment epithelium. Proceedings of
the ational Academy of Sciences, 99, 3842-3847.
FLOOD, V., SMITH, W., WANG, J. J., MANZI, F., WEBB, K. & MITCHELL, P.
2002. Dietary antioxidant intake and incidence of early age-related
maculopathy: the Blue Mountains Eye Study. Ophthalmology, 109, 2272-8.

232
FRANCIS, P. J. & KLEIN, M. L. 2011. Update on the role of genetics in the onset of
age-related macular degeneration. Clinical ophthalmology, 5, 1127-33.
FUJII, Y., KACHI, S., ITO, A., KAWASUMI, T., HONDA, H. & TERASAKI, H.
2010. Transfer of gene to human retinal pigment epithelial cells using
magnetite cationic liposomes. The British journal of ophthalmology, 94, 1074-
7.
FUJISHIRO, H., OKUGAKI, S., YASUMITSU, S., ENOMOTO, S. & HIMENO, S.
2009. Involvement of DNA hypermethylation in down-regulation of the zinc
transporter ZIP8 in cadmium-resistant metallothionein-null cells. Toxicology
and applied pharmacology, 241, 195-201.
FUKADA, T., CIVIC, N., FURUICHI, T., SHIMODA, S., MISHIMA, K.,
HIGASHIYAMA, H., IDAIRA, Y., ASADA, Y., KITAMURA, H.,
YAMASAKI, S., HOJYO, S., NAKAYAMA, M., OHARA, O., KOSEKI, H.,
DOS SANTOS, H. G., BONAFE, L., HA-VINH, R., ZANKL, A., UNGER, S.,
KRAENZLIN, M. E., BECKMANN, J. S., SAITO, I., RIVOLTA, C.,
IKEGAWA, S., SUPERTI-FURGA, A. & HIRANO, T. 2008. The zinc
transporter SLC39A13/ZIP13 is required for connective tissue development; its
involvement in BMP/TGF-beta signaling pathways. PloS one, 3, e3642.
FURUSE, M., HIRASE, T., ITOH, M., NAGAFUCHI, A., YONEMURA, S.,
TSUKITA, S & TSUKITA, S. 1993. Occludin: a novel integral membrane
protein localizing at tight junctions. Journal of cell biology, 123, 1777-1788.
FURUSE, M., HATA, M., FURUSE, K., YOSHIDA, Y., HARATAKE, A.,
SUGITANI, Y. & TSUKITA, S. 2002. Claudin-based tight junctions are
crucial for the mammalian epidermal barrier: a lesson from claudin-1 deficient
mice. Journal of cell biology, 156, 1099-111.
FURUSE, M., ITOH, M., HIRASE, T., NAGAFUCHI, A., YONEMURA, S.,
TSUKITA, S. & TSUKITA, S. 1994. Direct association of occluding with ZO-
1 and its possible involvement in the localisation of occludin at tight junctions.
Journal of cell biology, 127, 1617-1626.

233
GAITHER, L. A. & EIDE, D. J. 2001. Eukaryotic zinc transporters and their
regulation. Biometals : an international journal on the role of metal ions in
biology, biochemistry, and medicine, 14, 251-70.
GALIN, M. A., NANO, H. D. & HALL, T. 1962. Ocular zinc concentration.
Investigative ophthalmology, 1, 142-8.
GASMAN, S., CHASSEROT-GOLAZ, S., POPOFF, M.R., AUNIS, D. & BADER,
M.F. 1999. Involvement of Rho GTPases in calcium-regulated exocytosis from
adrenal chromaffin cells. Journal of cell science, 112, 4763-4771.
GATON, D. D., SAGARA, T., LINDSEY, J. D. & WEINREB, R. N. 1999. Matrix
metalloproteinase-1 localization in the normal human uveoscleral outflow
pathway. Investigative ophthalmology & visual science, 40, 363-9.
GEISEN, P., MCCOLM, J. R., KING, B. M. & HARTNETT, M. E. 2006.
Characterization of barrier properties and inducible VEGF expression of
several types of retinal pigment epithelium in medium-term culture. Current
eye research, 31, 739-48.
GERMAN, O. L., BUZZI, E., ROTSTEIN, N. P., RODRIGUEZ-BOULAN, E. &
POLITI, L. E. 2008. Retinal pigment epithelial cells promote spatial
reorganization and differentiation of retina photoreceptors. Journal of
neuroscience research, 86, 3503-14.
GLEIM, S., STOJANOVIC, A., AREHART, E., BYINGTON, D. & HWA, J. 2009.
Conserved rhodopsin intradiscal structural motifs mediate stabilization: effects
of zinc. Biochemistry, 48, 1793-800.
GOLOVINE, K., UZZO, R. G., MAKHOV, P., CRISPEN, P. L., KUNKLE, D. &
KOLENKO, V. M. 2008. Depletion of intracellular zinc increases expression
of tumorigenic cytokines VEGF, IL-6 and IL-8 in prostate cancer cells via NF-
kappaB-dependent pathway. The Prostate, 68, 1443-9.
GONG, H. & AMEMIYA, T. 2001. Optic nerve changes in zinc-deficient rats.
Experimental eye research, 72, 363-9.

234
GONG, H., TAKAMI, Y., AMEMIYA, T., TOZU, M. & OHASHI, Y. 2004. Ocular
surface in Zn-deficient rats. Ophthalmic research, 36, 129-38.
GRAHAM, S. M., DALEY, H. M., BANERJEE, A., SALANIPONI, F. M. &
HARRIES, A. D. 1998. Ethambutol in tuberculosis: time to reconsider?
Archives of disease in childhood, 79, 274-8.
GRAHN, B. H., PATERSON, P. G., GOTTSCHALL-PASS, K. T. & ZHANG, Z.
2001. Zinc and the eye. Journal of the American College of utrition, 20, 106-
18.
GEORGIADIS, A., TSCHERNUTTER, M., BAINBRIDGE, J.W.B, BALAGGAN,
K.S., MOWAT, F., WEST, E.L., MUNRO, P.M.G., THRASHER, A.J.,
MATTER, K., BALDA., M. & ALI, R. 2010. The tight junction associated
signalling proteins- ZO-1 and ZONAB regulate retinal pigment epithelium
homeostasis in mice. PLOSone, 5, e15730.
GRUPE, A., LI, Y., ROWLAND, C., NOWOTNY, P., HINRICHS, A. L., SMEMO,
S., KAUWE, J. S., MAXWELL, T. J., CHERNY, S., DOIL, L., TACEY, K.,
VAN LUCHENE, R., MYERS, A., WAVRANT-DE VRIEZE, F., KALEEM,
M., HOLLINGWORTH, P., JEHU, L., FOY, C., ARCHER, N., HAMILTON,
G., HOLMANS, P., MORRIS, C. M., CATANESE, J., SNINSKY, J., WHITE,
T. J., POWELL, J., HARDY, J., O'DONOVAN, M., LOVESTONE, S.,
JONES, L., MORRIS, J. C., THAL, L., OWEN, M., WILLIAMS, J. &
GOATE, A. 2006. A scan of chromosome 10 identifies a novel locus showing
strong association with late-onset Alzheimer disease. American journal of
human genetics, 78, 78-88.
GUERINOT, M. L. 2000. The ZIP family of metal transporters. Biochimica et
biophysica acta, 1465, 190-8.
GUNDERSEN, D., ORLOWSKI, J. & RODRIGUEZ-BOULAN, E. Apical polarity of
Na,K-ATPase in retinal pigment epithelium is linked to a reversal of the
anykrin-fodrin submembrane cytoskeleton. The journal of cell biology. 5, 863-
868.

235
GURUSAMY, K. S., FAROOQUI, N., LOIZIDOU, M., DIJK, S., TAANMAN, J. W.,
WHITING, S., FARQUHARSON, M. J., FULLER, B. J. & DAVIDSON, B. R.
2011. Influence of zinc and zinc chelator on HT-29 colorectal cell line.
Biometals : an international journal on the role of metal ions in biology,
biochemistry, and medicine, 24, 143-51.
HA, K.-N., CHEN, Y., CAI, J. & STERNBERG, P., JR. 2006. Increased Glutathione
Synthesis through an ARE-Nrf2-Dependent Pathway by Zinc in the RPE:
Implication for Protection against Oxidative Stress. Invest. Ophthalmol. Vis.
Sci., 47, 2709-2715.
HAO, R., CERUTIS, D. R., BLAXALL, H. S., RODRIGUEZ-SIERRA, J. F.,
PFEIFFER, R. F. & EBADI, M. 1994. Distribution of zinc metallothionein I
mRNA in rat brain using in situ hybridization. eurochemical research, 19,
761-7.
HARRIS, W. R. & STENBACK, J. Z. 1988. The bicarbonate-dependence of zinc(II)-
transferrin binding. Journal of inorganic biochemistry, 33, 211-23.
HARTSOCK, A. & NELSON, W.J. 2008. Adherens and tight junctions: structure,
function and connections to the actin cytoskeleton. Biochemical biophysical
acta, 1778, 660-669.
HE, L., GIRIJASHANKER, K., DALTON, T.P., REED, J., LI, H., SOLEIMANI, M.,
& NEBERT D.W. 2006. ZIP8, member of the solute-carrier-39 (SLC39) metal-
transporter family: characterisation of transporter properties. Molecular
Pharmacology, 70(1), 171-180.
HENNIG, B., MEERARANI, P., TOBOREK, M. & MCCLAIN, C.J. 1999.
Antioxidant-like properties of zinc in activated endothelial cells. Journal of the
American College of utrition, 18, 152-158.
HERNANDEZ, J.M, DOMINGUEZ-ROBLES, M.C., PALMER, E., & SABORIO,
J.L. 1989. Interaction of cadmium with actin microfilaments in vitro.
Toxicology in vitro, 4, 277-284.
HIRAYAMA, Y. 1990. Histochemical localization of zinc and copper in rat ocular
tissues. Acta histochemica, 89, 107-11.

236
HO, L., VAN LEEUWEN, R., WITTEMAN, J. C., VAN DUIJN, C. M.,
UITTERLINDEN, A. G., HOFMAN, A., DE JONG, P. T., VINGERLING, J.
R. & KLAVER, C. C. 2011a. Reducing the Genetic Risk of Age-Related
Macular Degeneration With Dietary Antioxidants, Zinc, and omega-3 Fatty
Acids: The Rotterdam Study. Archives of ophthalmology, 129, 758-66.
HO, L., VAN LEEUWEN, R., WITTEMAN, J. C., VAN DUIJN, C. M.,
UITTERLINDEN, A. G., HOFMAN, A., DE JONG, P. T., VINGERLING, J.
R. & KLAVER, C. C. 2011b. Reducing the genetic risk of age-related macular
degeneration with dietary antioxidants, zinc, and omega-3 fatty acids: the
Rotterdam study. Archives of ophthalmology, 129, 758-66.
HO, J., WITKIN, A.J., LIU, J., CHEN, Y., FUJIMOTO, J.G., SCHUMAN, J.S. &
DUKER, J.S. 2011. Documentation of intraretinal retinal pigment epithelium
migration via high-speed ultrahigh resolution optical coherence tomography.
Ophthalmology. 118, 687-693.
HOFMAN, P., HOYNG, P., VANDERWERF, F., VRENSEN, G. F. &
SCHLINGEMANN, R. O. 2001. Lack of blood-brain barrier properties in
microvessels of the prelaminar optic nerve head. Investigative ophthalmology
& visual science, 42, 895-901.
HOGSTRAND, C., KILLE, P., NICHOLSON, R. I. & TAYLOR, K. M. 2009. Zinc
transporters and cancer: a potential role for ZIP7 as a hub for tyrosine kinase
activation. Trends in molecular medicine, 15, 101-11.
HOSIE, A. M., DUNNE, E. L., HARVEY, R. J. & SMART, T. G. 2003. Zinc-
mediated inhibition of GABA(A) receptors: discrete binding sites underlie
subtype specificity. ature neuroscience, 6, 362-9.
HU, J. & BOK, D. 2001. A cell culture medium that supports the differentiation of
human retinal pigment epithelium into functionally polarised monolayers.
Molecular vision, 7, 14-19.
HUANG, L., YU, Y. Y., KIRSCHKE, C. P., GERTZ, E. R. & LLOYD, K. K. 2007.
Znt7 (Slc30a7)-deficient mice display reduced body zinc status and body fat
accumulation. The Journal of biological chemistry, 282, 37053-63.

237
HUANG, Z. L., DUFNER-BEATTIE, J. & ANDREWS, G. K. 2006. Expression and
regulation of SLC39A family zinc transporters in the developing mouse
intestine. Developmental biology, 295, 571-9.
HUSSAIN, A. A., LEE, Y., ZHANG, J. J. & MARSHALL, J. 2011. Disturbed matrix
metalloproteinase activity of Bruch's membrane in age-related macular
degeneration. Investigative ophthalmology & visual science, 52, 4459-66.
IDA, H., TOBE, T., NAMBU, H., MATSUMURA, M., UYAMA, M. &
CAMPOCHIARO, P. A. 2003. RPE cells modulate subretinal
neovascularization, but do not cause regression in mice with sustained
expression of VEGF. Investigative ophthalmology & visual science, 44, 5430-
7.
IOANNIDOU, S., DEINHARDT, K., MIOTLA, J., BRADLEY, J., CHEUNG, E.,
SAMUELSSON, S., NG, Y. S. & SHIMA, D. T. 2006. An in vitro assay
reveals a role for the diaphragm protein PV-1 in endothelial fenestra
morphogenesis. Proceedings of the ational Academy of Sciences of the
United States of America, 103, 16770-5.
JACKSON, K. A., HELSTON, R. M., MCKAY, J. A., O'NEILL, E. D., MATHERS,
J. C. & FORD, D. 2007. Splice variants of the human zinc transporter ZnT5
(SLC30A5) are differentially localized and regulated by zinc through
transcription and mRNA stability. J Biol Chem, 282, 10423-31.
JAGER, R. D., MIELER, W. F. & MILLER, J. W. 2008. Age-related macular
degeneration. The ew England journal of medicine, 358, 2606-17.
JAKOBSDOTTIR, J., CONLEY, Y.P., WEEKS, D.E., MAH, T.S., FERRELL, R.E. &
GORIN. 2005. Susceptibility genes for age-related maculopathy on
chromosome 10q26. American journal of human genetics, 77, 389-407.
JANKOWSKI, M. A., URIU-HARE, J. Y., RUCKER, R. B., ROGERS, J. M. &
KEEN, C. L. 1995. Maternal zinc deficiency, but not copper deficiency or
diabetes, results in increased embryonic cell death in the rat: implications for
mechanisms underlying abnormal development. Teratology, 51, 85-93.
238
JUNG, T., BADER, N. & GRUNE, T. 2007. Lipofuscin: Formation, distribution and
metabolic consequences. Annals of the ew York academy of sciences, 1119,
91-111.
KALER, P. & PRASAD, R. 2007. Molecular cloning and functional characterization
of novel zinc transporter rZip10 (Slc39a10) involved in zinc uptake across rat
renal brush-border membrane. American journal of physiology. Renal
physiology, 292, F217-29.
KAMBE, T., GEISER, J., LAHNER, B., SALT, D. E. & ANDREWS, G. K. 2008.
Slc39a1 to 3 (subfamily II) Zip genes in mice have unique cell-specific
functions during adaptation to zinc deficiency. American journal of physiology.
Regulatory, integrative and comparative physiology, 294, R1474-81.
KAMBE, T., NARITA, H., YAMAGUCHI-IWAI, Y., HIROSE, J., AMANO, T.,
SUGIURA, N., SASAKI, R., MORI, K., IWANAGA, T. & NAGAO, M. 2002.
Cloning and characterization of a novel mammalian zinc transporter, zinc
transporter 5, abundantly expressed in pancreatic beta cells. J Biol Chem, 277,
19049-55.
KAMBE, T., YAMAGUCHI-IWAI, Y., SASAKI, R. & NAGAO, M. 2004. Overview
of mammalian zinc transporters. Cellular and molecular life sciences : CMLS,
61, 49-68.
KAMEI, M. & HOLLYFIELD, J.G. 1999. TIMP-3 in Bruch’s membrane: changes
during aging and in age-related macular degeneration. Investigative
ophthalmology visual science, 40, 2367-2375.
KANDA, A., CHEN, W., OTHMAN, M., BRANHAM, K. E., BROOKS, M.,
KHANNA, R., HE, S., LYONS, R., ABECASIS, G. R. & SWAROOP, A.
2007. A variant of mitochondrial protein LOC387715/ARMS2, not HTRA1, is
strongly associated with age-related macular degeneration. Proceedings of the
ational Academy of Sciences of the United States of America, 104, 16227-32.
KANEDA, M., ISHII, K., AKAGI, T., TATSUKAWA, T. & HASHIKAWA, T. 2005.
Endogenous zinc can be a modulator of glycinergic signaling pathway in the
rat retina. Journal of molecular histology, 36, 179-85.

239
KARCIOGLU, Z. A. 1982. Zinc in the eye. Survey of ophthalmology, 27, 114-22.
KATOH, K., KANO, Y., MASUDA, M., ONISHI, H. & FUJIWARA, K. 1998.
Isolation and contraction of the Stress Fiber. Molecular Biology of the Cell, 9,
1919-1938.
KELLEHER, S. L. & LOPEZ, V. 2008. Zinc transproter-2 (ZnT2) is associated with
mitochondria and functions as a zinc importer in mammary epithelial cells The
FASEB Journal, 22, 692.2.
KETOLA, H. G. 1979. Influence of dietary zinc on cataracts in rainbow trout (Salmo
gairdneri). The Journal of nutrition, 109, 965-9.
KIMURA, E., KOIKE, T. & SHIONOYA, M. 1997. Advances in zinc enzyme models
by small, mononuclear zinc (II) complexes. Metal sites in proteins and models,
87, 1-28.
KINDERMANN, B., DORING, F., FUCHS, D., PFAFFL, M. W. & DANIEL, H.
2005. Effects of increased cellular zinc levels on gene and protein expression
in HT-29 cells. Biometals : an international journal on the role of metal ions in
biology, biochemistry, and medicine, 18, 243-53.
KIRSCHKE, C. P. & HUANG, L. 2003. ZnT7, a novel mammalian zinc transporter,
accumulates zinc in the Golgi apparatus. The Journal of biological chemistry,
278, 4096-102.
KIRSCHKE, C. P. & HUANG, L. 2008. Expression of the ZNT (SLC30) family
members in the epithelium of the mouse prostate during sexual maturation. J
Mol Histol, 39, 359-70.
KITAMURA, H., MORIKAWA, H., KAMON, H., IGUCHI, M., HOJYO, S.,
FUKADA, T., YAMASHITA, S., KAISHO, T., AKIRA, S., MURAKAMI, M.
& HIRANO, T. 2006. Toll-like receptor-mediated regulation of zinc
homeostasis influences dendritic cell function. ature immunology, 7, 971-7.
KLEIN, R. J., ZEISS, C., CHEW, E. Y., TSAI, J. Y., SACKLER, R. S., HAYNES, C.,
HENNING, A. K., SANGIOVANNI, J. P., MANE, S. M., MAYNE, S. T.,
BRACKEN, M. B., FERRIS, F. L., OTT, J., BARNSTABLE, C. & HOH, J.

240
2005. Complement factor H polymorphism in age-related macular
degeneration. Science, 308, 385-9.
KOKKINOU, D., KASPER, H. U., BARTZ-SCHMIDT, K. U. & SCHRAERMEYER,
U. 2004. The pigmentation of human iris influences the uptake and storing of
zinc. Pigment cell research / sponsored by the European Society for Pigment
Cell Research and the International Pigment Cell Society, 17, 515-8.
KOLLURU, G.K., TAMILARASAN, K.P., GEETHA-PRIYA, S., DURGHA, N.P. &
CHATTERJEE, S. 2006. Cadmium induced endothelial dysfunction:
consequence of defective migratory pattern of endothelial cells in association
with poor nitric oxide availability under cadmium challenge. Cell biology
international, 30, 427-438.
KONERIRAJAPURAM, N. S., CORAL, K., PUNITHAM, R., SHARMA, T.,
KASINATHAN, N. & SIVARAMAKRISHNAN, R. 2004. Trace elements
iron, copper and zinc in vitreous of patients with various vitreoretinal diseases.
Indian journal of ophthalmology, 52, 145-8.
KOUMANTAKIS, E., ALEXIOU, D., GRIMANIS, A., KASKARELIS, D. &
BOUZAS, A. 1983. Zinc, cobalt and selenium concentrations in the premature
and full-term newborn eye. Ophthalmologica. Journal international
d'ophtalmologie. International journal of ophthalmology. Zeitschrift fur
Augenheilkunde, 186, 41-6.
KUNZELMANN, K., MILENKOVIC, V. M., SPITZNER, M., SORIA, R. B. &
SCHREIBER, R. 2007. Calcium-dependent chloride conductance in epithelia:
is there a contribution by Bestrophin? Pflugers Archiv : European journal of
physiology, 454, 879-89.
LANGMADE, S. J., RAVINDRA, R., DANIELS, P. J. & ANDREWS, G. K. 2000.
The transcription factor MTF-1 mediates metal regulation of the mouse ZnT1
gene. The Journal of biological chemistry, 275, 34803-9.
LENGYEL, I., FLINN, J. M., PETO, T., LINKOUS, D. H., CANO, K., BIRD, A. C.,
LANZIROTTI, A., FREDERICKSON, C. J. & VAN KUIJK, F. J. 2007. High

241
concentration of zinc in sub-retinal pigment epithelial deposits. Experimental
eye research, 84, 772-80.
LENGYEL, I., TUFAIL, A., HOSAINI, H. A., LUTHERT, P., BIRD, A. C. &
JEFFERY, G. 2004. Association of drusen deposition with choroidal
intercapillary pillars in the aging human eye. Investigative ophthalmology &
visual science, 45, 2886-92.
LESBURG, C.A., AND CHRISTIANSON, D.W. 1995. X-ray crystallographic studies
of engineered hydrogen bond networks in a protein-zinc binding site. The
Journal of American Chemistry Society, 117, 6838-6844.
LEUNG, K. W., LIU, M., XU, X., SEILER, M. J., BARNSTABLE, C. J. &
TOMBRAN-TINK, J. 2008. Expression of ZnT and ZIP zinc transporters in
the human RPE and their regulation by neurotrophic factors. Investigative
ophthalmology & visual science, 49, 1221-31.
LEURE-DUPREE, A. E. 1986. Vascularization of the rat cornea after prolonged zinc
deficiency. The Anatomical record, 216, 27-32.
LIN, Y.F., LIANG, H.M., YANG, S.Y., BOCH, A., CLEMENS, S., CHEN, C.C.,
WU, J.F., HUANG, J.L., & YEH, K.C. 2009. Arabidopsis IRT3 is a zinc-
regulated and plasma membrane localized zinc/iron transporter. ew
Phytologist, 2, 392-404.
LIU, L.B., XUE, Y.X., LIU, Y.H. & WANG, Y.B. 2008. Bradykinin increases blood-
tumor barrier permeability by down-regulating the expression levels of ZO-1,
occludin and claudin-5 and rearranging actin cytoskeleton. Journal of
neuroscience research. 5, 1153-1168.
LIUZZI, J. P., BLANCHARD, R. K. & COUSINS, R. J. 2001a. Differential regulation
of zinc transporter 1, 2, and 4 mRNA expression by dietary zinc in rats. J utr,
131, 46-52.
LIUZZI, J. P. & COUSINS, R. J. 2004a. Mammalian zinc transporters. Annu Rev
utr, 24, 151-72.

242
LIUZZI, J. P., LICHTEN, L. A., RIVERA, S., BLANCHARD, R. K., AYDEMIR, T.
B., KNUTSON, M. D., GANZ, T. & COUSINS, R. J. 2005. Interleukin-6
regulates the zinc transporter Zip14 in liver and contributes to the
hypozincemia of the acute-phase response. Proceedings of the ational
Academy of Sciences of the United States of America, 102, 6843-8.
LOOMANS, H. J., HAHN, B. L., LI, Q. Q., PHADNIS, S. H. & SOHNLE, P. G.
1998. Histidine-based zinc-binding sequences and the antimicrobial activity of
calprotectin. The Journal of infectious diseases, 177, 812-4.
LOPEZ, V. & KELLEHER, S. L. 2009. Zinc transporter-2 (ZnT2) variants are
localized to distinct subcellular compartments and functionally transport zinc.
The Biochemical journal, 422, 43-52.
LUTTY, G. A., HASEGAWA, T., BABA, T., GREBE, R., BHUTTO, I. & MCLEOD,
D. S. 2010. Development of the human choriocapillaris. Eye, 24, 408-15.
LYUBARTSEVA, G., SMITH, J. L., MARKESBERY, W. R. & LOVELL, M. A.
2010. Alterations of zinc transporter proteins ZnT-1, ZnT-4 and ZnT-6 in
preclinical Alzheimer's disease brain. Brain pathology, 20, 343-50.
MAIER, J.A.M., BERNARDINI, D., RAYSSIGUIER, Y. & MAZUR, A. 2004. High
concentrations of magnesium modulate vascular endothelial cell behaviour in
vitro. Biochemical biophysical acta, 1689, 6-12.
MANCINI, M. A., FRANK, R. N., KEIRN, R. J., KENNEDY, A. & KHOURY, J. K.
1986. Does the retinal pigment epithelium polarize the choriocapillaris?
Investigative ophthalmology & visual science, 27, 336-45.
MARET, W. 2008. Metallothionein redox biology in the cytoprotective and cytotoxic
functions of zinc. Experimental gerontology, 43, 363-9.
MARET, W. & LI, Y. 2009. Coordination dynamics of zinc in proteins. Chemical
reviews, 109, 4682-707.
MARTIN, T.A. & GIANG, W.G. 2009. Loss of tight junction barrier and its role in
cancer metastasis. Biochimica et biophysica acta. 1788, 872-891.

243
MATSUURA, W., YAMAZAKI, T., YAMAGUCHI-IWAI, Y., MASUDA, S.,
NAGAO, M., ANDREWS, G. K. & KAMBE, T. 2009. SLC39A9 (ZIP9)
regulates zinc homeostasis in the secretory pathway: characterization of the
ZIP subfamily I protein in vertebrate cells. Bioscience, biotechnology, and
biochemistry, 73, 1142-8.
MCBEAN, L. D., DOVE, J. T., HALSTED, J. A. & SMITH, J. C., JR. 1972. Zinc
concentration in human tissues. The American journal of clinical nutrition, 25,
672-6.
MCCLAIN, C. J., ANTONOW, D. R., COHEN, D. A. & SHEDLOFSKY, S. I. 1986.
Zinc metabolism in alcoholic liver disease. Alcoholism, clinical and
experimental research, 10, 582-9.
MCLEOD, D. S., GREBE, R., BHUTTO, I., MERGES, C., BABA, T. & LUTTY, G.
A. 2009. Relationship between RPE and choriocapillaris in age-related macular
degeneration. Investigative ophthalmology & visual science, 50, 4982-91.
MICELI, M. V., TATE, D. J., JR., ALCOCK, N. W. & NEWSOME, D. A. 1999. Zinc
deficiency and oxidative stress in the retina of pigmented rats. Investigative
ophthalmology & visual science, 40, 1238-44.
MILON, B., DHERMY, D., POUNTNEY, D., BOURGEOIS, M. & BEAUMONT, C.
2001. Differential subcellular localization of hZip1 in adherent and non-
adherent cells. FEBS letters, 507, 241-6.
MITCHELL, P., SMITH, W., ATTEBO, K. & WANG, J. J. 1995. Prevalence of age-
related maculopathy in Australia. The Blue Mountains Eye Study.
Ophthalmology, 102, 1450-60.
MOISEYEV, G., TAKAHASHI, Y., CHEN, Y., GENTLEMAN, S., REDMOND, T.
M., CROUCH, R. K. & MA, J. X. 2006. RPE65 is an iron(II)-dependent
isomerohydrolase in the retinoid visual cycle. The Journal of biological
chemistry, 281, 2835-40.
MORI, K., DUH, E., GEHLBACH, P., ANDO, A., TAKAHASHI, K., PEARLMAN,
J., YANG, H. S., ZACK, D. J., ETTYREDDY, D., BROUGH, D. E., WEI, L.
L. & CAMPOCHIARO, P. A. 2001. Pigment epithelium-derived factor inhibits

244
retinal and choroidal neovascularization. Journal of cellular physiology, 188,
253-63.
MORIARTY-CRAIGE, S. E., HA, K. N., STERNBERG, P., JR., LYNN, M.,
BRESSLER, S., GENSLER, G. & JONES, D. P. 2007. Effects of long-term
zinc supplementation on plasma thiol metabolites and redox status in patients
with age-related macular degeneration. American journal of ophthalmology,
143, 206-211.
MUGA, S. J. & GRIDER, A. 1999. Partial characterization of a human zinc-
deficiency syndrome by differential display. Biological trace element research,
68, 1-12.
MULLINS, R. F., JOHNSON, M. N., FAIDLEY, E. A., SKEIE, J. M. & HUANG, J.
2011. Choriocapillaris vascular dropout related to density of drusen in human
eyes with early age-related macular degeneration. Investigative ophthalmology
& visual science, 52, 1606-12.
MURAKAMI, M. & HIRANO, T. 2008. Intracellular zinc homeostasis and zinc
signaling. Cancer science, 99, 1515-22.
MURGIA, C., VESPIGNANI, I., CERASE, J., NOBILI, F. & PEROZZI, G. 1999.
Cloning, expression, and vesicular localization of zinc transporter Dri 27/ZnT4
in intestinal tissue and cells. The American journal of physiology, 277, G1231-
9.
MURGIA, C., VESPIGNANI, I., RAMI, R. & PEROZZI, G. 2006. The Znt4 mutation
inlethal milk mice affects intestinal zinc homeostasis through the expression of
other Zn transporters. Genes & nutrition, 1, 61-70.
NABI, I. R., MATHEWS, A. P., COHEN-GOULD, L., GUNDERSEN, D. &
RODRIGUEZ-BOULAN, E. 1993. Immortalization of polarized rat retinal
pigment epithelium. Journal of cell science, 104 ( Pt 1), 37-49.
NAN, R., FARABELLA, I., SCHUMACHER, F. F., MILLER, A., GOR, J.,
MARTIN, A. C., JONES, D. T., LENGYEL, I. & PERKINS, S. J. 2011. Zinc
binding to the Tyr402 and His402 allotypes of complement factor H: possible

245
implications for age-related macular degeneration. Journal of molecular
biology, 408, 714-35.
NAN, R., GOR, J., LENGYEL, I. & PERKINS, S. J. 2008. Uncontrolled zinc- and
copper-induced oligomerisation of the human complement regulator factor H
and its possible implications for function and disease. Journal of molecular
biology, 384, 1341-52.
NARDINOCCHI, L., PANTISANO, V., PUCA, R., PORRU, M., AIELLO, A.,
GRASSELLI, A., LEONETTI, C., SAFRAN, M., RECHAVI, G., GIVOL, D.,
FARSETTI, A. & D'ORAZI, G. 2010. Zinc downregulates HIF-1alpha and
inhibits its activity in tumor cells in vitro and in vivo. PloS one, 5, e15048.
NEWSOME, D. A., OLIVER, P. D., DEUPREE, D. M., MICELI, M. V. &
DIAMOND, J. G. 1992. Zinc uptake by primate retinal pigment epithelium and
choroid. Current eye research, 11, 213-7.
NEWSOME, D. A., SWARTZ, M., LEONE, N. C., ELSTON, R. C. & MILLER, E.
1988. Oral zinc in macular degeneration. Archives of ophthalmology, 106, 192-
8.
NIESSEN, C.M. 2007. Tight junctions/ adherens junctions: basic structure and
function. Journal of investigative dermatology. 127, 2525-2532.
NISHIMURA, M. & NAITO, S. 2008. Tissue-specific mRNA expression profiles of
human solute carrier transporter superfamilies. Drug metabolism and
pharmacokinetics, 23, 22-44.
NOBES, C.D. & HALL, A. 1995. Rho, rac, and cdc42 GTPases regulate the assembly
of multimolecular focal complexes associated with actin stress fibers,
lamellipodia and filopodia. Cell, 81, 53-62
NOURMOHAMMADI, I., MODARRESS, M. & PAKDEL, F. 2006. Assessment of
aqueous humor zinc status in human age-related cataract. Annals of nutrition &
metabolism, 50, 51-3.
NOWAK, J.Z. 2006. Age-related macular degeneration (AMD): Pathogenesis and
Therapy. Pharmacological reports. 58, 353-363.

246
OGATA, N., WADA, M., OTSUJI, T., JO, N., TOMBRAN-TINK, J. &
MATSUMURA, M. 1999. Expression of pigment epithelium-derived factor in
normal adult rat eye and experimental choroidal neovascularisation.
Investigative ophthalmology visual science, 43, 1168-1175.
PALMITER, R. D., COLE, T. B., QUAIFE, C. J. & FINDLEY, S. D. 1996. ZnT-3, a
putative transporter of zinc into synaptic vesicles. Proc atl Acad Sci U S A,
93, 14934-9.
PALMITER, R. D. & FINDLEY, S. D. 1995. Cloning and functional characterization
of a mammalian zinc transporter that confers resistance to zinc. The EMBO
journal, 14, 639-49.
PALMITER, R. D. & HUANG, L. 2004. Efflux and compartmentalization of zinc by
members of the SLC30 family of solute carriers. Pflugers Archiv : European
journal of physiology, 447, 744-51.
PARK, K., JIN, J., HU, Y., ZHOU, K. & MA, J. X. 2011. Overexpression of pigment
epithelium-derived factor inhibits retinal inflammation and neovascularization.
The American journal of pathology, 178, 688-98.
PEDELACQ, J. D., CABANTOUS, S., TRAN, T., TERWILLIGER, T. C. &
WALDO, G. S. 2006. Engineering and characterization of a superfolder green
fluorescent protein. ature biotechnology, 24, 79-88.
PRASAD, A. S. 1998. Zinc and immunity. Mol Cell Biochem, 188, 63-9.
PRASAD, A. S. 2008. Zinc in human health: effect of zinc on immune cells.
Molecular medicine, 14, 353-7.
PRASAD, A. S., MIALE, A., JR., FARID, Z., SANDSTEAD, H. H. & SCHULERT,
A. R. 1963. Zinc metabolism in patients with the syndrome of iron deficiency
anemia, hepatosplenomegaly, dwarfism, and hypognadism. The Journal of
laboratory and clinical medicine, 61, 537-49.
PREBEN-MORTH, PEDERSEN, B.P., TOUSTRUP-JENSEN, M.S., SORENSEN,
T.L.M., PETERSEN, J., ANDERSEN, J.P., VILSEN, B. & NISSEN, P. 2007.
Crystal structure of the sodium-potassium pump. ature, 450, 1043-1049.

247
PREDESCU, D., HORVAT, R., PREDESCU, S. & PALADE, G. E. 1994.
Transcytosis in the continuous endothelium of the myocardial microvasculature
is inhibited by N-ethylmaleimide. Proceedings of the ational Academy of
Sciences of the United States of America, 91, 3014-8.
RACZ, P., KOVACS, B., VARGA, L., UJLAKI, E., ZOMBAI, E. & KARBUCZKY,
S. 1979. Bilateral cataract in acrodermatitis enteropathica. Journal of pediatric
ophthalmology and strabismus, 16, 180-2.
RAJASEKARAN, S.A., HU, J., GOPAL, J., GALLEMORE, R., RYAZANTSEV, S.,
BOK, D. & RAJASEKARAN, A.K. 2003. Na,K-ATPase inhibition alters tight
junction structure and permeability in human retinal pigment epithelial cells.
The American journal of physiology and cell physiology. 284, C1497-C1507.
RAJASEKARAN, S.A., PALMER, L.G., MOON, S.Y., SOLER, A.P., HARPER, J.F.,
ZHENG, Y. & APODACA, G.L. 2001. Na,K-ATPase Activity Is Required for
Formation of Tight Junctions, Desmosomes, and Induction of Polarity in
Epithelial Cells. Molecular biology of the cell, 12, 3717-3732.
RATTNER, A. & NATHANS, J. 2006. Macular degeneration: recent advances and
therapeutic opportunities. ature reviews. euroscience, 7, 860-72.
REAUME, A. G., ELLIOTT, J. L., HOFFMAN, E. K., KOWALL, N. W.,
FERRANTE, R. J., SIWEK, D. F., WILCOX, H. M., FLOOD, D. G., BEAL,
M. F., BROWN, R. H., JR., SCOTT, R. W. & SNIDER, W. D. 1996. Motor
neurons in Cu/Zn superoxide dismutase-deficient mice develop normally but
exhibit enhanced cell death after axonal injury. ature genetics, 13, 43-7.
REDENTI, S. & CHAPPELL, R. L. 2003. Zinc chelation enhances the sensitivity of
the ERG b-wave in dark-adapted skate retina. The Biological bulletin, 205,
213-4.
REDENTI, S. & CHAPPELL, R. L. 2004a. Localization of zinc transporter-3 (ZnT-3)
in mouse retina. Vision Res, 44, 3317-21.
REDENTI, S. & CHAPPELL, R. L. 2005. Neuroimaging of zinc released by
depolarization of rat retinal cells. Vision research, 45, 3520-5.

248
REMINGTON, Lee Ann. Clinical Anatomy of the Visual System. Newton,
Massachusetts: Butterworth-Heinemann, 1998.
REYES, J. G. 1996. Zinc transport in mammalian cells. The American journal of
physiology, 270, C401-10.
REZAEI, K. A., CHEN, Y., CAI, J. & STERNBERG, P. 2008a. Modulation of Nrf2-
dependent antioxidant functions in the RPE by Zip2, a zinc transporter protein.
Investigative ophthalmology & visual science, 49, 1665-70.
RICHARD, M. J., GUIRAUD, P., LECCIA, M. T., BEANI, J. C. & FAVIER, A.
1993. Effect of zinc supplementation on resistance of cultured human skin
fibroblasts toward oxidant stress. Biological trace element research, 37, 187-
99.
RICHARDSON, N. L., HIGGS, D. A., BEAMES, R. M. & MCBRIDE, J. R. 1985.
Influence of dietary calcium, phosphorus, zinc and sodium phytate level on
cataract incidence, growth and histopathology in juvenile chinook salmon
(Oncorhynchus tshawytscha). The Journal of nutrition, 115, 553-67.
RINK, LOTHAR. Zinc in Human Health. Amsterdam, Netherlands: IOS Press, 2011.
ROBERTS, W. G. & PALADE, G. E. 1995. Increased microvascular permeability and
endothelial fenestration induced by vascular endothelial growth factor. Journal
of cell science, 108 ( Pt 6), 2369-79.
ROBINSON, N.J. 2007. A more discerning zinc exporter. ature chemical biology, 3,
692-693.
ROGERS, J. M. & HURLEY, L. S. 1987. Effects of zinc deficiency on morphogenesis
of the fetal rat eye. Development, 99, 231-8.
ROHRER, B., GOLETZ, P., ZNOIKO, S., ABLONCZY, Z., MA, J. X., REDMOND,
T. M. & CROUCH, R. K. 2003. Correlation of regenerable opsin with rod
ERG signal in Rpe65-/- mice during development and aging. Investigative
ophthalmology & visual science, 44, 310-5.

249
ROSENSTEIN, F. J. & CHAPPELL, R. L. 2003. Endogenous zinc as a retinal
neuromodulator: evidence from the skate (Raja erinacea). euroscience letters,
345, 81-4.
ROWE, D. J. & BOBILYA, D. J. 2000. Albumin facilitates zinc acquisition by
endothelial cells. Proceedings of the Society for Experimental Biology and
Medicine. Society for Experimental Biology and Medicine, 224, 178-86.
SAINT-GENIEZ, M., KURIHARA, T. & D'AMORE, P. A. 2009a. Role of cell and
matrix-bound VEGF isoforms in lens development. Investigative
ophthalmology & visual science, 50, 311-21.
SAINT-GENIEZ, M., KURIHARA, T., SEKIYAMA, E., MALDONADO, A. E. &
D'AMORE, P. A. 2009b. An essential role for RPE-derived soluble VEGF in
the maintenance of the choriocapillaris. Proceedings of the ational Academy
of Sciences of the United States of America, 106, 18751-6.
SATCHELL, S. C. & BRAET, F. 2009. Glomerular endothelial cell fenestrations: an
integral component of the glomerular filtration barrier. American journal of
physiology. Renal physiology, 296, F947-56.
SCHMITTGEN, T. D. & LIVAK, K. J. 2008. Analyzing real-time PCR data by the
comparative C(T) method. ature protocols, 3, 1101-8.
SCHNITZER, J. E. 1992. gp60 is an albumin-binding glycoprotein expressed by
continuous endothelium involved in albumin transcytosis. The American
journal of physiology, 262, H246-54.
SCHRAERMEYER, U., PETERS, S., THUMANN, G., KOCIOK, N. & HEIMANN,
K. 1999. Melanin granules of retinal pigment epithelium are connected with
the lysosomal degradation pathway. Experimental eye research, 68, 237-45.
SCHUPP, C., OLANO-MARTIN, E., GERTH, C., MORRISSEY, B.M., CROSS,
C.E.& WERNE, J.S. 2004. Lutein, zeaxanthin, macular pigment, and visual
function in adult cystic fibrosis patients. American journal of clinical nutrition,
79, 1045-1052.

250
SEDDON, J. M. 2007. Multivitamin-multimineral supplements and eye disease: age-
related macular degeneration and cataract. The American journal of clinical
nutrition, 85, 304S-307S.
SEKLER, I., SENSI, S. L., HERSHFINKEL, M. & SILVERMAN, W. F. 2007.
Mechanism and regulation of cellular zinc transport. Molecular medicine, 13,
337-43.
SENSI, S. L., YIN, H. Z. & WEISS, J. H. 2000. AMPA/kainate receptor-triggered
Zn2+ entry into cortical neurons induces mitochondrial Zn2+ uptake and
persistent mitochondrial dysfunction. The European journal of neuroscience,
12, 3813-8.
SEVE, M., CHIMIENTI, F., DEVERGNAS, S. & FAVIER, A. 2004. In silico
identification and expression of SLC30 family genes: an expressed sequence
tag data mining strategy for the characterization of zinc transporters' tissue
expression. BMC genomics, 5, 32.
SHUE, E. H., CARSON-WALTER, E. B., LIU, Y., WINANS, B. N., ALI, Z. S.,
CHEN, J. & WALTER, K. A. 2008. Plasmalemmal vesicle associated protein-
1 (PV-1) is a marker of blood-brain barrier disruption in rodent models. BMC
neuroscience, 9, 29.
SIM, D. L. & CHOW, V. T. 1999. The novel human HUEL (C4orf1) gene maps to
chromosome 4p12-p13 and encodes a nuclear protein containing the nuclear
receptor interaction motif. Genomics, 59, 224-33.
SIM, D. L., YEO, W. M. & CHOW, V. T. 2002. The novel human HUEL (C4orf1)
protein shares homology with the DNA-binding domain of the XPA DNA
repair protein and displays nuclear translocation in a cell cycle-dependent
manner. The international journal of biochemistry & cell biology, 34, 487-504.
SONDERGAARD, L. G., BROCK, B., STOLTENBERG, M., FLYVBJERG, A.,
SCHMITZ, O., SMIDT, K., DANSCHER, G. & RUNGBY, J. 2005. Zinc
fluxes during acute and chronic exposure of INS-1E cells to increasing glucose
levels. Hormone and metabolic research = Hormon- und
Stoffwechselforschung = Hormones et metabolisme, 37, 133-9.

251
SONODA, S., SREEKUMAR, P.G., KASE, S., SPEE, C., RYAN, S.J, KANNAN, R.
& HINTON D.R. 2010. Attainment of polarity promotes growth factor
secretion by retinal pigment epithelial cells: Relevance to age‐related macular
degeneration. 2003. The journal of cell biology. 3, 423-432.
SONODA, S., SPEE, C., BARRON, E., RYAN, S. J., KANNAN, R. & HINTON, D.
R. 2009. A protocol for the culture and differentiation of highly polarized
human retinal pigment epithelial cells. ature protocols, 4, 662-73.
SOTIRIOU, C., WIRAPATI, P., LOI, S., HARRIS, A., FOX, S., SMEDS, J.,
NORDGREN, H., FARMER, P., PRAZ, V., HAIBE-KAINS, B., DESMEDT,
C., LARSIMONT, D., CARDOSO, F., PETERSE, H., NUYTEN, D., BUYSE,
M., VAN DE VIJVER, M. J., BERGH, J., PICCART, M. & DELORENZI, M.
2006. Gene expression profiling in breast cancer: understanding the molecular
basis of histologic grade to improve prognosis. Journal of the ational Cancer
Institute, 98, 262-72.
SPARROW, J.R., BEN-SHABAT, S., VOLLMER, H., ITAGAKI, Y. &
NAKANISHI, K. 2002. Involvement of oxidative mechanisms in blue-light
induced damage to AE2-laden RPE. Investigative ophthalmology visual
science, 43, 1222-1227.
STAN, R. V. 2004. Multiple PV1 dimers reside in the same stomatal or fenestral
diaphragm. American journal of physiology. Heart and circulatory physiology,
286, H1347-53.
STAN, R. V. 2007. Endothelial stomatal and fenestral diaphragms in normal vessels
and angiogenesis. Journal of cellular and molecular medicine, 11, 621-43.
STAN, R. V., ARDEN, K. C. & PALADE, G. E. 2001. cDNA and protein sequence,
genomic organization, and analysis of cis regulatory elements of mouse and
human PLVAP genes. Genomics, 72, 304-13.
STAN, R. V., KUBITZA, M. & PALADE, G. E. 1999. PV-1 is a component of the
fenestral and stomatal diaphragms in fenestrated endothelia. Proceedings of the
ational Academy of Sciences of the United States of America, 96, 13203-7.
STONE, E. M. 2007. Macular degeneration. Annual review of medicine, 58, 477-90.
252
STRAUSS, O. 2005. The retinal pigment epithelium in visual function. Physiological
reviews, 85, 845-81.
STRICKLAND, L. A., JUBB, A. M., HONGO, J. A., ZHONG, F., BURWICK, J.,
FU, L., FRANTZ, G. D. & KOEPPEN, H. 2005. Plasmalemmal vesicle-
associated protein (PLVAP) is expressed by tumour endothelium and is
upregulated by vascular endothelial growth factor-A (VEGF). The Journal of
pathology, 206, 466-75.
STRZELECKA-GOLASZEWSKA, H., PROCHNIEWICZ, E. & DRABIKOWSKI,
W. 1978. Interaction of actin with divalent cations. 2. Characterization of
protein-metal complexes. European journal of biochemistry / FEBS, 88, 229-
37.
SUMITA, R. 1961. The fine structure of Bruch’s Membrane of the Human Choroid as
Revealed by Electron Microscopy. The Journal of Electron Microscopy
(Tokyo), 10(2), 111-118.
SWAROOP, A., CHEW, E.Y. & ABECASIS, A. 2009. Unraveling a multifactorial
late onset disease: From genetic susceptibility to disease mechanisms for age-
related macular degeneration. Annual Reviews Genomics: Human Genetics, 10,
19-43.
TAKAHASHI, H., AKIBA, K., NOGUCHI, T., OHMURA, T., TAKAHASHI, R.,
EZURE, Y., OHARA, K. & ZIESKE, J. D. 2000. Matrix metalloproteinase
activity is enhanced during corneal wound repair in high glucose condition.
Current eye research, 21, 608-15.
TAM, S. W., WILBER, K. E. & WAGNER, F. W. 1976. Light sensitive zinc content
of protein fractions from bovine rod outer segments. Biochemical and
biophysical research communications, 72, 302-9.
TAMIYA, S., LIU, L.H. & KAPLAN, H.J. 2009. Epithelial-mesenchymal transition
and proliferation of retinal pigment epithelial cells initiated upon loss of cell-
cell contact. Investigative ophthalmology visual science. 51, 52755-52763.

253
TATE, D. J., JR., MICELI, M. V. & NEWSOME, D. A. 1997. Zinc induces catalase
expression in cultured fetal human retinal pigment epithelial cells. Current eye
research, 16, 1017-23.
TATE, D. J., JR., MICELI, M. V. & NEWSOME, D. A. 1999. Zinc protects against
oxidative damage in cultured human retinal pigment epithelial cells. Free
radical biology & medicine, 26, 704-13.
TATE, D. J., MICELI, M. V., NEWSOME, D. A., ALCOCK, N. W. & OLIVER, P.
D. 1995. Influence of zinc on selected cellular functions of cultured human
retinal pigment epithelium. Current eye research, 14, 897-903.
TAYLOR, K. M. 2000. LIV-1 breast cancer protein belongs to new family of
histidine-rich membrane proteins with potential to control intracellular Zn2+
homeostasis. IUBMB life, 49, 249-53.
TAYLOR, K. M., MORGAN, H. E., JOHNSON, A., HADLEY, L. J. &
NICHOLSON, R. I. 2003. Structure-function analysis of LIV-1, the breast
cancer-associated protein that belongs to a new subfamily of zinc transporters.
The Biochemical journal, 375, 51-9.
TAYLOR, K. M., MORGAN, H. E., SMART, K., ZAHARI, N. M., PUMFORD, S.,
ELLIS, I. O., ROBERTSON, J. F. & NICHOLSON, R. I. 2007. The emerging
role of the LIV-1 subfamily of zinc transporters in breast cancer. Molecular
medicine, 13, 396-406.
TAYLOR, K. M. & NICHOLSON, R. I. 2003. The LZT proteins; the LIV-1 subfamily
of zinc transporters. Biochimica et biophysica acta, 1611, 16-30.
TAYLOR, K. M., VICHOVA, P., JORDAN, N., HISCOX, S., HENDLEY, R. &
NICHOLSON, R. I. 2008. ZIP7-mediated intracellular zinc transport
contributes to aberrant growth factor signaling in antihormone-resistant breast
cancer Cells. Endocrinology, 149, 4912-20.
THOMPSON, D. A., GYURUS, P., FLEISCHER, L. L., BINGHAM, E. L.,
MCHENRY, C. L., APFELSTEDT-SYLLA, E., ZRENNER, E., LORENZ, B.,
RICHARDS, J. E., JACOBSON, S. G., SIEVING, P. A. & GAL, A. 2000.

254
Genetics and phenotypes of RPE65 mutations in inherited retinal degeneration.
Investigative ophthalmology & visual science, 41, 4293-9.
THORNTON, J. K., TAYLOR, K. M., FORD, D. & VALENTINE, R. A. 2011.
Differential subcellular localization of the splice variants of the zinc transporter
ZnT5 is dictated by the different C-terminal regions. PloS one, 6, e23878.
TOMAT, A. L., WEISSTAUB, A. R., JAUREGUI, A., PINEIRO, A.,
BALASZCZUK, A. M., COSTA, M. A. & ARRANZ, C. T. 2005. Moderate
zinc deficiency influences arterial blood pressure and vascular nitric oxide
pathway in growing rats. Pediatric research, 58, 672-6.
TOMBRAN-TINK, J., CHADER, G.G. & JOHNSON, L.V. 1991. PEDF: a pigment
epithelium-derived factor with potent neuronal differentiative capacity.
Experimental eye research, 53, 411-414.
TOMBRAN-TINK, J. & BARNSTABLE, C.J. 2002. PEDF: a multifaceted
neurotrophic factor. ature reviews neuroscience, 4, 628-636.
TSUDA, M., IMAIZUMI, K., KATAYAMA, T., KITAGAWA, K., WANAKA, A.,
TOHYAMA, M. & TAKAGI, T. 1997. Expression of zinc transporter gene,
ZnT-1, is induced after transient forebrain ischemia in the gerbil. The Journal
of neuroscience : the official journal of the Society for euroscience, 17, 6678-
84.
TUROWSKI, P., ADAMSON, P., SATHIA, J., ZHANG, J. J., MOSS, S. E.,
AYLWARD, G. W., HAYES, M. J., KANUGA, N. & GREENWOOD, J.
2004. Basement membrane-dependent modification of phenotype and gene
expression in human retinal pigment epithelial ARPE-19 cells. Investigative
ophthalmology & visual science, 45, 2786-94.
UENO, S., TSUKAMOTO, M., HIRANO, T., KIKUCHI, K., YAMADA, M. K.,
NISHIYAMA, N., NAGANO, T., MATSUKI, N. & IKEGAYA, Y. 2002.
Mossy fiber Zn2+ spillover modulates heterosynaptic N-methyl-D-aspartate
receptor activity in hippocampal CA3 circuits. The Journal of cell biology, 158,
215-20.
255
UGARTE, M. & OSBORNE, N. N. 2001. Zinc in the retina. Progress in
neurobiology, 64, 219-49.
ULSHAFER, R. J. 1989. Zinc content in melanosomes of degenerating RPE as
measured by X-ray mapping. Progress in clinical and biological research, 314,
131-9.
ULSHAFER, R. J., ALLEN, C. B. & RUBIN, M. L. 1990. Distributions of elements
in the human retinal pigment epithelium. Archives of ophthalmology, 108, 113-
7.
UZZO, R.G., CRISPEN, P.L., GOLOVINE, K., MAKHOV, P., HORWITZ, E.M. &
KOLENKO, V.M. 2006. Diverse effects of zinc on NF-κB and AP-1
transcription factors: implications for prostate cancer progression.
Carcinogenesis, 27, 1980-1990.
VALENTINE, R. A., JACKSON, K. A., CHRISTIE, G. R., MATHERS, J. C.,
TAYLOR, P. M. & FORD, D. 2007. ZnT5 variant B is a bidirectional zinc
transporter and mediates zinc uptake in human intestinal Caco-2 cells. J Biol
Chem, 282, 14389-93.
VALLEE, B. L. & FALCHUK, K. H. 1993. The biochemical basis of zinc physiology.
Physiological reviews, 73, 79-118.
VUGLER, A., CARR, A. J., LAWRENCE, J., CHEN, L. L., BURRELL, K.,
WRIGHT, A., LUNDH, P., SEMO, M., AHMADO, A., GIAS, C., DA CRUZ,
L., MOORE, H., ANDREWS, P., WALSH, J. & COFFEY, P. 2008.
Elucidating the phenomenon of HESC-derived RPE: anatomy of cell genesis,
expansion and retinal transplantation. Experimental neurology, 214, 347-61.
WALKUP, G. K., BURDETTE, S. C., LIPPARD, S. J. & TSIEN, R. Y. 2000. A new
cell-permeable fluorescent probe for Zn2+. Journal of the American Chemical
Society, 122, 5644-5645.
WANG, B. Y., JU, X. H., FU, B. Y., ZHANG, J. & CAO, Y. X. 2005. Effects of
ethanol on liver sinusoidal endothelial cells-fenestrae of rats. Hepatobiliary &
pancreatic diseases international : HBPD IT, 4, 422-6.

256
WANG, F., DUFNER-BEATTIE, J., KIM, B. E., PETRIS, M. J., ANDREWS, G. &
EIDE, D. J. 2004a. Zinc-stimulated endocytosis controls activity of the mouse
ZIP1 and ZIP3 zinc uptake transporters. The Journal of biological chemistry,
279, 24631-9.
WANG, X., WANG, Z. Y., GAO, H. L., DANSCHER, G. & HUANG, L. 2006.
Localization of ZnT7 and zinc ions in mouse retina--immunohistochemistry
and selenium autometallography. Brain research bulletin, 71, 91-6.
WANG, X., WU, Y. & ZHOU, B. 2009a. Dietary zinc absorption is mediated by ZnT1
in Drosophila melanogaster. FASEB J, 23, 2650-61.
WANG, Z. Y., STOLTENBERG, M., JO, S. M., HUANG, L., LARSEN, A.,
DAHLSTROM, A. & DANSCHER, G. 2004b. Dynamic zinc pools in mouse
choroid plexus. euroreport, 15, 1801-4.
WEAVER, B. P., DUFNER-BEATTIE, J., KAMBE, T. & ANDREWS, G. K. 2007.
Novel zinc-responsive post-transcriptional mechanisms reciprocally regulate
expression of the mouse Slc39a4 and Slc39a5 zinc transporters (Zip4 and
Zip5). Biological chemistry, 388, 1301-12.
WENZLAU, J.M., JUHL, K., YU, L., MOUA, O., SARKAR, S.A., GOTTLIEB, P.,
REWERS, M., EISENBARTH, G.S., JENSEN, J., DAVIDSON, H.W., &
HUTTON J.C. 2007. The cation efflux transporter ZnT8 (SLC30A8) is a major
autoantigen in human type1 diabetes. Proceedings of the ational Academy of
Sciences, 43, 17040-17045.
WESTENKOW, P., PICCOLO, S. & FUHRMANN, S. 2009. Beta-catenin controls
differentiation of the retinal pigment epithelium in the mouse optic cup by
regulating Mitf and Otx2 expression. Development, 136, 2505-2510.
WILLS, N. K., KALARIYA, N., SADAGOPA RAMANUJAM, V. M., LEWIS, J. R.,
HAJI ABDOLLAHI, S., HUSAIN, A. & VAN KUIJK, F. J. 2009. Human
retinal cadmium accumulation as a factor in the etiology of age-related macular
degeneration. Experimental eye research, 89, 79-87.
WILLS, N. K., RAMANUJAM, V. M., KALARIYA, N., LEWIS, J. R. & VAN
KUIJK, F. J. 2008. Copper and zinc distribution in the human retina:

257
relationship to cadmium accumulation, age, and gender. Experimental eye
research, 87, 80-8.
WOJCIAK-STOTHARD, B., POTEMPA, S., EICHHOLTZ, T & RIDLEY, A.J. 2001.
9Rgr and Rac but not Cdc43 regulate endothelial cell permeability. Journal of
cell science, 114, 1343-1355.
WOOD, J. P. & OSBORNE, N. N. 2003. Zinc and energy requirements in induction of
oxidative stress to retinal pigmented epithelial cells. eurochemical research,
28, 1525-33.
WRIGHT, P. L., SMITH, K. F., DAY, W. A. & FRASER, R. 1983. Small liver
fenestrae may explain the susceptibility of rabbits to atherosclerosis.
Arteriosclerosis, 3, 344-8.
WU, S. M., QIAO, X., NOEBELS, J. L. & YANG, X. L. 1993. Localization and
modulatory actions of zinc in vertebrate retina. Vision research, 33, 2611-6.
WYSZYNSKI, R. E., BRUNER, W. E., CANO, D. B., MORGAN, K. M., DAVIS, C.
B. & STERNBERG, P. 1989. A donor-age-dependent change in the activity of
alpha-mannosidase in human cultured RPE cells. Investigative ophthalmology
& visual science, 30, 2341-7.
XU, T. F., WANG, X. L., YANG, J. Z., HU, X. Y., WU, W. F., GUO, L., KANG, L.
D. & ZHANG, L. Y. 2009. Overexpression of Zip-2 mRNA in the leukocytes
of asthmatic infants. Pediatric pulmonology, 44, 763-7.
YAN, A., Xu, G. & YANG, Z.B. 2009. Calcium participates in feedback regulation of
the oscillating ROP1 Rho GTPase in pollen tubes. Proceedings of the ational
Academy of Sciences, 51, 22002-22007.
YANG, L., GONG, H., WANG, Y., YIN, H., CHEN, P. & ZHANG, H. 2010.
Nicotine alters morphology and function of retinal pigment epithelial cells in
mice. Toxicologic pathology, 38, 560-7.
YOLTON, D. P. 1981. Nutritional effects of zinc on ocular and systemic physiology.
Journal of the American Optometric Association, 52, 409-14.

258
YU, Y. Y., KIRSCHKE, C. P. & HUANG, L. 2007. Immunohistochemical analysis of
ZnT1, 4, 5, 6, and 7 in the mouse gastrointestinal tract. The journal of
histochemistry and cytochemistry : official journal of the Histochemistry
Society, 55, 223-34.
ZHANG, B., ZHANG, Y., WANG, Z.X. & ZHENG, Y. 2000. The Role of
Mg2+
Cofactor in the Guanine Nucleotide Exchange and GTP Hydrolysis
Reactions of Rho Family GTP-binding Proteins. The journal of biological
chemistry, 275, 25299-25307.
ZHANG, L. H., WANG, X., STOLTENBERG, M., DANSCHER, G., HUANG, L. &
WANG, Z. Y. 2008. Abundant expression of zinc transporters in the amyloid
plaques of Alzheimer's disease brain. Brain research bulletin, 77, 55-60.
Copyright © 2022 FDOKUMEN