Assessment of pigment-based measures of omn - eScholarship
11
UC San Diego UC San Diego Previously Published Works Title Astaxanthin in Calanus pacificus: Assessment of pigment-based measures of omnivory Permalink https://escholarship.org/uc/item/95x3s2x8 Journal Limnology and Oceanography, 41(6) ISSN 0024-3590 Authors Juhl, AR Ohman, MD Goericke, R Publication Date 1996 DOI 10.4319/lo.1996.41.6.1198 Peer reviewed eScholarship.org Powered by the California Digital Library University of California
-
Upload
khangminh22 -
Category
Documents
-
view
3 -
download
0
Transcript of Assessment of pigment-based measures of omn - eScholarship

UC San DiegoUC San Diego Previously Published Works
TitleAstaxanthin in Calanus pacificus: Assessment of pigment-based measures of omnivory
Permalinkhttps://escholarship.org/uc/item/95x3s2x8
JournalLimnology and Oceanography, 41(6)
ISSN0024-3590
AuthorsJuhl, AROhman, MDGoericke, R
Publication Date1996
DOI10.4319/lo.1996.41.6.1198 Peer reviewed
eScholarship.org Powered by the California Digital LibraryUniversity of California
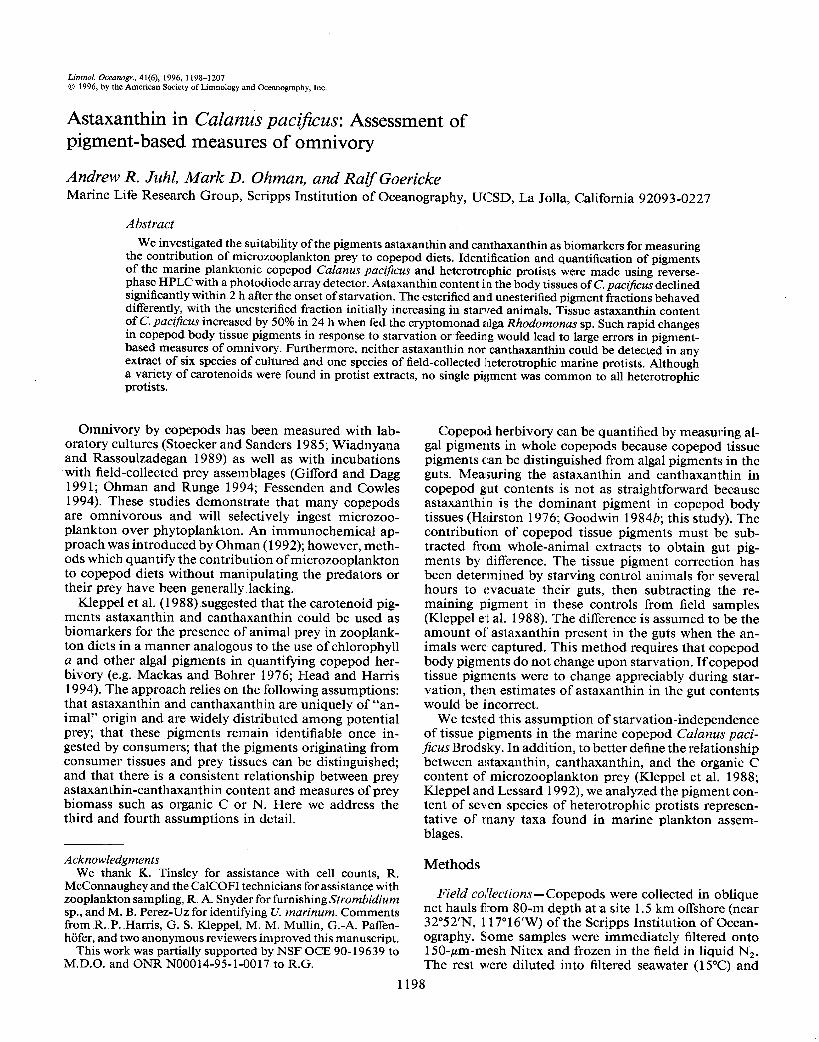
Limnol. Oceanogr., 41(6), 1996, 1198-1207 0 1996, by the American Society of Limnology and Oceanography, Inc.
Astaxanthin in Calanus pacijicus: Assessment of pigment-based measures of omnivory
Andrew R. Juhl, Mark D. Ohman, and Ralj’Goericke Marine Life Research Group, Scripps Institution of Oceanography, UCSD, La Jolla, California 92093-0227
Abstract We investigated the suitability of the pigments astaxanthin and canthaxanthin as biomarkers for measuring
the contribution of microzooplankton prey to copepod diets. Identification and quantification of pigments of the marine planktonic copepod Calanus pacificus and heterotrophic protists were made using reverse- phase HPLC with a photodiode array detector. Astaxanthin content in the body tissues of C. paczjicus declined significantly within 2 h after the onset of starvation. The esterified an’d unesterified pigment fractions behaved differently, with the unesterified fraction initially increasing in starved animals. Tissue astaxanthin content of C. paczjicus increased by 50% in 24 h when fed the cryptomonad alga Rhodomonas sp. Such rapid changes in copepod body tissue pigments in response to starvation or feeding would lead to large errors in pigment- based measures of omnivory. Furthermore, neither astaxanthin nor canthaxanthin could be detected in any extract of six species of cultured and one species of field-collected heterotrophic marine protists. Although a variety of carotenoids were found in Protist extracts, no single pigment was common to all heterotrophic protists.
Omnivory by copepods has been measured with lab- oratory cultures (Stoecker and Sanders 1985; Wiadnyana and Rassoulzadegan 1989) as well as with incubations with field-collected prey assemblages (Gifford and Dagg 1991; Ohman and Runge 1994; Fessenden and Cowles 1994). These studies demonstrate that many copepods are omnivorous and will selectively ingest microzoo- plankton over phytoplankton. An immunochemical ap- proach was introduced by Ohman (1992); however, meth- ods which quantify the contribution of microzooplankton to copepod diets without manipulating the predators or their prey have been generally lacking.
Kleppel et al. (1988) suggested that the carotenoid pig- ments astaxanthin and canthaxanthin could be used as biomarkers for the presence of animal prey in zooplank- ton diets in a manner analogous to the use of chlorophyll a and other algal pigments in quantifying copepod her- bivory (e.g. Mackas and Bohrer 1976; Head and Harris 1994). The approach relies on the following assumptions: that astaxanthin and canthaxanthin are uniquely of “an- imal” origin and are widely distributed among potential prey; that these pigments remain identifiable once in- gested by consumers; that the pigments originating from consumer tissues and prey tissues can be distinguished; and that there is a consistent relationship between prey astaxanthin-canthaxanthin content and measures of prey biomass such as organic C or N. Here we address the third and fourth assumptions in detail.
Acknowledgments We thank K. Tinsley for assistance with cell counts, R.
McConnaughey and the CalCOFI technicians for assistance with zooplankton sampling, R. A. Snyder for furnishing Strombidium sp., and M. B. Perez-Uz for identifying U. marinum. Comments from R. P. Harris, G. S. Kleppel, M. M. Mullin, G.-A. Paffen- hijfer, and two anonymous reviewers improved this manuscript.
This work was partially supported by NSF OCE 90- 19639 to M.D.O. and ONR N00014-95-1-0017 to R.G.
Copepod herbivory can be quantified by measuring al- gal pigments in whole copepods because copepod tissue pigments can be distinguished from algal pigments in the guts. Measuring the astaxanthin and canthaxanthin in copepod gut contents is not as straightforward because astaxanthin is the dominant pigment in copepod body tissues (Hairston 1976; Goodwin 1984b; this study). The contribution of copepod tissue pigments must be sub- tracted from whole-animal extracts to obtain gut pig- ments by difference. The tissue pigment correction has been determined by starving control animals for several hours to evacuate their guts, then subtracting the re- maining pigment in these controls from field samples (Kleppel et al. 1988). The difference is assumed to be the amount of astaxanthin present in the guts when the an- imals were captured. This method requires that copepod body pigments do not change upon starvation. If copepod tissue pigments were to change appreciably during star- vation, then estimates of astaxanthin in the gut contents would be incorrect.
We teste:d this assumption of starvation-independence of tissue pigments in the marine copepod Calanus paci- &us Brodsky. In addition, to better define the relationship between astaxanthin, canthaxanthin, and the organic C content of microzooplankton prey (Kleppel et al. 1988; Kleppel and Lessard 1992), we analyzed the pigment con- tent of seven species of heterotrophic protists represen- tative of rnany taxa found in marine plankton assem- blages.
Methods
Field collections - Copepods were collected in oblique net hauls firom 80-m depth at a site 1.5 km offshore (near 32”52’N, 117’16’W) of the Scripps Institution of Ocean- ography. Some samples were immediately filtered onto 150~pm-mesh Nitex and frozen in the field in liquid NZ. The rest were diluted into filtered seawater (15OC) and
1198

Pigment measures of omnivory 1199
transported to a laboratory, where individual adult C. paczjkus females were sorted for experiments.
Pigment variability in the field was determined from copepods collected in the Southern California Bight near Pt. Conception (-34ON, 12O”W) on two CalCOFI (Cali- fornia Cooperative Oceanic Fisheries Investigations) cruises. These animals were collected in the upper 70 m in 7-min hauls with a 0.70-m-diameter, 202~pm-mesh net on a bongo frame. Collections were made on 23-24 April 1992 (cruise 9204, stations 82.47,83.55 and 80.60; SIO Ref. 92-20) and 12 July 1992 (cruise 9207, stations 83.42, 82.47, 80.5 1, 80.55; SIO Ref. 93-13). Animals were quickly frozen in liquid N2 at sea, then transferred to a freezer at -80°C ashore until removed for pigment extraction.
We selected the cryptomonad alga, Rhodomonas sp., as prey for copepod feeding experiments because, unlike diatoms or dinoflagellates, Rhodomonas lacks pigments that coelute with astaxanthin or canthaxanthin, thus sim- plifying pigment identification. Because Rhodomonas contains neither astaxanthin nor canthaxanthin, we could also be assured that any such pigments in copepod ex- tracts originated from copepod body tissues and not gut contents.
To further confirm which pigments came from copepod gut contents and which from body tissues, we dissected the intestinal tract from C. pacijicus females and extracted and analyzed the gut contents and gut-free bodies sepa- rately. Small pieces of frozen samples were defrosted and C. pacijkus intact females were sorted out for dissection. Guts were removed by slowly and evenly tugging on the last urosomal segment with microforceps while holding the body in place with another microforceps. The entire gut often popped out as an intact sac. The remaining urosomal segment was then removed from the end of the gut and combined with the rest of the body tissues. We analyzed gut contents and gut-free bodies of two lots of 20 adult female C. pac$cus that had been fed at the high Rhodomonas concentration in the lab and three lots of 20 adult females collected and frozen in the field on CalCOFI cruises.
Feeding experiments- We tested whether well-fed C. paczjicus had qualitatively or quantitatively different pig- ment composition compared to starved animals. Cope- pods were incubated in lots of 20 individuals in l-liter polycarbonate bottles containing either filtered seawater (Whatman GF/F; starved treatment) or filtered seawater augmented with Rhodomonas (fed treatment). Bottles were secured to a plankton wheel and rotated at 1 rpm. Ex- periments were conducted on 4-5 August 1994 and 7-8 October 1994. On 4 August, two lots of animals were starved for 30 h while two additional lots were fed for 24 h at an initial concentration of 30,000 Rhodomonas cells ml-‘. The incubations began at 1700 hours and were run at 19°C with a 14 : 10 L/D cycle synchronized to field conditions. On 7 October, the animals were either starved for 36 h postcollection, fed at an initial Rhodomonas concentration of 30,000 cells ml-l (high food concentra- tion) for 24 h, or fed at an initial concentration of 5,000
cells ml-l (low food concentration) for 24 h (three lots per treatment). These incubations began at 2300 hours and were run at 15°C with a 12 : 12 L/D cycle.
Incubations were terminated by collecting the animals on Nitex mesh, then freezing them in liquid NZ. The sample was later defrosted; species, stage, and abundance were confirmed; and intact adult C. pacz@us females were transferred to a 47-mm GFK filter. The filters were wrapped in aluminum foil and stored at < - 73°C until pigment extraction.
Pigment decay rates in body tissues-Experiments as- sessed the time-course of change in tissue pigment of well- fed adult female C. pacz$cus upon starvation. Plexiglas cylinders with 3 3 3-pm-mesh bottoms were suspended within 3.8-liter glass jars filled with a solution of 30,000 Rhodomonas cells ml-‘. Copepods (40-60 individuals) were added to the cylinders. The jars were agitated oc- casionally to prevent settling of the food. After 24 h, the copepods were transferred to filtered seawater to begin starvation, then recovered and frozen in liquid N2 at spec- ified time intervals. On 30 September 1994, samples were collected after 0, 2, and 4 h of starvation. On 2 1 Novem- ber 1994, samples were taken after 0, 6, 8, and 24 h of starvation. Both experiments were run at 15°C with a 12 : 12 L/D cycle.
Culturing of heterotrophic protists-Cultures of hetero- trophic protists were grown at temperatures from 15 to 21°C with low, indirect light or in darkness. In addition to Rhodomonas, we found that the cyanobacterium Sy- nechococcus sp. (WH 7803) and the heterotrophic bac- terium Vibrio natriegens (ATCC 14048) also lacked pig- ments that coeluted with astaxanthin or canthaxanthin in our Chromatographic system. Using these organisms as food allowed us to test for the presence of astaxanthin and canthaxanthin in herbivorous and bacterivorous mi- crozooplankton without separating predator from prey. We also cultured the tintinnid ciliate FaveZZa sp. on the dinoflagellate Heterocapsa triquetra. In this case, predator and prey were separated upon harvesting by screening through a 63-pm mesh. The ciliates were then resus- pended in filtered seawater until their vacuoles had cleared. Inspection showed that there were essentially no residual prey and negligible FaveZZa mortality with this procedure. We also collected the heterotrophic dinoflagellate Noc- tiluca scintillans in net hauls from the Scripps pier. Noc- tiluca was resuspended in filtered seawater for 24 h before extraction.
Triplicate cultures of each species were filtered onto GFK filters and frozen at < - 73°C until extracted. Sub- samples were taken immediately before filtration and pre- served in acidic Lugol’s solution (final concn, 2%). After at least 48 h (Ohman and Snyder 1991), the abundance of microzooplankton in each culture was determined by microscopic counts. Linear dimensions were measured for randomly selected cells from each culture. These were converted to biovolume using the geometric formulae given by Kovala and Larrance (1966). Biovolumes were

1200 Juhl et al.
0 2 4 6 6 10 12 14 16 18 20 22
0.008
i
B) Starved Calanus
A f 3
5b I 8 c 0.004
42 E: 2
0.000
0 2 4 6 8 10 12 14 16 18 20 22 24
0.10 -
0.08 -
0.06 -
0.04 -
0.02 -
0.00 -
0
C) Rhodomonas
2
a
Time (min)
Fig. 1. Chromatograms from (A) Calanus pacz@us adult females fed Rhodomonas sp. for 24 h, (B) C. pacificus adult females starved for 8 h, and (C) a pure culture of Rhodomonas sp. Numbered peaks are identified as follows: 1 -unesterified astaxanthin; 2-alloxanthin; 3 - 4 - similar to alloxanthin; 5a- Chl a and astaxanthin ester; Sb-astaxanthin ester only; 5c- Chl a only; 6-unidentified carotenoid; 7a-pheophytin a and astaxanthin ester; 7b-astaxanthin ester only; 8-Chl c (cl + ~2); 9-l 2 -similar to a-carotene; 13 -a-carotene. Peaks 5a and 7a show coelution of two pigments. Braces encompass all of the unnumbered peaks in panels A and B with retention times from 14 to 23 min that were identified by their absorption spectra as astaxanthins. Absorption spectra of pigments given in Fig. 2 legend.
multiplied by 0.21 pg C pm-3 to determine cellular C content (Ohman and Snyder 1991).
Pigment extraction and analysis- Samples of cope- pods, algae, or microzooplankton on 47-mm GF/F filters were freeze-dried until only 0.1 ml of water remained in the filter (as determined by weight). We did not detect any difference between samples which were freeze-dried and samples which were not freeze-dried because the lat- ter were collected on smaller (25 mm) filters that already had low water content. Filters were extracted in 1 ml of 100% HPLC-grade acetone in a glass tissue homogenizer tube, then, after standing at least 0.5 h at - 2O”C, were ground for 30-60 s while in an ice bath. Samples were further extracted for at least 4 h at -2O”C, then centri- fuged for 5 min. Subsamples of 50-700 ~1 from the su- pernatant w’ere mixed with Milli-Q HZ0 (two parts ex- tract : one part H20) immediately before injection.
All samples were analyzed on a C18 column-based sys- tem with a Rainin Dynamax cartridge column (10 cm, 4.6 mm, 3 p:m), HPLC-grade solvents (A-855% methanol, 15% 0.5 M aqueous ammonium acetate; B-methanol; C-acetone), and the following linear tertiary gradient system derived from Goericke and Welschmeyer ( 1992) (time, %A, %B, %C): (0 min, 100, 0, 0), (5 min, 50, 50, 0), (7 min, 50, 50, 0), (11 min, 0, 100, 0), (20 min, 0, 20, 80), (22 min, 0, 20, 80), (24 min, 100, 0, 0). Flow rate was always 1.5 ml min- l. Pigments were quantified at 440 nm and spectrally characterized on a Waters 99 1 M photodiode array detector system. Pigments were iden- tified by absorption spectra. Algal pigment standards for reference splectra were derived from extracts of a variety of cultured phytoplankton. Astaxanthin standard was ob- tained from Hoffman-La Roche (as Carophyll Pink) and canthaxanthin standard was obtained from Fluka Chemie AG. The detector response was linear through the range of pigment content in our samples (r2 1 0.99). The ex- tinction coefficient of astaxanthin from Davies (1976) was used for all peaks identified as astaxanthin esters. Our smallest detectable peaks contained the equivalent of 3- 4 ng of pigment, corresponding to 0.15-0.2 ng of astax- anthin per copepod.
Results
Astaxanthin pigments of C. pacificus-A single peak was identified as unesterified astaxanthin in chromato- grams of adult female C. pacificus (Fig. 1 A, B) based on its absorption spectrum (Fig. 2B) and retention time. Nu- merous other peaks were found, all with absorption spec- tra characteristic of astaxanthin (see Fig. 2C, I) but longer retention times. These peaks were most likely astaxanthin esters (cf. Hairston 1976), although some could also have been intermediate compounds in astaxanthin metabolism or esters of’ canthaxanthin; astaxanthin and canthaxan- thin have very similar absorption spectra. No evidence of unesterified canthaxanthin was ever found. We refer to all peaks with astaxanthinlike absorption spectra as “astaxanthins” and will distinguish between unesterified

Pigment measures of omnivory 1201
A) Astaxanthin std. D) Alloxanthin std.
I I I I I I I I I I I I I I I I 360 400 440 480 520 560 600 640 68t
h (nm)
H) Coeluted spectra
Fig. 2. Examples of pigment absorption spectra from pigment standards and selected peaks in Fig. 1. Vertical axes are standardized so that all spectra are scaled similarily. A. Unesterified astaxanthin standard. B. Unesterified astaxanthin from peak 1 (Fig. 1A). C. Overlain spectra from all unnumbered peaks in Fig. 1A with absorbance > 0.001 absorbance units (AU). All these peaks were identified as astaxanthins. D. Alloxanthin from Rhodomonas sp. E. Allox- anthin from peak 2 (Fig. 1A). F. Unidentified carotenoid from peak 6 (Fig. 1A). G. Chl a (solid line) and pheophytin a (dashed line) standards. H. Spectra from peaks 5a and 7a (Fig. 1A) which demonstrate the coelution of two pigments. Dashed line (peak Sa)-Chl a and astaxanthin ester; solid line (peak 7a)-pheophytin a and astaxanthin ester. Arrow indicates characteristic absorbance peak of Chl a and related pigments. I. Overlain spectra from all peaks in Fig. 1 B with absorbance > 0.00 1 AU, all of which were identified as astaxanthins.
astaxanthin and a group of esterified astaxanthins (i.e. astaxanthins with longer retention times).
Whole animal extracts of experimentally fed copepods also contained the algal pigments alloxanthin and chlo- rophyll a, which must have originated from ingested Rho- domonas (Fig. lC, cf. 2D with 2E and 2G with 2H). Pheophorbides (which include pheophorbide a, pheo- phorbide a’ and pyropheophorbide a) and pheophytins (which include pheophytin a, pheophytin a’ and pyro- pheophytin a) resulting from the digestive breakdown of chlorophyll a were present in the extracts of fed animals (Fig. 1 A, 2H). However, chlorophyll a breakdown prod- ucts were not always apparent in chromatograms ana- lyzed at 440 nm because their absorption is low at this wavelength. Some peaks had absorption spectra charac- teristic of carotenoids other than astaxanthin but could
not be identified with certainty (e.g. Fig. 2F). By corn- parison, starved copepods (Fig. 1B) contained only as- taxanthins (Fig. 21), indicating that only astaxanthins were present once the guts were evacuated.
Further demonstration that astaxanthins were localized in body tissues and not in gut contents is given by the results of the gut dissections (Fig. 3A-E). Figure 3A shows a chromatogram from C. pacificus frozen in the field (col- lected at 0339, 24 April 1992). The chromatogram is similar to Fig. 1A; it contains unesterified astaxanthin, many other astaxanthins, and several algal pigment peaks, indicating the animals had recently fed. Analysis of the dissected gut contents of C. paczjkus from the same sam- ple is shown in Fig. 3B. The peaks in Fig. 3B correspond to the nonastaxanthin peaks in Fig. 3A with only three exceptions (peaks 20, 21, and 22). Figure 3A and B were
1202 Juhl et al.
o.oo4;u ' '; ' ' 'c, ' ' '(2' ' '16' "2b' ' ':
B) Gut contents only
0.002
8 s 0.001
g
jj
a
0.000 1
-0.001
0
0.04- C) Bodies only
0.03 -
I’ll’ I I II”’ ’ II”” “III” 0 4 8 12 16 20 24 v 1
Time (min) r’
1 I I I I, I I, 1 I I,, c
440 520 600 66t
h (nm)
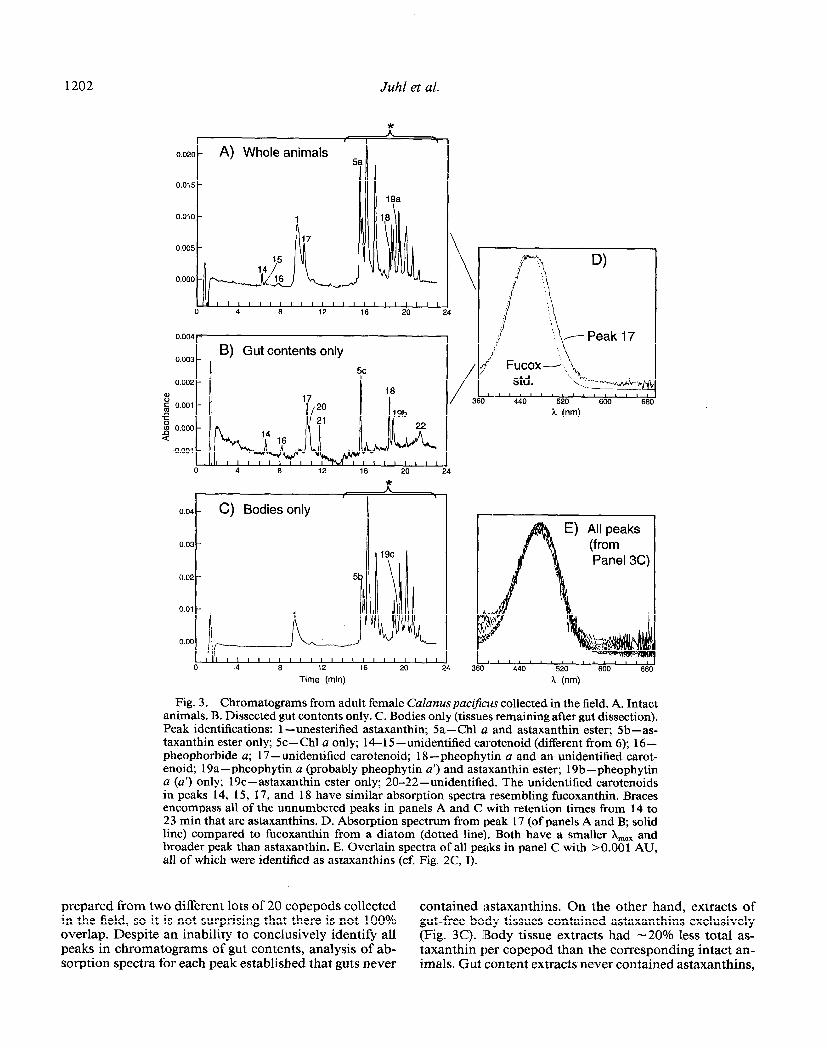
Fig. 3. Chromatograms from adult female CaZanus pacij-hs collected in the field. A. Intact animals. B. Dissected gut contents only. C. Bodies only (tissues remaining after gut dissection). Peak identifications: 1 -unesterified astaxanthin; Sa-Chl a and astaxanthin ester; Sb-as- taxanthin ester only; 5c - Chl a only; 14- 15 -unidentified carotenoid (different from 6); 16 - pheophorbide a; 17 -unidentified carotenoid; 18 -pheophytin a and an unidentified carot- enoid; 19a-pheophytin a (probably pheophytin a’) and astaxanthin ester; 19b-pheophytin a (a’) only; 19c-astaxanthin ester only; 20-22-unidentified. The unidentified carotenoids in peaks 14, 15, 17, and 18 have similar absorption spectra resembling fucoxanthin. Braces encompass all of the unnumbered peaks in panels A and C with retention times from 14 to 23 min that are astaxanthins. D. Absorption spectrum from peak 17 (of panels A and B; solid line) compared to fucoxanthin from a diatom (dotted line). Both have a smaller X,,, and broader peak than astaxanthin. E. Overlain spectra of all peaks in panel C with bO.001 AU, all of which were identified as astaxanthins (cf. Fig. 2C, I).
prepared from two different lots of 20 copepods collected contained astaxanthins. On the other hand, extracts of in the field, so it is not surprising that there is not 100% gut-free body tissues contained astaxanthins exclusively overlap. Despite an inability to conclusively identify all (Fig. 3C). IBody tissue extracts had -20% less total as- peaks in chromatograms of gut contents, analysis of ab- taxanthin per copepod than the corresponding intact an- sorption spectra for each peak established that guts never imals. Gut content extracts never contained astaxanthins,

Pigment measures of omnivory 1203
so we attribute this decrease to loss of tissue and lipids during dissection rather than to gut content removal per se.
Adult female C. paczjkus that had been fed a high con- centration of Rhodomonas cells for 24 h had significantly higher content of astaxanthins than starved animals (Fig. 4, two-sample t-test, P < 0.002 for each case). There was no significant difference between the starved treatment and the low food treatment (two-sample t-test, P > 0.2). After 24 h at the high food concentration, the astaxanthins per copepod had increased by - 50% over the initial value of animals frozen immediately upon collection in the field (Fig. 4, far right bars). This demonstrates that astaxanthin content increased rapidly during feeding. Therefore, dif- ferences between starved and fed copepods were partly due to a buildup of pigments in fed animals.
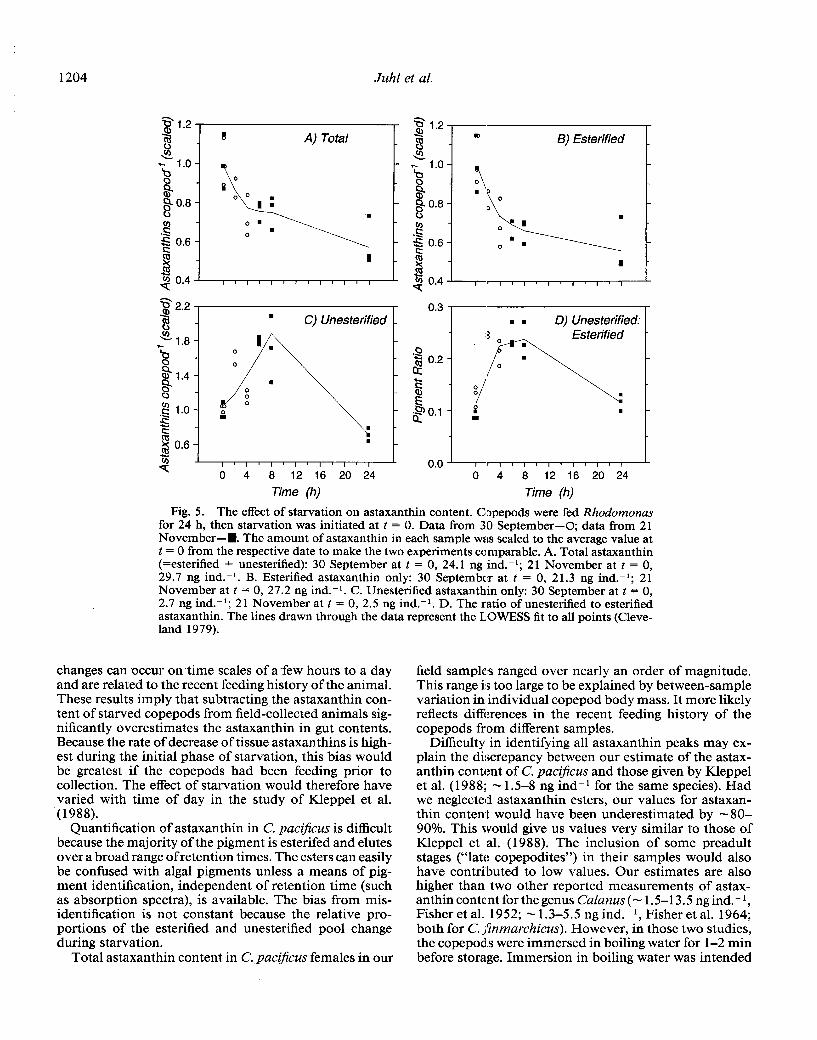
During starvation experiments, total astaxanthins de- clined (Fig. 5A; Jonckheere’s test for ordered alternatives, P < 0.001). A 20-30% decrease was found during the first 4 h. The esterified and unesterified astaxanthin frac- tions behaved differently, especially during early starva- tion. Although the esterified fraction decreased more rap- idly than total astaxanthins (Fig. 5B), the unesterified fraction increased through the first 8 h of starvation, then decreased by 24 h of starvation (Fig. 5C). In well-fed copepods and those which had been starved for 24 h, unesterified astaxanthin was - 10% of the esterified frac- tion, while in copepods in the initial phase of starvation, unesterified astaxanthin was -2O-25% of the esterified astaxanthin (Fig. 5D).
In our field collections, total astaxanthin content of individual adult female C. pacijicus ranged from 11.4 to 92.4 ng ind.-’ (17 analyses from eight independent sam- ples). The range of astaxanthin content of animals from our experiments (11.8-34.9 ng ind.-‘) lies within the range of values encountered in the field, albeit on the low end. As with the experimental animals, the unesterified astax- anthin of copepods in the field collections was only lo- 20% of the esterified fraction. Unesterified canthaxanthin was not detected. C. paczjkus copepodid stage 5s from one of the CalCOFI samples averaged 15.0 + 2.8 (+ 1 SD, n = 4) ng astaxanthin ind.- l, while the adult females from the same sample averaged 34.3 f 3.8 (n = 4) ng astaxanthin ind.-‘, a factor of 2.28 difference (Mann- Whitney U-test, P x 0.05). This difference demonstrates the necessity of separating developmental stages in pig- ment analyses.
Pigments of heterotrophic protists -No astaxanthin or canthaxanthin was detected in any analyses of the species and diets of the seven species of heterotrophic protists tested (Table 1). Three species were selected to illustrate this result because the chromatograms were simple enough to display the absorption spectrum of each peak. An oli- gotrich ciliate, Strombidium sp. (Fig. 6A), and a hypotrich ciliate, Euplotes sp. (Fig. 6B), were cultured on the bac- terium V. natriegens; N. miliaris (Fig. 6C) was collected from the field. A chromatogram with pure astaxanthin
351 1 30 -
-2 ,y 25 - ‘u iz. Q) 20 - 8
l-
Fig. 4. The difference between starved (S) and fed (F) adult female Calanus pacificus. Fed animals were fed for 24 h at either Hi (30,000 Rhodomonas cells ml-l) or Lo (5,000 Rhodomonas cells ml-l) prey concentration. Starting from the left, S animals were starved 30, 36, and 24 h. The last set of bars compares the initial astaxanthin content of animals in the field to animals from the same sample following 24 h in the high food concen- tration. Each bar is the mean (+ 1 SD) of three samples (except the first set where n = 2).
and canthaxanthin standards is shown for comparison of retention time and absorption spectra (Fig. 6D). Chro- matograms from other species were more complicated, typically consisting of tens of peaks. Some of these peaks could be attributed to prey pigments or breakdown prod- ucts of prey pigments. However, the absorption spectra of most pigments in heterotrophic Protist extracts did not match known pigments and could not be conclusively identified.
The Noctiluca extract (Fig. 6C) contained a small Chl a peak despite separation from potential prey items for nearly 24 h. This pigment may have been retained in the Noctiluca cells or there may have been some contami- nating algae, although we inspected the sample micro- scopically before harvesting and found no prey carryover.
Discussion
We have demonstrated that the copepods in our ex- periments contained astaxanthins exclusively in their body tissues and not in their gut contents. Changes in total astaxanthin during starvation could therefore be attrib- uted to changes in body tissue astaxanthins and not to gut evacuation. Our experiments showed that the tissue pigment content of C. paczjicus is dynamic. Significant
1204 Juhl et al.
n C) Unesterified
’ ‘I’,‘,‘,‘, il ; 8 12 16 20 24
Time (h)
B) Esterified _
0.3 7 I n n D) Unesterified: 1
r3 o
io.2: -I” 1 80.1 - 8 . -
I
0 4 8 12 16 20 24
Time (h)
Fig. 5. The effect of starvation on astaxanthin content. Copepods were fed Rhodomonas for 24 h, then starvation was initiated at t = 0. Data from 30 September-O; data from 21 November-H. The amount of astaxanthin in each sample was scaled to the average value at t = 0 from the respective date to make the two experiments co,mparable. A. Total astaxanthin (=esterified + unesterified): 30 September at t = 0, 24.1 ng ind.-‘; 21 November at t = 0, 29.7 ng ind.-‘. B. Esterified astaxanthin only: 30 September at t = 0, 21.3 ng ind.-‘; 21 November at t = 0, 27.2 ng ind.-‘. C. Unesterified astaxanthin only: 30 September at t = 0, 2.7 ng ind.-‘; 2 1 November at t = 0, 2.5 ng ind.-‘. D. The ratio of unesterified to esterified astaxanthin. The lines drawn through the data represent the L.OWESS fit to all points (Cleve- land 1979).
changes can occur on time scales of a few hours to a day and are related to the recent feeding history of the animal. These results imply that subtracting the astaxanthin con- tent of starved copepods from field-collected animals sig- nificantly overestimates the astaxanthin in gut contents. Because the rate of decrease of tissue astaxanthins is high- est during the initial phase of starvation, this bias would be greatest if the copepods had been feeding prior to collection. The effect of starvation would therefore have varied with time of day in the study of Kleppel et al. (1988).
Quantification of astaxanthin in C. paciJicus is difficult because the majority of the pigment is esterifed and elutes over a broad range of retention times. The esters can easily be confused with algal pigments unless a means of pig- ment identification, independent of retention time (such as absorption spectra), is available. The bias from mis- identification is not constant because the relative pro- portions of the esterified and unesterified pool change during starvation.
Total astaxanthin content in C. paczjicus females in our
field samples ranged over nearly an order of magnitude. This range is too large to be explained by between-sample variation in individual copepod body mass. It more likely reflects difX:rences in the recent feeding history of the copepods from different samples.
Difficulty in identifying all astaxanthin peaks may ex- plain the discrepancy between our estimate of the astax- anthin content of C. paczjkus and those given by Kleppel et al. (1988; - 1.5-8 ng ind-’ for the same species). Had we neglected astaxanthin esters, our values for astaxan- thin content would have been underestimated by -8O- 90%. This would give us values very similar to those of Kleppel et al. (1988). The inclusion of some preadult stages (“late copepodites”) in their samples would also have contributed to low values. Our estimates are also higher than two other reported measurements of astax- anthin conte:nt for the genus Calanus (- 1.5-l 3.5 ng ind. - l, Fisher et al. 1952; - 1.3-5.5 ng ind.-‘, Fisher et al. 1964; both for C. jkzmarchicus). However, in those two studies, the copepods were immersed in boiling water for l-2 min before storage. Immersion in boiling water was intended

Pigment measures of omnivory 1205
600
700 B) Euplotes sp.
600
-E 500 -5
x
Time (min)
0.00 - + ̂ - I, I,, I I I I I # I I I IO I I I I I I4
0 3 6 9 12 15 18 21 24
Time (min)
Fig. 6. Chromatograms from three species of heterotrophic protists and pigment standards. A. Strombidium sp. B. Euplotes sp. C. Noctiluca scintillans. D. Astaxanthin and canthaxanthin standards (the canthaxanthin peak extends to 0.12 AU). U-Unidentified pigment; C-un- identified carotenoids; Bact-an unidentified pigment found in Vibrio natriegens; Zeax- zeaxanthin; Chl a-chlorophyll a; Astax-astaxanthin; Canthax-canthaxanthin. C3’ and C5’ have essentially identical spectra (but smaller peaks) as C3 and C5.
to “fix” the pigment in its tissue of origin; however, the procedure may have caused degradation of astaxanthin. Other studies on copepod pigments have reported astax- anthin contents for other genera that are comparable or higher than ours. Hairston (1980) gave a value of 5 pg pigment (mg dry body wt)-l for brightly colored Diap- tomus nevadensis, which is - 250 ng ind.- l (using dry weights from Hairston 1979). Ohman et al. (1989) found 93 ng pigment ind.--’ for stage 5 and 164 ng ind.- l for adult female Neocalanus tonsus, a species which has - 3 x the body mass of C. paczjicus.
Hairston (1980) reported only a small decrease in the astaxanthin content of the freshwater copepod D. neva- densis after a week of starvation. The stability of pigment content in Diaptomus contrasts with the rapid changes in astaxanthin content of Calanus that we found. Kleppel et al. (1985) also demonstrated rapid changes in body pigments of Acartia tonsa which correlated with recent feeding history (their figure 2). These results may indicate that astaxanthin has a different function in copepods with different lifestyles. Diaptomus may use astaxanthin as a photoprotectant because it lives in alpine lakes where it could experience high light levels. However, this function
seems unnecessary for a vertically migrating, deep-living, oceanic copepod such as Calanus. Because the majority (-SO-90%) of astaxanthins in Calanus are esterified to lipids and because astaxanthin has been shown to protect lipids from attack by peroxide radicals (Terao 1989), we suggest that one of the roles of astaxanthin in Calanus and similar copepods is to provide antioxidant protection to unsaturated storage lipids.
Neither astaxanthin nor canthaxanthin was detected in extracts of heterotrophic protists. Although some peaks in the Protist extracts could be identified as prey pigments or breakdown products of prey pigments, many pigments remained unidentified. Nevertheless, none of these un- knowns had absorption spectra that matched astaxanthin or canthaxanthin. There was some overlap in pigments found in different species. For example, both the oligo- trich ciliate Strombidium sp. and the hypotrich ciliate Euplotes sp. (both fed on K natriegens) had large peaks with retention times and absorption spectra identical to the algal carotenoid zeaxanthin. This pigment was also found when the same species of Strombidium was raised on Rhodomonas sp. (data not shown), yet the pigment was not detected in either prey, Rhodomonas or V. na- .

1206 Juhl et al.
Table 1. Diet, cell biovolume @m3), number of cells, and total carbon per sample (ng) of heterotrophic Protist species tested for the presence of astaxanthin and canthaxanthin. Noc- tiluca scintillans was collected in the field; hence its diet is unknown. Neither astaxanthin nor canthaxanthin were detected in any analyses of heterotrophic .protist extracts.
Species Prey Cell bio.. volume
Total No. cells sample- 1
Total C sample- I
Strombidium sp.
Strombidium sp.
Favella sp.
Gymnodinium sp.
Scuticociliate No. 1
Scuticociliate No. 1
Uronema marinum
Euplotes sp.
Noctiluca scintillans
Vibrio natriegens
Rhodomonas sp.
Heterocapsa triquetra
Rhodomonas sp. Synechococcus sp.
V. natriegens
Synechococcus sp.
V. natriegens
V. natriegens
Unknown
18,650
25,000
275,000
1,086
600
2,150
1,7160
33,000
5,840,OOO
160,000 6.27 x lo5 165,000 6.46 x lo5 160,000 6.27 x lo5 93,500 4.91 X 10⁵ 95,800 5.03 x 10⁵
3,430 1.98 x lo5 3,790 2.19 x lo5 2,970 1.72 x lo5
68,000 1.55 X lo4 74,000 1.69 x lo4 49,250 1.12x 10⁴
115,000 1.45 x 10⁴ 208,000 2.62 x lo4
68,000 8.57 x lo3 450,000 2.03 x lo5 206,000 9.30 x lo4 200,000 9.03 x lo4 794,000 2.93 x lo5
1,215,OOO 4.50 x lo5 700,000 2.59 x lo5
53,000 3.67 x lo5 27,000 1.87 x lo5 54,000 3.74 x 10⁵
1,165 1.43 x 10⁶ 5,825 7.14x lo7 1,165 1.43 x 10⁶
triegens. However, comparison of the Noctiluca extract with the other taxa analyzed demonstrates that no single pigment is found in all heterotrophic protists.
Astaxanthin and canthaxanthin were previously re- ported in several of the same genera of heterotrophic protists we studied (Kleppel and Lessard 1992). Sufficient organic C was present in our extracts to have detected astaxanthin and canthaxanthin had they been present in the organic C : pigment ratios given by Kleppel and Les- sard (1992). Because Kleppel and Lessard lacked a means of pigment identification independent of retention time and they experienced problems with coelution of pig- ments, they may have had difficulty identifying astax- anthin and canthaxanthin (Kleppel pers. comm.). Even if the species of heterotrophic protists used by Kleppel and Lessard did contain astaxanthin and canthaxanthin, our results nevertheless demonstrate that the pigments are not universally present in heterotrophic protists. Thus, in reference to the assumptions listed in our introduction, astaxanthin and canthaxanthin do not seem to be widely distributed among animal prey of copepods. We also note that astaxanthin and canthaxanthin can be found in some green algae and some cyanobacteria (Goodwin 1984a)
- and are therefore not uniquely of “animal” origin.
We conclude that the use of astaxanthin and canthax- anthin as biomarkers for copepod predation on hetero- trophic protists is precluded both by the rapid changes in tissue pigments of Calanus and by the lack of these pigments in the species of heterotrophic protists exam- ined. The dynamic nature of astaxanthin within copepod body tissues make it a poor choice as a biomarker even for potential prey (such as copepod eggs and nauplii) that do contain astaxanthin. Further difficulties arise because of the variability of astaxanthin content within and be- tween copepod developmental stages in the field. The adaptive significance of such pigments remains to be fully explored.
References CLEVELAND, W. S. 1979. Robust locally weighted regression
and smoothing scatterplots. J. Am. Stat. Assoc. 74: 829- 836.
DAVIES, B. H. 1976. Carotenoids, p. 38-165. In T. W. Good- win [ed.], Chemistry and biochemistry of plant pigments, 2nd ed. Academic.
FESSENDEN, L., AND T. J. COWLES. 1994. Copepod predation on phagotrophic ciliates in Oregon coastal waters. Mar. Ecol. Prog. Ser. 107: 103-l 11.

Pigment measures of omnivory 1207
FISHER, L.R. ,S.K KIN, ANDS.Y.THOMPSON. 1952. Vitamin A and carotenoids in certain invertebrates. 1. Marine crus- tacea. J. Mar. Biol. Assoc. U.K. 31: 229-258.
--,AND-------. 1964. Vitamin A and carotenoids in’certain invertebrates. 7. Crustacea: Copepoda. J. Mar. Biol. Assoc. U.K. 44: 685-692.
GIFFORD, D. J., AND M. J. DAGG. 1991. The microzooplank- ton-mesozooplankton link: Consumption of planktonic protozoa by the Calanoid copepods Acartia tonsa Dana and Neocalanusplumchrus Murukawa. Mar. Microb. Food Webs 5: 161-177.
GOERICKE, R., ANDN. A. WELSCHMEYER. 1992. Pigmentturn- over in the marine diatom Thalassiosira weissflogii. 1. The 14C0,-labeling kinetics of chlorophyll a. J. Phycol. 28: 498- 507.
GOODWIN, T. W. 1984a,b. The biochemistry of the carote- noids. V. 1 and 2, 2nd Ed. Chapman and Hall.
HAIRSTON, N. G., JR. 1976. Photoprotection by carotenoid pigments in the copepod Diaptomus nevadensis. Proc. Natl. Acad. Sci. 73: 971-974.
- 1979. The adaptive significance of color polymor- . phism in two species of Diaptomus (Copepoda). Limnol. Oceanogr. 24: 15-3 7.
- 1980. On the diel variation of copepod pigmentation. Limnol. Oceanogr. 25: 742-747.
HEAD, E. J. H., AND L. R. HARRIS. 1994. Feeding selectivity by copepod grazing on natural mixtures of phytoplankton determined by HPLC analysis of pigments. Mar. Ecol. Prog. Ser. 110: 75-83.
KLEPPEL,G. S.,D. FRAZEL, R.E. PIEPER,AND D.V. HOLLIDAY. 1988. Natural diets of zooplankton off southern California. Mar. Ecol. Prog. Ser. 49: 23 l-24 1.
-, AND E. J. LESSARD. 1992. Carotenoid pigments in microzooplankton. Mar. Ecol. Prog. Ser. 84: 2 1 l-2 18.
-, L. WILLBANKS, AND R.E. PIEPER. 1985. Dielvariation
in body carotenoid content and feeding activity in marine zooplankton assemblages. J. Plankton Res. 7: 569-580.
KOVALA, P. E., AND J. D. LARRANCE. 1966. Computation of phytoplankton cell numbers, cell volume, cell surface and plasma volume per liter, from microscopical counts. Univ. Wash. Dep. Oceanogr. Spec. Rep. 38.
MACKAS, D., AND R. BOHRER. 1976. Fluorescence analysis of zooplankton gut contents and an investigation of diel feed- ing patterns. J. Exp. Mar. Biol. Ecol. 25: 77-85.
OHMAN, M. D. 1992. Immunochemical recognition of oligo- trich ciliates. Mar Biol. 114: 653-660.
-, J. M. BRADFORD, AND J. B. JILLET. 1989. Seasonal growth and lipid storage of the circumglobal, subantarctic copepod, Neocalanus tonsus (Brady). Deep-Sea Res. 36: 1309-l 326.
-, AND J. A. RUNGE. 1994. Sustained fecundity when phytoplankton resources are in short supply: Omnivory by Calanusfinmarchicus in the Gulf of St. Lawrence. Limnol. Oceanogr. 39: 2 l-36.
-, AND R. A. SNYDER. 199 1. Growth kinetics of the om- nivorous oligotrich ciliate Strombidium sp. Limnol. Ocean- ogr. 36: 922-935.
STOECKER, D. K., AND N. K. SANDERS. 1985. Differential feed- ing by Acartia tonsa on a dinoflagellate and a tintinnid. J. Plankton Res. 7: 85-100.
TERAO, J. 1989. Antioxidant activity of beta-carotene-related carotenoids in solution. Lipids 24: 659-66 1.
WIADNYANA, N. N., AND F. RASSOULZADEGAN. 1989. Selective feeding of Acartia clausi and Centropages typicus on mi- crozooplankton. Mar. Ecol. Prog. Ser. 53: 37-45.
Submitted: 7 July 1995 Accepted: 20 December 1995
Amended: 29 March 1996