qt1p4898qc.pdf - eScholarship
11
UC Irvine UC Irvine Previously Published Works Title Interactive effects of precipitation manipulation and nitrogen addition on soil properties in California grassland and shrubland Permalink https://escholarship.org/uc/item/1p4898qc Authors Khalili, Banafshe Michael L. Goulden Oladele A. Ogunseitan et al. Publication Date 2016-11-01 DOI 10.1016/j.apsoil.2016.05.018 Peer reviewed eScholarship.org Powered by the California Digital Library University of California
-
Upload
khangminh22 -
Category
Documents
-
view
1 -
download
0
Transcript of qt1p4898qc.pdf - eScholarship

UC IrvineUC Irvine Previously Published Works
TitleInteractive effects of precipitation manipulation and nitrogen addition on soil properties in California grassland and shrubland
Permalinkhttps://escholarship.org/uc/item/1p4898qc
AuthorsKhalili, BanafsheMichael L. GouldenOladele A. Ogunseitanet al.
Publication Date2016-11-01
DOI10.1016/j.apsoil.2016.05.018 Peer reviewed
eScholarship.org Powered by the California Digital LibraryUniversity of California

Applied Soil Ecology 107 (2016) 144–153
Interactive effects of precipitation manipulation and nitrogen additionon soil properties in California grassland and shrubland
Banafshe Khalilia,*, Oladele A. Ogunseitana, Michael L. Gouldenb, Steven D. Allisonb,c
a Program in Public Health and School of Social Ecology, University of California, Irvine, CA 92697, USAbDepartment of Earth System Science, University of California, Irvine, CA 92697, USAcDepartment of Ecology and Evolutionary Biology, University of California, Irvine, CA 92697, USA
A R T I C L E I N F O
Article history:Received 20 December 2015Received in revised form 28 March 2016Accepted 28 May 2016Available online 11 June 2016
Keywords:Carbon and nitrogen cycleDroughtGlobal changeGrasslandMicrobial communitiesShrubland
A B S T R A C T
Soil microbial communities and pools of carbon (C) and nitrogen (N) play an important role in ecosystemresponses to precipitation variability and N deposition. In southern California, ecosystem vulnerability tothese environmental change drivers may differ for grassland versus shrubland vegetation types. Wehypothesized that (1) these vegetation types would differ in their responses to precipitation and Nmanipulation; (2) reduced precipitation (“drought treatment”) would have a negative effect on soilmicrobial abundance and alter microbial community composition, (3) these changes would be associatedwith reductions in soil C and N pools, (4) N addition would increase microbial abundance as well as soil Cand N pools, and (5) combined drought and N deposition would have offsetting effects on soil properties.We tested these hypotheses at the Loma Ridge Global Change Experiment in southern California. Acrossvegetation types, we found that microbial biomass based on phospholipid fatty acids declined withdrought and N addition. Microbial composition differed more strongly by vegetation type than withenvironmental change treatments. Added precipitation had little effect on microbial biomass butreduced labile C and N pools; these reductions were mitigated by N addition. Drought reduced labileforms of soil C and N, whereas N addition increased labile soil C pools and all soil N pools. Negative effectsof drought and N addition were additive for microbial biomass, which could inhibit soil C cycling if both ofthese environmental changes occur together. Drought interacted with N addition to significantly increasethe most labile N pool under the drought + N treatment, which suggests a build-up of available N underthese conditions. These results imply that multiple environmental changes may combine non-additivelyto affect below-ground microorganisms and soil C and N pools, which may have important consequencesfor ecosystem services such as productivity, biodiversity, and soil quality in Mediterranean climateregimes of North America.
ã 2016 Elsevier B.V. All rights reserved.
Contents lists available at ScienceDirect
Applied Soil Ecology
journal homepage: www.else vie r .com/ locate /apsoi l
1. Introduction
Belowground communities in soils are expected to respond tohuman-induced environmental changes with consequences forsoil carbon (C) and nitrogen (N) pools (Bardgett et al., 2008;Ogunseitan, 2005). Large-scale environmental change can producelocal effects on soil moisture patterns, N availability, and soiltemperature. In addition, changes in plant community composi-tion, C allocation patterns, or the quantity and quality of plant-derived organic matter can alter the supply of C and N to soil aswell as the structure and activity of microbial communitiesinvolved in biogeochemical processes (Allison et al., 2013; Balser
* Corresponding author.E-mail address: [email protected] (B. Khalili).
http://dx.doi.org/10.1016/j.apsoil.2016.05.0180929-1393/ã 2016 Elsevier B.V. All rights reserved.
et al., 2010). Shifts in microbial community composition andfunctioning can also feedback to affect other soil biogeochemicalprocesses (Carreiro et al., 2000; Treseder et al., 2012; Todd-Brownet al., 2012; Henry et al., 2005).
In grasslands and shrublands of southern California, climatechange may lead to reductions in winter season precipitation andincreases in the duration and severity of drought (Seager andVecchi, 2010; Cayan et al., 2010). However, precipitation projec-tions are uncertain, and rainfall events may become more extremewith climate change (IPCC, 2013). These changes may haveimplications for microbial communities and nutrient cycling(Cregger et al., 2012; Castro et al., 2010). For example, Fiereret al. (2013) found a strong correlation between taxonomicdiversity of soil microbial communities and precipitation amount.Precipitation changes can also influence soil microbial

Fig. 1. Annual water input in the control, reduced and added precipitationtreatments.
B. Khalili et al. / Applied Soil Ecology 107 (2016) 144–153 145
communities and biogeochemical cycles indirectly, via vegetationchange (Bragazza et al., 2015; Tiemann and Billings, 2011; Harperet al., 2005). Allison et al. (2013) found that drought reduced litterdecomposition directly, through water limitation, and indirectlythrough changes in microbial population size, communitycomposition, and litter chemistry. Previous studies have shownthat increased precipitation can increase soil light fraction C and N,whereas total soil C and heavy fraction C is relatively stable underclimate change (Song et al., 2012; Rosenstein et al., 2011).
Nitrogen deposition in some areas of California is among thehighest in the United States, with 20 kg ha�1 y�1 or greater insouthern California (Fenn et al., 2010). Nitrogen limits primaryproduction in many terrestrial ecosystems (LeBauer and Treseder,2008; Niboyet et al., 2011). The effect of chronic N enrichment onsoil microbial community structure and activity varies withecosystem type, duration of N addition, and rate of N addition.Often, N enrichment alters osmotic potentials in soil solution,reduces soil pH and soil magnesium/calcium availability, and altersthe availability of soil C and N through aboveground litterproduction, which could alleviate microbial C limitation (Treseder,2008; Carreiro et al., 2000; Gutknecht et al., 2012).
The impacts of global change stressors affecting southernCalifornia may also depend on vegetation type. Grasslands andshrublands differ substantially in species composition as well asecosystem C and N dynamics (Wolkovich et al., 2010). Coastal sageshrub species show higher vulnerability to xylem cavitation thanchaparral or desert shrubs (Kimball et al., 2014), implying thatshrubland species may be particularly sensitive to drought. Suchdifferences in drought or N vulnerability could cause vegetation-specific changes in plant input chemistry or quantity withconsequences for soil C and N pools (Harpole et al., 2007; Follettet al., 2012).
In southern California, both precipitation change and Ndeposition may occur simultaneously. Therefore, we investigatedthe responses of microbial communities and soil C and N pools toaltered precipitation and N deposition with a factorial design ingrassland and shrubland vegetation types at the Loma Ridge GlobalChange Experiment, CA, USA. We hypothesized that (1) Thegrassland and the shrubland should differ in their soil responses toprecipitation and N manipulations; (2) Declining precipitationlevels should have a negative effect on soil microbial abundanceand soil C and N pools owing to declines in net primary production(Parolari et al., 2012); (3) Changes in microbial communitycomposition are associated with changes in plant communitycomposition under precipitation manipulation (Allison et al., 2013;Parolari et al., 2012); (4) N addition should increase soil microbialabundance, C pools, and N pools based on previous results at LomaRidge showing that N availability increases above-ground netprimary production (Parolari et al., 2012); and (5) Assuming theresponses to manipulation are additive, the positive effects of Naddition should offset the negative effects of drought in thecombined manipulation.
2. Materials and methods
2.1. Field site and experimental design
The Loma Ridge Global Change Experiment is located in theSanta Ana foothills within the Irvine Ranch National Landmark inOrange County, California (33.742 N, 117.704 W, elev. 365 m) on anortheast-facing slope (<10%). Soils are loamy, mixed, thermicTypic Palexeralfs sandy loams (California Soil Resource Lab, http://casoilresource.lawr.ucdavis.edu) formed on a several-meter-deepcolluvial deposit eroded from sedimentary rock of the Vaquerosformation (Potts et al., 2012). The vegetation at the site is a mosaicof non-native annual grassland (e.g. Bromus diandrus, Avena fatua
and Lolium multiflorium) and perennial, drought deciduousshrubland (e.g. Artemisia californica, Salvia melifera) (Potts et al.,2012). The grass to shrub boundary is not obviously related todifferences in soil texture, depth or pH. The grassland andshrubland soils have a consistent texture of 85.3% sand and finegravel, 7.6% silt, and 7.1% clay, with reduced clay content near thesurface presumably due to leaching (Goulden, unpublished data).
The grassland manipulation site is immediately northeast of thecoastal sage shrubland manipulation site (Kimball et al., 2014). Thesites experience a Mediterranean-type climate, with cool, wetwinters and dry, hot summers and annual mean precipitation of281 mm that falls mostly from November through April (TustinIrvine Ranch weather 1902–2003 from http://www.wrcc.dri.edu)(Parolari et al., 2012). The timing and size of precipitation eventsvary markedly both within and between years. Ambient precipita-tion ranged from 72 mm to 540 mm over the 7 years of theexperiment.
Factorial manipulations at Loma Ridge were initiated in 2007and include altered precipitation and N input. We used arandomized split-plot design with eight replicate blocks in eachvegetation type. Three levels of precipitation input were appliedwithin each block: ambient (control), ambient minus 40%(drought), and ambient plus 40% (added) (Fig. 1). Rainfall wasexcluded from the drought plots with retractable polyethyleneroofs that were closed during approximately half of the rain events(closed <5% of the days during a year); this approach reducedpotential climate artifacts (measurements show no effect on airtemperature or humidity when open) (Parolari et al., 2012; Kimballet al., 2014). Water draining from the roofs was collected inpolyethylene tanks for subsequent application to the addedprecipitation plots using pressure compensated drip tubing. Allplots were burned in 2007, shortly after the start of the experiment.Each plot was split lengthwise and half of each plot was fertilizedwhile the other half remained unfertilized. Plots were fertilizedwith 2 g N m�2 immediate-release calcium nitrate (15.5�0�0 + 19%Ca) prior to the growing season and 4 g N m�2 100-day releasecalcium nitrate during the growing season (Parolari et al., 2012).
2.2. Soil sampling and soil moisture
Soil samples were collected from all of the grassland andshrubland plots on August 20th, 2012. Three replicate cores (2.5 cmdiameter and 15 cm deep) were taken from each plot, combined,homogenized, and used for soil analysis. A sub-sample of thehomogenized core was frozen and freeze dried for lipid analysis(Microbial ID, Inc., Newark, DE).
The effect of precipitation treatment on volumetric soil watercontent (q) was measured using Frequency Domain Reflectometry

Fig. 2. Effect of vegetation types (grassland and shrubland) on biomarker classes.Error bars indicate standard errors (n = 6). Means within a group sharing the sameletter are not significantly different. TMB = total microbial biomass; G� = gramnegative bacteria; G+ = gram positive bacteria; AMF = arbuscular mycorrhizal fungi.
146 B. Khalili et al. / Applied Soil Ecology 107 (2016) 144–153
(FDR) or time-domain reflectometry (TDR; Mini-Trase, SantaBarbara, CA USA). Probes were installed vertically at the soilsurface, providing a measure of water content throughout theupper 15 cm of soil (u, m3m�3) (Parolari et al., 2012).
2.3. Labile and recalcitrant C and N pools
We used a two-step acid hydrolysis with H2SO4 as theextractant to determine the labile and recalcitrant C and N pools(Oades et al., 1970; Rovira and Vallejo, 2007). 500 mg soil washydrolyzed with 20 mL of 2.5 M H2SO4 in sealed Pyrex tubes at105 �C for 30 min; the hydrolysate was then recovered bycentrifugation. This hydrolysate was analyzed for labile C and Npool I (LCPI, LNPI) with a Shimadzu TOC/TN analyzer (ShimadzuCorporation, Kyoto, Japan). The residue was washed with waterand dried. The remaining residue was hydrolyzed with 2 mL of13 M H2SO4 overnight at room temperature under continuousshaking. After diluting the acid with de-ionized water to 1 M, theresidue was hydrolyzed for 3 h at 105 �C and the hydrolysate wasrecovered by centrifugation. This second hydrolysate was taken aslabile pool II and analyzed for C (LCPII) and N (LNPII) with aShimadzu TC analyzer. The labile pool I is composed mainly ofpolysaccharides of plant (hemi-cellulose and starch) and microbialorigin (mostly microbial cell walls) while the labile pool II iscomposed primarily of cellulose (Oades et al., 1970; Rovira andVallejo, 2007). We also measured total C and total N with a CarloErba elemental analyzer (Carlo-Erba, Milan, Italy). Recalcitrant C(RC) and N (RN) pools were calculated as the difference betweenthe total concentration of the elements and the labile pools (LPIand LPII summed together).
Table 1Analysis of variance P-values for ecosystem, precipitation manipulation, and nitrogen a
Factor Multivariate Total microbial biomass Fungi:bacteria
Ecosystem (E) <0.0001* <0.0001 0.0500
Precipitation (P) <0.0001 0.0003 <0.0001
Nitrogen (N) 0.0024 0.0385 0.0130
E � P 0.0062 0.5939 0.3222
E � N 0.6657 0.1605 0.5703
P � N 0.3295 0.1163 0.7801
E � P � N 0.8543 0.7664 0.7801
* Bold numbers are significant at P < 0.05.a AM = arbuscular mycorrhizal.
2.4. Microbial community analysis
Phospholipid fatty acids from microbial cell membranes wereextracted, purified, and characterized following Buyer and Sasser(2012). Soil samples were dried overnight and then a Bligh-Dyerlipid extraction was performed. The extract was dried, dissolved inchloroform and loaded onto a solid phase extraction plate.Phospholipids were eluted into glass vials, dried and trans-esterified. The resulting fatty acid methyl esters were analyzed byGC and quantified relative to an internal standard. The total nmollipid g�1 dry soil (sum of all lipids present, 20 or less C atoms inlength) was used as an index of microbial biomass (Zelles and Bai,1993; Frostegård and Bååth, 1996). Individual lipids were used asbiomarkers of broad microbial taxa: 16:1 v5c for arbuscularmycorrhizal fungi (Balser et al., 2005), 18:2 v6,9c for saprophyticfungi (Balser et al., 2005), 10-methyl fatty acids for actinobacteria(Zelles, 1999), monounsaturated fatty acids and cyclopropyl suchas 18:1 v9c for Gram-negative bacteria (Zelles, 1999), and iso andanteiso saturated branched fatty acids such as 15:0 iso for Gram-positive bacteria (Zelles, 1999). The fungal to bacterial ratio wascalculated as the average biomass of fungal lipid biomarkers (16:1v5c and 18:2 v6,9c) divided by the average biomass of bacteriallipid biomarkers (15:0 iso, 15:0 anteiso, 16:0 iso, 16:1 v7c; 16:0 10methyl; 17:0 iso, 17:0 anteiso,17:0 cyclo, 18:1 v7c, 18:1 v9c, 18:0 10methyl, and 19:0 cyclo v9c).
2.5. Statistics
Multivariate and univariate statistical analyses were performedon the microbial community profiles for the factorial treatmentwith a randomized split plot design for N and precipitationtreatments (N factor levels assigned randomly as the subplot,nested within precipitation treatments assigned as the main plots).Data were analyzed by analysis of variance (three-way ANOVA)using PROC MIXED, SAS Institute Inc., Cary, NC, USA, to examine theeffects of vegetation type (grassland vs. shrubland), precipitationregime (reduced, ambient and added) and N (ambient vs. addition),and their interactions, on the observed soil properties. Thedependent variables were total microbial biomass, fungal tobacterial ratio, Gram positive bacteria, Gram negative bacteria,actinomycetes, AM fungi, and saprophytic fungi phospholipid fattyacids, as well as soil total C and N and their labile and recalcitrantpools. Mean comparisons using Least Significant Difference (LSD)values were conducted if significant treatment effects were found.
Fatty acid profiles were classified and discriminated byprincipal components analysis (PCA) using XLSTAT Software(XLSTAT, 2012, Addinsoft, New York, NY). The factor loading scoresfor the individual fatty acid biomarkers were used to assess therelative importance of each individual biomarker in the calculationof the principal component axes. PCA plots mapped locations andtreatment combinations through loadings and scores in
ddition effects on soil microbial communities.
G+ bacteria G� bacteria Actinomycetes AMa Fungi SaprophyticFungi
<0.0001 0.0002 <0.0001 0.0007 0.00070.0003 0.0007 0.0003 <0.0001 0.01330.0137 0.0972 0.0426 0.0029 0.14500.7918 0.4501 0.7690 0.5475 0.59400.0931 0.1767 0.1784 0.2838 0.47250.0657 0.1308 0.0841 0.3270 0.38740.8983 0.6876 0.6563 0.9714 0.8171

Fig. 3. (a) Effect of vegetation types (grassland and shrubland) on soil carbon pools,(b) Effect of vegetation types (grassland and shrubland) on soil nitrogen pools. Errorbars indicate standard errors (n = 3). Means within a group sharing the same letterare not significantly different. TOC = total organic carbon; LCPI = labile carbon pool I;LCPII = labile carbon pool II; TN = total N; LNPI = labile nitrogen pool I; LNPII = labilenitrogen pool II.
B. Khalili et al. / Applied Soil Ecology 107 (2016) 144–153 147
dimensional spaces determined by PCs with eigenvalues >1.0based on Kaiser’s rule.
3. Results
3.1. Effects of vegetation type on microbial communities and C and Npools
Total microbial biomass, G+ bacteria, G� bacteria, AM fungi,saprophytic fungi and actinomycete lipid biomarkers and fungal tobacterial ratio were significantly greater in the grassland than the
Table 2Analysis of variance P-values for ecosystem, precipitation manipulation, and nitrogen adcarbon pool II; TN = total N; LNPI = labile nitrogen pool I; LNPII = labile nitrogen pool II.
Factor LCPI LCPII Recalcitrant C Tota
Ecosystem (E) 0.0175 0.0364 0.1074 0.37Precipitation (P) 0.0016 0.1592 0.0766 <0.0Nitrogen (N) <0.0001 0.2490 0.0274 <0.0E � P 0.0129 0.2258 0.1475 0.00E � N 0.0909 0.8696 0.5510 0.00P � N 0.1192 0.0035 0.2251 0.03E � P � N 0.0767 0.1522 0.0187 0.04
Bold numbers are significant at P < 0.05.
shrubland (Fig. 2, Table 1). Except for TOC and LNPII, all C and Npool sizes were significantly lower in shrubland than in grasslandsoils (Fig. 3a and b, Table 2).
3.2. Effects of precipitation manipulation and N addition on microbialcommunities
In general, microbial abundances in both ecosystems displayedqualitatively similar responses to precipitation and N manipu-lations (Fig. 4). Precipitation treatment significantly affected thefungal:bacterial ratio and all metrics of microbial abundance(Table 1) with lower values in the drought treatment than in theambient and addition treatments (Fig. 4). Particularly in shrubland,drought had a pronounced negative effect on total microbialbiomass, AM fungi, and G- bacteria (Fig. 4). Nitrogen addition had asignificant negative effect on fungal:bacterial ratios and allmicrobial abundances except G- bacteria and saprotrophic fungi(Table 1, Fig. 4).
The additive effects of drought and N tended to reducemicrobial abundance the most in the drought + N treatment.Compared to controls in the grassland and shrubland, thedrought + N treatment had a significant (P < 0.05) negative effecton total microbial biomass, G+ bacteria, G� bacteria, AM fungi, andactinomycetes compared to the control treatment in both thegrassland and shrubland, with the greatest decline in AM fungiabundance. Total microbial biomass decreased from 86.9 nmollipid g�1 dry soil in the control to 68.7 nmol lipid g�1 dry soil in thedrought + N treatment in the grassland, and from 63.4 nmol lipidg�1 dry soil to 47.0 nmol lipid g�1 dry soil in the shrubland (Fig. 4).There was also a significant negative effect of drought + Ntreatment on the fungal to bacterial ratio (P < 0.05) in bothvegetation types (Fig. 4). Saprotrophic fungi abundance in thedrought + N treatment was lower than in the control, although thedecline was not statistically significant (Fig. 4).
Principal components analysis reduced the PLFA biomarkersvariables to two factors (Fig. 5). PC 1 explained 75.04% of thevariance and was closely related to vegetation type. The second PC,which accounted for 7.1% of the variance, separated the droughttreatment from the ambient and added precipitation treatment.
3.3. Treatment effects on C pools
Total organic C pools were similar in the grassland andshrubland, although LCPI values were significantly lower in theshrubland (Table 2, Fig. 6). Nitrogen addition significantlyincreased LCPI, and both drought and added water treatmentsreduced LCPI, although there was an interaction betweenprecipitation and ecosystem type (Table 2, Fig. 6). Treatmenteffects on LCPII were minor, although there was a precipitation x Ninteraction whereby N had opposing effects in ambient and addedprecipitation treatments. For recalcitrant C, there was a three-wayinteraction (Table 2) whereby N addition increased values in theshrubland under ambient precipitation (Fig. 6). There were also
dition effects on carbon and nitrogen pools. LCPI = labile carbon pool I; LCPII = labile
l C LNPI LNPII Recalcitrant N Total N
57 0.0467 0.1180 0.0130 0.0031001 0.0003 0.0009 0. 0515 0.0002001 0.0039 0.0034 0.0024 <0.000108 0.9505 0.0386 0.1119 0.006812 0.0017 0.1973 0.0692 0.020790 <0.0001 <0.0001 0.4966 0.070142 0.0010 0.0006 0.2372 0.2407
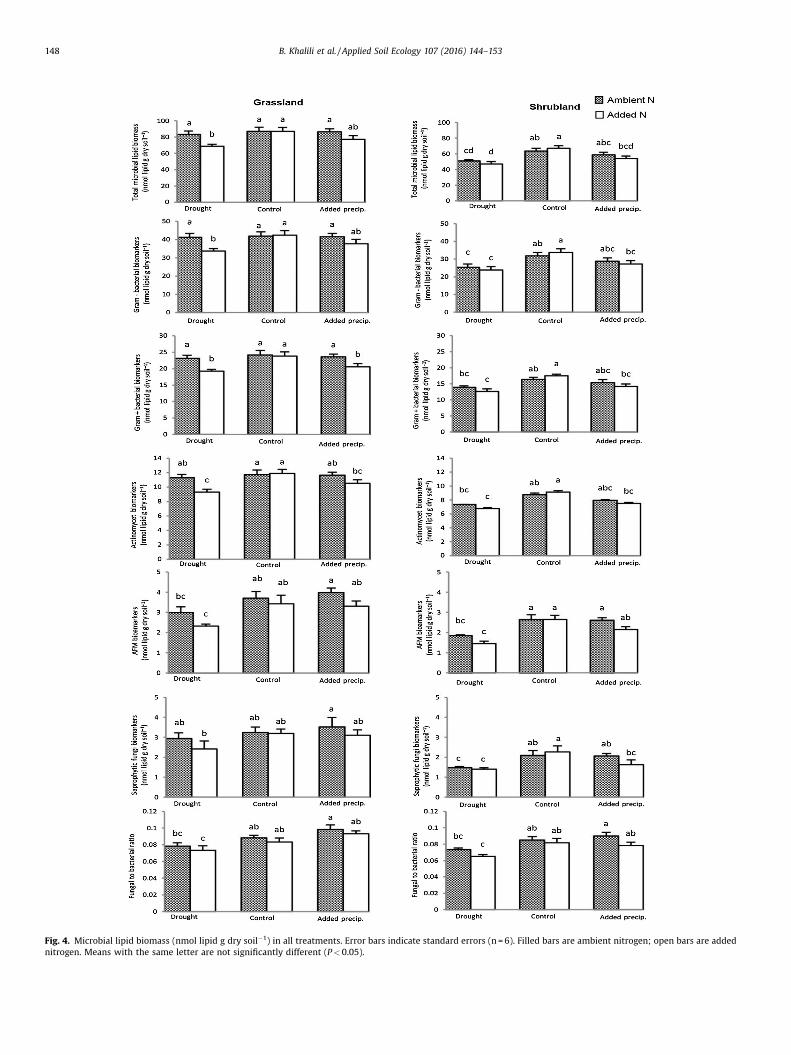
Fig. 4. Microbial lipid biomass (nmol lipid g dry soil�1) in all treatments. Error bars indicate standard errors (n = 6). Filled bars are ambient nitrogen; open bars are addednitrogen. Means with the same letter are not significantly different (P < 0.05).
148 B. Khalili et al. / Applied Soil Ecology 107 (2016) 144–153

Fig. 5. Ordination of 12 treatments in 2 ecosystem types based on PLFA biomarkers using principal components analysis (varimax rotation). The variance explained by eachprincipal component axis is shown in parentheses. Filled symbols are grassland (G), and open symbols are shrubland (S).
B. Khalili et al. / Applied Soil Ecology 107 (2016) 144–153 149
significant treatment interactions for total organic C (Table 2) suchthat N addition increased total C whereas drought and addedprecipitation reduced total C, particularly in the shrubland (Fig. 6).
3.4. Treatment effects on N pools
Total N and recalcitrant N were greater in the grassland than theshrubland, whereas the effect of vegetation type varied bytreatment for the labile N pools (Table 2, Fig. 7). For LNPI, therewere several treatment interactions (Table 2); N addition tended toincrease LNPI except in the added precipitation treatment (Fig. 7).There was a negative LNPI response to drought, but only in theshrubland under ambient N. We also observed many significanttreatment interactions for LNPII (Table 2), with the most notableresult being that N addition reduced LNPII under ambientprecipitation but increased LNPII under added precipitation(Fig. 7). Recalcitrant N increased significantly overall with Naddition (Table 2, Fig. 7), as did total N, although the total Nincrease was greater in shrubland.
4. Discussion
Across grassland and shrubland vegetation types, we quantifiedresponses of soil microbial communities and C and N pools to twointeracting global change factors: precipitation level and Naddition. Our comparison of vegetation types suggests thatshrublands are more sensitive to environmental change, whichcould possibly facilitate vegetation-type conversion of nativeshrubs to annual grassland (Wolkovich et al., 2010; Kimball et al.,2014). As predicted, drought reduced microbial abundance andaltered microbial community composition, especially in combina-tion with N addition. Also consistent with our initial hypotheses, Cand N pools responded to precipitation manipulations and Naddition. Drought and to some extent added precipitation reducedlabile C and N pools, especially in the shrubland, whereas Naddition and drought + N treatments increased the LNPI poolacross vegetation types. N addition also increased LCPI, total C, andtotal N pools in the shrubland. Our hypothesis about offsettingeffects drought and N addition was not supported because bothdrought and N addition had negative effects on microbial biomassthat combined in an additive way. Also, effects on the LNPI poolwere non-additive, with significantly greater pool sizes in thedrought + N treatment than expected from the single factors.
4.1. Effect of vegetation type on microbial communities and C and Npools
Differences in vegetation type contributed to differences inbelow-ground microbial biomass and composition (Figs. 2 and 4,Table 1). This result is likely explained by plant effects on thephysical and biochemical characteristics of the root zone, thequantity and quality of litter, and the availability of low-molecular-weight C and N (Wardle et al., 2004; Balser et al., 2010; Gutknechtet al., 2012; Bragazza et al., 2015). Different vegetation types mayalso result in differences in soil aeration, soil moisture (Fig. 8), andthe quality of resources available to microbes (Allison et al., 2010;Bragazza et al., 2015). In our system, inputs from grasslandvegetation to soil are likely higher in C:N ratio and carbohydratecontent but lower in lignin and N concentrations compared toshrubland inputs (Allison et al., 2013; Wolkovich et al., 2010).
4.2. Effects of precipitation manipulation and N addition on microbialcommunities
We found that both drought and N addition reduced microbialabundances, with the two treatments combining additively tostrongly reduce abundances in the drought + N treatment. Droughtmay negatively impact soil microbes through reduced input ofplant C into the rhizosphere (Bragazza et al., 2015; Bardgett et al.,2008). Increasing the soil water osmotic pressure along withreducing plant C allocation to fine roots and mycorrhizal symbiontsare mechanisms that could explain microbial biomass declinesunder N addition (Treseder, 2008; Carreiro et al., 2000; Gutknechtet al., 2012). Given that many California ecosystems experiencehigh rates of N deposition (Fenn et al., 2010), and that drought mayincrease with climate change (Seager and Vecchi, 2010), microbialabundances could decline substantially in these systems.
In our study site, where water and N availability play adominant role, fungal responses to drought and N treatments weremuch stronger than bacterial responses. Fungal:bacterial ratiosdeclined when drought was combined with N addition, mainly dueto lower fungal biomass in the drought + N treatments. Thepatterns we observed suggest that the sensitivity of AM fungi to Naddition is important for determining fungal versus bacterialabundance in our system.
Previous work at our site has shown that drought and Naddition treatments also have significant effects on litter microbial

Fig. 6. Soil carbon pools (g kg�1) in all treatments. Error bars indicate standard errors (n = 3). Filled bars are ambient nitrogen; open bars are added nitrogen. Means with thesame letter are not significantly different (P < 0.05).
150 B. Khalili et al. / Applied Soil Ecology 107 (2016) 144–153
biomass and community composition. Based on direct cell counts,bacterial biomass declines sharply with drought in grassland litter,whereas fungal biomass increases (Alster et al., 2013). Based ontaxonomic data from DNA sequencing, Methylobacterium was moreabundant in the N addition plots but decreased in relativeabundance in the drought plots (Matulich et al., 2015). Three ofthe most abundant fungal taxa declined significantly in relative
abundance in both the N addition and drought treatments(Matulich et al., 2015).
Surprisingly, total microbial biomass and most PLFA groups didnot respond positively to added precipitation (Fig. 4), even thoughthey responded negatively to drought. It is possible that increasesin soil water availability led to a temporal mismatch betweenresource availability and microbial demand, thereby constraining

Fig. 7. Soil nitrogen pools (g kg�1) at all treatments. Error bars indicate standard errors (n = 3). Filled bars are ambient nitrogen; open bars are added nitrogen. Means with thesame letter are not significantly different (P < 0.05).
B. Khalili et al. / Applied Soil Ecology 107 (2016) 144–153 151
soil microbial biomass. In support of this idea, we observedreductions in total and labile C pools, particularly in the shrublandunder added precipitation, consistent with reduced available Csupply to microbial biomass. Labile N (pool II) was also lower withadded precipitation across both vegetation types. The cause ofthese reductions in available C and N under added precipitation isunknown. They might be explained by declining belowgroundplant allocation with increasing soil moisture availability (Ye et al.,2015), but this explanation is not consistent with the observedrecovery of labile C pools when N is added in combination with
added precipitation (Fig. 7). Additional N is expected to reduce, notincrease, belowground C allocation.
4.3. Effects of drought and N addition on C and N pools
The organic C and N pools were more responsive to thetreatments in the shrubland than in the grassland (Figs. 6 and 7).Soil C and N pool responses may have resulted from shifts in C andN inputs and decomposer abundances and activities. Allison et al.(2013) showed that changes in vegetation cover were associated

Fig. 8. Mean 15-cm integrated soil moisture in grassland and shrubland.
152 B. Khalili et al. / Applied Soil Ecology 107 (2016) 144–153
with shifts in litter chemistry such as lignin, cellulose, sugars and Nconcentrations. Size and functioning of the decomposer commu-nity may be affected by these changes in the biochemicalcomposition of litter (Ball et al., 2014). We showed that soilmicrobial community abundances and composition were differentin the grassland versus the shrubland. These differences could inturn affect soil C and N pools.
Although N addition tended to increase C and N pool sizeswhereas drought tended to reduce them, there was a strikinginteraction between the factors in the most labile N pool (Table 2).Increases in labile N under drought + N may have occurred becauseof reduced biological demand for nutrients. In dry to average years,plant productivity responds negatively to the drought treatment,which could reduce plant N demand (Parolari et al., 2015; Kimballet al., 2014). We also observed a decline in microbial biomass underdrought + N which could reduce microbial nutrient demand. In wetyears, however, this accumulated N could become available toplants and microbes, thereby stimulating a pulse of productivity ifsufficient moisture is available to alleviate water limitation.
The overall labile C and N pool responses to N addition may bedriven by increasing aboveground litter production and higher litterquality following N fertilization (Allison et al., 2013; LeBauer andTreseder, 2008; Suding et al., 2005), which alter the supply of C and Nto soils (Bardgett et al., 2008; Ogunseitan, 2005). The observedresponse of LCPI and LNPI pools to N addition is consistent withprevious results at Loma Ridge that have reported increasedvegetation production with N fertilization (Parolari et al., 2012),and altered litter chemistry, whereby litter derived from the Naddition treatment had significantly higher N, cellulose, andhemicellulose, but significantly less lignin (Allison et al., 2013).Nitrogen addition could also indirectly affect soil C and N pools byshifting microbial enzyme activities toward degradation of specificlitter constituents and altering microbial composition (fungal tobacterialratios).Wefoundasignificantnegativecorrelationbetweenfungal to bacterial ratio and total soil N (r = �0.88, p = 0.0198).Significant increases in cellobiohydrolase, N-acetyl-glucosamini-dase, polyphenol oxidase, litter decomposition rate, and cumulativerespiration rate have also been reported in response to N addition inthe Loma Ridge grassland (Alster et al., 2013; Amend et al., 2015).These results imply that N addition affects both the inputs and lossesof soil C and N at the Loma Ridge site.
In contrast to N addition, drought generally caused a netreduction in soil C and N pools. The main mechanism by whichdrought might impact soil C and N pools is through reducedproduction of organic matter by plants. Parolari et al. (2015)showed that above-ground net primary production at Loma Ridge
was strongly limited by water availability. The role of microbes indriving soil C and N losses under drought is less clear. Droughttreatment has only minor effects on N cycling potential of littermicrobes (Nelson et al., 2015). Reductions in soil microbial biomassunder drought should lead to greater C storage, not less. Ingrassland litter at our site, drought reduces enzyme efficienciesand the potential for carbohydrate degradation by microbialcommunities (Alster et al., 2013; Berlemont et al., 2014) whichcould limit production of available C substrates. In addition,decomposition rates under drought may be affected by changes inthe chemistry of litter inputs (van der Molen et al., 2011). Droughthas altered plant community composition at Loma Ridge, leadingto increased inputs of litter lignin, sugars, and starch to grasslandsoil pools (Allison et al., 2013).
5. Conclusions
Overall, our results suggest that the combined effect of droughtand N addition, as might occur under environmental change insouthern California, is to suppress microbial biomass and cause abuild-up of labile N in the soil. This increase is ecologicallymeaningful because labile nutrients accumulated during drieryears with low plant and microbial nutrient demand couldstimulate productivity during wetter years. Labile C and N poolsalong with microbial abundance and composition showedpronounced responses to both drought and N deposition, whichmay contribute to the refinement of models that predict climatechange vulnerability. Our findings suggest that shrublands aremore sensitive to environmental change than grasslands, implyingthat ecosystem responses to precipitation and N deposition willdepend on vegetation type.
Acknowledgements
The Loma Ridge experiment was supported by the Office ofScience, US DOE (BER) Terrestrial Ecosystem Science Program andthe Microbial Communities and Carbon Cycling Program.
References
Allison, S.D., Wallenstein, M.D., Bradford, M.A., 2010. Soil-carbon response towarming dependent on microbial physiology. Nat. Geosci. 3, 336–340.
Allison, S.D., Lu, Y., Weihe, C., Goulden, M.L., Martiny, A.C., Treseder, K.K., Martiny, J.B., 2013. Microbial abundance and composition influence litter decompositionresponse to environmental change. Ecology 94, 714–725.
Alster, C.J., German, D.P., Lu, Y., Allison, S.D., 2013. Microbial enzymatic responses todrought and to nitrogen addition in a Southern California grassland. Soil Biol.Biochem. 64, 68–79.

B. Khalili et al. / Applied Soil Ecology 107 (2016) 144–153 153
Amend, A.S., Matulich, K.L., Martiny, J.B.H., 2015. Nitrogen addition not initialphylogenetic diversity, increases litter decomposition by fungal communities.Front. Microbiol. 6, 1–10.
Ball, B.A., Carrillo, Y., Molina, M., 2014. The influence of litter composition across thelitter-soil interface on mass loss: nitrogen dynamics and the decomposercommunity. Soil Biol. Biochem. 69, 71–82.
Balser, T.C., Treseder, K.K., Ekenler, M., 2005. Using lipid analysis and hyphal lengthto quantify AM and saprotrophic fungal abundance along a soilchronosequence. Soil Biol. Biochem. 37, 601–604.
Balser, T.C., Gutknecht, J.L.M., Liang, C., 2010. How will climate change impact soilmicrobial communities? In: Dixon, G.R., Tilston, E.L. (Eds.), Soil Microbiologyand Sustainable Crop Production. University of Reading, Reading, UK, pp. 373–397.
Bardgett, R.D., Freeman, C., Ostle, N.J., 2008. Microbial contributions to climatechange through carbon cycle feedbacks. ISME J. 2, 805–881.
Berlemont, R., Allison, S.D., Weihe, C., Lu, Y., Brodie, E.L., Martiny, J.B.H., Martiny, A.C.,2014. Cellulolytic potential under environmental changes in microbialcommunities from grassland litter. Front. Microbiol. 5, 639.
Bragazza, L., Bardgett, R.D., Mitchell, E.A.D., Buttler, A., 2015. Linking soil microbialcommunities to vascular plant abundance along a climate gradient. New Phytol.205, 1175–1182.
Buyer, J.S., Sasser, M., 2012. High throughput phospholipid fatty acid analysis ofsoils. Appl. Soil. Ecol. 61, 127–130.
Carreiro, M.M., Sinsabaugh, R.L., Repert, D.A., Parkhurst, D.F., 2000. Microbialenzyme shifts explain litter decay responses to simulated nitrogen deposition.Ecology 81, 2359–2365.
Castro, H.F., Classen, A.T., Austin, E.E., Norby, R.J., Schadt, C.W., 2010. Soil microbialcommunity responses to multiple experimental climate change drivers. Appl.Environ. Microb. 76, 999–1007.
Cayan, D.R., Das, T., Pierce, D.W., Barnett, T.P., Tyree, M., Gershunov, A., 2010. Futuredryness in the southwest US and the hydrology of the early 21st centurydrought. Proc. Natl. Acad. Sci. U. S. A. 107, 21271–21276.
Cregger, M.A., Schadt, C.W., McDowell, N.G., Pockman, W.T., Classen, A.T., 2012. Soilmicrobial community response to precipitation change in a semi-aridecosystem. Appl. Environ. Microb. 78, 8587–8594.
Fenn, M.E., Allen, E.B., Weiss, S.B., Jovan, S., Geiser, L.H., Tonnesen, G.S., Johnson, R.F.,Rao, L.E., Gimeno, B.S., Yuan, F., Meixner, T., Bytnerowicz, A., 2010. Nitrogencritical loads and management alternatives for N-impacted ecosystems inCalifornia. J. Environ. Manage. 91, 2404–2423.
Fierer, N., Ladau, J., Clemente, J.C., Leff, J.W., Owens, S.M., Pollard, K.S., Knight, R.,Gilbert, J.A., McCulley, R.L., 2013. Reconstructing the microbial diversity andfunction of pre-agricultural tallgrass prairie soils in the United States. Science342, 621–624.
Follett, R.F., Stewart, C.E., Pruessner, E.G., Kimble, J.M., 2012. Effects of climatechange on soil carbon and nitrogen storage in the US Great Plains. J. Soil WaterConserv. 67, 331–342.
Frostegård, Å., Bååth, E.,1996. The use of phospholipid fatty acid analysis to estimatebacterial and fungal biomass in soil. Biol. Fertil. Soils 22, 59–65.
Gutknecht, J.L., Field, C.B., Balser, T.C., 2012. Microbial communities and theirresponses to simulated global change fluctuate greatly over multiple years.Glob. Change Biol. 18, 2256–2269.
Harper, C.W., Blair, J.M., Fay, P.A., Knapp, A.K., Carlisle, J.D., 2005. Increased rainfallvariability and reduced rainfall amount decreases soil CO2 flux in a grasslandecosystem. Glob. Change Biol 11, 322–334.
Harpole, W.S., Potts, D.L., Suding, K.N., 2007. Ecosystem responses to water andnitrogen amendment in a California grassland. Glob. Change Biol. 13, 2341–2348.
Henry, H.A., Juarez, J.D., Field, C.B., Vitousek, P.M., 2005. Interactive effects ofelevated CO2, N deposition and climate change on extracellular enzyme activityand soil density fractionation in a California annual grassland. Glob. ChangeBiol. 11, 1808–1815.
IPCC, 2013. Summary for policymakers. In: Stocker, T.F., Qin, D., Plattner, G.K., Tignor,M., Allen, S.K., Boschung, J., Nauels, A., Xia, Y., Bex, V., Midgley, P.M. (Eds.),Climate Change 2013: The Physical Science Basis. Contribution of WorkingGroup I to the Fifth Assessment Report of the Intergovernmental Panel onClimate Change. Cambridge University Press, Cambridge.
Kimball, S., Goulden, M.L., Suding, K.N., Parker, S., 2014. Altered water and nitrogeninput shifts succession in a Southern California coastal sage community. Ecol.Appl. 24, 1390–1404.
LeBauer, D.S., Treseder, K.K., 2008. Nitrogen limitation of net primary productivity interrestrial ecosystems is globally distributed. Ecology 89, 371–379.
Matulich, K.L., Weihe, C., Allison, S.D., Amend, A.S., Berlemont, R., Goulden, M.L.,Kimball, S., Martiny, A.C., Martiny, J.B., 2015. Temporal variation overshadowsthe response of leaf litter microbial communities to simulated global change.ISME J. 9, 2477–2489.
Nelson, M.B., Berlemont, R., Martiny, A.C., Martiny, J.B., 2015. Nitrogen cyclingpotential of a grassland litter microbial community. Appl. Environ. Microbiol.81, 7012–7022.
Niboyet, A., Le Roux, X., Dijkstra, P., Hungate, B.A., Barthes, L., Blankinship, J.C.,Brown, J.R., Field, C.B., Leadley, P.W., 2011. Testing interactive effects of globalenvironmental changes on soil nitrogen cycling. Ecosphere 2, 1–24.
Oades, J.M., Kirkman, M.A., Wagner, G.H., 1970. The use of gas-liquidchromatography for the determination of sugars extracted from soils by sulfuricacid. Soil Sci. Soc. Am. J. 34, 230–235.
Ogunseitan, O., 2005. Microbial Diversity: Form and Function in Prokaryotes. JohnWiley & Sons.
Parolari, A.J., Goulden, M.L., Bras, R.L., 2012. Fertilization effects on the ecohydrologyof a southern California annual grassland. Geophys. Res. Lett. 39, L08405.
Parolari, A.J., Goulden, M.L., Bras, R.L., 2015. Ecohydrological controls on grass andshrub above-ground net primary productivity in a seasonally dry climate.Ecohydrology 10, 1605.
Potts, D.L., Suding, K.N., Winston, G.C., Rocha, A.V., Goulden, M.L., 2012. Ecologicaleffects of experimental drought and prescribed fire in a southern Californiacoastal grassland. J. Arid Environ. 81, 59–66.
Rosenstein, R.W., Boutton, T.W., Tjoelker, M., Volder, A., Briske, D.D., 2011. Soil C andN pools in oak savanna: Responses to temperature and rainfall manipulation. InAGU Fall Meeting Abstracts, 1, 390.
Rovira, P., Vallejo, Ramón, 2007. Labile, recalcitrant, and inert organic matter inMediterranean forest soils. Soil Biol. Biochem. 39, 202–215.
Seager, R., Vecchi, G.A., 2010. Greenhouse warming and the 2st centuryhydroclimate of southwestern North America. Proc. Natl. Acad. Sci. U. S. A. 107,21277–21282.
Song, B., Niu, S., Zhang, Z., Yang, H., Li, L., Wan, S., 2012. Light and heavy fractions ofsoil organic matter in response to climate warming and increased precipitationin a temperate steppe. PloS One 7, e33217.
Suding, K.N., Collins, S.L., Gough, L., Clark, C., Cleland, E.E., Gross, K.L., Milchunas, D.G., Pennings, S., 2005. Functional-and abundance-based mechanisms explaindiversity loss due to N fertilization. Proc. Natl. Acad. Sci. U. S. A. 102, 4387–4392.
Tiemann, L.K., Billings, S.A., 2011. Changes in variability of soil moisture altermicrobial community C and N resource use. Soil Biol. Biochem. 43, 1837–1847.
Todd-Brown, K.E., Hopkins, F.M., Kivlin, S.N., Talbot, J.M., Allison, S.D., 2012. Aframework for representing microbial decomposition in coupled climatemodels. Biogeochemistry 109, 19–33.
Treseder, K.K., Balser, T.C., Bradford, M.A., Brodie, E.L., Dubinsky, E.A., Eviner, V.T.,Hofmockel, K.S., Lennon, J.T., Levine, U.Y., MacGregor, B.J., Pett-Ridge, J.,Waldrop, M.P., 2012. Integrating microbial ecology into ecosystem models:challenges and priorities. Biogeochemistry 109, 7–18.
Treseder, K.K., 2008. Nitrogen additions and microbial biomass: a meta-analysis ofecosystem studies. Ecol. Lett. 11, 1111–1120.
Wardle, D.A., Bardgett, R.D., Klironomos, J.N., Setala, H., van der Putten, W.H., Wall,D.H., 2004. Ecological linkages between aboveground and belowground biota.Science 304, 1629–1633.
Wolkovich, E.M., Lipson, D.A., Virginia, R.A., Cottingham, K.L., Bolger, D.T., 2010.Grass invasion causes rapid increases in ecosystem carbon and nitrogen storagein a semiarid shrubland. Glob. Change Biol. 16, 1351–1365.
Ye, X.H., Pan, X., Cornwell, W.K., Gao, S.Q., Dong, M., Cornelissen, J.H.C., 2015.Divergence of above-and belowground C and N pool within predominant plantspecies along two precipitation gradients in North China. Biogeosciences 12,457–465.
Zelles, L., Bai, Q.Y., 1993. Fractionation of fatty acids derived from soil lipids by solidphase extraction and their quantitative analysis by GC–MS. Soil Biol. Biochem.25, 495–507.
Zelles, L., 1999. Fatty acid patterns of phospholipids and lipopolysaccharides in thecharacterisation of microbial communities in soil: a review. Biol. Fertil. Soils 29,111–129.
van der Molen, M.K., Dolman, A.J., Ciais, P., Eglin, T., Gobron, N., Law, B.E., Meir, P.,Peters, W., Phillips, O.L., Reichstein, M., Chen, T., Dekker, S.C., Doubkov’a, M.,Friedl, M.A., Jung, M., van den Hurk, B.J.J.M., de Jeu, R.A.M., Kruijt, B., Ohta, T.,Rebel, K.T., Plummer, S., Seneviratne, S.I., Sitch, S., Teuling, A.J., van der Werf, G.R., Wang, G., 2011. Drought and ecosystem carbon cycling. Agric. ForestMeteorol. 151, 765–773.