Expression of epidermal growth factor receptor in human gastric and colonic carcinomas
Upload
khangminh22Category
view
1download
0
HAL Id: hal-01173417https://hal.archives-ouvertes.fr/hal-01173417
Submitted on 27 May 2020
HAL is a multi-disciplinary open accessarchive for the deposit and dissemination of sci-entific research documents, whether they are pub-lished or not. The documents may come fromteaching and research institutions in France orabroad, or from public or private research centers.
L’archive ouverte pluridisciplinaire HAL, estdestinée au dépôt et à la diffusion de documentsscientifiques de niveau recherche, publiés ou non,émanant des établissements d’enseignement et derecherche français ou étrangers, des laboratoirespublics ou privés.
High-protein diet modifies colonic microbiota andluminal environment but not colonocyte metabolism inthe rat model: the increased luminal bulk connectionXinxin Liu, Jean-Marc Blouin, Arlette Santacruz, Annaig Lan, MireilleAndriamihaja, Sabina Wilkanowicz, Pierre-Henri Benetti, Daniel Tomé,
Yolanda Sanz, Francois Blachier, et al.
To cite this version:Xinxin Liu, Jean-Marc Blouin, Arlette Santacruz, Annaig Lan, Mireille Andriamihaja, et al.. High-protein diet modifies colonic microbiota and luminal environment but not colonocyte metabolism inthe rat model: the increased luminal bulk connection. AJP - Gastrointestinal and Liver Physiology,American Physiological Society, 2014, 307 (4), pp.G459 - G470. �10.1152/ajpgi.00400.2013�. �hal-01173417�
High-protein diet modifies colonic microbiota and luminal environment butnot colonocyte metabolism in the rat model: the increased luminal bulkconnection
Xinxin Liu,1 Jean-Marc Blouin,1 Arlette Santacruz,2 Annaïg Lan,1 Mireille Andriamihaja,1
Sabina Wilkanowicz,2 Pierre-Henri Benetti,1 Daniel Tomé,1 Yolanda Sanz,2 François Blachier,1
and Anne-Marie Davila1
1UMR914 Institut National de la Recherche Agronomique/AgroParisTech, Nutrition Physiology and Ingestive Behavior, Paris,France; and 2Microbial Ecophysiology and Nutrition Research Group, Institute of Agrochemistry and Food Technology,Spanish National Research Council, Valencia, Spain
Submitted 21 November 2013; accepted in final form 18 June 2014
Liu X, Blouin JM, Santacruz A, Lan A, Andriamihaja M, Wilkano-wicz S, Benetti PH, Tomé D, Sanz Y, Blachier F, Davila AM. High-protein diet modifies colonic microbiota and luminal environment but notcolonocyte metabolism in the rat model: the increased luminal bulk connec-tion. Am J Physiol Gastrointest Liver Physiol 307: G459–G470, 2014. Firstpublished June 26, 2014; doi:10.1152/ajpgi.00400.2013.—High-protein di-ets are used for body weight reduction, but consequences on the largeintestine ecosystem are poorly known. Here, rats were fed for 15 dayswith either a normoproteic diet (NP, 14% protein) or a hyperproteic-hypoglucidic isocaloric diet (HP, 53% protein). Cecum and colonwere recovered for analysis. Short- and branched-chain fatty acids, aswell as lactate, succinate, formate, and ethanol contents, were mark-edly increased in the colonic luminal contents of HP rats (P � 0.05 orless) but to a lower extent in the cecal luminal content. This wasassociated with reduced concentrations of the Clostridium coccoidesand C. leptum groups and Faecalibacterium prausnitzii in both thececum and colon (P � 0.05 or less). In addition, the microbiotadiversity was found to be higher in the cecum of HP rats but waslower in the colon compared with NP rats. In HP rats, the colonic andcecal luminal content weights were markedly higher than in NP rats(P � 0.001), resulting in similar butyrate, acetate, and propionateconcentrations. Accordingly, the expression of monocarboxylate trans-porter 1 and sodium monocarboxylate transporter 1 (which is in-creased by higher butyrate concentration) as well as the colonocytecapacity for butyrate oxidation were not modified by the HP diet,whereas the amount of butyrate in feces was increased (P � 0.01). Itis concluded that an increased bulk in the large intestine contentfollowing HP diet consumption allows maintenance in the luminalbutyrate concentration and thus its metabolism in colonocytes despitemodified microbiota composition and increased substrate availability.
protein; microbiota; SCFA; transport; metabolism
HIGH-PROTEIN (HP) diets are commonly used for body weightloss (36, 38). In fact, such diets have been shown to increasesatiety, to modify lipid metabolism, and to facilitate short- andmiddle-term weight reduction (24, 61, 72). However, the con-sequences on gut microbiota composition, on microbial-de-rived metabolites in the large intestine luminal content, and oncolonocyte epithelial cell metabolic capacities have been littlestudied.
Increasing protein intake induces an increase in the propor-tion of nitrogenous compounds, mainly protein, peptides, and
to a lesser extent amino acids, entering the large intestine (13,23, 25, 51, 64). They are subjected to luminal proteolysis andsubsequent metabolism by the large number of microorganismsof the large intestine microbiota (about 1011 to 1012 viablebacteria/g content) (29) leading to the production of numerousamino acid-derived metabolites (53), including phenols, in-doles, amines, sulfide, ammonia, and monocarboxylic acids.Monocarboxylic acids include short-chain fatty acids (SCFA),branched-chain fatty acids (BCFA) and several other organicacids. In contrast to SCFA, which are produced from indigest-ible carbohydrates, other metabolites such as BCFA are pro-duced by the microbiota exclusively from amino acids (55).Changes in diet composition may affect the composition andmetabolic activities of the microbiota that adapts to the newcolonic luminal environment and substrate availability. Phylacomposing the microbiota are known to be quite stable overtheir lifetime, but the dietary composition influences the repar-tition of species and functional groups (69). This has beenparticularly documented for carbohydrates, fibers, and morerecently for fat-rich diets (35, 48). In contrast, few studies haveaddressed the influence of protein-rich diet on the compositionand activity of the gut microbiota (8).
The colonic luminal environment may influence colonicepithelial cell metabolic capacities. SCFA and other monocar-boxylic acids like lactate are absorbed from the lumen to thecolonocyte cytosol by transport processes involving the mono-carboxylate transporter 1 (MCT1), the protein CD147 (thatparticipates to the apical expression of MCT1), and the sodiummonocarboxylate transporter 1 (SMCT1) (11, 57). The ab-sorbed components are partly metabolized mainly throughoxidation pathways and used as energy substrates by colonicepithelial cells, with the unmetabolized fractions being recov-ered in the portal blood plasma and used by other tissues (3,45). These bacterial metabolites, and particularly butyrate, areinvolved in numerous processes regarding colonocytes metab-olism and physiology, including expression of MCT1 (10, 16),sodium-dependent fluid absorption (6), cell proliferation (20),histone acetylation, and gene expression (1, 20). Indeed, bu-tyrate is considered as the preferential oxidative substrate forcolonocytes (19, 58). In contrast to butyrate and propionate,which are mainly metabolized by the intestinal mucosa andliver, acetate is recovered in significant amount in the systemicblood (45).
The present study aims to evaluate the influence of HP dieton the composition of the intestinal microbiota, on the com-
Address for reprint requests and other correspondence: A.-M. Davila,UMR914 INRA/AgroParisTech, Nutrition Physiology and Ingestive Behavior,Paris, France (e-mail: [email protected]).
Am J Physiol Gastrointest Liver Physiol 307: G459–G470, 2014.First published June 26, 2014; doi:10.1152/ajpgi.00400.2013.
0193-1857/14 Copyright © 2014 the American Physiological Societyhttp://www.ajpgi.org G459
by 10.220.33.2 on Decem
ber 1, 2016http://ajpgi.physiology.org/
Dow
nloaded from
position of SCFA, BCFA, and other organic acids in cecal andcolonic contents, and on putative modifications of energymetabolism in colonic epithelial cells. The central role ofbutyrate on colonocyte physiology suggests the necessity of anexquisite regulation of butyrate availability for both energyproduction and gene expression in these cells (1, 2, 34, 62, 65).Thus, we evaluated if the modifications of the gut ecosystemfollowing HP diet ingestion are associated with metabolicchanges toward butyrate (and other energy substrates) in iso-lated colonic epithelial cells or if, conversely, metabolic ho-meostasis is maintained in these cells after such a dietarymodification.
MATERIALS AND METHODS
Animals, diets, and colonocyte isolation. Wistar male rats (150 g)were acclimatized for 6 days to receive a standard rodent dietcontaining 16% (wt/wt) protein. Then they were randomly allocated toeither normoproteic diet (NP) diet containing 14% (wt/wt) protein orHP isocaloric diet (by decreasing digestible carbohydrates) containing53% (wt/wt) protein (Table 1). After 15 days of experimental diet,animals were anesthetized with pentobarbital sodium (40 mg/kg bodywt), and total cecal and colonic luminal contents were collected byexpulsion. Luminal contents (0.2 g) were taken after homogenizationfor bacterial DNA extraction, and the remaining was frozen in liquidnitrogen and kept at �80°C for subsequent analysis. The whole colon
was used for colonocyte isolation using the perfusion method withEDTA as described (52). The present protocol received writtenagreement from the local animal ethical committee (COMETHEA atJouy-en-Josas, France, Nos. 11/042 and 12/090).
Bacterial DNA extraction. Bacterial DNA extraction of fresh cecaland colonic luminal contents was performed with a QIAamp DNAStool Mini kit (Qiagen). The DNA concentration and purity weremeasured with Nanodrop. The DNA integrity was confirmed byelectrophoresis on agarose gel with Gelred staining. Extracted bacte-rial DNA was normalized to 30 ng/�l for subsequent real-time qPCRassay.
Analysis of microbiota composition by real-time qPCR. The mainbacterial groups of the intestinal microbiota were quantified by real-time qPCR using specific primers (Table 2) and SYBR Green I Mastermix (Roche Diagnostics) in a LightCycler 480 instrument (RocheDiagnostics) as previously described (59). The bacterial groups in-cluded total bacteria, Bifidobacterium, Lactobacillus group, Bacte-roides fragilis group, Clostridium coccoides group, C. leptum group,Enterobacteriaceae, Desulfovibrio spp., and Faecalibacterium praus-nitzii. Standard curves of each bacterial group were generated fromserial dilutions of a known copy number of the target gene cloned intoa plasmid vector. For each reference strain, the 16S rRNA gene wascloned into a pGEM-T Easy Vector System (Promega). An Esche-richia coli strain was transformed with the recombinant plasmid, andplasmid DNA was extracted from E. coli by the miniprep method.
Denaturing gradient gel electrophoresis. PCR amplifications withuniversal primers and denaturing gradient gel electrophoresis (DGGE)analysis were performed as described (60). Renyi’s entropy (diversityprofile) was used to explore differences in bacterial species detectedby DGGE and DNA sequencing between the different diets. Theformula of Renyi’s entropy is:
H� �In��i�1
S Pi��
1 � �
where S is the number of species in the sample and Pi is the proportionof the species i in the sample. Diversity profiles are calculated bychanging the value of � from zero to infinity. Their graphical displayprovides diversity ordering of samples. A sample profile always abovethe profile of another sample indicates a higher diversity. The shape ofthe profile is an indication of evenness. The flatter the curve is, thehigher the evenness is. Renyi’s entropy also provides information on
Table 1. Composition of the experimental diets
NP HP
Ingredients, g/kgWhole milk proteins 140 530Sucrose 100 45.7Corn starch 622.4 287Mineral mixture AIN 93-M# 35 35Vitamin mixture AIN 93-V# 10 10Soybean oil 40 40Cellulose 50 50Choline 2.3 2.3
Energy, kJ/g 14.6 14.6
NP, normoproteic diet; HP, high-protein diet.#Data from Ref. 56.
Table 2. Primers used for bacterial DNA amplification for microbiota composition analysis
Target Bacterial Group/Species Designation Primer (5=-3=) Squence Annealing Temperature, °C
Total bacteria HAD F TGGCTCAGGACGAACGCTGGCGGC 59a
HAD R CCTACTGCTGCCTCCCGTAGGAGTBifidobacterium g-Bifid F CTCCTGGAAACGGGTGG 55b
g-Bifid R GGTGTTCTTCCCGATATCTACALactobacillus group Lac F AGCAGTAGGGAATCTTCCA 61c
Lac R ATTYCACCGCTACACATGBacteroides fragilis group Bfra 531 F ATAGCCTTTCGAAAGRAAGAT 50b
Bfra 766 R CCAGTATCAACTGCAATTTTAClostridium coccoides group Ccoc F AAATGACGGTACCTGACTAA 50b
Ccoc R CTTTGAGTTTCATTCTTGCGAAC. leptum group Clep F GCACAAGCAGTGGAGT 50d
Clep R CTTCCTCCGTTTTGTCAAEnterobacteriaceae Entero F CATTGACGTTACCCGCAGAAGAAGC 63c
Entero R CTCTACGAGACTCAAGCTTGCDefulfovibrio spp. Desulf.spp F GGTACCTTCAAAGGAAGCAC 58e
Desulf.spp R GGGATTTCACCCCTGACTTAFaecalibacterium prausnitzii F.praus F CCCTTCAGTGCCGCAGT 61e
F.praus R GTCGCAGGATGTCAAGAC
F, forward primer; R, reverse primer. The program of PCR was as follows: initial denaturation at 95°C for 5 min; 40 cycles of denaturation at 95°C for 10s, annealing at primer-specific temperature for 10 s and extension at 72°C for 30 s; and melting curve at 95°C for 5 s, 65°C for 1 min, and 98°C continuousfollowed by cooling to 40°C. Data from Refs. 70 (a), 49 (b), 12 (c), 50 (d), and 47 (e).
G460 HIGH-PROTEIN DIET AND LARGE BOWEL
AJP-Gastrointest Liver Physiol • doi:10.1152/ajpgi.00400.2013 • www.ajpgi.org
by 10.220.33.2 on Decem
ber 1, 2016http://ajpgi.physiology.org/
Dow
nloaded from

three further diversity index values: species richness for � � 0,Shannon index for � � 1, and Simpson index for � � 2. (68).
Analysis of SCFA, BCFA, and other organic acids in luminalcontents and in feces. Cecal and colonic contents recovered at deathwere immediately weighted. The feces were recovered during the 3days before death. All of the organic acids and ethanol were extractedfrom contents and feces by vigorous homogenization with dilutedultrapure water followed by centrifugation (14,000 g, 15 min at 4°C).The SCFA and BCFA in the supernatants were then derivatized byesterification and analyzed with a gas chromatograph equipped with acapillary column (30 m, 0.32 mm ID; RestekRtx 502.2) and fitted witha flame ionization detector using a modification of the method ofKristensen et al. (39). The amounts of SCFA and BCFA weredetermined by external standards with reference to internal standards.Formate, L- and D-lactate, succinate, and ethanol were measured incecal and colonic samples using the Megazyme biochemical assay kits(Megazyme) according to the manufacturer’s instructions. To calcu-late the percentages of ingested energy lost in feces as SCFA, we usedthe corresponding values as defined by Livesey and Elia (42) withacetate representing 3.48 kcal/g, propionate representing 4.93 kcal/g,and butyrate representing 5.92 kcal/g.
Metabolic assays in isolated colonocytes. Isolated colonocyteswere resuspended in Krebs-Henseleit bicarbonate-buffered medium(pH 7.4), enriched with 10 mg/ml BSA. The incubation medium wasequilibrated against a mixture of O2-CO2 (19:1, vol/vol). D-Glucose,L-glutamine, n-butyrate, and L-lactate oxidation by isolated colono-cytes was carried out at 37°C in the incubation medium containing 5mM D-glucose containing tracer amounts of D-[1-14C]glucose, 1 mML-glutamine containing tracer amount of L-[U-14C]glutamine, 2 mMsodium butyrate containing tracer amount of n-[1-14C]butyrate (so-dium salt), or 2 mM L-lactate containing tracer amount of L-[U-14C]lactate. The incubation was stopped with perchloric acid (3% finalconcentration), and radioactive CO2 was measured by liquid scintil-lation after trapping in methylbenzethonium hydroxide. Lactate pro-duction by colonocytes from 5 mM D-glucose was determined in theincubation medium using a colorimetric system as described by themanufacturer’s instructions (Biovision/Clinisciences).
Gene expression analysis in colonocytes. Total RNA was extractedfrom isolated colonocytes using Trizol extraction derived from themethod of Chomczynski and Sacchi (14). A subsequent step of DNaseand purification was done with the RNeasy Mini Kit and DNase I(Qiagen). Next, sample quality was controlled by the 260-to-280 nmabsorption ratio measured with Nanodrop (between 1.8 and 2.0) andchecked on 1% agarose gel. For real-time RT-PCR analyses, 1 �gtotal RNA was first reverse transcribed using the High CapacitycDNA Archive kit (Applied Biosystems). Reverse-transcribed RNA(5 ng of cDNA) were amplified on a thermal cycler (ABI prism 7900HT; Applied Biosystems) using the SYBR green fluorescence methodand specific primers (Table 3). Results were analyzed with the SDS2.1 real-time detection system software. Quantification of RNA wascarried out by comparison of the number of cycles required to reachreference and target threshold values (�-�Ct method) and was nor-malized using Ribosomal Protein L13a (Rpl13a) mRNA.
Western blot analysis of MCT1 and SMCT1 in colonocytes. Thecell surface expression of MCT1 and SMCT1 was achieved using thecell surface protein isolation kit (Pierce Biotechnology). Briefly,
surface proteins of isolated colonocytes were biotinylated with themembrane-impermeant reagent Sulfo-NHS-LC-Biotin during 30 minat 4°C. The reaction was quenched, and, after a washing step,membrane proteins were solubilized by incubation in Triton X-100-containing buffer. Biotinylated proteins were bound to ImmunoPureimmobilized streptavidin (Pierce), washed three times, and then dis-solved in 62.5 mM Tris·HCl, pH 6.8, with 50 mM DTT.
Equal amounts of protein were loaded on 4–12% NuPAGENovexBis-Tris gel (Invitrogen) and run using 1� NuPage MES buffer. TheXCellSureLock Mini Cell (Invitrogen) was used for electrophoresis.Protein was then transferred to Hybond ECL membranes that wereblocked for 2 h at room temperature using 1� Tris-buffered saline(TBS, pH 7.5), 0.05% Tween 20, and 5% (wt/vol) nonfat dry milk andincubated overnight (4°C) with polyclonal antisera raised against ratMCT1 (1:5,000; Millipore) or rat SMCT1 (1:500; Santa Cruz Bio-technologies) diluted in 1� TBS (pH 7.5), 0.05% Tween 20, and 5%(wt/vol) BSA. Nitrocellulose membranes were then washed with 1�TBS and 0.05% Tween 20 and incubated for 1 h at room temperaturewith horseradish peroxidase-linked secondary antibody anti-chickenIgG to reveal MCT1 or anti-goat to reveal SMCT1. Bound antibodywas visualized using the ECL (Enhanced ChemiLuminescence) sys-tem according to the manufacturer’s instructions (Pierce Biotechnol-ogy).
Immunofluorescence analysis of MCT1 and SMCT1 in colon. Forimmunohistochemical studies, segments of colon were immediatelyfixed in 4% paraformaldehyde and embedded in paraffin. Four-micrometer tissue sections were subjected to deparaffinization andwashed with TBS plus 0.025% Triton X-100. Nonspecific bindingsites were then blocked for 2 h at room temperature with TBS plus 1%BSA and 10% normal serum. Next, the sections were incubated withMCT1 antibody (1:500) and SMCT1 antibody (1:100) diluted in TBSplus 1% BSA in a humidified chamber at 4°C overnight. Subse-quently, the sections were washed two times in TBS plus 0.025%Triton X-100 and exposed for 1 h to AlexaFluor 488-conjugatedsecondary antibodies diluted in TBS plus 1% BSA. After beingwashed in TBS, sections were mounted using Vectashield mountingmedium (Vector Laboratories).
Statistical analysis. The results are expressed as mean values SE.Statistical analyses were performed by using SAS 9.1 (SAS Institute,Cary, NC). Rats’ body weight and food intake analysis were per-formed using the mixed model for repeated-measure analysis, and thedifferences between NP and HP groups at each time point are revealedby Tukey’s post hoc test. The Welch’s t-test was used to compare twogroups. The difference in microbiota composition was analyzed byMann-Whitney-Wilcoxon test. The prevalence of bacterial speciesidentified by PCR-DGGE was analyzed by Fisher’s test. Differenceswith P values �0.05 were considered as statistically significant.
RESULTS
Body weight gain and weight of the cecal and coloniccontents. Differences in rat weight gain of the HP groupcompared with the NP group were significantly more markedin the second half of diet intervention (Fig. 1A), whereas thedifferences in their daily food intake were more marked in the
Table 3. Primers used for gene expression analysis in isolated rat colonocytes
RNA Accession No. Forward Primer (5=-3=) Sequence Reverse Primer (5=-3=) Sequence
Mct1 NM 012716.2 GCAACGACCAGTGAAGTGT AAGCCCAAGACCTCCAATSmct1 NM 001191987.1 CTGGGCTTGTTTTCTTTGG CGTTGTGCGTGCTGTTACCd147 NM 001109882.1 AGTGAGGGAGAGTTTGTGAAG TCAGTGCCGTTGGAGATAGRpl13a NM 173340.2 GGATCCCTCCACCCTATGACA CTGGTACTTCCACCCGACCTC
Mct1, monocarboxylate transporter 1; Smct1, sodium monocarboxylate transporter 1. The program of PCR was as follows: 95°C for 10 min, followed by 40cycles of 15 s at 95°C, 1 min at 60°C.
G461HIGH-PROTEIN DIET AND LARGE BOWEL
AJP-Gastrointest Liver Physiol • doi:10.1152/ajpgi.00400.2013 • www.ajpgi.org
by 10.220.33.2 on Decem
ber 1, 2016http://ajpgi.physiology.org/
Dow
nloaded from

first half (Fig. 1B). The weight of the cecal and colonic luminalcontents was increased by 136 and 172%, respectively, in HPanimals compared with NP animals (Fig. 1, C and D).
Microbiota composition, biodiversity, and species prevalence.The results of the effects of the HP diet on gut microbiotacomposition determined by real-time PCR are shown inTable 4. The total bacterial concentration was slightly butsignificantly decreased (1.3-fold) in the colon of HP animalscompared with NP animals. However, total bacterial con-centrations detected in the cecal luminal contents weresimilar between NP and HP animals. C. coccoides groupgene copy numbers had a 4.3- and 1.6-fold decline in cecumand colon of HP animals, respectively, compared with NPdiet. A marked decrease of C. leptum group gene copynumbers was also detected in cecum and colon of the HPgroup with, respectively, 2.2- and 3.4-fold change comparedwith NP animals. Finally F. prausnitzii gene copy numberswere dramatically decreased in both cecum (2.3-fold) and
colon (4.6-fold) after HP diet. The concentrations of Bifi-dobacterium, Lactobacillus group, B. frafilis group, Enter-obacteriaceae, and Desulfovibrio spp. did not differ signif-icantly between the HP and NP groups.
Bacterial community fingerprint in the cecal and colonicluminal contents was analyzed by PCR-DGGE. The DNAbanding pattern obtained was used to determine the speciesdiversity with the Renyi’s entropy (Fig. 2). HP diet consump-tion compared with NP diet increased diversity, richness, andevenness in cecum. By contrast, HP diet consumption de-creased diversity and richness in colon but had no effect onevenness. Whatever the diet, gut microbiota displayed greaterdiversity and richness in cecal contents than in colonic con-tents. With NP diet, evenness was lower in cecum than incolon. With HP diet, evenness became similar in cecum andcolon.
The assignment of PCR-DGGE bands to bacterial species(Table 5) shows an increased number of different bacterialspecies identified by PCR-DGGE (90% identity in the Gen-Bank using the BLAST algorithm) in cecal content than incolonic content. Several of these bacterial species had signif-icantly higher or lower prevalence with the HP diet dependingon the bacterial species. Clostridium sp. had significantly lowerprevalence (0%) in both colonic and cecal contents with the HPdiet than with the NP diet. These results are consistent with thatobtained by the absolute quantification by real-time PCR,where two important groups of Clostridium were decreased. B.vulgatus was also identified in both cecal and colonic contents,with an increased prevalence after the HP diet only in cecalcontent. The prevalences of B. dorei and Fusobacterium sp.were different according to the diet and opposite depending onthe large intestine segment considered. Indeed, their prevalenceincreased significantly in cecal content, whereas in coloniccontent their prevalence decreased. E. coli was identified onlyin cecal content, where its prevalence was significantly lowerin HP- than in NP-fed animals.
Organic acids in cecal and colonic luminal contents. Thetotal quantity of organic acids in the luminal contents mainlyfollows the mass of the luminal contents. When calculatingtheir quantity in the whole cecal contents, the total amount ofacetate, isobutyrate, isovalerate, formate, and succinate wassignificantly higher, whereas the total amount of L-lactate,D-lactate, and ethanol was not significantly different in the HPgroup compared with the NP group (Fig. 3, A and B, and Table 6).For the quantity in the whole colonic content, the total amountsof acetate, propionate, butyrate, valerate, isobutyrate, isovaler-ate, L-lactate, D-lactate, succinate, and ethanol were signifi-cantly higher except formate in the HP group compared withthe NP group (Fig. 3, C and D, and Table 6). However, whenthese results were expressed as concentrations in cecal andcolonic luminal contents, the concentrations of SCFA were notsignificantly different after HP diet compared with NP diet(Table 7).
In the feces, the total quantity in acetate, propionate, andbutyrate recovered for the three last days was 1.9-, 2.6-, and2.1-fold higher for HP animals compared with NP animals(Fig. 3E). Figure 3F shows the relative amounts of energy lostas SCFA in feces expressed as percentages of energy intake.
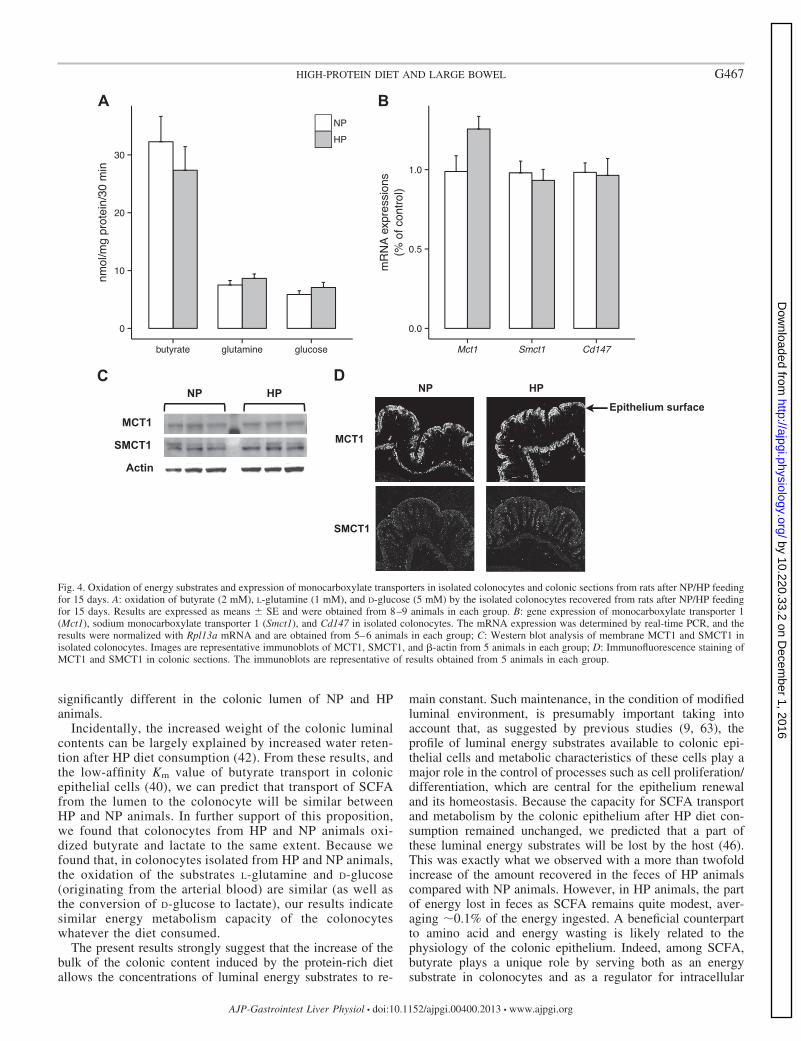
Energy substrate metabolism and expression of monocar-boxylic and sodium transporters in isolated colonocytes. Asindicated in Fig. 4A, the oxidation of butyrate was not signif-
Fig. 1. Characteristics of animals after normoproteic diet (NP)/hyperproteic-hypoglucidic isocaloric diet (HP) feeding for 15 days. Cumulative body weightgain (A), food intake (B), and weight of the cecal and colonic luminal contents (C)recovered from rats. The results were obtained from 8 animals in each group andare expressed as means SE. *P � 0.05, **P � 0.01, and ***P � 0.001.
G462 HIGH-PROTEIN DIET AND LARGE BOWEL
AJP-Gastrointest Liver Physiol • doi:10.1152/ajpgi.00400.2013 • www.ajpgi.org
by 10.220.33.2 on Decem
ber 1, 2016http://ajpgi.physiology.org/
Dow
nloaded from

icantly different in colonocytes isolated from NP and HPanimals and neither was the oxidation of the substrates origi-nating from blood, i.e., L-glutamine and D-glucose. Further-more, the production of L-lactate from D-glucose in isolated
colonocytes was similar in NP and HP animals (241 27 and232 42 nmol·mg protein�1·30 min�1, respectively, n � 9 ineach experimental group). Last, the oxidation of L-lactate wasalso found to be similar in colonocytes from NP and HPanimals, averaging, respectively, 3.41 0.87 and 4.44 1.87nmol·mg protein�1·30 min�1 (n � 3 in each experimentalgroup).
As indicated in Fig. 4B, the mRNA levels of the twomonocarboxylic acid transporters Mct1 and Smct1, as well asthat of Cd147 (CD147 involved in the apical expression ofMCT1 participating in the transport of monocarboxylic acids incolonic epithelial cells), were not significantly different be-tween NP and HP groups. As shown in Fig. 4C, with the use ofWestern blot analysis of cell membrane proteins recoveredfrom colonocytes isolated after NP and HP diet consumption,the amounts of MCT1 and SMCT1 were similar in both groupsof animals. Last, by visualizing MCT1 and SMCT1 usingimmunofluorescence technique, our results indicate similarimmunolocalization of both monocarboxylic acid transportersin NP and HP colonocytes (Fig. 4D).
DISCUSSION
The results obtained in the present study clearly indicate thatrats, after the consumption of the HP diet compared with theNP diet, were characterized in the large intestine by an increasein the mass of its luminal content, a shift in microbiotacomposition, and marked changes in the amount of organicacids, particularly in the colon.
Analysis of bacterial biodiversity with PCR-DGGE stronglysuggests that the gut microbiota is deeply reshaped followingHP diet ingestion. The fluctuations of biodiversity markers(diversity and richness) suggest changes at the species levelresulting from adaptation of the microbiota to the new intesti-nal environment created by the HP diet. The large intestinemicrobiota of rats submitted to HP diet had to cope with the
Table 4. Microbiota composition in the cecal and colonic luminal contents recovered from rats after NP/HP feeding for 15days determined by real-time qPCR
Bacterial Group
NP HP
P ValueMedian IQR Median IQR
Cecal luminal contentsTotal bacteria 13.3 13.1–13.5 13.3 13.2–13.4 0.910Bifidobacterium 6.6 5.6–7.9 7.0 6.6–7.5 0.307Lactobacillus group 8.5 8.0–8.9 8.3 7.9–8.8 0.495Bacteroides fragilis group 11.1 10.9–11.2 11.2 11.2–11.3 0.124C. coccoides group 10.7 10.6–10.8 9.2 7.7–10.2 0.028*C. leptum group 10.9 10.7–11.0 10.1 9.8–10.3 0.006*Desulfovibrio spp. 10.2 10.0–10.3 10.1 9.9–10.1 0.248F. prausnitzii 8.5 8.3–8.9 7.7 7.4–8.0 �0.001*Enterobacteriaceae 10.6 10.4–10.7 10.6 10.2–10.9 0.909
Colonic luminal contentsTotal bacteria 12.4 12.4–12.5 12.2 12.1–12.3 0.002*Bifidobacterium 7.4 7.1–7.6 7.0 6.9–7.2 0.052Lactobacillus group 9.2 8.7–9.5 8.6 8.1–9.2 0.218B. fragilis group 11.6 11.3–11.8 11.4 11.1–11.6 0.248C. coccoides group 11.0 11.0–11.1 10.5 10.4–10.7 �0.001*C. leptum group 11.8 11.7–11.8 10.6 10.5–11.1 �0.001*Desulfovibrio spp. 9.1 8.9–9.3 9.1 9.0–9.3 0.739F. prausnitzii 6.7 6.6–6.9 5.2 5.1–5.5 0.001*Enterobacteriaceae 10.7 10.5–10.9 10.6 10.2–10.8 0.436
IQR, interquartile range. Results are expressed as log of gene copy numbers of the different bacterial groups/species per gram of wet luminal content and wereobtained from 8 animals in each group. *Statistically significant difference.
Fig. 2. Renyi’s diversity profiles of microbiota in luminal content of rats afterNP/HP feeding for 15 days. A: diversity profiles in the cecal luminal contents;B: diversity profiles in the colonic luminal contents. Results were obtainedfrom 8 animals in each group.
G463HIGH-PROTEIN DIET AND LARGE BOWEL
AJP-Gastrointest Liver Physiol • doi:10.1152/ajpgi.00400.2013 • www.ajpgi.org
by 10.220.33.2 on Decem
ber 1, 2016http://ajpgi.physiology.org/
Dow
nloaded from
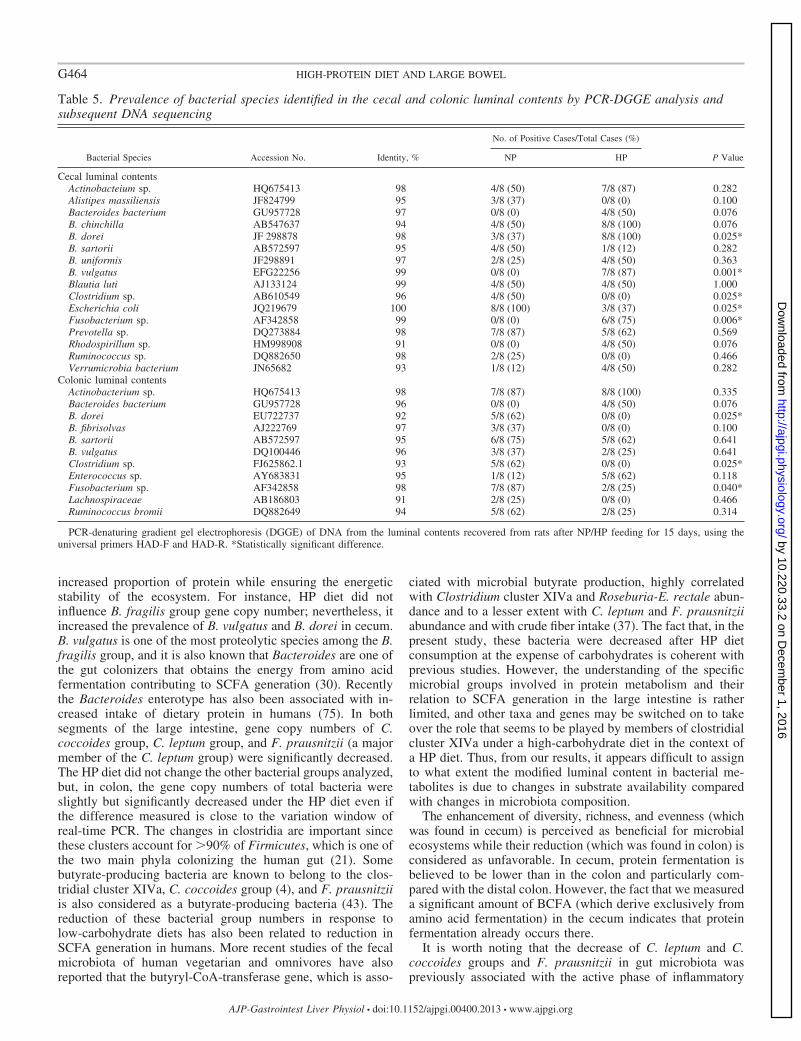
increased proportion of protein while ensuring the energeticstability of the ecosystem. For instance, HP diet did notinfluence B. fragilis group gene copy number; nevertheless, itincreased the prevalence of B. vulgatus and B. dorei in cecum.B. vulgatus is one of the most proteolytic species among the B.fragilis group, and it is also known that Bacteroides are one ofthe gut colonizers that obtains the energy from amino acidfermentation contributing to SCFA generation (30). Recentlythe Bacteroides enterotype has also been associated with in-creased intake of dietary protein in humans (75). In bothsegments of the large intestine, gene copy numbers of C.coccoides group, C. leptum group, and F. prausnitzii (a majormember of the C. leptum group) were significantly decreased.The HP diet did not change the other bacterial groups analyzed,but, in colon, the gene copy numbers of total bacteria wereslightly but significantly decreased under the HP diet even ifthe difference measured is close to the variation window ofreal-time PCR. The changes in clostridia are important sincethese clusters account for 90% of Firmicutes, which is one ofthe two main phyla colonizing the human gut (21). Somebutyrate-producing bacteria are known to belong to the clos-tridial cluster XIVa, C. coccoides group (4), and F. prausnitziiis also considered as a butyrate-producing bacteria (43). Thereduction of these bacterial group numbers in response tolow-carbohydrate diets has also been related to reduction inSCFA generation in humans. More recent studies of the fecalmicrobiota of human vegetarian and omnivores have alsoreported that the butyryl-CoA-transferase gene, which is asso-
ciated with microbial butyrate production, highly correlatedwith Clostridium cluster XIVa and Roseburia-E. rectale abun-dance and to a lesser extent with C. leptum and F. prausnitziiabundance and with crude fiber intake (37). The fact that, in thepresent study, these bacteria were decreased after HP dietconsumption at the expense of carbohydrates is coherent withprevious studies. However, the understanding of the specificmicrobial groups involved in protein metabolism and theirrelation to SCFA generation in the large intestine is ratherlimited, and other taxa and genes may be switched on to takeover the role that seems to be played by members of clostridialcluster XIVa under a high-carbohydrate diet in the context ofa HP diet. Thus, from our results, it appears difficult to assignto what extent the modified luminal content in bacterial me-tabolites is due to changes in substrate availability comparedwith changes in microbiota composition.
The enhancement of diversity, richness, and evenness (whichwas found in cecum) is perceived as beneficial for microbialecosystems while their reduction (which was found in colon) isconsidered as unfavorable. In cecum, protein fermentation isbelieved to be lower than in the colon and particularly com-pared with the distal colon. However, the fact that we measureda significant amount of BCFA (which derive exclusively fromamino acid fermentation) in the cecum indicates that proteinfermentation already occurs there.
It is worth noting that the decrease of C. leptum and C.coccoides groups and F. prausnitzii in gut microbiota waspreviously associated with the active phase of inflammatory
Table 5. Prevalence of bacterial species identified in the cecal and colonic luminal contents by PCR-DGGE analysis andsubsequent DNA sequencing
Bacterial Species Accession No. Identity, %
No. of Positive Cases/Total Cases (%)
P ValueNP HP
Cecal luminal contentsActinobacteium sp. HQ675413 98 4/8 (50) 7/8 (87) 0.282Alistipes massiliensis JF824799 95 3/8 (37) 0/8 (0) 0.100Bacteroides bacterium GU957728 97 0/8 (0) 4/8 (50) 0.076B. chinchilla AB547637 94 4/8 (50) 8/8 (100) 0.076B. dorei JF 298878 98 3/8 (37) 8/8 (100) 0.025*B. sartorii AB572597 95 4/8 (50) 1/8 (12) 0.282B. uniformis JF298891 97 2/8 (25) 4/8 (50) 0.363B. vulgatus EFG22256 99 0/8 (0) 7/8 (87) 0.001*Blautia luti AJ133124 99 4/8 (50) 4/8 (50) 1.000Clostridium sp. AB610549 96 4/8 (50) 0/8 (0) 0.025*Escherichia coli JQ219679 100 8/8 (100) 3/8 (37) 0.025*Fusobacterium sp. AF342858 99 0/8 (0) 6/8 (75) 0.006*Prevotella sp. DQ273884 98 7/8 (87) 5/8 (62) 0.569Rhodospirillum sp. HM998908 91 0/8 (0) 4/8 (50) 0.076Ruminococcus sp. DQ882650 98 2/8 (25) 0/8 (0) 0.466Verrumicrobia bacterium JN65682 93 1/8 (12) 4/8 (50) 0.282
Colonic luminal contentsActinobacterium sp. HQ675413 98 7/8 (87) 8/8 (100) 0.335Bacteroides bacterium GU957728 96 0/8 (0) 4/8 (50) 0.076B. dorei EU722737 92 5/8 (62) 0/8 (0) 0.025*B. fibrisolvas AJ222769 97 3/8 (37) 0/8 (0) 0.100B. sartorii AB572597 95 6/8 (75) 5/8 (62) 0.641B. vulgatus DQ100446 96 3/8 (37) 2/8 (25) 0.641Clostridium sp. FJ625862.1 93 5/8 (62) 0/8 (0) 0.025*Enterococcus sp. AY683831 95 1/8 (12) 5/8 (62) 0.118Fusobacterium sp. AF342858 98 7/8 (87) 2/8 (25) 0.040*Lachnospiraceae AB186803 91 2/8 (25) 0/8 (0) 0.466Ruminococcus bromii DQ882649 94 5/8 (62) 2/8 (25) 0.314
PCR-denaturing gradient gel electrophoresis (DGGE) of DNA from the luminal contents recovered from rats after NP/HP feeding for 15 days, using theuniversal primers HAD-F and HAD-R. *Statistically significant difference.
G464 HIGH-PROTEIN DIET AND LARGE BOWEL
AJP-Gastrointest Liver Physiol • doi:10.1152/ajpgi.00400.2013 • www.ajpgi.org
by 10.220.33.2 on Decem
ber 1, 2016http://ajpgi.physiology.org/
Dow
nloaded from

bowel diseases (67). In addition, anti-inflammatory effects ofF. prausnitzii in the trinitrobenzene sulfonate-induced colitismodel were also reported (66). Next, it can be hypothesizedthat HP diet ingestion may create an unfavorable luminalcondition in terms of microbiota composition in the largeintestine in the case of subsequent inflammatory episodes.Further work, out of the scope of the present study, is necessaryto document this new working hypothesis.
HP rats showed a marked increase of the total content ofalmost all the measured monocarboxylic acids in the colonluminal contents. In cecal content, the situation was not vastlydifferent but less marked.
These results are compatible with the view that, despitelower food intake in the HP group, more proteins and thenamino acid substrates were available to the microbiota in thelarge intestine for the synthesis of SCFA (from alanine, aspar-
Fig. 3. Total amounts of short-chain fattyacids (SCFA) in the large intestine’s luminalcontents and in feces recovered from ratsafter NP/HP feeding for 15 days. A andB: SCFA and branched-chain fatty acids(BCFA) in the cecal luminal contents; C and D:SCFA and BCFA in the colonic luminal con-tents; E: total fecal SCFA; and F: fecal SCFAexpressed as percentages of energy loss. Thefeces were recovered for the last 3 days beforedeath. To calculate the energy loss as SCFA,total energy in the food ingested is taken as100%. Results are presented as means SEand were obtained from 8 animals in eachgroup, *P � 0.05 and **P � 0.01.
G465HIGH-PROTEIN DIET AND LARGE BOWEL
AJP-Gastrointest Liver Physiol • doi:10.1152/ajpgi.00400.2013 • www.ajpgi.org
by 10.220.33.2 on Decem
ber 1, 2016http://ajpgi.physiology.org/
Dow
nloaded from

tate, glutamate, glycine, lysine, threonine), BCFA (from iso-leucine, leucine, valine), and other organic acids (from deami-nation and fermentation of amino acids) (5, 22, 44, 45). Thiswill correspond to a loss of amino acids for the host since thecolonic epithelium (except in the neonatal period) cannotabsorb a significant amount of amino acids. Among the 10monocarboxylic acids that were markedly increased in coloniccontent, some of them (butyrate, acetate, propionate, and L-lac-tate) have been shown to represent important luminal oxidativesubstrates providing energy in the form of ATP for the colonicepithelial cells. In the case of succinate, this metabolite hasbeen shown to be transported within the colonic mucosa (74)and to increase oxygen consumption in colonocytes (31).Because the large intestine epithelial layer is renewed within afew days (with important corresponding anabolic ATP-con-suming pathways) (54), together with consumption of ATP bycolonocytes through the membrane-bound ATPase involved incolonic electrolyte transport (7), ATP has to be synthesized ata rate matching its cellular utilization to maintain a constantATP cell content, a necessary condition to maintain the via-bility of epithelial cells (41). The other monocarboxylic acids(valerate, isobutyrate, isovalerate, formate, and D-lactate),which have not yet been tested for their capacity to be oxidizedin colonocyte, are present in much lower amounts than SCFAand succinate. Interestingly, the amount of ethanol in coloniccontent recovered from HP animals was markedly increased
compared with NP animals. It remains, however, to be deter-mined if ethanol is absorbed through the colonic epitheliumwith or without metabolism during its transfer from the lumento the bloodstream. Ethanol, succinate, formate, and lactate, asmetabolic intermediates in microbiota metabolism, usually donot accumulate to any substantial extent in the large intestinecontent. However, the production of these latter compoundscan be increased under specific circumstances (33, 45).
Microbiota-derived energy substrates, which are absorbed inthe process of transfer from the intestinal lumen to the portalvein blood, are available first for the liver and then, for someof them, for other peripheral tissues. In other words, transportfrom the lumen inside the colonocytes and further metabolismin these cells will primarily determine the amount of energysubstrates available for liver and peripheral tissues in host.From this point of view, our results showing that the expres-sion of the monocarboxylic acid transporters MCT1 andSMCT1 is not significantly modified after HP diet consumptionrepresent strong evidence indicating similar capacities for lu-minal transport of energy substrates originating from the mi-crobiota by the colonic epithelium. More evidence in favor ofsimilar transport of monocarboxylic acids in colonocytes fromHP and NP animals originates from the calculation of SCFAconcentrations in the colonic lumen. Indeed, when we calculateacetate, propionate, and butyrate concentrations, they are not
Table 6. Total amounts of organic acids and ethanol in the total cecal and colonic luminal contents recovered from ratsafter NP/HP feeding for 15 days
�mol in Total Luminal Contents
NP HP
P ValueMean SE Mean SE
Cecal luminal contentsL-Lactate 0.214 0.036 0.390 0.088 0.095D-Lactate 0.098 0.014 0.145 0.043 0.325Succinate 3.452 0.585 7.505 0.845 0.002*Formate 0.565 0.027 0.947 0.114 0.015*Ethanol 27.590 8.388 23.352 11.821 0.775
Colonic luminal contentsL-Lactate 0.053 0.006 0.210 0.029 �0.001*D-Lactate 0.004 0.002 0.008 0.002 0.040*Succinate 0.905 0.625 7.064 1.066 �0.001*Formate 0.064 0.013 0.177 0.044 0.052Ethanol 0.796 0.142 1.756 0.340 0.031*
Results were obtained from 6–8 animals in each group. *Statistically significant difference.
Table 7. SCFA concentrations in the cecal and colonic luminal contents recovered from rats after NP/HP feeding for 15days
�mol/g of Wet Luminal Contents
NP HP
P ValueMean SE Mean SE
Cecal luminal contentsAcetate 15.186 1.046 16.848 1.636 0.409Propionate 3.446 0.292 3.282 0.331 0.716Butyrate 1.886 0.161 1.986 0.288 0.768Valerate 0.378 0.022 0.399 0.058 0.733
Colonic luminal contentsAcetate 9.714 2.610 10.413 1.430 0.819Propionate 2.065 0.554 3.291 0.573 0.147Butyrate 0.905 0.205 1.358 0.274 0.208Valerate 0.168 0.055 0.436 0.130 0.090
Results were obtained from 8 animals in each group.
G466 HIGH-PROTEIN DIET AND LARGE BOWEL
AJP-Gastrointest Liver Physiol • doi:10.1152/ajpgi.00400.2013 • www.ajpgi.org
by 10.220.33.2 on Decem
ber 1, 2016http://ajpgi.physiology.org/
Dow
nloaded from
significantly different in the colonic lumen of NP and HPanimals.
Incidentally, the increased weight of the colonic luminalcontents can be largely explained by increased water reten-tion after HP diet consumption (42). From these results, andthe low-affinity Km value of butyrate transport in colonicepithelial cells (40), we can predict that transport of SCFAfrom the lumen to the colonocyte will be similar betweenHP and NP animals. In further support of this proposition,we found that colonocytes from HP and NP animals oxi-dized butyrate and lactate to the same extent. Because wefound that, in colonocytes isolated from HP and NP animals,the oxidation of the substrates L-glutamine and D-glucose(originating from the arterial blood) are similar (as well asthe conversion of D-glucose to lactate), our results indicatesimilar energy metabolism capacity of the colonocyteswhatever the diet consumed.
The present results strongly suggest that the increase of thebulk of the colonic content induced by the protein-rich dietallows the concentrations of luminal energy substrates to re-
main constant. Such maintenance, in the condition of modifiedluminal environment, is presumably important taking intoaccount that, as suggested by previous studies (9, 63), theprofile of luminal energy substrates available to colonic epi-thelial cells and metabolic characteristics of these cells play amajor role in the control of processes such as cell proliferation/differentiation, which are central for the epithelium renewaland its homeostasis. Because the capacity for SCFA transportand metabolism by the colonic epithelium after HP diet con-sumption remained unchanged, we predicted that a part ofthese luminal energy substrates will be lost by the host (46).This was exactly what we observed with a more than twofoldincrease of the amount recovered in the feces of HP animalscompared with NP animals. However, in HP animals, the partof energy lost in feces as SCFA remains quite modest, aver-aging �0.1% of the energy ingested. A beneficial counterpartto amino acid and energy wasting is likely related to thephysiology of the colonic epithelium. Indeed, among SCFA,butyrate plays a unique role by serving both as an energysubstrate in colonocytes and as a regulator for intracellular
Fig. 4. Oxidation of energy substrates and expression of monocarboxylate transporters in isolated colonocytes and colonic sections from rats after NP/HP feedingfor 15 days. A: oxidation of butyrate (2 mM), L-glutamine (1 mM), and D-glucose (5 mM) by the isolated colonocytes recovered from rats after NP/HP feedingfor 15 days. Results are expressed as means SE and were obtained from 8–9 animals in each group. B: gene expression of monocarboxylate transporter 1(Mct1), sodium monocarboxylate transporter 1 (Smct1), and Cd147 in isolated colonocytes. The mRNA expression was determined by real-time PCR, and theresults were normalized with Rpl13a mRNA and are obtained from 5–6 animals in each group; C: Western blot analysis of membrane MCT1 and SMCT1 inisolated colonocytes. Images are representative immunoblots of MCT1, SMCT1, and �-actin from 5 animals in each group; D: Immunofluorescence staining ofMCT1 and SMCT1 in colonic sections. The immunoblots are representative of results obtained from 5 animals in each group.
G467HIGH-PROTEIN DIET AND LARGE BOWEL
AJP-Gastrointest Liver Physiol • doi:10.1152/ajpgi.00400.2013 • www.ajpgi.org
by 10.220.33.2 on Decem
ber 1, 2016http://ajpgi.physiology.org/
Dow
nloaded from

gene targets, including those involved in colonic epithelial cellproliferation and migration (1, 73).
Thus, the same butyrate transport and oxidation in mito-chondria of colonocytes recovered from HP and NP animalslikely represents a way to maintain butyrate intracellular con-centration within a narrow range compatible with its actionupon its targets, including nuclear ones related to the epige-netic regulation of gene expression (15, 71). Because theexpression of the MCT1 transporter in the colonocyte brush-border membrane is sensitive to the butyrate concentration (10,16), the maintenance of the luminal concentration of butyratedespite increased protein consumption and butyrate productionby the microbiota would thus allow maintaining metabolichomeostasis in the colonic epithelium. In conclusion, the datapresented in this study are compatible with the view that anincreased bulk in the large intestine contents following HP dietingestion allows some kind of homeostasis regarding bacterialmetabolites produced by the microbiota in a context of modi-fied composition and increased substrate availability. Particu-larly, the present study indicates that, despite a marked increaseof the amount of butyrate in the colonic luminal contents, arather constant concentration is associated with unchangedcapacity of colonic epithelial cells for its transport and metab-olism. Because of the complexity of metabolic reactions andinterconversions involving microbiota and its environment,further studies particularly involving high-throughput analysisare necessary to better explain the taxonomic and functionaldifferences resulting from the HP diet and their long-termconsequences on host-microbiota interactions.
ACKNOWLEDGMENTS
We acknowledge Patrick Even for helpful discussion and Corine Delteil fortechnical help.
GRANTS
This work was supported by INRA, AgroParisTech, and CSIC. J.-M.Blouin received a postdoctoral grant from the Region Ile-de-France (DIM/Astrea program).
DISCLOSURES
No conflicts of interest, financial or otherwise, are declared by the authors.
AUTHOR CONTRIBUTIONS
Author contributions: X.L., J.-M.B., A.S., A.L., M.A., S.W., and P.-H.B.performed experiments; X.L. and J.-M.B. analyzed data; X.L., J.-M.B., andA.S. prepared figures; X.L., F.B., and A.-M.D. drafted manuscript; X.L.,J.-M.B., A.S., A.L., M.A., S.W., P.-H.B., D.T., Y.S., F.B., and A.-M.D. editedand revised manuscript; X.L., J.-M.B., A.S., A.L., M.A., S.W., P.-H.B., D.T.,Y.S., F.B., and A.-M.D. approved final version of manuscript; Y.S., F.B., andA.-M.D. conception and design of research; F.B. and A.-M.D. interpretedresults of experiments.
REFERENCES
1. Andriamihaja M, Chaumontet C, Tome D, Blachier F. Butyrate me-tabolism in human colon carcinoma cells: implications concerning itsgrowth-inhibitory effect. J Cell Physiol 218: 58–65, 2009.
2. Archer SYJJ, Kim HJ, Ma Q, Mou H, Dasety V, Meng S, Hodin RA.The histone deacetylase inhibitor butyrate down regulates cyclin B1 geneexpression via p21/WAF-1-dependent mechanism in human colon cancercells. Am J Physiol Gastrointest Liver Physiol 289: G696–G703, 2005.
3. Bach Knudsen KE, Serena A, Canibe N, Juntunen KS. New insightinto butyrate metabolism. Proc Nutr Soc 62: 81–86, 2003.
4. Barcenilla A, Pryde SE, Martin JC, Duncan SH, Stewart CS, Hen-derson C, Flint HJ. Phylogenetic relationships of butyrate-producing
bacteria from the human gut. Appl Environ Microbiol 66: 1654–1661,2000.
5. Barker HA. Amino acid degradation by anaerobic bacteria. Annu RevBiochem 50: 23–40, 1981.
6. Binder HJ. Role of colonic short-chain fatty acid transport in diarrhea.Annu Rev Physiol 72: 297–313, 2010.
7. Binder HJ, Sangan P, Rajendran VM. Physiological and molecularstudies of colonic H ,K -ATPase. Semin Nephrol 19: 405–414, 1999.
8. Blachier F, Mariotti F, Huneau JF, Tome D. Effects of amino acid-derived luminal metabolites on the colonic epithelium and physiopatho-logical consequences. Amino Acids 33: 547–562, 2007.
9. Boren J, Lee WN, Bassilian S, Centelles JJ, Lim S, Ahmed S, BorosLG, Cascante M. The stable isotope-based dynamic metabolic profile ofbutyrate-induced HT29 cell differentiation. J Biol Chem 278: 28395–28402, 2003.
10. Borthakur A, Saksena S, Gill RK, Alrefai WA, Ramaswamy K,Dudeja PK. Regulation of monocarboxylate transporter 1 (MCT1) pro-moter by butyrate in human intestinal epithelial cells: involvement ofNF-kappaB pathway. J Cell Biochem 103: 1452–1463, 2008.
11. Buyse M, Sitaraman SV, Liu X, Bado A, Merlin D. Luminal leptinenhances CD147/MCT-1-mediated uptake of butyrate in the human intes-tinal cell line Caco2-BBE. J Biol Chem 277: 28182–28190, 2002.
12. Cano PG, Santacruz A, Trejo FM, Sanz Y. Bifidobacterium CECT 7765improves metabolic and immunological alterations associated with obesityin high-fat diet fed mice. Obesity (Silver Spring) 21: 2310–2321, 2013.
13. Chacko A, Cummings JH. Nitrogen losses from the human small bowel:obligatory losses and the effect of physical form of food. Gut 29: 809–815,1988.
14. Chomczynski P, Sacchi N. Single-step method of RNA isolation by acidguanidinium thiocyanate-phenol-chloroform extraction. Anal Biochem162: 156–159, 1987.
15. Cuff M, Dyer J, Jones M, Shirazi-Beechey S. The human colonicmonocarboxylate transporter Isoform 1: its potential importance to colonictissue homeostasis. Gastroenterology 128: 676–686, 2005.
16. Cuff MA, Lambert DW, Shirazi-Beechey SP. Substrate-induced regu-lation of the human colonic monocarboxylate transporter, MCT1. JPhysiol 539: 361–371, 2002.
17. Cummings JH, Macfarlane GT. The control and consequences ofbacterial fermentation in the human colon. J Appl Bacteriol 70: 443–459,1991.
18. Cummings JH, Pomare EW, Branch WJ, Naylor CP, Macfarlane GT.Short chain fatty acids in human large intestine, portal, hepatic and venousblood. Gut 28: 1221–1227, 1987.
19. Darcy-Vrillon B, Morel MT, Cherbuy C, Bernard F, Posho L,Blachier F, Meslin JC, Duee PH. Metabolic characteristics of pigcolonocytes after adaptation to a high fiber diet. J Nutr 123: 234–243,1993.
20. Donohoe DR, Collins LB, Wali A, Bigler R, Sun W, Bultman SJ. TheWarburg effect dictates the mechanism of butyrate-mediated histoneacetylation and cell proliferation. Mol Cell 48: 612–626, 2012.
21. Eckburg PB, Bik EM, Bernstein CN, Purdom E, Dethlefsen L, Sar-gent M, Gill SR, Nelson KE, Relman DA. Diversity of the humanintestinal microbial flora. Science 308: 1635–1638, 2005.
22. Elsden SR, Hilton MG. Volatile acid production from threonine, valine,leucine and isoleucine by clostridia. Arch Microbiol 117: 165–172, 1978.
23. Evenepoel P, Claus D, Geypens B, Hiele M, Geboes K, Rutgeerts P,Ghoos Y. Amount and fate of egg protein escaping assimilation in thesmall intestine of humans. Am J Physiol Gastrointest Liver Physiol 277:G935–G943, 1999.
24. Fromentin G, Darcel N, Chaumontet C, Marsset-Baglieri A, NadkarniN, Tome D. Peripheral and central mechanisms involved in the control offood intake by dietary amino acids and proteins. Nutr Res Rev 25: 29–39,2012.
25. Gaudichon C, Bos C, Morens C, Petzke KJ, Mariotti F, Everwand J,Benamouzig R, Dare S, Tome D, Metges CC. Ileal losses of nitrogen andamino acids in humans and their importance to the assessment of aminoacid requirements. Gastroenterology 123: 50–59, 2002.
26. Genell S, Gustafsson BE, Ohlsson K. Quantitation of active pancreaticendopeptidases in the intestinal contents of germfree and conventionalrats. Scand J Gastroenterol 11: 757–762, 1976.
27. Gibson GR, Roberfroid MB. Dietary modulation of the human colonicmicrobiota: introducing the concept of prebiotics. J Nutr 125: 1401–1412,1995.
G468 HIGH-PROTEIN DIET AND LARGE BOWEL
AJP-Gastrointest Liver Physiol • doi:10.1152/ajpgi.00400.2013 • www.ajpgi.org
by 10.220.33.2 on Decem
ber 1, 2016http://ajpgi.physiology.org/
Dow
nloaded from
28. Gibson GR, Willems A, Reading S, Collins MD. Fermentation ofnon-digestible oligosaccharides by human colonic bacteria. Proc Nutr Soc55: 899–912, 1996.
29. Gibson JA, Sladen GE, Dawson AM. Protein absorption and ammoniaproduction: the effects of dietary protein and removal of the colon. Br JNutr 35: 61–65, 1976.
30. Gill SR, Pop M, Deboy RT, Eckburg PB, Turnbaugh PJ, Samuel BS,Gordon JI, Relman DA, Fraser-Liggett CM, Nelson KE. Metagenomicanalysis of the human distal gut microbiome. Science 312: 1355–1359,2006.
31. Goubern M, Andriamihaja M, Nubel T, Blachier F, Bouillaud F.Sulfide, the first inorganic substrate for human cells. FASEB J 21:1699–1706, 2007.
32. Gustafsson BE. The physiological importance of the colonic microflora.Scand J Gastroenterol Suppl 77: 117–131, 1982.
33. He T, Priebe MG, Harmsen HJ, Stellaard F, Sun X, Welling GW,Vonk RJ. Colonic fermentation may play a role in lactose intolerance inhumans. J Nutr 136: 58–63, 2006.
34. Hinnebusch BF, Meng S, Wu JT, Archer SY, Hodin RA. The effects ofshort-chain fatty acids on human colon cancer cell phenotype are associ-ated with histone hyperacetylation. J Nutr 132: 1012–1017, 2002.
35. Hooda S, Boler BM, Serao MC, Brulc JM, Staeger MA, Boileau TW,Dowd SE, Fahey GC Jr, Swanson KS. 454 pyrosequencing reveals ashift in fecal microbiota of healthy adult men consuming polydextrose orsoluble corn fiber. J Nutr 142: 1259–1265, 2012.
36. Johnstone AM. Safety and efficacy of high-protein diets for weight loss.Proc Nutr Soc 71: 339–349, 2012.
37. Kabeerdoss J, Devi RS, Mary RR, Ramakrishna BS. Faecal microbiotacomposition in vegetarians: comparison with omnivores in a cohort ofyoung women in southern India. Br J Nutr 108: 953–957, 2012.
38. Klenk J, Nagel G, Ulmer H, Strasak A, Concin H, Diem G, Rapp K.Body mass index and mortality: results of a cohort of 184,697 adults inAustria. Eur J Epidemiol 24: 83–91, 2009.
39. Kristensen NB, Pierzynowski SG, Danfaer A. Net portal appearance ofvolatile fatty acids in sheep intraruminally infused with mixtures ofacetate, propionate, isobutyrate, butyrate, and valerate. J Anim Sci 78:1372–1379, 2000.
40. Lecona E, Olmo N, Turnay J, Santiago-Gomez A, Lopez de Silanes I,Gorospe M, Lizarbe MA. Kinetic analysis of butyrate transport in humancolon adenocarcinoma cells reveals two different carrier-mediated mech-anisms. Biochem J 409: 311–320, 2008.
41. Leschelle X, Goubern M, Andriamihaja M, Blottiere HM, Couplan E,Gonzalez-Barroso MD, Petit C, Pagniez A, Chaumontet C, MignotteB, Bouillaud F, Blachier F. Adaptative metabolic response of humancolonic epithelial cells to the adverse effects of the luminal compoundsulfide. Biochim Biophys Acta 1725: 201–212, 2005.
42. Livesey G, Elia M. Estimation of energy expenditure, net carbohydrateutilization, and net fat oxidation and synthesis by indirect calorimetry:evaluation of errors with special reference to the detailed composition offuels. Am J Clin Nutr 47: 608–628, 1988.
43. Louis P, Flint HJ. Diversity, metabolism and microbial ecology ofbutyrate-producing bacteria from the human large intestine. FEMS Micro-biol Lett 294: 1–8, 2009.
44. Macfarlane GT. Microbiological Aspects of the Production of Short-Chain Fatty Acids in the Large Bowel. Cambridge, UK: Cambridge UnivPress, 1995, p. 87–105.
45. Macfarlane GT, Macfarlane S. Bacteria, colonic fermentation, andgastrointestinal health. J AOAC Int 95: 50–60, 2012.
46. Macfarlane S, Macfarlane GT. Regulation of short-chain fatty acidproduction. Proc Nutr Soc 62: 67–72, 2003.
47. Malinen E, Rinttila T, Kajander K, Matto J, Kassinen A, Krogius L,Saarela M, Korpela R, Palva A. Analysis of the fecal microbiota ofirritable bowel syndrome patients and healthy controls with real-timePCR. Am J Gastroenterol 100: 373–382, 2005.
48. Martinez-Medina M, Denizot J, Dreux N, Robin F, Billard E, BonnetR, Darfeuille-Michaud A, Barnich N. Western diet induces dysbiosiswith increased E coli in CEABAC10 mice, alters host barrier functionfavouring AIEC colonisation. Gut 63: 116–124, 2014.
49. Matsuki T, Watanabe K, Fujimoto J, Miyamoto Y, Takada T, Ma-tsumoto K, Oyaizu H, Tanaka R. Development of 16S rRNA-gene-targeted group-specific primers for the detection and identification ofpredominant bacteria in human feces. Appl Environ Microbiol 68: 5445–5451, 2002.
50. Matsuki T, Watanabe K, Fujimoto J, Takada T, Tanaka R. Use of 16SrRNA gene-targeted group-specific primers for real-time PCR analysis ofpredominant bacteria in human feces. Appl Environ Microbiol 70: 7220–7228, 2004.
51. Miner-Williams W, Deglaire A, Benamouzig R, Fuller MF, Tome D,Moughan PJ. Endogenous proteins in terminal ileal digesta of adultsubjects fed a casein-based diet. Am J Clin Nutr 96: 508–515, 2012.
52. Mouille B, Robert V, Blachier F. Adaptative increase of ornithineproduction and decrease of ammonia metabolism in rat colonocytes afterhyperproteic diet ingestion. Am J Physiol Gastrointest Liver Physiol 287:G344–G351, 2004.
53. Nyangale EP, Mottram DS, Gibson GR. Gut microbial activity, impli-cations for health and disease: the potential role of metabolite analysis. JProteome Res 11: 5573–5585, 2012.
54. Potten CS, Grant HK. The relationship between ionizing radiation-induced apoptosis and stem cells in the small and large intestine. Br JCancer 78: 993–1003, 1998.
55. Rasmussen HS, Holtug K, Mortensen PB. Degradation of amino acidsto short-chain fatty acids in humans. An in vitro study. Scand J Gastro-enterol 23: 178–182, 1988.
56. Reeves PG, Nielsen FH, Fahey GC Jr. AIN-93 purified diets forlaboratory rodents: final report of the American Institute of Nutrition adhoc writing committee on the reformulation of the AIN-76A rodent diet.J Nutr 123: 1939–1951, 1993.
57. Ritzhaupt A, Wood IS, Ellis A, Hosie KB, Shirazi-Beechey SP. Iden-tification and characterization of a monocarboxylate transporter 513:719–732, 1998.
58. Roediger WE. Utilization of nutrients by isolated epithelial cells of the ratcolon. Gastroenterology 83: 424–429, 1982.
59. Santacruz A, Collado MC, Garcia-Valdes L, Segura MT, Martin-Lagos JA, Anjos T, Marti-Romero M, Lopez RM, Florido J, CampoyC, Sanz Y. Gut microbiota composition is associated with body weight,weight gain and biochemical parameters in pregnant women. Br J Nutr104: 83–92, 2010.
60. Sanz Y, Sanchez E, Marzotto M, Calabuig M, Torriani S, Dellaglio F.Differences in faecal bacterial communities in coeliac and healthy childrenas detected by PCR and denaturing gradient gel electrophoresis. FEMSImmunol Med Microbiol 51: 562–568, 2007.
61. Schwarz J, Tome D, Baars A, Hooiveld GJ, Muller M. Dietary proteinaffects gene expression and prevents lipid accumulation in the liver inmice. PLoS One 7: e47303, 2012.
62. Siavoshian S, Blottiere HM, Cherbut C, Galmiche JP. Butyrate stim-ulates cyclin D and p21 and inhibits cyclin-dependent kinase 2 expressionin HT-29 colonic epithelial cells. Biochem Biophys Res Commun 232:169–172, 1997.
63. Singh B, Halestrap AP, Paraskeva C. Butyrate can act as a stimulator ofgrowth or inducer of apoptosis in human colonic epithelial cell linesdepending on the presence of alternative energy sources. Carcinogenesis18: 1265–1270, 1997.
64. Smiddy FG, Gregory SD, Smith IB, Goligher JC. Faecal loss of fluid,electrolytes, and nitrogen in colitis before and after ileostomy. Lancet 1:14–19, 1960.
65. Smith JG, Yokoyama WH, German JB. Butyric acid from the diet:actions at the level of gene expression. Crit Rev Food Sci Nutr 38:259–297, 1998.
66. Sokol H, Pigneur B, Watterlot L, Lakhdari O, Bermudez-HumaranLG, Gratadoux JJ, Blugeon S, Bridonneau C, Furet JP, Corthier G,Grangette C, Vasquez N, Pochart P, Trugnan G, Thomas G, BlottiereHM, Dore J, Marteau P, Seksik P, Langella P. Faecalibacteriumprausnitzii is an anti-inflammatory commensal bacterium identified by gutmicrobiota analysis of Crohn disease patients. Proc Natl Acad Sci USA105: 16731–16736, 2008.
67. Sokol H, Seksik P, Furet JP, Firmesse O, Nion-Larmurier I,Beaugerie L, Cosnes J, Corthier G, Marteau P, Dore J. Low counts ofFaecalibacterium prausnitzii in colitis microbiota. Inflamm Bowel Dis 15:1183–1189, 2009.
68. Tothmeresz B. Comparison of different methods for diversity ordering. JVeg Sci 283–290, 1995.
69. Walker AW, Ince J, Duncan SH, Webster LM, Holtrop G, Ze X,Brown D, Stares MD, Scott P, Bergerat A, Louis P, McIntosh F,Johnstone AM, Lobley GE, Parkhill J, Flint HJ. Dominant and diet-responsive groups of bacteria within the human colonic microbiota. ISMEJ 5: 220–230, 2011.
G469HIGH-PROTEIN DIET AND LARGE BOWEL
AJP-Gastrointest Liver Physiol • doi:10.1152/ajpgi.00400.2013 • www.ajpgi.org
by 10.220.33.2 on Decem
ber 1, 2016http://ajpgi.physiology.org/
Dow
nloaded from

70. Walter J, Tannock GW, Tilsala-Timisjarvi A, Rodtong S, Loach DM,Munro K, Alatossava T. Detection and identification of gastrointestinalLactobacillus species by using denaturing gradient gel electrophoresis andspecies-specific PCR primers. Appl Environ Microbiol 66: 297–303, 2000.
71. Wellen KE, Hatzivassiliou G, Sachdeva UM, Bui TV, Cross JR,Thompson CB. ATP-citrate lyase links cellular metabolism to histoneacetylation. Science 324: 1076–1080, 2009.
72. Westerterp-Plantenga MS, Nieuwenhuizen A, Tome D, Soenen S,Westerterp KR. Dietary protein, weight loss, and weight maintenance.Annu Rev Nutr 29: 21–41, 2009.
73. Wilson AJ, Gibson PR. Short-chain fatty acids promote the migration ofcolonic epithelial cells in vitro. Gastroenterology 113: 487–496, 1997.
74. Wolffram S, Badertscher M, Scharrer E. Carrier-mediated transport isinvolved in mucosal succinate uptake by rat large intestine. Exp Physiol79: 215–226, 1994.
75. Wu GD, Chen J, Hoffmann C, Bittinger K, Chen YY, Keilbaugh SA,Bewtra M, Knights D, Walters WA, Knight R, Sinha R, Gilroy E,Gupta K, Baldassano R, Nessel L, Li H, Bushman FD, Lewis JD.Linking long-term dietary patterns with gut microbial enterotypes. Science334: 105–108, 2011.
G470 HIGH-PROTEIN DIET AND LARGE BOWEL
AJP-Gastrointest Liver Physiol • doi:10.1152/ajpgi.00400.2013 • www.ajpgi.org
by 10.220.33.2 on Decem
ber 1, 2016http://ajpgi.physiology.org/
Dow
nloaded from
Copyright © 2022 FDOKUMEN