FT-IR MICROSCOPIC CHARACTERIZATION OF NORMAL AND MALIGNANT HUMAN COLONIC TISSUES
8
FT-IR MICROSCOPIC CHARACTERIZATION OF NORMALAND MALIGNANT HUMAN COLONIC TISSUES Ahmad SALMAN 1 , Shmuel ARGOV 2 , Jagannathan RAMESH 1 , Jed GOLDSTEIN 2 , Igor SINELNIKOV 2 , Hugo GUTERMAN 3 and Shaul MORDECHAI 1✍ 1 Department of Physics, Ben-Gurion University, Beer-Sheva 84105, Israel Fax: +972 8 6472 903; E-mail: [email protected] 2 Department of Pathology, Soroka University Medical Center, Beer-Sheva 84105, Israel 3 Department of Electrical and Computer Engineering, Ben Gurion University, Beer-Sheva 84105, Israel Received July 28, 2000; Accepted April 18, 2001 Abstract - Fourier-transform infrared spectroscopy (FT-IR) employs a unique approach to optical diagnosis of tissue pathology based on the characteristic molecular vibrational spectra of the tissue. In this study, we report infrared absorption spectra of for- malin fixed, paraffin embedded normal and malignant human colonic tissues from ten different patients. Our method is based on microscopic infrared study (FT-IR-microscopy) of thin tissue specimens in parallel with normal histopathological analysis, which serves as a reference. Our results indicate that the normal colonic tissue has a stronger absorption than the cancerous type over a wide region in all ten cases. The detailed analysis showed that there is a significant decrease in carbohydrate levels, total phosphate and also possibly creatine contents for cancerous tissue in comparison to the controls. Also, RNA/DNA ratio increased in cance- rous tissues relative to the normals in all the patients. The results of Linear Discriminant Analysis (LDA) showed that the normal and malignant cells could be identified with about 89% accuracy. Key words:FT-IR microspectrometry, colon cancer, histology review, band fitting INTRODUCTION Of the estimated 5.2 million deaths from cancer per year in the world, 55% (2.8 million) occurs in developing countries. Lung cancer is still the most common cause of death from cancer worldwide with over 900,000 deaths per year, followed by gastric cancer with over 600,000 deaths and colorectal and liver cancers accounting for at least 400,000 deaths each (25). The ACS (American Cancer Society) estimates that there will be 93,800 new diagnoses of colon cancer and 36,400 new diagnoses of rectal cancer in the year 2000 in the USA (26). Despite the improvement in diagnostic techniques, the vast majority of pancreatic cancers, more than 90%, have either advanced or metastasized by the time they are diagnosed (1). Hence there is an urgent need to develop novel diagnostic method to detect the malignancy in the earlier stage. Infrared (IR) spectroscopy is well known for its uniqueness as a non-invasive method in identifying vibrational structure of various materials (2). The spectra allow the study and identification of vibrational modes. Various biomolecular components of the cell give a characteristic IR spectrum, which is rich in structural and functional aspects (16,22). One of the most promising applications of the IR-based techniques, which has become possible now, is in biomedicine. IR spectroscopy can detect and monitor characteristic changes in molecular composition and structure that accompany transformation from normal to cancerous state (3,9,13). Literature has numerous examples including lung (8) cervix (30), prostate (21) and breast (4,5,12) and this growing list illustrates the potential of FT-IR in the field of infrared cancer diagnostics (optical biopsy). There are only very few reports on diagnosis of colorectal cancer by Rigas and others using conventional FT-IR and microscopic FT-IR, respectively (17,27). FT-IR microscopic imaging of human colon carcinoma has also been reported (19). In this report, we describe the results on microscopic FT-IR of normal and malignant tissues of OL159 Cellular and Molecular Biology TM 47, N° 22, OL159-OL166 ISSN 1165-158X DOI 10.1170/22 2001 Cell. mol. Biol. TM Abbreviations: CCD: charged coupled detector; DNA: deoxy ribonucleic acid; FT-IR: Fourier transform infrared; MCT: mercury cadmium telluride; RNA: ribonucleic acid
Transcript of FT-IR MICROSCOPIC CHARACTERIZATION OF NORMAL AND MALIGNANT HUMAN COLONIC TISSUES
FT-IR MICROSCOPIC CHARACTERIZATION OF NORMALANDMALIGNANT HUMAN COLONIC TISSUES
Ahmad SALMAN1, Shmuel ARGOV2, Jagannathan RAMESH1, Jed GOLDSTEIN2, Igor SINELNIKOV2, Hugo GUTERMAN3 and Shaul MORDECHAI1✍
1 Department of Physics, Ben-Gurion University, Beer-Sheva 84105, IsraelFax: +972 8 6472 903; E-mail: [email protected]
2 Department of Pathology, Soroka University Medical Center, Beer-Sheva 84105, Israel3 Department of Electrical and Computer Engineering, Ben Gurion University, Beer-Sheva 84105, Israel
Received July 28, 2000; Accepted April 18, 2001
Abstract - Fourier-transform infrared spectroscopy (FT-IR) employs a unique approach to optical diagnosis of tissue pathologybased on the characteristic molecular vibrational spectra of the tissue. In this study, we report infrared absorption spectra of for-malin fixed, paraffin embedded normal and malignant human colonic tissues from ten different patients. Our method is based onmicroscopic infrared study (FT-IR-microscopy) of thin tissue specimens in parallel with normal histopathological analysis, whichserves as a reference. Our results indicate that the normal colonic tissue has a stronger absorption than the cancerous type over awide region in all ten cases. The detailed analysis showed that there is a significant decrease in carbohydrate levels, total phosphateand also possibly creatine contents for cancerous tissue in comparison to the controls. Also, RNA/DNA ratio increased in cance-rous tissues relative to the normals in all the patients. The results of Linear Discriminant Analysis (LDA) showed that the normaland malignant cells could be identified with about 89% accuracy.
Key words: FT-IR microspectrometry, colon cancer, histology review, band fitting
INTRODUCTION
Of the estimated 5.2 million deaths from cancer peryear in the world, 55% (2.8 million) occurs in developingcountries. Lung cancer is still the most common cause ofdeath from cancer worldwide with over 900,000 deathsper year, followed by gastric cancer with over 600,000deaths and colorectal and liver cancers accounting for atleast 400,000 deaths each (25). The ACS (AmericanCancer Society) estimates that there will be 93,800 newdiagnoses of colon cancer and 36,400 new diagnoses ofrectal cancer in the year 2000 in the USA (26). Despite theimprovement in diagnostic techniques, the vast majorityof pancreatic cancers, more than 90%, have eitheradvanced or metastasized by the time they are diagnosed(1). Hence there is an urgent need to develop noveldiagnostic method to detect the malignancy in the earlierstage.
Infrared (IR) spectroscopy is well known for itsuniqueness as a non-invasive method in identifyingvibrational structure of various materials (2). The spectraallow the study and identification of vibrational modes.Various biomolecular components of the cell give acharacteristic IR spectrum, which is rich in structural andfunctional aspects (16,22). One of the most promisingapplications of the IR-based techniques, which hasbecome possible now, is in biomedicine. IR spectroscopycan detect and monitor characteristic changes in molecularcomposition and structure that accompany transformationfrom normal to cancerous state (3,9,13). Literature hasnumerous examples including lung (8) cervix (30),prostate (21) and breast (4,5,12) and this growing listillustrates the potential of FT-IR in the field of infraredcancer diagnostics (optical biopsy).
There are only very few reports on diagnosis ofcolorectal cancer by Rigas and others using conventionalFT-IR and microscopic FT-IR, respectively (17,27). FT-IRmicroscopic imaging of human colon carcinoma has alsobeen reported (19). In this report, we describe the resultson microscopic FT-IR of normal and malignant tissues of
OL159
Cellular and Molecular BiologyTM 47, N° 22, OL159-OL166 ISSN 1165-158XDOI 10.1170/22 2001 Cell. mol. Biol.TM
Abbreviations: CCD: charged coupled detector; DNA:deoxy ribonucleic acid; FT-IR: Fourier transform infrared;MCT: mercury cadmium telluride; RNA: ribonucleic acid

human intestine from ten patients. Significant spectraldifferences have been observed between normal andcancerous tissues. The detailed analysis showed thatphosphate content and RNA/DNA ratio may be potentialmarkers to differentiate normal from diseased tissues.Linear discriminant analysis (LDA), used in the presentstudy, provided good classification between normal andmalignant cells. Also, the possible reasons for intensityvariations between normal and cancerous tissues havebeen discussed.
MATERIALS AND METHODS
Sample preparationFormalin-fixed, paraffin-embedded tissue from 10
adenocarcinoma patients, were retrieved from the histopathology filesof Soroka University Medical Center, Beer Sheva (SUMC). The tissuesamples used in this study were selected to include both normal andmalignant areas. Two parafin sections were cut from each case, onewas placed on zinc-selenium slide and the other on glass slide.Thickness of all the tissue samples was 10 µm. The first slide wasdeparaffinized using xylol and alcohol and was used for FT-IRmeasurements. The second slide was stained with hematoxylin andeosin for histology review.
FT-IR microspectroscopyFT-IR-measurements were performed in transmission mode. For
the transmission measurement we used the FT-IR microscope withliquid nitrogen cooled MCT detector which is coupled to the FT-IRspectrometer (BRUKER EQUINOX model 55/S OPUS software).The microscope is also equipped with a CCD-camera for the visiblerange of the spectrum. Since the ordinary glass slides have strongabsorption in the wavelength range of our interest, we used ZincSellenide crystals, which are highly transparent to IR light. Thepathologist examined each site using combined optical microscopyunder standard histological conditions after staining. During eachmeasurement, the measured areas of samples were typically a 100 µmdiameter. Sixty differentssites were measured for normal and similarlyfrom malignant sections from ten different patients. The measuredspectra cover the wavenumber range 600-4000 cm-1 in the mid-IRregion. The spectrum was taken as an average of 128 scans to increasethe signal to noise ratio. The spectral resolution was at 4 cm-1. Thebaseline was corrected as follows. Initially, the spectrum was dividedinto 64 sections of equal size. Then the y-value minima of the spectrumwere connected generating a curve which gives the best fit to thebackground. The spectrum was normalized to amide I peak at 1646 cm-1
after baseline correction for the entire spectrum.
Spectral analysis and fitting proceduresThe band fitting analysis was performed using the software
PEAKFIT (Version 4.0). The measured spectra were fitted using astandard Gaussian peak shape satisfying the followingrelationship:
1 ν–ν0I(ν) = I0 exp[– – (——) 2] (1)2 w
Where, I (ν) represents the IR absorbance at wavenumber ν, ν0 is thepeak centroid and w is the width parameter (6,20). The full width athalf maximum (FWHM) of the band Γ is calculated using the relation
Γ = 2.36 w (cm-1 ) (2)
OL160 A. Salman et al.
�
�
�
Fig. 1 Histological image of formalin fixed normalhuman colonic tissue stained with hematoxylin-teosin (a)cross section (b) lateral section (c) cross section of coloniccancerous tissue.
With the enhanced resolution achieved due to high signal to noiseratio, the weak absorption bands can be resolved to a greater extent.Firstly, the second derivative spectrum was generated. The secondderivative spectrum was used in identifying the hidden peaks.Secondly, the peaks obtained from the second derivative spectrumwere fitted allowing the centroids, widths and absorption amplitudesto vary in the process. A linear function was used to fit the smallresidual background. The above analysis yielded reliable fits for theentire region of the spectra. Integrated areas were calculated (usingOPUS software) to quantify the metabolites for normal and malignanttissue samples.

FT-IR microscopy of human colon adenocarcinoma OL161
Linear discriminant analysisTo fully evaluate the performance of the proposed method, linear
discriminant analysis (LDA) (14) was employed using MATLAB(Version 5.3, Math Works). LDA is a classification technique thatemployes Mahalanobis distance to determine the class of an unknownsample. In this study, training and test sets were selected randomlyfrom the database. Fifty percent of each set was employed for trainingand the remainder for test. In addition, the validation experiment wasrepeated 100 times, with the same input features but with different setsof randomly selected training and test sets, and the results wereaveraged.
RESULTS
Fig. 1a presents histological cross section image offormalin-fixed human normal colonic tissues. The thinmicrovascular vessels pass vertically between crypts inthe normal lamina propria. The normal colonic mucosa (Fig.1b) is made up of epithelial lined crypts that aresurrounded by lamina propria. The histological section isoriented in such a way that simple columnar surfaceepithelium facing the lumen is at the left of the Fig. andthe lamina propria in which they are situated at the rightof the Fig. The mucosal crypts are parallel to one anotherand unbranched. The adenomatous epithelium preservesmucus production-goblet cells. In this field there is amarked decrease in mucus production. There is focal lossof nuclear polarity, and an increase in nucleocytoplamicratio. Fig. 1c gives a low power view of adenocarcinoma,a malignant epithelial tumor. The gland shows cribriform
Fig. 2 Infrared microspectroscopy in the region 600-1800 cm-1 of normal (solid lines) and cancerous human colonic tissue (dashedlines) from two patients.
Fig. 3 Typical band fitting analysis in thewavenumber region 1730-600 cm-1 for patient number 8.
pattern, with loss of mucin production and foci of necroticdebris. The adenocarcinoma glands (grade II) are irregularand torous.
Fig. 2 shows typical infrared absorption spectra ofnormal (lines a,c) and cancerous (lines b,d) humanintestinal tissues of two patients in the spectral range 600-1800 cm-1. The absorption due to normal tissue was higherthan cancerous types in this entire region of the spectrum.This was true for the other eight patients. No significant
OL162 A. Salman et al.
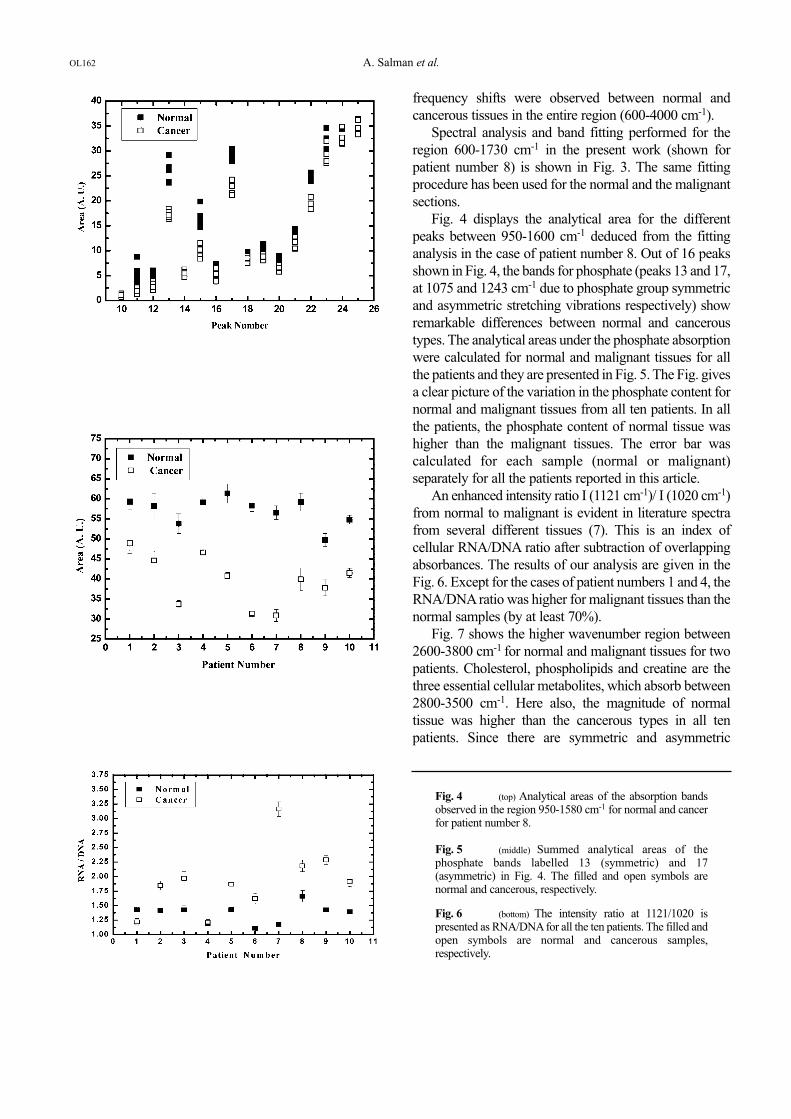
Fig. 4 (top) Analytical areas of the absorption bandsobserved in the region 950-1580 cm-1 for normal and cancerfor patient number 8.
Fig. 5 (middle) Summed analytical areas of thephosphate bands labelled 13 (symmetric) and 17(asymmetric) in Fig. 4. The filled and open symbols arenormal and cancerous, respectively.
Fig. 6 (bottom) The intensity ratio at 1121/1020 ispresented as RNA/DNAfor all the ten patients. The filled andopen symbols are normal and cancerous samples,respectively.
frequency shifts were observed between normal andcancerous tissues in the entire region (600-4000 cm-1).
Spectral analysis and band fitting performed for theregion 600-1730 cm-1 in the present work (shown forpatient number 8) is shown in Fig. 3. The same fittingprocedure has been used for the normal and the malignantsections.
Fig. 4 displays the analytical area for the differentpeaks between 950-1600 cm-1 deduced from the fittinganalysis in the case of patient number 8. Out of 16 peaksshown in Fig. 4, the bands for phosphate (peaks 13 and 17,at 1075 and 1243 cm-1 due to phosphate group symmetricand asymmetric stretching vibrations respectively) showremarkable differences between normal and canceroustypes. The analytical areas under the phosphate absorptionwere calculated for normal and malignant tissues for allthe patients and they are presented in Fig. 5. The Fig. givesa clear picture of the variation in the phosphate content fornormal and malignant tissues from all ten patients. In allthe patients, the phosphate content of normal tissue washigher than the malignant tissues. The error bar wascalculated for each sample (normal or malignant)separately for all the patients reported in this article.
An enhanced intensity ratio I (1121 cm-1)/ I (1020 cm-1)from normal to malignant is evident in literature spectrafrom several different tissues (7). This is an index ofcellular RNA/DNA ratio after subtraction of overlappingabsorbances. The results of our analysis are given in theFig. 6. Except for the cases of patient numbers 1 and 4, theRNA/DNA ratio was higher for malignant tissues than thenormal samples (by at least 70%).
Fig. 7 shows the higher wavenumber region between2600-3800 cm-1 for normal and malignant tissues for twopatients. Cholesterol, phospholipids and creatine are thethree essential cellular metabolites, which absorb between2800-3500 cm-1. Here also, the magnitude of normaltissue was higher than the cancerous types in all tenpatients. Since there are symmetric and asymmetric

vibrations due to water absorption in the region between3200-3550 cm-1, hence this region is not considered foranalysis. The integrated areas (for peaks I and II in Fig. 7)at 2848 cm-1 and 2916 cm-1 for all the ten patients arepresented in Fig. 8a-8b. The area for normal tissue washigher than cancer types in most of the cases.
The bands at 1025 and 1045 cm-1 in IR spectra areresponsible for the vibrational modes of -CH2OH groupsand the C-O stretching coupled with C-O bending of theC-OH groups of carbohydrates (includes glucose, fructoseand glycogen, etc.) (24). The ratio of areas of the bands at1045/1545 gives an estimate of the carbohydrate levels,which are shown in Fig. 9. Our results indicated thatcarbohydrate (including glycogen) levels were reduced incancerous tissues in comparison to normals. This is inagreement with the decrease in phosphate levels presentedin Fig. 5. It is surprising that the carbohydrate (glycogen)levels decrease in normal tissue relative to the canceroustype in the case of rectal region of the intestine (28), forwhich the reasons are not clearly understood and possiblyit might arise from the different biological samples in thetwo cases.
FT-IR microscopy of human colon adenocarcinoma OL163
Fig. 7 Infrared microspectroscopy in the region 2600-3800 cm-1 of normal (solid lines) and cancerous human colonic tissue(dashed lines) from two patients. The wavenumbers of peaks I and II are 2848 and 2916 cm-1, respectively.
Fig. 8 a) Integrated area of peak I (2848 cm-1) for allten patients. The filled and open symbols are normal andcancerous, respectively. b) Integrated area of peak II (2916cm-1) for all ten patients.

investigate the interference due to mucins layer present inthe colonic tissue, the measurements were taken atdifferent aperture values. Our results showed that theintensity changes at different values were not significantand the contribution due to mucins layer to the observedspectra was negligible. In the previous study reported byRigas (27) the malignant tissues displayed decreasedintensity of the νas PO2
- band and increased intensity ofthe νsy PO2
- band, when compared to normal (for coloncancer) tissues. They also reported that the intensity ofthese peaks varied from patient to patient and also withinthe sample. In our study, such discrepancies were notfound, possibly the regions of colon and rectal maybehave differently. Also, when the analytical areas forthese two bands were summed up, the same trend wasrepeated (Fig. 5). The analysis of phosphate (symmetricand asymmetric) bands has clearly shown that the totalphosphate content is significantly higher in normal tissuesthan malignant types.
Our results showed that in eight out of ten patients, theRNA/DNA ratio (Fig. 6) increased from normal tocancerous stage. These results correlate well with reportsavailable in the literature. The region between 2800-3500cm-1 is due to strong absorption of CH2, CH3 stretchingvibrations of phospholipids, cholesterol and creatine.Creatine and cyclocreatine have been shown to inhibitthe growth of a variety of human and murine tumors.Antiproliferative effect of creatine is shown to beeffective in mice carrying a human colonadenocarcinoma (LS 174T) (18). As in the case ofphosphate bands, the intensity of higher wavenumberregion for normal tissue was higher than cancer. Ourresults indicate that the creatine levels may be lower incancer types compared to normal ones in accordancewith the above studies.
The preliminary results of LDA are highlyencouraging in discriminating normal from malignantcells. A summary of the different feature sets is shown inTable 1. The probabilities of classification using sevensets of features for normal and cancer tissues are shown inTable 2. The best results were obtained for set 1(phosphate bands labelled 13 and 17, Table 1) with asuccess rate of 86.2% and 91.6% for normal and cancertissue, respectively. Although the success rate of the LDAbased classifier is high, a careful analysis of Table 2reveals that about 8.4% of the cancer cases might beclassified as normal while up to 13.8% of the normalcases might be classified as cancer.
Our FT-IR investigation on two types of colon tissuesfor ten patients showed that the levels of vital cellular
OL164 A. Salman et al.
Fig. 10 The Schematic representation of the normal(left) and adenomatous crypt (right) showing cell migrationand its corresponding living status. Filled and open circlesrepresent the cells in exponentially growing and apoptoticstages, respectively.
Fig. 9 The intensity ratio at (1045/1545) x 100 for allpatients. Filled and open symbols represent normal andcancerous, respectively.
DISCUSSION
The informative PO2- symmetrical and asymmetrical
stretching vibrations, which occur between 1000-1300cm-1, provide clues to qualitative and quantitative changesfor phosphate containing compounds. In our study, theintensity of these band structures for normal tissue washigher than cancerous types (as illustrated by bands 13and 17 in Fig. 4 for patient number 8) in all ten patients.Mantsch and co-workers cautioned that in some studiesthe spectral differences observed between normal andmalignant tissues could be due to collagen content (15).The examination of measured areas of the tissue sample inall the cases confirmed that the interference due tocollagen was very minimal and hence our spectralchanges are not due to collagen content. Also to

FT-IR microscopy of human colon adenocarcinoma OL165
metabolites decrease in cancer relative to the controls.These results are surprising since other cancer forms e.g.sarcoma (10), breast cancer (11)and skin cancer (29) showan increase in the phosphate concentration relative to thenormal tissues. Colonic adenocarcinoma shows anentirely different behavior. Our results can be explained byhaving a better understanding of histogenesis of colonicadenomas. Generally, in normal crypt, the epithelial cellsproliferate in the bottom portion and move further withdifferentiation and finally exit ending up in apoptosis. Therecent model (schematically shown in Fig. 10) onhistogenesis of colonic adenomas given by Moss et al.(23) claims that in adenomas, the proliferation of cells ispredominant at lumen and apoptosis at the base, acomplete reversal of normal pattern. It is interesting tospeculate that the drastic decrease in cellular contents forcancerous tissues (as shown by our results) can becorrelated to the apoptotic stage of cancerous tissues. Thisexplains why our results are opposite to the findings forother tissue types. Additional evidences are necessary tosubstantiate our results by having more microscopic FT-IRdata on samples from different sites of the adenomatouscrypt in patients.
CONCLUSIONS
The absorbance for normal cells was higher than themalignant in all ten patients. The decrease in phosphatecontent was significant in malignant cells. The RNA/DNAratio was higher for malignant tissue samples which canbe a good biological marker. Also, probable decrease increatine levels for malignant cells could be one of the riskfactors as reported in vitro studies. The decrease incarbohydrate levels in malignant tissues may be thepossible reason for the reduction in cell metabolites. Also,this accounts for higher intensity for normal tissues thanthe malignant samples in the entire region of the spectrum.Multivariate analysis showed reasonably goodclassification between normal and malignant samples. Ourstudy with ten samples of normal and malignant colonictissues has clearly shown that FT-IR microscopy can bedeveloped for the purpose of diagnosis. However largedatabase is essential to turn this methodology into noveldiagnostic technique for colon cancer using FT-IR. Studieswith larger number of human samples and use of state ofthe art imaging techniques may improve the results in theearly diagnosis of colon cancer in the future.
Table 1 Feature combinations of the linear discriminant analysis
Feature Description Vector size Feature Identification
Phosphate bands labelled 13 and 17 2 1Integrated area of peaks I (2848 cm-1) and II (2916 cm-1) 2 2The intensity ratio at I(1121) / I(1020) and I(1045) / I(1545) 2 3The intensity ratio at I(1045) / I(1545) and summed analytic areas of the phosphate bands labelled 13 and 17 2 4Phosphate bands labelled 13 and 17 and 3 5the intensity ratio at I(1045) / I(1545)Phosphate bands labelled 13 and 17 and RNA 3 6Phosphate bands labelled 13 and 17 and 3 7the intensity ratio at I(1121) / I(1020)
Table 2 FT-IR assessment for Cancer: the percentage of correct and incorrect test diagnoses
Feature Normal as Cancer as Normal as Cancer as Total*Identification Normal Cancer Cancer Normal
1 86.2 91.6 13.8 8.4 88.92 93.2 55.4 6.8 44.6 74.33 84.4 84.4 15.6 15.6 84.44 84.6 89.6 15.4 10.4 87.15 80.4 78.2 19.6 21.8 79.36 77.0 90.8 23.0 9.2 83.97 83.2 90.2 16.8 9.8 86.7
* Total is the average of positive identification for both normal and cancer types (columns 2 and 3).

Acknowledgments – This research work was supported in part by theMiddle East Cancer Consortium (MECC) and the Cancer ResearchFoundation at the Soroka University Medical Center (Beer-Sheva,Israel) in Memory of Prof. Tabb. Many thanks are due to Dr. V.Erukhimovitch (Inst. of Applied Sciences, Ben Gurion University) fordata collection and Dr. B. Cohen (Dept. of Chemistry, Ben GurionUniversity) for fruitful discussions.
REFERENCES
1. Adams, J.T., Poulter, C.A. and Pandya, K.J., In: Clinical Oncology,Philip, R. (ed.) 6th ed., American Cancer Society, New York, 1983,pp. 178-189.
2. Afanasyeva, I.N., Bruch, F.R., Angelique, K. and Vladimir, M.,Numerous applications of fiber optic-evanescent wave Fouriertransform infrared (FEW-FT-IR) spectroscopy for surface andsubsurface structural analysis. Subsurface Technol. Appl. 2000, 1:45-63.
3. Afanasyeva, I.N., Kolyakov, F., Artjushenko, S.G., Sokolov, V.V. andFrank, G.A., Minimally invasive and ex vivo diagnostics of breastcancer tissues by fiber optic evanescent wave Fourier transform IR(FEW-FT-IR) spectroscopy. SPIE 1998a, 3250: 140-146.
4. Afanasyeva, I.N., Makhine, V. and Bruch, F.R., Diagnostics ofbreast cancer tissues by fiber optic evanescent wave Fouriertransform IR (FEW-FT-IR) spectroscopy. SPIE 1999, 3590: 472-483.
5. Afanasyeva, I.N., Kolyakov, F., Letokhov, S.V. and Golovkina,V.V., Diagnostics of cancer tissues by fiber optic evanescent waveFourier transform IR (FEW-FT-IR) spectroscopy. SPIE 1997,2979: 478-485.
6. Afanasyeva, I.N., Sergei, F.K. and Leonid, N.B., Remote skintissue diagnostics in vivo by fiber optic evanescent wave Fouriertransform infrared (FEW-FT-IR) spectroscopy. SPIE 1998b, 3257:260-266.
7. Andrus, P.G and Strickland, R.D., Cancer grading by Fouriertransform infrared spectroscopy. Biospectroscopy 1998, 4: 37-46.
8. Benedetti, E., Teodori, L., Trinca, M.L., Vergamini, P., Salvati, F.,Mauro, F. and Spremolla, G., A new approach to the study ofhuman solid tumor cells by means of FT-IR microspectroscopy.Appl. Spectrosc. 1990, 44: 1276-1280.
9. Diem, M., Boydston-White, S. and Chiriboga, L., Infraredspectroscopy of cells and tissues: shining light onto a novel subjectAppl. Spectrosc. 1999, 53: 148-161.
10. Difei, Y., Castro, D.J., El-Sayed, I.H., El-Sayed, M.A., Saxton, R.Eand Yi Zhang, N., A Fourier-transform infrared spectroscopiccomparison of cultured human fibroblast and fibrosarcoma cells.SPIE 1995, 2389: 543-551.
11. Dukor, R.K., Liebman, M.N. and Johnson, B.L., A new, non-destructive method for analysis of clinical samples with FT-IRmicrospectroscopy. Breast cancer tissue as an example. Cell. Mol.Biol. 1998, 44: 211-217.
12. Fabian, H., Jackson, M., Murphy, L., Watson, P.H., Fichtner, I. andMantsch, H.H., A comparative infrared spectroscopic study ofhuman breast tumors and breast tumor cell xenografts.Biospectroscopy 1995, 1: 37-45.
13. Franck, P., Nabet, P. and Dousset, B., Applications of infraredspectroscopy to medical biology. Cell. Mol. Biol. 1998, 44: 273-275.
14. Haaland, D.M., Jones, H.D.T. and Thomas, E.V., Multivariateclassification of the infrared spectra of cell and tissue samples.Appl. Spectros. 1997, 51: 340-345.
15. Jackson, M., Lin-P’ing, Choo., Watson, P.H., Halliday, W.C. andMantsch, H.H., Beware of connective tissue proteins: assignmentand implications of collagen absorptions in infrared spectra ofhuman tissues. Biochim. Biophys. Acta 1995, 1270: 1-6.
16. Jagannathan, R., Salman, A., Hammody, Z., Cohen, B., Gopas, J.,Grossman, N and Mordechai, S., FT-IR microscopic studies onnormal and H-Ras oncogene transfected cultured mousefibroblasts. Eur. Biophys. J. 2001, 30(4): 250-255.
17. Jagannathan, R., Salman, A., Argov, S., Goldstein, J., Sinelnikov,I., Walfisch, S., Guterman, H. and Mordechai, S., FT-IRmicroscopic studies on mormal, polyp and malignant humancolonic tissues. Subsurface Sensing Technol. Appl. 2001, 2: 99-117.
18. Kristensen, C.A., Askenasy, N., Jain, R.K. and Koretsky, A.P.,Creatine and cyclocreatine treatment of human colonadenocarcinoma xenografts: 31P and 1H magnetic resonancespectroscopic studies Br. J. Cancer 1999, 79: 278-285.
19.Lasch., P. and Naumann, D., FT-IR microscopic imaging of humancarcinoma thin sections based on pattern recognition techniques.Cell. Mol. Biol. 1998, 44: 189-202.
20. Lucassen, G.W., Caspers, P.J. and Pupples, G.J., In vivo infrared-and Raman-spectroscopy of human stratum corneum. SPIE 1998,3257: 52-60.
21. Malins, D.C., Polissar, N.L. and Gunselman, S.J., Models of DNAstructure achieve almost perfect discrimination between normalprostate, benign prostatic hyperplasia (BPH) and adnocarcinomaand have a high potential for predicting BPH and prostate cancer.Proc. Natl. Acad. Sci. USA 1997, 94: 259-264.
22. Mantsch, H.H. and Chapman, D. (eds.), Infrared Spectroscopy ofBiomolecules, John Wiley, N.Y., 1996, chapters 2, 6, 7, 8, 9.
23. Moss, S.F., Liu, T.C., Petrotos, A., Hsu, T.N., Gold, L.I. and Holt,P.R., Inward growth of colonic adenomatous polyps.Gastroenterology 1996, 111: 1425-1432.
24. Parker, F.S., Application of Infrared Spectroscopy in Biochemistry,Biology and Medicine Plenum Press, New York, 1971.
25. Pisani, P., Parkin, D.M., Bray, F. and Ferlay, J., Estimates of theworldwide mortality from 25 cancers in 1990. Int. J. Cancer 1999,83: 18-29.
26. Ries, L.A., Wingo, P.A., Miller, D.S., Howe, H.L., Weir, H.K.,Rosenberg, H.M., Vernon, S.W., Cronin, K. and Edwards, B.K.,The annual report to the nation on the status of cancer. 1973-1997,with a special section on colorectal cancer. Cancer 2000, 88: 2398-2424.
27. Rigas, B., Morgello, S., Goldman, I.S. and Wong, P.T.T., Humancolorectal cancers display abnormal Fourier-transform infraredspectra. Proc. Natl. Acad. Sci. USA 1990, 87: 8140-8144.
28. Takahashi, S., Satomi, A., Yanko, K., Kawase, H., Tanimizu, T.,Tuji, Y., Murakami, S. and Hirayama, R., Estimation of glycogenlevels in human colorectal cancer tissue: relationship with cellcycle and tumor outgrowth. J. Gasteroenterol. 1999, 34: 474-480.
29. Wong, P.T.T., Goldstein, S.M., Grekin, R.C., Godwin,T.A., Pivik,C and Rigas, B., Distinct infrared spectroscopic patterns of humanbasal cell carcinoma of the skin. Cancer Res. 1993, 53: 762-765.
30. Wood, B.R., Quinn, M.A., Burden, F.R. and McNaughton, D., Aninvestigation into FT-IR spectroscopy as a bio-diagnostic tool forcervical cancer. Biospectroscopy 1996, 2: 143-153.
OL166 A. Salman et al.