LAGOS-NE: A multi-scaled geospatial and temporal database ...
Journal of Molecular Structure 998 (2011) 69–78
Contents lists available at ScienceDirect
Journal of Molecular Structure
journal homepage: www.elsevier .com/ locate /molst ruc
FT-IR, FT-Raman spectra and scaled quantum mechanical study of4-amino-1-benzylpiperidine
S. Chandra a, H. Saleem b,⇑, Y. Erdogdu c, S. Subashchandrabose b, Akhil R. Krishnan b, M.T. Gulluoglu c
a Department of Engg. Physics, Annamalai University, Annamalai Nagar 608 002, Indiab Department of Physics, Annamalai University, Annamalai Nagar 608 002, Indiac Department of Physics, Ahi Evran University, Kirsehir 40040, Turkey
a r t i c l e i n f o
Article history:Received 19 February 2011Received in revised form 6 May 2011Accepted 9 May 2011Available online 13 May 2011
Keywords:FT-IRFT-Raman4A1BPNBOHOMO–LUMO
0022-2860/$ - see front matter � 2011 Elsevier B.V. Adoi:10.1016/j.molstruc.2011.05.014
⇑ Corresponding author. Tel.: +91 9443879295.E-mail address: [email protected] (H. Sal
a b s t r a c t
In this work, we report a combined experimental and theoretical study on molecular structure, vibra-tional spectra of 4-amino-1-benzyl piperidine (4A1BP). The FT-IR and FT-Raman spectrum have beenrecorded in the region 4000–400 cm�1 and 3500–50 cm�1 respectively. The molecular geometry, har-monic vibrational frequencies and bonding features of 4A1BP have been calculated by using density func-tional theory methods with B3LYP and 6-31G(d,p) basis set. Using the same basis set NBO analysis wasperformed. The calculated HOMO and LUMO energies show that the charge transfers occur with in themolecule. The theoretical FT-IR and FT-Raman spectra for the title molecule have been constructed. Mul-liken charges were also calculated using B3LYP/6-31, 6-311, 6-311++G(d,p) level method.
� 2011 Elsevier B.V. All rights reserved.
1. Introduction using 1064 nm line of Nd-YAG laser source of 200 mw for excita-
Piperidines are an important group of heterocyclic compounds inthe field of medicinal chemistry owing to the fact that these can fre-quently be recognized in the structure of numerous naturally occur-ring alkaloid and synthetic compounds with interesting biologicaland pharmacological properties. Piperidine derivatives were also re-ported to possess analgesic [1,2] anti-inflammatory [2] central ner-vous system [3–7] local anaesthetic [3–8] anticancer [9] andantimicrobial activity [10]. Piperidine nucleus is also found in drugsas raloxifene, minaxidil [11] and as a raw material for preparingepoxy resins, corrosion inhibitors and antioxidant [12]. The vibra-tional studies of piperidine on theoretical studies of Density func-tional calculations were also reported [13–20].
The literature survey reveals DFT calculations and experimentalstudies have not been reported for the title compound (4A1BP) sofar. To fulfill the lacunae, the current investigation of FT-IR, FT-Ramanand theoretical studies are carried out and reported in this study.
2. Experimental details
A pure chemical of 4A1BP was obtained from Sigma–AldrichCompany, USA and was used as such without further purificationafter checking its melting point 110 �C to record FT-Raman andFT-IR spectra. The FT-Raman spectrum of 4A1BP has been recorded
ll rights reserved.
eem).
tion in the region 3500–50 cm�1 on a BRUKER IFS 66V spectropho-tometer. The FT-IR spectrum of this compound was recorded in theregion 4000–400 cm�1 on IFS66V spectrophotometer in KBr pellet.The spectrum was recorded at the room temperature with a scan-ning speed of 30 cm�1min�1 and the spectral width 2.0 cm�1. Thefrequencies for all sharp bands are accurate to 4 cm�1. The spectralmeasurements were carried out at RSIC, IIT, at Chennai.
3. Computational details
The DFT (B3LYP) calculations were performed using Gaussian03W [21] program package without any constraint on the geome-try [22]. Geometries of the model 4A1BP were first optimized withfull relaxation on the potential energy surfaces (C2AN15AC16AC17
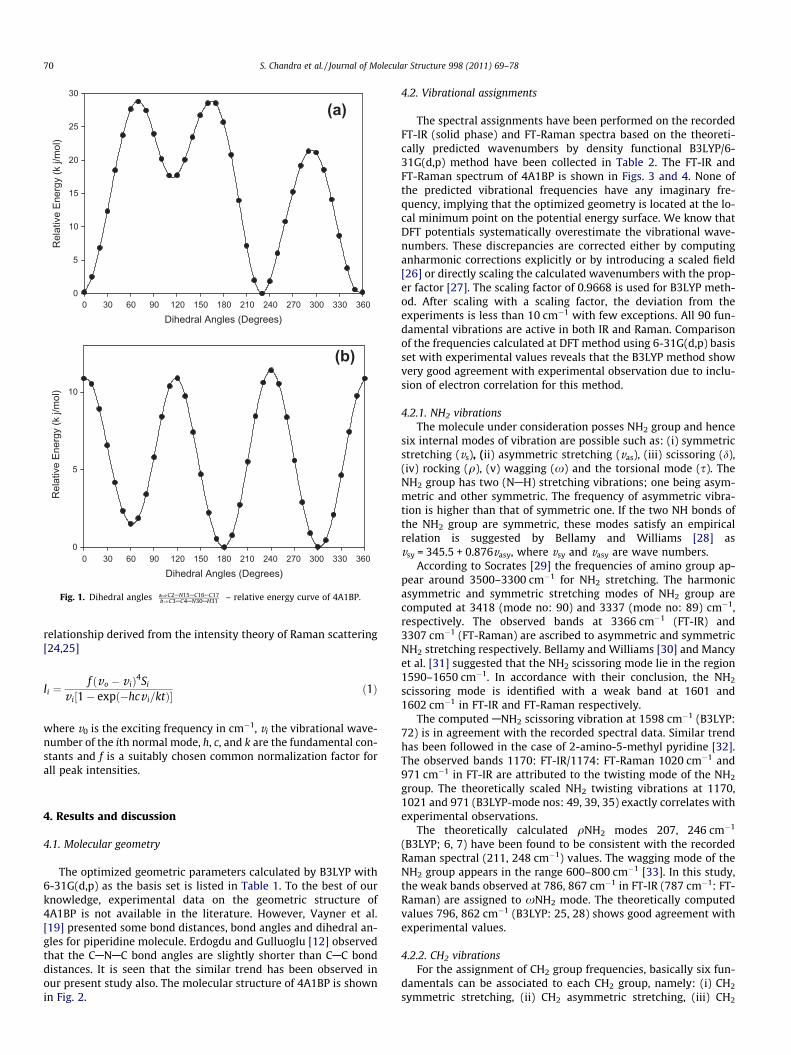
and C3AC4AN30AH31 dihedral angles) at B3LYP/6-31G(d,p) leveland the resultant geometries were used as inputs for further calcu-lations at DFT(B3LYP) level. The curves between dihedral angles(C2AN15AC16AC17 and C3AC4AN30AH31) and relative energy areshown in Fig. 1. Optimized structural parameters were used inthe vibrational frequency calculations at DFT level to characterizeall stationary points as minima using GAUSSVIEW molecular visu-alizing program [23] along with the assignments were made with ahigh degree of accuracy.
3.1. Prediction of Raman intensities
The Raman activities (Si) calculated with Gaussian 03 programconverted to relative Raman intensities (Ii) using the following
Dihedral Angles (Degrees)0 30 60 90 120 150 180 210 240 270 300 330 360
Dihedral Angles (Degrees)0 30 60 90 120 150 180 210 240 270 300 330 360
Rel
ativ
e En
ergy
(k j/
mol
)
0
5
10
15
20
25
30
(a)
Rel
ativ
e En
ergy
(k j/
mol
)
0
5
10
(b)
Fig. 1. Dihedral angles a)C2AN15AC16AC17b)C3AC4AN30AH31
� �– relative energy curve of 4A1BP.
70 S. Chandra et al. / Journal of Molecular Structure 998 (2011) 69–78
relationship derived from the intensity theory of Raman scattering[24,25]
Ii ¼f ðvo � v iÞ4Si
v i½1� expð�hcv i=ktÞ� ð1Þ
where v0 is the exciting frequency in cm�1, vi the vibrational wave-number of the ith normal mode, h, c, and k are the fundamental con-stants and f is a suitably chosen common normalization factor forall peak intensities.
4. Results and discussion
4.1. Molecular geometry
The optimized geometric parameters calculated by B3LYP with6-31G(d,p) as the basis set is listed in Table 1. To the best of ourknowledge, experimental data on the geometric structure of4A1BP is not available in the literature. However, Vayner et al.[19] presented some bond distances, bond angles and dihedral an-gles for piperidine molecule. Erdogdu and Gulluoglu [12] observedthat the CANAC bond angles are slightly shorter than CAC bonddistances. It is seen that the similar trend has been observed inour present study also. The molecular structure of 4A1BP is shownin Fig. 2.
4.2. Vibrational assignments
The spectral assignments have been performed on the recordedFT-IR (solid phase) and FT-Raman spectra based on the theoreti-cally predicted wavenumbers by density functional B3LYP/6-31G(d,p) method have been collected in Table 2. The FT-IR andFT-Raman spectrum of 4A1BP is shown in Figs. 3 and 4. None ofthe predicted vibrational frequencies have any imaginary fre-quency, implying that the optimized geometry is located at the lo-cal minimum point on the potential energy surface. We know thatDFT potentials systematically overestimate the vibrational wave-numbers. These discrepancies are corrected either by computinganharmonic corrections explicitly or by introducing a scaled field[26] or directly scaling the calculated wavenumbers with the prop-er factor [27]. The scaling factor of 0.9668 is used for B3LYP meth-od. After scaling with a scaling factor, the deviation from theexperiments is less than 10 cm�1 with few exceptions. All 90 fun-damental vibrations are active in both IR and Raman. Comparisonof the frequencies calculated at DFT method using 6-31G(d,p) basisset with experimental values reveals that the B3LYP method showvery good agreement with experimental observation due to inclu-sion of electron correlation for this method.
4.2.1. NH2 vibrationsThe molecule under consideration posses NH2 group and hence
six internal modes of vibration are possible such as: (i) symmetricstretching (vs), (ii) asymmetric stretching (vas), (iii) scissoring (d),(iv) rocking (q), (v) wagging (x) and the torsional mode (s). TheNH2 group has two (NAH) stretching vibrations; one being asym-metric and other symmetric. The frequency of asymmetric vibra-tion is higher than that of symmetric one. If the two NH bonds ofthe NH2 group are symmetric, these modes satisfy an empiricalrelation is suggested by Bellamy and Williams [28] asvsy = 345.5 + 0.876vasy, where vsy and vasy are wave numbers.
According to Socrates [29] the frequencies of amino group ap-pear around 3500–3300 cm�1 for NH2 stretching. The harmonicasymmetric and symmetric stretching modes of NH2 group arecomputed at 3418 (mode no: 90) and 3337 (mode no: 89) cm�1,respectively. The observed bands at 3366 cm�1 (FT-IR) and3307 cm�1 (FT-Raman) are ascribed to asymmetric and symmetricNH2 stretching respectively. Bellamy and Williams [30] and Mancyet al. [31] suggested that the NH2 scissoring mode lie in the region1590–1650 cm�1. In accordance with their conclusion, the NH2
scissoring mode is identified with a weak band at 1601 and1602 cm�1 in FT-IR and FT-Raman respectively.
The computed ANH2 scissoring vibration at 1598 cm�1 (B3LYP:72) is in agreement with the recorded spectral data. Similar trendhas been followed in the case of 2-amino-5-methyl pyridine [32].The observed bands 1170: FT-IR/1174: FT-Raman 1020 cm�1 and971 cm�1 in FT-IR are attributed to the twisting mode of the NH2
group. The theoretically scaled NH2 twisting vibrations at 1170,1021 and 971 (B3LYP-mode nos: 49, 39, 35) exactly correlates withexperimental observations.
The theoretically calculated qNH2 modes 207, 246 cm�1
(B3LYP; 6, 7) have been found to be consistent with the recordedRaman spectral (211, 248 cm�1) values. The wagging mode of theNH2 group appears in the range 600–800 cm�1 [33]. In this study,the weak bands observed at 786, 867 cm�1 in FT-IR (787 cm�1: FT-Raman) are assigned to xNH2 mode. The theoretically computedvalues 796, 862 cm�1 (B3LYP: 25, 28) shows good agreement withexperimental values.
4.2.2. CH2 vibrationsFor the assignment of CH2 group frequencies, basically six fun-
damentals can be associated to each CH2 group, namely: (i) CH2
symmetric stretching, (ii) CH2 asymmetric stretching, (iii) CH2
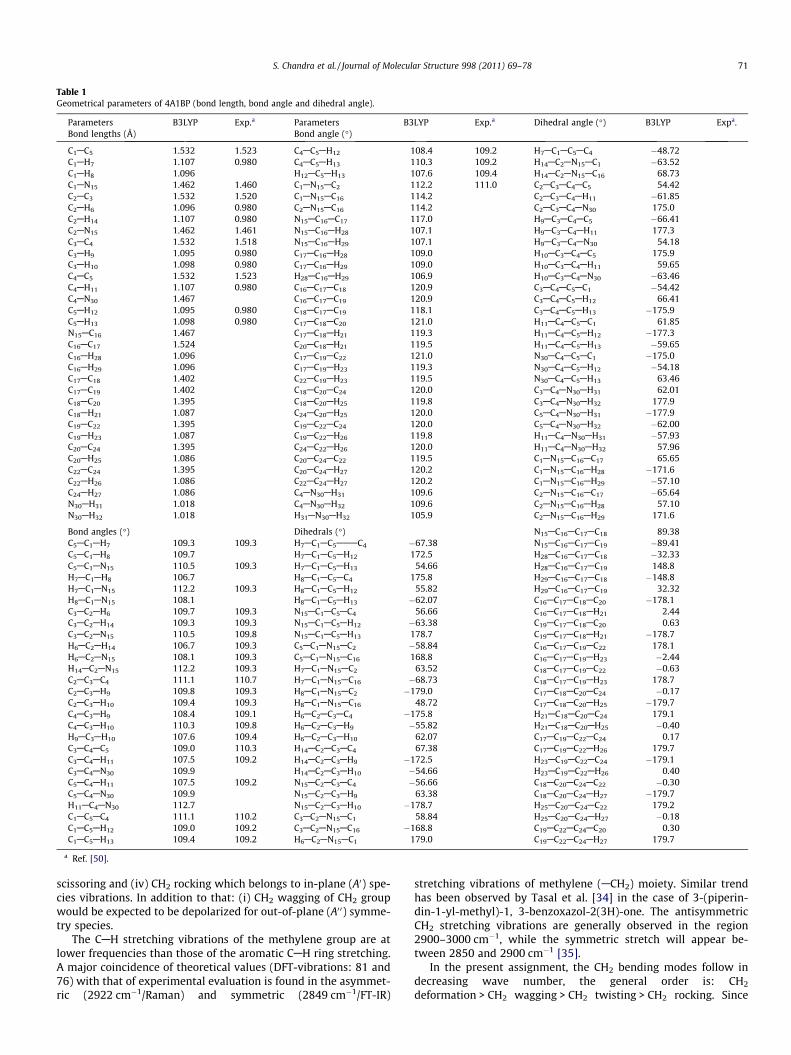
Table 1Geometrical parameters of 4A1BP (bond length, bond angle and dihedral angle).
Parameters B3LYP Exp.a Parameters B3LYP Exp.a Dihedral angle (�) B3LYP Expa.Bond lengths (Å) Bond angle (�)
C1AC5 1.532 1.523 C4AC5AH12 108.4 109.2 H7AC1AC5AC4 �48.72C1AH7 1.107 0.980 C4AC5AH13 110.3 109.2 H14AC2AN15AC1 �63.52C1AH8 1.096 H12AC5AH13 107.6 109.4 H14AC2AN15AC16 68.73C1AN15 1.462 1.460 C1AN15AC2 112.2 111.0 C2AC3AC4AC5 54.42C2AC3 1.532 1.520 C1AN15AC16 114.2 C2AC3AC4AH11 �61.85C2AH6 1.096 0.980 C2AN15AC16 114.2 C2AC3AC4AN30 175.0C2AH14 1.107 0.980 N15AC16AC17 117.0 H9AC3AC4AC5 �66.41C2AN15 1.462 1.461 N15AC16AH28 107.1 H9AC3AC4AH11 177.3C3AC4 1.532 1.518 N15AC16AH29 107.1 H9AC3AC4AN30 54.18C3AH9 1.095 0.980 C17AC16AH28 109.0 H10AC3AC4AC5 175.9C3AH10 1.098 0.980 C17AC16AH29 109.0 H10AC3AC4AH11 59.65C4AC5 1.532 1.523 H28AC16AH29 106.9 H10AC3AC4AN30 �63.46C4AH11 1.107 0.980 C16AC17AC18 120.9 C3AC4AC5AC1 �54.42C4AN30 1.467 C16AC17AC19 120.9 C3AC4AC5AH12 66.41C5AH12 1.095 0.980 C18AC17AC19 118.1 C3AC4AC5AH13 �175.9C5AH13 1.098 0.980 C17AC18AC20 121.0 H11AC4AC5AC1 61.85N15AC16 1.467 C17AC18AH21 119.3 H11AC4AC5AH12 �177.3C16AC17 1.524 C20AC18AH21 119.5 H11AC4AC5AH13 �59.65C16AH28 1.096 C17AC19AC22 121.0 N30AC4AC5AC1 �175.0C16AH29 1.096 C17AC19AH23 119.3 N30AC4AC5AH12 �54.18C17AC18 1.402 C22AC19AH23 119.5 N30AC4AC5AH13 63.46C17AC19 1.402 C18AC20AC24 120.0 C3AC4AN30AH31 62.01C18AC20 1.395 C18AC20AH25 119.8 C3AC4AN30AH32 177.9C18AH21 1.087 C24AC20AH25 120.0 C5AC4AN30AH31 �177.9C19AC22 1.395 C19AC22AC24 120.0 C5AC4AN30AH32 �62.00C19AH23 1.087 C19AC22AH26 119.8 H11AC4AN30AH31 �57.93C20AC24 1.395 C24AC22AH26 120.0 H11AC4AN30AH32 57.96C20AH25 1.086 C20AC24AC22 119.5 C1AN15AC16AC17 65.65C22AC24 1.395 C20AC24AH27 120.2 C1AN15AC16AH28 �171.6C22AH26 1.086 C22AC24AH27 120.2 C1AN15AC16AH29 �57.10C24AH27 1.086 C4AN30AH31 109.6 C2AN15AC16AC17 �65.64N30AH31 1.018 C4AN30AH32 109.6 C2AN15AC16AH28 57.10N30AH32 1.018 H31AN30AH32 105.9 C2AN15AC16AH29 171.6
Bond angles (�) Dihedrals (�) N15AC16AC17AC18 89.38C5AC1AH7 109.3 109.3 H7AC1AC5AAAC4 �67.38 N15AC16AC17AC19 �89.41C5AC1AH8 109.7 H7AC1AC5AH12 172.5 H28AC16AC17AC18 �32.33C5AC1AN15 110.5 109.3 H7AC1AC5AH13 54.66 H28AC16AC17AC19 148.8H7AC1AH8 106.7 H8AC1AC5AC4 175.8 H29AC16AC17AC18 �148.8H7AC1AN15 112.2 109.3 H8AC1AC5AH12 55.82 H29AC16AC17AC19 32.32H8AC1AN15 108.1 H8AC1AC5AH13 �62.07 C16AC17AC18AC20 �178.1C3AC2AH6 109.7 109.3 N15AC1AC5AC4 56.66 C16AC17AC18AH21 2.44C3AC2AH14 109.3 109.3 N15AC1AC5AH12 �63.38 C19AC17AC18AC20 0.63C3AC2AN15 110.5 109.8 N15AC1AC5AH13 178.7 C19AC17AC18AH21 �178.7H6AC2AH14 106.7 109.3 C5AC1AN15AC2 �58.84 C16AC17AC19AC22 178.1H6AC2AN15 108.1 109.3 C5AC1AN15AC16 168.8 C16AC17AC19AH23 �2.44H14AC2AN15 112.2 109.3 H7AC1AN15AC2 63.52 C18AC17AC19AC22 �0.63C2AC3AC4 111.1 110.7 H7AC1AN15AC16 �68.73 C18AC17AC19AH23 178.7C2AC3AH9 109.8 109.3 H8AC1AN15AC2 �179.0 C17AC18AC20AC24 �0.17C2AC3AH10 109.4 109.3 H8AC1AN15AC16 48.72 C17AC18AC20AH25 �179.7C4AC3AH9 108.4 109.1 H6AC2AC3AC4 �175.8 H21AC18AC20AC24 179.1C4AC3AH10 110.3 109.8 H6AC2AC3AH9 �55.82 H21AC18AC20AH25 �0.40H9AC3AH10 107.6 109.4 H6AC2AC3AH10 62.07 C17AC19AC22AC24 0.17C3AC4AC5 109.0 110.3 H14AC2AC3AC4 67.38 C17AC19AC22AH26 179.7C3AC4AH11 107.5 109.2 H14AC2AC3AH9 �172.5 H23AC19AC22AC24 �179.1C3AC4AN30 109.9 H14AC2AC3AH10 �54.66 H23AC19AC22AH26 0.40C5AC4AH11 107.5 109.2 N15AC2AC3AC4 �56.66 C18AC20AC24AC22 �0.30C5AC4AN30 109.9 N15AC2AC3AH9 63.38 C18AC20AC24AH27 �179.7H11AC4AN30 112.7 N15AC2AC3AH10 �178.7 H25AC20AC24AC22 179.2C1AC5AC4 111.1 110.2 C3AC2AN15AC1 58.84 H25AC20AC24AH27 �0.18C1AC5AH12 109.0 109.2 C3AC2AN15AC16 �168.8 C19AC22AC24AC20 0.30C1AC5AH13 109.4 109.2 H6AC2AN15AC1 179.0 C19AC22AC24AH27 179.7
a Ref. [50].
S. Chandra et al. / Journal of Molecular Structure 998 (2011) 69–78 71
scissoring and (iv) CH2 rocking which belongs to in-plane (A0) spe-cies vibrations. In addition to that: (i) CH2 wagging of CH2 groupwould be expected to be depolarized for out-of-plane (A0 0) symme-try species.
The CAH stretching vibrations of the methylene group are atlower frequencies than those of the aromatic CAH ring stretching.A major coincidence of theoretical values (DFT-vibrations: 81 and76) with that of experimental evaluation is found in the asymmet-ric (2922 cm�1/Raman) and symmetric (2849 cm�1/FT-IR)
stretching vibrations of methylene (ACH2) moiety. Similar trendhas been observed by Tasal et al. [34] in the case of 3-(piperin-din-1-yl-methyl)-1, 3-benzoxazol-2(3H)-one. The antisymmetricCH2 stretching vibrations are generally observed in the region2900–3000 cm�1, while the symmetric stretch will appear be-tween 2850 and 2900 cm�1 [35].
In the present assignment, the CH2 bending modes follow indecreasing wave number, the general order is: CH2
deformation > CH2 wagging > CH2 twisting > CH2 rocking. Since
Fig. 2. Optimized molecular structure of 4A1BP.
72 S. Chandra et al. / Journal of Molecular Structure 998 (2011) 69–78
the bending modes involving hydrogen atom attached to the cen-tral carbon fall into the 1450–875 cm�1 range. There is extensivevibrational coupling of these modes with CH2 deformation partic-ularly with the CH2 twist. It is notable that both CH2 scissoringand CH2 rocking were sensitive to the molecular conformation.The fundamental CH2 vibrations are able to show scissoring, wag-ging, twisting and rocking modes and presently appear in the ex-pected frequency regions 1500–800 cm�1 [18].
These vibrations revealed to be mixed with CAC and CANstretching. In FT-IR spectrum of 4A1BP, the weak bands at1466 cm�1 and 1453 cm�1 assigned to CH2 scissoring vibration.The same vibration in FT-Raman is observed at 1453 cm�1. Thetheoretical wave number of CH2 scissoring vibrations 1452 and1466 cm�1 (B3LYP-mode nos: 67, 68) are incidentally coincide verywell with experimental values. These assignments find supportfrom the work of Gulluoglu et al. [11] and are within the frequencyintervals given by Vedal et al. [18].
The FT-IR wagging mode in the range 1296–1366 cm�1 corre-sponding to CH2 was calculated to be in the range 1296–1371 cm�1 (B3LYP-mode nos: 54, 61). The present assignmentsagree well with the values available in literature [11]. In the pres-ent work, the FT-IR frequencies observed in the range 971–1170 cm�1 have been assigned to CH2 twisting vibrations. The cor-responding vibrations appear in the FT-Raman spectrum at1174 cm�1. The theoretically computed values in the range 971–1170 cm�1 (mode nos: 35, 42, 44, 45, 49) shows excellent agree-ment with experimental data by B3LYP/6-31G(d,p) method. Theseassignments find support from the work of Sebastian and Sundara-ganesan [20] in the case of 4-hydroxy piperidine.
The CH2 rocking vibrations calculated to be 487, 396 cm�1
(B3LYP-mode nos: 17, 12) is also in excellent agreement with re-corded value of 487 cm�1 (FT-IR/Raman) and 395 cm�1 in Ramanspectrum. This is in agreement with Gulluoglu et al. [11].
4.2.3. CAH vibrationsThe heteroaromatic structure shows the presence of CAH
stretching with in the region 3000–3100 cm�1 which is the charac-teristic region for the ready identification of CAH stretching vibra-tions and typically exhibit weak bands compared with the aliphaticCAH stretching [36–38]. The most organic compounds containingCAH bands show SP3 CAH stretching in the region 2850–3000 cm�1, whereas SP2 CAH stretching appears above3000 cm�1 [34]. The vibrations (B3LYP-mode nos: 84–88) assignedto aromatic CAH stretching in the region 3045–3079 cm�1, whichare in agreement with experimental assignment in the range of3003–3061 cm�1. These results are supported by the literature
[34]. The aromatic CH in-plane bending modes of benzene andits derivatives are observed in the region 1000–1300 cm�1 [39].The bands observed in the FT-IR spectrum 1296, 1170,1143 cm�1 and FT-Raman spectrum 1287, 1174 cm�1 are assignedto CAH in-plane bending vibration of 4A1BP. The theoreticallycomputed values by B3LYP method at 1296 and 1140 (mode nos:54 and 46) show good agreement with recorded data. The CAHout-of-plane deformation is observed between 1000 and700 cm�1 [40]. Generally CAH out-of-plane deformation modesowned by highest wave numbers have weaker intensity than thoseabsorbing at lower wave numbers [41]. Accordingly, in 4A1BPcompound the CAH out-of-plane deformation are observed at906, 867 and 829 cm�1. The scaled frequencies (958, 934, 897,829, 803 (B3LYP-mode nos: 33, 31, 30, 27, 26) reproduce wellthe experimental ones. These assignments also find support fromTasal et al. [34].
4.2.4. CAC vibrationsTasal et al. [34] assigned CAC stretching vibrations are in the
range 1453–1625 cm�1 in the case of 3-(piperidine-1-yl-methyl)-1, 3-benzoxazol-2(3H)-one. As can be seen from Table 2, the ob-served frequencies in the range 1453–1602 cm�1 are belongs tothe same mode. While the harmonic frequencies are in the rangeof 1436–1595 cm�1 (DFT mode nos: 65, 69–71). In the presentwork we observed CACAC stretching at 1003 (Raman) and983 cm�1 (FT-IR) and ring trigonal bending at 971 cm�1 (FT-IR).These assignments are supported by theoretical values 1015 and977 cm�1 (DFT mode nos: 38, 36) respectively. The bands (FT-IR)at 603, (620: Raman), 487, 464, (463: Raman), 416 cm�1 are desig-nated to b(CACAC) and c(CACAC) vibrations respectively. The the-oretically calculated CACAC in-plane and out-of-plane bendingmodes have been found to be consistent with the recorded spectravalues.
4.2.5. CANH2, CAN and CANAC vibrationsThe FT-Raman/FT-IR stretching mode 1088 cm�1 corresponding
to CANH2 moiety was calculated to be 1062 cm�1 (DFT: mode no-40). The CANH2 out-of-plane vibration calculated at 251 cm�1
(DFT: mode no-8) which is also in agreement with the assignmentin the experimental data. The identification of CAN vibrations is avery difficult task, since the mixing of several bands is possible inthe region. Silverstein et al. [42] assign CAN stretching absorptionin the region 1382–1266 cm�1 for aromatic amines. In 3-(piperi-dine-1-yl-methyl)-1,3-benzoxazol-2(3H)-one, the CAN stretchingbands are found to be in the region 1024–1271 cm�1 [34]. TheCAN stretching mode is assigned in the region 1055–1224 cm�1
for 2-methyl piperidine by Erdogdu and Gulluoglu [12]. In thepresent work, the FT-IR/FT-Raman bands observed at 1088 cm�1
and 1131 cm�1: FT-IR are assigned to CAN stretching mode. Thetheoretically calculated values of CAN stretching vibrations inthe region 1062–1101 cm�1 (mode nos: 40, 42 and 43) coincideswith experimental data and also find support from literature val-ues [20]. The CANAC in-plane bending vibration assigned at633 cm�1 (FT-IR) and the CANAC out-of-plane bending vibrationfound at 395 cm�1 (Raman). These assignments are in agreementwith calculated frequencies by B3LYP/6-31G(d,p) method (modenos: 20 and 11) and also find supported from the literature valuesin the case of nicotinamide [43].
5. Thermodynamic properties
Entropy of the title compound is presented in Table 3. Scale fac-tors have been recommended [44] for an accurate prediction indetermining the zero-point vibration energies (ZPVE), and the en-tropy, Svib (T). The variations in the ZPVE’s seem to be insignificant.
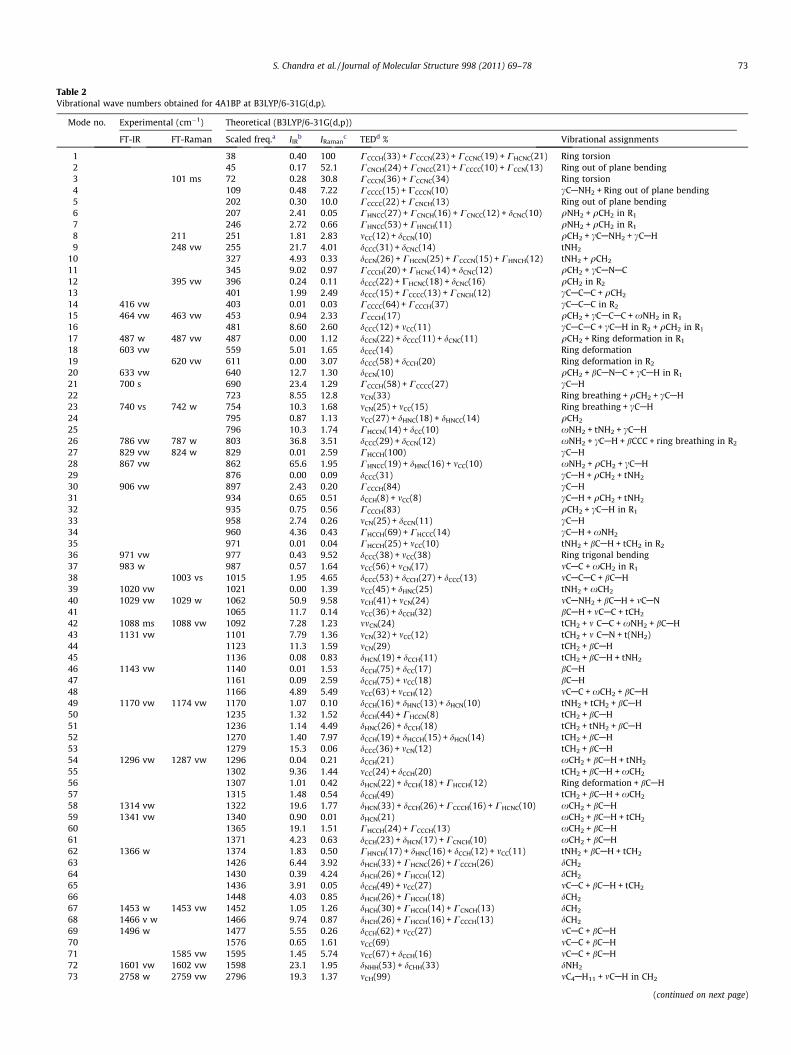
Table 2Vibrational wave numbers obtained for 4A1BP at B3LYP/6-31G(d,p).
Mode no. Experimental (cm�1) Theoretical (B3LYP/6-31G(d,p))
FT-IR FT-Raman Scaled freq.a IIRb IRaman
c TEDd % Vibrational assignments
1 38 0.40 100 CCCCH(33) + CCCCN(23) + CCCNC(19) + CHCNC(21) Ring torsion2 45 0.17 52.1 CCNCH(24) + CCNCC(21) + CCCCC(10) + CCCN(13) Ring out of plane bending3 101 ms 72 0.28 30.8 CCCCN(36) + CCCNC(34) Ring torsion4 109 0.48 7.22 CCCCC(15) + CCCCN(10) cCANH2 + Ring out of plane bending5 202 0.30 10.0 CCCCC(22) + CCNCH(13) Ring out of plane bending6 207 2.41 0.05 CHNCC(27) + CCNCH(16) + CCNCC(12) + dCNC(10) qNH2 + qCH2 in R1
7 246 2.72 0.66 CHNCC(53) + CHNCH(11) qNH2 + qCH2 in R1
8 211 251 1.81 2.83 mCC(12) + dCCN(10) qCH2 + cCANH2 + cCAH9 248 vw 255 21.7 4.01 dCCC(31) + dCNC(14) tNH2
10 327 4.93 0.33 dCCN(26) + CHCCN(25) + CCCCN(15) + CHNCH(12) tNH2 + qCH2
11 345 9.02 0.97 CCCCH(20) + CHCNC(14) + dCNC(12) qCH2 + cCANAC12 395 vw 396 0.24 0.11 dCCC(22) + CHCNC(18) + dCNC(16) qCH2 in R2
13 401 1.99 2.49 dCCC(15) + CCCCC(13) + CCNCH(12) cCACAC + qCH2
14 416 vw 403 0.01 0.03 CCCCC(64) + CCCCH(37) cCACAC in R2
15 464 vw 463 vw 453 0.94 2.33 CCCCH(17) qCH2 + cCACAC + xNH2 in R1
16 481 8.60 2.60 dCCC(12) + mCC(11) cCACAC + cCAH in R2 + qCH2 in R1
17 487 w 487 vw 487 0.00 1.12 dCCN(22) + dCCC(11) + dCNC(11) qCH2 + Ring deformation in R1
18 603 vw 559 5.01 1.65 dCCC(14) Ring deformation19 620 vw 611 0.00 3.07 dCCC(58) + dCCH(20) Ring deformation in R2
20 633 vw 640 12.7 1.30 dCCN(10) qCH2 + bCANAC + cCAH in R1
21 700 s 690 23.4 1.29 CCCCH(58) + CCCCC(27) cCAH22 723 8.55 12.8 mCN(33) Ring breathing + qCH2 + cCAH23 740 vs 742 w 754 10.3 1.68 mCN(25) + mCC(15) Ring breathing + cCAH24 795 0.87 1.13 mCC(27) + dHNC(18) + dHNCC(14) qCH2
25 796 10.3 1.74 CHCCN(14) + dCC(10) xNH2 + tNH2 + cCAH26 786 vw 787 w 803 36.8 3.51 dCCC(29) + dCCN(12) xNH2 + cCAH + bCCC + ring breathing in R2
27 829 vw 824 w 829 0.01 2.59 CHCCH(100) cCAH28 867 vw 862 65.6 1.95 CHNCC(19) + dHNC(16) + mCC(10) xNH2 + qCH2 + cCAH29 876 0.00 0.09 dCCC(31) cCAH + qCH2 + tNH2
30 906 vw 897 2.43 0.20 CCCCH(84) cCAH31 934 0.65 0.51 dCCH(8) + mCC(8) cCAH + qCH2 + tNH2
32 935 0.75 0.56 CCCCH(83) qCH2 + cCAH in R1
33 958 2.74 0.26 mCN(25) + dCCN(11) cCAH34 960 4.36 0.43 CHCCH(69) + CHCCC(14) cCAH + xNH2
35 971 0.01 0.04 CHCCH(25) + mCC(10) tNH2 + bCAH + tCH2 in R2
36 971 vw 977 0.43 9.52 dCCC(38) + mCC(38) Ring trigonal bending37 983 w 987 0.57 1.64 mCC(56) + mCN(17) mCAC + xCH2 in R1
38 1003 vs 1015 1.95 4.65 dCCC(53) + dCCH(27) + dCCC(13) mCACAC + bCAH39 1020 vw 1021 0.00 1.39 mCC(45) + dHNC(25) tNH2 + xCH2
40 1029 vw 1029 w 1062 50.9 9.58 mCH(41) + mCN(24) mCANH2 + bCAH + mCAN41 1065 11.7 0.14 mCC(36) + dCCH(32) bCAH + mCAC + tCH2
42 1088 ms 1088 vw 1092 7.28 1.23 mmCN(24) tCH2 + m CAC + xNH2 + bCAH43 1131 vw 1101 7.79 1.36 mCN(32) + mCC(12) tCH2 + m CAN + t(NH2)44 1123 11.3 1.59 mCN(29) tCH2 + bCAH45 1136 0.08 0.83 dHCN(19) + dCCH(11) tCH2 + bCAH + tNH2
46 1143 vw 1140 0.01 1.53 dCCH(75) + dCC(17) bCAH47 1161 0.09 2.59 dCCH(75) + mCC(18) bCAH48 1166 4.89 5.49 mCC(63) + mCCH(12) mCAC + xCH2 + bCAH49 1170 vw 1174 vw 1170 1.07 0.10 dCCH(16) + dHNC(13) + dHCN(10) tNH2 + tCH2 + bCAH50 1235 1.32 1.52 dCCH(44) + CHCCN(8) tCH2 + bCAH51 1236 1.14 4.49 dHNC(26) + dCCH(18) tCH2 + tNH2 + bCAH52 1270 1.40 7.97 dCCH(19) + dHCCH(15) + dHCN(14) tCH2 + bCAH53 1279 15.3 0.06 dCCC(36) + mCN(12) tCH2 + bCAH54 1296 vw 1287 vw 1296 0.04 0.21 dCCH(21) xCH2 + bCAH + tNH2
55 1302 9.36 1.44 mCC(24) + dCCH(20) tCH2 + bCAH + xCH2
56 1307 1.01 0.42 dHCN(22) + dCCH(18) + CHCCH(12) Ring deformation + bCAH57 1315 1.48 0.54 dCCH(49) tCH2 + bCAH + xCH2
58 1314 vw 1322 19.6 1.77 dHCN(33) + dCCH(26) + CCCCH(16) + CHCNC(10) xCH2 + bCAH59 1341 vw 1340 0.90 0.01 dHCN(21) xCH2 + bCAH + tCH2
60 1365 19.1 1.51 CHCCH(24) + CCCCH(13) xCH2 + bCAH61 1371 4.23 0.63 dCCH(23) + dHCN(17) + CCNCH(10) xCH2 + bCAH62 1366 w 1374 1.83 0.50 CHNCH(17) + dHNC(16) + dCCH(12) + mCC(11) tNH2 + bCAH + tCH2
63 1426 6.44 3.92 dHCH(33) + CHCNC(26) + CCCCH(26) dCH2
64 1430 0.39 4.24 dHCH(26) + CHCCH(12) dCH2
65 1436 3.91 0.05 dCCH(49) + mCC(27) mCAC + bCAH + tCH2
66 1448 4.03 0.85 dHCH(26) + CHCCH(18) dCH2
67 1453 w 1453 vw 1452 1.05 1.26 dHCH(30) + CHCCH(14) + CCNCH(13) dCH2
68 1466 v w 1466 9.74 0.87 dHCH(26) + CHCCH(16) + CCCCH(13) dCH2
69 1496 w 1477 5.55 0.26 dCCH(62) + mCC(27) mCAC + bCAH70 1576 0.65 1.61 mCC(69) mCAC + bCAH71 1585 vw 1595 1.45 5.74 mCC(67) + dCCH(16) mCAC + bCAH72 1601 vw 1602 vw 1598 23.1 1.95 dNHH(53) + dCHH(33) dNH2
73 2758 w 2759 vw 2796 19.3 1.37 mCH(99) mC4AH11 + mCAH in CH2
(continued on next page)
S. Chandra et al. / Journal of Molecular Structure 998 (2011) 69–78 73
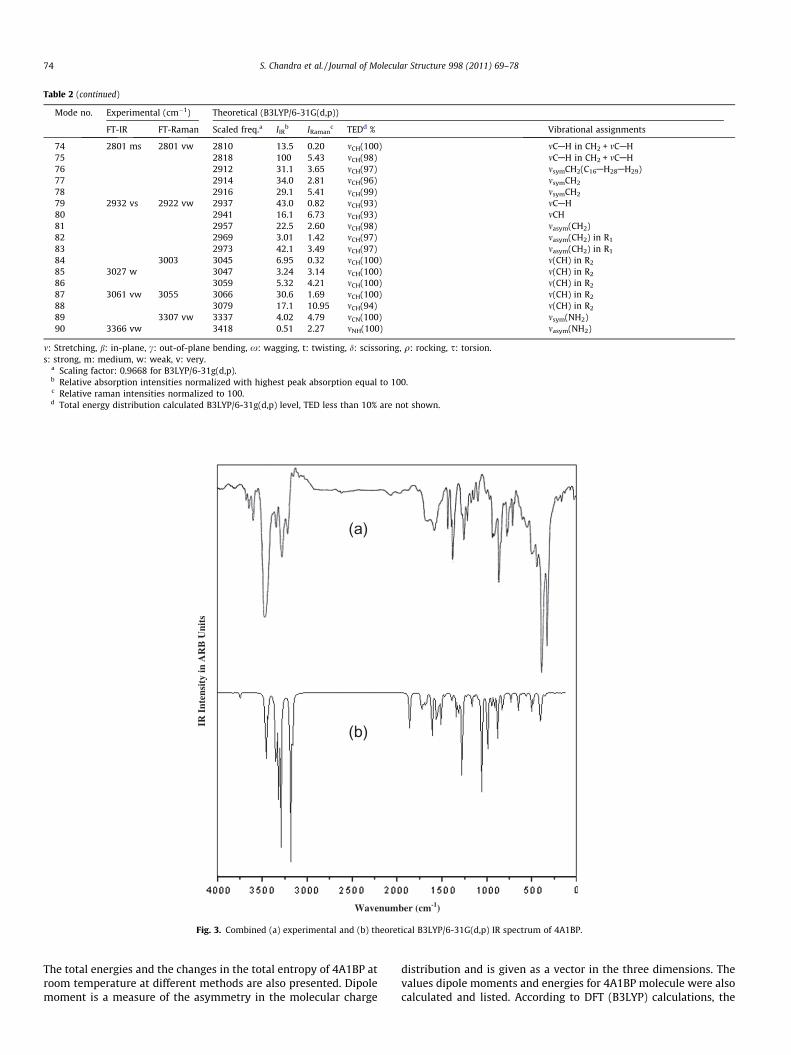
Table 2 (continued)
Mode no. Experimental (cm�1) Theoretical (B3LYP/6-31G(d,p))
FT-IR FT-Raman Scaled freq.a IIRb IRaman
c TEDd % Vibrational assignments
74 2801 ms 2801 vw 2810 13.5 0.20 mCH(100) mCAH in CH2 + mCAH75 2818 100 5.43 mCH(98) mCAH in CH2 + mCAH76 2912 31.1 3.65 mCH(97) msymCH2(C16AH28AH29)77 2914 34.0 2.81 mCH(96) msymCH2
78 2916 29.1 5.41 mCH(99) msymCH2
79 2932 vs 2922 vw 2937 43.0 0.82 mCH(93) mCAH80 2941 16.1 6.73 mCH(93) mCH81 2957 22.5 2.60 mCH(98) masym(CH2)82 2969 3.01 1.42 mCH(97) masym(CH2) in R1
83 2973 42.1 3.49 mCH(97) masym(CH2) in R1
84 3003 3045 6.95 0.32 mCH(100) m(CH) in R2
85 3027 w 3047 3.24 3.14 mCH(100) m(CH) in R2
86 3059 5.32 4.21 mCH(100) m(CH) in R2
87 3061 vw 3055 3066 30.6 1.69 mCH(100) m(CH) in R2
88 3079 17.1 10.95 mCH(94) m(CH) in R2
89 3307 vw 3337 4.02 4.79 mCN(100) msym(NH2)90 3366 vw 3418 0.51 2.27 mNH(100) masym(NH2)
m: Stretching, b: in-plane, c: out-of-plane bending, x: wagging, t: twisting, d: scissoring, q: rocking, s: torsion.s: strong, m: medium, w: weak, v: very.
a Scaling factor: 0.9668 for B3LYP/6-31g(d,p).b Relative absorption intensities normalized with highest peak absorption equal to 100.c Relative raman intensities normalized to 100.d Total energy distribution calculated B3LYP/6-31g(d,p) level, TED less than 10% are not shown.
Fig. 3. Combined (a) experimental and (b) theoretical B3LYP/6-31G(d,p) IR spectrum of 4A1BP.
74 S. Chandra et al. / Journal of Molecular Structure 998 (2011) 69–78
The total energies and the changes in the total entropy of 4A1BP atroom temperature at different methods are also presented. Dipolemoment is a measure of the asymmetry in the molecular charge
distribution and is given as a vector in the three dimensions. Thevalues dipole moments and energies for 4A1BP molecule were alsocalculated and listed. According to DFT (B3LYP) calculations, the

Fig. 4. Combined (a) experimental and (b) theoretical B3LYP/6-31G(d,p) Raman spectrum of 4A1BP.
Table 3Theoretically computed energies, zero-point vibrational energies (kcal/mol), rota-tional constants (GHz), entropy (cal/mol K�1), dipole moment (D) and energy gap(a.u) for 4A1BP.
Parameters B3LYP/6-31G(d,p)
Total energies �577.636Zero point energy 179.199Rotational constants 1.5478, 0.3386, 0.3274
EntropyTotal 111.812Translational 41.634Rotational 31.905Vibrational 38.274Dipole moment (D) 1.2029HOMO (a.u) �0.20325LUMO (a.u) �0.00067Energy gap 0.20258
S. Chandra et al. / Journal of Molecular Structure 998 (2011) 69–78 75
largest dipole moment and the lowest energy were observed forB3LYP/6-31G(d,p).
6. HOMO and LUMO analysis
Many organic molecules, containing conjugated p electrons arecharacterized by large values of molecular first hyperpolarizabili-ties, were analyzed by means of vibrational spectroscopy [45,46].In most cases, even in the absence of inversion symmetry, thestrongest bands in the Raman spectrum are weak in the IR spec-trum and vice versa. But the intramolecular charge transfer fromthe donor to accepter group through a single–double bond conju-gated path can induce large variations of both the molecular dipole
moment and the molecular polarizability, making IR and Ramanactivity strong at the same time. The experimental spectroscopicbehavior described above is well accounted for by ab initio calcula-tions in p conjugated systems that predict exceptionally large Ra-man and infrared intensities for the some normal modes [45]. It isalso observed in our title molecule the bands in FT-IR spectrumhave their counterparts in Raman shows that the relative intensi-ties in IR and Raman spectra are comparable resulting from theelectron cloud movement through p conjugated frame work fromelectron donor to electron acceptor groups. The analysis of thewave function indicates that the electron absorption correspondsto the transition from the ground to the first excited state and ismainly described by one-electron excitation from the highest occu-pied molecular orbital (HOMO) to the lowest unoccupied molecu-lar orbital (LUMO). The LUMO of p nature, (i.e. heterocyclic ring) isdelocalized over the whole CAC and CAN bond. The HOMO–LUMOenergy gap of 4A1BP was calculated at the B3LYP/6-31G(d,p) leveland are shown in Fig. 5 which reveals that the energy gap reflectthe chemical activity of the molecule. LUMO as an electron accep-tor represents the ability to obtain an electron, HOMO representsthe ability to donate an electron. The energy gap of 4A1BP was tab-ulated in Table 3.
7. NBO analysis
NBO analysis provides the most accurate possible ‘natural Lewisstructure’ picture of ø, because all orbital details are mathemati-cally chosen to include the highest possible percentage of the elec-tron density. A useful aspect of the NBO method is that it givesinformation about interactions in both filled and virtual orbitalspaces that could enhance the analysis of intra- and intermolecular
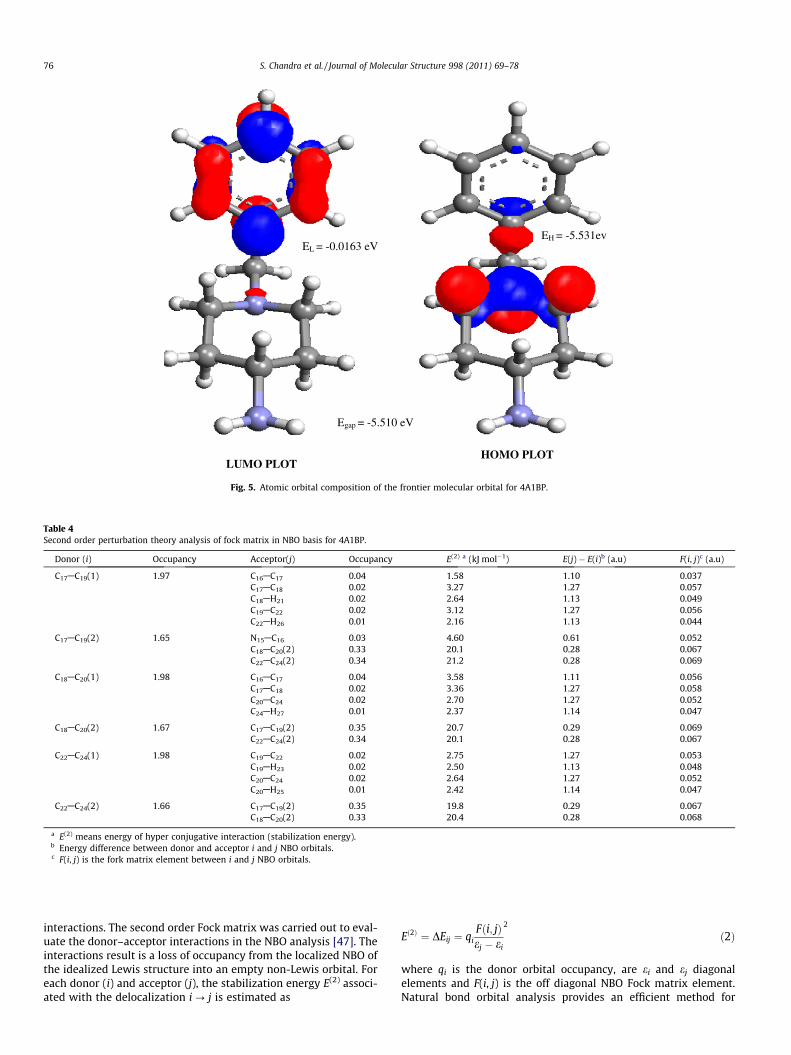
EL = -0.0163 eV EH = -5.531ev
Egap = -5.510 eV
LUMO PLOTHOMO PLOT
Fig. 5. Atomic orbital composition of the frontier molecular orbital for 4A1BP.
Table 4Second order perturbation theory analysis of fock matrix in NBO basis for 4A1BP.
Donor (i) Occupancy Acceptor(j) Occupancy E(2) a (kJ mol�1) E(j) � E(i)b (a.u) F(i, j)c (a.u)
C17AC19(1) 1.97 C16AC17 0.04 1.58 1.10 0.037C17AC18 0.02 3.27 1.27 0.057C18AH21 0.02 2.64 1.13 0.049C19AC22 0.02 3.12 1.27 0.056C22AH26 0.01 2.16 1.13 0.044
C17AC19(2) 1.65 N15AC16 0.03 4.60 0.61 0.052C18AC20(2) 0.33 20.1 0.28 0.067C22AC24(2) 0.34 21.2 0.28 0.069
C18AC20(1) 1.98 C16AC17 0.04 3.58 1.11 0.056C17AC18 0.02 3.36 1.27 0.058C20AC24 0.02 2.70 1.27 0.052C24AH27 0.01 2.37 1.14 0.047
C18AC20(2) 1.67 C17AC19(2) 0.35 20.7 0.29 0.069C22AC24(2) 0.34 20.1 0.28 0.067
C22AC24(1) 1.98 C19AC22 0.02 2.75 1.27 0.053C19AH23 0.02 2.50 1.13 0.048C20AC24 0.02 2.64 1.27 0.052C20AH25 0.01 2.42 1.14 0.047
C22AC24(2) 1.66 C17AC19(2) 0.35 19.8 0.29 0.067C18AC20(2) 0.33 20.4 0.28 0.068
a E(2) means energy of hyper conjugative interaction (stabilization energy).b Energy difference between donor and acceptor i and j NBO orbitals.c F(i, j) is the fork matrix element between i and j NBO orbitals.
76 S. Chandra et al. / Journal of Molecular Structure 998 (2011) 69–78
interactions. The second order Fock matrix was carried out to eval-uate the donor–acceptor interactions in the NBO analysis [47]. Theinteractions result is a loss of occupancy from the localized NBO ofthe idealized Lewis structure into an empty non-Lewis orbital. Foreach donor (i) and acceptor (j), the stabilization energy E(2) associ-ated with the delocalization i ? j is estimated as
Eð2Þ ¼ DEij ¼ qiFði; jÞej � ei
2
ð2Þ
where qi is the donor orbital occupancy, are ei and ej diagonalelements and F(i, j) is the off diagonal NBO Fock matrix element.Natural bond orbital analysis provides an efficient method for
Atoms
Cha
rges
C1 C2
C3
C4
C5
N15
C16
C17
C18
C19
C20
C22
C24
N30
H6 H8 H9
H10
H11 H7
H12 H13
H14
H21
H23
H25
H26
H27
H28
H29
H31 H32
-0,8
-0,6
-0,4
-0,2
0,0
0,2
0,4
Fig. 6. Mulliken’s plot for 4A1BP.
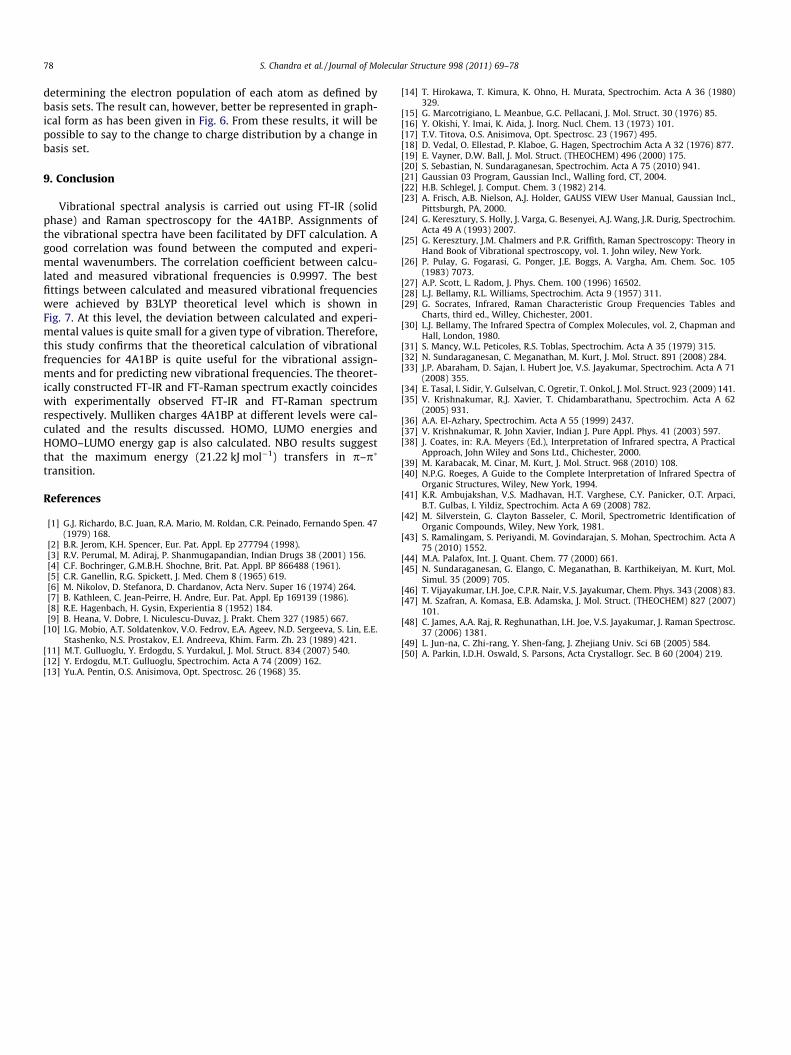
R2=0.99973
Fig. 7. Correlation coefficient between the experimental and theoretical frequencies of 4A1BP.
S. Chandra et al. / Journal of Molecular Structure 998 (2011) 69–78 77
studying intra and intermolecular bonding and interaction amongbonds, and also provides a convenient basis for investigating chargetransfer or conjugative interaction in molecular systems. Some elec-tron donor orbital, acceptor orbital and the interacting stabilizationenergy resulted from the second-order micro-disturbance theoryare reported [48,49].
The larger the E(2) value, the more intensive is the interactionbetween electron donors and electron acceptors, i.e. the moredonating tendency from electron donors to electron acceptorsand the greater the extent of conjugation of the whole system.Delocalization of electron density between occupied Lewis-type(bond or lone pair) NBO orbitals and formally unoccupied (anti-bond or Rydgberg) non-Lewis NBO orbitals correspond to a stabi-lizing donor–acceptor interaction. NBO analysis has beenperformed on the molecule at the DFT/B3LYP/6-31G(d,p) level inorder to elucidate the intramolecular, rehybridization and
delocalization of electron density within the molecule are shownin Table 4. The NBO results suggest that the maximum energy(21.22 kJ mol�1) transfers in p–p� transition.
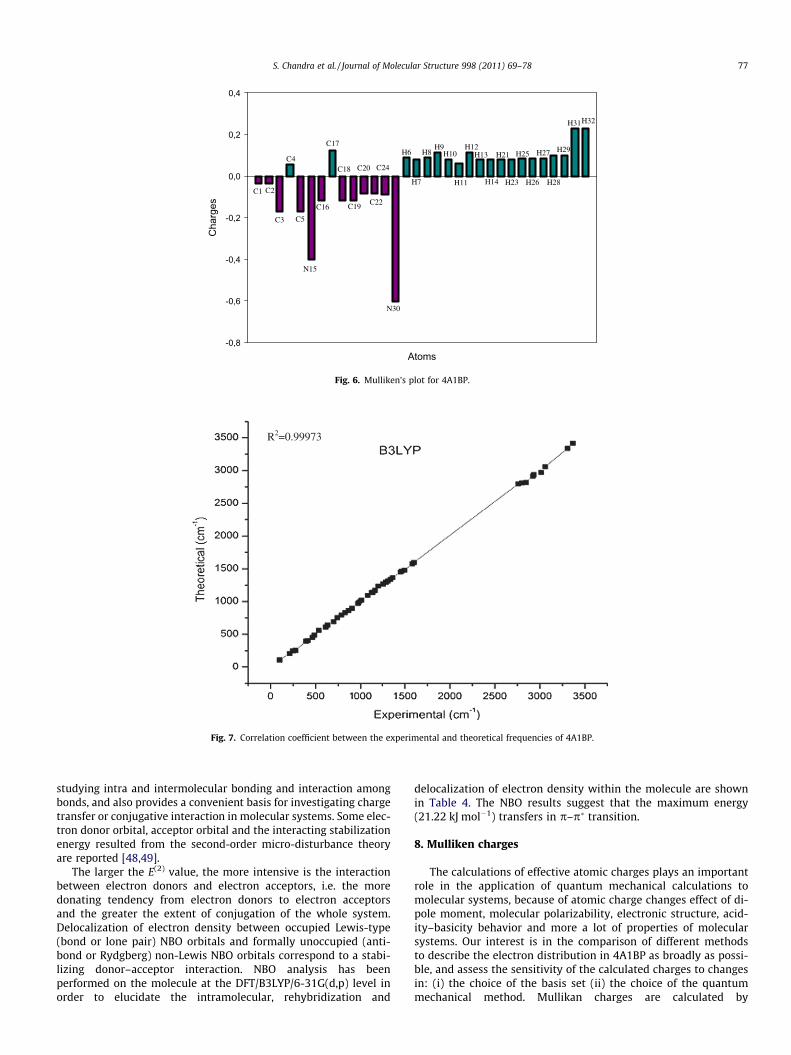
8. Mulliken charges
The calculations of effective atomic charges plays an importantrole in the application of quantum mechanical calculations tomolecular systems, because of atomic charge changes effect of di-pole moment, molecular polarizability, electronic structure, acid-ity–basicity behavior and more a lot of properties of molecularsystems. Our interest is in the comparison of different methodsto describe the electron distribution in 4A1BP as broadly as possi-ble, and assess the sensitivity of the calculated charges to changesin: (i) the choice of the basis set (ii) the choice of the quantummechanical method. Mullikan charges are calculated by
78 S. Chandra et al. / Journal of Molecular Structure 998 (2011) 69–78
determining the electron population of each atom as defined bybasis sets. The result can, however, better be represented in graph-ical form as has been given in Fig. 6. From these results, it will bepossible to say to the change to charge distribution by a change inbasis set.
9. Conclusion
Vibrational spectral analysis is carried out using FT-IR (solidphase) and Raman spectroscopy for the 4A1BP. Assignments ofthe vibrational spectra have been facilitated by DFT calculation. Agood correlation was found between the computed and experi-mental wavenumbers. The correlation coefficient between calcu-lated and measured vibrational frequencies is 0.9997. The bestfittings between calculated and measured vibrational frequencieswere achieved by B3LYP theoretical level which is shown inFig. 7. At this level, the deviation between calculated and experi-mental values is quite small for a given type of vibration. Therefore,this study confirms that the theoretical calculation of vibrationalfrequencies for 4A1BP is quite useful for the vibrational assign-ments and for predicting new vibrational frequencies. The theoret-ically constructed FT-IR and FT-Raman spectrum exactly coincideswith experimentally observed FT-IR and FT-Raman spectrumrespectively. Mulliken charges 4A1BP at different levels were cal-culated and the results discussed. HOMO, LUMO energies andHOMO–LUMO energy gap is also calculated. NBO results suggestthat the maximum energy (21.22 kJ mol�1) transfers in p–p�
transition.
References
[1] G.J. Richardo, B.C. Juan, R.A. Mario, M. Roldan, C.R. Peinado, Fernando Spen. 47(1979) 168.
[2] B.R. Jerom, K.H. Spencer, Eur. Pat. Appl. Ep 277794 (1998).[3] R.V. Perumal, M. Adiraj, P. Shanmugapandian, Indian Drugs 38 (2001) 156.[4] C.F. Bochringer, G.M.B.H. Shochne, Brit. Pat. Appl. BP 866488 (1961).[5] C.R. Ganellin, R.G. Spickett, J. Med. Chem 8 (1965) 619.[6] M. Nikolov, D. Stefanora, D. Chardanov, Acta Nerv. Super 16 (1974) 264.[7] B. Kathleen, C. Jean-Peirre, H. Andre, Eur. Pat. Appl. Ep 169139 (1986).[8] R.E. Hagenbach, H. Gysin, Experientia 8 (1952) 184.[9] B. Heana, V. Dobre, I. Niculescu-Duvaz, J. Prakt. Chem 327 (1985) 667.
[10] I.G. Mobio, A.T. Soldatenkov, V.O. Fedrov, E.A. Ageev, N.D. Sergeeva, S. Lin, E.E.Stashenko, N.S. Prostakov, E.I. Andreeva, Khim. Farm. Zh. 23 (1989) 421.
[11] M.T. Gulluoglu, Y. Erdogdu, S. Yurdakul, J. Mol. Struct. 834 (2007) 540.[12] Y. Erdogdu, M.T. Gulluoglu, Spectrochim. Acta A 74 (2009) 162.[13] Yu.A. Pentin, O.S. Anisimova, Opt. Spectrosc. 26 (1968) 35.
[14] T. Hirokawa, T. Kimura, K. Ohno, H. Murata, Spectrochim. Acta A 36 (1980)329.
[15] G. Marcotrigiano, L. Meanbue, G.C. Pellacani, J. Mol. Struct. 30 (1976) 85.[16] Y. Okishi, Y. Imai, K. Aida, J. Inorg. Nucl. Chem. 13 (1973) 101.[17] T.V. Titova, O.S. Anisimova, Opt. Spectrosc. 23 (1967) 495.[18] D. Vedal, O. Ellestad, P. Klaboe, G. Hagen, Spectrochim Acta A 32 (1976) 877.[19] E. Vayner, D.W. Ball, J. Mol. Struct. (THEOCHEM) 496 (2000) 175.[20] S. Sebastian, N. Sundaraganesan, Spectrochim. Acta A 75 (2010) 941.[21] Gaussian 03 Program, Gaussian Incl., Walling ford, CT, 2004.[22] H.B. Schlegel, J. Comput. Chem. 3 (1982) 214.[23] A. Frisch, A.B. Nielson, A.J. Holder, GAUSS VIEW User Manual, Gaussian Incl.,
Pittsburgh, PA, 2000.[24] G. Keresztury, S. Holly, J. Varga, G. Besenyei, A.J. Wang, J.R. Durig, Spectrochim.
Acta 49 A (1993) 2007.[25] G. Keresztury, J.M. Chalmers and P.R. Griffith, Raman Spectroscopy: Theory in
Hand Book of Vibrational spectroscopy, vol. 1. John wiley, New York.[26] P. Pulay, G. Fogarasi, G. Ponger, J.E. Boggs, A. Vargha, Am. Chem. Soc. 105
(1983) 7073.[27] A.P. Scott, L. Radom, J. Phys. Chem. 100 (1996) 16502.[28] L.J. Bellamy, R.L. Williams, Spectrochim. Acta 9 (1957) 311.[29] G. Socrates, Infrared, Raman Characteristic Group Frequencies Tables and
Charts, third ed., Willey, Chichester, 2001.[30] L.J. Bellamy, The Infrared Spectra of Complex Molecules, vol. 2, Chapman and
Hall, London, 1980.[31] S. Mancy, W.L. Peticoles, R.S. Toblas, Spectrochim. Acta A 35 (1979) 315.[32] N. Sundaraganesan, C. Meganathan, M. Kurt, J. Mol. Struct. 891 (2008) 284.[33] J.P. Abaraham, D. Sajan, I. Hubert Joe, V.S. Jayakumar, Spectrochim. Acta A 71
(2008) 355.[34] E. Tasal, I. Sidir, Y. Gulselvan, C. Ogretir, T. Onkol, J. Mol. Struct. 923 (2009) 141.[35] V. Krishnakumar, R.J. Xavier, T. Chidambarathanu, Spectrochim. Acta A 62
(2005) 931.[36] A.A. El-Azhary, Spectrochim. Acta A 55 (1999) 2437.[37] V. Krishnakumar, R. John Xavier, Indian J. Pure Appl. Phys. 41 (2003) 597.[38] J. Coates, in: R.A. Meyers (Ed.), Interpretation of Infrared spectra, A Practical
Approach, John Wiley and Sons Ltd., Chichester, 2000.[39] M. Karabacak, M. Cinar, M. Kurt, J. Mol. Struct. 968 (2010) 108.[40] N.P.G. Roeges, A Guide to the Complete Interpretation of Infrared Spectra of
Organic Structures, Wiley, New York, 1994.[41] K.R. Ambujakshan, V.S. Madhavan, H.T. Varghese, C.Y. Panicker, O.T. Arpaci,
B.T. Gulbas, I. Yildiz, Spectrochim. Acta A 69 (2008) 782.[42] M. Silverstein, G. Clayton Basseler, C. Moril, Spectrometric Identification of
Organic Compounds, Wiley, New York, 1981.[43] S. Ramalingam, S. Periyandi, M. Govindarajan, S. Mohan, Spectrochim. Acta A
75 (2010) 1552.[44] M.A. Palafox, Int. J. Quant. Chem. 77 (2000) 661.[45] N. Sundaraganesan, G. Elango, C. Meganathan, B. Karthikeiyan, M. Kurt, Mol.
Simul. 35 (2009) 705.[46] T. Vijayakumar, I.H. Joe, C.P.R. Nair, V.S. Jayakumar, Chem. Phys. 343 (2008) 83.[47] M. Szafran, A. Komasa, E.B. Adamska, J. Mol. Struct. (THEOCHEM) 827 (2007)
101.[48] C. James, A.A. Raj, R. Reghunathan, I.H. Joe, V.S. Jayakumar, J. Raman Spectrosc.
37 (2006) 1381.[49] L. Jun-na, C. Zhi-rang, Y. Shen-fang, J. Zhejiang Univ. Sci 6B (2005) 584.[50] A. Parkin, I.D.H. Oswald, S. Parsons, Acta Crystallogr. Sec. B 60 (2004) 219.
Copyright © 2022 FDOKUMEN