Investigating the Elusive Mechanism of Glycosaminoglycan Biosynthesis
Upload
independentCategory
view
2download
0
IntroductionThe basal lamina surrounding muscle fibres fulfils manydevelopmental and physiological roles (Sanes, 2003; Sanes etal., 1990; Sanes et al., 1986). The basal lamina networks areinterconnected with resident and cell surface proteins andproteoglycans (PG). These PGs consist of a core protein towhich glycosaminoglycan (GAG) moieties are covalentlylinked. Heparan sulfate proteoglycans (HSPG) constitute themajor portion of proteoglycans of the basal lamina of skeletalmuscle cell surfaces (Brandan et al., 1996; Brandan et al.,1991; Cornelison et al., 2001; Larrain et al., 1997). Highlyregulated spatiotemporal distribution of basal laminacomponents and of cell surface HSPGs such as collagen, agrin,perlecan, glypicans or syndecans (Sanes et al., 1990) create aspecific microenvironment around muscle cells that act as adeterminant for the events of myogenesis in particular by
regulating bioavailability of growth factors (Larrain et al.,1997; Larrain et al., 1998). A growing body of evidenceindicates that most growth factors involved in the control ofcellular growth and differentiation can be stored in theextracellular matrix through specific interaction with GAGs,especially heparan sulfate (HS). Heparin or HS stabilizes andprotects growth factors from degradation (Sommer and Rifkin,1989) and may even potentiate their activity (Lyon andGallagher, 1998; Rahmoune et al., 1998; Rapraeger, 2002).From these binding sites, the growth factors traditionallydesignated as heparin binding growth factors (HBGF), can bereleased and accomplish cellular activating functions.
The control of bioavailability of HBGF may in part bemediated by an affinity of these factors for specific sequencesof the sugar moiety of proteoheparan sulfates. In particular, thepattern of sulfation regulates the affinity of growth factors to
253
Crucial events in myogenesis rely on the highly regulatedspatiotemporal distribution of cell surface heparan sulfateproteoglycans to which are associated growth factors, thuscreating a specific microenvironment around muscle cells.Most growth factors involved in control of myoblast growthand differentiation are stored in the extracellularmatrix through interaction with specific sequences ofglycosaminoglycan oligosaccharides, mainly heparansulfate (HS). Different HS subspecies revealed by specificantibodies, have been shown to provide spatiotemporalregulation during muscle development. We have previouslyshown that glycosaminoglycan (GAG) mimetics calledRGTA (ReGeneraTing Agent), stimulate muscle precursorcell growth and differentiation. These data suggest animportant role of GAGs during myogenesis; however, littleis yet known about the different species of GAGssynthesized during myogenesis and their metabolicregulation. We therefore quantified GAGs duringmyogenesis of C2.7 cells and show that the composition of
GAG species was modified during myogenic differentiation.In particular, HS levels were increased during this process.In addition, the GAG mimetic RGTA, which stimulatedboth growth and differentiation of C2.7 cells, increased thetotal amount of GAG produced by these cells withoutsignificantly altering their rate of sulfation. RGTAtreatment further enhanced HS levels and changed its sub-species composition. Although mRNA levels of the enzymesinvolved in HS biosynthesis were almost unchanged duringmyogenic differentiation, heparanase mRNA levelsdecreased. RGTA did not markedly alter these levels. Herewe show that the effects of RGTA on myoblast growth anddifferentiation are in part mediated through an alterationof GAG species and provide an important insight into therole of these molecules in normal or pathologic myogenicprocesses.
Key words: Glycosaminoglycans, Myoblast, RGTA
Summary
A synthetic glycosaminoglycan mimetic (RGTA)modifies natural glycosaminoglycan species duringmyogenesisIsabelle Barbosa1, Christophe Morin1, Stephanie Garcia1, Arlette Duchesnay1, Mustapha Oudghir2,Guido Jenniskens3, Hua-Quan Miao4, Scott Guimond5, Gilles Carpentier1, José Cebrian1,Jean-Pierre Caruelle1, Toin van Kuppevelt6, Jeremy Turnbull5, Isabelle Martelly1,* and Dulce Papy-Garcia1
1Laboratoire CRRET, CNRS UMR 7149, Université Paris 12-Val de Marne, 61 Avenue du Général de Gaulle, 94010 Créteil CEDEX, France2Faculty of Science Semlalia, University Cadi Ayyat, BP 2390, Marrakech, Morocco3Division of Bioengineering and Environmental Health, Massachusetts Institute of technology, Cambridge, MA 02139, USA4ImClone Systems Incorporated, New York, NY 10014, USA5School of Biological Sciences, University of Liverpool, Liverpool, L69 7ZB, UK6Department of Biochemistry194, University Medical Centre, NCMLS, PO Box 9101, 6500 HB Nijmegen, The Netherlands*Author for correspondence (e-mail: [email protected])
Accepted 13 October 2004Journal of Cell Science 118, 253-264 Published by The Company of Biologists 2005doi:10.1242/jcs.01607
Research Article
Jour
nal o
f Cel
l Sci
ence

254
HS (Fernig et al., 2000; Ford-Perriss et al., 2002; Kreuger etal., 1999; Kreuger et al., 2001). Interestingly, it has beendemonstrated, using phage display antibodies, that HSs form afamily of molecules that present a spatiotemporal regulation indifferentiating skeletal muscle cells, thus suggesting a subtleregulating role of these molecules (Dennissen et al., 2002;Jenniskens et al., 2000; Jenniskens et al., 2002). Indeed, severalgrowth factor binding oligosaccharides sequences have beenestablished (Allen et al., 2001; Kreuger et al., 2001; Olwin andRapraeger, 1992; Turnbull et al., 1992). They govern theactivity of growth factors on cells, as has been shown forinstance for fibroblast growth factor 2 (FGF2) (Berry et al.,2003; Rapraeger et al., 1991).
We have used substituted dextran polymers that mimicGAGs on the basis of their ability to interact with and to protectseveral HBGFs against proteolysis (Meddahi et al., 1995;Meddahi et al., 1996). These GAG mimetics were shown toenhance tissue repair in various in vivo models including skin(Meddahi et al., 1996), bone (Blanquaert et al., 1995) or colon(Meddahi et al., 2002). They highly stimulate and improveregeneration of denervated and crushed skeletal muscles(Aamiri et al., 1995; Gautron et al., 1995; Zimowska et al.,2001) as well as prevent most of the damage resulting fromacute skeletal or cardiac muscle ischemia (Desgranges et al.,1999; Zakine et al., 2003). Therefore, these dextran polymerswere called RGTA (for ReGeneraTing Agent). Experimentsperformed with satellite cells (also called muscle precursorcells) in primary cultures have shown that these GAG mimeticsstimulate satellite cell growth and differentiation (Papy-Garciaet al., 2002; Stockholm et al., 1999).
Taken together, these results suggest that the GAG moietyof certain proteoglycans might regulate the differentiationprocess of myoblasts into myotubes. However, little is knownabout the GAG composition of myoblasts and myotubes.Chondroitin sulfate (CS) and HS synthesis are greatlyincreased in mdx satellite cells compared to normal musclesatellite cells (Alvarez et al., 2002; Crisona et al., 1998). Thereduction of GAG sulfation by chlorate treatment of C2myoblasts reduces their growth (Papy-Garcia et al., 2002) anddifferentiation capacities (Melo et al., 1996).
These results prompted us to study changes in GAG levelsduring myoblast differentiation in vitro and to identify theirspecies, using the C2.7 cell line. We also investigated whethera specific RGTA, named RGD120 and structurally related toheparin, would alter the content of the GAG species balance inrelation to its effect on myoblast growth and differentiation.
Materials and MethodsMaterialsThe RGTA used in this study, RGD120, was obtained from OTR3(Sarl, Créteil, France). This molecule is a synthetic derivative of T40dextran in which some of the hydroxyl groups were substituted bycarboxymethyl and sulfate groups (Fig. 1). The global degree ofsubstitution (d.s.) of each polymer was determined by acid-basetitration of the carboxylic and sulfate groups and by microanalysis ofthe sulfur content; the fine structure was determined by 1H NMRspectroscopy and HPLC gel filtration-light diffusion detection(Ledoux et al., 2003). Full data were provided with the compound.
Myoblasts were supplied by Pinset and Montaras (Pinset et al.,1988). Dulbecco’s Modified Eagle Medium (DMEM), fetal bovineserum (FBS), horse serum and 10× phosphate buffered saline (PBS)
were from Gibco-BRL-Life Technologie, (Cergy-Pontoise, France).Sodium acetate, sodium formiate, formic acid, anthranilic acid andproteinase K were from Merck (Darmstadt, Germany); propan-1-olwas from Prolabo-VWR (Strasbourg, France). Ultrafree-MC Amiconfilters were from Millipore (Bedford, Massachusetts). Gelatin,paraformaldehyde, p-nitrocatechol sulfate and all other chemicalswere from Sigma-Aldrich (St Louis, MO). Mowiol was fromCalbiochem (La Jolla, California). The protein assay kit was fromBio-Rad Laboratories (California, USA). Epitope-specific antibodiesagainst HS were produced by the phage display technique (Jenniskenset al., 2002). Anti c-myc tag rabbit polyclonal IgG (A-14) was fromSigma, Alexa 488-conjugated goat anti-rabbit IgG was fromMolecular Probes (Eugene, USA). Electrophoresis material andproducts were from Bio-Rad. Spectroscopic data were collected usinga scanning spectrophotometer PU 8740 UV/Vis (Phillips, Paris,France). HPLC analysis was performed with a TSKgel G3000 PWXL7.8 mm ID × 30 cm column from Tosohaas (Cambridge, UK) usingan LC240 fluorescence detector from Perkin Elmer (DivisionInstruments, St Quentin, France); the HPLC pump was from KontronInstruments (Germany). Analysis of HPLC peaks was performed withRadioStar software. Confocal microscopy images were acquired witha Zeiss LSM 410 laser-scanning confocal Axiovert 135M invertedmicroscope.
Cell culturesThe C2.7 cell line (Pinset el al., 1988) was maintained as sub-confluent monolayers in DMEM containing 1 g/l glucose and 4 mML-glutamine supplemented with 20% FBS, 100 U/ml penicillin and10 µg/ml streptomycin. Cells cultures were incubated at 37°C in 12%CO2. Samples of proliferating cells (myoblasts) were taken during thefollowing 5 days after plating. To induce differentiation, the mediumwas changed at sub-confluence (days 3 or 4 after plating) to DMEMsupplemented with 0.25% FBS and 0.25% horse serum. Samples ofdifferentiated cells were taken at the indicated times during the 48hours following medium shift.
Evaluation of myoblast proliferation or differentiationAt the indicated times, cultures were trypsinized and cells were
Journal of Cell Science 118 (1)
OO
-O3SOO O
-OOCCH2OO
O
HOO
RO
RO
ROR
H
CH2COO-
SO3-
A (62%)
C (22%)
B (16%)
(30%)
(5%)
(65%)
Fig. 1. Schematic structure of RGTA D120. The dextran derivativeon the 1-6 glucose polymeric chain contains carboxymethyl(–CH2COO–) and sulfate residues (–SO3
–) at degrees of substitutionof 0.26 and 1.92, respectively. Three differently substitutedglucosidic units are represented according to the nature of the grouplinked to the C2 position. For easier interpretation, these units werearranged in an arbitrary combination. R represents the possiblesubstituted groups in the global C3 and C4 positions. The position ofeach group on the C-2 compared to C-3 + C-4 was also determinedby analyzing the anomeric proton signal by 1H NMR (300 MHz).
Jour
nal o
f Cel
l Sci
ence

255GAG species during myogenesis: effect of GAG mimetics
counted in a Coulter Counter. In other cases, culture growth wasdetermined by DNA content evaluation using a diaminophenyl indole(DAPI) assay (Brunk et al., 1979). In order to evaluate differentiation,total activity and isoform ratio of creatine kinases (CK) on cellularextracts were determined by a micro method using Biotrol reagents.Samples containing equivalent amounts of CK activity in 1 µl wereloaded onto 1% agarose gels; isoforms were separated byelectrophoresis and revealed by using the CK reagent (Lagord et al.,1993). Gels were illuminated with UV (365 nm) and images of thefluorescent CK bands were analyzed by the Gene Tool Syngenesoftware. The percentages of B and M subunits were determined fromthese images.
Preparation of GAG extractsAt the indicated times, cellular extracts and conditioned medium wereselected and treated as described previously (Barbosa et al., 2003). Inbrief, cellular layer extracts were performed by scraping the cells inK2HPO4 (50 mM, pH 8.0). Cellular extract was then digested in asolution of 50 µg/ml proteinase K in 100 mM phosphate buffer pH8.0 at 56°C overnight. Proteinase K was then inactivated by heatingthe preparation for 10 minutes at 90°C. At this step, the amount ofDNA in aliquot samples was determined by 4,6-diamino-2-phenylindole (DAPI) assay using salmon sperm DNA as a standard(Brunk et al., 1979). Digested tissue was then filtered through anUltrafree-MC filter in order to eliminate interfering DNA and tissuedebris from the extract. This preparation was used for sulfated GAGquantification. Conditioned medium from each plate was lyophilizedand dry powder was dissolved in 100 mM phosphate buffer and treatedwith proteinase K as described above.
Quantification of GAGTotal sulfated GAG and HS or CS was quantified using a methodbased on dimethylmethylene blue (DMMB) co-precipitation withGAG (Barbosa et al., 2003). To take account of the presence ofsynthetic sulfated GAGs (RGTA) in extracts, the value correspondingto the added RGTA in cultures was subtracted from the total GAGmeasurement. HS was quantified after nitrous acid treatment of totalGAG preparation, as it is known that this treatment selectivelyeliminates HS (Bosworth and Scott, 1994). The GAG remaining inthe sample represented O-sulfated GAGs including CS. The N-sulfated GAG (HS) content was then calculated as the differencebetween the total GAGs and the O-sulfated GAGs in each sample.
Preparation of GAG labelled with anthranilic acid and HPLCanalysisIn order to enhance sensitivity of GAG detection using HPLC, weprepared GAG samples that were tagged with anthranilic acid byreductive amination of the proteinase K-digested samples. 100 µl ofproteinase K-treated GAG samples were incubated for 24 hours at37°C under slow agitation with 200 µl of a 1:1 mixture containing 1M anthranilic acid in ethanol and 1 M sodium cyanoborohydride(NaCNBH3) prepared extemporaneously in 100 mM ammoniumacetate. The reaction was stopped by addition of 300 µl of 300 mMacetate buffer at pH 4 and filtered through Ultra-free MC filters.20 µl of the filtrate were injected in the HPLC system (TSKG3000SWXL column). GAGs were eluted at 1.0 M NaCl at 1 ml/minute and detected with an LC240 fluorescence detector. TotalGAG amounts, analyzed with the Radiostar software (Berthold,Germany), represented the sum of the areas under each peak thateluted between 6 and 18 minutes. As controls, samples that were nottreated with proteinase K and proteinase K alone were analyzed,applying the same procedure. In such control samples, a very weakbackground signal was detected in the HPLC system with respect todigested samples.
Arylsulfatase assayDetermination of arylsulfatase A and B was adapted from a publishedmethod (Baum et al., 1959). In brief, cells were homogenized in 250mM sodium acetate buffer, pH 6.0 containing 0.5% Triton X-100. Thesamples were kept on ice for 1 hour and centrifuged at 10,000 g for10 minutes. Supernatants were then dialyzed for 18 hours againstdistilled water. Proteins were measured using BCA reagent (Bio-Rad).Arylsulfatase A was determined by colorimetry as followed: 50 µgprotein from cellular extracts in water were diluted to a final volumeof 50 µl in buffer A (10 mM sodium pyrophosphate, 1.7 M NaCl, 0.5M sodium acetate, pH 5.0) and 50 µl nitrocatechol sulfate (10 mM)diluted in buffer A was added. The reaction was allowed to occur for60 minutes at 37°C and stopped by addition of 50 µl of 1.0 M sodiumhydroxide. The liberated nitrocatechol was measured at 540 nm. Asa standard, 4-nitrocatechol was used between 0.250 and 5 nmol in thesame buffer conditions. Aryl sulfate B was measured in similarconditions but in buffer B (0.5 M sodium acetate, 10 mM bariumacetate, pH 6.0). 50 µl nitrocatechol sulfate (50 mM) in buffer B wasadded to the protein extract. A standard curve with 4-nitrocatecholwas produced between 12.5 and 125 nmol. Two sets of assays wereprepared in order to perform incubation between 30 and 90 minutes.The liberated 4-nitrocatechol was measured as described above. Theevaluation of arylsulfatase B under these conditions was performed asdescribed (Aqrabawi et al., 1993).
Real-time PCR analysis of enzymes involved in GAGmetabolismThe transcription levels of most of the enzymes involved in HS
0
10
20
30
40
50
60
70
2 3 4 5
culture time (days)
/A
ND g
µhsid control
Heparin
RGTA
B
0
5000
10000
15000
20000
25000
30000
35000
40000
45000
50000
0 0.1 0.5 1 5 10 15 20
RGTA (µg/ml)
hsid rep sllec fo rebmun
A
0
10
20
30
40
50
60
70
2 3 4 5
culture time (days)
/A
ND g
µhsid control
Heparin
RGTA
B
0
10
20
30
40
50
60
70
2 3 4 5
culture time (days)
/A
ND g
µhsid control
Heparin
RGTA
B
0
5000
10000
15000
20000
25000
30000
35000
40000
45000
50000
0 0.1 0.5 1 5 10 15 20
RGTA (µg/ml)
hsid rep sllec fo rebmun
A
Fig. 2. Effect of RGTA on C2.7 cell growth. (A) Effect of differentconcentrations of RGTA (0.1 to 20 µg/ml) on cell proliferation. Cellswere counted at day 4 and each value is the mean±s.d. of fourcultures. (B) Growth of C2.7 myoblasts in the presence of heparin(10 µg/ml) or RGTA (0.5 µg/ml). DNA was measured in cellularextracts at the indicated times. Each point is the mean±s.d. of threedeterminations on three independent cultures.
Jour
nal o
f Cel
l Sci
ence

256
synthesis, namely exostosin (EXT) 1 and 2, N-deacetylase N-sulfotransferase (NDST1), epimerase, 2-O-sulfotransferase (OST)and 6OST1, as well as heparanase involved in HS degradation, havebeen analyzed. Real-time PCR analyses were performed on RNAextracted from differentiating C2.7 cells at the indicated time usingRNA treatment with Instapure Plus (Eurogentec, Seraingn, Belgium).The use Instapure plus permitted elimination of any interference onthe RT and PCR steps which otherwise would occur owing to thepresence of polyanionic molecules such as RGTA. Such a drawbackhas been already described for heparin (Bai et al., 2000).
The RNA pellet was dissolved in RNase-free water,treated with DNA-free (Ambion Europe, UK) and its purityverified on agarose gel. The reverse transcription reactionwas performed on 1 µg total RNA from cells by using theoligo dT primer and the Superscript IITM preamplificationsystem (Invitrogen). Gene expression was quantified by real-time PCR using the LightCycler Fast Start DNA Master(Roche) with 0.2 µl cDNA, corresponding to 100 ng totalRNA in a 20 µl final volume, 3 mM magnesium chlorideand 0.5 µM of each primer (final concentration). Briefly,quantitative PCR was performed for 45 cycles at 95°C for15 seconds, at the specific annealing temperature for 25seconds and 72°C for 30 seconds. Amplification specificitywas checked using a melting curve following themanufacturer’s instructions. Some of the specific geneprimers of each enzyme of interest for real-time PCRanalysis were designed using Primers3 software based onpublished sequences (Table 1). Heparanase, NDST1, 2OSTand 6OST1, and epimerase were used as described (Miao etal., 2002; Ford-Perriss et al., 2002; Li et al., 2002). Resultswere analyzed with LightCycler software v3.5 (Roche)using the second derivative maximum method to set thethreshold cycle (CT). The quantitative analysis was carriedout using standard curves and normalized using the GeNormsoftware and methodology (Vandesompele et al., 2002).Four different reference genes [glyceraldehyde 3-phosphatedehydrogenase (GAPDH), RNA Polymerase II (RPII),TATA-box binding protein (TBP) and α-tubulin] were used.
ImmunohistochemistryThe cell layers (myoblast or myotubes) were fixed with 4%paraformaldehyde for 20 minutes. Cells were washed three times with1× PBS, treated with 2 ml ammonium chloride (50 mM) in PBS for10 minutes and washed three times with PBS/0.2% gelatin and thenincubated with anti-heparan sulfate antibodies (RB4CD12, AO4F12,AO4BO5) (Jenniskens et al., 2000) for 90 minutes. The followingsteps were as described previously (Jenniskens et al., 2003).
Journal of Cell Science 118 (1)
Fig. 3. Effect of RGTA on C2.7 cell differentiation.(A) C2.7 cells grown at high serum concentrations at day 4,without treatment (1) or in the presence of 0.5 µg/ml RGTA(2). C2.7 cells at 24 hours in differentiating medium (0.25%SVF + 0.25% SC) without treatment (3) or in the presenceof 0.5 µg/ml RGTA (4). Arrows indicate myotubes in thecultures. (B) Subunits of creatine kinase (CK) andenzymatic activity at day 4 of C2.7 cell culture. Isoenzymeanalysis was performed after agarose gel electrophoresisand the percentage of each subunit was calculated asdescribed in Materials and Methods. CK activity isexpressed as international units per dish. Bar, 100 µm.
Table 1. Primer pairs for real time PCRGene Accession no. Sense Antisense Location Size
NDST1 AF074926 CTTGAGCCCTCGGCAGATGC CTACCTCACTGGGCCGTGTC 133-646 514EXT1 BC004741 GGTCTCTCAGTCCCAGCCAGTG AGTGGCAGGCCAGCGATGTTTG 1654-1780 127EXT2 BC006597 GCTGTGAAGTGGGCTAGTGTGAGC ATACTTCCACTTGTTCATCTCGTG 1485-1931 4472OST AF060178 ATTAAGGAGACGGAAACAAGGAG GAAGGGTGGTGACACAGTCAAG 595-1164 5706OST1 AB024566 ACCAGCAACTCTTTCTATCCC AGCAATACCCACCAGCATC 2186-2720 535Epimerase AF003927 CCATCTATGACCTCCGGCAC AGTCCCAGCGGGCCAG 1226-1285 59Heparanase NM152803 TCTGCTGCGGTGTTGAGGA GTAATAGTGATGCCATGTAAGAGA 463-963 501GAPDH BU504528 ACTCCACTCACGGCAAATTC GACACCAGTAGACTCCACGACA 201-355 155TFIID D01034 TACTGGAAAGGTCCCCCTCT CTGGCTTGTGTGGGAAAGAT 1156-1367 212RPII BC042723 TACACCGACTCCACAAACCA TGGACCCAATTAACGATGG 677-852 176α-Tubulin NM011653 CTTCCCTCTGGCCACTTATG ACTGGATGGTACGCTTGGTC 846-1075 230
Jour
nal o
f Cel
l Sci
ence
257GAG species during myogenesis: effect of GAG mimetics
Image analysis Confocal microscopy images were acquired using a Zeiss LSM 410laser-scanning confocal Axiovert 135M inverted microscope. For bothtransmission and fluorescence modes, the 488 nm emission ray of anAr/Kr laser was used as lighting and excitation source. No emissionfilter was used for transmission mode but a 515 nm emission filter wasused for fluorescence mode. Images of fixed cells were obtained with63× objective with a twofold scanning zoom. Stacks of 40 slices of0.25 µm thickness were acquired to make a maximum projection onthe z-axis. The final images contain information from the base to thetop of cells. Image treatment procedures (deblurring, improvement ofimages by unsharp mask filtering) were developed on a Macintoshcomputer G4 using the public domain program Object-Image, whichis an extended version of NIH Image, developed at the U.S. NationalInstitutes of Health and at the University of Amsterdam.
Evaluation of HS subspecies by ELISA The GAG-containing extracts were used for further HS subspeciesdetermination by ELISA. GAG was grafted on BSA as follows: 100µl extract containing 1-10 µg/ml of GAG were mixed with 100 µlBSA (1 mg/ml) diluted in 100 mM phosphate buffer, pH 8.0 and 390µl phosphate buffer was added. Next, 10 µl of a solution of reducingagent (NaCNBH3) prepared extemporaneously at 5 mg/ml inphosphate buffer were added. The mixture was kept at 37°C overnightunder moderate agitation. The BSA-GAG complex was used at 2.5µg protein/ml to coat ELISA plates overnight at 4°C. The plates werethen rinsed three times with 0.05% PBS-Tween 20. Then 3% BSA in
PBS was added for 1 hour at room temperature. After three washesin PBS-Tween 20, anti HS diluted at 1:10 in 1% PBS-BSA was added.Incubation was performed at 37°C for 1.5 hours. After three washesin PBS-Tween 20, anti c-myc diluted at 1:600 in 1% PBS-BSA wasadded and plates were further incubated for 1 hour at roomtemperature. After washing, peroxidase-labeled anti IgG were added(Jackson) and plates were incubated at room temperature for 30minutes. The plates were again washed three times and TBM kitreagent (Pierce) was used according to the manufacturer’sinstructions. Absorbance was measured at 450 nm. As a control, CSor HS from commercial sources were included in the assays.
Statistical analysisValues are reported as the mean±s.d. Statistical significance wasdetermined using one-way ANOVA non-parametric test or one-wayANOVA test followed by Dunnett’s post-test using GraphPad Prism4 (GraphPad Software, San Diego, CA).
ResultsPattern of GAG content upon C2.7 proliferation anddifferentiationWhen C2.7 cultures were grown in serum-rich medium, cellsproliferated and then spontaneously formed myotubes after 5days of culture. Differentiation could be accelerated whenserum-rich medium was replaced with low serum medium
SLLEC GNITAITNEREFFID SLLEC GNITAREFILORP
0
1.0
2.0
3.0
4.0
5.0
55.445.33
)syad( emit erutluc
lortnoC
ATGR
A
0
2.0
4.0
6.0
8.0
8483420
)sruoh( muidem gnitaitnereffid ni emit
lortnoC
ATGR
C***
*
***** **
GA
G (
g/g
DN
A)
GA
G (
g/g
DN
A)
0
1
2
3
4
5
6
8483420
)sruoh( muidem gnitaitnereffid ni emit
lortnoC
ATGR
D
** *
0
1
2
3
4
5
6
55.445.33
)syad( emit erutluc
lortnoC
ATGR
B
*****
Tot
al G
AG
(ra
tio c
ell/
med
ium
)
Tot
al G
AG
(ra
tio c
ell/
med
ium
)
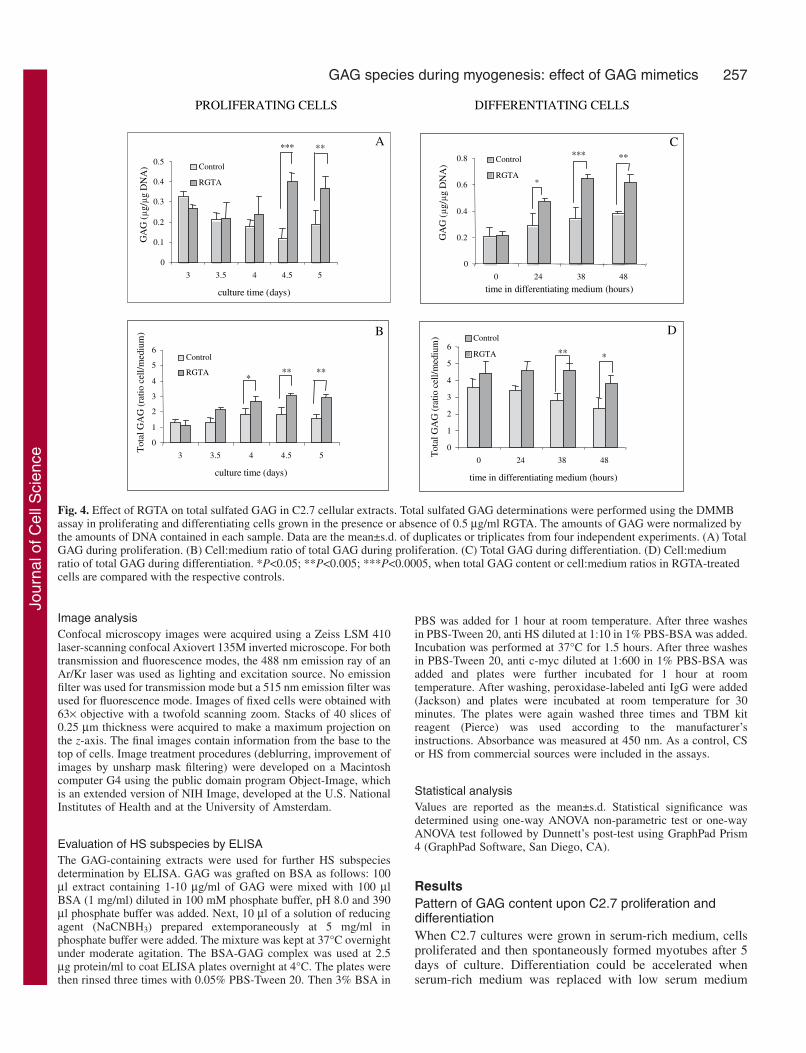
Fig. 4. Effect of RGTA on total sulfated GAG in C2.7 cellular extracts. Total sulfated GAG determinations were performed using the DMMBassay in proliferating and differentiating cells grown in the presence or absence of 0.5 µg/ml RGTA. The amounts of GAG were normalized bythe amounts of DNA contained in each sample. Data are the mean±s.d. of duplicates or triplicates from four independent experiments. (A) TotalGAG during proliferation. (B) Cell:medium ratio of total GAG during proliferation. (C) Total GAG during differentiation. (D) Cell:mediumratio of total GAG during differentiation. *P<0.05; **P<0.005; ***P<0.0005, when total GAG content or cell:medium ratios in RGTA-treatedcells are compared with the respective controls.
Jour
nal o
f Cel
l Sci
ence

258
(Figs 2 and 3). Using the DMMB technique, total sulfatedGAG content was measured between days 3 and 6 in C2.7 cellsgrown continuously in high serum medium. We refer to cellsgrown under these conditions as proliferating cells. In highserum conditions, total GAG content in cellular extractsslightly decreased upon withdrawal of proliferation at days 3and 4 after plating. A moderate increase in total GAG wasnoticed at day 5 upon spontaneous differentiation. Thisincrease was further augmented twofold when cells weregrown in differentiating medium (Fig. 4).
Effect of RGTA on myoblast proliferation anddifferentiationPrevious studies have shown that RGTA is a potent stimulatingagent for proliferation and differentiation of rat satellite cellsin primary cultures (Papy-Garcia et al., 2002; Stockholm et al.,1999). To provide a basis for additional studies we determinedthe proliferating and differentiating effects of RGTA on theC2.7 mouse cell line. As RGTA is a GAG mimetic and someof its effects were considered similar to a heparin effect, aheparin control treatment was included in most of the followingexperiments. RGTA applied just after plating stimulatedproliferation of C2.7 myoblasts in a dose-dependent manner(Fig. 2A). The optimal doses for maximal proliferationstimulation were between 0.5 µg/ml and 1 µg/ml. The decreasein cell number for high doses of RGTA was partially due tosome cell loss and to cellular differentiation, which was visible.The kinetics of cell growth in the presence of 0.5 µg/ml RGTAor 10 µg/ml heparin are shown in Fig. 2B. Compared tocontrols, both treatments increased cell growth, but RGTAappeared more efficient than heparin when considering productmolarities. Whereas 10 µg/ml of heparin represented about 670nM, the efficient concentration of RGTA was about 6 nMcorresponding to 0.5 µg/ml. Between days 4 and 5, cell growthwas stopped and cultures began to differentiate spontaneouslyunder our culture conditions. RGTA induces precociousdifferentiation of cells in high serum medium (Fig. 3A1,A2).It also increased differentiation of cells that were shifted to lowserum medium (Fig. 3A3,A4). Within 24 hours after mediumshift from high to low serum, numerous myotubes were seenin RGTA-treated cultures (Fig. 3A4) whereas myotubes were
almost absent in control cultures (Fig. 3A3). The increaseddifferentiation in the presence of RGTA was also indicated byan increase in CK activity and an increase in the proportion ofthe muscular isoform (M) of this enzyme (Fig. 3B). Thesedifferent results showed that RGTA increased C2.7 growth andalso stimulated their differentiation. We have chosen to focusour study essentially on the effect of RGTA at the myoblast tomyotube transition, i.e. between day 3 and day 6 after plating,using the RGTA concentration of 0.5 µg/ml that was effectiveon both processes.
RGTA increased GAG content upon proliferation anddifferentiation of C2.7In proliferating cells, RGTA treatment significantly increased
Journal of Cell Science 118 (1)
SLLEC GNITAITNEREFFID SLLEC GNITAREFILORP
0
00005
000001
000051
55.445.33
)syad( emit erutluc
UA
F/gD
NA lortnoC
ATGR******
0
00005
000001
000051
420
)sruoh( muidem gnitaitnereffid ni emit
UA
F/gD
NA lortnoC
ATGR
**
Fig. 5. Measurement of total GAG by HPLC on samples from proliferating or differentiating C2.7 cells. GAG extracts from proliferating anddifferentiating C2.7 cells were tagged with anthranilic acid and quantified by HPLC. Results were normalized to the amount of DNA in thesamples. Data are expressed in arbitrary units of fluorescence (AUF)/µg DNA are the mean±s.d. of two independent experiments. **P<0.005;***P<0.0005, when compared to AUF of the respective controls.
B
0
0.1
0.2
0.3
0.4
0.5
0 24 36 48
time in differentiating medium (hours)
.torp gµ/ruoh/lo
mn
control
RGTA
A
0
0.02
0.04
0.06
0.08
0 24 36 48
time in differentiating medium (hours)
.torp gµ/ruoh/lo
mn
control
RGTA
Fig. 6. Arylsulfatase specific activity in differentiating C2.7 cells.Arylsulfatase A (A) and B (B) were assayed in extracts performed atthe indicated times after a shift to low serum medium. Each value isthe mean±s.d. of duplicated determinations performed with twoindependent cultures.
Jour
nal o
f Cel
l Sci
ence

259GAG species during myogenesis: effect of GAG mimetics
the amount of total sulfated GAGs between days 4 and 5compared to controls (Fig. 4A). Whereas the cell-to-mediumratio of GAGs slightly increased from 1:1 to 2:1 under controlconditions, RGTA treatment further increased the amount ofGAGs in the cellular compartment compared to medium (Fig.4B).
We also studied GAG changes in cultures in whichdifferentiation was stimulated by a shift to a low serummedium (referred to as differentiating medium). In thismedium, total GAG amount increased about twofold incontrols, RGTA further increased this total GAG amount asshowed in Fig. 4C. The cell-to-medium GAG ratio slightlydecreased in control cultures but remained high in RGTA-treated cultures (Fig. 4D).
Sulfation rate of total GAG was not altered by RGTAThe technique used to assay total sulfated GAG content in cellextracts was based on the affinity of sulfated GAGs to thecationic DMMB dye. In order to check if RGTA increasedoverall GAGs, and not specifically sulfated GAGs, we performedanother GAG determination using HPLC chromatography ofGAG molecules tagged with a fluorescent chromophore(anthranilic acid). This method gives a signal directlyproportional to the number of GAG molecules. It allowed thequantification of total GAGs, including unsulfated species such
as hyaluronic acid. In these experiments, results have shown thatRGTA or heparin increased the total amount of GAGs comparedto controls. Heparin was always less efficient than RGTA inincreasing total GAG content (not shown). This RGTA-inducedincrease measured in proliferating cells (Fig. 5A) or indifferentiating cells (Fig. 5B) by the anthranilic acid tagtechnique was at similar levels to the increases measured usingthe DMMB assay (Fig. 4). This suggested that RGTA did notchange the degree of sulfation of the GAGs. As arylsulfatasemight be involved in changes of the sulfation rates of GAG, wealso measured the activities of arylsulfatase A and B in controland RGTA-treated cells during differentiation (Fig. 6). Althougharylsulfatase A specific activity did not significantly change indifferentiating cultures (Fig. 6A), arylsulfatase B decreased incontrols about fourfold over the course of differentiation. RGTAtreatment of cultures did not significantly alter the activity ofeither sulfatase, although it seemed to slow down the decreaseof arylsulfatase B in differentiating cells.
GAG metabolic enzymes during myogenic differentiationIn order to analyze the possible effect of RGTA on GAGmetabolism, we determined the expression of enzymesinvolved in HS biosynthesis and expression of heparanaseusing real-time PCR in C2.7 cells under control conditions andin RGTA-treated cultures. In control cultures, the mRNA levels
EXT1
0 12 24 36 480.000
1.000
2.000
3.000
4.000
5.000
Hours in differentiation medium
stin
U yrartibr
A
EXT2
0 12 24 36 480.000
0.010
0.020
0.030
0.040
0.050
Hours in differentiation medium
stin
U yrartibr
A
NDST1
0 12 24 36 480.000
0.020
0.040
0.060
0.080
0.100
Hours in differentiation medium
stin
U yrartibr
A
Epimerase
0 12 24 36 480.000
0.050
0.100
0.150
0.200
Hours in differentiation medium
stin
U yrartibr
A
2OST
0 12 24 36 480.000
0.005
0.010
0.015
0.020
Hours in differentiation medium
stin
U yrartibr
A
6OST1
0 12 24 36 480.000
0.030
0.060
0.090
0.120
0.150
Hours in differentiation medium
stin
U yrartibr
A
Heparanase
0 12 24 36 480.000
0.030
0.060
0.090
0.120
0.150
Hours in differentiation medium
stin
U yrart ibr
A
Control
RGTA
Fig. 7. Analysis of enzymes involved in GAGmetabolism by real-time PCR. Real-time PCR of EXT1and 2, NDST1, epimerase, 2OST and 6OST1 as well asheparanase was performed with RNA extracts fromdifferentiating control and RGTA-treated C2.7 cells.Values were normalized using the following referencegenes: glyceraldehyde 3-phosphate dehydrogenase(GAPDH), RNA polymerase II (RPII), TATA-Boxbinding protein (TBP) and α-tubulin. Each value is themean±s.e. of measurements performed on threeindependent cultures.
Jour
nal o
f Cel
l Sci
ence
260
of most of the enzymes involved in HS synthesis, namelyEXT1 and -2, NDST1, epimerase, 2OST and 6OST1 did notsignificantly change during the differentiation process. In thepresence of RGTA, levels of the mRNAs of the enzymesinvolved in HS synthesis were always lower than those ofcontrols. However, these differences were not statisticallysignificant.
We also measured the expression of heparanase involved inHS degradation at the mRNA level (Fig. 7). Interestingly, theheparanase mRNA level decreased almost to zero in controlcultures within the first 24 hours in differentiating medium.RGTA did not significantly change this pattern.
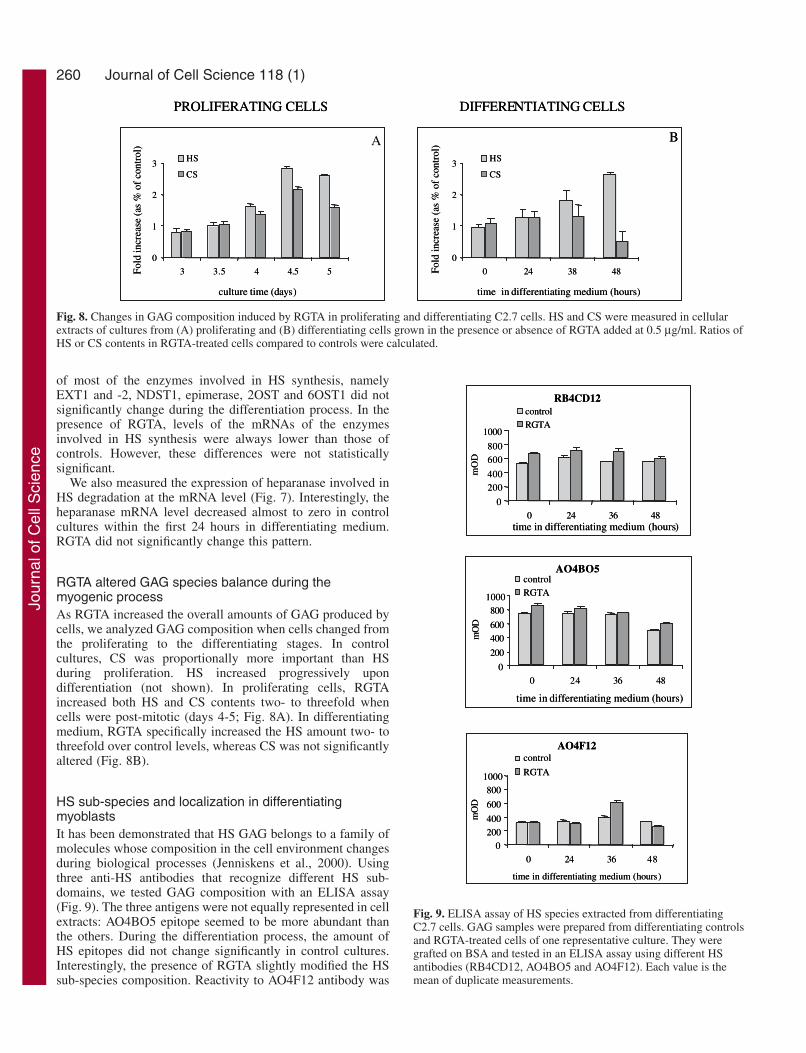
RGTA altered GAG species balance during themyogenic processAs RGTA increased the overall amounts of GAG produced bycells, we analyzed GAG composition when cells changed fromthe proliferating to the differentiating stages. In controlcultures, CS was proportionally more important than HSduring proliferation. HS increased progressively upondifferentiation (not shown). In proliferating cells, RGTAincreased both HS and CS contents two- to threefold whencells were post-mitotic (days 4-5; Fig. 8A). In differentiatingmedium, RGTA specifically increased the HS amount two- tothreefold over control levels, whereas CS was not significantlyaltered (Fig. 8B).
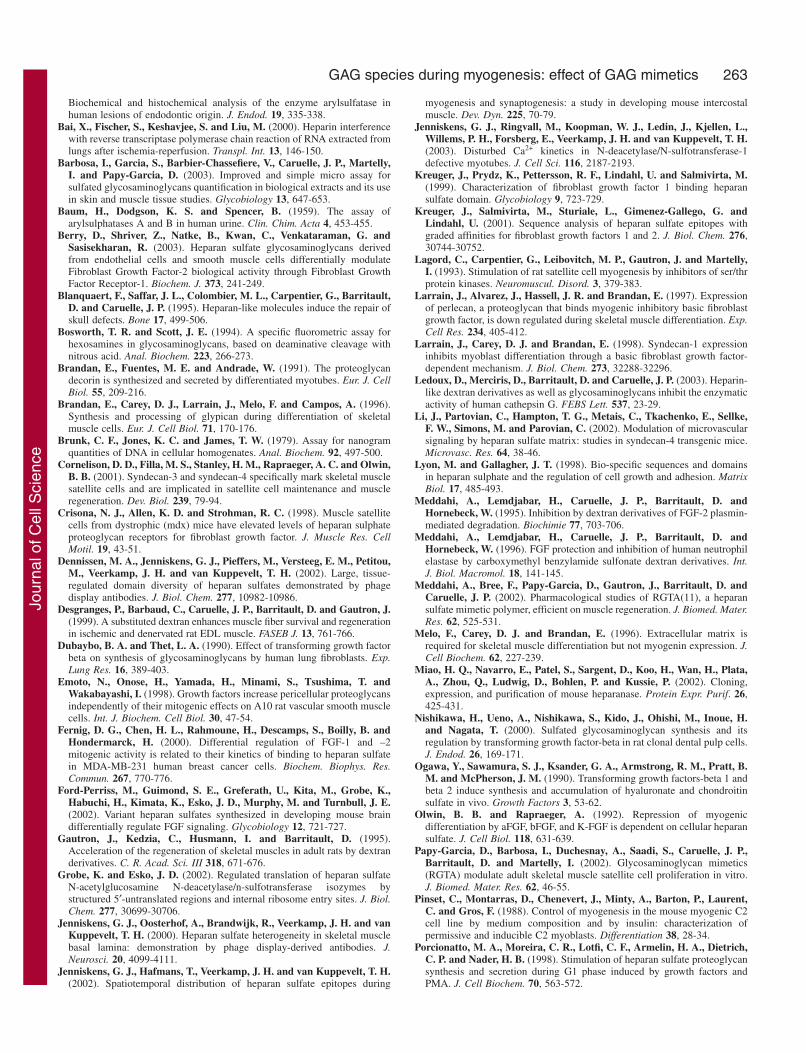
HS sub-species and localization in differentiatingmyoblastsIt has been demonstrated that HS GAG belongs to a family ofmolecules whose composition in the cell environment changesduring biological processes (Jenniskens et al., 2000). Usingthree anti-HS antibodies that recognize different HS sub-domains, we tested GAG composition with an ELISA assay(Fig. 9). The three antigens were not equally represented in cellextracts: AO4BO5 epitope seemed to be more abundant thanthe others. During the differentiation process, the amount ofHS epitopes did not change significantly in control cultures.Interestingly, the presence of RGTA slightly modified the HSsub-species composition. Reactivity to AO4F12 antibody was
Journal of Cell Science 118 (1)
PROLIFERATING CELLS DIFFERENTIATING CELLS
0
1
2
3
3 3.5 4 4.5 5
culture time (days)
HS
CS
A
0
1
2
3
0 24 38 48
time in differentiating medium (hours)
B esaercni dlo
F)lortnoc fo
% sa( esaerc ni dloF)lo rtnoc fo
% s a(
PROLIFERATING CELLS DIFFERENTIATING CELLS
0
1
2
3
3 3.5 4 4.5 5
culture time (days)
HS
CS
HS
CS
HS
CS
0
1
2
3
0 24 38 48
time in differentiating medium (hours)
B esaercni dlo
F)lortnoc fo
% sa( esaerc ni dloF)lo rtnoc fo
% s a(
Fig. 8. Changes in GAG composition induced by RGTA in proliferating and differentiating C2.7 cells. HS and CS were measured in cellularextracts of cultures from (A) proliferating and (B) differentiating cells grown in the presence or absence of RGTA added at 0.5 µg/ml. Ratios ofHS or CS contents in RGTA-treated cells compared to controls were calculated.
RB4CD12
0
200
400
600
800
1000
0 24 36 48time in differentiating medium (hours)
DO
m
control
RGTA
AO4BO5
0
200
400
600
800
1000
0 24 36 48
time in differentiating medium (hours)
DO
m
control
RGTA
AO4F12
0
200
400
600
800
1000
0 24 36 48
time in differentiating medium (hours)
DO
m
control
RGTA
RB4CD12
0
200
400
600
800
1000
0 24 36 48time in differentiating medium (hours)
DO
m
control
RGTA
AO4BO5
0
200
400
600
800
1000
0 24 36 48
time in differentiating medium (hours)
DO
m
control
RGTA
AO4F12
0
200
400
600
800
1000
0 24 36 48
time in differentiating medium (hours)
DO
m
control
RGTA
Fig. 9. ELISA assay of HS species extracted from differentiatingC2.7 cells. GAG samples were prepared from differentiating controlsand RGTA-treated cells of one representative culture. They weregrafted on BSA and tested in an ELISA assay using different HSantibodies (RB4CD12, AO4BO5 and AO4F12). Each value is themean of duplicate measurements.
Jour
nal o
f Cel
l Sci
ence

261GAG species during myogenesis: effect of GAG mimetics
clearly increased 36 hours after medium shift, whereas theresponses to the other antibodies were only slightly enhancedcompared to control levels.
Although RGTA did not seem to alter the localizationof the different HS subspecies compared to controls,immunocytological analyses of these HS sub-domains revealedsubtle differences in their localization in myoblasts (Fig. 10).In differentiated cultures, HS antibodies labelled a network thatoverlaid the cells. This network was even more accentuated inmyotubes than myoblasts (not shown).
In myoblasts, the RB4CD12 antibody principally delineateda subset at the periphery of cells (Fig. 10A, arrow 1) andpseudopodia structures (arrow 2). AO4F12 (Fig. 10B) andAO4BO5 (Fig. 10C-E) antibodies decorated pseudopodiastructures and cell-to-cell contacts. Pseudopodia between twocells were often labelled with AO4F12 antibody (Fig. 10B,arrow 1). Membrane close to these cell-to-cell contacts alsoappeared strongly labelled (Fig. 10B, arrow 2). AO4BO5antibody also labelled pseudopodia structures (Fig. 10C,arrows 1 and 2). An intense fluorescence was also frequentlyobserved at the contact zone between two adjacent cells (Fig.10D, arrow). In addition, cytoplasmic bridges formed betweentwo presumably pre-fusing cells were also labelled (Fig. 10E,arrows 1 and 2).
DiscussionIt is becoming clear that the extracellular environmentregulates cellular functions as complex as myogenicdifferentiation. GAGs are a class of molecules generally
associated with core proteins to form proteoglycans and playimportant roles in this environment. For instance, defectiveheparan sulfate biosynthesis induces neonatal lethality in mice(Ringvall et al., 2000) and disturbs Ca2+ homeostasis inmyotubes (Jenniskens et al., 2002). However, there is littleavailable information about GAG species synthesis in thecourse of myogenesis. In the present study, using twomethodological approaches for GAG quantification andanalysis, we observed that GAG composition changed incultures of C2.7 myoblasts when shifted from proliferation todifferentiation states. These alterations concerned the overallGAG content, its distribution between medium and cell layer,and its species. We have shown that GAGs, and more especiallyHSs, were increased during the differentiation process. Weanalyzed the expression levels of most of the enzymes involvedin HS metabolism. It must be emphasized that expressionpatterns of enzymes responsible for HS synthesis were notsignificantly altered during myoblast differentiation. Incontrast, the level of heparanase mRNA was strongly reduced.This reduction of heparanase correlated with the increase inoverall HS in differentiating cells.
The presence of RGTA, a synthetic GAG mimetic, in the cellenvironment increased both myoblast proliferation anddifferentiation. The optimal dose for enhancing proliferationwas between 0.1 and 1 µg/ml. At these concentrations, a shiftof B to M creatine kinase isoform, taken as a classical signof differentiation, was observed whereas the increase intotal creatine kinase activity occurred at higher RGTAconcentrations. Thus, the concentration of 0.5 µg/ml mainlyused here appeared the optimal dose which favoured the whole
Fig. 10. Immunolocalization of HS in C2.7 myoblasts. Localization of HS subspecies was investigated using (A) RB4CD12, (B) AO4F12 and(C-E) AO4BO5 antibodies and confocal microscopy. Note the differential labelling of HS species either at the periphery of cells (RB4CD12) orat cell-to-cell contacts with AO4BO5 or AO4F12. These two antibodies labelled cell-to-cell contacts differentially. Areas indicated by arrowsare described in the text. Panel E shows the boxed area in C. Bar, 10 µm.
Jour
nal o
f Cel
l Sci
ence

262
process from proliferation to differentiation. Interestingly itwas shown that RGTA emphasized the changes in GAGamount, composition and localization observed in controlcultures undergoing differentiation. Heparin was always foundto have a lesser effect than RGTA at equivalent concentrations.
The question of how RGTA could alter GAG synthesis andwhether GAG changes are causal or the consequences ofRGTA effect on proliferation and differentiation remain open.Cells are influenced by an environment composed of GAG-containing entities. The presence of RGTA, by itself, modifiesthis environment and thus might modify cell behavior. Webelieve that the changes brought by the presence of RGTA arethe starting event in the process. RGTA could act firstextracellularly, as do natural GAGs such as HS, by increasingbioavailability of growth factors and by potentiating growthfactor-mediated proliferation and differentiation. Interestingly,we have observed, using the same RGTA labeled with FITC,that this molecule remains for several hours in the cellularenvironment of myoblasts as a dense network (I.M.,unpublished). From this location, RGTA could mediate growthand also induce phenotypic changes in cells indirectly viagrowth factor modulation. We have previously shown thatRGTA stimulates proliferation of satellite cells in primarycultures and that this effect was partially caused by FGF2potentiation (Papy-Garcia et al., 2002). RGTA was also shownto partially substitute for hypo-sulfated GAG in chlorate-treated cultures and to mediate the FGF2 growth response(Papy-Garcia et al., 2002). This result could be related to theobservations that chlorate-induced reduction of sulfation of HSchains of the perlecan proteoglycan in C2C12 myoblastsdiminished their differentiation capacity (Villar et al., 1999).Stimulation of proliferation has been shown to correlate withan increase in matrix protein (Porcionatto et al., 1998) andHSPG secretions in endothelial cells (Weiss and Randour,2002). Conversely, changes in HS sulfation might alter HBGFsynthesis and intracellular processing. This has beendemonstrated with FGF2 (Sperinde and Nugent, 1998).
The novel findings of the present study were that GAGmimetics stimulated myogenesis, along with changes in thenatural GAG composition and that RGTA more particularlyincreased HS levels. It has long been known that TGFβ activityis regulated by proteoglycans present in the ECM, and in turnregulates synthesis of ECM components (Rapraeger, 1989;Dubaybo and Thet, 1990; Ogawa et al., 1990; Rapraeger et al.,1991; Anastassiades et al., 1996; Nishikawa et al., 2000).Similarly, growth factors, including FGF, have been shown toalter HS composition of smooth muscle cells (Emoto et al.,1998; Li et al., 2002). We hypothesize that RGTA indirectlymodulates GAG patterns through FGF or TGFβ as it has beenshown to protect these growth factors from proteolysis(Meddahi et al., 1996).
A possible effect of RGTA on the expression of enzymesinvolved in synthesis of GAG was also investigated. ThemRNA of the studied enzymes did not change significantlyduring differentiation, and RGTA did not significantly alter theexpression of these enzymes. These results suggest thatchanges at the transcriptional level might not be relevant forstudying regulation of the enzymes involved in HS metabolism.Interestingly, the mRNA of these enzymes all have long 5′untranslated region (5′-UTR) sequences involved intranslational regulation (Grobe and Esko, 2002). This suggests
a sophisticated regulation at translational levels of regulatingfactors that have the property of stimulating synthesis of HSand molecules that would bind to it. RGTA could interfere withthis regulation.
It should be emphasized that heparanase was the onlyenzyme that was significantly altered in differentiating cultureswhatever the treatment. We have also shown that RGTA didnot modify heparanase mRNA expression. This finding doesnot preclude an effect at the protein level. An interesting issuethat we are currently exploring is that RGTA may alterheparanase activity (A. Meddahi et al., unpublished). Such ahypothesis is supported by studies showing that heparin wasable to reduce the activity of this enzyme in CHO cells(Tumova and Bame, 1997) and/or may cause a reducedintracellular degradation of HS through inhibition ofendogenous heparanase as in smooth muscle cells (Potter-Perigo and Wight, 1996). RGTA was observed to enter intocells in vesicles where it remains for at least 24 hours (I.M.,unpublished). We cannot rule out the fact that RGTA mayfurther modify phenotypic cells from intracellular storesthrough an unknown mechanism and alter expression oractivity of the enzymes involved in GAG metabolism.
The complexity of the system is further emphasized by thefact that levels of the various HS sub-species as revealed byspecific antibodies were all different in RGTA and controlculture conditions. We have shown that HS antibodies detectdifferent amounts of HS sub-species in differentiating cellsstimulated by RGTA. These HS antibodies, recognizingdifferent epitopes, differentially decorated the cells. Thissuggests sophisticated changes in HS synthesis duringmyogenesis. RGTA could participate in these regulations bydiscretely modulating the different sets of enzymes involved inHS synthesis.
Taken together, the present results, showing effects of RGTAon myoblast growth and differentiation with alteration of GAGcomposition, give an important insight into the myogenesisprocess, especially as it occurs in a pathological situation suchas skeletal muscle dystrophy or in muscle repair.
The authors acknowledge Prof. D. Barritault for helpfuldiscussions, OTR3 for providing synthetic heparan mimetics and E.Planus for initiation with the basic commands for the LSM 410confocal microscope. This work was partially supported by theCNRS, by the Ministère des Affaires étrangères et de la Coopération(Action Concertée France-Maroc, 01/1) and by the AssociationFrançaise contre les Myopathies (AFM). I.B. and C.M. had AFMgrants nos 8552 and 9164, respectively.
ReferencesAamiri, A., Mobarek, A., Carpentier, G., Barritault, D. and Gautron, J.
(1995). Effects of substituted dextran on reinnervation of a skeletal musclein adult rats during regeneration. C. R. Acad. Sci. III 318, 1037-1043.
Allen, B. L., Filla, M. S. and Rapraeger, A. C. (2001). Role of heparansulfate as a tissue-specific regulator of FGF-4 and FGF receptor recognition.J. Cell Biol. 155, 845-858.
Alvarez, K., Fadic, R. and Brandan, E. (2002). Augmented synthesis anddifferential localization of heparan sulfate proteoglycans in Duchennemuscular dystrophy. J. Cell Biochem. 85, 703-713.
Anastassiades, T. P., Chopra, R. K. and Wood, A. (1996). Exogenousglycosaminoglycans (GAG) differentially modulate GAG synthesis byanchorage-independent cultures of the outer cells from neonatal rat calvariain the absence and presence of TGF-beta. Mol. Cell. Biochem. 158, 25-32.
Aqrabawi, J., Schilder, H., Toselli, P. and Franzblau, C. (1993).
Journal of Cell Science 118 (1)
Jour
nal o
f Cel
l Sci
ence
263GAG species during myogenesis: effect of GAG mimetics
Biochemical and histochemical analysis of the enzyme arylsulfatase inhuman lesions of endodontic origin. J. Endod. 19, 335-338.
Bai, X., Fischer, S., Keshavjee, S. and Liu, M. (2000). Heparin interferencewith reverse transcriptase polymerase chain reaction of RNA extracted fromlungs after ischemia-reperfusion. Transpl. Int. 13, 146-150.
Barbosa, I., Garcia, S., Barbier-Chassefiere, V., Caruelle, J. P., Martelly,I. and Papy-Garcia, D. (2003). Improved and simple micro assay forsulfated glycosaminoglycans quantification in biological extracts and its usein skin and muscle tissue studies. Glycobiology 13, 647-653.
Baum, H., Dodgson, K. S. and Spencer, B. (1959). The assay ofarylsulphatases A and B in human urine. Clin. Chim. Acta 4, 453-455.
Berry, D., Shriver, Z., Natke, B., Kwan, C., Venkataraman, G. andSasisekharan, R. (2003). Heparan sulfate glycosaminoglycans derivedfrom endothelial cells and smooth muscle cells differentially modulateFibroblast Growth Factor-2 biological activity through Fibroblast GrowthFactor Receptor-1. Biochem. J. 373, 241-249.
Blanquaert, F., Saffar, J. L., Colombier, M. L., Carpentier, G., Barritault,D. and Caruelle, J. P. (1995). Heparan-like molecules induce the repair ofskull defects. Bone 17, 499-506.
Bosworth, T. R. and Scott, J. E. (1994). A specific fluorometric assay forhexosamines in glycosaminoglycans, based on deaminative cleavage withnitrous acid. Anal. Biochem. 223, 266-273.
Brandan, E., Fuentes, M. E. and Andrade, W. (1991). The proteoglycandecorin is synthesized and secreted by differentiated myotubes. Eur. J. CellBiol. 55, 209-216.
Brandan, E., Carey, D. J., Larrain, J., Melo, F. and Campos, A. (1996).Synthesis and processing of glypican during differentiation of skeletalmuscle cells. Eur. J. Cell Biol. 71, 170-176.
Brunk, C. F., Jones, K. C. and James, T. W. (1979). Assay for nanogramquantities of DNA in cellular homogenates. Anal. Biochem. 92, 497-500.
Cornelison, D. D., Filla, M. S., Stanley, H. M., Rapraeger, A. C. and Olwin,B. B. (2001). Syndecan-3 and syndecan-4 specifically mark skeletal musclesatellite cells and are implicated in satellite cell maintenance and muscleregeneration. Dev. Biol. 239, 79-94.
Crisona, N. J., Allen, K. D. and Strohman, R. C. (1998). Muscle satellitecells from dystrophic (mdx) mice have elevated levels of heparan sulphateproteoglycan receptors for fibroblast growth factor. J. Muscle Res. CellMotil. 19, 43-51.
Dennissen, M. A., Jenniskens, G. J., Pieffers, M., Versteeg, E. M., Petitou,M., Veerkamp, J. H. and van Kuppevelt, T. H. (2002). Large, tissue-regulated domain diversity of heparan sulfates demonstrated by phagedisplay antibodies. J. Biol. Chem. 277, 10982-10986.
Desgranges, P., Barbaud, C., Caruelle, J. P., Barritault, D. and Gautron, J.(1999). A substituted dextran enhances muscle fiber survival and regenerationin ischemic and denervated rat EDL muscle. FASEB J. 13, 761-766.
Dubaybo, B. A. and Thet, L. A. (1990). Effect of transforming growth factorbeta on synthesis of glycosaminoglycans by human lung fibroblasts. Exp.Lung Res. 16, 389-403.
Emoto, N., Onose, H., Yamada, H., Minami, S., Tsushima, T. andWakabayashi, I. (1998). Growth factors increase pericellular proteoglycansindependently of their mitogenic effects on A10 rat vascular smooth musclecells. Int. J. Biochem. Cell Biol. 30, 47-54.
Fernig, D. G., Chen, H. L., Rahmoune, H., Descamps, S., Boilly, B. andHondermarck, H. (2000). Differential regulation of FGF-1 and –2mitogenic activity is related to their kinetics of binding to heparan sulfatein MDA-MB-231 human breast cancer cells. Biochem. Biophys. Res.Commun. 267, 770-776.
Ford-Perriss, M., Guimond, S. E., Greferath, U., Kita, M., Grobe, K.,Habuchi, H., Kimata, K., Esko, J. D., Murphy, M. and Turnbull, J. E.(2002). Variant heparan sulfates synthesized in developing mouse braindifferentially regulate FGF signaling. Glycobiology 12, 721-727.
Gautron, J., Kedzia, C., Husmann, I. and Barritault, D. (1995).Acceleration of the regeneration of skeletal muscles in adult rats by dextranderivatives. C. R. Acad. Sci. III 318, 671-676.
Grobe, K. and Esko, J. D. (2002). Regulated translation of heparan sulfateN-acetylglucosamine N-deacetylase/n-sulfotransferase isozymes bystructured 5′-untranslated regions and internal ribosome entry sites. J. Biol.Chem. 277, 30699-30706.
Jenniskens, G. J., Oosterhof, A., Brandwijk, R., Veerkamp, J. H. and vanKuppevelt, T. H. (2000). Heparan sulfate heterogeneity in skeletal musclebasal lamina: demonstration by phage display-derived antibodies. J.Neurosci. 20, 4099-4111.
Jenniskens, G. J., Hafmans, T., Veerkamp, J. H. and van Kuppevelt, T. H.(2002). Spatiotemporal distribution of heparan sulfate epitopes during
myogenesis and synaptogenesis: a study in developing mouse intercostalmuscle. Dev. Dyn. 225, 70-79.
Jenniskens, G. J., Ringvall, M., Koopman, W. J., Ledin, J., Kjellen, L.,Willems, P. H., Forsberg, E., Veerkamp, J. H. and van Kuppevelt, T. H.(2003). Disturbed Ca2+ kinetics in N-deacetylase/N-sulfotransferase-1defective myotubes. J. Cell Sci. 116, 2187-2193.
Kreuger, J., Prydz, K., Pettersson, R. F., Lindahl, U. and Salmivirta, M.(1999). Characterization of fibroblast growth factor 1 binding heparansulfate domain. Glycobiology 9, 723-729.
Kreuger, J., Salmivirta, M., Sturiale, L., Gimenez-Gallego, G. andLindahl, U. (2001). Sequence analysis of heparan sulfate epitopes withgraded affinities for fibroblast growth factors 1 and 2. J. Biol. Chem. 276,30744-30752.
Lagord, C., Carpentier, G., Leibovitch, M. P., Gautron, J. and Martelly,I. (1993). Stimulation of rat satellite cell myogenesis by inhibitors of ser/thrprotein kinases. Neuromuscul. Disord. 3, 379-383.
Larrain, J., Alvarez, J., Hassell, J. R. and Brandan, E. (1997). Expressionof perlecan, a proteoglycan that binds myogenic inhibitory basic fibroblastgrowth factor, is down regulated during skeletal muscle differentiation. Exp.Cell Res. 234, 405-412.
Larrain, J., Carey, D. J. and Brandan, E. (1998). Syndecan-1 expressioninhibits myoblast differentiation through a basic fibroblast growth factor-dependent mechanism. J. Biol. Chem. 273, 32288-32296.
Ledoux, D., Merciris, D., Barritault, D. and Caruelle, J. P. (2003). Heparin-like dextran derivatives as well as glycosaminoglycans inhibit the enzymaticactivity of human cathepsin G. FEBS Lett. 537, 23-29.
Li, J., Partovian, C., Hampton, T. G., Metais, C., Tkachenko, E., Sellke,F. W., Simons, M. and Parovian, C. (2002). Modulation of microvascularsignaling by heparan sulfate matrix: studies in syndecan-4 transgenic mice.Microvasc. Res. 64, 38-46.
Lyon, M. and Gallagher, J. T. (1998). Bio-specific sequences and domainsin heparan sulphate and the regulation of cell growth and adhesion. MatrixBiol. 17, 485-493.
Meddahi, A., Lemdjabar, H., Caruelle, J. P., Barritault, D. andHornebeck, W. (1995). Inhibition by dextran derivatives of FGF-2 plasmin-mediated degradation. Biochimie 77, 703-706.
Meddahi, A., Lemdjabar, H., Caruelle, J. P., Barritault, D. andHornebeck, W. (1996). FGF protection and inhibition of human neutrophilelastase by carboxymethyl benzylamide sulfonate dextran derivatives. Int.J. Biol. Macromol. 18, 141-145.
Meddahi, A., Bree, F., Papy-Garcia, D., Gautron, J., Barritault, D. andCaruelle, J. P. (2002). Pharmacological studies of RGTA(11), a heparansulfate mimetic polymer, efficient on muscle regeneration. J. Biomed. Mater.Res. 62, 525-531.
Melo, F., Carey, D. J. and Brandan, E. (1996). Extracellular matrix isrequired for skeletal muscle differentiation but not myogenin expression. J.Cell Biochem. 62, 227-239.
Miao, H. Q., Navarro, E., Patel, S., Sargent, D., Koo, H., Wan, H., Plata,A., Zhou, Q., Ludwig, D., Bohlen, P. and Kussie, P. (2002). Cloning,expression, and purification of mouse heparanase. Protein Expr. Purif. 26,425-431.
Nishikawa, H., Ueno, A., Nishikawa, S., Kido, J., Ohishi, M., Inoue, H.and Nagata, T. (2000). Sulfated glycosaminoglycan synthesis and itsregulation by transforming growth factor-beta in rat clonal dental pulp cells.J. Endod. 26, 169-171.
Ogawa, Y., Sawamura, S. J., Ksander, G. A., Armstrong, R. M., Pratt, B.M. and McPherson, J. M. (1990). Transforming growth factors-beta 1 andbeta 2 induce synthesis and accumulation of hyaluronate and chondroitinsulfate in vivo. Growth Factors 3, 53-62.
Olwin, B. B. and Rapraeger, A. (1992). Repression of myogenicdifferentiation by aFGF, bFGF, and K-FGF is dependent on cellular heparansulfate. J. Cell Biol. 118, 631-639.
Papy-Garcia, D., Barbosa, I., Duchesnay, A., Saadi, S., Caruelle, J. P.,Barritault, D. and Martelly, I. (2002). Glycosaminoglycan mimetics(RGTA) modulate adult skeletal muscle satellite cell proliferation in vitro.J. Biomed. Mater. Res. 62, 46-55.
Pinset, C., Montarras, D., Chenevert, J., Minty, A., Barton, P., Laurent,C. and Gros, F. (1988). Control of myogenesis in the mouse myogenic C2cell line by medium composition and by insulin: characterization ofpermissive and inducible C2 myoblasts. Differentiation 38, 28-34.
Porcionatto, M. A., Moreira, C. R., Lotfi, C. F., Armelin, H. A., Dietrich,C. P. and Nader, H. B. (1998). Stimulation of heparan sulfate proteoglycansynthesis and secretion during G1 phase induced by growth factors andPMA. J. Cell Biochem. 70, 563-572.
Jour
nal o
f Cel
l Sci
ence

264
Potter-Perigo, S. and Wight, T. N. (1996). Heparin causes the accumulationof heparan sulfate in cultures of arterial smooth muscle cells. Arch. Biochem.Biophys. 336, 19-26.
Rahmoune, H., Chen, H. L., Gallagher, J. T., Rudland, P. S. and Fernig,D. G. (1998). Interaction of heparan sulfate from mammary cells with acidicfibroblast growth factor (FGF) and basic FGF. Regulation of the activity ofbasic FGF by high and low affinity binding sites in heparan sulfate. J. Biol.Chem. 273, 7303-7310.
Rapraeger, A. (1989). Transforming growth factor (type beta) promotes theaddition of chondroitin sulfate chains to the cell surface proteoglycan(syndecan) of mouse mammary epithelia. J. Cell Biol. 109, 2509-2518.
Rapraeger, A. C. (2002). Heparan sulfate-growth factor interactions. MethodsCell Biol. 69, 83-109.
Rapraeger, A. C., Krufka, A. and Olwin, B. B. (1991). Requirement ofheparan sulfate for bFGF-mediated fibroblast growth and myoblastdifferentiation. Science 252, 1705-1708.
Ringvall, M., Ledin, J., Holmborn, K., van Kuppevelt, T., Ellin, F.,Eriksson, I., Olofsson, A. M., Kjellen, L. and Forsberg, E. (2000).Defective heparan sulfate biosynthesis and neonatal lethality in mice lackingN-deacetylase/N-sulfotransferase-1. J. Biol. Chem. 275, 25926-25930.
Sanes, J. R. (2003). The basement membrane/basal lamina of skeletal muscle.J. Biol. Chem. 278, 12601-12604.
Sanes, J. R., Schachner, M. and Covault, J. (1986). Expression of severaladhesive macromolecules (N-CAM, L1, J1, NILE, uvomorulin, laminin,fibronectin, and a heparan sulfate proteoglycan) in embryonic, adult, anddenervated adult skeletal muscle. J. Cell Biol. 102, 420-431.
Sanes, J. R., Engvall, E., Butkowski, R. and Hunter, D. D. (1990). Molecularheterogeneity of basal laminae: isoforms of laminin and collagen IV at theneuromuscular junction and elsewhere. J. Cell Biol. 111, 1685-1699.
Sommer, A. and Rifkin, D. B. (1989). Interaction of heparin with human basicfibroblast growth factor: protection of the angiogenic protein fromproteolytic degradation by a glycosaminoglycan. J. Cell Physiol. 138, 215-220.
Sperinde, G. V. and Nugent, M. A. (1998). Heparan sulfate proteoglycanscontrol intracellular processing of bFGF in vascular smooth muscle cells.Biochemistry 37, 13153-13164.
Stockholm, D., Barbaud, C., Marchand, S., Ammarguellat, F., Barritault,D., Richard, I., Beckmann, J. and Martelly, I. (1999). Studies on calpainexpression during differentiation of rat satellite cells in primary cultures inthe presence of heparin or a mimic compound. Exp. Cell Res. 252, 392-400.
Tumova, S. and Bame, K. J. (1997). The interaction between basic fibroblastgrowth factor and heparan sulfate can prevent the in vitro degradation of theglycosaminoglycan by Chinese hamster ovary cell heparanases. J. Biol.Chem. 272, 9078-9085.
Turnbull, J. E., Fernig, D., Ke, Y., Wilkinson, M. C. and Gallagher, J. T.(1992). Identification of the basic FGF binding sequence in fibroblast HS.J. Biol. Chem. 267, 10337-10341.
Vandesompele, J., de Preter, K., Pattyn, F., Poppe, B., van Roy, N., dePaepe, A. and Speleman, F. (2002). Accurate normalization of real-timequantitative RT-PCR data by geometric averaging of multiple internalcontrol genes. Genome Biol. 3, R34.1-R34.11.
Villar, M. J., Hassell, J. R. and Brandan, E. (1999). Interaction of skeletalmuscle cells with collagen type IV is mediated by perlecan associated withthe cell surface. J. Cell Biochem. 75, 665-674.
Weiss, R. H. and Randour, C. J. (2002). Attenuation of matrix proteinsecretion by antisense oligodeoxynucleotides to the cyclin kinase inhibitorp21(Waf1/Cip1). Atherosclerosis 161, 105-112.
Zakine, G., Martinod, E., Fornes, P., Sapoval, M., Barritault, D.,Carpentier, A. F. and Chachques, J. C. (2003). Growth factors improvelatissimus dorsi muscle vascularization and trophicity after cardiomyoplasty.Ann. Thorac. Surg. 75, 549-554.
Zimowska, M., Szczepankowska, D., Streminska, W., Papy, D., Tournaire,M. C., Gautron, J., Barritault, D., Moraczewski, J. and Martelly, I.(2001). Heparan sulfate mimetics modulate calpain activity during ratSoleus muscle regeneration. J. Cell Physiol. 188, 178-187.
Journal of Cell Science 118 (1)
Jour
nal o
f Cel
l Sci
ence
Copyright © 2022 FDOKUMEN