Morphological Classification of Hybrid Microsystems Assembly
Upload
khangminh22Category
view
4download
0
RESEARCH Open Access
Morphological adaptation of sheep’s rumenepithelium to high-grain diet entailsalteration in the expression of genesinvolved in cell cycle regulation, cellproliferation and apoptosisLei Xu, Yue Wang, Junhua Liu, Weiyun Zhu and Shengyong Mao*
Abstract
Background: The objectives of this study were to characterize changes in the relative mRNA expression ofcandidate genes and proteins involved in cell cycle regulation, cell proliferation and apoptosis in the ruminalepithelium (RE) of sheep during high-grain (HG) diet adaptation.
Results: Twenty sheep were assigned to four groups with five animals each. These animals were assigned to differentperiods of HG diet (containing 40% forage and 60% concentrate mix) feeding. The HG groups received an HG diet for7 (G7, n = 5), 14 (G14, n = 5) and 28 d (G28, n = 5), respectively. In contrast, the control group (CON, n = 5) was fed theforage-based diet for 28 d. The results showed that HG feeding linearly decreased (P < 0.001) the ruminal pH, andincreased the concentrations of ruminal total volatile fatty acid (linear, P = 0.001), butyrate (linear, P < 0.001), valerate(quadratic P = 0.029) and the level of IGF-1 (quadratic, P = 0.043) in plasma. The length (quadratic, P = 0.004), width(cubic, P = 0.015) and surface of the ruminal papillae (linear, P = 0.003) were all enlarged after 14 d of HG diet feeding.HG feeding cubically increased the number of cell layers forming the stratum corneum (SC, P < 0.001) and thethickness of the SC (P < 0.001) and stratum basale (P < 0.001). The proportion of basal layer cells in the RE decreased(linear, P < 0.001) in the G0/G1-phase, but it increased linearly (P = 0.006) in the S-phase and cubically (P = 0.004) in theG2/M-phases. The proportion of apoptosis cells in G7, G14 and G28 was reduced compared to the CON (quadratic, P <0.001). HG diet feeding linearly decreased the mRNA expression of Cyclin E1 (P = 0.021) and CDK-2 (P = 0.001) and (P = 0.027) the protein expression of Cyclin E1. Feeding an HG diet linearly increased the mRNA expression of genes IGFBP-2(P = 0.034) and IGFBP 5 (P < 0.009), while linearly decreasing (P < 0.001) the IGFBP 3 expression. The expression of cellapoptosis gene Caspase 8 decreased (quadratic, P = 0.012), while Bad mRNA expression tended to decrease(cubic, P = 0.053) after HG feeding.
Conclusions: These results demonstrated sequential changes in rumen papillae size, cell cycle regulation andthe genes involved in proliferation and apoptosis as time elapsed in feeding a high-grain diet to sheep.
Keywords: Adaptation, Apoptosis, Cell cycle, Proliferation, Rumen papillae, Sheep
* Correspondence: [email protected] of Animal Science and Technology, Jiangsu Key Laboratory ofGastrointestinal Nutrition and Animal Health, Laboratory of GastrointestinalMicrobiology, Nanjing Agricultural University, Nanjing, Jiangsu 210095, China
© The Author(s). 2018 Open Access This article is distributed under the terms of the Creative Commons Attribution 4.0International License (http://creativecommons.org/licenses/by/4.0/), which permits unrestricted use, distribution, andreproduction in any medium, provided you give appropriate credit to the original author(s) and the source, provide a link tothe Creative Commons license, and indicate if changes were made. The Creative Commons Public Domain Dedication waiver(http://creativecommons.org/publicdomain/zero/1.0/) applies to the data made available in this article, unless otherwise stated.
Xu et al. Journal of Animal Science and Biotechnology (2018) 9:32 https://doi.org/10.1186/s40104-018-0247-z

BackgroundIn modern ruminant agriculture, diets rich in rapidlyfermentable carbohydrates are typically used to increase theenergy intake and efficiency of meat as well as milkproduction [1]. However, increased volatile fatty acid (VFA)production and reduced ruminal pH impose a challenge tothe absorption and metabolism of the ruminal epithelium(RE) [2, 3]. The RE responds to these challenges in a coordi-nated manner. Previous studies revealed that RE adaptationto highly fermentable diets entails morphological adapta-tions associated with tissue proliferation [4, 5]. RE tissueproliferation is presumably a response that maximizes theabsorptive surface area for nutrient absorption [6, 7].Nevertheless, previous studies have largely focused on REproliferation in calves and dairy cattle during the periparturi-ent period [8, 9]. There is a paucity of data regarding REproliferation in feedlot ruminants in spite of the fact thatdietary transition from backgrounding diets to finishingdiets should elicit such a response [8].RE proliferation is well known to be a response that
maximizes the absorptive surface area for nutrient absorp-tion [10–12]. Dirksen et al. [10] showed that a maximal in-crease in ruminal papillae surface area required six toeight weeks after an increase in the dietary energy density.Bannink et al. [13] found that maximal surface area re-quired approximately three to four weeks after parturitionin postpartum cows fed rapidly increased dietary concen-trate. However, Reynolds et al. [14] reported that there wasno difference in rumen papillae surface area between theprepartum and postpartum phases in Holstein cows fed di-ets based on NRC (1989) recommendations. Therefore, theresults of studying the impact of time on maximizing theabsorptive surface area for nutrient absorption during con-centrate adaptation were inconsistent [10, 13, 14]. A clearunderstanding of the time period is required, which mightallow for better management of the rumen ecosystem andthe practical use of these results in feedlot ruminant pro-duction systems.The surface area enlargement of ruminal papillae during
high-grain feeding might attribute to an increased rate ofgene transcription related to epithelial proliferation [8]and cell apoptosis [15]. A recent report showed that anincrease in dietary concentrate from 10 to 35% caused anaccelerated ruminal cell cycle and promoted ruminal cellapoptosis. Short volatile fatty acid and acidic pH maymodulate the genes involved in this process [15]. However,to date, little is known about the molecular basis of epi-thelial proliferation and apoptosis in the RE cells of sheepduring grain adaptation. The changes in their cell cyclehave not been clarified yet.In the present study, we hypothesized that the morpho-
logical adaptation of sheep’s rumen epithelium to a highgrain-diet entails alteration in the expression of genesinvolved in cell cycle regulation, cell proliferation and
apoptosis. Thus, the objectives of the study were tocharacterize changes in the relative mRNA expression ofcandidate genes and proteins involved in cell cycle regula-tion, cell proliferation and apoptosis in the RE of sheepduring grain adaptation, and the time period required tomaximize the absorptive surface area for nutrient absorp-tion during adaptation was also evaluated.
MethodsAnimals, experimental design, and dietsAll experimental designs and procedures for this studywere approved by the Animal Care and Use Committeeof Nanjing Agricultural University (SYXK(Su)2015–0656), following the requirements of the Regulations forthe Administration of Affairs Concerning ExperimentalAnimals (The State Science and Technology Commis-sion of P. R. China, 1988).In this study, 20 male sheep (Hu Sheep, BW of 25.60
± 0.41 kg, mean ± SD, approximately 180 d of age) wereplaced in individual pens (1.2 m × 1.4 m). These sheepwere divided into 4 groups based on age and bodyweight (BW). At the beginning of the study, all sheepwere fed a forage-based diet containing 96.4% hay and3.6% of a mineral and vitamin premix (the nutrient com-positions of the hay are presented in Table 1) on a drymatter (DM) basis for at least 4 wk. In the adaptationstage following the preparation period, three high-grain(HG) diet groups were fed a step-up diet (HG diet wasincreased 15 by 3.50% of BW per day gradually) for 4 duntil fed by 60% concentrate mix (Table 1); the controlgroup (CON, n = 5) continued to be fed the forage-baseddiet. Following adaptation, CON was fed the forage-based diet for an additional 28 d. In contrast, the HGgroups received an HG diet for 7 (G7, n = 5), 14 (G14, n= 5) and 28 d (G28, n = 5), respectively. The diets werefed twice in equal portions at 0830 and 1630 h daily.The BW of sheep was measured on the first day of everyweek before feeding. Sheep in CON were slaughteredafter 28 d of hay feeding and sheep in the HG7, HG14,and HG28 groups were slaughtered after 7, 14, and 28 dof HG feeding, respectively. During the experiment, thesheep had free access to clean drinking water, and theBW of sheep were measured on the first day of everyweek before morning feeding. The health and feed intakeof the animals were constantly monitored. Samples ofthe feed were offered, and the residue removed were col-lected and weighted daily, and then analyzed for drymatter intake (DMI).
Sample collectionFeed ingredients were sampled at the beginning and endof the experimental period. At the end of each feedingperiod, the sheep were slaughtered for sampling (4 hafter the last feeding) in a local slaughterhouse. Blood
Xu et al. Journal of Animal Science and Biotechnology (2018) 9:32 Page 2 of 12

samples (5 mL) were taken from the jugular vein imme-diately before slaughter. Blood was collected using ablood collection tube containing 40 kIU Na-heparin/mLblood. Plasma was harvested by centrifuging the bloodsamples at 2,000×g for 10 min at 4 °C and subsequentlystoring them at − 20 °C until IGF-1 concentration ana-lysis. Sheep were stunned by captive bolt and killed byexsanguinations according to the animal protection lawsof China. Immediately after slaughter, the pH value wasdetermined from a representative sample of rumen fluid(at least 200 mL) by a portable pH meter (PB-10; Sartor-ius, Goettingen, Germany). Then the rumen fluid wasfiltrated through four layers of cheesecloth preserved in25% (wt/vol) metaphosphoric acid and stored at − 20 °Cuntil later VFA concentration was determined using acapillary column gas chromatography (GC-14B; Shi-madzu, Japan; Capillary Column: 30 m × 0.32 mm ×0.25 mm film thickness; Column temperature = 130 °C,injector temperature = 180 °C, detector temperature =180 °C) [16]. Within 5 min of slaughter, rumen tissuesfrom the ventral sac were collected, and the muscularand serosal layers were peeled off by blunt dissection.
Serosal layers were transferred into liquid nitrogen andimmediately stored at − 80 °C until being analyzed formRNA and proteins. Other parts of rumen epitheliumsamples from the ventral sac were isolated, immediatelyrinsed, soaked in buffer solution and transferred to thelaboratory for cell cycle and apoptosis analysis. Rumentissue (1 cm2) from the rumen ventral sac was fixed in4% neutral paraformaldehyde solution for histomorpho-metric microscopy.
Plasma IGF-1 concentrationThe concentration of IGF-1 in blood plasma was deter-mined by an IGF-1 RIA KIT (Nanjing Jian Cheng insti-tute of Bio-engineering, Nanjing, China) with aminimum detection limit of 0.1μg/mL at Nanjing Gen-eral Hospital. Pretreated plasma samples were diluteduntil their IGF-1 concentrations were in the range of 25to 100 μg/mL, relative to the reference IGF-1.
Determination of rumen papillae morphologyTissue samples from the rumen ventral sac of all sheepwere prepared for light microscopy histomorphometricanalysis using the methods previously described byOdongo et al. [6]. Samples were fixed in 4% paraformal-dehyde, dehydrated, cleared and embedded in paraffin (3paraffin blocks per animal). Five discontinuous slices perparaffin block per animal were sectioned at a 6 μmthickness, stained with hematoxylin and eosin, andmounted for analysis. The standard sectioning procedurewas performed exactly as described by Holle and Birtles[17]. The microscopist was blinded to treatment condi-tions during the histomorphometric analysis. Five rumenpapillae per slide were selected at random for analysis.The length and width of papillae were measured usingImage Pro Plus software (Media Cybernetics, Bethesda,MD, USA). The density of papillae (1 cm × 1 cm) wasdetermined using a magnifying mirror (MG3B-1A,Shanghai, China). The total surface of papillae/cm2 wascalculated as length × width × 2, multiplied by the dens-ity of papillae (number of papillae/cm2). Measurementsof each stratum were made using the 40× objective lens,and five images (five different areas in one rumen papil-lae) were captured per papillae for a total of 25 replicatesper slide per animal. Image Pro Plus software (MediaCybernetics, Bethesda, MD, USA) was used to measurepredefined criteria previously described by Steele et al.[5]. In short, the stratum corneum (SC) was the outer-most cell layer, which was heavily stained, and thestratum granulosum (SG) was defined as the layer oflong axes cells that lay perpendicular to the stratum spi-nosum (SS) and basale (SB). SS and SB were cells nestedbetween the lamina propria and SG (Additional file 1:Figure S1).
Table 1 Ingredient and chemical composition of the diet(DM basis)
Item Diet
Hay High-grain diet
Ingredient composition, % DM
Oat hay 63.40 26.00
Alfalfa hay 33.00 14.00
Corn meal 0 34.20
Wheat meal 0 18.00
Soybean meal 0 4.20
CaCO3 1.00 1.00
NaCl 0.40 0.40
CaHPO4 1.20 1.20
Mineral and vitamin supplementa 1.00 1.00
Nutrient compositionb
DE, MJ/kg DM 8.88 11.73
CP, % DM 11.18 11.92
Crude fat, % DM 2.09 2.49
Crude fiber, % DM 28.41 12.90
NDF,% DM 44.45 24.54
ADF, % DM 19.52 10.15
Crude ash, % DM 8.34 4.53
Starch, % DM 3.25 32.34aContained 16% calcium carbonate; 102 g/kg of Zn; 47 g/kg of Mn; 26 g/kg ofCu; 1,140 mg/kg of I; 500 mg/kg of Se; 340 mg/kg of Co; 17,167,380 IU/kg ofvitamin A; 858,370 IU/kg of vitamin D; and 23,605 IU/kg of vitamin EbValues were analyzed based on the Feed Database in China [60]Sheep assigned to CON (n = 5), G7 (n = 5), G14 (n = 5) and G28 (n = 5) receiveda high-grain diet for 0, 7, 14 and 28 d, respectively
Xu et al. Journal of Animal Science and Biotechnology (2018) 9:32 Page 3 of 12
Cell cycle and apoptosis analysis by flow cytometryRE tissue (10 g of wet weight, sampled from the rumenventral blind sac) was digested by 0.25% trypsin and addedto 0.02% EDTA in D-Hanks’ solution. This method wasdescribed previously [15]. Briefly, the RE from the ventralblind sac of each sheep was quickly excised, then trans-ferred into ice-cold PBS (pH 7.4) and placed in an electric-heated thermostatic water bath at 37 °C, with continuousstirring. The digestion solution was changed every 30 minuntil the cells were completely dissociated. Cells werewashed in a culture medium. A portion of the isolated cellswas fixed in 75% ethanol, washed and treated with PBS,followed by 30 min of propidium iodide incubation. Otherisolated cells were incubated for 30 min with Annexin V-FITC/PI (Vazyme Bio, Nanjing). All cells were analyzed ona BD FACSCalibur Flow Cytometer (BD Biosciences, SanJose, CA) and 10,000 cells were collected with the FlowCytometer. Cell cycle and apoptosis were analyzed byFlowJo 7.6 (Stanford University, USA). The cell cycle wasset at FL2-A and apoptosis was set at FL1-H and FL2-H.
RNA isolation and cDNA synthesisTotal RNA was extracted from the RE samples using a Tri-zol (Takara Bio, Otsu, Japan) extraction method [18], andReal-time PCR was carried out as described by Liu et al.[19]. A NanoDrop spectrophotometer ND-1000UV-Vis(Thermo Fisher Scientific, Madison, Wisconsin, USA) wasused to detect the RNA concentration and the absorptionratio (260/280 nm) between 1.80 and 2.10, reflecting highRNA purity. A 1.4% agarose-formaldehyde gel electrophor-esis was used to verify the quality of RNA samples. Theconcentration of RNA was adjusted to 500 ng/μL and thenstored at − 80 °C. Total RNA (1 μg) was reverse-transcribed using a PrimeScript RT reagent Kit (Takara BioInc., Kusatsu, Japan).
Primer design and qRT-PCRCandidate genes related to the cell cycle protein (Cyclin),cyclin-dependent protein kinases (CDKs), IGFBPs andapoptosis proteins in the RE of sheep were evaluated usingqRT-PCR. All primers were designed by Primer Premier 5.0software (Premier Biosoft International, Palo Alto, CA) andidentified using the BLAST computer program (NationalCenter for Biotechnology Information, Bethesda, MD,USA). Primers were synthesized in Invitrogen BiologicalTechnologies (Shanghai, China). The range in efficiency forthe primers was between 92.1 and 119.0%. Real-time quan-titative PCR for candidate genes and GAPDH were carriedout using the QuantStudio 5 Real-time PCR Instrument(Applied Biosystems, Foster, California, USA), with fluores-cence detection of SYBR green dye. Amplification condi-tions were set as follows: 95 °C for 30 s, and 40 cycles of95 °C for 5 s and 60 °C for 30 s, followed by a dissociationcurve step (95 °C for 15 s, 60 °C for 1 min, and 95 °C for
15 s). PCR products were sequenced to verify their identity(Invitrogen Biological Technologies, Shanghai, China) andall amplicons were verified as 100% homologous to theirtarget sequence. The primers and amplicon sizes of allgenes are presented in Additional file 2: Table S1). All mea-surements were performed in triplicate. Reverse-transcription-negative blanks of each sample served as thenegative controls. Gene expression was normalized toGAPDH mRNA levels, and the data were analyzed accord-ing to the 2-△△Ct method.
Western blot analysisTotal protein was extracted from rumen epithelium tissuewith RIPA Lysis Buffer (Cat. P0013B, Beyotime Institute ofBiotechnology, Shanghai, China). The protein concentra-tion was then detected using an enhanced BCA proteinassay kit (Beyotime Institute of Biotechnology, Shanghai,China). Each protein sample (100 mg) was mixed withloading buffer and denatured at 100 °C for 5 min. Sampleproteins (50 μg) and a dual color prestained broad mo-lecular weight protein marker (Thermo Fisher Scientific,MA, USA) were separated with 10% sodium dodecylsulfate-polyacrylamide gel electrophoresis (SDS-PAGE).The separated proteins were then transferred onto a poly-vinylidene fluoride (PVDF) membrane (Merck MilliporeCorporation, USA). The membrane was saturated with 5%(wt/vol) nonfat milk powder (Yili, China), prepared inTris-buffered saline containing 0.1% Tween 20 (TBST),for 2 h at room temperature and then incubated with pri-mary antibodies overnight at 4 °C. The primary antibodiesemployed were rb-anti-Cyclin D1 (Abcam, ab134175,1:50,000 dilution), rb-anti-Cyclin A2 (Abcam, ab181591,1:2,000 dilution), rb-anti-Cyclin E1 (Abcam, ab33911,1:2,000 dilution), rb-anti-CDK 2 (Abcam, ab32147,1:10,000 dilution), rb-anti-CDK 4 (Abcam, ab199728,1:2,000 dilution), and rb-anti-CDK 6 (Abcam, ab124821,1:50,000 dilution). After several washes with TBST, mem-branes were incubated in goat-anti-rabbit lgG HRP-conjugated secondary antibody (Fcmacs Biotechnology,Nanjing, China) with a 1:5,000 dilution. Then, membraneswere incubated in HRP-conjugated mouse monoclonalGAPDH antibody (Santa Cruz, sc-32233, California, USA)with a 1:200 dilution to normalize the results. The signalswere detected with a Immobilon Western chemilumines-cent HRP substrate (Merck Millipore Corporation, USA),according to the manufacturer’s instructions, and visual-ized by luminescence imaging (LAS-4000, Fujifilm, Tokyo,Japan). The density of the blotting bands was then ana-lyzed using Image J software (National Institutes ofHealth, Bethesda, MD).
Statistical analysisComparisons between the groups were carried out withone-way ANOVA, followed by Tukey’s multiple comparison
Xu et al. Journal of Animal Science and Biotechnology (2018) 9:32 Page 4 of 12

test in SPSS software packages (SPSS version 16.0.1for Windows; SPSS Inc., Chicago, IL, USA). Linear,quadratic or cubic polynomial contrasts were per-formed to test for a trend in the treatment means.Differences were considered significant at P < 0.05,and trends were discussed at 0.05 < P < 0.10.
ResultsAnimalsAll animals were clinically healthy for the entire dur-ation of the feeding experiments. During the hay-fedperiod, hay intake was approximately 1,000 g per animalper day. During the HG feeding period, there was no sig-nificant variation in DMI between the different treat-ment groups (P = 0.379) (Fig. 1). The final body weightof sheep increased linearly (P = 0.003) with the numberof days fed an HG diet and was greater (P = 0.024) in theG28 group compared with the CON group (Table 2).
Rumen fermentation and plasma IGF-1The rumen pH, concentrations of ruminal VFA in rumi-nal fluid and the level of IGF-1 in the blood are summa-rized in Table 2. Feeding the HG diet linearly decreased(P < 0.001) the ruminal pH. Total rumen VFA concentra-tion increased (linear, P = 0.001) with HG diet feeding
and was greater in the G14 and G28 groups than in theCON group (P = 0.006). Furthermore, the butyrate con-centration increased linearly (P < 0.001) with the numberof days fed the HG diet. The valerate concentration in-creased quadratically (P = 0.029) and was greater in theG7, G14 and G28 groups (P = 0.008) than in the CONgroup. No significant changes were observed in the con-centrations of acetate (P = 0.436), propionate (P = 0.315),isobutyrate (P = 0.363) and isovalerate (P = 0.198) amongthe four groups. Feeding the grain diet quadratically in-creased (P = 0.043) the plasma IGF-1 concentration, andthe level of IGF-1 in plasma was greater in the G14 andG28 groups (P = 0.004) than in the CON group.
Rumen papillae density, dimensions and surface areaTo evaluate whether dietary adaptation affected rumenpapillae density, papillae dimensions and surface, 1-cm2
pieces of RE samples were collected and measured imme-diately after the animals’ slaughter. The results are shownin Table 3. No significant differences were observed (P =0.865) in the papillae density of the ventral sac among thefour groups. However, there was a quadratic increase (P =0.004) in papillae length from 3.66 for CON group to4.76 mm for G28 group, with the greatest length being5.32 mm for the G14 group. Papillae width increased cu-bically (P = 0.015), and was greater in the G28 group thanin the CON and G14 groups (P = 0.001). Furthermore, thetwo-dimensional surface area of rumen papillae was calcu-lated, and the data showed that it increased linearly (P =0.003) with the number of days fed an HG diet, and it wasgreater (P = 0.010) in the G14 and G28 groups comparedwith the CON and G7 groups.
Rumen epithelium morphologyThe representative rumen papillae cross sections areshown in Additional file 1: Figure S1. The changes in therumen papillae morphology of the RE in CON, G7, G14and G28 groups are described in Table 4. The number ofcell layers forming SC increased cubically (P < 0.001) withHG diet feeding, and was greater in the G7 group than inthe CON group (P = 0.004). The thickness of SC increasedcubically (P < 0.001) and was greater (P < 0.001) in G7 andG28 groups than in CON and G14 groups. The thicknessof the sum of the SG and SS decreased cubically (P <0.001), and was lower in G7 and G14 groups relative toCON and G28 groups (P < 0.001). Feeding the grain dietcubically increased (P = 0.028) the thickness of the SB, andthe SB thickness was greater (P < 0.001) in G28 groupthan in CON, G7 and G14 groups.
Analyses of cell cycles and apoptosisThe representative cell cycles of RE are shown inAdditional file 3: Figure S2 and the details are shownin Table 5. The proportion of cells in the G0/G1-
Fig. 1 DMI during a high-grain (HG) feeding period (G7–28). Error barsindicate SEM. Values are mean ± SEM, n = 5. Sheep assigned to G7(n = 5), G14 (n = 5) and G28 (n = 5) received a high-grain diet for 7, 14and 28 d, respectively. Contrast patterns: L = linear, Q = quadratic
Xu et al. Journal of Animal Science and Biotechnology (2018) 9:32 Page 5 of 12

phase was lower (P < 0.001) in the G14 and G28groups than in the CON and G7 groups (linear P <0.001). However, the proportion of cells in S-phaseincreased linearly (P = 0.006), and was greater (P =0.007) in G28 group than in CON, G7 and G14groups, while the cell number percentage of the G2/M-phase increased (P = 0.004) cubically, and wasgreater in G14 and G28 groups than in CON and G7groups (P < 0.001). The changes in cell apoptosis inthe RE (Additional file 4: Figure S3) were also evalu-ated. The results showed that the proportion of apop-tosis cells in G7, G14 and G28 groups was reducedcompared with CON group (quadratic, P < 0.001).However, the proportion of apoptosis cells increasedfrom 19.03% for G7 group to 28.22% for G14 group,with an increase to 38.33% for G28 group (P < 0.05).
Gene and protein expression related to cell-cycle-regulationThe expression of genes related to cell-cycle-regulatingproteins (Cyclin D1, Cyclin A2, Cyclin E1, CDK-2, CDK-4and CDK-6) are shown in Fig. 2. The mRNA expression
of Cyclin E1 linearly decreased (P = 0.021) from 1.00 forCON group to 0.73 for G14 group, and CDK-2 geneexpression decreased from 1.02 for CON group to 0.73 forG28 group (linear, P = 0.001). No significant changes (P ≥0.05) were observed in the mRNA expression of CyclinD1, Cyclin A2, CDK-4 and CDK-6 among the four groups.The protein expressions of Cyclin A2, Cyclin D1, Cyclin
E1, CDK 2, CDK 4 and CDK 6 were assessed by Westernblotting (Fig. 3). The results showed that the protein expres-sion of Cyclin E1 decreased linearly (P= 0.027) from 1.11for CON group to 0.37 for G28 group, with a minimum ex-pression at 0.26 for G14 group. No significant differenceswere observed for the expression of Cyclin D1 (P= 0.129),Cyclin A2 (P= 0.417), CDK 2 (P= 0.319), CDK 4 (P= 0.445)or CDK 6 (P= 0.640) among the four groups.
Gene expression related to the IGF-1 pathway and cellapoptosisThe expression of genes that regulate the IGF-1 path-way, namely IGFBP 2, IGFBP 3, IGFBP 5 and IGFBP 6,and cell apoptosis, namely Caspase 3, Caspase 8, Bcl-2
Table 2 Final body weight, ruminal pH, concentrations of ruminal volatile fatty acid (VFA) in ruminal fluid and level of IGF-1 in bloodof hay-fed (CON) and high-grain-fed sheep (G7–28)
Item Treatment SEM Contrast, P
CON G7 G14 G28 Treatment Linear Quadratic Cubic
Final body weight, kg 25.73b 26.24ab 28.40ab 29.23a 0.51 0.024 0.003 0.845 0.47
Rumen parameters
Ruminal pH 6.81a 5.99b 5.94b 5.84b 0.09 < 0.001 < 0.001 < 0.001 0.106
Acetate, mmol/L 66.26 69.33 70.36 74.53 1.74 0.436 0.117 0.877 0.744
Propionate, mmol/L 18.45 19.33 19.88 23.85 1.08 0.315 0.095 0.474 0.695
Isobutyrate, mmol/L 0.61 0.81 0.68 0.78 0.04 0.363 0.343 0.563 0.165
Butyrate, mmol/L 5.74b 16.03a 20.17a 18.78a 1.41 < 0.001 < 0.001 < 0.001 0.906
Isovalerate, mmol/L 0.53 0.87 0.64 0.87 0.07 0.198 0.185 0.664 0.096
Valerate, mmol/L 0.67b 1.36a 1.29a 1.32a 0.09 0.008 0.008 0.029 0.188
Total VFA, mnol/L 92.26b 107.73ab 113.02a 120.13a 3.24 0.006 0.001 0.402 0.588
Blood parameter
IGF-1 in plasma, ng/mL 195.88b 255.74ab 329.70a 293.35a 15.15 0.004 0.002 0.043 0.221
Sheep assigned to CON (n = 5), G7 (n = 5), G14 (n = 5) and G28 (n = 5) received a high-grain diet for 0, 7, 14 and 28 d, respectivelySEM standard error of meana, bMeans within a row with different superscripts differ (P < 0.05)
Table 3 Rumen papillae density, dimensions and surface area of hay-fed (CON) and high-grain-fed sheep (G7–28)
Item Treatments SEM Contrast, P
CON G7 G14 G28 Treatment Linear Quadratic Cubic
Length, mm 3.66c 3.72c 5.32a 4.76b 0.15 < 0.001 < 0.001 0.004 < 0.001
Width, mm 1.90b 1.98ab 1.89b 2.13a 0.06 0.001 0.004 0.093 0.015
Surface, mm/cm2 935.00b 1077.83ab 1407.49a 1337.98a 136.58 0.010 0.003 0.288 0.194
Density, no./cm2 70 76 74 70 10 0.865 0.964 0.420 0.843
Sheep assigned to CON (n = 5), G7 (n = 5), G14 (n = 5) and G28 (n = 5) received a high-grain diet for 0, 7, 14 and 28 d, respectivelySEM standard error of meana-c Means within a row with different superscripts differ (P < 0.05)
Xu et al. Journal of Animal Science and Biotechnology (2018) 9:32 Page 6 of 12

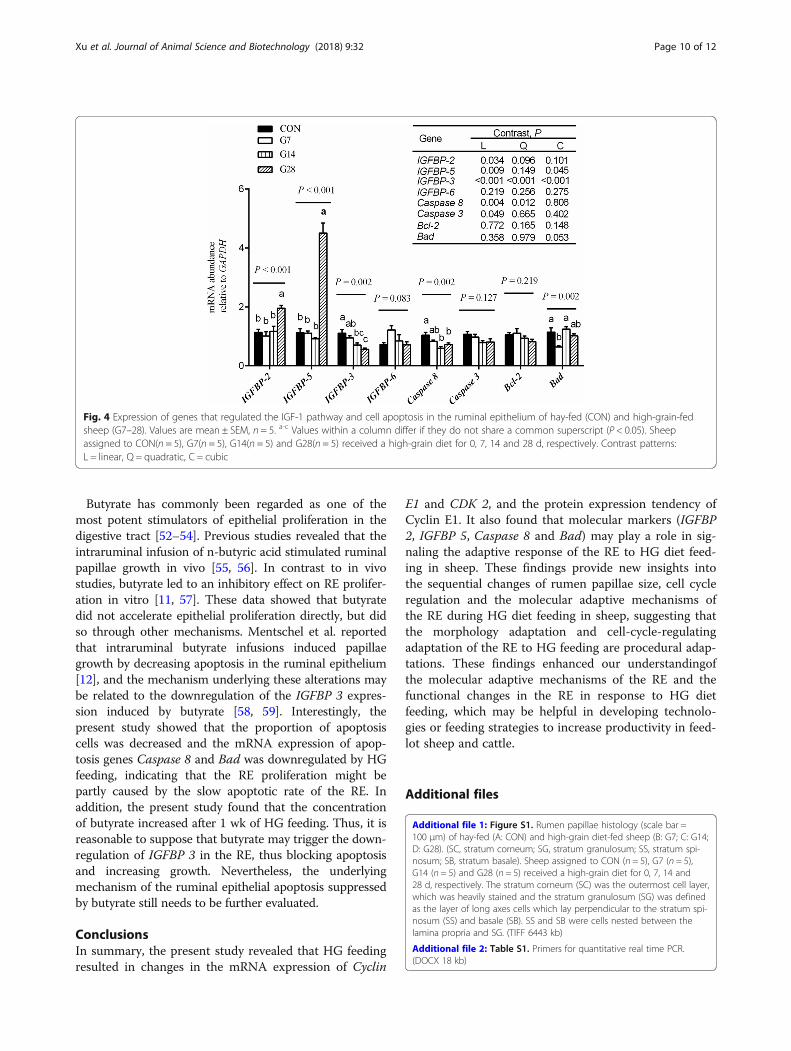
and Bad, were evaluated by real-time quantitative PCR(Fig. 4). The mRNA expression of IGFBP 2 (linear, P =0.034) and IGFBP 5 (linear, P < 0.009) increased up tothe maximal level after 28 d of HG diet feeding, whileIGFBP 3 mRNA expression decreased linearly (P <0.001) from 1.10 for CON group to 0.56 for G28 group,and IGFBP 6 expression tended to increase (P = 0.083)from CON group to the G7 group.The mRNA expression of Caspase 8 decreased (quad-
ratic, P = 0.012) from 1.04 for CON group to 0.60 forG14 group and 0.72 for G28 group, but there was no dif-ference (P > 0.05) among G7, G14 and G28 groups. BadmRNA expression tended to decrease (cubic, P = 0.053)from 1.14 for CON group to 0.64 for G7 group, with anincrease (P < 0.05) to 1.24 for G14 group compared withG7 group. However, the expressions of Caspase 3 (P =0.127) and Bcl-2 (P = 0.219) showed no variation amongthe four groups.
DiscussionIn the present study, our data revealed that HG feedingsignificantly increased the concentrations of total VFAand decreased the ruminal pH, which were in line withsome previous studies [19–21]. In response to increasedVFA production and decreased ruminal pH, our data re-vealed that the RE responded to these challenges in a co-ordinated manner. The present study showed that the
length, width and surface area of the rumen papillaewere significantly enlarged with increasing time of con-centrate feeding in the diet, which was consistent withprevious studies on goats [22] and cattle [23–25]. An en-largement of the RE surface area could enhance trans-port rates and increase the activity of the transportproteins involved in VFA absorption and regulation ofintracellular pH [26, 27], further stimulating VFA ab-sorption and pH value recovery in the rumen [13, 28,29]. In addition, the present study showed that the dur-ation of time required for a significant increase in rumi-nal papillae surface area was at least 2 wk after HGfeeding, which was consistent with the report by Liebichet al. [30], who showed that the size of papillae increasedat the 2-wk mark after switching from a dry period to alactation diet.The increase in ruminal VFA production and acidic
load associated with HG feeding necessitates an adap-tation of RE structure and function [8, 31]. Thepresent data indicated that, after 7 d of HG diet feed-ing, the thickness and layers of SC increased cubic-ally, and the increase in the thickness of the SBoccurred within 28 d of the onset of HG feeding.These results were similar to other reports [32, 33],which demonstrated that the cell layers and thicknessof the SC increased with increasing levels of concen-trate feeds in the diet.
Table 4 Rumen papillae morphology of hay-fed (CON) and high-grain-fed sheep (G7–28)
Item Treatments SEM Contrast, P
CON G7 G14 G28 Treatment Linear Quadratic Cubic
Thickness of stratum corneum, μm 21.31b 27.12a 20.26b 26.18a 0.78 < 0.001 < 0.001 < 0.001 < 0.001
Cell layers of stratum corneum,number of cell layers
2.86b 3.13a 2.98ab 2.99ab 0.04 0.004 < 0.001 0.006 < 0.001
Thickness of stratum granulosum/spinosum, μm
87.88a 69.70b 69.28b 88.16a 1.92 < 0.001 0.006 0.410 < 0.001
Thickness of stratum basale, μm 11.50b 10.51b 10.63b 13.66a 0.25 < 0.001 0.002 0.016 0.028
Sheep assigned to CON (n = 5), G7 (n = 5), G14 (n = 5) and G28 (n = 5) received a high-grain diet for 0, 7, 14 and 28 d, respectivelySEM standard error of meana, b Means within a row with different superscripts differ (P < 0.05)
Table 5 Cell cycle progression of ruminal epithelial cells of hay-fed (CON) and high-grain-fed sheep (G7–28)
Item1 Treatments SEM Contrast, P
CON G7 G14 G28 Treatment Linear Quadratic Cubic
G0/G1, % 91.77a 89.96a 85.86b 84.73b 0.76 < 0.001 < 0.001 0.754 0.238
S, % 2.78b 2.56b 3.05b 5.11a 0.33 0.007 0.006 0.058 0.691
G2/M, % 4.24b 5.62b 9.70a 9.36a 0.56 < 0.001 < 0.001 0.058 0.004
Apoptosis cells, % 62.72a 19.03d 28.22c 38.33b 3.82 < 0.001 < 0.001 < 0.001 < 0.001
Sheep assigned to CON (n = 5), G7 (n = 5), G14 (n = 5) and G28 (n = 5) received a high-grain diet for 0, 7, 14 and 28 d, respectivelySEM standard error of meana-d Means within a row with different superscripts differ (P < 0.05)1 G0/G1 = the proportion of cells in the gap G0 and G1 phases (the percentage is based on 10,000 cells); S = the proportion of cells in the synthesis (S) phase,based on the fact that the single-cell DNA level is greater than the DNA content of resting diploid cells (the percentage is based on 10,000 cells measured); G2/M= the proportion of mitotic cells (the percentage is based on 10,000 cells). Apoptosis cells = the proportion of cells in the apoptosis phase (the percentage is basedon 10,000 cells measured)
Xu et al. Journal of Animal Science and Biotechnology (2018) 9:32 Page 7 of 12

Enlarged rumen papillae size caused by HG feeding maybe the result of an accelerated cell cycle progression [15, 20].Previous studies revealed that the animal cell cycle consistsof five distinct but sequential phases named the G0, G1, S,G2 and M phase, respectively [15, 20, 34]. The cells in theG0 phase have normal function (but not mitotic activity)and become quiescent; the G1 phase is the phase of cellgrowth; the S phase is the phase of DNA synthesis; the G2
phase includes preparations for cell division; and the Mphase is the cell division phase [34]. In the present study,HG feeding resulted in a decrease in the proportion of REcells in the G0/G1-phase and an increase in the percentageof RE cells in the S-phase and G2/M-phases. This indicatedthat the time duration of the G0/G1-phase was shortened,and then, cell cycle progression was accelerated. Thesechanges may lead to an increase in rumen papillae size,which further enhances the absorption ability of the RE [10,15, 20]. In addition, the present study showed that signifi-cant changes in the proportion of the basal layer cells of theRE in the G0/G1-phase and G2/M-phase occurred at d14after HG diet feeding, indicating that the acceleration of celldivision in the RE occurred after 2 wk of HG diet feeding.Cyclins and cyclin-dependent kinases (CDKs) are two
main protein families that control cell cycle progression[35, 36]. The G1-phase cell cyclin protein containsCyclin D and Cyclin E [34]. The Cyclin D1 combineswith CDK 4 and CDK 6, forming complexes to enterinto the G1-phase [37]. The Cyclin E-CDK 2 complexpromotes progression from G1 into the S phase [38].
Any changes in the duration of one or more phases ofthe cell cycle will affect cell cycle progression and cellgrowth [34]. A previous study showed that the Cyclin E-CDK 2 complex accumulated at the G1/S-phase bound-ary and is degraded as cells progress through the S phase[39]. In the present study, compared with the CONgroup, the Cyclin E 1 and CDK 2 mRNA expression waslower at 14 and 28 d, respectively, after the onset of HGfeeding. Similar changes in the protein expression ofCyclin E 1 decreased with a minimum expression at14 d after HG feeding. This indicated that Cycline E1and CDK 2 may be degraded as cells progress from Sinto the G2/M phase [40]. However, no similar changeswere observed in the protein expression of CDK 2. Asshown in other studies [41, 42], changes in protein levelsdid not automatically correlate well to mRNA levels, im-plying that posttranscriptional events may contribute tothe formation of such discrepancies.The results of this study showed that plasma IGF-1
concentration increased linearly with the number of daysfed an HG diet, and this finding is consistent with theprevious report by Shen et al. [22], who found thatplasma IGF-1 concentration increased significantly at14 d (191 ± 21 μg/L) and 21 d (302 ± 36 μg/L) after feed-ing a high-energy diet in goats aged 4 months. Someprevious studies also revealed that energy intake hadmarked effects on the plasma IGF-1 concentration insheep [20, 22]. Thus, in the current study, the higherplasma IGI-1 level in the HG group might be explained
Fig. 2 Expression of genes related to cell cycle regulation in the ruminal epithelium of hay-fed (CON) and high-grain-fed sheep (G7–28). Values aremean ± SEM, n = 5. a, b Values within a column differ if they do not share a common superscript (P < 0.05). Sheep assigned to CON (n = 5), G7 (n = 5),G14 (n = 5) and G28 (n = 5) received a high-grain diet for 0, 7, 14 and 28 d, respectively. Contrast patterns: L = linear, Q = quadratic, C = cubic
Xu et al. Journal of Animal Science and Biotechnology (2018) 9:32 Page 8 of 12

by the high-energy intake in sheep fed an HG diet. Con-sistent with some previous reports that found HG dietfeeding increased the final body weight of sheep [43, 44],the current study also revealed that the BW at slaughterincreased linearly with the days fed an HG diet.It has been well established that HG feeding or the
intraruminal infusion of VFA can stimulate the prolifera-tion of RE [4, 45], and the growth promoters such asVFA and IGF may be involved in the regulation of pro-liferation [8, 22]. Shen et al. showed that increasing diet-ary energy could improve plasma IGF-1 concentrationsin goats and further stimulate rumen papillae growthand enhance the functional adaptation of ruminal Na+
absorption. [22, 46]. Zitnan et al. reported that plasmaIGF-1 concentrations had been positively associated withruminal papillae proliferation in calves [47]. As a growthfactor, IGF-1 was believed to play a pivotal role in REgrowth [20], as it induced RE cell proliferation in vitro[11, 22], thereby initiating a signal transduction cascade
that activates genes responsible for proliferation andapoptosis [48].IGF-1 induces cellular response by regulating IGF-
binding proteins (IGFBPs) [49]. It has been well character-ized that IGFBP 2, IGFBP 3 and IGFBP 5 were thought tomodulate IGF-1 cellular events [50, 51]. Of these IGFBPs,IGFBP 5, which is known to potentiate IGF-1 effects, mayencourage proliferation in the RE when upregulated,whereas IGFBP 3 modulates IGF-1 cellular events in an op-posing fashion to IGFBP 5. In the present study, our datarevealed that HG feeding upregulated the mRNA expres-sion of IGFBP 2 and IGFBP 5, and downregulated themRNA expression of IGFBP 3, which was in line with thereport by Steele et al. [1], who showed that the mRNA ex-pression of IGFBP 3 was down-regulated, and IGFBP 5 wasup-regulated in the RE of nonlactating cattle after transferto a high-grain diet [5]. Thus, it is reasonable to supposethat IGF-1 may trigger the proliferation of the RE and blockapoptosis to increase growth after 2 wk of HG feeding.
Fig. 3 Expression of proteins related to cell cycle regulators in rumen epithelial tissue of hay-fed (CON) and high-grain-fed sheep (G7–28). Proteinextracts of rumen epithelium samples were prepared and immunoblotted with specific antibodies (a). Intensities of Cyclin D1, Cyclin A2, CyclinE1, CDK-2, CDK-4 and CDK-6 were normalized to corresponding GAPDH levels (b) (means ± SE; n = 5). Sheep assigned to CON(n = 5), G7(n = 5),G14(n = 5) and G28(n = 5) received a high-grain diet for 0, 7, 14 and 28 d, respectively. Contrast patterns: L = linear, Q = quadratic, C = cubic
Xu et al. Journal of Animal Science and Biotechnology (2018) 9:32 Page 9 of 12
Butyrate has commonly been regarded as one of themost potent stimulators of epithelial proliferation in thedigestive tract [52–54]. Previous studies revealed that theintraruminal infusion of n-butyric acid stimulated ruminalpapillae growth in vivo [55, 56]. In contrast to in vivostudies, butyrate led to an inhibitory effect on RE prolifer-ation in vitro [11, 57]. These data showed that butyratedid not accelerate epithelial proliferation directly, but didso through other mechanisms. Mentschel et al. reportedthat intraruminal butyrate infusions induced papillaegrowth by decreasing apoptosis in the ruminal epithelium[12], and the mechanism underlying these alterations maybe related to the downregulation of the IGFBP 3 expres-sion induced by butyrate [58, 59]. Interestingly, thepresent study showed that the proportion of apoptosiscells was decreased and the mRNA expression of apop-tosis genes Caspase 8 and Bad was downregulated by HGfeeding, indicating that the RE proliferation might bepartly caused by the slow apoptotic rate of the RE. Inaddition, the present study found that the concentrationof butyrate increased after 1 wk of HG feeding. Thus, it isreasonable to suppose that butyrate may trigger the down-regulation of IGFBP 3 in the RE, thus blocking apoptosisand increasing growth. Nevertheless, the underlyingmechanism of the ruminal epithelial apoptosis suppressedby butyrate still needs to be further evaluated.
ConclusionsIn summary, the present study revealed that HG feedingresulted in changes in the mRNA expression of Cyclin
E1 and CDK 2, and the protein expression tendency ofCyclin E1. It also found that molecular markers (IGFBP2, IGFBP 5, Caspase 8 and Bad) may play a role in sig-naling the adaptive response of the RE to HG diet feed-ing in sheep. These findings provide new insights intothe sequential changes of rumen papillae size, cell cycleregulation and the molecular adaptive mechanisms ofthe RE during HG diet feeding in sheep, suggesting thatthe morphology adaptation and cell-cycle-regulatingadaptation of the RE to HG feeding are procedural adap-tations. These findings enhanced our understandingofthe molecular adaptive mechanisms of the RE and thefunctional changes in the RE in response to HG dietfeeding, which may be helpful in developing technolo-gies or feeding strategies to increase productivity in feed-lot sheep and cattle.
Additional files
Additional file 1: Figure S1. Rumen papillae histology (scale bar =100 μm) of hay-fed (A: CON) and high-grain diet-fed sheep (B: G7; C: G14;D: G28). (SC, stratum corneum; SG, stratum granulosum; SS, stratum spi-nosum; SB, stratum basale). Sheep assigned to CON (n = 5), G7 (n = 5),G14 (n = 5) and G28 (n = 5) received a high-grain diet for 0, 7, 14 and28 d, respectively. The stratum corneum (SC) was the outermost cell layer,which was heavily stained and the stratum granulosum (SG) was definedas the layer of long axes cells which lay perpendicular to the stratum spi-nosum (SS) and basale (SB). SS and SB were cells nested between thelamina propria and SG. (TIFF 6443 kb)
Additional file 2: Table S1. Primers for quantitative real time PCR.(DOCX 18 kb)
Fig. 4 Expression of genes that regulated the IGF-1 pathway and cell apoptosis in the ruminal epithelium of hay-fed (CON) and high-grain-fedsheep (G7–28). Values are mean ± SEM, n = 5. a-c Values within a column differ if they do not share a common superscript (P < 0.05). Sheepassigned to CON(n = 5), G7(n = 5), G14(n = 5) and G28(n = 5) received a high-grain diet for 0, 7, 14 and 28 d, respectively. Contrast patterns:L = linear, Q = quadratic, C = cubic
Xu et al. Journal of Animal Science and Biotechnology (2018) 9:32 Page 10 of 12

Additional file 3: Figure S2. Cell cycle distribution in the ruminalepithelium of sheep fed purely hay (A: CON) and a high-grain diet for 7(B: G7), 14 (C: G14) and 28 d (D: G28). (TIFF 468 kb)
Additional file 4: Figure S3. Cell apoptosis distribution in the ruminalepithelium of sheep fed purely hay (A: CON) and a high-grain diet for 7(B: G7), 14 (C: G14) and 28 d (D: G28). Q4: Nonapoptotic, live cells do notbind Annexin V-FITC and exclude PI(Propidium lodide); Q3: Early apoptoticcells bind Annexin V-FITC and exclude PI; Q2: Late apoptotic cells bindAnnexin V-FITC and also PI. Apoptosis cells = Q2 (Late apoptotic cells) + Q3(Early apoptotic cells). (TIFF 1543 kb)
AbbreviationsBW: Body weight; CDKs: Cyclin-dependent protein kinases; CON: Control;Cyclin: Cell cycle protein; DMI: Dry matter intake; HG: High-grain; IGF-1: Insuline like growth factor 1; IGFBPs: IGF-binding proteins; RE: Ruminalepithelium; SB: Stratum basale; SC: Stratum corneum; SG: Stratumgranulosum; SS: Stratum spinosum; VFA: Volatile fatty acid
AcknowledgementsThis work was supported by the National Natural Science Foundation of China(No.31572436) and Natural Science Foundation of China (No. 31372339).
Authors’ contributionsLX and SYM conceived the study, performed the experiment, performed dataanalysis, and contributed to drafting the manuscript. LX and YW carried out theanimal experiment. JHL and WYZ conceived the experiment and proofread themanuscript. All authors read and approved the final manuscript.
Ethics approvalAll experimental designs and procedures for this study were approved bythe Animal Care and Use Committee of Nanjing Agricultural University(SYXK(Su)2015–0656), following the requirements of the Regulations for theAdministration of Affairs Concerning Experimental Animals (The StateScience and Technology Commission of P. R. China, 1988).
Consent for publicationNot applicable.
Competing interestsThe authors declare that they have no competing interests.
Received: 22 September 2017 Accepted: 1 March 2018
References1. Steele M, Dionissopoulos L, AlZahal O, Doelman J, McBride B. Rumen
epithelial adaptation to ruminal acidosis in lactating cattle involves thecoordinated expression of insulin-like growth factor-binding proteins and acholesterolgenic enzyme. J Dairy Sci. 2012;95:318–27.
2. Sutton J, Dhanoa M, Morant S, France J, Napper D, Schuller E. Rates ofproduction of acetate, propionate, and butyrate in the rumen of lactating dairycows given normal and low-roughage diets. J Dairy Sci. 2003;86:3620–33.
3. Penner G, Taniguchi M, Guan L, Beauchemin K, Oba M. Effect of dietaryforage to concentrate ratio on volatile fatty acid absorption and theexpression of genes related to volatile fatty acid absorption andmetabolism in ruminal tissue. J Dairy Sci. 2009;92:2767–81.
4. Goodlad RA. Some effects of diet on the mitotic index and the cell cycle ofthe ruminal epithelium of sheep. Q J Exp Physiol. 1981;66:487–99.
5. Steele MA, Croom J, Kahler M, AlZahal O, Hook SE, Plaizier K, et al. Bovinerumen epithelium undergoes rapid structural adaptations during grain-induced subacute ruminal acidosis. Am. J. Physiol. Regul. Integr. Comp.Physiol. 2011;300:1515–23.
6. Odongo N, AlZahal O, Lindinger M, Duffield T, Valdes E, Terrell S, et al.Effects of mild heat stress and grain challenge on acid-base balance andrumen tissue histology in lambs. J Anim Sci. 2006;84:447–55.
7. Etschmann B, Suplie A, Martens H. Change of ruminal sodium transport insheep during dietary adaptation. Arch Anim Nutr. 2009;63:26–38.
8. Penner G, Steele M, Aschenbach J, McBride B. Ruminant nutritionsymposium: molecular adaptation of ruminal epithelia to highlyfermentable diets. J Anim Sci. 2011;89:1108–19.
9. Steele M, Schiestel C, AlZahal O, Dionissopoulos L, Laarman A, Matthews J, etal. The periparturient period is associated with structural and transcriptomicadaptations of rumen papillae in dairy cattle. J Dairy Sci. 2015;98:2583–95.
10. Dirksen G, Liebich H, Mayer E. Adaptive changes of the ruminal mucosa andtheir functional and clinical significance. Bovine Pract. 1985;20:116–20.
11. Baldwin R. The proliferative actions of insulin, insulin-like growth factor-I,epidermal growth factor, butyrate and propionate on ruminal epithelial cellsin vitro. Small Rumin Res. 1999;32:261–8.
12. Mentschel J, Leiser R, Mulling C, Pfarrer C, Claus R. Butyric acid stimulatesrumen mucosa development in the calf mainly by a reduction of apoptosis.Archiv fur Tierernahrung. 2001;55:85–102.
13. Bannink A, France J, Lopez S, Gerrits W, Kebreab E, Tamminga S, et al.Modelling the implications of feeding strategy on rumen fermentation andfunctioning of the rumen wall. AnimFeed Sci Technol. 2008;143:3–26.
14. Reynolds C, Dürst B, Lupoli B, Humphries D, Beever D. Visceral tissue massand rumen volume in dairy cows during the transition from late gestationto early lactation. J Dairy Sci. 2004;87:961–71.
15. Gui H, Shen Z. Concentrate diet modulation of ruminal genes involved incell proliferation and apoptosis is related to combined effects of short-chainfatty acid and pH in rumen of goats. J Dairy Sci. 2016;99:6627–38.
16. Qin W. Determination of rumen volatile fatty acids by means of gaschromatography. J Nanjing Agric Coll. 1982;4:110–6.
17. Holle S, Birtles M. An immunocytochemical method for studying patterns ofcell proliferation in the wool follicle. N Z Vet J. 1990;38:89–93.
18. Chomczynski P, Sacchi N. Single-step method of RNA isolation by acidguanidinium thiocyanate-phenol-chloroform extraction. Anal Biochem.1987;162:156–9.
19. Liu JH, Xu TT, Liu YJ, Zhu WY, Mao SY. A high-grain diet causes massivedisruption of ruminal epithelial tight junctions in goats. Am J Physiol RegulIntegr Comp Physiol. 2013;305:232–41.
20. Lu J, Zhao H, Xu J, Zhang L, Yan L, Shen Z. Elevated cyclin D1 expression isgoverned by plasma IGF-1 through Ras/Raf/MEK/ERK pathway in rumenepithelium of goats supplying a high metabolizable energy diet. J AnimPhysiol Anim Nutr (Berl). 2013;97:1170–8.
21. Mao SY, Huo WJ, Zhu WY. Microbiome–metabolome analysis revealsunhealthy alterations in the composition and metabolism of ruminalmicrobiota with increasing dietary grain in a goat model. Environ Microbiol.2016;18:525–41.
22. Shen Z, Seyfert HM, Lohrke B, Schneider F, Zitnan R, Chudy A, et al. Anenergy-rich diet causes rumen papillae proliferation associated with moreIGF type 1 receptors and increased plasma IGF-1 concentrations in younggoats. J Nutr. 2004;134:11–7.
23. Brownlee A. The development of rumen papillae in cattle fed on differentdiets. Br Vet J. 1956;112:369–75.
24. Weiss B. The relationship between the acidity of the rumen contents andthe proliferation status of the rumen mucosa in cattle. Berl Munch TierarztlWochenschr. 1994;107:73–8.
25. Chen J, Chen W, Shen Z, Su Y. Effects of pentagastrin and IGF-1 on DNAsynthesis of rumen epithelial cells of dairy cow and neonatal calf. J AnimFeed Sci. 2004;13:289–92.
26. Galfi P, Neogrády S, Gäbel G. Na+/H+ exchange in primary, secondary andn-butyrate-treated cultures of ruminal epithelial cells: short communication.Acta Vet Hung. 2002;50:211–5.
27. Schurmann, B: Functional adaptation of the ruminal epithelium. https://ecommons.usask.ca/handle/10388/ETD-2013-12-1381 (2014). Accessed 20 Jan 2014.
28. Dieho K, Bannink A, Geurts I, Schonewille J, Gort G, Dijkstra J.Morphological adaptation of rumen papillae during the dry period andearly lactation as affected by rate of increase of concentrate allowance.J Dairy Sci. 2016;99:2339–52.
29. Steele MA, Penner GB, Chaucheyras-Durand F, Guan LL. Development andphysiology of the rumen and the lower gut: targets for improving guthealth. J Dairy Sci. 2016;99:4955–66.
30. Liebich H, Dirksen G, Arbel A, Dori S, Mayer E. Feed-dependent changes inthe rumen mucosa of high-producing cows from the dry period to eightweeks post partum. Zentralbl Veterinarmed A. 1987;34:661.
31. Martens H, Rabbani I, Shen Z, Stumpff F, Deiner C. Changes in rumen absorptionprocesses during transition. Anim Feed Sci Technol. 2012;172:95–102.
32. Hinders R, Owen F. Relation of ruminal parakeratosis development tovolatile fatty acid absorption. J Dairy Sci. 1965;48:1069–73.
33. Gaebel G, Martens H, Suendermann M, Galfi P. The effect of diet,intraruminal pH and osmolarity on sodium, chloride and magnesium
Xu et al. Journal of Animal Science and Biotechnology (2018) 9:32 Page 11 of 12

absorption from the temporarily isolated and washed reticulo-rumen ofsheep. Q J Exp Physiol. 1987;72:501–11.
34. Norbury C, Nurse P. Animal cell cycles and their control. Annu Rev Biochem.1992;61:441–68.
35. Sherr CJ. Mammalian G1 cyclins. Cell. 1993;73:1059–65.36. Vermeulen K, Van Bockstaele DR, Berneman ZN. The cell cycle: a review
of regulation, deregulation and therapeutic targets in cancer. Cell Prolif.2003;36:131–49.
37. Hinz M, Krappmann D, Eichten A, Heder A, Scheidereit C, Strauss M. NF-κBfunction in growth control: regulation of cyclin D1 expression and G0/G1-to-S-phase transition. Mol Cell Biol. 1999;19:2690–8.
38. Ohtsubo M, Theodoras AM, Schumacher J, Roberts JM, Pagano M. Humancyclin E, a nuclear protein essential for the G1-to-S phase transition. Mol CellBiol. 1995;15:2612–24.
39. Koff A, Giordano A, Desai D, Yamashita K, Harper JW, Elledge S, et al.Formation and activation of a cyclin E-cdk2 complex during the G1 phaseof the human cell cycle. Science. 1992;257:1689–94.
40. Clurman BE, Sheaff RJ, Thress K, Groudine M, Roberts JM. Turnover of cyclinE by the ubiquitin-proteasome pathway is regulated by cdk2 binding andcyclin phosphorylation. Genes Dev. 1996;10:1979–90.
41. Gygi SP, Rochon Y, Franza BR, Aebersold R. Correlation between protein andmRNA abundance in yeast. Mol Cell Biol. 1999;19:1720–30.
42. Bondzio A, Gabler C, Badewien-Rentzsch B, Schulze P, Martens H, EinspanierR. Identification of differentially expressed proteins in ruminal epithelium inresponse to a concentrate-supplemented diet. Am J Physiol GastrointestLiver Physiol. 2011;301:G260–8.
43. Majdoub-Mathlouthi L, Said B, Say A, Kraiem K. Effect of concentrate level andslaughter body weight on growth performances, carcass traits and meatquality of Barbarine lambs fed oat hay based diet. Meat Sci. 2013;93:557–63.
44. Osorio A, Mendoza G, Plata F, Martínez J, Vargas L, Ortega G. A simulationmodel to predict body weight gain in lambs fed high-grain diets. SmallRumin Res. 2015;123:246–50.
45. Sakata T, Tamate H. Rumen epithelial cell proliferation accelerated by rapidincrease in intraruminal butyrate. J Dairy Sci. 1978;61:1109–13.
46. Shen ZM, Martens H, Schweigel-Rontgen M. Na+ transport across rumenepithelium of hay-fed sheep is acutely stimulated by the peptide IGF-1 invitro. Exp Physiol. 2012;97:497–505.
47. Zitnan R, Kuhla S, Sanftleben P, Bilska A, Schneider F, Zupcanova M, et al.Diet induced ruminal papillae development in neonatal calves notcorrelating with rumen butyrate. Vet Med (Praha) 2005. 50:472.
48. Kaulfuss S, Burfeind P, Gaedcke J, Scharf JG. Dual silencing of insulin-likegrowth factor-I receptor and epidermal growth factor receptor in colorectalcancer cells is associated with decreased proliferation and enhancedapoptosis. Mol Cancer Ther. 2009;8:821–33.
49. Firth SM, Baxter RC. Cellular actions of the insulin-like growth factor bindingproteins. Endocr Rev. 2002;23:824–54.
50. Albiston AL, Taylor RG, Herington AC, Beveridge DJ, Fuller PJ.Divergent ileal IGF-I and IGFBP-3 gene expression after small bowelresection: a novel mechanism to amplify IGF action. Mol CellEndocrinol. 1992;83:R17–20.
51. Baxter RC. Signalling pathways involved in antiproliferative effects of IGFBP-3: a review. Mol Pathol. 2001;54:145–8.
52. Sakata T, Yajima T. Influence of short chain fatty acids on the epithelial cell divisionof digestive tract. QJ Exp Physiol. 1984;69:639–48.
53. Blottière HM, Buecher B, Galmiche J-P, Cherbut C. Molecular analysisof the effect of short-chain fatty acids on intestinal cell proliferation.Proc Nutr Soc. 2003;62:101–6.
54. Ploger S, Stumpff F, Penner GB, Schulzke JD, Gabel G, Martens H, et al.Microbial butyrate and its role for barrier function in the gastrointestinaltract. Ann N Y Acad Sci. 2012;1258:52–9.
55. Noziere P, Martin C, Remond D, Kristensen NB, Bernard R, Doreau M.Effect of composition of ruminally-infused short-chain fatty acids on netfluxes of nutrients across portal-drained viscera in underfed ewes. Br JNutr. 2000;83:521–31.
56. Shen Z, Kuhla S, Zitnan R, Seyfert H-M, Schneider F, Hagemeister H,et al. Intraruminal infusion of n-butyric acid induces an increase ofruminal papillae size independent of IGF-1 system in castrated bulls.Arch Anim Nutr. 2005;59:213–25.
57. Galfi P, Gabel G, Martens H. Influences of extracellular matrix componentson the growth and differentiation of ruminal epithelial cells in primaryculture. Res Vet Sci. 1993;54:102–9.
58. Collard TJ, Guy M, Butt AJ, Perks CM, Holly JM, Paraskeva C, et al.Transcriptional upregulation of the insulin-like growth factor bindingprotein IGFBP-3 by sodium butyrate increases IGF-independentapoptosis in human colonic adenoma-derived epithelial cells.Carcinogenesis. 2003;24:393–401.
59. Sanderson IR. Short chain fatty acid regulation of signaling genes expressedby the intestinal epithelium. J Nutr. 2004;134:2450S–4S.
60. Feed Database in China. Table of feed composition and nutritive value inChina. 22nd ed. Beijing: China Feed; 2011.
• We accept pre-submission inquiries
• Our selector tool helps you to find the most relevant journal
• We provide round the clock customer support
• Convenient online submission
• Thorough peer review
• Inclusion in PubMed and all major indexing services
• Maximum visibility for your research
Submit your manuscript atwww.biomedcentral.com/submit
Submit your next manuscript to BioMed Central and we will help you at every step:
Xu et al. Journal of Animal Science and Biotechnology (2018) 9:32 Page 12 of 12
Copyright © 2022 FDOKUMEN