FTIR study of the evolution of coal structure during the coalification process
11
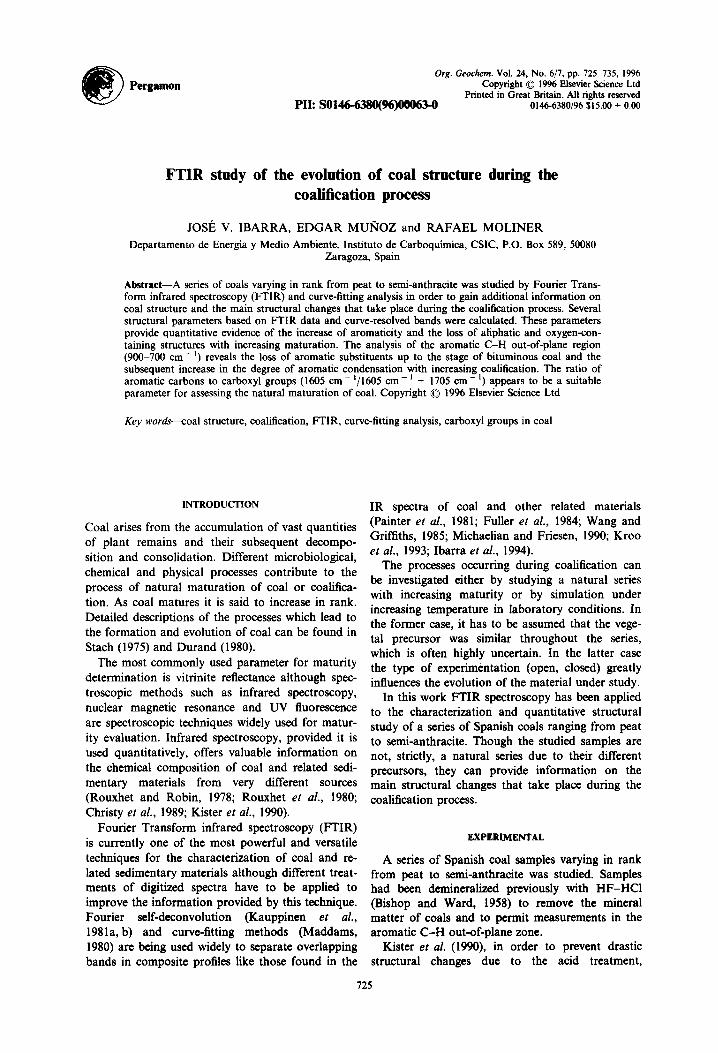
Pergamon Org. Geochem. Vol. 24, No. 6/'7,pp. 725-735, 1996 Copyright © 1996Elsevier ScienceLtd Printed in Great Britain.All rights reserved PII: S0|46-6380(96)00063-0 0146-6380/96 $15.00 + 0.00 FTIR study of the evolution of coal structure during the coalification process JOSI~ V. IBARRA, EDGAR MUlqOZ and RAFAEL MOLINER Departamento de Energia y Medio Ambiente, Instituto de Carboquimica, CSIC, P.O. Box 589, 50080 Zaragoza, Spain Abstract--A series of coals varying in rank from peat to semi-anthracite was studied by Fourier Tram- form infrared spectroscopy (FTIR) and curve-fitting analysis in order to gain additional information on coal structure and the main structural changes that take place during the coalification process. Several structural parameters based on FTIR data and curve-resolved bands were calculated. These parameters provide quantitative evidence of the increase of aromaticity and the loss of aliphatic and oxygen-con- taining structures with increasing maturation. The analysis of the aromatic C-H out-of-plane region (900-700 cm- ~) reveals the loss of aromatic substituents up to the stage of bituminous coal and the subsequent increase in the degree of aromatic condensation with increasing coalification. The ratio of aromatic carbons to carboxyl groups (1605 cm - 1/1605 cm - 1 + 1705 cm - 1) appears to be a suitable parameter for assessing the natural maturation of coal. Copyright © 1996 Elsevier Science Ltd Key words---coal structure, coalification, FTIR, curve-fitting analysis, carboxyl groups in coal INTRODUCTION Coal arises from the accumulation of vast quantities of plant remains and their subsequent decompo- sition and consolidation. Different microbiological, chemical and physical processes contribute to the process of natural maturation of coal or coalifica- tion. As coal matures it is said to increase in rank. Detailed descriptions of the processes which lead to the formation and evolution of coal can he found in Stach (1975) and Durand (1980). The most commonly used parameter for maturity determination is vitrinite reflectance although spec- troscopic methods such as infrared spectroscopy, nuclear magnetic resonance and UV fluorescence are spectroscopic techniques widely used for matur- ity evaluation. Infrared spectroscopy, provided it is used quantitatively, offers valuable information on the chemical composition of coal and related sedi- mentary materials from very different sources (Rouxhet and Robin, 1978; Rouxhet et al., 1980; Christy et al., 1989; Kister et al., 1990). Fourier Transform infrared spectroscopy (FTIR) is currently one of the most powerful and versatile techniques for the characterization of coal and re- lated sedimentary materials although different treat- ments of digitized spectra have to be applied to improve the information provided by this technique. Fourier self-deconvolution (Kauppinen et al., 1981a, b) and curve-fitting methods (Maddams, 1980) are being used widely to separate overlapping bands in composite profiles like those found in the IR spectra of coal and other related materials (Painter et al., 1981; Fuller et al., 1984; Wang and Griffiths, 1985; Michaelian and Friesen, 1990; Kroo et al., 1993; Ibarra et al., 1994). The processes occurring during coalification can be investigated either by studying a natural series with increasing maturity or by simulation under increasing temperature in laboratory conditions. In the former case, it has to be assumed that the vege- tal precursor was similar throughout the series, which is often highly uncertain. In the latter case the type of experimentation (open, closed) greatly influences the evolution of the material under study. In this work FTIR spectroscopy has been applied to the characterization and quantitative structural study of a series of Spanish coals ranging from peat to semi-anthracite. Though the studied samples are not, strictly, a natural series due to their different precursors, they can provide information on the main structural changes that take place during the coalification process. EXPERIMENTAL A series of Spanish coal samples varying in rank from peat to semi-anthracite was studied. Samples had been demineralized previously with HF-HC1 (Bishop and Ward, 1958) to remove the mineral matter of coals and to permit measurements in the aromatic C-H out-of-plane zone. Kister et al. (1990), in order to prevent drastic structural changes due to the acid treatment, 725
-
Upload
independent -
Category
Documents
-
view
6 -
download
0
Transcript of FTIR study of the evolution of coal structure during the coalification process
Pergamon Org. Geochem. Vol. 24, No. 6/'7, pp. 725-735, 1996
Copyright © 1996 Elsevier Science Ltd Printed in Great Britain. All rights reserved
PII: S0|46-6380(96)00063-0 0146-6380/96 $15.00 + 0.00
FTIR study of the evolution of coal structure during the coalification process
JOSI~ V. IBARRA, EDGAR MUlqOZ and RAFAEL MOLINER
Departamento de Energia y Medio Ambiente, Instituto de Carboquimica, CSIC, P.O. Box 589, 50080 Zaragoza, Spain
Abstract--A series of coals varying in rank from peat to semi-anthracite was studied by Fourier Tram- form infrared spectroscopy (FTIR) and curve-fitting analysis in order to gain additional information on coal structure and the main structural changes that take place during the coalification process. Several structural parameters based on FTIR data and curve-resolved bands were calculated. These parameters provide quantitative evidence of the increase of aromaticity and the loss of aliphatic and oxygen-con- taining structures with increasing maturation. The analysis of the aromatic C-H out-of-plane region (900-700 cm- ~) reveals the loss of aromatic substituents up to the stage of bituminous coal and the subsequent increase in the degree of aromatic condensation with increasing coalification. The ratio of aromatic carbons to carboxyl groups (1605 cm - 1/1605 cm - 1 + 1705 cm - 1) appears to be a suitable parameter for assessing the natural maturation of coal. Copyright © 1996 Elsevier Science Ltd
Key words---coal structure, coalification, FTIR, curve-fitting analysis, carboxyl groups in coal
INTRODUCTION
Coal arises from the accumulation of vast quantities of plant remains and their subsequent decompo- sition and consolidation. Different microbiological, chemical and physical processes contribute to the process of natural maturation of coal or coalifica- tion. As coal matures it is said to increase in rank. Detailed descriptions of the processes which lead to the formation and evolution of coal can he found in Stach (1975) and Durand (1980).
The most commonly used parameter for maturity determination is vitrinite reflectance although spec- troscopic methods such as infrared spectroscopy, nuclear magnetic resonance and UV fluorescence are spectroscopic techniques widely used for matur- ity evaluation. Infrared spectroscopy, provided it is used quantitatively, offers valuable information on the chemical composition of coal and related sedi- mentary materials from very different sources (Rouxhet and Robin, 1978; Rouxhet et al., 1980; Christy et al., 1989; Kister et al., 1990).
Fourier Transform infrared spectroscopy (FTIR) is currently one of the most powerful and versatile techniques for the characterization of coal and re- lated sedimentary materials although different treat- ments of digitized spectra have to be applied to improve the information provided by this technique. Fourier self-deconvolution (Kauppinen et al., 1981a, b) and curve-fitting methods (Maddams, 1980) are being used widely to separate overlapping bands in composite profiles like those found in the
IR spectra of coal and other related materials (Painter et al., 1981; Fuller et al., 1984; Wang and Griffiths, 1985; Michaelian and Friesen, 1990; Kroo et al., 1993; Ibarra et al., 1994).
The processes occurring during coalification can be investigated either by studying a natural series with increasing maturity or by simulation under increasing temperature in laboratory conditions. In the former case, it has to be assumed that the vege- tal precursor was similar throughout the series, which is often highly uncertain. In the latter case the type of experimentation (open, closed) greatly influences the evolution of the material under study.
In this work FTIR spectroscopy has been applied to the characterization and quantitative structural study of a series of Spanish coals ranging from peat to semi-anthracite. Though the studied samples are not, strictly, a natural series due to their different precursors, they can provide information on the main structural changes that take place during the coalification process.
EXPERIMENTAL
A series of Spanish coal samples varying in rank from peat to semi-anthracite was studied. Samples had been demineralized previously with HF-HC1 (Bishop and Ward, 1958) to remove the mineral matter of coals and to permit measurements in the aromatic C - H out-of-plane zone.
Kister et al. (1990), in order to prevent drastic structural changes due to the acid treatment,
725
726 Jos6 V. Ibarra et al.
reported the spectral removal of mineral matter using difference spectra obtained by subtraction of low temperature ash (LTA). However, pre- vious studies have shown the presence of some LTA-induced changes such as nitrates in lignites (Painter et al., 1980) and sulphates for high-sul- phur high-calcium content coals (Ibarra et al., 1989). The acid treatment used (HCI/HF, room temperature) does not seem to produce important structural changes in low rank coals as proved by the good agreement between structural par- ameters deduced from solid state 13C NMR of raw coals and those obtained from FTIR spec- troscopy using demineralized samples (Ibarra et al., 1991, 1994). For these reasons, the use of a weak acid treatment was preferred for the studied coals.
F T I R measurements
FTIR spectra of coal samples were run on KBr pellets (120 mg, 1 wt%). Pellets were dried under vacuum with P205 for 48 h to remove the adsorbed water which might induce spectral perturbations at 3400 and 1630 c m - 1 (Juan and Ibarra, 1983). Spectra were recorded by co-adding 124 scans at a resolution of 2 cm - 1 in a Nicolet 550 spectrometer using a DTGS detector. Software facilities were used for baseline corrections of spectra which were scaled to 1 mg sample c m - 2 . For quantitative measurements of spectra duplicate pellets were used. The aliphatic (Hat) and aromatic (Har) hydrogen contents were calculated from the integrated absor- bance areas of the bands at 3000-2700 c m - 1 and 900-700 c m - 1, respectively. The extinction coeffi- cients used for converting integrated absorbance areas to concentration units were 541 and 710 abs c m - 1 mg c m - 2 for the aromatic and aliphatic bands respectively of peat, lignite and subbitumi- nous coal, and 684 and 744 abs c m - i mg c m - 2 for bituminous coal and semi-anthracite (Solomon and Carangelo, 1988). Calculation of extinction coefficients for materials as complex as coal remains very difficult due to the fact that the coefficients depend on a series of parameters such as coal struc- ture, coalification stage, origin, etc. The choice of average absorption coefficients is an inherent de- ficiency of the IR methods in the analysis of coal structure as has been pointed out by Painter et al. (1994). These authors have examined the determi- nation of absorption coefficients in a wide series of coal from different origin and rank and they found a truly extraordinary agreement with the values reported by Solomon in spite of the different meth- odologies used. For this reason the Solomon values have been used in the present work.
The apparent aromaticity, fa, of the samples was calculated by using the method of Brown and Ladner (1960):
fa = 1 -- Cal/C
Cal/C = (Hal/H. H/C )(Hal/Ca0
where Cal/C is the aliphatic carbon fraction, H/C is the hydrogen:carbon atomic ratio calculated from elemental analysis, Hal/H is the fraction of total hydrogen present as aliphatic hydrogen an~l Hal/Cal is hydrogen:carbon atomic ratio for aliphatic groups, which is generally taken to be 1.8 for coals (Ibarra et al., 1994). Hal/H values are usually de- rived from IH NMR analyses, but in this work they were obtained from FTIR data.
These equations assume that all carbon atoms present are either aliphatic or aromatic in character. This assumption is not valid for low-rank coals due to the important contribution of carboxylic acids and therefore the aromaticity f~ has to be corrected for that contribution (Supaluknari et al., 1989a). Carboxylic carbons were determined by the barium acetate method as described by Schafer (1970). The carboxylic carbon content of the most evolved coals was considered negligible. Satisfactory agreements between coal aromaticities calculated from FTIR measurements using the method described here and those determined by solid state 13C NMR were reported in previous papers (Ibarra et al., 1991, 1994).
Curve-fitting analysis
Selected zones of the FTIR spectra were studied by curve-fitting analysis using a commercially avail- able data-processing program (Spectracalc, Galactic Industries Corporation). Selected regions were base- line-linearized using an interactive procedure of the program by connecting the left and right points of the interval with a straight line. This baseline adjustment yielded spectra whose intensities tended towards zero at both ends of the region eliminating a possible source of artifacts in the deconvoluted spectra. Positions and number of bands were estab- lished initially from the second derivative of the spectrum (Maddams, 1980; Kauppinen et al., 1981a, b). As the shapes of the bands are not known a function with equal Lorentzian and Gaussian contribution was assayed (Painter et al., 1981) and it was allowed to vary in the iterative procedure. The use of other band shapes such as Gaussian, Lorentzian and Voight function has been applied to the infrared spectra of coal obtained by transmission, photoacoustic and diffuse reflectance techniques (Michaelian and Friesen, 1990; Kroo et al., 1993; Wang and Griffiths, 1985). Previous stu- dies carried out on coal, thermally altered coals and cokes (Ibarra et al., 1994, 1995) indicated that the best results were obtained using the mentioned Lorentz/Gauss combination. The parameters were fitted to the experimental envelope by a least squares iterative procedure. All peaks, heights, band
FTIR study of coal structure
Table 1. Main characteristics of the studied coals
727
Coal Source Rank
Elemental analysis (wt% daf)*
C H N S O diff. O/C H/C
TP Padul peat LP As Pontes lignite SE Mequinenza brown coal AA6 Teruel subbituminous HU Asturies m.v,bituminous SL Le6n l.v.bituminous BZ Le6n semi-anthracite
56.55 5.97 1.81 2.58 32.29 0.43 1.27 59.85 4.89 0.96 2.78 31.52 0.39 0.98 66.76 5.58 0.86 9.53 17.27 0.19 1.00 65.16 4.67 0~53 3.20 26.44 0.30 0.86 83.94 5.31 1.88 0.42 8.45 0.08 0.76 84.32 3.47 0.79 1.90 8.52 0.08 0.49 89.83 1.27 0.52 0.67 7.71 0,06 0.17
*Dry ash free basis.
shapes and widths were allowed to vary from the in- itial guesses.
In order to determine the goodness of fit criteria the following aspects were considered (Maddams, 1980; Michaelian and Friesen, 1990; Ibarra et al., 1994): standard errors of parameters (chi-squared); residuals (differences between original and fitted spectra); tendencies of particular bands to approach zero with increasing iterations in the curve-fitting procedure; local poor fits (usually indicative of an
incorrect choice of the number of component peaks or substantial errors in their half-widths) and degree of coincidence of the second derivative (original and fitted spectrum).
RESULTS AND DISCUSSION
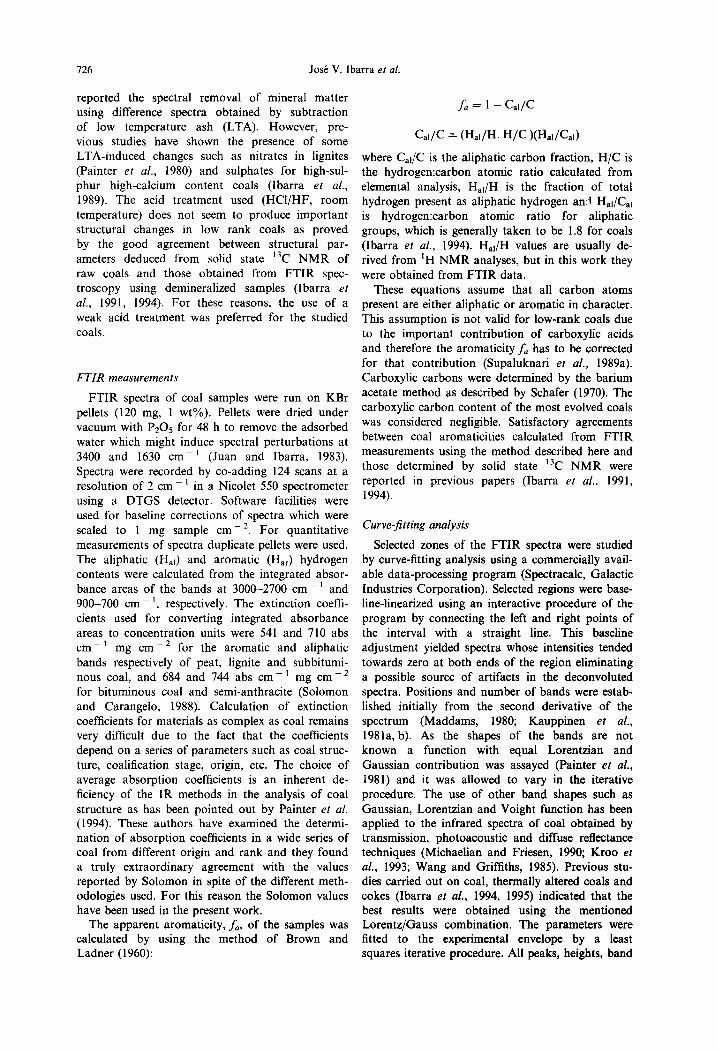
Table 1 gives the elemental analysis of the Spanish coals used in this study. Coal increases its carbon content with increasing coalification while
1.5
z
0
.5
0 4000
/ ~ ~ ¢ ~ I i Hu
SL ~
BZ
35'00 30'00 25'00 20'00 1500 1000 500
Wavenumbers ( e r a - I)
Fig. 1. FTIR spectra of coals varying in rank from peat to semi-anthracite (see Table 1).
728 Jos6 V. Ibarra et al.
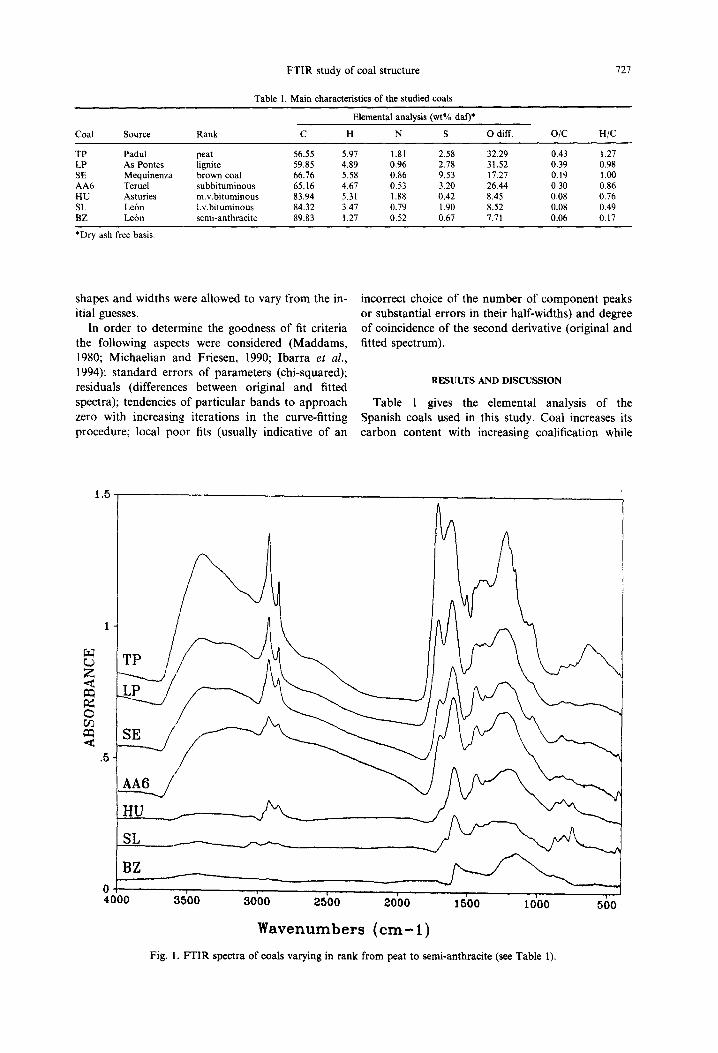
Table 2. Structural parameters deduced from FTIR measurements
Sample Hat/Hal Hat (wt%) Hal (wt%) C~1 (wt%) Car (wt%) Cc ~ o (wt%)* f~ Hat/Car
TP 0.06 0.34 5.63 37.89 12.44 6.22 0.22 0.33 LP 0.09 0.39 4.50 29.93 26.33 3.59 0.44 0.18 SE 0.10 0.52 5.06 33.38 29.37 4.01 0.44 0.21 AA6 0.27 0.99 3.68 24.76 37.14 3.42 0.57 0.32 HU 0.50 2.00 3.31 21.82 62.12 -- 0.74 0.39 SL 4.14 2.79 0.68 4.22 80.10 - - 0.95 0.42 BZ 1.36 0.73 0.54 3.59 86.24 - - 0.96 0.10
*Determined by chemical analysis as indicated in the text.
oxygen decreases drastically at the bituminous stage.
Figure 1 shows the F T I R spectra of the studied coals where some trends can be observed. The examination of the 3000-2700 c m - i zone reveals a progressive decrease in the aliphatic hydrogen con- tent up to the stage of bi tuminous coal with a dras- tic decrease for the most evolved coals. Significant changes for the oxygen containing functional groups can also be observed in the 1800-1100 cm - 1 zone. C = O structures tend to decrease with increasing coalification and they practically disappear at the stage o f bituminous coal. The C - O - R structures in the l l 0 0 c m - 1 zone and the distribution of aro- matic hydrogen, 900-700 c m - 1 zone, are also modified during the process of natural maturat ion of coal. In order to gain additional information on these changes a series of structural parameters, defined below, were used in this work.
S t ruc tura l p a r a m e t e r s
Apparent aromaticity, fa, and other related par- ameters deduced from F T I R measurements are given in Table 2. F rom these parameters it can be observed that coal increases its aromaticity with increasing coalification. A good relationship between the apparent aromaticity deduced from F T I R and the H /C atomic ratio was found for stu- died coals (Fig. 2). Coal increases its aromatic car- bon and aromatic hydrogen contents with increasing coalification (except for hydrogen in the
1.0 0.9 0.8
0.7 0.6 0.5 0.4 0.3 0.2 o.1
o
B .-.q BZ L
mAA6 -
mw SE _ L P
TP
I I [ I I I P 0.0 0.2 0.4 0.6 0.8 1.0 1.2 1.4
H/C atomic ratio
Fig. 2. Apparent aromaticity, fa, calculated from FTIR measurements vs H/C atomic ratio.
most evolved sample) while the aliphatic hydrogen decreases. These results are in good agreement with the well-established mechanisms of coal maturat ion and they prove that F T I R spectroscopy can be sucessfully used to determine aromaticies and hydrogen species in coals and related sedimentary organic materials.
In order to further examine the structural modifi- cations of coal as a function of natural maturat ion selected zones of the spectra were studied by curve- fitting analysis. Assignations were made by reference to literature and to previous works (Baruak, 1986; Painter et al., 1981, 1983; Starsinic et al., 1984; Michaelian and Friesen, 1990; Ibarra and Juan, 1985; Ibarra et al., 1994; Kister et al., 1990; Van der Marel and Beutelspacher, 1976; Wang and Griffiths, 1985; Yen et al., 1984; Supaluknari et al., 1989b). F rom curve-fitted bands a series of relation- ships defined as ratios of integrated absorbance areas were used to quantify the structural changes. The relationships investigated were the following:
CH3/CH2:2955 cm - l band / 2920 cm - 1 band (1)
Car /C = O + Car: 1605 c m - l b a n d / 1705 (2) cm - i band + 1605 cm - i band
C = O/Car: 1780-1660 c m - 1 zone / 1605 (3) c m - t band
C = O / C - O : 1780-1660 c m - l zone / 1260- (4) 1040 c m - l zone
The methyl to methylene ratio of equation (l) can be considered as an estimate of the length of aliphatic chains of coal and a branching index (Pandolfo et al., 1988; Ibarra et al., 1994). The ratio of aromatic C = C to carboxylic groups as defined in equation (2) appears in the literature (Christy et al., 1989; Kister et al., 1990) as a a suitable index for assessing the degree o f maturat ion of organic matter. This ratio combines two independent mech- anisms, aromatizat ion and oxygen removal, which follow an inverse trend in the coalification process. However, both bands seem to be related because the intensity of the aromatic C - - C band is enhanced by the presence of polar substituents in aromatic rings (Painter et al., 1981). It can be observed in Fig. 6 that the band over 1610 c m - 1 decreases with increasing coal rank though the aro-
FTIR study of coal structure 729
.01
0
Z en ~.01
-.01
2rid derivative ~̂
29'00 28'00
Wavenuml~ers ( c m - I )
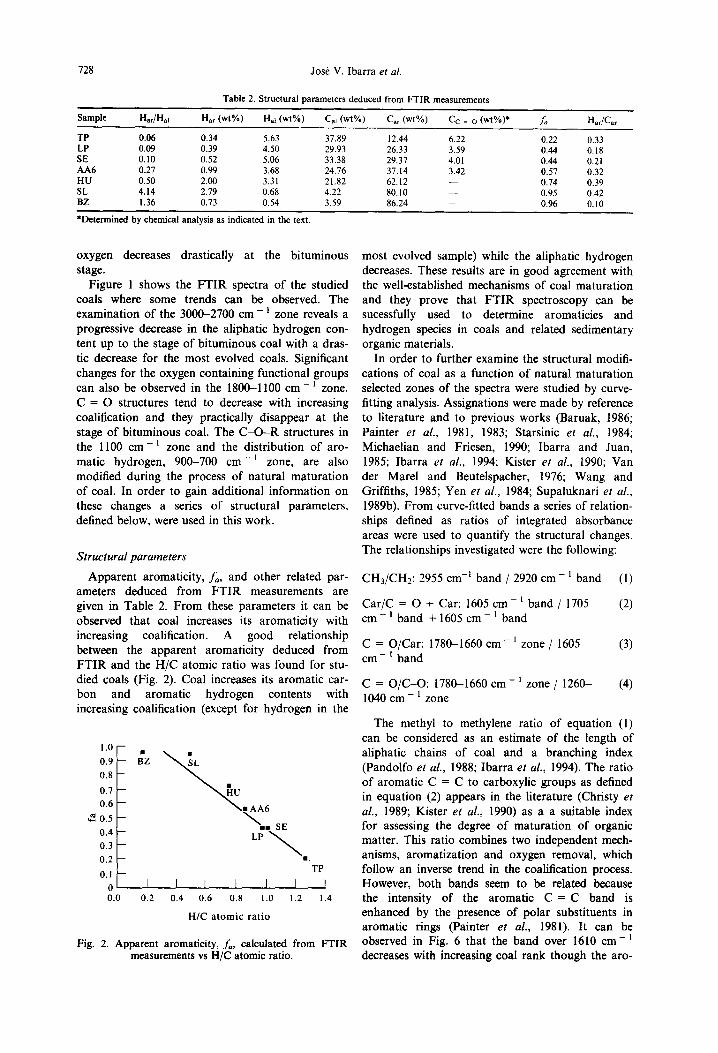
Fig. 3. Second derivative in the 3000-2800 cm- the FTIR spectra of selected coal samples.
zone of
~ ~ Mequinenza coal
. 2 -
2i50 29'o0 28'50 Wavenumbers (em-ll
Fig. 4. Curve-fitted FTIR spectrum of the aliphatic C-H stretching bands for Mequinenza coal (SE).
maticity values calculated in Table 2 have increased with increasing coalification of the samples.
Equation (3) can provide a quantitative estimate of the evolution of carboxylic and other C = O struc- tures in relation to the aromatic macromolecular net- work of coal while equation (4) allows us to follow the evolution of the different oxygen functionalities.
The spectral zones of equations (3) and (4) include the curve-resolved bands of that interval. It can be pointed out that the positions of the peaks under study can shift slightly as a function of the degree of evolution of the sample or the curve-fitting procedure (see Table 6 for shifts of C - O - R groups).
Evolution of aliphatic structures
The second derivative of the 3000-2700 c m - i zone of the FTIR spectra of the studied coals revealed the presence of 5-8 bands, in agreement with the results reported by other authors (Michaelian and Friesen, 1990; Wang and Griffiths, 1985). Figure 3 shows the evolution of the second derivative as a function of the coal rank. Peat (TP) has the most simple profile with two prominent peaks at 2920 and 2850 c m - ~ attributed to asym- metric and symmetric - C H 2 - stretching, respect- ively. The profile observed for the lignite (LP) was similar. As the maturation of coal progresses new peaks can be observed at 2954 c m - ] (asymmetric - CH3 stretching), 2895 c m - 1 (methine C - H stretch- ing) and 2870 c m - 1 (symmetric -CH3 stretching)
for the brown coal (SE) and the subbituminous coal (AA6). These facts suggest a more complex aliphatic structure and a higher contribution of methyl groups for subbituminous coals in relation to peat and lignites.
For the most evolved coals the band at 2954 c m - 1 is resolved in two peaks at 2960 and 2952 c m - l attributed to methyl groups attached to alkyl chains and aromatic rings, respectively (Michaelian and Friesen, 1990; Wang and Griffiths, 1985). A low intensity band at 2820 c m - t was detected in the BZ coal. This band was reported by Michaelian and Friesen (1990) in photoacoustic FTIR spectra of separated macerals but its assignment remains unknown.
The tendency of some band areas to aproach zero with increasing iterations in the curve-fitting pro- cedure implied that the best fits were obtained with the five mentioned bands (six for the most evolved coals). An example of band-fitting for the aliphatic C - H stretching bands for Mequinenza coal (SE) is shown in Fig. 4. Table 3 summarizes the results of this curve-fitting study (centre of the peaks, heights, width, Lorentz/Gauss character and areas of the bands).
The study of the evolution of aliphatic bands with increasing coalification (CH3/CH2 ratio, Table 4) indicated that methylene groups are prefer- ably lost in low rank coals up to the stage of subbi- tuminous coal. This is probably due to a
Table 3. Curve-fitting for the aliphatic C-H stretching bands of Mequinenza coal (SE)
Maximum (cm - i) Width (cm - t) Height* Assignment Area? Type/L~
2954 35 0.063 asym.RCH3 2.85 Mix/0.70 2921 32 0.156 asym.R2CH2 5.94 Mix/0.32 2895 30 0.060 R3CH 1.85 G 2874 2(} 0.020 sym.RCH3 0.39 Mix/0.75 2849 32 0.099 sym.R2CH2 4.36 L
*Absorbance units; ?absorbance units x cm- J; :[:peak type (mixture of Gaussian and Lorentzian) and percentage Lorentzian (L) for the peak; chi-squarexl = 2.05 x l0- s.
730 Josh V. Ibarra et al.
Table 4. Structural relationships derived from the curve-fitting analysis of the FTIR spectra*
CH3/CH2 Car/C = O + Car C = O/Car C = O/C-O Sample (2955/2920) (1605/1705 + 1605) (1780-1660/1605) (1780-1660/1260-1040)
TP 0.22 0.29 4.78 0.67 LP 0.51 0.39 1.97 0.39 SE 0.48 0,39 1.98 0.44 AA6 0.39 0,40 1.76 0.33 HU 0,09 0.75 1.57 0.13 SL 0.06 0.89 1.09 0.22 BZ 0,10 - - - - - -
*Calculated as defined in the text.
progressive loss of alkyl chains and the conversion of hydroaromatic methylene structures to aromatic rings (Wang and Griffiths, 1985) and/or a higher presence of branched aliphatic structures. Hovewer,
the bituminous coal (HU) showed the highest con- tent in methylene structures probably due to differ- ences in the vegetal precursor and in the geological conditions of coal formation. For the most evolved coals, SL and BZ, the contribution of methyl groups is very low and only methylene structures can be measured, in practice. In these cases the
CH3/CH2 ratio does not seem to provide an esti- mation of the length of the aliphatic chains.
Evolution o f oxygen-containing structures
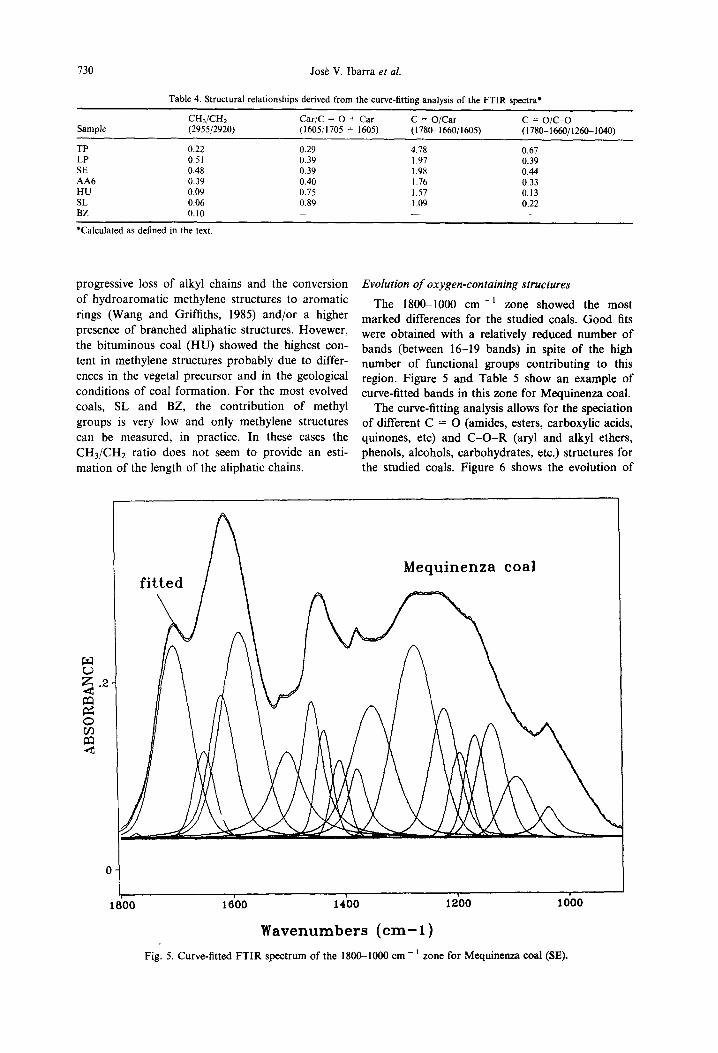
The 1800-1000 c m - ~ zone showed the most marked differences for the studied coals. G o o d fits were obtained with a relatively reduced number of bands (between 16-19 bands) in spite of the high number of functional groups contributing to this region. Figure 5 and Table 5 show an example of curve-fitted bands in this zone for Mequinenza coal.
The curve-fitting analysis allows for the speciation of different C --- O (amides, esters, carboxylic acids, quinones, etc) and C - O - R (aryl and alkyi ethers, phenols, alcohols, carbohydrates, etc.) structures for the studied coals. Figure 6 shows the evolution of
f i t t ed Mequinenza coal
CD Z . 2
0 0~
1800 16'oo 1 'oo doo lo'oo
Wavenumbers (cm-1) Fig. 5. Curve-fitted FTIR spectrum of the 1800-1000 cm - l zone for Mequinenza coal (SE).
FTIR study of coal structure
Table 5. Curve-fitting for the 1800-1000 cm- ~ region of Mequinenza coal*
731
Maximum (cm- i) Width (cm - i) Height Assignmentt Area Type/L (%)
1772 20 0.01 aryl esters 0.2 Mix/0.78 1703 74 0.21 carboxyl acids 16.7 Mix/0.15 1650 ~ 45 0.09 conjugated C = O 4.4 Mix/0.14 1618 55 0.15 aromatic C = C 10.7 Mix/0.49 1586 82 0.22 aromatic C = C 20.4 Mix/0.14 1502 67 0.09 aromatic C = C 8.9 L 1458 45 0.15 6 as. CH3-, CH2- 10.8 L 1437 35 0.11 aromatic C = C 4.1 Mix/0.22 1410 37 0.08 fi as. CH-(CH3); 6 OH 3.3 G 1377 41 0.07 6 s. CH3-Ar, R 5.0 L 1350 89 0.14 6 s. CH2-C = O 14.3 Mix/0.30 1274 90 0.20 v C-O in aryl ethers 14.3 G 1222 59 0.14 v C-O and t5 OH, phenoxy 9.6 Mix/0.29
structures, ethers 1195 43 0.09 v C-O phenols, ethers 4.2 G 1168 44 0.11 v C-O phenols, ethers 5.0 G 1138 59 0.12 v C-O, tert. alcohols, ethers 8.0 Mix/0.10 1094 65 0.06 v C O sec. alcohols 4.4 G 1036 40 0.03 alkyl ethers, Si-O 2.1 L
*See notes in Table 3; tv: stretch; 6: deformation vibration; s: symmetric; as: asymmetric.
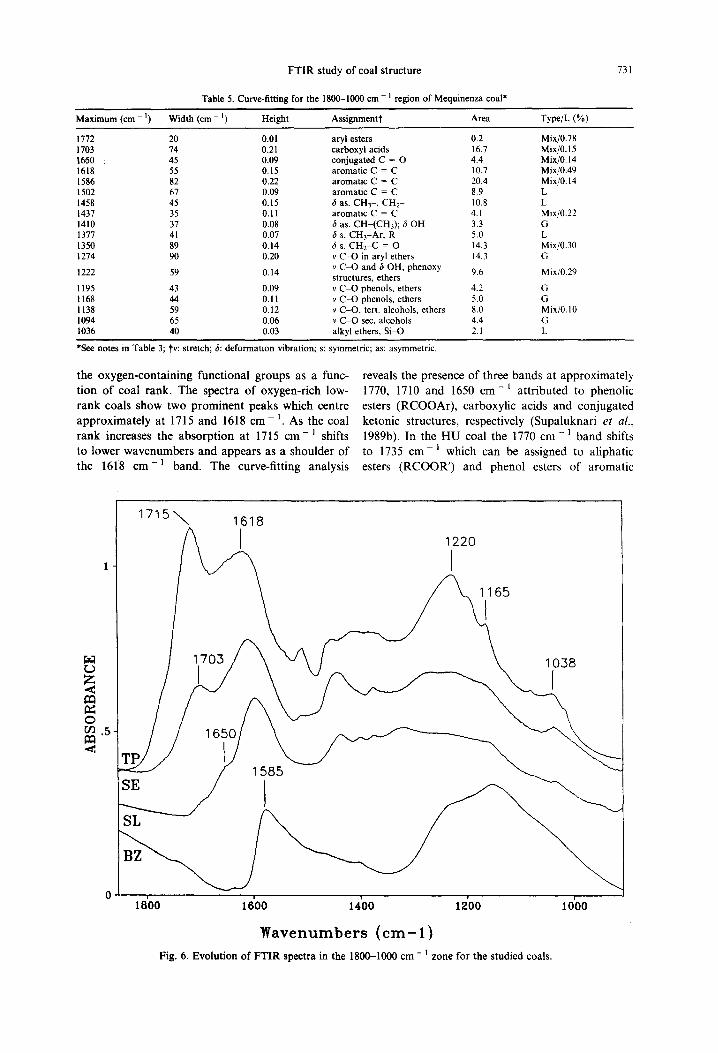
the oxygen-con ta in ing funct ional g r o u p s as a func-
t ion o f coal rank. The spect ra o f oxygen-r ich low-
r ank coals s h o w two p r o m i n e n t peaks which centre
app rox ima te ly at 1715 and 1618 c m - 1. As the coal
r ank increases the a b s o r p t i o n at 1715 c m - ~ shifts
to lower w a v e n u m b e r s and appea r s as a shou lde r o f
the 1618 c m - ~ band . The curve-fi t t ing analysis
reveals the presence o f three bands at app rox ima te ly
1770, 1710 and 1650 c m - t a t t r ibu ted to phenol ic
esters ( R C O O A r ) , carboxyl ic acids and con juga ted
ketonic s t ructures , respectively (Supa lukna r i et al., 1989b). In the H U coal the 1770 c m - 1 b a n d shifts
to 1735 c m - l which can be ass igned to al iphatic
esters ( R C O O R ' ) and pheno l esters o f a romat i c
1715 ~, 1618
I 1220
I 1165
I
¢m
o 03.5 ~m
SE
1703
I ,
1650
I/ 1 585
1058
16oo lo'oo 14'oo 12'oo
Wavenumbers (crn- 1) Fig. 6. Evolution of FTIR spectra in the 1800-1000 cm - t zone for the studied coals.
lobo
732 Jose V. lbarra et al.
Table 6. Evolution of curve-fitted bands* for the 1300-1000 cm - I region
Bandst (era - i) TP LP SE AA6 HU SL BZ
1260 41.0 (35.1) 48.2 (58.0) 14.3 (30.1) 23.3 (35.8) 15.6(33.1) 10.7 (33.5) 5.9 (17.5) 1220 17.7 (15.1) 12.0 (14.5) 9.6 (20.2) 14.7 (22.6) 6.5 (13.8) 4.1 (12.8) 3.4 (10.1) 1190 6.9 (5.9) 2.2 (2.7) 4.2 (8.8) 3.5 (5.4) 3.7 (7.8) 3.8 (11.9) 5.2 (15.4) 1165 6.5 (5.6) 4.7 (5.7) 5.0 (10.5) 4.4 (6,8) 4.6 (9.7) 6.1 (19.1) 7.0 (20.8) 1120 23.1 (19.8) 3.9 (4.7) 8.0 (16.8) 9.3 (14.3) 4.0 (8.5) 3.4 (10.7) 6.0 (17.8) 1080 6.8 (5.8) 8.5 (10.2) 4.4 (9.2) 7.0 (10.8) 2.8 (5.9) 1.9 (6.0) 3.6 (10.7) 1035 14.9 (12.7) 3.5 (4.2) 2.1 (4.4) 2.8 (4,3) 10.0 (21.2) 1.9 (6.0) 2.6 (7.7) Total area 116.9 83.0 47.6 65.0 47.2 31.9 33.7
*Integrated absorbance area: absorbance units x cm - I. Percentages in relation to the total area are given in brackets; tThe maximum of the band can vary slightly for each coal. The interval of variation of the bands listed in the first column was as follows: 1279-1260 can- i; 1238-1218 cm - t; 1198-1188 c m - t; 1168-1157 c m - l; 1134-1115 cm - i; 1094-1074 and 1038-1031 cm - i, respectively.
acids (ArCOOAr'). The band of carboxylic acids shifts from 1720 cm - 1 in peat (TP) to 1690 c m - 1 in bituminous coals indicating a progressive conver- sion of aliphatic carboxylic acids into aromatic car- boxyls with increasing coal rank. A remarkable presence of highly conjugated C = O structures (quinones) were detected in the SL coal at 1650 c m - i. It has been found (Rouxhet and Robin, 1978) that carbonyl groups are more stable than carboxyl at high degrees of evolution. The remains of peptidic materials (1653 and 1544 cm - l bands, amide I and II bands) observed in peat, disappeared at the lignite stage. The C = O/Car ratio shows that C = O groups decreased quickly with increas- ing coalification (Table 4).
Ether tended to be selectively retained in the most evolved coals compared with C - - - O groups. The C = O / C - O - R ratio (Table 4) and the curve- resolved bands of the 1300-1000 cm -1 zone (Table 6) show the above trend. The evolution of oxygen functionalities as a function of the O/C atomic ratio is shown in Fig. 7. The abundance of C = O and C - O - R structures falls drastically from peat to lignite and then both decrease progressively with coal rank.
Peat has the higher content in C - O - R structures due to the presence of lignin-like structures inferred from the bands at 1260 c m - 1 (arylmethylethers) and 1460, 1330, 1220, 1165, 1130, 1080 and 1038 c m - i (Van der Marel and Beutelspacher, 1976;
Ibarra and Juan, 1985) and polysaccharide ma- terials, 1038 c m - 1 (Baruak, 1986). Lignite LP showed the highest content in arylether structures (1260 c m - ~) and the contribution of the band at 1220 c m - i (C-O stretching and O - H bending of carboxylic acids) was very important for the brown coal SE and the subbituminous coal AA6. Aliphatic and mixed ethers and/or secondary alcohols seem to be the predominant structures in the most evolved coals (SL, BZ)
The Car/C = O + Car ratio as defined in equation (2) increases with increasing coal evolution (Table 4) and is a suitable index for assessing the degree of maturation of coal organic matter as it has been reported in the literature (Christy et al. ,
1989; Kister et al., 1990). The values of this par- ameter agree surprisingly well with the apparent aromaticity of the samples (fa, Table 2) and thus, this ratio could be used for a fast estimation of aro- maticity in organic materials.
A r o m a t i c s t ruc tures
A progressive shift of the aromatic C = C stretching band from 1618 c m - l (peat) to 1585 c m - l (semi-anthracite) was observed as a function of increasing coalification (Fig. 6). This fact is in good agreement with the increasing aromaticity values calculated for these coals (Table 2).
The aromatic hydrogen content of the coals eval-
150!
< 125 8 r ~
100
o 75
50
• C = O
• C-O-R / /
- . / ' !
:r i , I 0.1 0.2 0.3 0.4
O/C a t o m i c ratio
I 0.5
Fig. 7. E v o l u t i o n of C = O and C - O - R s t ructures as a function of the O/C atomic ratio of coals.
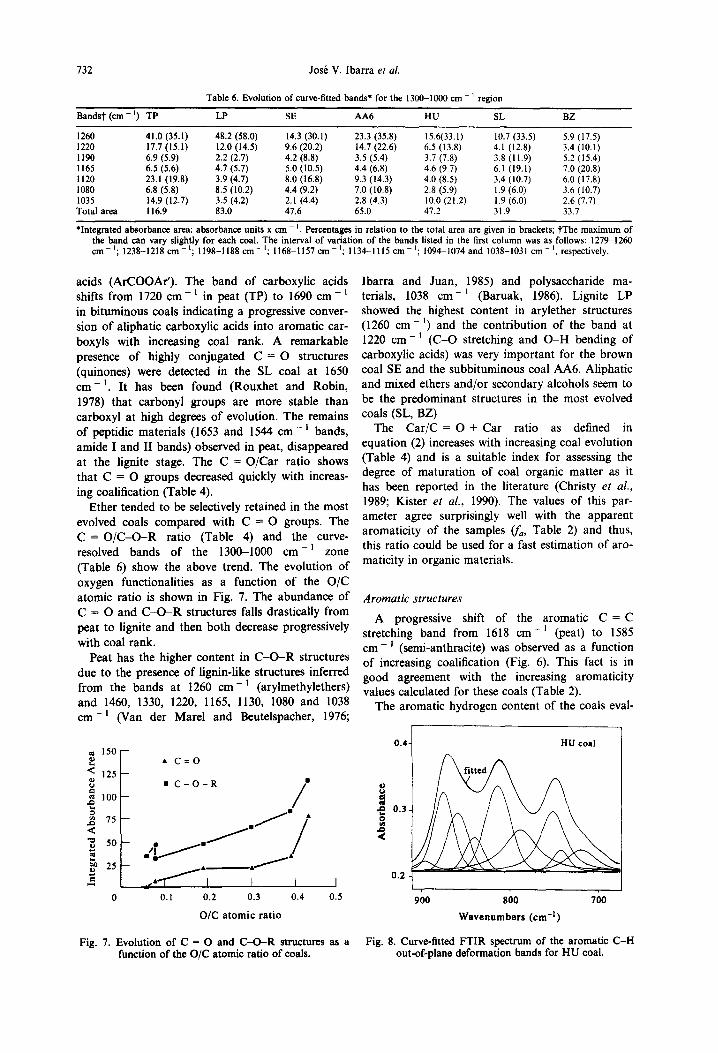
0.4- HU coal
~ 0.3
0.2
)oo goo
W a v e n u m b e r s (era -1)
Fig. 8. Curve-f i t ted F T I R spec t rum of the a roma t i c C - H out -of -p lane de fo rma t ion bands for H U coal.
FTIR study of coal structure
Table 7. Curve-fitting for the aromatic C-H out-of-plane deformation bands of HU coal*
733
Maximum (cm - l) Width (cm - L) Height Assignmentt Area Typc/L (%)
895 26 0.016 1H 0.47 L 874 26 0.120 1H 3.57 Mix/0.29 858 29 0.089 IH 2.64 G 839 25 0.051 2H 1.38 Mix/0.06 812 34 0.130 2H 4.80 Mix/0.10 787 45 0.063 3H 3.94 L 750 34 0.091 4H 4.07 Mix/0.76 742 25 0.033 4H 0.91 Mix/0.50 695 20 0.006 5H 0.16 L 720 39 0.033 (CH3)~ ~ 4 1.62 Mix/0.70
*Notes as in Table 3. tNumber of adjacent aromatic hydrogens per
ua ted f r o m F T I R m e a s u r e m e n t s indica tes a p ro -
gressive increase o f this p a r a m e t e r wi th increas ing
coal i f ica t ion o f the samples . B i t u m i n o u s coals have
.4
L~
O
0 900 850 800 7,50 700
W a v e n u m b e r s ( c m - l )
Fig. 9. Evolution of the aromatic C - H out-of-plane defor- mation bands for the studied coals.
ring; chi-squared = 6.18 x 10- 5.
the h ighes t a r o m a t i c h y d r o g e n c o n t e n t s (Table 2).
Th ree ou t -o f -p l ane C - H d e f o r m a t i o n b a n d s were
obse rved in the 900-700 c m - 1 reg ion for the differ-
en t coals as i l lus t ra ted in Fig. 8 for H U coal. These
b a n d s are ass igned to a r o m a t i c s t ruc tures wi th iso-
la ted a r o m a t i c h y d r o g e n s (870 cm - t), two ad jacen t
h y d r o g e n s per r ing (815 c m - l ) a n d fou r ad jacen t
a r o m a t i c h y d r o g e n s (750 c m - 1) (Yen et al., 1984).
The curve-f i t t ing analys is revealed the p resence o f
o t h e r ove r l app ing b a n d s (Fig. 8) wh ich di f fered
only sl ightly for all the s tudied coals. G o o d fits
were o b t a i n e d wi th 6 -8 b a n d s for low rank coals
a n d 8 - 1 0 b a n d s for b i t u m i n o u s coals and semi-
an thrac i te . Table 7 gives the results o f the curve-f i t - t ing analys is for the a r o m a t i c zone o f H U coal
s h o w n in Fig. 8.
The n u m b e r o f ad jacen t h y d r o g e n s per r ing p ro -
vides an es t imate o f the degree o f a r o m a t i c subst i -
t u t i on a n d c o n d e n s a t i o n wi th increas ing
coal i f icat ion. Signif icant d i f ferences be t ween the
coals were f o u n d ma in ly in the va r i a t ion o f the rela-
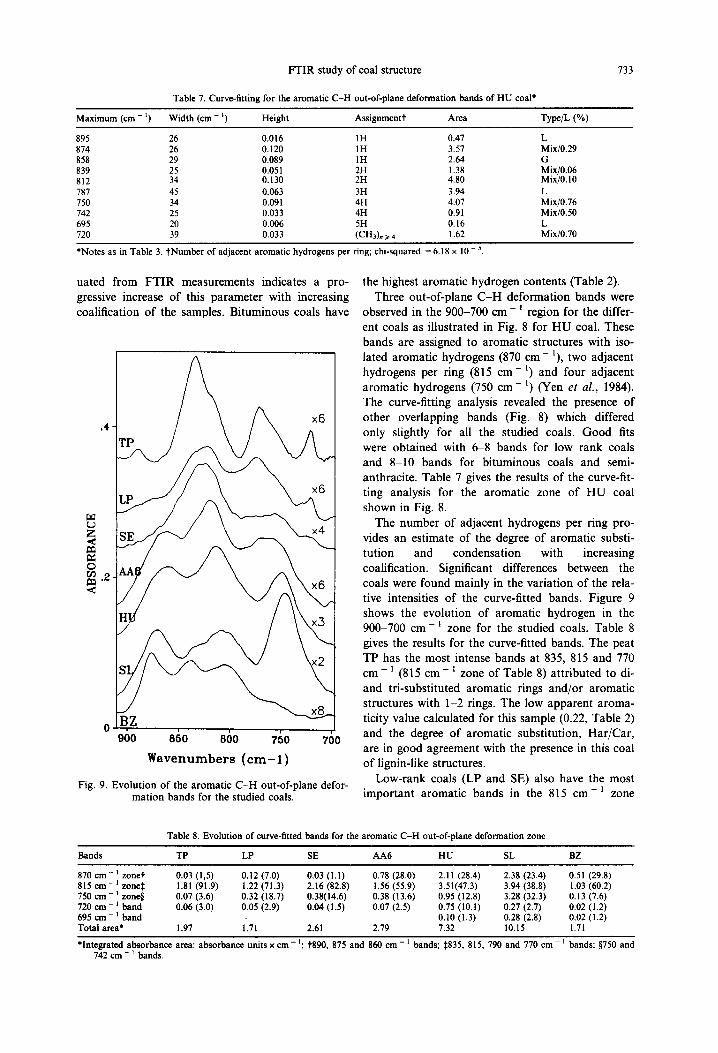
tive intensi t ies o f the curve-f i t ted bands . F igure 9 shows the evo lu t ion o f a r o m a t i c h y d r o g e n in the
900-700 c m - 1 zone for the s tud ied coals. Table 8
gives the resul ts for the curve-f i t ted bands . T h e pea t
T P has the m o s t in tense b a n d s at 835, 815 a n d 770 cm - 1 (815 cm - 1 zone o f Table 8) a t t r i bu t ed to di-
a n d t r i - subs t i tu ted a r o m a t i c r ings a n d / o r a roma t i c
s t ruc tures wi th 1-2 rings. T h e low a p p a r e n t a r o m a -
ticity value ca lcu la ted for this sample (0.22, Tab le 2) and the degree o f a r o m a t i c subs t i tu t ion , H a r / C a r ,
are in g o o d a g r e e m e n t wi th the p resence in this coal o f l ignin-l ike s t ructures .
L o w - r a n k coals (LP a n d SE) a lso have the m o s t i m p o r t a n t a r o m a t i c b a n d s in the 815 c m - i zone
Table 8. Evolution of curve-fitted bands for the aromatic C-H out-of-plane deformation zone
Bands TP LP SE AA6 HU SL BZ
870 cm- i zoner 0.03 (1,5) 0.12 (7.0) 0.03 (1.1) 0.78 (28.0) 2.11 (28.4) 2.38 (23.4) 0.51 (29.8) 815 era- ~ zone:[: 1.81 (91,9) 1.22 (71.3) 2.16 (82.8) 1.56 (55.9) 3.51(47.3) 3.94 (38.8) 1.03 (60.2) 750 crn - ~ zone§ 0.07 (3.6) 0.32 (18.7) 0.38(14.6) 0.38 (13.6) 0.95 (12.8) 3.28 (32.3) 0.13 (7.6) 720 era- 1 band 0.06 (3.0) 0.05 (2.9) 0.04 (1.5) 0.07 (2.5) 0.75 (10.1) 0.27 (2.7) 0.02 (1.2) 695 cm - ~ band . . . . 0.10 (1.3) 0.28 (2.8) 0.02 (1.2) Total area* 1.97 1.71 2.61 2.79 7.32 10.15 1.71
*Integrated absorbance area: absorbance units x cm - i; t890, 875 and 860 cm - 1 bands; :[:835, 815, 790 and 770 cm - i bands; §750 and 742 cm - ~ bands.
734 Jos+ V. Ibarra et al.
(Table 8). The relatively low aromaticity and Har/ Car values calculated for these samples (Table 2) suggest that such bands should be attributed to highly-substituted aromatic rings rather than to lar- ger ring sizes.
From the subbituminous stage an important con- tribution of the bands over the 870 cm - l zone can be observed while the degree of aromatic substi- tution decreases and the aromaticity increases mark- edly. These facts should be consistent with a large size of the condensed aromatic nuclei. According to Gerstein et al. (1979) the average aromatic ring size inferred from the aromatic hydrogen to carbon ratio depends a good deal upon the number of sub- stituents (side chains, functional groups, etc.). A value of 0.40 is consistent with an average ring size of two, with four substituents per polyaromatic ring but also with average ring sizes of four to six. Based on these facts and on reported infrared band assignations for PAHs (Semmler et al., 1991) and model compounds, the bands centred at 870 and 780 cm - ~ in the most evolved coals could be attrib- uted to average aromatic ring sizes of 3 4 or more. Thus, highly-substituted aromatic rings seem to be the main aromatic structures in peat and low-rank coals whereas condensed aromatic nuclei (3-4 rings) should be present in the most evolved coals. These findings are in good agreement with the results reported by other authors and obtained by other techniques such as pyrolysis-gas chromatography (Hayatsu et al., 1978) and solid state 13C NMR (Gerstein et al., 1979; Solum et al., 1989) and they prove that coal increases its aromaticity with increasing natural maturation due, mainly, to a higher content in polynuclear aromatic structures.
CONCLUSIONS
The resolution of overlapping bands in the FTIR spectra of the studied coals by curve-fitting methods contributes to improve the information on the main structural changes that can take place during the coalification process. From curve-resolved bands different structural parameters and trends for fol- lowing coal evolution have been established.
The apparent aromaticity values (f~) calculated from FTIR measurements indicate that coal increases its aromaticity with increasing coalifica- tion. A good relationship between fa and the H/C atomic ratio has been found for the studied coals. The hydrogen distribution calculated for the studied samples shows that the aromatic hydrogen content increases while the aliphatic hydrogen content decreases with coal rank.
The speciation of different C = O and C - O - R structures from the curve-resolved zone of 1800- 1000 cm - ~ shows the progressive conversion of ali- phatic carboxylic acids into aromatic carboxyls with increasing coal rank. The abundance of C = O and
C - O - R structures falls drastically from peat to lig- nite and then both decrease progressively with coal rank. Ether tended to be selectively retained in the most evolved coals compared with C = O groups. The Car/C = O + Car ratio is a suitable index for assessing the degree of maturation of coal organic matter.
The examination of the out-of plane deformation bands (900-700 cm - l ) provides evidence that highly-substituted aromatic rings are the main aro- matic structures in peat and low-rank coals whereas condensed aromatic nuclei are present in the most evolved coals. Long alkyl chains of aliphatic struc- tures, as evaluated by the 720 c m - l band, are scar- cely present in all studied samples, except for the HU bituminous coal.
The present results are in good agreement with the well-established mechanisms of coal maturation and they prove that FTIR spectroscopy can be sucessfully used to determine aromaticies, hydrogen distributions and oxygen-containing species in coals and related sedimentary organic materials.
REFERENCES
Baruak M. K. (1986) Assignment of the IR absorption band at 1050 cm - l in lignite humic acid. Fuel 65, 1756- 1759.
Bishop M. and Ward D. L. (1958) The direct determi- nation of mineral matter in coal. Fuel 37, 191-200.
Brown J. K. and Ladner W. R. (1960) A study of the hydrogen distribution in coal-like materials by high-res- olution nuclear magnetic resonance spectroscopy. II. A comparison with infrared measurement and the conver- sion to carbon structure. Fuel 39, 87-96.
Christy A. A., Hopland A. L., Barth T. and Kvalheim O. M. (1989) Quantitative determination of thermal maturity in sedimentary organic matter by difusse reflec- tance infrared spectroscopy of asphaltenes. Org. Geochem, 14, 77-81.
Durand B. (Ed.) (1980) Kerogen. Insoluble Organic Matter from Sedimentary Rocks. Editions Technip, Paris.
Fuller E. L., Smyrl N. R., Howell R. L. and Daw C. S. (1984) Chemistry and structure of coals: evaluation of organic structure by computer aided diffuse reflectance infrared spectroscopy. Am. Chem. Soc. Div. Fuel Chem. 29(1), 1-9.
Gerstein B. C., Ryam L. M. and Dubois M. P. (1979) A tentative identification of average aromatic ring size in an Iowa vitrain and a Virginia vitrain. Am. Chem. Soc. Div. Fuel Chem. 24, 90-95.
Hayatsu R., Winans R. E., Scott R. G., Moore L. P. and Studier M. H. (1978) Trapped organic compounds and aromatic units in coals. Fuel 57, 541-548.
Ibarra J. V. and Juan R. (1985) Structural changes in humic acids during the coaliflcation process. Fuel 64, 650-656.
Ibarra J. V., Palacios J. M. and Andr6s A. M. (1989) Analysis of coal and chars ashes and their ability for sulphur retention. Fuel 68, 861-867.
Ibarra J. V., Cervero I., Miranda J. L. and Moliner R. (1991) Structural rank parameters of Spanish low rank coals and their influence on pyrolysis yields. Fuel Process. Technol. 28, 259-273.
FTIR study of coal structure 735
Ibarra J. V., Moliner R. and Bonet A. J. (1994) FTIR in- vestigation on char formation during the early stages of coal pyrolysis. Fuel 73, 918-924.
lbarra J. V., Royo C., Monz6n A. and Santamaria J. (1995) Fourier transform spectroscopic study of coke deposits on a Cr203-A1203 catalyst. Vibr. Spectrosc. 9, 191-196.
Juan R. and Ibarra J. V. (1983) Caracterizaci6n por espectroscopia IR de la materia mineral y de los ~icidos hflmicos de carbones de bajo rango. Anal. Quim. 79, 290-295.
Kauppinen J. K., Moffatt D. J., Mantsch H. H. and Cameron D. G. (1981) Fourier transform in the compu- tation of self-deconvoluted and first order derivative spectra of overlapped band contours. Anal. Chem. 53, 1454-1457.
Kauppinen J. K., Moffatt D. J., Mantsch H. H. and Cameron D. G. (1981) Fourier self-deconvolution: a method for resolved intrinsically overlapped bands. Appl. Spectrosc. 35, 271-276.
Kister J., Guiliano M., Largeau C., Derenne S. and Casadevall E. (1990) Characterization of chemical struc- ture, degree of maturation and oil potential of Torbanites (type I Kerogens) by quantitative FTIR spec- troscopy. Fuel 69, 1356-1361.
Kroo E., Bonanno A. S., Serio M. A. and Solomon P. R. (1993) Application of a spectral deconvolution technique to coal FT-IR spectra. In Proceedings 7th International Conference on Coal Science (Edited by Michelian K. H.), Vol. II, pp. 473-476. Banff, Canada.
Maddams W. F. (1980) The scope and limitations of curve-fitting. Appl. ~ectrosc. 34, 245-267.
Michaelian K. H. and Friesen W. I. (1990) Photoacoustic FTIR spectra of separated western canadian coal mac- erals. Analysis of the CH stretching region by curve-fit- ting and deconvolution. Fuel 69, 1271.
Painter P. C., Youtcheff J. and Given P. H. (1980) Concerning the putative presence of nitrate in lignites. Fuel 59, 523-526.
Painter P. C., Snyder R. W., Starsinic M., Coleman M. M., Kuehn D. W. and Davis A. (1981) Concerning the application of FTIR to the study of coal: a critical assessment of band assignments and the application of spectral analysis programs. Appl. Spectrosc. 35, 475-485.
Painter P. C., Starsinic M., Squires E. and Davies A. (1983) Concerning the 1600 c m - 1 region in the IR spec- trum of coal. Fuel 62, 742-744.
Painter P., Sobkowiak M., Heidary S. and Coleman M. (1994) Current status of FTIR in the analysis of coal structure. Am. Chem. Soc. Div. Fuel Chem. 39(1), 49-53.
Pandolfo A. G., Johns R. B., Dyrkacz G. R. and Buchanan A. S. (1988) Separation and preliminary characterization of high-purity maceral group fractions from an Australian bituminous coal. Energy and Fuels 2, 657-662.
Rouxhet P. G. and Robin P. (1978) Infrared study of the evolution of kerogens of different origins during cata- genesis and pyrolysis. Fuel 57, 533-540.
Rouxhet P. G., Robin P. L. and Nicaise G. (1980) Characterization of kerogens and their evolution by in- frared spectroscopy. In Kerogen (Edited by Durand B.), pp. 163-190. Editions Technip, Paris.
Schafer H. N. S. (1970) Carboxyl groups and ion exchange in low-rank coals. Fuel 49, 197-213.
Stach E. (Ed.) (1975) Coal Petrology. Gebriider Borntraeger, Berlin.
Semmler J., Yang P. W. and Craford G. E. (1991) Gas chromatography/Fourier transform infrared studies of gas-phase polynuclear aromatic hydrocarbons. Vibrational Spectrosc. 2, 189-203.
Solum M. S., Pugmire R. J. and Grant D. M. (1989) 13C solid state NMR of Argonne premium coals. Energy and Fuels 3, 187-193.
Solomon P. R. and Carangelo R. M. (1988) FTIR analysis of coal. Fuel 67, 949-959.
Starsinic M., Otake Y., Walker P. and Painter P. C. (1984) Application of FTIR spectroscopy to the determination of COOH groups in coal. Fuel 63, 1002-1007.
Supaluknari S., Larkins F. P., Redlich P. and Jackson W. R. (1989) Determination of aromaticities and other structural features of Australian coals using solid state 13C NMR and FTIR spectroscopies. Fuel Proc. Tech. 23, 47-61.
Supaluknari S., Larkins F. P., Redlich P. and Jackson W. R. (1989) An FTIR study of Australian coals: characterization of oxygen functional groups.. Fuel Proc. Teeh. 19, 123-140.
Van der Marel H. W. and Beutelspacher, H. (1976) Atlas of Infrared Spectroscopy of Clay Minerals and their Admixtures. Elsevier, Amsterdam.
Wang S. H. and Griffiths P. R. (1985) Resolution enhance- ment of diffuse reflectance IR spectra of coal by Fourier self-deconvolution. 1. C H stretching and bending modes.. Fuel 64, 229-236.
Yen T. F., Wu W. H. and Chilingar G. V. (1984) A study of the structure of petroleum asphaltenes and related substances by infrared spectroscopy. Energy Sources 7, 203-235.