High-speed broadband FTIR system using MEMS
6
High-speed broadband FTIR system using MEMS N. Pelin Ayerden, 1,2 Ugur Aygun, 1 Sven T. S. Holmstrom, 1 Selim Olcer, 1 Basarbatu Can, 1 Jean-Louis Stehle, 3 and Hakan Urey 1, * 1 Department of Electrical Engineering, Koc University, Istanbul 34450, Turkey 2 Microelectronics Department, Delft University of Technology, Delft 2628 CD, The Netherlands 3 Semilab, Budapest H-1117, Hungary *Corresponding author: [email protected] Received 31 July 2014; revised 23 September 2014; accepted 23 September 2014; posted 23 September 2014 (Doc. ID 217555); published 23 October 2014 Current Fourier transform infrared spectroscopy (FTIR) systems have very good spectral resolution, but are bulky, sensitive to vibrations, and slow. We developed a new FTIR system using a microelectrome- chanical system (MEMS)-based lamellar grating interferometer that is fast, compact, and achromatic (i.e., does not require a beam splitter). The MEMS device has >10 mm 2 active surface area, up to 325 μm mechanical displacement, and a 343 Hz resonant operation frequency. The system uses a 5 MHz bandwidth custom infrared (IR) detector and a small emission area custom blackbody source to achieve fast interferogram acquisition and compact form factor. Effects of lamellar grating period, detector size, laser reference, apodization, and averaging of data on the spectral resolution are discussed. The measurement time ranges from 1.5 to 100 ms depending on the averaging time. In the target range of 2.5–16 μm(625–4000 cm -1 ) a spectral resolution of 15–20 cm -1 is demonstrated. The measurements are shown to be stable over a long time. © 2014 Optical Society of America OCIS codes: (120.6200) Spectrometers and spectroscopic instrumentation; (300.6300) Spectroscopy, Fourier transforms; (050.0050) Diffraction and gratings; (230.4685) Optical microelectromechanical devices. http://dx.doi.org/10.1364/AO.53.007267 1. Introduction Fourier transform infrared spectroscopy (FTIR) has been the gold standard in infrared (IR) spectroscopy since the 1970s [ 1– 3]. FTIR instruments have, how- ever, traditionally been bulky, sensitive to vibrations, and needed at least several seconds per measure- ment. There is a long-term trend toward ever smaller systems and with the large developments in micro- electromechanical systems (MEMS) over the last two decades it is now possible to realize truly minia- turized FTIR instruments that are cheaper, faster, and more convenient to use [ 4– 6]. Miniaturized FTIR spectrometry is of interest in a very wide array of ap- plications, including food monitoring, gas detection, bomb detection, the mining industry, space missions, and quality and process control. FTIR is usually implemented with a moving mir- ror in the Michelson configuration [ 7] and successful MEMS implementations of this type have been re- ported [ 8, 9]. An alternative approach is the lamellar grating interferometer (LGI), where the wavefront is split by having one half reflected from the moving binary grating fingers and the other half from the static grating fingers [ 10]. The LGI configuration has several advantages that make it especially suited for easy-to-handle, mobile instruments. LGI enables a more compact optical setup since the dy- namic grating eliminates the reference mirror, beam splitter, and dispersion compensation plates. The simpler assembly and the combination of dynamic and static mirrors in one single component make for greater robustness. On the optical side it is pos- sible to implement the LGI-based system with only 1559-128X/14/317267-06$15.00/0 © 2014 Optical Society of America 1 November 2014 / Vol. 53, No. 31 / APPLIED OPTICS 7267
-
Upload
independent -
Category
Documents
-
view
6 -
download
0
Transcript of High-speed broadband FTIR system using MEMS

High-speed broadband FTIR system using MEMS
N. Pelin Ayerden,1,2 Ugur Aygun,1 Sven T. S. Holmstrom,1 Selim Olcer,1
Basarbatu Can,1 Jean-Louis Stehle,3 and Hakan Urey1,*1Department of Electrical Engineering, Koc University, Istanbul 34450, Turkey
2Microelectronics Department, Delft University of Technology, Delft 2628 CD, The Netherlands3Semilab, Budapest H-1117, Hungary
*Corresponding author: [email protected]
Received 31 July 2014; revised 23 September 2014; accepted 23 September 2014;posted 23 September 2014 (Doc. ID 217555); published 23 October 2014
Current Fourier transform infrared spectroscopy (FTIR) systems have very good spectral resolution, butare bulky, sensitive to vibrations, and slow. We developed a new FTIR system using a microelectrome-chanical system (MEMS)-based lamellar grating interferometer that is fast, compact, and achromatic(i.e., does not require a beam splitter). The MEMS device has >10 mm2 active surface area, up to�325 μm mechanical displacement, and a 343 Hz resonant operation frequency. The system uses a5 MHz bandwidth custom infrared (IR) detector and a small emission area custom blackbody sourceto achieve fast interferogram acquisition and compact form factor. Effects of lamellar grating period,detector size, laser reference, apodization, and averaging of data on the spectral resolution are discussed.Themeasurement time ranges from 1.5 to 100ms depending on the averaging time. In the target range of2.5–16 μm (625–4000 cm−1) a spectral resolution of 15–20 cm−1 is demonstrated. The measurements areshown to be stable over a long time. © 2014 Optical Society of AmericaOCIS codes: (120.6200) Spectrometers and spectroscopic instrumentation; (300.6300) Spectroscopy,
Fourier transforms; (050.0050) Diffraction and gratings; (230.4685) Optical microelectromechanicaldevices.http://dx.doi.org/10.1364/AO.53.007267
1. Introduction
Fourier transform infrared spectroscopy (FTIR) hasbeen the gold standard in infrared (IR) spectroscopysince the 1970s [1–3]. FTIR instruments have, how-ever, traditionally been bulky, sensitive to vibrations,and needed at least several seconds per measure-ment. There is a long-term trend toward ever smallersystems and with the large developments in micro-electromechanical systems (MEMS) over the lasttwo decades it is now possible to realize truly minia-turized FTIR instruments that are cheaper, faster,and more convenient to use [4–6]. Miniaturized FTIRspectrometry is of interest in a very wide array of ap-plications, including food monitoring, gas detection,
bomb detection, the mining industry, space missions,and quality and process control.
FTIR is usually implemented with a moving mir-ror in the Michelson configuration [7] and successfulMEMS implementations of this type have been re-ported [8,9]. An alternative approach is the lamellargrating interferometer (LGI), where the wavefront issplit by having one half reflected from the movingbinary grating fingers and the other half from thestatic grating fingers [10]. The LGI configurationhas several advantages that make it especiallysuited for easy-to-handle, mobile instruments. LGIenables a more compact optical setup since the dy-namic grating eliminates the reference mirror, beamsplitter, and dispersion compensation plates. Thesimpler assembly and the combination of dynamicand static mirrors in one single component makefor greater robustness. On the optical side it is pos-sible to implement the LGI-based system with only
1559-128X/14/317267-06$15.00/0© 2014 Optical Society of America
1 November 2014 / Vol. 53, No. 31 / APPLIED OPTICS 7267

reflective components, rendering it achromatic andenabling simultaneous spectrum measurements inmultiple wave bands by changing the detector only,which is a distinct advantage over traditional FTIRs.Additionally, since the moving element is a gratingrather than a solid mirror, LGIs lend themselvesto implementations without vacuum packaging. Allmeasurements in this paper are performed at ambi-ent pressure.
The theoretical background of the LGI spectrom-eter is described elsewhere [11–13]. The mechanicaldesign, fabrication, and characterization of theMEMS interferometer used here are given in [14].With a clear aperture of 10 mm2 and an operationaldeflection up to �325 μm the present device has thelargest clear aperture as well as the largest displace-ment of any non-Michelson MEMS spectrometerdevice. Spectrums measured with and without laserreference are presented and signal processingchoices are discussed in this paper. The device isoperated at resonance around 343 Hz, with two fullspectrums obtained per cycle. One spectrum is hencemeasured in 1.5 ms. This makes room for measure-ment times far below 1 s even with optimal averag-ing. Resonant operation improves the measurementtime drastically compared to its counterparts.A MEMS Michelson interferometer with a thermallyactuated gear and crank systemwas reported to havea full cycle of 600 μm displacement in just over 1 s[15]. An electrostatically actuated LGI was pre-sented with 145 μm optical path difference (OPD)measured step by step in 5 min [13]. Apart fromour device, a MEMS Michelson interferometer thatoperates in the resonant mode at 500 Hz is reportedto have a measurement time of 1 ms [8].
In Section 2 we develop a bench-top setup for anLGI-based FTIR spectrometer, using the above-mentionedMEMSdevice, formeasurement in the2.5–16 μm(625–4000 cm−1) range. In Section 3we analyzeand compare spectrummeasurements taken in differ-ent conditions. In Section 4 the paper is concluded.
2. Optical Design and Optimization
The layout of the FTIR spectrometer setup is shownin Fig. 1(a). Infrared radiation from the source iscollimated by a 90° off-axis parabolic mirror and thenreflected off the lamellar grating. After passingthrough the sample, the beam is focused onto theIR detector by the focusing lens and aligned so thatonly the zeroth diffraction order reaches the sensor.The IR source (developed by Bruker Optics, Ger-many) is a blackbody radiator operating at 1070 Kwith an emission diameter of 0.5 mm. The IR detec-tor (developed by VIGO Systems, Poland) is athermoelectrically cooled HgCdTe detector with anintegrated 12.85 mm focal length focusing lens.The detector and source are both designed specifi-cally for this project and the target range of 2.5–16 μm (625–4000 cm−1). To accurately track thedevice deflection, a reference laser of He–Ne type(632.8 nm) is diffracted off the grating. The reference
data is acquired by capturing the zeroth order with aphotodetector.
Since the resonant device motion is sinusoidal, theIR interferogram is resampled at the zero crossingsof the laser interferogram to obtain a spatially equi-distant IR interferogram. The Fourier transform ofthis resampled data will then give the spectrum.Each spectral measurement consists of two separatesteps: a reference measurement without the sampleis followed by ameasurement with the sample placedin the optical path. After data sampling and Fouriertransform, percent transmittance and absorbancespectra are calculated in MATLAB. In order toincrease the SNR, averaging and apodization maybe applied to the interferogram.
The general reasoning and method behind theoptical design consideration are treated in [12].
Fig. 1. (a) Schematic of the spectrometer system setup. ZCD,zero-crossing detector; ADC, analog-to-digital converter. (b) Ouractual spectrometer implementation. Note that in the actual setupboth IR and laser reference are reflected off the front side of thedevice.
7268 APPLIED OPTICS / Vol. 53, No. 31 / 1 November 2014

The MEMS interferometers are fabricated with afour-mask SOI bulk micromachining process. Eachdevice has an Al top reflector, 11 mm × 11 mm diearea, 130 μm grating pitch, and a 10 mm2 clear aper-ture. The grating consists of alternating static andmovable mirrors, arranged in a diamond patternto increase the efficiency for a circular beam. Forthe measurements in this paper deflections up to�325 μm are used; all achieved with acoustic actua-tion at 343 Hz.
The spectral resolution of LGI-based FTIR spec-trometers are restricted by four main limitations:OPD created by the interferometer, the Talbot effect,diffraction order mixing, and divergence of thesource. The OPD is twice the zero-to-peak deflection.The highest possible spectral resolution is 1/OPD,which is around 15 cm−1 at �325 μm deflection.The Talbot effect is the repeated imaging of thediffraction grating itself at regular distances. TheTalbot length, T, can be expressed as
T � 2Λ2
λ; (1)
where λ is the wavelength and Λ the grating period[16]. In our case Λ � 130 μm and λmax in the choseninterval is 16 μm (625 cm−1). The phase-reversedTalbot image appears at T∕2, leading to a practicalupper deflection limit of 1.06 mm, which is highcompared to the maximum deflection of 325 μm. Dif-fraction order mixing, on the other hand, is an areawhere some compromise is needed. The detector win-dow plane is sketched in the upper row of Fig. 2 forthe two extremities of the wave band, assuming pointlight sources. The blue box represents the detectorwidth. Separation between order centers at thedetector is under the paraxial approximation deter-mined by Eq. (2), where f foc is the focal length of thefocusing lens:
S0 � f focλ
Λ: (2)
The degree of collimation is defined by the halfdivergence angle and given in Eq. (3):
θd � D2f foc
; (3)
where D is the diameter of the IR source and f col isthe focal length of the collimating lens. The detectorwindow plane is sketched in the bottom row of Fig. 2by taking the divergence angle of both λmin and λmaxinto account. The width of the zeroth order in thiscase can be calculated as in Eq. (4):
W0th � 2θd × f foc � Df focf col
: (4)
It is unavoidable to have some mixing of the zerothand the first orders for short wavelengths. Thisreduces the signal-to-bias ratio (SBR), defined asthe ratio of the AC signal to DC bias of the interfero-gram. The width of the zeroth order is optimized byproperly selecting focal lengths of the focusing lensand the collimating lens.
In order to optimize the optical design of the spec-trometer the algorithm given in [12] is implementedin MATLAB, as illustrated in Fig. 3(a). Eventuallythe interferogram signal for a wavelength λ and adeflection d can be written as
I�λ; d� �Z
W∕2
x�−W∕2
Xθdθ�−θd
jF fE�r1� � E�t1; r2; t2�gj2; (5)
where E corresponds to the electric field and F de-notes the Fourier transform. The calculation stepsare as follows: a plane wave is created and propa-gated through the double grating. After reflectionfrom the grating the wavefront is split into a firstpart due to reflection from the upper mirrors (r1)and a second part that is reflected from the bottommirrors. The second component is calculated by con-sidering Fresnel propagation due to optical path (d),transmission coefficients (t1, t2), and the reflectioncoefficient (r2). The wave is then focused onto thedetector with the focusing lens. The interferogram
Fig. 2. Sketch of the order mixing for long and short wavelengths.The upper part of the figure shows the ideal case of point sourceillumination. The lower part of the figure illustrates the actualsituation with nonzero divergence.
Fig. 3. (a) Illustration of the algorithm used to model perfor-mance of the LGI device [12]. (b) Results at the two extremitiesof the predefined wavelength interval.
1 November 2014 / Vol. 53, No. 31 / APPLIED OPTICS 7269

intensity for a specific deflection is calculated byintegration of the beam energy within the detectorwindow. The whole interferogram can be calculatedby sweeping the deflection parameter (d) over theentire range. Finally, the spectrum is calculated bytaking the Fourier transform of the interferogram.The two most important parameters are full widthat half-maximum (FWHM) of the magnitude spec-trum and the SBR.
For a given detector width W, W0th can be adjustedby the choice of lenses. Optimal signal-to-noise ratio(SNR) and SBR are obtained when W0th is about thesame size as W. In the actual setup the detectorwidth is 1.4 mm. Smaller W0th results in larger biasand smaller signal due to order mixing. Larger W0thimproves SBR. SNR decreases as signal levelbecomes very small.
As shown in Fig. 3 the system performance istested for the two extremes of the detector’s spectralband (625–4000 cm−1) to investigate the impact oforder mixing effects and the Talbot effect. The chosenvalue for the collimation lens is f col � 5.8 mm, whichclears the lower limit to fit W0th inside the detectorarea, while still giving an even spectral resolutionover the wavelength interval. The simulated inter-ferograms and spectrums calculated from theseare shown in Fig. 3(b). The resolution is equal forthe two extreme cases, but the SBR is lower forλ � 2.5 μm due to order mixing, which decreases dy-namic range. In the actual system a capacitor isadded to the IR detector output to filter out DC com-ponents and maintain AC coupled detection.
3. Spectrum Measurements
To investigate the effects of interferometer deflectionon the system, the spectrum of a polystyrenesample is measured with varying deflection (Fig. 4).Each spectrum is obtained by averaging over 32measurements. Resolution is increasing with in-creasing deflection as expected. In the range of4000–3500 cm−1 noise also increases. Dynamic defor-mation of the MEMSmirrors is one of the reasons for
this noise. This region also suffers from order mixing,as explained in the previous section, and is hencemore sensitive to any disturbance. At short wave-numbers the resolution is increasing gradually, whilenoise is not increasing significantly.
SNR of the measured spectrum can be improved byaveraging multiple scans at the expense of the mea-surement time. Polystyrene spectrums, obtained byaveraging over a varying number of measurementsare shown in Fig. 5. Averaging decreases the noiselevel, especially at high (4000–3500 cm−1) and
Fig. 4. Polystyrene spectrum measured at varying OPD, eachaveraged over 32 measurements.
Fig. 5. Spectrums of the same polystyrene sample, measured at adevice deflection of �325 μm. The data was averaged over a vary-ing number of measurements to show the effect of averaging.
Fig. 6. Comparison of the generated spectrum with that of acommercial device.
7270 APPLIED OPTICS / Vol. 53, No. 31 / 1 November 2014
moderate wavenumbers (2800–2000 cm−1). Anincreasing measurement number improves the spec-trum quality up to 64measurements. Increasing thatnumber to 128 did not improve the results further.On the other hand, even without any averaging(one measurement only) most of the characteristicpeaks of polystyrene spectrum are observed. Depend-ing on speed and accuracy requirements a measure-ment takes 1.5 ms (650 spectrums∕s) to 100 ms(10 spectrum∕s).
A virtual reference interferogram can be generatedand used instead of the laser reference if the mirrormotion is assumed to be sinusoidal and if the OPD isknown and stable. In Fig. 6 the polystyrene spectrummeasured with a commercial FTIR spectrometer iscompared to spectrums obtained with or withoutlaser reference and with or without apodization.Although peaks around 3000 cm−1 are not observedwith the virtual reference, the resolution is identicalfor the two references over most of the range. Thelaser reference is traditionally used in MEMS spec-trometers [17] because of two major advantages: itwill keep up with long-term deflection drift (not ac-counted for here) and it can take into account thesmall deflection variations between vibration cycles.The latter is what leads to a slightly better resolutionat high wavenumbers in this measurement.
However, elimination of the He–Ne laser and photo-detector enables further miniaturization of thesystem, which is of large interest for some industrialmonitoring applications.
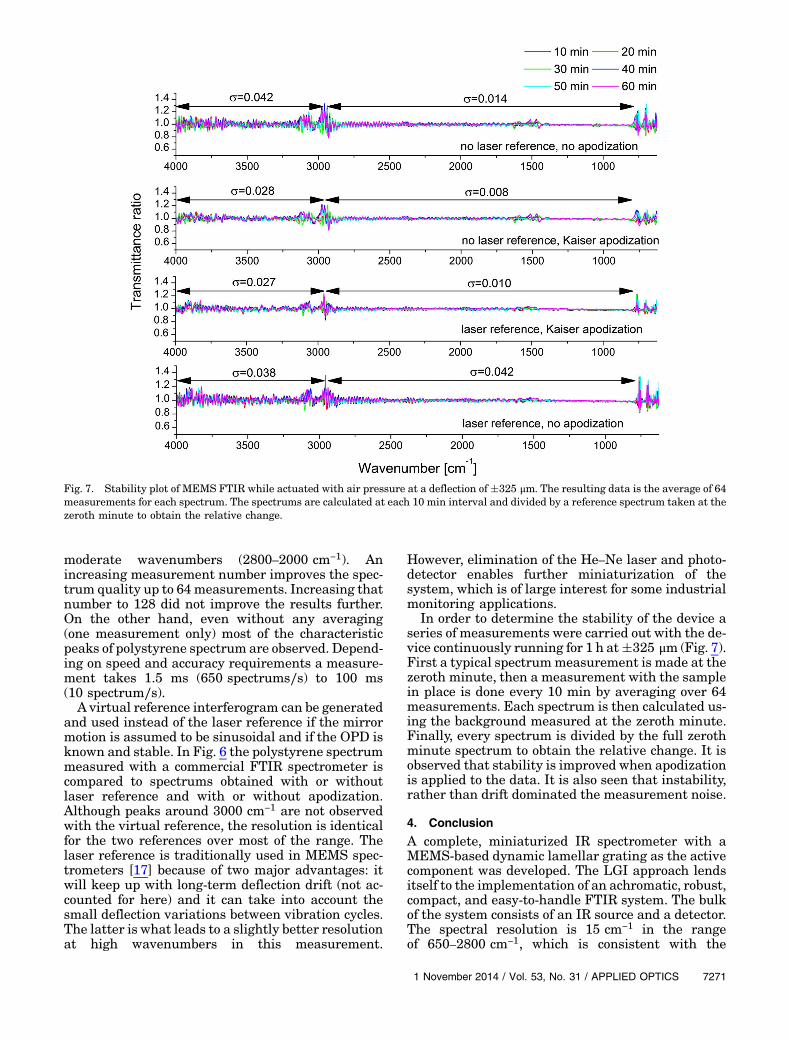
In order to determine the stability of the device aseries of measurements were carried out with the de-vice continuously running for 1 h at�325 μm (Fig. 7).First a typical spectrummeasurement is made at thezeroth minute, then a measurement with the samplein place is done every 10 min by averaging over 64measurements. Each spectrum is then calculated us-ing the background measured at the zeroth minute.Finally, every spectrum is divided by the full zerothminute spectrum to obtain the relative change. It isobserved that stability is improved when apodizationis applied to the data. It is also seen that instability,rather than drift dominated the measurement noise.
4. Conclusion
A complete, miniaturized IR spectrometer with aMEMS-based dynamic lamellar grating as the activecomponent was developed. The LGI approach lendsitself to the implementation of an achromatic, robust,compact, and easy-to-handle FTIR system. The bulkof the system consists of an IR source and a detector.The spectral resolution is 15 cm−1 in the rangeof 650–2800 cm−1, which is consistent with the
Fig. 7. Stability plot of MEMS FTIR while actuated with air pressure at a deflection of�325 μm. The resulting data is the average of 64measurements for each spectrum. The spectrums are calculated at each 10 min interval and divided by a reference spectrum taken at thezeroth minute to obtain the relative change.
1 November 2014 / Vol. 53, No. 31 / APPLIED OPTICS 7271

theoretical limit. The stability is better than 1% inthis range. As explained above the obtained spec-trum resolution is about 20 cm−1 in the range of2800–4000 cm−1. The stability is better than 3% inthis range. Lower resolution and higher noise is aresult of the current grating pitch of 130 μm, whichprovides a good balance between long Talbot distanceand diffraction order mixing.
The system is fast and as long as the device deflec-tion is known, which can be achieved with infrequentcalibrations, no laser reference is needed, enablingthe system to be simple and compact. The systemis achromatic and can be made portable. High-speedmeasurements lead to application flexibility with upto 600 measurements per second.
The authors would like to thank all MEMFISproject partners. This work was supported by theMEMFIS Project, funded by the European Commis-sion Seventh Framework Program under grant224151. The authors would also like to thankH. R. Seren for the mechanical device design, theCenter of Micronanotechnology (CMI) at École Poly-technique Fédérale de Lausanne (EPFL) for helpwith the microfabrication, and P. Flückiger and Y.Leblebici from EPFL for support and help.
References1. J. Bates, “Fourier transform infrared spectroscopy,” Science
191, 31–37 (1976).2. R. J. Bell, Introductory Fourier Transform Spectroscopy
(Academic, 1972).3. G. Horlick, “Introduction to Fourier transform spectroscopy,”
Appl. Spectrosc. 22, 617–626 (1968).4. D. Bell, T. Lu, N. Fleck, and S. Spearing, “MEMS actuators
and sensors: observations on their performance and selectionfor purpose,” J. Micromech. Microeng. 15, S153–S164 (2005).
5. H. Fujita, “Microactuators and micromachines,” Proc. IEEE86, 1721–1732 (1998).
6. E. Thielicke and E. Obermeier, “Microactuators and theirtechnologies,” Mechatronics 10, 431–455 (2000).
7. A. A. Michelson, “The relative motion of the Earth andthe luminiferous ether,” Am. J. Sci. 22, 120–129(1881).
8. A. Kenda, S. Lüttjohann, T. Sandner,M.Kraft, A. Tortschanoff,andA.Simon,“AcompactandportableIRanalyzer:progressofaMOEMS FT-IR system for mid-IR sensing,” Proc. SPIE 8032,80320O (2011).
9. M. Kraft, A. Kenda, T. Sandner, and H. Schenk, “MEMS-basedcompact FT-spectrometers—a platform for spectroscopicmid-infrared sensors,” in 2008 IEEE Sensors (IEEE, 2008),pp. 130–133.
10. J. Strong and G. A. Vanasse, “Lamellar grating far-infraredinterferomer,” J. Opt. Soc. Am. 50, 113 (1960).
11. C. Ataman and H. Urey, “Modeling and characterizationof comb-actuated resonant microscanners,” J. Micromech.Microeng. 16, 9–16 (2006).
12. O. Ferhanoglu, H. R. Seren, S. Lüttjohann, and H. Urey,“Lamellar grating optimization for miniaturized fouriertransform spectrometers,” Opt. Express 17, 21289–21301(2009).
13. O. Manzardo, R. Michaely, F. Schädelin,W. Noell, T. Overstolz,N. De Rooij, and H. P. Herzig, “Miniature lamellar gratinginterferometer based on silicon technology,” Opt. Lett. 29,1437–1439 (2004).
14. H. R. Seren, S. Holmstrom, N. P. Ayerden, J. Sharma, and H.Urey, “Lamellar-grating-based MEMS Fourier transformspectrometer,” J. Microelectromech. Syst. 21, 331–339(2012).
15. E. R. Deutsch, D. Reyes, E. R. Schildkraut, and J. Kim, “High-resolution miniature FTIR spectrometer enabled by a largelinear travel MEMS pop-up mirror,” Proc. SPIE 7319,73190J (2009).
16. L. Rayleigh, “XXV. On copying diffraction-gratings, and onsome phenomena connected therewith,” Philos. Mag. 11(67),196–205 (1881).
17. J. Connes and P. Connes, “Near-infrared planetary spectra byFourier spectroscopy. I. Instruments and results,” J. Opt. Soc.Am. 56, 896–910 (1966).
7272 APPLIED OPTICS / Vol. 53, No. 31 / 1 November 2014