
broadband optical access networks
301
-
Upload
khangminh22 -
Category
Documents
-
view
0 -
download
0
Transcript of broadband optical access networks


BROADBAND OPTICALACCESS NETWORKS


BROADBAND OPTICALACCESS NETWORKS
LEONID G. KAZOVSKYNING CHENGWEI-TAO SHAWDAVID GUTIERREZSHING-WA WONG
A JOHN WILEY & SONS, INC., PUBLICATION

Copyright C© 2011 by John Wiley & Sons, Inc. All rights reserved.
Published by John Wiley & Sons, Inc., Hoboken, New Jersey.Published simultaneously in Canada.
No part of this publication may be reproduced, stored in a retrieval system, or transmitted in any form orby any means, electronic, mechanical, photocopying, recording, scanning, or otherwise, except aspermitted under Sections 107 or 108 of the 1976 United States Copyright Act, without either the priorwritten permission of the Publisher, or authorization through payment of the appropriate per-copy fee tothe Copyright Clearance Center, Inc., 222 Rosewood Drive, Danvers, MA 01923, (978) 750-8400,fax (978) 750-4470, or on the web at www.copyright.com. Requests to the Publisher for permissionshould be addressed to the Permissions Department, John Wiley & Sons, Inc., 111 River Street, Hoboken,NJ 07030, (201) 748-6011, fax (201) 748-6008, or online at http://www.wiley.com/go/permission.
Limit of Liability/Disclaimer of Warranty: While the publisher and author have used their best efforts inpreparing this book, they make no representations or warranties with respect to the accuracy orcompleteness of the contents of this book and specifically disclaim any implied warranties ofmerchantability or fitness for a particular purpose. No warranty may be created or extended by salesrepresentatives or written sales materials. The advice and strategies contained herein may not be suitablefor your situation. You should consult with a professional where appropriate. Neither the publisher norauthor shall be liable for any loss of profit or any other commercial damages, including but not limited tospecial, incidental, consequential, or other damages.
For general information on our other products and services or for technical support, please contact ourCustomer Care Department within the United States at (800) 762-2974, outside the United States at(317) 572-3993 or fax (317) 572-4002.
Wiley also publishes its books in a variety of electronic formats. Some content that appears in print maynot be available in electronic format. For more information about Wiley products, visit our web site atwww.wiley.com
Library of Congress Cataloging-in-Publication Data Is Available
Kazovsky, Leonid G.
Broadband optical access networks / Leonid G. Kazovsky, Ning Cheng, Wei-Tao Shaw, DavidGutierrez, Shing-Wa Wong.
Includes index.
ISBN 978-0-470-18235-2
Printed in Singapore
oBook ISBN: 978 0470 910931ePDF ISBN: 978 0470 910924ePub ISBN: 978 0470 922675
10 9 8 7 6 5 4 3 2 1

CONTENTS
FOREWORD xi
PREFACE xiii
ACKNOWLEDGMENTS xv
1 BROADBAND ACCESS TECHNOLOGIES: AN OVERVIEW 1
1.1 Communication Networks / 2
1.2 Access Technologies / 4
1.2.1 Last-Mile Bottleneck / 4
1.2.2 Access Technologies Compared / 5
1.3 Digital Subscriber Line / 6
1.3.1 DSL Standards / 7
1.3.2 Modulation Methods / 8
1.3.3 Voice over DSL / 8
1.4 Hybrid Fiber Coax / 9
1.4.1 Cable Modem / 10
1.4.2 DOCSIS / 10
1.5 Optical Access Networks / 11
1.5.1 Passive Optical Networks / 11
1.5.2 PON Standard Development / 12
1.5.3 WDM PONs / 13
1.5.4 Other Types of Optical Access Networks / 15
v

vi CONTENTS
1.6 Broadband over Power Lines / 18
1.6.1 Power-Line Communications / 18
1.6.2 BPL Modem / 19
1.6.3 Challenges in BPL / 20
1.7 Wireless Access Technologies / 20
1.7.1 Wi-Fi Mesh Networks / 21
1.7.2 WiMAX Access Networks / 22
1.7.3 Cellular Networks / 24
1.7.4 Satellite Systems / 25
1.7.5 LMDS and MMDS Systems / 26
1.8 Broadband Services and Emerging Technologies / 28
1.8.1 Broadband Access Services / 29
1.8.2 Emerging Technologies / 30
1.9 Summary / 31
References / 33
2 OPTICAL COMMUNICATIONS: COMPONENTSAND SYSTEMS 34
2.1 Optical Fibers / 35
2.1.1 Fiber Structure / 35
2.1.2 Fiber Mode / 38
2.1.3 Fiber Loss / 45
2.1.4 Fiber Dispersion / 47
2.1.5 Nonlinear Effects / 52
2.1.6 Light-Wave Propagation in Optical Fibers / 54
2.2 Optical Transmitters / 55
2.2.1 Semiconductor Lasers / 55
2.2.2 Optical Modulators / 66
2.2.3 Transmitter Design / 71
2.3 Optical Receivers / 72
2.3.1 Photodetectors / 73
2.3.2 Optical Receiver Design / 76
2.4 Optical Amplifiers / 78
2.4.1 Rare-Earth-Doped Fiber Amplifiers / 81
2.4.2 Semiconductor Optical Amplifiers / 83
2.4.3 Raman Amplifiers / 85
2.5 Passive Optical Components / 86
2.5.1 Directional Couplers / 86
2.5.2 Optical Filters / 89

CONTENTS vii
2.6 System Design and Analysis / 93
2.6.1 Receiver Sensitivity / 93
2.6.2 Power Budget / 98
2.6.3 Dispersion Limit / 99
2.7 Optical Transceiver Design for TDM PONs / 101
2.7.1 Burst-Mode Optical Transmission / 102
2.7.2 Colorless ONUs / 104
2.8 Summary / 106
References / 107
3 PASSIVE OPTICAL NETWORKS: ARCHITECTURESAND PROTOCOLS 108
3.1 PON Architectures / 109
3.1.1 Network Dimensioning and Bandwidth / 110
3.1.2 Power Budget / 110
3.1.3 Burst-Mode Operation / 112
3.1.4 PON Packet Format and Encapsulation / 113
3.1.5 Dynamic Bandwidth Allocation, Ranging,and Discovery / 114
3.1.6 Reliability and Security Concerns / 114
3.2 PON Standards History and Deployment / 115
3.2.1 Brief Developmental History / 115
3.2.2 FTTx Deployments / 116
3.3 Broadband PON / 117
3.3.1 BPON Architecture / 118
3.3.2 BPON Protocol and Service / 121
3.3.3 BPON Transmission Convergence Layer / 125
3.3.4 BPON Dynamic Bandwidth Allocation / 130
3.3.5 Other ITU-T G.983.x Recommendations / 133
3.4 Gigabit-Capable PON / 133
3.4.1 GPON Physical Medium–Dependent Layer / 134
3.4.2 GPON Transmission Convergence Layer / 137
3.4.3 Recent G.984 Series Standards, Revisions, andAmendments / 142
3.5 Ethernet PON / 144
3.5.1 EPON Architecture / 144
3.5.2 EPON Point-to-Multipoint MAC Control / 147
3.5.3 Open Implementations in EPON / 152
3.5.4 Unresolved Security Weaknesses / 155

viii CONTENTS
3.6 IEEE 802.av-2009 10GEPON Standard / 156
3.6.1 10GEPON PMD Architecture / 156
3.6.2 10GEPON MAC Modifications / 158
3.6.3 10GEPON Coexistence Options / 161
3.7 Next-Generation Optical Access System Developmentin the Standards / 162
3.7.1 FSAN NGA Road Map / 162
3.7.2 Energy Efficiency / 163
3.7.3 Other Worldwide Development / 164
3.8 Summary / 164
References / 165
4 NEXT-GENERATION BROADBAND OPTICALACCESS NETWORKS 166
4.1 TDM-PON Evolution / 167
4.1.1 EPON Bandwidth Enhancements / 168
4.1.2 GPON Bandwidth Enhancements / 168
4.1.3 Line Rate Enhancements Research / 169
4.2 WDM-PON Components and Network Architectures / 172
4.2.1 Colorless ONUs / 173
4.2.2 Tunable Lasers and Receivers / 174
4.2.3 Spectrum-Sliced Broadband Light Sources / 176
4.2.4 Injection-Locked FP Lasers / 178
4.2.5 Centralized Light Sources with RSOAs / 179
4.2.6 Multimode Fiber / 181
4.3 Hybrid TDM/WDM-PON / 184
4.3.1 TDM-PON to WDM-PON Evolution / 184
4.3.2 Hybrid Tree Topology Evolution / 186
4.3.3 Tree to Ring Topology Evolution / 195
4.4 WDM-PON Protocols and Scheduling Algorithms / 202
4.4.1 MAC Protocols / 203
4.4.2 Scheduling Algorithms / 204
4.5 Summary / 211
References / 211
5 HYBRID OPTICAL WIRELESS ACCESS NETWORKS 216
5.1 Wireless Access Technologies / 217
5.1.1 IEEE 802.16 WiMAX / 217
5.1.2 Wireless Mesh Networks / 225

CONTENTS ix
5.2 Hybrid Optical–Wireless Access Network Architecture / 241
5.2.1 Leveraging TDM-PON for Smooth Upgrade of HierarchicalWireless Access Networks / 242
5.2.2 Upgrading Path / 244
5.2.3 Reconfigurable Optical Backhaul Architecture / 247
5.3 Integrated Routing Algorithm for Hybrid Access Networks / 258
5.3.1 Simulation Results and Performance Analysis / 260
5.4 Summary / 262
References / 263
INDEX 267

FOREWORD
Broadband optical access networks are crucial to the future development of theInternet. The continuing evolution of high-capacity, low-latency optical access net-works will provide users with real-time high-bandwidth access to the Web essentialfor such emerging trends as immersive video communications and ubiquitous cloudcomputing. These ultrahigh-speed access networks must be built under challengingeconomic and environmental imperatives to be “faster, cheaper, and greener.” Thisbook presents in a clear and illustrative format the technical and scientific conceptsthat are needed to accomplish the design of new broadband access networks uponwhich users will surf the wave of the twenty-first-century Internet.
The book is coauthored by Professor Leonid Kazovsky and his graduate stu-dents. Professor Kazovsky is a recognized leader and authority in the field and hasa long and distinguished track record for making highly timely and significant re-search contributions within the general area of optical communication systems andoptical networks. He has contributed over the last 40 years in the areas of wavelength-division-multiplexed (WDM) and coherent transmission systems for the core networkas well as transmission systems and network architectures and technologies at themetro and access levels. This book builds on Professor Kazovsky’s research con-ducted at Bellcore (where he worked in the 1980s), at Stanford University (where hehas worked since 1990), and at numerous European research organizations duringsabbaticals in the UK, the Netherlands, Italy, Denmark, and (most recently) Sweden.This rich set of influences gives the book and its readers the benefits of broad exposureto diverse research ideas and approaches.
Professor Kazovsky heads the Photonics and Networking Research Laboratoryat Stanford University. He and his team of researchers are focusing on broadbandoptical access networks. They bring their ongoing research results to this unique
xi

xii FOREWORD
book, bridging fundamentals of optical communication and networking system designwith technology issues and current standards. Once that foundation is laid, the bookdelves into current high-capacity research issues, including evolution to WDM opticalaccess, converged hybrid optical/wireless access networks, and implementation issuesof broadband optical access. Research ideas generated by Professor Kazovsky’sresearch group have been widely adopted worldwide, including in framework projectsof the European Union.
We strongly recommend this book, as it offers timely, accurate, authoritative,and innovative information regarding broadband optical access network design andimplementation. We’re confident that you will enjoy reading the book and learn muchwhile doing so.
Daniel Kilper and Peter VetterAlcatel-Lucent Bell Labs, Murray Hill, New Jersey
James F. KellyGoogle, Mountain View, California
Alan WillnerUSC Viterbi School of Engineering, Los Angeles, California
Biswanath MukherjeeUniversity of California Davis, Davis, California
Anders Berntson, Gunnar Jacobsen, and Mikhail PopovAcreo, Stockholm, Sweden

PREFACE
The roots of this book were planted about a decade ago. At that time, I becameincreasingly convinced that wide-area and metropolitan-area networks, where muchof my group’s research has been centered at that time, were in good shape. Althoughresearch in these fields was (and still is) needed, that’s not where the networkingbottleneck seemed to be. Rather, the bottleneck was (and still is in many places) inthe access networks, which choked users’ access to information and services. It wasclear to me that the long-term solution to that problem has to involve optical fiberaccess networks.
That conviction led me to switch the focus of my group’s research to opticalaccess networks. In turn, that decision led to a decade of exciting exceptionallyinteresting research into the many challenges facing modern access networks. Thesechallenges include rapidly increasing demands for larger bandwidth and better qualityof service, graceful evolution to more powerful solutions without complete rebuildingof existing infrastructure, enhancing network range and number of users, improvingaccess networks’ resilience, simplifying network architecture, finding better controlstrategies, and solving the problem of fiber/wireless integration. All these problemswould have to be solved while maintaining the economic viability of access networksso that operators would be prepared to make the necessary (and huge) investment infiber and other infrastructure.
Finding solutions for the foregoing problems occupied most of my research group’stime and attention for much of the past decade. In the beginning of that decade (andfor a long time after that), my group, the Photonics and Networking Research Labo-ratory (PNRL) at Stanford University, was one of very few (or perhaps even the only)university research group working on fiber access, as many other optical researcherstended to discount optical access issues as trivial. Although that made funding for our
xiii

xiv PREFACE
research difficult to find, that position allowed us to make many pioneering contribu-tions widely used and cited today. Later, many other university and industrial researchgroups entered the field, and several large-scale research efforts were organized, mostnotably in Europe, where serious research into both passive optical networks (PONs)and active optical networks (AONs) has been conducted over the last several years.Notable European efforts in broadband fiber access include ICT ALPHA (architec-tures for flexible photonic home and access networks, focused on AON, PON, andtechnoeconomics), ICT OASE (optical access seamless evolution, focused on PON,technoeconomics, and business models) and ICT SARDANA (focused on PON andoptical metropolitan networks). These efforts resulted in extremely fast progress inthe field. It was gratifying to see many PNRL research results adopted, used, anddeveloped further by these (and other) efforts, especially in SARDANA.
Many of my colleagues working on optical access research encouraged me overthe past few years to integrate results of the PNRL research on optical access networksinto a single volume and publish it to ensure the broadest possible dissemination ofour results. They feel that our results, when published in a single volume rather thanthe current combination of conference and journal articles, will further stimulate newresearch, plant new ideas, and lead to exciting new developments.
For a long while, I was reluctant to do so. The field of broadband fiber accessnetworks is exceptionally broad; in addition, it is still very young and is developingand changing very fast. Thus, writing a comprehensive book on this subject is (nearly)impossible. Eventually, though, a stream of inquiries for additional information aboutour research convinced me to change my mind, and my research students and myselfbegan the time-consuming process of writing our book.
Our goal was fairly modest: to summarize in one place the research results pro-duced by the PNRL over the past decade or so. The reader should keep this goal inmind. We make no attempt to cover the entire field, just to provide a summary of ourresearch. Even that goal proved to be difficult to achieve, as we are continuing ourresearch as new technologies emerge, so our understanding of the field continues toevolve with time. However, we trust that the reader will consider this book a usefuladdition to his or her knowledge base of optical access networks.
Leonid KazovskyStanford UniversityStanford, California

ACKNOWLEDGMENTS
This book is based on research results obtained by our research group, the Photonicsand Networking Research Laboratory at Stanford University. Our research on broad-band fiber access networks, conducted over a decade or so, required a consistent effortby a large group of exceptionally talented graduate students, postdocs, and visitors.Some of these contributors are co-authors of the book, while others are workingin other organizations and on other projects and so were too busy to help with thebook-writing process. We are thankful to all of them, however.
Our research on broadband fiber access networks required a sizable team and asubstantial amount of experimental, theoretical, and simulation efforts. This wouldbe impossible without the generous and long-term support of our sponsors. We aregrateful to our sponsors, who trusted us with the necessary resources. Our mainsponsors in that area were, or are, the National Science Foundation under grants0520291 and 0627085, KDDI Laboratories, Motorola, the Stanford Networking Re-search Center (no longer in existence), ST Microelectronics, ANDevices, Huawei,Deutsche Telecom, and Alcatel-Lucent Bell Laboratories.
We also thank the many research visitors to our group (mainly postdocs or visitingprofessors), who helped in a variety of ways, ranging from making research contribu-tions to our book, to providing suggestions and comments on its contents, to takingpart in one or more of our broadband access research projects. In particular, we aregrateful to Dr. Kyeong Soo (Joseph) Kim of Swansea University; Professor ChunmingQiao of SUNY Buffalo; Dr. Luca Valcarenghi of Scuola Superiore Sant’Anna , Italy;Professor David Larrabeiti of Universidad Carlos III de Madrid, Madrid, Spain; andDr. Divanilson Campelo of University of Brasilia, Brazil. Many others helped as well;unfortunately, a comprehensive list would be too long to include here.
xv

xvi ACKNOWLEDGMENTS
We are grateful to the challenging, exciting research environment at StanfordUniversity, where the lead author of this book has had the pleasure of working for thepast two decades. Without that environment, this book would never have materialized.
Last but not least, we would like to thank our many colleagues all over the worldfor stimulating discussions, for their friendship, and for their help. We are particularlygrateful to Prof. Vincent Chan, MIT; Prof. Alan Willner, USC; Drs. James Kelly andCedric Lam of Google, Inc.; Prof. Andrea Fumagali, University of Texas; Profs. BenYoo and Biswanath Mukherjee, University of California, Davis; Profs. Djan Khoe andDr. Harm of the Technical University of Eindoven, the Netherlands; Prof. GiancarloPrati of the Scuola Superiore St. Anna, Pisa, Italy; Prof. Palle Jeppesen of the DanishTechnical University, Copenhagen, Denmark; Drs. Gunnar Jacobsen, Mikhail Popov,and Claus Larsen of Acreo, Stockholm, Sweden; Dr. Shu Yamamoto of KDDI, Japan;and Dr. Frank Effenburger of Huawei.
Leonid KazovskyNing Cheng
Wei-Tao ShawDavid GutierrezShing-Wa Wong
Stanford UniversityStanford, California

CHAPTER 1
BROADBAND ACCESSTECHNOLOGIES: AN OVERVIEW
In past decades we witnessed the rapid development of global communication infras-tructure and the explosive growth of the Internet, accompanied by ever-increasing userbandwidth demands and emerging multimedia applications. These dramatic changesin technologies and market demands, combined with government deregulation andfierce competition among data, telcom, and CATV operators, have scrambled the con-ventional communication services and created new social and economic challengesand opportunities in the new millennium. To meet those challenges and competi-tions, current service providers are striving to build new multimedia networks. Themost challenging part of current Internet development is the access network. As anintegrated part of global communication infrastructure, broadband access networksconnect millions of users to the Internet, providing various services, including inte-grated voice, data, and video. As bandwidth demands for multimedia applicationsincrease continuously, users require broadband and flexible access with higher band-width and lower cost. A variety of broadband access technologies are emerging tomeet those challenging demands. While broadband communication over power linesand satellites is being developed to catch the market share, DSL (digital subscriberline) and cable modem continue to evolve, allowing telecom and CATV companiesto provide high-speed access over copper wires. In the meantime, FTTx and wirelessnetworks have become a very promising access technologies. The convergence ofoptical and wireless technologies could be the best solution for broadband and mo-bile access service in the future. As new technology continues to be developed, thefuture access technology will be more flexible, faster, and cheaper. In this chapter
Broadband Optical Access Networks, First Edition. Leonid G. Kazovsky, Ning Cheng, Wei-Tao Shaw,David Gutierrez, and Shing-Wa Wong.C© 2011 John Wiley & Sons, Inc. Published 2011 by John Wiley & Sons, Inc.
1

2 BROADBAND ACCESS TECHNOLOGIES: AN OVERVIEW
we discuss current access network scenarios and review current and emerging broadaccess technologies, including DSL, cable modem, optical, and wireless solutions.
1.1 COMMUNICATION NETWORKS
Since the development of telegraph and telephone networks in the nineteenth century,communication networks have come a long way and evolved into a global infrastruc-ture. More than ever before, communications and information technologies pervadeevery aspect of our lives: our homes, our workplaces, our schools, and even ourbodies. As part of the fundamental infrastructure of our global village, communi-cation networks has enabled many other developments—social, economic, cultural,and political—and has changed significantly how people live, work, and interact.
Today’s global communication network is an extremely complicated system andcovers a very large geographic area, all over the world and even in outer space. Sucha complicated system is built and managed within a hierarchical structure, consistingof local area, access area, metropolitan area, and wide area networks (as shown inFigure 1.1). All the network layers cooperate to achieve the ultimate task: anyone,anywhere, anytime, and any media communications.
Local Area Networks Local area networks (LANs) mainly connect computers andother electronic devices (servers, printers, etc.) within an office, a single building, or afew adjacent buildings. Therefore, the geographical coverage of LANs is very small,spanning from a few meters to a few hundred meters. LANs are generally not a partof public networks but are owned and operated by private organizations. Common
FIGURE 1.1 Hierarchical architecture of global communication infrastructure.

COMMUNICATION NETWORKS 3
topologies for LANs are bus, ring, star, or tree. The most popular LANs are parts ofthe Ethernet, supporting a few hundred users with typical bit rates of 10 or 100 Mb/s.
Access Networks The computers and other communication equipment of a privateorganization are usually connected to a public telecommunication networks throughaccess networks. Access networks bridge end users to service providers through twistpairs (phone line), coaxial cables, or other leased lines (such as OC3 through opticalfiber). The typical distance covered by an access network is a few kilometers up to20 km. For personal users, access networks use DSL or cable modem technologywith a transmission rate of a few megabits per second; for business users, networksemploy point-to-point fiber links with hundreds of megabits or gigabits per second.
Metropolitan Area Networks Metropolitan area networks (MANs) aggregate thetraffic from access networks and transport the data at a higher speed. A typical areacovered by a MAN spans a metropolitan area or a small region in the countryside.Its topology is usually a fiber ring connecting multiple central offices, where thetransmission data rate is typically 2.5 or 10 Gb/s.
Wide Area Networks Wide area networks (WANs) carry a large amount of trafficamong cities, countries, and continents. MAN multiplexes traffic from LANs andtransports the aggregated traffic at a much higher data rate, typically tens of gigabitsper second or higher using wavelength-division multiplexing (WDM) technologyover optical fibers. Whereas a WAN covers the area of a nation or, in some cases,multiple nations, a link or path through a MAN could be as long as a few thousandkilometers. Beyond MANs, submarine links connect continents. Generally, the sub-marine systems are point-to-point links with a large capacity and an extremely longpath, from a few thousand up to 10,000 km. Because these links are designed forultralong distances and operate under the sea, the design requirements are much morestringent than those of their terrestrial counterparts. Presently, submarine links aredeployed across the Pacific and Atlantic oceans. Some shorter submarine links arealso widely used in the Mediterranean, Asian Pacific, and African areas.
Service Convergence Historically, communication networks provide mainlythree types of service: voice, data, and video (triple play). Voice conversation us-ing plain old telephony is a continuous 3.4-kHz analog signal carried by two-way,point-to-point circuits with a very stringent delay requirement. The standard TV sig-nal is a continuous 6-MHz analog signal usually distributed with point-to-multipointbroadcasting. Data transmission is typically bursty with varying bandwidth and de-lay requirements. Because the traffic characteristics of voice, data, and video andtheir corresponding requirements as to quality of service (QoS) are fundamentallydifferent, three major types of networks were developed specifically to render theseservices in a cost-effective manner: PSTN (public-switched telephone networks) forvoice conversation, HFC (hybrid fiber coax) networks for video distribution, and theInternet for data transfer. Although HFC networks are optimized for video broad-casting, the inherent one-way communication is not suitable for bidirectional data or

4 BROADBAND ACCESS TECHNOLOGIES: AN OVERVIEW
voice. PSTN adopts circuit switching technology to carry information with specificbandwidth or data rates, such as voice signals. However, circuit-switched networksare not very efficient for carrying bursty data traffic. With packet switching, theInternet can support bursty data transmission, but it is very difficult to meet stringentdelay requirements for certain applications. Therefore, no single network can satisfyall the service requirements.
Emerging multimedia applications such as video on demand, e-learning, and inter-active gaming require simultaneous transmission of voice, data, and video. Driven byuser demands and stiff competition, service providers are moving toward a convergednetwork for multimedia applications, which will utilize Internet protocol (IP) tech-nologies to provide triple-play services. As VoIP (voice over IP) has been developedin the past few years and more recently IP TV has become a mature technology,all network services will converge into an IP-based service platform. Furthermore,the integration of optical and wireless technologies will make quadruple play (voice,data, video, and mobility) a reality in the near future.
1.2 ACCESS TECHNOLOGIES
Emerging multimedia applications continuously fuel the explosive growth of theInternet and gradually pervade every area of our lives, from home to workplace. Toprovide multimedia service to every home and every user, access networks are builtto connect end users to service providers. The link between service providers andend users is often called the last mile by service providers, or from an end user’sperspective, the first mile. Ideally, access networks should be a converged platformcapable of supporting a variety of applications and services. Through broadbandaccess networks, integrated voice, data, and video service are provided to end users.However, the reality is that access networks are the weakest links in the currentInternet infrastructure. While national information highways (WANs and MANs)have been developed in most parts of the globe, ramps and access routes to theseinformation highways (i.e., the first/last mile) are mostly bike lanes or at best, unpavedroads, causing traffic congestion. Hence, pervasive broadband access should be anational imperative for future Internet development. In this section we review currentaccess scenarios and discuss the last-mile bottleneck and its possible solutions.
1.2.1 Last-Mile Bottleneck
Due to advances in photonic technologies and worldwide deployment of opticalfibers, during the last decade the telecommunication industry has experienced an ex-traordinary increase in transmission capacity in core transport networks. Commercialsystems with 1-Tb/s transmission can easily be implemented in the field, and thestate-of-the-art fiber optical transmission technology has reached 10 Tb/s in a singlefiber. In the meanwhile, at the user end, the drastic improvement in the performanceof personal computers and consumer electronic devices has made possible expand-ing demands of multimedia services, such as video on demand, video conferencing,

ACCESS TECHNOLOGIES 5
TABLE 1.1 Multimedia Applications and Their Bandwidth Requirements
Application Bandwidth Latency Other Requirements
Voice over IP (VoIP) 64 kb/s 200 ms ProtectionVideoconferencing 2 Mb/s 200 ms ProtectionFile sharing 3 Mb/s 1 sSDTV 4.5 Mb/s/ch 10 s MulticastingInteractive gaming 5 Mb/s 200 msTelemedicine 8 Mb/s 50 ms ProtectionReal-time video 10 Mb/s 200 ms Content distributionVideo on demand 10 Mb/s/ch 10 s Low packet lossHDTV 10 Mb/s/ch 10 s MulticastingNetwork-hosted software 25 Mb/s 200 ms Security
e-learning, interactive games, VoIP, and others. Table 1.1 lists common end-user ap-plications and their bandwidth requirements. As a result of the constantly increasingbandwidth demand, users may require more than 50 Mb/s in the near future. However,the current copper wire technologies bridging users and core networks have reachedtheir fundamental bandwidth limits and become the first-last-mile bottleneck. Delaysin Web page browsing, data access, and audio/video clip downloading have earnedthe Internet the nickname “World Wide Wait.” How to alleviate this bottleneck hasbeen a very challenging task for service providers.
1.2.2 Access Technologies Compared
For broadband access services, there is strong competition among several technolo-gies: digital subscriber line, hybrid fiber coax, wireless, and FTTx (fiber to the x,x standing for home, curb, neighborhood, office, business, premise, user, etc.). Forcomparison, Table 1.2 lists the bandwidths (per user) and reaches of these com-peting technologies. Currently, dominant broadband access technologies are digital
TABLE 1.2 Comparison of Bandwidth and Reach for Popular Access Technologies
Service Medium Downstream (Mb/s) Upstream (Mb/s) Max Reach (km)
ADSL Twisted pair 8 0.896 5.5ADSL2 Twisted pair 15 3.8 5.5VDSL1 Twisted pair 50 30 1.5VDSL2 Twisted pair 100 30 0.5HFC Coax cable 40 9 25
BPON Fiber 622 155 20GPON Fiber 2488 1244 20EPON Fiber 1000 1000 20
Wi-Fi Free space 54 54 0.1WiMAX Free space 134 134 5

6 BROADBAND ACCESS TECHNOLOGIES: AN OVERVIEW
subscriber loop and coaxial cable. For conventional ADSL (asymmetric DSL) tech-nology, the bandwidth available is a few Mb/s within the 5.5-km range. Newer VDSL(very high-speed DSL) can provide 50 Mb/s, but the maximum reach is limited to1.5 km. On the other hand, coaxial cable has a much larger bandwidth than twistpairs, which can be as high as 1 Gb/s. However, due to the broadcast nature of CATVsystem, current cable modems can provide each user with an average bandwidth of afew Mb/s. While DSL and cable provide wired solutions for broadband access, Wi-Fi(wireless fidelity), and WiMAX (worldwide interoperability for microwave access)provide mobile access in a LAN or MAN network. Even though a nominal band-width of Wi-Fi and WiMAX can be relatively higher (54 Mb/s in 100 m for Wi-Fi and28 Mb/s in 15 km for WiMAX), the reach of such wireless access is very limited andthe actual bandwidth provided to users can be much lower, due to the interference inwireless channels. As a LAN technology, the primary use of Wi-Fi is in home and of-fice networking. To reach the central office or service provider, multiple-hop wirelesslinks with WiMAX have to be adopted. An alternative technology that is also underdevelopment is MBWA (mobile broadband wireless access, IEEE 802.20), which isvery similar to WiMAX (IEEE 802.16e). Compared to the fixed access solutions,the advantages of the wireless technologies are easy deployment and ubiquitous ormobile access, and the disadvantages are unreliable bandwidth provisioning and/orlimited access range.
The bandwidth and/or reach of the copper wire and wireless access technology isvery limited due to the physical media constraints. To satisfy the future use demand(>30 Mb/s), there is a strategic urgency for service providers to deploy FTTx net-works. Currently, for cost and deployment reasons, FTTx is competing with otheraccess technologies. Long term, however, only optical fiber can provide the unlim-ited capacity and performance that will be required by future broadband services.FTTx has long been dubbed as a future-proof technology for the access networks.A number of optical access network architectures have been standardized (APON,BPON, EPON, and GPON), and cost-effective components and devices for FTTxhave matured. We are currently witnessing a worldwide deployment of optical accessnetworks and a steady increase in FTTx users.
1.3 DIGITAL SUBSCRIBER LINE
Digital subscriber line (also called digital subscriber loop) is a family of accesstechnologies that utilize the telephone line (twisted pair) to provide broadband accessservice. While the audio signal (voice) carried by a telephony system is limited from300 to 3400 Hz, the twisted pair connecting the users to the central office is capableof carrying frequencies well beyond the 3.4-kHz upper limit of the telephony system.Depending on the length and the quality of the twisted pair, the upper limit canextend to tens of megahertz. DSL takes advantage of this unused bandwidth andtransmits data using multiple-frequency channels. Thus, some types of DSL allowsimultaneous use of the telephone and broadband access on the same twisted pair.

DIGITAL SUBSCRIBER LINE 7
Modem
CentralOffice
FIGURE 1.2 DSL access networks.
Figure 1.2 shows the typical setup of a DSL configuration. At the central office, aDSLAM (DSL access multiplexer) sends the data to users via downstream channels.At the user side, a DSL modem functions as a modulator/demodulator (i.e., receivesdata from DSLAM and modulates user data for upstream transmission).
1.3.1 DSL Standards
DSL comes in different flavors, supporting various downstream/upstream bit rates andaccess distances. DSL standards are defined in ANSI T1, and ITU-T RecommendationG.992/993. Table 1.2 lists various DSL standards and their performance. Collectively,these DSL technologies are referred to as xDSL. Two commonly deployed DSLstandards are ADSL and VDSL.
As its name suggests, ADSL supports asymmetrical transmission. Since the typicalratio of traffic asymmetry is about 2 : 1 to 3 : 1, ADSL becomes a popular choice forbroadband access. In addition, there is more crosstalk from other circuits at theDSLAM end. As the upload signal is weak at the noisy DSLAM end, it makes sensetechnically to have upstream transmission at a lower bit rate. Depending on the lengthand quality (such as the signal-to-noise ratio) of the twisted pair, the downstream bitrate can be as high as 10 times the upstream transmission. The maximum reach ofADSL is 5500 m. While ADSL1 can support a downstream bit rate up to 8 Mb/s andan upstream data rate up to 896 kb/s, ADSL2 supports up to 15 Mb/s downstreamand 3.8 Mb/s upstream.
To support higher bit rates, the VDSL standard was developed after ADSL. Tradingtransmission distance for data rate, VDSL can support a much higher data rate but withvery limited reach. VDSL1 standards specify data rates of 50 Mb/s for downstreamand 30 Mb/s for upstream transmission. The maximum reach of VDSL1 is limitedto 1500 m. The newer version of VDSL standards, VDSL2, is an enhancement of

8 BROADBAND ACCESS TECHNOLOGIES: AN OVERVIEW
VDSL1, supporting a data rate up to 100 Mb/s (with a transmission distance of500 m). At 1 km, the bit rate will drop to 50 Mb/s. For reaches longer than 1.6 km,the VDSL2 performance is close to ADSL. Because of its higher data rates andADSL-like long reach performance, VDSL2 is considered to be a very promisingsolution for upgrading existing ADSL infrastructure.
ADSL and VDSL are designed for residential subscribers with asymmetric band-width demands. For business users, symmetrical connections are generally required.Two symmetrical DSL standards, HDSL and SHDSL, are developed for business cus-tomers. While HDSL supports a T1 line data rate at 1.552 Mb/s (including 8 kb/s ofoverhead) with a reach of about 4000 m, SHDSL can provide a 6.696-Mb/s data ratewith a maximum reach of 5500 m. However, HDSL and SHDSL do not support si-multaneous telephone service, as most business customers do not have a requirementfor a simultaneous voice circuit.
1.3.2 Modulation Methods
DSL uses a DMT (discrete multitone) modulation method. In DMT modulation,complex-to-real inverse discrete Fourier transform is used to partition the availablebandwidth of the twisted pair into 256 orthogonal subchannels. DMT is adaptive tothe quality of the twisted pair, so all the available bandwidth is fully utilized. Thesignal-to-noise ratio of each subchannel is monitored continuously. Based on thenoise margin and bit error rate, a set of subchannels are selected, and a block of databits are mapped into subchannels. In each subchannel, QAM (quadrature amplitudemodulation) with a 4-kHz symbol rate is used to modulate the bit stream onto asubcarrier, leading to 60 kb/s per channel. Typically, the frequency range between 25and 160 kHz is used for upstream transmission, and 140 kHz to 1.1 MHz is used fordownstream transmission.
1.3.3 Voice over DSL
DSL was designed originally to carry data over phone lines, and DSL signal isseparated from voice signal. Recently, new protocols have been proposed to mergevoice and data at the circuit level. With advanced coding technologies, a 64-kb/sdigitized voice signal can be compressed to 8 kb/s or less, thus allowing more voicechannels to be carried over the same phone line. A voice over a DSL (VoDSL)gateway converts and compresses the analog voice signal to digital bit streams, sothat calls made over VoDSL are indistinguishable from conventional calls. Usually,12 to 20 voice channels can be carried over a single DSL line, depending on thetransmission distance and the signal quality. A VoDSL system can be integratedinto higher-layer protocols such as IP and ATM. Early DSL networks used ATMto ensure QoS, where ATM virtual circuits were used for the voice traffic. ADSLand VDSL networks migrate to packet-based transport, and they use packet-switchedbased virtual circuits instead of ATM ones.

HYBRID FIBER COAX 9
1.4 HYBRID FIBER COAX
Cable networks were originally developed for a very simple reason: TV signal dis-tribution. Therefore, cable networks are optimized for one-way, point-to-multipointbroadcasting of analog TV signals. As optical communication systems were devel-oped, most cable TV systems have gradually been upgraded to hybrid fiber coax(HFC) networks, eliminating numerous electronic amplifiers along the trunk line.However, before cable access technology can be deployed, a return pass must beimplemented for upstream traffic. To support two-way communication, bidirectionalamplifiers have to be used in HFC systems, where filters are deployed to split theupstream (forward) and downstream (reverse) signals for separate amplification.
Figure 1.3 presents the network architecture of a typical HFC network. In HFCnetworks, analog TV signals are carried from the cable headend to distribution nodesusing optical fibers, and from the distribution node, coaxial cable drops are deployedto serve 500 to 2000 subscribers. As shown in the figure, an HFC network is a sharedmedium system with a tree topology. In such a topology, multiple users share the sameHFC infrastructure, so medium access control is required in upstream transmissionwhile downstream transmission uses a broadcast scheme. A cable modem deployedat the subscriber end provides data connection to the cable network, while at theheadend, the cable modem termination system connects to a variety of data serversand provides service to subscribers.
Compared with the twisted pairs in a telephone system, coaxial cables have a muchhigher bandwidth (1000 MHz), thus can support a much higher data rate. Dependingon the signal-to-noise ratio on the coaxial cable, 40 Mb/s can be delivered to theend users with QAM modulation. For upstream transmission, QPSK can deliver upto a 10-Mb/s data rate. However, as cable systems are shared-medium networks, thebandwidth is thus shared by all the cable modems connected to the network. Bycontrast, DSL uses dedicated twist pairs for each user, thus no bandwidth sharingfor different users. Furthermore, as the transmission bandwidth must be shared bymultiple users, medium access control protocol must be deployed to govern upstreamtransmission. If congestion occurs in a specific channel, the headend must be able toinstruct cable modems to tune its receiver to a different channel.
Primaryhub
Masterheadend
Secondaryhub
Fibernode
RF amplifier
FIGURE 1.3 HFC access networks.

10 BROADBAND ACCESS TECHNOLOGIES: AN OVERVIEW
1.4.1 Cable Modem
Cable modems were developed to transport high-speed data to and from end usersin an HFC network. Traditional TV broadcasting occupies frequencies up to 1 GHz,with each TV channel occupying 6 MHz of bandwidth (Part 76 in the FCC rules). Acable modem uses two of those 6-MHz channels for data transmission. For upstreamtransmission, a cable modem sends user data to the headend using a 6-MHz bandbetween 5 and 42 MHz. At the same time, the cable modem must tune its receiver toa 6-MHz band within a 450- to 750-MHz band to receive downstream data. While aQAM modulation scheme is used for downstream data, a QPSK modulation schemeis usually selected for upstream transmission, as it is more immune to the interferenceresulting from radio broadcasting.
1.4.2 DOCSIS
DOCSIS (Data Over Cable Service Interface Specifications), developed by Cable-Labs, a consortium of equipment manufactuers, is the current standard for cable accesstechnology. DOCSIS defines the functionalities and properties of cable modems at asubscriber’s premises and cable modem termination systems at the headend. As itsname suggests, DOCSIS specifies the physical layer characteristics, such as trans-mission frequency, bit rate, modulation format, and power levels, of cable modemand cable modem termination systems, but also the data link layer protocol, such asframe structure, medium access control, and link security. Three different versions ofDOCSIS (1.0/2.0/3.0) was developed during the past decade and were later ratifiedas ITU-T Recommendation J.112, J.122, and J.222. Although some compromise isneeded as cable networks are a shared medium, DOCSIS offers various classes ofservice with medium access control. Such QoS features in DOCSIS can supportapplications (such as VoIP) that have stringent delay or bandwidth requirements.
Physical Layer The upstream PMD layer supports two modulation formats: QPSKand 16-QAM, and the downstream PMD layers uses 64-QAM and 256-QAM. Thenominal symbol rate is 0.16, 0.32, 0.64, 1.28, 2.56, or 5.12 Mbaud. Therefore, themaximum downstream data rate is about 40 Mb/s and the upstream data rate isabout 20 Mb/s. To mitigate the effect of noise and other detrimental channel effects,Reed–Solomon encoding, transmitter equalizer, and variable interleaving schemesare commonly used.
Data Link Layer The DOCSIS data link layer specifies frame structure, MAC, andlink security. The frame structure used in HFC networks is very similar to the Ethernetin both the upstream and downstream directions. For the downstream direction, dataframes are embedded in 188-byte MPEG-2 (ITU-T H.222.0) packets with a 4-byteheader followed by 184 bytes of payload. Downstream uses TDM transmissionschemes, synchronous to all modems. In the upstream direction, TDMA or S-CDMAare defined for medium access control. An upstream packet includes physical layeroverhead, a unique word, MAC overhead, packet payload, and FEC bytes. MAC

OPTICAL ACCESS NETWORKS 11
layer specifications also include modem registration, ranging, bandwidth allocation,collision detection and contention resolution, error detection, and data recovery. Anaccess security mechanism in DOCSIS defines a baseline privacy interface, securitysystem interface, and removable security module interface, to ensure informationsecurity in HFC networks.
1.5 OPTICAL ACCESS NETWORKS
Due to their ultrahigh bandwidth and low attenuation, optical fibers have been widelydeployed for wide area networks and metro area networks. To some extent, mul-timode fibers were also deployed in office buildings for local area networks. Eventhough optical fibers are ideal media for high-speed communication systems and net-works, the deployment cost was considered prohibitive in the access area, and copperwires still dominate in the current marketplace. However, as discussed in Section 1.2,emerging multimedia applications have created such large bandwidth demands thatcopper wire technologies have reached their bandwidth limits. Meanwhile, low-costphotonic components and passive optical network architecture have made fiber avery attractive solution. In the past few years, various PON architecture and tech-nologies have been studied by the telecom industry, and a few PON standards havebeen approved by ITU-T and IEEE. FTTx becomes a mature technology in directcompetition with copper wires. In fact, large-scale deployment has started in Asia,North America, and Europe, and millions of subscribers are enjoying the benefit ofPON technologies.
1.5.1 Passive Optical Networks
Figure 1.4 illustrates the architecture of a passive optical network. As the nameimplies, there is no active component between the central office and the user premises.Active devices exist only in the central office and at user premises. From the centraloffice, a standard single-mode optical fiber (feeder fiber) runs to a 1 : N passive opticalpower splitter near the user premises. The output ports of the passive splitter connectsto the subscribers through individual single-mode fibers (distribution fibers). Thetransmission distance in a passive optical networks is limited to 20 km, as specifiedin current standards. The fibers and passive components between the central office andusers premises are commonly called an optical distribution network. The number ofusers supported by a PON can be anywhere from 2 to 128, depending on the the powerbudget, but typically, 16, 32, or 64. At the central office, an optical line terminal (OLT)transmits downstream data using 1490-nm wavelength, and the broadcasting video issent through 1550-nm wavelength. Downstream uses a broadcast and select scheme;that is, the downstream data and video are broadcast to each user with MAC addresses,and the user selects the data packet–based MAC addresses. At the user end, anoptical network unit (ONU), also called an optical network terminal (ONT), transmitsupstream data at 1310-nm wavelength. To avoid collision, upstream transmission usesa multiple access protocol (i.e., time-division multiple access) to assign time slots to

12 BROADBAND ACCESS TECHNOLOGIES: AN OVERVIEW
TDM PON StandardsBPON: ITU G.983GPON: ITU G.984EPON: IEEE 802.3ah
OLT
Central OfficeCoupler
Fiber to the home/user
Fiber to the node/curb/neighborhood
Fiber to the office/business
VDSL, WiFi, etc.
10 ~ 20 km
ONU
ONU
ONU
OLT: Optical Line TerminalONU: Optical Network Unit
FIGURE 1.4 Passive optical networks.
each user. This type of passive optical network is called TDM PON. The ONU couldbe located in a home, office, a curbside cabinet, or elsewhere. Thus comes the so-called fiber-to-the-home/office/business/neighborhood/curb/user/premises/node, allof which are commonly referred to as fiber to the x . In the case of fiber-to-the-neighborhood/curb/node, twisted pairs are typically deployed to connect end users tothe ONUs, thus providing a hybrid fiber/DSL access solution.
1.5.2 PON Standard Development
Early work of passive optical networks started in 1990s, when telecom serviceproviders and system equipment vendors formed the FSAN (full service accessnetworks) working group. The common goal of the FSAN group is to develop trulybroadband fiber access networks. Because of the traffic management capabilitiesand robust QoS support of ATM (asynchronous transfer mode), the first PON stan-dard, APON, is based on ATM and hence referred to as ATM PON. APON supports622.08 Mb/s for downstream transmission and 155.52 Mb/s for upstream traffic.Downstream voice and data traffic is transmitted using 1490-nm wavelength, anddownstream video is transmitted with 1550-nm wavelength. For upstream, user dataare transmitted with 1310-nm wavelength. All the user traffic is encapsulated instandard ATM cells, which consists of 5-byte control header and 48-byte user data.APON standard was ratified by ITU-T in 1998 in Recommendation G.983.1. In theearly days, APON was most deployed for business applications (e.g., fiber-to-the-office). However, APON networks are largely substituted with higher-bit-rate BPONsand GPONs.

OPTICAL ACCESS NETWORKS 13
Based on APON, ITU-T further developed BPON standard as specified in a seriesof recommendations in G.983. BPON is an enhancement of APON, where a higherdata rate and detailed control protocols are specified. BPON supports a maximumdownstream data rate at 1.2 Gb/s and a maximum upstream data rate at 622 Mb/s.ITU-T G.983 also specifies dynamic bandwidth allocation (DBA), management andcontrol interfaces, and network protection. There has been large-scale deployment ofBPON in support of fiber-to-the-premises applications.
The growing demand for higher bandwidth in the access networks stimulatedfurther development of PON standards with higher capacity beyond those of APONand BPON. Starting in 2001, the FSAN group developed a new standard calledgigabit PON, which becomes the ITU-T G.984 standard. The GPON physical media–dependent layer supports a maximum downstream/upstream data rate at 2.488 Gb/s,and the transmission convergence layer specifies a GPON frame format, media accesscontrol, operation and maintenance procedures, and an encryption method. Basedon the ITU-T G.7041 generic framing procedure, GPON adopts GEM (a GPONencapsulation method) to support different layer 2 protocols, such as ATM andEthernet. The novel GEM encapsulation method is backwardly compatible withAPON and BPON and provides better efficiency than do Ethernet frames. Deploymentof GPON had taken off in North America and largely replaced older BPONs and more.
While ITU-T rolled out BPON and GPON standards, IEEE Ethernet-in-the-first-mile working group developed a PON standard based on Ethernet. The EPON physicalmedia–dependent layer can support maximum 1.25-Gb/s (effective data rate 1.0 Gb/s)downstream/upstream traffic. EPON encapsulate and transport user data in Ethernetframes. Thus, EPON is a natural extension of the local area networks in the userpremises, and connects LANs to the Ethernet-based MAN/WAN infrastructure. Sincethere is no data fragment or assembly in EPON and its requirement on physical media–dependent layer is more relaxed, EPON equipment is less expensive than GPON. AsEthernet has been used widely in local area networks, EPON becomes a very attractiveaccess technology. Currently, EPON networks have been deployed on a large scalein Japan, serving millions of users.
1.5.3 WDM PONs
As the user bandwidth demands keep increasing, current GPON or EPON will even-tually no longer be able to satisfy the bandwidth requirement. There are a few possiblesolutions. One possibility is to split a single PON into multiple PONs so that eachPON supports fewer users and each user gets more bandwidth. Another alternativeis to use a higher bit rate, such as 10 Gb/s. In fact, an IEEE 802.3av study groupis creating a draft standard on 10-Gb/s EPON. However, both solutions for higherbandwidth (i.e., higher bit rate or fewer users per PON) are not very cost-effectiveand do not scale very well as the bandwidth demands increase further. In addition, thepower distribution of the passive splitter is fixed; that will lead to an uneven powerbudget for users and limit the transmission distance. Ultimately, WDM PON is theonly future proof of technology that can satisfy any bandwidth demands.

14 BROADBAND ACCESS TECHNOLOGIES: AN OVERVIEW
OLT ONU1
ONU32
MUXDEMUX
Fiber
MUXDEMUX
TX1
TX32
RX1
TX1
RX1
RX32
TX32
RX32
FIGURE 1.5 WDM passive optical networks.
Figure 1.5 shows the network architecture of WDM PONs. Transmitters withvarying wavelengths will be deployed at the OLT and ONU sides, and a passivewavelength-division multiplexer will be inserted at the distribution node to separateand combine multiple wavelengths. Thus, the fiber distribution network will be keptpassive. If the user bandwidth demands are not very large, or in the other words, a smallnumber of users can still share a single wavelength, a passive power splitter followingthe WDM is used to broadcast the downstream traffic and combine the upstreamtraffic. In this case, multiple wavelengths separate a single PON into multiple logicalTDM PONs. Each PON runs on a different wavelength, and fewer users share thebandwidth of a TDM PON. In addition, since the optical power is split for a smallernumber of users, WDM PONs is less subject to optical power budget constraints,leading to long-reach access networks. If a user requires a large amount of bandwidth(e.g., a few gigabits per second), a single wavelength can be provided for this specificuser; or in an extreme case, multiple wavelengths, hence a large bandwidth, can beprovided to a single user if needed.
In WDM PONs, the equipment and resources at OLT are shared by fewer users,leading to higher cost per user. Hence, WDM PONs are considered much more ex-pensive than TDM PONs. However, to support high-bandwidth applications, therewill be a need in the near future to move from TDM access networks to WDMaccess networks. Currently, the way to migrate from current TDM access networksto WDM access networks in a cost-effective, flexible, and scalable manner is not atall clear. A method to upgrade the access service smoothly and cost-effectively froma current TDM FTTx network to a future WDM FTTx network with a minimuminfluence on legacy users is the object of intense research. Various approaches toimplementing WDM have been and are being explored, and field deployment hasbegun in Asia (South Korea, to be exact). A number of schemes to incorporate WDMtechnology into access networks have been studied and tested in experiments, andthe WDM FTTx network architecture exhibits certain exceptional features in theWDM implementation in either downstream, upstream, or both directions. As optical

OPTICAL ACCESS NETWORKS 15
technology becomes cheaper and easier to deploy and end users demand ever-increasing bandwidth, WDM PONs will eventually make the first/last-mile bottle-neck history.
1.5.4 Other Types of Optical Access Networks
In addition to the passive optical networks, TDM and WDM PONs, that we havediscussed, other types of optical access networks have been developed over theyears, including Ethernet over fiber, DOCSIS PON, RF PON, and free-space opticalnetworks. Ethernet over fiber is essentially point-to-point Ethernet built on fiber links.DOCSIS and RF PON is two flavors of PON developed for cable companies. Free-space optical networks is a wireless access solution utilizing optical communicationtechnologies.
Ethernet over Fiber Ethernet over fiber is deployed primarily in point-to-pointtopology. Typically, dedicated fiber connects a subscriber to the central office,and each subscriber requires two dedicated transceivers (one at the user premises andthe other at the central office). This approach requires a large number of fibers andoptical transceivers and thus incurs a large cost associated with fiber and equipment.Since each fiber link can run on its full capacity, Ethernet over fiber, which requiresgigabit bandwidth, is used primarily for business subscribers. Figure 1.6 shows an
Centraloffice
Ethernetswitch
FIGURE 1.6 Point-to-point Ethernet optical access networks.

16 BROADBAND ACCESS TECHNOLOGIES: AN OVERVIEW
alternative architecture for Ethernet over fiber. A local Ethernet switch is deployed tothe user sites. Individual fiber can then run from the switch to each user, and only asingle fiber (bidirectional) or two fibers (unidirectional) connect the Ethernet switchto the central office. This approach reduces the number of fibers run from the centraloffice but requires an active Ethernet switch in the field and requires at least two moretransceivers than is the case on the left in the figure.
DOCSIS PON While telecom companies are deploying PONs worldwide on alarge scale, MSOs (multisystem operators) need to upgrade their fiber coax systemsto compete in FTTx markets. DOCSIS PON, or DPON, is developed to providea DOCSIS service layer interface on top of PON architecture. DPON implementsDOCSIS functionalities, including OAMP (operation, administration, maintenance,and provisioning) on existing PON systems, and thus allow MSOs to use set-topand DOCSIS equipment located in homes and headends over PONs. However, fun-damentally, DPON service is based on current EPON or GPON MAC and phys-ical layer standards. Therefore, DPON is just an application running on top ofPON systems.
RF PON Radio-frequency PON (RF PON) is another flavor of passive opticalnetworks developed for MSOs. RF PONs support RF video broadcasting signalsover optical fibers. As MSOs expand the network footprint and launch new prod-ucts using additional RF bandwidth, more active RF components are deployed andhigher frequencies sometimes require RF electronics change-outs and respacing. As aconsequence, HFC networks experience reduced signal quality, lower reliability, andhigher operating and maintenance cost. RF PONs are a natural evolution of currentHFC networks, as they offer backward compatibility with current RF video broad-casting technologies and provides significant cost reduction in network operation andmaintenance.
OCDM PON Optical code-division multiplexing (OCDM) has been demonstratedrecently as an alternative multiplexing technique for PONs. Similar to electronicCDMA technology, users in OCDM PONs are assigned orthogonal codes with whicheach user’s data are encoded or decoded into or from optical pulse sequence. OCDMPONs can thus provide asynchronous communications and security against unautho-rized users. However, the optical encoders and decoders for OCDM are expensive,and the number of users is limited by interference and noise.
Free-Space Optical Networks Unlike fiber optic communications, free-space op-tical communication (also called optical wireless communication) uses atmosphereas the communication medium. This is probably one of the old long-distance com-munication methods (e.g., smoke signals) used a few thousands years ago. Duringthe past decades, there has been revived interest in free-space communication forsatellite and urban environment. Particularly in the access networks, it can used toconnect a subscriber directly to a central office. Figure 1.7 shows a typical setup

OPTICAL ACCESS NETWORKS 17
FIGURE 1.7 Free-space optical communications and networks. Point-to-point optical wire-less links on the roofs of buildings form a mesh network for broadband access.
for urban free-space optical communication networks. Due to the line-of-sight re-quirement for free-space optical communications, optical transceivers are usuallymounted on the tops of buildings, and telescopes are typically used in the transmitterto improve the alignment of optical links. Multiple point-to-point links can form amesh network, improving its scalability and reliability. As a wireless technology,the cost of free-space optical communication is very low, about 10% of fiber opticcommunications, and the high-speed link can be set up and torn down in a couplehours. Compared to other wireless access technologies, it provides a higher datarate, longer reach, and better signal quality. So far, thousands of free-space opticallinks have been deployed. However, atmosphere is not an ideal transmission medium,due to attenuation and scattering at optical frequency. Turbulence, rain, and densefog could be very challenging for free-space optical communication. For long-reachlinks, alignment of optical transmitters and receivers is also difficult, and an adaptiveray-tracking system might be needed for rapid pointing and accurate alignment. Po-tentially, survivable network topology, transmitter and receiver arrays, and adaptiveand equalization technologies could help mitigate the atmospheric effect and align-ment problem. Integration with wire line networks such as PONs can greatly improvethe reliability and survivability of free-space optical access networks. In the future,we may witness more and more free-space optical networks in urban settings.

18 BROADBAND ACCESS TECHNOLOGIES: AN OVERVIEW
1.6 BROADBAND OVER POWER LINES
Ac power lines have long been considered a workable communication medium. Fordecades, utility companies have used power lines for signaling and control, but theyare used primarily for internal management of power grids, household intercoms, andlighting controls. As deregulation of both the telecom and electricity industries wasunfolding in the 1990s, broadband access over power lines became a possibility. Aspower lines reach more residences than does any other medium, significant effortshave been made to develop high-speed access over power lines. A number of solutionshave been proposed and tested in the field. Even though DSL or cable currentlydominates the broadband access services, and PONs are very promising for the nearfuture, broadband over power lines (BPL) can still claim its part in the current market.For example, in some rural areas, building infrastructure to provide DSL or cablecould be very expensive, while power-line communications could easily providebroadband services. Anywhere there is electricity there could be broadband overpower lines. In addition, there is a great potential to network all the appliances in ahousehold through the power line, thus providing a smart home solution. However,at present power-line communication technology and its market potential remain tobe developed further.
1.6.1 Power-Line Communications
Figure 1.8 shows the topology of the electrical power distribution grid. The three-phase power generated at a power plant enters a transmission substation, where thethree-phase power generated by the power generators is converted to extremely high
PowerPlant
High-VoltageTransmission Lines
PowerSubstation
DistributionLines
FIGURE 1.8 Electrical power transmission and distribution.

BROADBAND OVER POWER LINES 19
Coupler& Bridge
Powerlinesubstation
FIGURE 1.9 Broadband power-line communications.
voltages (155 to 765 kV) for long-distance transmission over the grid. Within thetransmission grid, many power substations convert the extremely high transmissionvoltage down to distribution voltages (less than 10 kV), and this medium-voltageelectricity is sent through a bus that can split the power in multiple directions. Alongthe distribution bus, there are regulator banks that regulate the voltage on the lineto avoid overshoot or undershoot, and taps that send electricity down the street. Ateach building or house, there is a transformer drum attached to the electricity pole,reducing the medium voltage (typically, 7.2 kV) to household voltage (110 or 240 V).
Broadband over power lines utilizes the medium-voltage power lines to transmitdata to and from each house, as shown in Figure 1.9. Typically, repeaters are installedalong the power lines for long-distance data transmission, and some bypass devicesallow RF signals to bypass transformers. In the last step of data transmission, thesignals can be carried to each house by the power line or, alternatively, using Wi-Fior other wireless technology for last-mile connection.
1.6.2 BPL Modem
A BPL modem plugs into a common power socket on the wall, sending and re-ceiving data through a power line. On the other end, the BPL modem connects tocomputers or other network devices by means of Ethernet cables. In some cases,a wireless router can be integrated with a BPL modem. BPL modems transmit atmedium to high frequencies, from a few megahertz to tens of megahertz. Typical

20 BROADBAND ACCESS TECHNOLOGIES: AN OVERVIEW
data rates supported by a BPL modem range from hundreds of kilobits per second toa few megabits per second. Various modulation schemes can be used for power-linecommunications, including the older ASK (amplitude shift keying), FSK (frequencyshift keying) modulation and newer DMT, DSSS (direct sequence spread spectrum)and OFDM (orthogonal frequency-division multiplexing) technologies. DMT, DSSS,or OFDM modulation is perferred in modern BPL modems, as it is more robust inhandling interference and noise. Recent research has demonstrated a gigabit data rateover power lines using microwave frequencies via surface wave propagation. Thistechnology can avoid the interference problems very common in power lines.
1.6.3 Challenges in BPL
BPL is a promising technology, but its development is relatively slow compared withDSL and cable. There are a number of technical challenges that must be overcome. Apower line is not a very good medium for data transmission: Various transformers usedin the electric grid do not pass RF signals, the numerous sources of signal reflections(impedance mismatches and lack of proper impedance termination) on power lineshinder data transmission, and noise from numerous sources (such as power motors)contaminates the transmission spectrum. Since power lines consist of untwisted andunshielded wire, their long length makes them large antennas emitting RF signals andinterfering with other radio communications. Furthermore, a power line is a sharedmedium limiting the bandwidth delivered to each user and raising security concernsfor private communications. All these issues have to be fully addressed before large-scale deployment can be implemented. Fortunately, much progress has been madethrough intensive research during recent decades. BPL is poised to be a promisingtechnology for entry into the current highly competitive market.
1.7 WIRELESS ACCESS TECHNOLOGIES
Starting with RF communication and broadcasting, wireless communication tech-nologies have had an incredibly powerful effect on the entire world since the be-ginning of the twentieth century. Nowadays, AM/FM radio and TV broadcastingblanket every continent except Antarctica; wireless cellular networks provide voicecommunication to hundreds of millions of users; satellites provide video broadcast-ing and communication links worldwide; and Bluetooth and wireless LANs supportmobile services to individuals. Wireless networks are everywhere. The popularity ofwireless technologies is due primarily to their mobility, scalability, low cost, and easeof deployment. Wireless technologies will continue to play an important part in ourdaily lives, and fourth-generation wireless networks will be able to provide quadru-ple play through seamless integration of a variety of wireless networks, includingwireless personal networks, wireless LANs, wireless access networks, cellular widearea networks, and satellite networks. In recent years, a number of wireless technolo-gies have been developed as alternatives to traditional wired access service (DSL,cable, and PONs). Except for free-space optical communications (Section 1.5), most

WIRELESS ACCESS TECHNOLOGIES 21
wireless access networks use RF signals to establish communication links betweena central office and subscribers. In this section we discuss various broadband radioaccess technologies and their characteristics. The choice of radio access technologiesdepends largely on the applications, required data rate, available frequency spectrum,and transmission distance. Even though wireless access networks cannot competewith wired access technologies in terms of data rate and reliability, they offer flexi-bility and mobility that no other technologies can provide. Therefore, wireless accessnetworks complement current wired access technologies and will continue to growin the future.
1.7.1 Wi-Fi Mesh Networks
The Wi-Fi network based on IEEE 802.11 standards was developed in the 1990s forwireless local area networks, where a set of wireless access points function as commu-nication hubs for mobile clients. Because of its flexibility and low deployment cost,Wi-Fi has become an efficient and economical networking option that is widespreadin both households and the industrial world, and is a standard feature of laptops,PDAs, and other mobile devices. Now Wi-Fi is available in thousands of public hotspots, millions of campus and corporate facilities, and hundreds of millions of homes.Even though current Wi-Fi networks are limited primarily to point-to-multipoint com-munications between access points and mobile clients, multiple access points can beinterconnected to form a wireless mesh network, as shown in Figure 1.7. The wirelessaccess points establish wireless links among themselves to enable automatic topol-ogy discovery and dynamic routing configuration. The wireless links among accesspoints form a wireless backbone referred to as mesh backhaul. Multihop wirelesscommunications in mesh backhaul are employed to forward traffic to and from awired Internet entry point, and each access point may provide point-to-multipointaccess to users known as mesh access. Therefore, a Wi-Fi mesh network can providebroadband access services in a self-organized, self-configured, and self-healing way,enabling quick deployment and easy maintenance.
Over the years, a set of standards has been specified by the IEEE 802.11 work-ing group, including the most popular 802.11b/g standards. Table 1.3 comparesthe main attributes of these standards (pp152, 3G Wireless with WiMAX andWi-Fi). The original 802.11 standard (approved in 1997) supports data rates of 1 or
TABLE 1.3 Comparison of IEEE 802.11 Standards
Parameter 802.11a 802.11b 802.11g 802.11n 802.11y
Operating frequency (GHz) 5 2.4 2.4 2.4 and 5 3.7Maximum data rate (Mb/s) 54 11 54 248 54Maximum indoor transmission
distance (m)35 40 40 70 50
Maximum outdoor transmissiondistance (m)
100 120 120 250 5000

22 BROADBAND ACCESS TECHNOLOGIES: AN OVERVIEW
2 Mb/s using FHSS (frequency hopping direct sequence) with GFSK modulation orDSSS (direct sequence spread spectrum) with DBPSK (differential binary-phase shiftkeying)/DQPSK (differential quadrature-phase shift keying) modulation. In 1999,802.11b extended the original 802.11 standard to support 5.5- and 11-Mb/s data ratesin addition to the original 1- and 2-Mb/s rates. The 802.11b standard uses eight-chipDSSS with a CCK (complementary code keying) modulation scheme at the 2.4-GHzband. Also approved in 1999 by the IEEE, 802.11a operates at bit rates up to 55 Mb/susing OFDM with BPSK, QPSK, 16-QAM, or 64-QAM at the 5-GHz band. In 2003,IEEE ratified a newer standard, IEEE 802.11g, providing a 54-Mb/s data rate at the2.4-GHz band. The 802.11g standard is back-compatible with 802.11b. The upcom-ing IEEE 802.11n standard will support a 248-Mb/s data rate operating at the 2.4- and5-GHz bands. In addition, IEEE 802.11e provides effective QoS support, and IEEE802.11i supports enhanced security in wireless LANs. Even though Wi-Fi networksbased on IEEE 802.11a/g/n can provide data rates over 50 Mb/s, their maximumreach is very limited (< 500 m). For last-mile solution, Wi-Fi mesh networks withmultihop paths are necessary. However, due to RF interference, bit rates for multihopwireless communication could be much lower than the maximum data rate of a singlewireless link. To support a long reach, IEEE 802.11y is currently under developmentfor 54 Mb/s with a maximum reach of 5 km (outdoor environment).
In wireless networks, interference from different transmitters can be a seriousproblem limiting the throughput of the entire network. In Wi-Fi networks, MAClayer control uses a contention-based medium access called CSMA/CA (carrier-sense multiple access with collision avoidance) to reduce the interference effect andimprove network performance. However, because of the randomness of data packetarrival time and the contentious nature of the MAC layer protocol, the throughput ofWi-Fi networks can be much lower than its maximum capacity.
1.7.2 WiMAX Access Networks
WiMAX access networks, based on IEEE 802.16 standards, can provide wirelessbroadband Internet access at a relatively low cost. A single base station in WiMAXnetworks can support data rates up to 75 Mb/s to residential or business users.However, since multiple users are served by a single base station, data payloaddelivered to end users is likely to 1 Mb/s for residential subscribers and a few Mb/sfor business clients. Compared to the transmission distance of a few hundred meterssupported by Wi-Fi (802.11a/b/g/n), WiMAX promises wireless access range up to50 km. Therefore, WiMAX can provide citywide coverage and QoS capabilities,supporting multimedia applications from non-real-time data to real-time voice andvideo. Furthermore, as an IP-based wireless technology, WiMAX can be integratedseamlessly with other types of wireless or wireline networks.
The salient features of a number of 802.16 standards ratified by IEEE are shownin Table 1.4. The original IEEE 802.16 standrad defines backhaul point-to-pointconnections with bit rates up to 134 Mb/s using frequencies in the range 10 to66 GHz, and IEEE 802.16d/e specifies point-to-multipoint wireless access at bit rates

WIRELESS ACCESS TECHNOLOGIES 23
TABLE 1.4 Comparison of IEEE 802.16 Standards
Parameter 802.16 802.16a 802.16e 802.16m
Operating frequency (GHz) 10−66 2−11 2−6 To be determinedMaximum data rate (Mb/s) 134 75 15 1000Typical cell size (km) 2−5 7−10 2−5 Microcell (to be determined)
up to 75 Mb/s. The newest standard, IEEE 802.16m, supports data rates up to 1 Gb/sbut with a much shorter transmission range.
Figure 1.10 shows the architecture of a typical WiMAX network. In WiMAXnetworks, WiMAX base stations are connected to the wireline networks (usually,optical metro networks) using optical fiber, cable, and microwave high-speed point-to-point links. Theoretically, a base station can cover up to a 50-km radius, but inpractice it is usually limited to 10 km. The base station serves a number of subscriberstations (deployed at the locations of residential or business users) using point-to-multipoint links. A WiMAX network can be configured with a star topology or a meshtopology; each has advantages and disadvantages. Whereas star topology can supporthigher data rates, mesh topology provides a longer reach and faster deployment.The WiMAX MAC layer allocates the uplink and downlink bandwidth to subscribersaccording to their bandwidth needs. Unlike Wi-Fi networks, WiMAX networks adopt
Star Topology
Mesh Topology
FIGURE 1.10 WiMAX network topology.

24 BROADBAND ACCESS TECHNOLOGIES: AN OVERVIEW
scheduled access using a time-division multiplexing technique, but the time slotassigned to each subscriber can vary in length depending on the bandwidth allocatedto the subscriber. Because of the scheduling algorithm, WiMAX networks are morebandwidth efficient than are Wi-Fi networks.
1.7.3 Cellular Networks
During the last decade, cellular networks have spread all over the world, evolving fromfirst generation (1G) to 2G and now moving toward 3G and 4G systems. The primaryfunction of cellular networks is to carry voice communications for mobile users.However, as the telecom industry is migrating from voice- to data-centric networks,cellular networks have gradually built up their capacity for multimedia services suchas data and video applications. As the first-generation cellular networks, AMPS (theAdvanced Mobile Phone System) in North America and ETACS (the Extended TotalAccess Communication System) in Europe and Asia are analog, circuit-switchedsystems supporting only voice communications. The second-generation networksbegan the digital evolution. Digital encoding techniques such as CDMA, GSM, andTDMA pervade the cellular networks, and text messaging service becomes a commonapplication. In addition, GPRS (general packet radio service) adds packet switchingin GSM networks for high-speed data transmission (up to 171.2 kb/s), and EDGE(enhanced data rates for GSM evolution) further improved data transmission in GSMnetworks at bit rates up to 473.6 kb/s. The third-generation cellular networks basedon UMTS (the universal mobile telecommunication system) or WCDM (widebandcode-division multiple access) provide data service with bit rates above 144 kb/s. Theemerging fourth-generation network will be an IP-based mobile system combiningmultiple radio access technologies, such as Bluetooth and wireless LAN, into anintegrated network. The data rates supported by 4G networks could be as high as100 Mb/s, thus providing truly broadband and ubiquitous access services.
Figure 1.11 illustrates the configuration of a typical cellular network, consistingof a base station controller, mobile switching center, base station transceiver, andmobile devices. To use the radio spectrum efficiently, the area covered by the cellular
BSC
HLR
MSC
Wired Networks
FIGURE 1.11 Cellular network architecture. MSC, mobile switching center; BSC, basestation controller; HLR, home location register.

WIRELESS ACCESS TECHNOLOGIES 25
network is divided into small cells. Frequencies are reused in nonadjacent cells. Eachcell has a base station that transmits and receives signals from the mobile deviceswithin the cell. A group of base stations are connected to a base station controller. Agroup of base station controllers are in turn connected to a mobile switching center viamicrowave or fiber optic links. The base station controller controls communicationsbetween a group of base stations and a single mobile switching center. The mobileswitching center connects to the public-switched telephone networks, which switchcalls to other mobile stations or wired telephones. To provide data service, the mobileswitching center is also connected to the Internet through edge routers.
Low-data-rate and incompatible technologies in current cellular networks (2G or2.5G) present a serious problem for emerging multimedia applications. Hence, 3Gnetworks have been developed to provide data rates over 1 Mb/s with a compati-ble radio interface among countries. However, economic concerns cast a doubt overlarge-scale deployment of 3G networks. Meanwhile, 4G technologies have emergedas a promising approach for mobile data service with a faster data rate than 3G.Despite all the efforts taken with developing data-centric cellular networks, broad-band multimedia service over cellular networks still lags behind Wi-Fi and WiMAXnetworks in term of available bandwidth and network capacity.
1.7.4 Satellite Systems
Satellites have played an important role in providing digital communication links allover the world for a few decades. Originally developed for long-distance and intercon-tinental communications, satellites are also used for video broadcasting. Due to thedevelopment of VSATs (very small aperture terminals), satellite direct-to-home videobroadcasting has been widely accepted since the mid-1990s. So far, satellite linkshave reached about 100 million homes, and widespread use of satellites for broadbandaccess has become a reality. Satellite systems can cover a wide geographic area andsupport a variety of broadband applications, making it a very attractive broadbandaccess solution. In fact, large corporate users have utilized satellite networks to es-tablish wide area data networks to serve geographically dispersed corporate officessince the 1980s. A special type of satellite network called a global positioning system(GPS) has found popular applications for both military and civil navigation. Satelliteoperators for video broadcasting are dashing forward for broadband Internet accessand multimedia applications.
Orbiting around the Earth, a satellite serves as a repeater and establishes a wire-less link between any two users on the Earth. A satellite receives signals from Earthstations on an uplink, amplifies those signals, and then transmits them on a downlinkwith a different frequency. The first-generation satellites operate in the C-band, witha 4-GHz downlink and a 6-GHz uplink. However, large dish antennas have to be usedfor ground stations to improve receiver sensitivity and reduce microwave beamwidth.As bandwidth demands increase, the Ku-band (12/14 GHz for downlink/uplink) andKa-band (20/30 GHz for downlink/uplink) were allocated by the U.S. Federal Com-munications Commission (FCC) for satellite communications. Using higher frequen-cies can support a higher data rate and permit the use of smaller-aperture antennas.

26 BROADBAND ACCESS TECHNOLOGIES: AN OVERVIEW
Recently, a higher-frequency satellite band, a V-band with a 40-GHz downlink and a50-GHz uplink, has been approved by the ITU-T. With a V-band satellite, over 2 GHzof bandwidth is available, but atmospheric and rain attenuation become more severeat the V-band than at a lower-frequency band.
Modern communication satellites typically use a geostationary orbit with an orbitalperiod matching the rotation period of the Earth. At a geostationary orbit, a singlesatellite can cover a huge geographical area (roughly 40% of the surface of theEarth). Since a geostationary orbit has a radius about 42,164 km, a long signaldelay (about a 0.25 s round-trip delay) and large signal attenuation are unavoidable.Alternatively, low Earth orbit (200 to 2000 km orbital altitude) or medium Earth orbit(2000 to 3000 km orbital altitude) can be used with shorter delays and lower powerattenuation. However, the coverage area of a low/medium-Earth-orbiting satellite ismuch smaller.
A satellite Earth station typically consists of a satellite modem, a transceiver, andan antenna. A parabolic reflector antenna is commonly used to transmit and receivesatellite signals. A satellite transceiver includes low-noise frequency converters andpower amplifiers made from microwave monolithic integrated circuits. A satellitemodem performs data encoding and modulation. Since satellite links are mostlypower limited, complicated encoding and modulation schemes are commonly usedto trade bandwidth for better performance.
A set of open standards called DVB (digital video broadcasting) has been de-veloped for digital television, including DVB-S, DVB-S2, and DVB-SH for satel-lite video broadcasting. However, these DVB standards specify that only point-to-multipoint one-way communication links be used for video broadcasting. With thegrowing demand for broadband access, two standards have been proposed to supporttwo-way broadband communication links over satellites: DVB-RCS (return channelsystem) and DOCSIS-S. In DVB-RCS, the forward link (from the service providerto subscribers) is completely compatible with DVB-S. In other words, the forwardlink can be used for video broadcasting or Internet access. In addition, a returnchannel is specified for sending user data to the service provider, where ATM-likepackets are used for data transmission. DOCSIS-S is an adaption of the DOCSISstandard for satellites. In DOCSIS-S, QPSK or SPSK, combined with turbo coding,is implemented for satellite links, and IP encapsulation is used for data transmission,resulting in more efficient bandwidth utilization and about 10% less overhead thanwith DVB-RCS.
1.7.5 LMDS and MMDS Systems
Local multipoint distribution service (LMDS), developed by the IEEE 802.16.1 work-ing group, is a last-mile point-to-multipoint wireless access technology. Figure 1.12shows the network architecture of LMDS systems. In the United States, a 1.3-GHzband between 28 and 31 GHz has been allocated for LMDS, whereas in Europe,LMDS may use different frequency bands from 24 to 43.5 GHz. LMDS can transmit34 to 38 Mb/s of data covering the range 3 to 5 km. Therefore, multiple cells are

WIRELESS ACCESS TECHNOLOGIES 27
Central officeor headend
FIGURE 1.12 LMDS architecture.
usually required to serve a metropolitan area. In each cell, a base station with multipletransceivers mounted on the roof of a tall building or on a tall pole transmits usersdata in a point-to-multipoint mode. A return link from the user to the base station isachieved by a point-to-point link. Even though the physical layer is different fromthat of the wired cable networks, LMDS has adopted DOCSIS specifications.
Multichannel multipoint distribution service (MMDS), also known as wirelesscable, was developed in the 1970s as an alternative to cable TV broadcasting. It cansupport 31 analog channels (6 MHz each) in a 200-MHz frequency band from 2.5to 2.7 GHz. An MMDS system can also be used as a general-purpose broadbandaccess network. MMDS has been deployed for wireless high-speed Internet accessin rural areas where other types of broadband access are unavailable or prohibitivelyexpensive. Figure 1.13 shows the architecture of an MMDS system. In an MMDSsystem, analog video signals or QAM/OFDM data signals are broadcast from mi-crowave towers at the headend. At the user premises, rooftop antennas pick up thebroadcast signal and downconvert it to cable channel frequencies. A gateway deviceis used to rout various signals to in-home network devices. Overall, the architecture ofMMDS resembles that of LMDS. Similarly, MMDS systems have adopted DOCSISspecifications. DOCSIS modified for wireless broadband is commonly referred to asDOCSIS+. MMDS systems can provide a data rate of over 10 Mb/s to a single user.MMDS broadcasts can transmit signal power up to 30 W and cover a diameter ofabout 50 km, much more than LMDS systems.
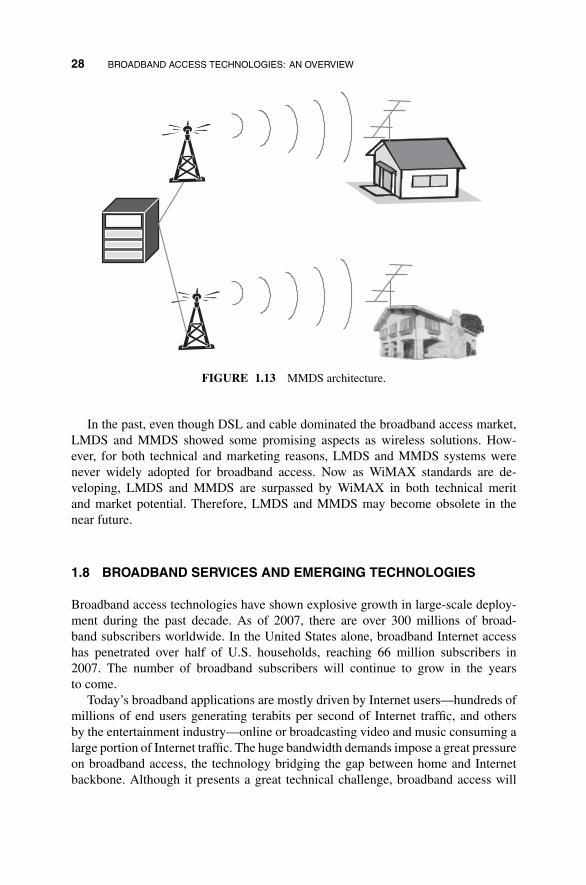
28 BROADBAND ACCESS TECHNOLOGIES: AN OVERVIEW
FIGURE 1.13 MMDS architecture.
In the past, even though DSL and cable dominated the broadband access market,LMDS and MMDS showed some promising aspects as wireless solutions. How-ever, for both technical and marketing reasons, LMDS and MMDS systems werenever widely adopted for broadband access. Now as WiMAX standards are de-veloping, LMDS and MMDS are surpassed by WiMAX in both technical meritand market potential. Therefore, LMDS and MMDS may become obsolete in thenear future.
1.8 BROADBAND SERVICES AND EMERGING TECHNOLOGIES
Broadband access technologies have shown explosive growth in large-scale deploy-ment during the past decade. As of 2007, there are over 300 millions of broad-band subscribers worldwide. In the United States alone, broadband Internet accesshas penetrated over half of U.S. households, reaching 66 million subscribers in2007. The number of broadband subscribers will continue to grow in the yearsto come.
Today’s broadband applications are mostly driven by Internet users—hundreds ofmillions of end users generating terabits per second of Internet traffic, and othersby the entertainment industry—online or broadcasting video and music consuming alarge portion of Internet traffic. The huge bandwidth demands impose a great pressureon broadband access, the technology bridging the gap between home and Internetbackbone. Although it presents a great technical challenge, broadband access will

BROADBAND SERVICES AND EMERGING TECHNOLOGIES 29
lead to a great opportunity to develop new applications and services. In previoussections we have presented various broadband access technologies. Among these,DSL and cable are the dominant wireline access networks, and cellular networks andWi-Fi hot spots represent the most widely deployed wireless access technologies. Onthe other hand, two versions of PON networks, GPON and EPON, become the mostpromising solution for future broadband services. In this section we review currentmarket demands and driving forces for broadband access, discuss challenging issuesin broadband access services, and present possible solutions for future broadbandaccess technologies.
1.8.1 Broadband Access Services
The existing pressure from broadband services has led to heated competitions inaccess technologies and may shatter the current landscape of the telecom industry.There are a few driving forces behind this huge wave of broadband deployment.Multimedia applications, user bandwidth demands, industrial competitions, econom-ical factors, and government regulation all play very important roles in the marchtoward “broadband for all” society. Multimedia applications create huge market de-mands for broadband access. Video services such as IP TV, video on demand, andvideoconferencing, particularly, have become killer applications for bandwidth ex-plosion in access networks. In addition to HD and standard TV broadcasting, videohas consumed more than 30% of current Internet traffic, and this percentage keepsincreasing. It is predicted that video traffic will consist of more than 50% of totalInternet traffic. Because of peer-to-peer Web traffic (including video sharing) andother bandwidth-hungry applications (e.g., interactive games), user bandwidth de-mands are increasing rapidly, rendering broadband DSL and cable Internet access“slow speed.” To meet user bandwidth demands and to support multimedia appli-cations, both telecom and cable industries are deploying next-generation broadbandtechnologies, including passive optical networks. Government deregulation, partic-ularly local loop unbundling, has created heated competition in the access segmentbetween telecom operators and MSOs and between ILECs (incumbent local exchangecarriers) and IXCs (interexchange carriers). In addition, economical reasons for re-ducing OPEX (operating expenses) and increasing revenue create a big incentive forlarge-scale deployment of passive optical networks. Driving by market demands andtechnical innovations, broadband access networks will continue to evolve in the nextfew years.
Even though DSL and cable access have come to dominate broadband access inmany countries, the broadband service currently offered by service providers is justan extension of existing technologies that provide data service. Telecom operatorsdeveloped DSL to offer data service over phone lines, and MSOs added bidirectionaltransmission in HFC networks to support data transmission. Triple play has become abuzzword for service providers, but it is very difficult for DSL and cable access to offertriple play, due to their limited bandwidth. In addition to bandwidth, next-generationbroadband access requires much more.

30 BROADBAND ACCESS TECHNOLOGIES: AN OVERVIEW
As communication networks is evolving toward anywhere, anytime, and anymedium communications, future broadband subscribers may requires integrated ac-cess services over a unified interface with good end-to-end quality of service at alow service fee. Integrated services over the broadband access networks must beable to provide triple play or even quadruple play (voice, data, video, and mobility).Bandwidth over 100 Mb/s per user might be necessary to support triple play. Further-more, good end-to-end quality of service is essential for many applications, and thebroadband service must be dependable and available all the time. For real-time voiceand video, there are tight constraints in delay and jitter. It might not be possible for asingle technology to meet these requirements, but future broadband services must beavailable through an intelligent interface that is transparent to subscribers. No matterwhat service a subscriber might need, a single user interface will provide it with goodQoS support. Finally, the access segment is always cost sensitive; service providersmust be able to provide broadband for all service at a price comparable to that ofcurrent DSL or cable access.
1.8.2 Emerging Technologies
As discussed earlier, fiber is the only medium that can provide unlimited bandwidthfor broadband access services. In the past, economics and lack of killer applicationshindered its deployment in the access segment. As the optical technologies becomemature, optical components are much less expensive and the fiber deployment costcontinues to drop. It is now economically feasible to massively deploy passive opticalnetworks. In the meantime, killer applications such as video on demand have emerged,demanding broadband access service that can be only supported by optical fibers interms of bandwidth and reach. Since IP over WDM optical networks has been widelydeployed in both WAN and MAN, it is not only reasonable but also necessary todeploy optical fibers to the user premises. In fact, different flavors of TDM PONs(mostly BPON and EPON) have been deployed on a large scale. Curently, Japanand Korea have taken the lead in FTTx deployment, and fibers have reached alarge percentage of households, serving millions of users. In Japan, there are about26 million broadband subscribers. Among these, 33% were using FTTH connectionsin 2007. Even though the majority of subscribers (about 50%) continue to use DSL,the market share of DSL has begun to shrink and FTTH continues to grow. In the firstquarter of 2007, FTTH subscribers increased by 860,000 while DSL lost 220,000users. In the United States, rapid deployment of passive optical networks began in2005. In 2007, 2 million homes in the United States had fiber connections. FTTHnetworks will continue to grow all over the world. In Chapter 2 the fundamental ofoptical communications and the physical technologies for passive optical networksare discussed in detail. Then in Chapter 3, current TDM PON standards are reviewedand compared.
Next-generation optical access networks will evolve to higher bit rates and multiplewavelengths. Currently, 10-Gb/s PONs are being discussed by standard bodies (IEEE,FSAN, and ITU-T). 10-Gb/s downstream deployment include upstream bit rates of1.25 or 2.5 Gb/s, and symmetric 10-Gb/s PONs will enter the market in the next few

SUMMARY 31
years. Eventually, optical access networks will adopt WDM technologies. The advan-tage of WDM PONs are higher bandwidth, flexible data format, and better security.However, point-to-point WDM access is relatively expensive despite the quick dropin the cost of optical components. Furthermore, a few issues, including protection andrestoration and colorless ONUs, need to be addressed before WDM PONs becomewide available. In the short term, hybrid TDM/WDM can provide an evolutionaryapproach to upgrade TDM to WDM PONs in a scalable and cost-effective man-ner. Next-generation optical access networks—higher-bit-rate, multiple-wavelengthPONs—are the focus of Chapter 4.
Even though passive optical networks can satisfy any user bandwidth demands fortriple play (voice, data, and video), their fixed infrastructure and limited coverage can-not fulfill the requirement of ubiquitous and flexible access for emerging multimediaapplications. Due to recent advances in wireless technologies, wireless access net-works such as Wi-Fi (IEEE 802.11) and WiMAX (IEEE 802.16) become a promisingsolution to serve the growing number of wireless subscribers interested in high-qualityvideo streams and other multi-media applications using handheld mobile devices. Inthe future, convergence of optical and wireless technologies is inevitable in the ac-cess segment for quadruple play (voice, data, video, and mobility). However, as thetraffic behavior and channel quality of these two technologies are far from each other,seamlessly integrating passive optical networks and wireless mesh networks present avery challenging task that demands further investigation. In Chapter 5 we present thechallenging issues and possible solutions for hybrid optical and wireless networks.
1.9 SUMMARY
In this chapter we provide a brief overview of the architecture of communicationnetworks and show that current Internet bottlenecks are due to the lack of high-speedaccess technologies. Then various broadband access technologies are discussed andthe major features of DSL, HFC, PON, BPL, Wi-Fi, WiMAX, celluar and satellitenetworks, and LMDS and MMDS are presented in detail.
DSL can offer data rates over 10 Mb/s within a short distance. Efforts to developnext-generation DSL focus on increasing data rates and transmission distance. WithDSL, voice and data can be supported by a single phone line. In the past decade, DSLhas become one of the dominant broadband access technologies worldwide. However,TV broadcasting and IP TV are still a technical challenge for DSL networks. UsingVDSL and advanced data-compressing techniques, video over IP may be offered inthe near future.
Traditionally, HFC networks offer analog TV broadcasting. With the developmentof cable modem, broadband Internet access can be provided to subscribers. Cable iscurrently the archrival of DSL, claiming a large portion of market share. However, thebandwidth of coax cable access is still limited to about 10 Mb/s because of hundredsof users sharing the same cable. Currently, MSOs have added VoIP and digital TVover HFC networks. Further development will extend the cable plant beyond 1 GHz,and higher data rates will be the main focus of HFC networks.

32 BROADBAND ACCESS TECHNOLOGIES: AN OVERVIEW
BPL is developed as an alternative for DSL and HFC networks. The data rate pro-vided by BPL can reach only a few megabits per second. As power lines reach moreresidences than any other wired medium, BPL is considered a feasible access technol-ogy for rural areas that have no DSL and HFC access. However, technical problemssuch as noise and interference have hindered large-scale development of BPL.
As optical fibers can provide essentially unlimited bandwidth, PONs are consid-ered the most promising wired access technologies for the future. Current TDM PONssupport data rates of tens of megabits per second for a single user, and large-scaledeployment of TDM PONs has begun in Asia and North America. As the user band-width demands are ever increasing, WDM PONs will be developed as the ultimatesolution for broadband access and satisfy the bandwidth requirements of any broad-band access services. However, the high deployment cost make them presently a lessattractive solution. Current efforts on PON development include bit-rate enhancementand service overlay on hybrid TDM/WDM PONs.
In addition to wired broadband solutions, many wireless technologies have beendeveloped to provide broadband Internet access, such as free-space optical com-munications, Wi-Fi, WiMAX, and cellular and satellite networks. Free-space opticalcommunications can support gigabit per second data rates and a transmission distanceof a few kilometers, but the atmospheric effects impose severe constraints for free-space optical communications. Wi-Fi is widely used for wireless local area networkswith transmission distances up to a few hundred meters. With a mesh topology, Wi-Finetworks can support extended reach and broadband Internet access. WiMAX cansupport wireless access over 10 km, but it requires higher transmitted power and thedata rate is lower than in Wi-Fi networks. Cellular networks are used primarily formobile voice communication. With digital encoding technologies, data transmissionservice can be added over cellular networks but with a very limited data rate (upto a few Mb/s). Further development of 3G and 4G is expected to support muchhigher data rates over 10 Mb/s. Satellite networks are used primarily for direct videodistribution, but data service over satellite can cover a large geographical area. Themain disadvantage of satellite communication is that of very limited data rates. Theadvantages of wireless technologies are mobility, scalability, low cost, and ease of de-ployment. Except for free-space optical communication, other wireless technologiesuses RF or microwave frequencies. The bit rate–distance product of RF technolo-gies is very limited, and the network capacity and reliability are also much lowerthan these of wired access networks. In the future, optical and wireless technologymay be combined in hybrid optical and wireless access networks, leveraging theircomplementary characteristics to provide quadruple-play service.
In summary, emerging multimedia applications demand broadband access net-works, and a number of wired and wireless broadband access technologies have beendeveloped over the past decade. The long-term perspective of broadband access tech-nology lies in the convergence of optical and wireless technologies. By solving thelast-mile bottleneck problem, a variety of new applications will be made possible.One day the dream of broadband access networks for anyone, anywhere, anytime,any medium communications will become a reality.

REFERENCES 33
REFERENCES
1. DSL standards: ITU-T G.992.1/G.992.2 for ADSL, G.992.3/G.992.4 for ADSL2, G.993.1for VDSL, G.993.2 for VDSL2, G.991.1 for HDSL, and 991.2 for SHDSL.
2. DOCSIS standards: ITU-T J.112 for DOCSIS 1.0, J.122 for DOCSIS 2.0, and J.222 forDOCSIS 3.0.
3. PON standards: ITU-T G.983 for APON and BPON, G.984 for GPON, IEEE 802.3ah forEPON, and 802.3av for 10GEPON.
4. BPL standards: X10 and IEEE P1675/1775/1901.
5. Wi-Fi standard: IEEE 802.11.
6. WiMAX standard: IEEE 802.16.

CHAPTER 2
OPTICAL COMMUNICATIONS:COMPONENTS AND SYSTEMS
Optical communications make use of light waves, very high frequency (100 terahertz)electromagnetic waves, for information transmission. Modern optical communica-tions were begun in the 1960s, when lasers were invented as a coherent light source.Since then, the rapid development of photonic technologies has made possible op-tical communication links with a capacity of terabits per second and a transmissiondistance of many thousands of kilometers. The explosive growth of optical commu-nication technology in the past decades has revolutionized the telecom industry andcreated a global communication infrastructure with optical networks.
A typical fiber optic communication system consists of an optical transmitter, op-tical fiber, and an optical receiver. The optical transmitter converts the information-carrying electronic signal to an optical signal, which are then sent through a longlength of optical fiber. At the receiver end, an optical detector converts the opticalsignal back to an electronic signal so that the information is recovered and deliveredto the destination. In this chapter we focus on the fundamentals of optical communi-cation technologies. The emphasis is on the enabling technologies and physical-layerdesign for passive optical networks. First, key components of optical communicationsystems are discussed, including the main characteristics and performance featuresof optical fibers, transmitters, receivers, amplifiers, and various passive components.Then optical link design and system performance of optical communications are pre-sented. At the end of this chapter, we discuss burst mode transmission, a unique opticaltransmission technique used in passive optical networks, and its related technologies.
Broadband Optical Access Networks, First Edition. Leonid G. Kazovsky, Ning Cheng, Wei-Tao Shaw,David Gutierrez, and Shing-Wa Wong.C© 2011 John Wiley & Sons, Inc. Published 2011 by John Wiley & Sons, Inc.
34

OPTICAL FIBERS 35
2.1 OPTICAL FIBERS
Optical fiber is a cylindrical waveguide made of dielectric materials such as glassor plastic. Because of its waveguide structure, optical fiber confines a light wave inits core and guides optical signals along its axis. Because of its high bandwidth andlow attenuation, optical fiber is widely used as the transmission channel for opticalcommunication systems, carrying high-bit-rate optical signals over long distance.When doped with rare earth elements, optical fiber can serve as an optical amplifier,boosting optical signal power for long-haul transmission. In addition to telecommu-nications, optical fiber is also used in illumination, imaging, and sensor applications.In this section we focus on its principles and characteristics as an optical transmissionmedium.
2.1.1 Fiber Structure
Optical fiber used in optical communications consists of a cylindrical dielectric coresurrounded by dielectric cladding. A polymer buffer coating is commonly used toenhance its mechanical strength and protect it from environmental effects. Figure 2.1shows the structure of an optical fiber. Both the core and the cladding are madeof silica (SiO2) or plastics (e.g., PMMA). To guide light waves along the fiber,the refractive index of the core, n1, must be larger than the refractive index of thecladding, n2. Typically, the refractive index difference is very small (only a fewpercent), depending on the desired characteristics of the fiber. There are two differenttypes of fibers: single mode and multimode. Multimode fibers have either 50-, 62.5-,and 85-µm core diameters and a 125-µm cladding diameter. The large diameter of thefiber core facilitates optical power coupling in and out of fiber. Single-mode fibers,on the other hand, have a much smaller core diameter, typically 5 to 8 µm.
2.1.1.1 Multimode Fibers Multimode fiber is used for short-distance trans-mission, up to a few kilometers. Multimode fibers are commonly deployed for localarea networks (e.g., gigabit Ethernet) used in offices, buildings, medical facilities,or campus complexes. Because of its large core diameter, multimode fiber can carrymany light rays simultaneously, each propagating at a different angle. Depending onthe refractive index profile, multimode fiber can be categorized as step- or graded-index fiber.
FIGURE 2.1 Optical fiber structure.

36 OPTICAL COMMUNICATIONS: COMPONENTS AND SYSTEMS
n2
n2
n1n1
r
n 1
n 2
n (r)
FIGURE 2.2 Step-index fiber.
Step-Index Fibers The refractive index profile of a step-index fiber is shownin Figure 2.2 Light transmission in step-index multimode fibers is based on totalinternal reflection. Since the core index is larger than that of the cladding, totalinternal reflection occurs when light rays are incident to the core–cladding interfacewith an incident angle larger than the critical angle θc. The critical angle for totalinternal reflection is given by sin θc = n2/n1. Because of total internal reflection, lightrays can propagate along the fiber core in a zigzag way if the fiber is straight withoutbending. Alternatively, light rays can travel in a straight line parallel to the fiberaxis. Since light rays travels in different paths along the fiber, they may experiencedifferent propagation delays. Suppose that all the light rays are coincident at the inputend of the multimode fiber. As they propagate through the fiber, some travel in astraight line while others may travel in zigzag paths. These rays disperse in time atthe output of the fiber. The shortest ray path is a straight line equal to the fiber lengthL , while the longest path occurs for rays with an incident angle at critical angle θc
and is of length L/ sin θc. Therefore, the propagation delay between two rays takingthe shortest and longest paths is
�T = L
v
(1
sin θc− 1
)= L
v
n1
n2�, (2.1)
where � = (n1 − n2) /n1 and v is the group velocity of light rays in the fiber.Since light rays traveling with different paths are referred to as different fiber
modes (the concept of fiber mode is discussed further in Section 2.1.2), the disper-sion in time, that is, the difference in the propagation delay for different light rays,is called modal dispersion. Because of modal dispersion, a short optical pulse willbe broadened as it propagates in a multimode fiber. The pulse broadening will intro-duce intersymbol interference, and hence limit the bit rate of optical communicationsystems. In multimode fibers, modal dispersion is one of the most important limitingfactors for high-speed optical communications. Step-index multimode fibers are usu-ally designed with a very small index difference. With � = 2 × 10⁻³, a step-indexmultimode fiber can support optical transmission with a 100-Mb/s data rate over a1-km distance. Hence, step-index multimode fibers are used only for low-data-rateapplications over short distances.

OPTICAL FIBERS 37
n2
n2
n1(r)
r
n 1(r
)
n 2
n (r)
FIGURE 2.3 Graded-index fiber.
Graded-Index Fibers In graded-index fibers, the refractive index of the core grad-ually decreases from the center of the core to the cladding, as shown in Figure 2.3.When a light ray propagates in a straight line in the center of the core, it takes theshortest path but has the lowest group velocity. Oblique rays will follow serpentinetraces due to the graded-index profile. A large portion of their paths has a smallerrefractive index, and hence they have a larger group velocity. Therefore, in a graded-index fiber with a suitable index profile, all light rays will arrive at the fiber output atthe same time. Detailed analysis found that minimum modal dispersion is
�T = 1
8
n1L
c�2, (2.2)
where c is the speed of light in vacuum. This minimum modal dispersion can beachieved with an index profile given by
n (r ) = n1[1 − � (r/a)α
], (2.3)
where α = 2 (1 − �). Since � is very small, the optimum index profile is approxi-mately parabolic. In practice, graded-index multimode fibers can support data ratesat 1 Gb/s over 10 km. To further improve the data rates and transmission distance,single-mode fibers have to be deployed.
2.1.1.2 Single-Mode Fibers Single-mode fiber has a very small core diameter,comparable to the wavelength of an optical signal, and only one fundamental fibermode exists in single-mode fibers. As a consequence, there is no modal dispersionin single-mode fibers, and very high data rates (e.g., 10 Gb/s) can be supported bysingle-mode fibers over a distance of tens of kilometers. Single-mode fibers are usedwidely in telecommunication applications, creating modern optical networks with atotal capacity above 10 Tb/s. However, there are disadvantages to using single-modefiber rather than multimode fiber. The small core diameter of single-mode fiber makesit very difficult to couple light in and out of a single-mode fiber, and it puts moreconstraints on the tolerance of connectors and splices used to connect single-modefibers.

38 OPTICAL COMMUNICATIONS: COMPONENTS AND SYSTEMS
Due to their superior performance, single-mode fibers are widely deployed forwide area networks and metropolitan area networks. Millions of miles of single-mode fibers have been laid worldwide in the ground, under the sea, or over the air.Passive optical networks also use single-mode fibers in their fiber plants to supporthigh data rates (≥ 1 Gb/s) and long-distance transmission (up to 20 km). In theremainder of the chapter we focus on the properties and transmission characteristicsof single-mode fibers.
2.1.2 Fiber Mode
Fiber mode is the optical field distribution in an optical fiber that satisfies certainboundary conditions imposed by the physical structure of the optical fiber. Thisdistribution does not change with optical signal propagation along the optical fiber(except as an attenuation factor). Like all other electromagnetic phenomena, theoptical field distribution in an optical fiber is governed by Maxwell’s equations.For homogeneous dielectric media (e.g., optical fiber), Maxwell’s equations can bewritten as
∇ × E (r, t) = −µ∂H (r, t)
∂t, (2.4)
∇ × H (r, t) = ε∂E (r, t)
∂t, (2.5)
ε∇ · E (r, t) = 0, (2.6)
µ∇ · H (r, t) = 0, (2.7)
where E and H are the electric and magnetic field vectors, respectively, and ε and µ
are the permittivity and permeability of the dielectric material.Assume that a monochromatic light wave propagates along an optical fiber in the
+z direction. The electric and magnetic fields of the light wave are given by
E (r, t) = [x Ex (x, y) + yEy (x, y) + zEz (x, y)
]e−γ ze jωt , (2.8)
H (r, t) = [x Hx (x, y) + y Hy (x, y) + zHz (x, y)
]e−γ ze jωt , (2.9)
where Ex , Ey , and Ez are the components of the electric field distribution, and Hx ,Hy , and Hz are the components of the electric field distribution in the cross sectionof the optical fiber. (x), (y), and (z) are the unit vectors in the x , y, and z directions,respectively. γ is the propagation constant of the light wave, given by
γ = α + jβ, (2.10)

OPTICAL FIBERS 39
where α is the field attenuation coefficient and β is the phase propagation constant.Substituting eqs. (2.8) and (2.9) into Maxwell’s equations yields two wave propaga-tion equations,
∂2 Ez
∂x2+ ∂2 Ez
∂y2+ κ2 Ez = 0, (2.11)
∂2 Hz
∂x2+ ∂2 Hz
∂y2+ κ2 Hz = 0, (2.12)
where κ2 = γ 2 + ω2µε. The other four field components can be found by
Ex = − γ
κ2
∂ Ez
∂x− jωµ
κ2
∂ Hz
∂y, (2.13)
Ey = − γ
κ2
∂ Ez
∂y+ jωµ
κ2
∂ Hz
∂x, (2.14)
Hz = jωµ
κ2
∂ Ez
∂y− γ
κ2
∂ Hz
∂x, (2.15)
Hy = − jωµ
κ2
∂ Ez
∂x− γ
κ2
∂ Hz
∂y. (2.16)
The equations above are written in rectangular coordinates. As an optical fiber iscylindrical, it is more convenient to work with cylindrical coordinates. In a cylin-drical coordinates, the field components in the cross section of the optical fiber canbe written
Er = Ex cos φ + Ey sin φ,
Eφ = −Ex sin φ + Ey cos φ,
Hr = Hx cos φ + Hy sin φ,
Hφ = −Hx sin φ + Hy cos φ.
The wave propagation equations, eqs. (2.11) and (2.12), written in coordinates,become
∂2 Ez
∂r2+ 1
r
∂ Ez
∂r+ 1
r2
∂2 Ez
∂φ2+ κ2 Ez = 0, (2.17)
∂2 Hz
∂r2+ 1
r
∂ Hz
∂r+ 1
r2
∂2 Hz
∂φ2+ κ2 Hz = 0. (2.18)

40 OPTICAL COMMUNICATIONS: COMPONENTS AND SYSTEMS
Solving the wave propagation, one can find the field distribution in the core andcladding of an optical fiber.
In the core, r < a, the field components are
Ez (r, φ) = AJν (pr ) e jνφ, (2.19)
Hz (r, φ) = B Jν (pr ) e jνφ, (2.20)
Er = − j
p2
(Aβp J ′
v (pr ) + j Bνωµ1
rJν (pr )
)e jνφ, (2.21)
Eφ = − j
p2
(j Aνβ
rJν (pr ) − Bpωµ1 J ′
ν (pr )
)e jνφ, (2.22)
Hr = − j
p2
(Bpβ J ′
ν (pr ) − j Aνωε1
rJν (pr )
)e jνφ, (2.23)
Hφ = − j
p2
(j Bνβ
rJν (pr ) + Apωε1 J ′
ν (pr )
)e jνφ, (2.24)
and in the cladding, r > a, the field components are
Ez (r, φ) = C Kν (qr ) e jνφ, (2.25)
Hz (r, φ) = DKν (qr ) e jνφ, (2.26)
Er = − j
q2
(Cβq K ′
v (qr ) + j Dνωµ2
rKν (qr )
)e jνφ, (2.27)
Eφ = − j
q2
(jCνβ
rKν (qr ) − Dqωµ2 K ′
ν (qr )
)e jνφ, (2.28)
Hr = − j
q2
(DqβK ′
ν (qr ) − jCνωε2
rKν (qr )
)e jνφ, (2.29)
Hφ = − j
q2
(j Dνβ
rKν (qr ) + Cqωε2 K ′
ν (qr )
)e jνφ, (2.30)
where ν is an integer, Jν a Bessel function of the first kind of order ν, and Kν
a modified Bessel function of the second kind of order ν. J ′ν and K ′
ν represent,respectively, the derivatives of Jν and Kν . ε1 and ε2 are the permittivities of the coreand cladding, respectively. µ1 and µ2 are the permeabilities of the core and cladding,

OPTICAL FIBERS 41
respectively. The parameters p and q are given by
p2 = n21k2
0 − β2, (2.31a)
q2 = β2 − n22k2
0 . (2.31b)
The wave number k0 is defined as k0 = 2π/λ, and the propagation constant β satisfiesn2k0 < β < n1k0. The constants β, A, B, C, and D can be determined by applying theboundary conditions for the two tangential components of the electric and magneticfields at the core–cladding interface, r = a. The following four equations in unknownsA, B, C, D, and β are derived from the boundary conditions:
⎡⎢⎢⎢⎢⎢⎢⎢⎢⎢⎢⎢⎣
Jν(pa) 0 −Kν(qa) 0
βν
p2aJν(pa)
jωµ1
pJ ′ν(pa)
βν
q2aKν(qa)
jωµ2
qK ′
ν(qa)
0 Jν(pa) 0 −Kν(qa)
− jωε1
pJ ′ν(pa)
βν
p2aJν(pa) −− jωε2
qK ′
ν(qa)βν
q2aKν(qa)
⎤⎥⎥⎥⎥⎥⎥⎥⎥⎥⎥⎥⎦
⎡⎢⎢⎢⎢⎢⎢⎢⎢⎢⎢⎣
A
B
C
D
⎤⎥⎥⎥⎥⎥⎥⎥⎥⎥⎥⎦
=
⎡⎢⎢⎢⎢⎢⎢⎢⎢⎢⎢⎣
0
0
0
0
⎤⎥⎥⎥⎥⎥⎥⎥⎥⎥⎥⎦
.
These homogeneous equations have a nontrivial solution if the determinant of thecoefficient matrix vanishes. Thus we have the characteristic equation
(J ′ν (pa)
p Jν (pa)+ K ′
ν (qa)
q Jν (qa)
)(n2
1 J ′ν (pa)
p Jν (pa)+ n2
2 K ′ν (qa)
q Jν (qa)
)k2
0 =(
βν
a
)2 (1
p2+ 1
q2
)2
.
(2.32)
For a given ν and ω only a finite number of values β can be found which satisfy thecharacteristic equation and n2k0 < β < n1k0. A fiber mode is determined uniquelyby its propagation constant β. Having found β, we then have
B
A= jβν
ωµ
[1
(pa)2 + 1
(qa)2
] [J ′ν (pa)
pa Jν (pa)+ K ′
ν (qa)
qaKν (qa)
],
C
A= Jν (pa)
Kν (qa),
D
A= C
A
B
A.
The only undetermined coefficient A can be found by the power constraint of thelight wave.
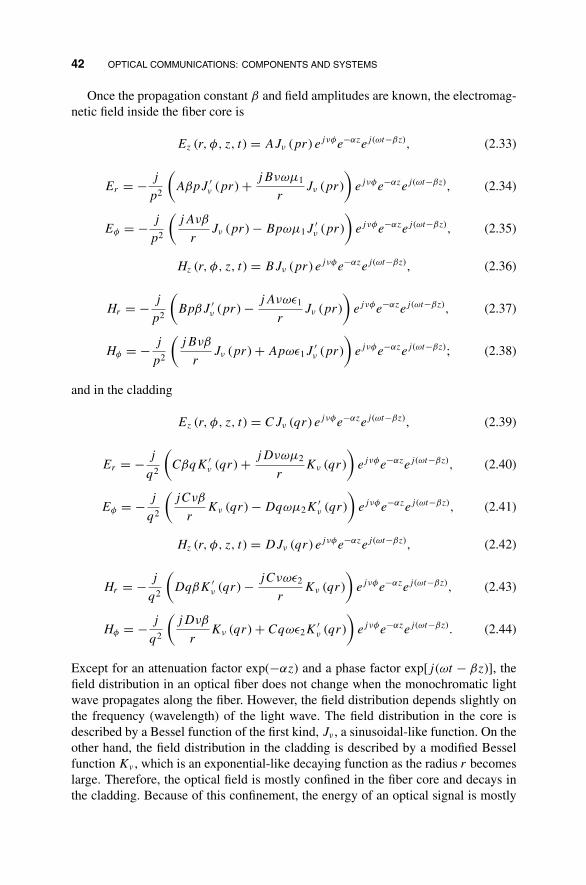
42 OPTICAL COMMUNICATIONS: COMPONENTS AND SYSTEMS
Once the propagation constant β and field amplitudes are known, the electromag-netic field inside the fiber core is
Ez (r, φ, z, t) = AJν (pr ) e jνφe−αze j(ωt−βz), (2.33)
Er = − j
p2
(Aβp J ′
v (pr ) + j Bνωµ1
rJν (pr )
)e jνφe−αze j(ωt−βz), (2.34)
Eφ = − j
p2
(j Aνβ
rJν (pr ) − Bpωµ1 J ′
ν (pr )
)e jνφe−αze j(ωt−βz), (2.35)
Hz (r, φ, z, t) = B Jν (pr ) e jνφe−αze j(ωt−βz), (2.36)
Hr = − j
p2
(Bpβ J ′
ν (pr ) − j Aνωε1
rJν (pr )
)e jνφe−αze j(ωt−βz), (2.37)
Hφ = − j
p2
(j Bνβ
rJν (pr ) + Apωε1 J ′
ν (pr )
)e jνφe−αze j(ωt−βz); (2.38)
and in the cladding
Ez (r, φ, z, t) = C Jν (qr ) e jνφe−αze j(ωt−βz), (2.39)
Er = − j
q2
(Cβq K ′
v (qr ) + j Dνωµ2
rKν (qr )
)e jνφe−αze j(ωt−βz), (2.40)
Eφ = − j
q2
(jCνβ
rKν (qr ) − Dqωµ2 K ′
ν (qr )
)e jνφe−αze j(ωt−βz), (2.41)
Hz (r, φ, z, t) = D Jν (qr ) e jνφe−αze j(ωt−βz), (2.42)
Hr = − j
q2
(DqβK ′
ν (qr ) − jCνωε2
rKν (qr )
)e jνφe−αze j(ωt−βz), (2.43)
Hφ = − j
q2
(j Dνβ
rKν (qr ) + Cqωε2 K ′
ν (qr )
)e jνφe−αze j(ωt−βz). (2.44)
Except for an attenuation factor exp(−αz) and a phase factor exp[ j(ωt − βz)], thefield distribution in an optical fiber does not change when the monochromatic lightwave propagates along the fiber. However, the field distribution depends slightly onthe frequency (wavelength) of the light wave. The field distribution in the core isdescribed by a Bessel function of the first kind, Jν , a sinusoidal-like function. On theother hand, the field distribution in the cladding is described by a modified Besselfunction Kv , which is an exponential-like decaying function as the radius r becomeslarge. Therefore, the optical field is mostly confined in the fiber core and decays inthe cladding. Because of this confinement, the energy of an optical signal is mostly

OPTICAL FIBERS 43
concentrated in the fiber core, and the optical fiber becomes an effective waveguideat optical frequencies. Optical signal can propagate along an optical fiber over a longdistance with small attenuation.
Solving the characteristic equation (2.32), we find that two sets of modes exist inthe fiber, whose characteristic equations are, for HE modes,
Jν−1 (pa)
pa Jν (pa)= −n2
1 + n22
2n21
K ′ν (qa)
qaKν (qa)+ ν
pa+ R, (2.45)
and for EH modes,
Jν+1 (pa)
pa Jν (pa)= n2
1 + n22
2n21
K ′ν (qa)
qaKν (qa)+ ν
pa+ R, (2.46)
where
R =[(
n21 − n2
2
2n21
)2 (K ′
ν (qa)
qaKν (qa)
)2
+(
βν
n1k0
)2 (1
p2a2+ 1
q2a2
)2]1/2
.
The characteristic equations can be solved numerically to find the propagation con-stant β. In general, both Ez and Hz are nonzero (except in the case of ν = 0).Therefore, these fiber modes are referred to as hybrid modes, and the solutions aredenoted by EHνm or HEνm , depending on whether Ez or Hz dominates. When ν = 0,there is no φ dependence for the field distribution; that is, the field components areradially symmetric. In this case, one of the longitudinal field components (either Ez
or Hz) is zero, so we have transverse (TE or TM) modes. For the TE mode, thecharacteristic equation becomes
J ′0 (pa)
p J0 (pa)+ K ′
0 (qa)
q K0 (qa)= 0. (2.47)
In this case, A = C = 0 (i.e., Ez = 0). The only nonvanishing field components areEr , Hr , and Hz . For the TM mode, the characteristic equation is
n21
J ′0 (pa)
p J0 (pa)+ n2
2K ′
0 (qa)
q K0 (qa)= 0. (2.48)
Now, B = D = 0, and we have TM modes with nonvanishing field components Hr ,Er , and Ez . The characteristic equation can be plotted as a function of pa. Sincen1 ≈ n2, the solutions of the characteristic equation for TE0m are very close to thoseof TM0m.
Single-Mode Condition A fiber mode is referred to as being cut off when it is nolonger bound to the fiber core; in other words, the field does not decay in the cladding.

44 OPTICAL COMMUNICATIONS: COMPONENTS AND SYSTEMS
The cutoffs for the various modes are founded by solving the characteristic equationin the limit q → 0. By a proper choice of the core radius a, core refractive index n1,and cladding refractive index n2, so that
V = k0a√
n21 − n2
2 ≈ 2πa
λn1
√2� ≤ 2.405, (2.49)
TE0m, TM0m, and all other higher-order modes are cut off for a light wave withwavelength λ. However, the HE11 mode is the fundamental mode of optical fibers andhas no cutoff. Hence, single-mode fibers are designed to satisfy the cutoff conditionin eq. (2.49) and supports on the HE11 mode. Typically, telecommunication fibersoperate in single mode for wavelength λ > 1.2 µm. These fibers are usually designedwith a core radius of 3 to 5 µm and � = 3 to 5×10⁻³.
The field distribution for a single-mode fiber is often approximated by a Gaussiandistribution
Ez (r, φ) = A exp
(− r2
w2
), (2.50)
where w is the field radius (sometimes called the spot size). 2w is commonly knownas the mode field diameter. For 1.2 < V < 2.4, the field radius can be approximatedby
w/a ≈ 0.65 + 1.619V −3/2 + 2.879V −6. (2.51)
Hence, the field radius decreases as V increases. The fraction of optical powercontained in the fiber core is referred to as the confinement factor. For weaklyguiding fiber (small �), the confinement factor is given by
� = Pcore
Ptotal=
∫ a0 |E |2r dr∫ ∞0 |E |2r dr
=(
1 − p2
V 2
) (1 − J 2
ν (pa)
Jν+1 (pa) Jν−1 (pa)
). (2.52)
Using Gaussian approximation for the field distribution, the confinement factor canbe found as
� = 1 − exp
(−2a2
w2
). (2.53)
As V increases, the mode field diameter decreases, and the optical power is moreconfined in the core, providing better guidance for optical signals. However, tomaintain single-mode operation, V must be less than 2.405. Therefore, most telecomsingle-mode fibers are designed with 2 < V < 2.4.
OPTICAL FIBERS 45
2.1.3 Fiber Loss
Various loss mechanisms attenuate optical signal propagating along the fiber. Sinceoptical receivers need a minimum amount of optical power to recover the informa-tion transmitted, fiber loss limits the maximum distance that an optical signal canbe transmitted. Therefore, fiber loss is a fundamental limiting factor in long-hauloptical communication systems. Even though modern optical networks use multiplestages of optical amplifiers to compensate for the fiber loss, optical amplifiers addamplified spontaneous noise. There is a limit on the maximum reach that an opticalcommunication system can support no matter how many optical amplifiers are used.In passive optical networks, optical amplifiers are not commonly used, for reasons ofeconomics. Current TDM PONs are essentially power limited, with fiber loss playinga significant role in the total power budget constraints.
When an optical signal propagates along an optical fiber, its power attenuation isdescribed by
dP/dz = α f P, (2.54)
where α f is the power attenuation coefficient of the optical fiber. If at the transmitterside an optical power signal with power Pin is launched into an optical fiber of lengthL , after propagating through an optical fiber, the optical power received at the otherend of the fiber is
Pout = Pin exp(−α f z
). (2.55)
Therefore, the optical power is attenuated exponentially in an optical fiber. Mod-ern optical communication only became possible when low-attenuation fibers werefabricated in 1970s.
Figure 2.4 shows the fiber loss of standard single-mode fiber as a function ofwavelength. There are three wavelength regions for local loss minima: 0.85, 1.30, and1.55 µm. Historically, when low-loss optical fibers were developed (but the impurityconcentration was still higher than modern fibers), the first window (0.85 µm) wasopened, matching the wavelength of AlGaAs semiconductor lasers developed inthe earlier years. This window has a loss at about 2 dB/km, which is too high formodern telecommunication applications but is still widely used for short-distancedata communications (e.g., gigabit Ethernet). As the fiber fabrication process wasimproved further in the late 1970s, lower-loss windows become available at 1.30 and1.55 µm. Because of its low loss (in addition, low dispersion at 1.31 µm), these twowindows are preferred for long-reach high-data-rate optical communications. Thelosses are 0.5 and 0.2 dB/km for wavelengths at 1.30 and 1.55 µm, respectively.In current TDM PON standards, the wavelength at 1.31 µm is used for upstreamtransmission, while the wavelength at 1.55 µm band (1490 nm) is used for downstreamtransmission.
Three major factors contribute to the fiber loss spectrum: material absorption,Rayleigh scattering, and waveguide imperfections. In practice, fiber connectors and

46 OPTICAL COMMUNICATIONS: COMPONENTS AND SYSTEMS
FIGURE 2.4 Optical fiber loss spectrum.
splice and nonlinear effects (e.g., stimulated Raman–Brillouin scattering) also con-tribute to power loss when an optical signal propagates along the fiber.
Material absorption results from both fused silica (SiO2 from which fiber is made)and impurities such as water and transition metals (e.g., Fe, Cu, and Ni). In fused silica,electronic resonance creates strong absorption peaks in the ultraviolet region, andmolecular vibration absorbs infrared wavelengths. The tails of these resonance peaksextend into the three windows of optical communications. This intrinsic material losssets the fundamental limit on fiber loss, typically less than 0.03 dB/km from 1.3 to1.6 µm. Much of the improvement in reducing fiber loss in the early years camefrom material purification. The transition metals can lead to significant absorption inwavelengths from 0.8 to 1.6 µm. To achieve a loss below 1 dB/km, the concentrationof transition metal impurities has to be reduced to 1 part per billion. Residue watervapor or, to be more exact, OH ions have absorption resonance peaks around 1.39,1.24, and 0.95 µm. Development of a new fiber fabrication process has lead todry fibers, in which the OH ion absorption peaks are eliminated. This type of fiberopens the entire 1.3 to 1.60-µm wavelength region for high-speed long-haul opticalcommunications. Dopants used to change the refractive index of the fiber core orcladding, such GeO2, P2O5, and B2O3, also cause the loss of optical power.
Rayleigh scattering results from the refractive index fluctuation in fiber materials.During the fabrication process, silica preform is melted, drawn into fibers, and thencooled down. The small fluctuations in refractive index are on a scale smaller thanthe wavelength of the optical signal, but these random changes still lead to lightscattering. The Rayleigh scattering is inverse proportional to the optical wavelength:
αR = CR
λ4, (2.56)

OPTICAL FIBERS 47
where the parameter CR is about 0.7 to 0.9 dB/km·µm4. Therefore, Rayleigh scat-tering is more significant for shorter wavelengths, and it is a dominant factor insingle-mode fibers for wavelengths from 0.8 to 1.6 µm.
Ideally, optical fiber is a perfect cylinder with constant core diameter and a smoothcore–cladding interface. However, waveguide imperfections such as bending and coreradius variation will lead to optical power loss. Coupling between guiding modes andcladding mode occurs when there are refractive index inhomogeneities at the core–cladding interface. Small fiber bends may lead to a part of optical energy beingscattered into the cladding layer. To reduce the fiber loss resulting from waveguideimperfection, fiber diameter is monitored closely during fiber drawing to ensure thatthe variations in fiber diameter are less than 1%. In addition, fiber installation andcabling are designed to minimize the random axial distortions.
2.1.4 Fiber Dispersion
In addition to fiber loss, dispersion of optical pulse is another detrimental effect ofoptical transmission in optical fibers. Dispersion leads to pulse broadening and inter-symbol interference. As a consequence, long-distance high-bit-rate communicationsystems are limited by fiber dispersion. There are basically three types of dispersionin optical fibers: modal dispersion, intramodal dispersion, and polarization mode dis-persion. Modal dispersion, or intermodal dispersion, is the dominant effect when it ispresent in multimodal fiber. As discussed in Section 2.1.2, each mode in a multimodefiber has a characteristic group velocity and corresponding propagation delay. Themodal dispersion is the difference between the longest and shortest propagation de-lays. In single-mode fiber, modal dispersion vanishes as the energy of optical signalsis coupled into a single mode. Intramodal dispersion, or chromatic dispersion, is thedifference in propagation delay for different spectral components of an optical signal.Two sources of chromatic dispersion in single-mode fibers are material dispersionand waveguide dispersion. Polarization mode dispersion is due to birefringence inoptical fibers, which leads to different group velocity for two orthogonal polarizationmodes.
2.1.4.1 Modal Dispersion Modal dispersion is related to the group velocityand propagation delay of different modes. The group velocity of an optical signal isdefined as
vg = dω
dβ, (2.57)
and the propagation delay in an optical fiber with length L is given by
τ = L
vg= L
dβ
dω. (2.58)

48 OPTICAL COMMUNICATIONS: COMPONENTS AND SYSTEMS
For weakly guiding fibers (� 1), the propagation constant for a mode denoted byνm can be written as
βνm = ωn2
c(1 + �bνm) , (2.59)
where b is the normalized propagation constant given by
bνm = βνm/k0 − n2
n1 − n2. (2.60)
Therefore, the propagation delay for mode νm is
τ
L= dβνm
dω= 1
c
(n2 + ω
dn2
dω
)(1 + bνm�) + ωn2
c
d (bνm�)
dω. (2.61)
In this equation, the first term on the right-hand side represents material dispersion,and the second term describes the excess delay due to the waveguide. Modal dis-persion is part of waveguide dispersion contained in the second term, and it is thedominant waveguide dispersion in multimode fibers. Modal dispersion is determinedby the difference in propagation delay between the fastest and slowest modes.
The modal dispersion for an optical fiber with unit length can be rewritten as
τw = n2�
c
d (V bνm)
dV= n2�
c
[1 − p2
q2
(1 − 2K 2
ν (qa)
Kν−1 (qa) Kν+1 (qa)
)]. (2.62)
Away from cutoff (ν � 1), the term d (V bνm) /dV is approximately 2 (ν − 1) /ν.Obviously, different modes ν give different propagation delays. For ν = 0, 1, and2, these modes travel fastest, and d(V bνm)/dV ≈ 1; for ν = νmax, the mode travelsslowest. Therefore, for an optical fiber with unit length, the difference in propagationdelays for the fastest and slowest modes is given by
δτw = n1 − n2
c
(1 − 2
νmax
). (2.63)
Since the largest mode number that can be supported in an optical fiber is approxi-mately νmax ≈ 2V/π , the modal dispersion in a multimode step-index fiber can beexpressed as
δτw = n1 − n2
c
(1 − π
V
). (2.64)
Modal dispersion is a multipath phenomenon, independent of the characteristics ofthe optical signal transmitted. The total modal dispersion is found by multiplying thedispersion per unit length by the total length of the fiber. In practice, when fiber is

OPTICAL FIBERS 49
longer than a critical length called the coupling length, the total modal dispersionincreases as the square root of the fiber length. The reason for this reduction in totaldispersion is mode coupling. The modal dispersion can be reduced by making � small.Small � leads to smaller V , reducing the number of modes that can be supported inthe fiber. Hence, the longest propagation delay is reduced with essentially no changein the shortest.
2.1.4.2 Intramodal Dispersion Modal dispersion can be eliminated effec-tively by reducing the number of modes to one. Single-mode fibers carry only thelowest-order mode, the HE11 mode. The cutoff condition for other modes (e.g., theTE01 or TM01 mode) is V < 2.405. In single-mode fibers, intramodal dispersionbecomes significant. Intramodal dispersion results from different frequency compo-nents of an optical signal having a different group velocity in an optical fiber. Hence,intramodal dispersion is also called group velocity dispersion. It includes mainlymaterial dispersion and waveguide dispersion. Material dispersion results when thedielectric constant and index of refraction vary with frequency (wavelength). Waveg-uide dispersion is the result of the waveguide structure of an optical fiber, where thepropagation parameters depend on the waveguide structure.
If an optical signal with a spectrum width δω propagates along an optical fiberof length L , group velocity dispersion leads to pulse distortion because differentspectrum components travel with different group velocity and arrive at the fiberoutput with different propagation delays. The difference in propagation delay fordifferent spectrum components can be found by
δτ = dτ
dω= d
dω
(L
vg
)δω, (2.65)
from which we have
δτ = Ld2β
dω2�ω, (2.66)
where β2 = d2β/dω2 is known as the group velocity dispersion parameter. For twosignals separated by a unit wavelength, the difference in group delay in an opticalfiber with unit length is defined as the fiber dispersion parameter, given by
D = d
dλ
(1
vg
)= −2πc
λ2β2. (2.67)
Since
dβ
dω= 1
c
(n2 + ω
dn2
dω
)(1 + b�) + ωn2
c
d (b�)
dω, (2.68)

50 OPTICAL COMMUNICATIONS: COMPONENTS AND SYSTEMS
we can find the group velocity dispersion parameter as
d2β
dω2= 1
c
dN2
dω
(1 + �
d(Vb)
dV
)+ 1
ωc
�N2
n2V
d2(Vb)
dV2 + N2
c
d�
dω
d2(V 2b)
dV2 ,
(2.69)
where N2 is the group index, defined as
N2 = n2 + ωdn2
dω. (2.70)
Based on the group velocity dispersion parameter β2, the fiber dispersion parametercan be determined as
D = Dm + Dw + Dd , (2.71)
where the material dispersion parameter is given by
Dm = ω
λc
d N2
dω
(1 + �
d(Vb)
dV
)= −λ
c
d2n2
dλ2
(1 + �
d(Vb)
dV
), (2.72)
the waveguide dispersion parameter is
Dw = − 1
λc
�N 22
n2
(V
d2(Vb)
dV2
)= − N1 − N2
λc
(V
d2(Vb)
dV2
), (2.73)
and the differential material dispersion parameter is
Dd = −ωN2
λc
d�
dω
d2(V 2b
)dV2 . (2.74)
For the material dispersion parameter (2.72), the term � · d(Vb) is small, and thusthe material dispersion is determined largely by the wavelength dependence of n2.For standard single-mode fibers, the material dispersion is negative for smaller wave-length (< 1.3µm) and positive for longer wavelength. For the waveguide dispersionparameter (2.73), the term in parentheses is due to the effect of the waveguide on thepropagation constant. The waveguide dispersion for standard single-mode fibers isnegative. For the differential material dispersion parameter, d�/dω is very small, andhence the differential material dispersion parameter in standard single-mode fibers isusually neglected.
Figure 2.5 shows the dispersion parameter of the standard single-mode fiber atvarious wavelengths, as well the material dispersion parameter and the waveguidedispersion parameter. Since the negative waveguide dispersion balances the positivematerials dispersion, the zero-dispersion wavelength of the standard single-mode

OPTICAL FIBERS 51
40
20
0
–20
–40
–601000 1200 1400
Wavelength (nm)
Fib
er D
ispe
rsio
n (p
s/nm
/km
)
Waveguide dispersion
Total dispersion
Material dispersion
1600 1800
FIGURE 2.5 Dispersion coefficient of standard single-mode fiber.
fiber is around 1300 nm. The dispersion parameter of standard single-mode fiber inthe 1.55-µm wavelength region is about 17 ps/km·nm. As the waveguide dispersionDw depends on fiber parameters such as the core radius a and the refractive indexdifference �, with proper design to make the absolute value of waveguide dispersionlarger, it is possible to shift the zero-dispersion wavelength into the 1550-nm regionwith lowest fiber loss. This type of fiber is called dispersion-shifted fiber. Furthermore,by using multiple cladding layers and a more complex refractive index profile, it ispossible to achieve a low total dispersion over a wide range of wavelength. Suchfibers are called dispersion-flattened fibers.
When an optical communication system operates in wavelengths away from zero-dispersion wavelength, pulse distortion is determined primarily by the first-orderdispersion parameter D. However, when the system operates at the zero-dispersionwavelength, then higher-order dispersion becomes significant. The dominant higher-order dispersive effects are dominated by the dispersion slope, given by
S = d D
dλ=
(2πc
λ2
)2 d3β
dω3+ 2πc
λ3
d2β
dω2. (2.75)
The dispersion slope is also called the differential-dispersion parameter or second-order dispersion parameter. At zero-dispersion wavelength, d2β/dω2 = 0, so thesecond-order dispersion is proportional to d3β/dω3. For a source with spectral widthδλ, the effective value of the dispersion parameter becomes Deff = Sδλ.
2.1.4.3 Polarization Mode Dispersion For an ideal optical fiber with cylin-drical symmetry, optical signals with two orthogonally polarized modes have thesame propagation constant. However, due to irregularities in fiber geometry and

52 OPTICAL COMMUNICATIONS: COMPONENTS AND SYSTEMS
nonuniform stress in cabling of optical fibers, optical fibers can never be perfectlycylindrical. As a consequence, the mode indices and propagation constants associatedwith two orthogonally polarized optical signals exhibit a slight difference. If an inputoptical pulse excites both polarization modes, the pulse will become broader at thefiber output since the two polarization components disperse along the fiber becauseof their different group velocities. This phenomenon is known as polarization modedispersion. Similar to group velocity dispersion, pulse broadening can be estimatedfrom the time delay δT between the two polarization components, given by
δT =∣∣∣∣ L
vgx− L
vgy
∣∣∣∣ = L
∣∣∣∣dβx
dω− dβy
dω
∣∣∣∣ , (2.76)
where the subscripts x and y denote the two orthogonal polarization modes. Polar-ization mode dispersion can be characterized by
δβ1 =∣∣∣∣dβx
dω− dβy
dω
∣∣∣∣ . (2.77)
However, δβ1 cannot be used directly to estimate polarization mode dispersion be-cause of random mode coupling. In practice, polarization mode dispersion is usuallycharacterized by the root-mean-square value of δT ,
σ 2T = 1
2(δβ1)2 h2
[2L
h− 1 + exp
(−2L
h
)], (2.78)
where h is the decorrelation length, with typical values in the range 1 to 10 m. ForL � h,
σT ≈ δβ1
√hL = Dp
√L, (2.79)
where Dp is the polarization mode dispersion parameter. Typical values of Dp arein the range 0.1 to 1 ps/
√km. Because of its square-root dependence on the fiber
length, pulse broadening induced by polarization mode dispersion is relatively smallcompared with the group velocity dispersion. However, polarization mode dispersioncan become a dominant factor for high-speed fiber optic communication systemsoperating over a long distance near the zero-dispersion wavelength or with dispersioncompensation.
2.1.5 Nonlinear Effects
Even though silica is not a highly nonlinear medium, nonlinear processes can beobserved in optical fibers at relatively lower power levels (10 mW) because of twoimportant characteristics of single-mode fibers: a small spot size (which leads to highintensities at low powers) and extremely low loss (which results in long effective
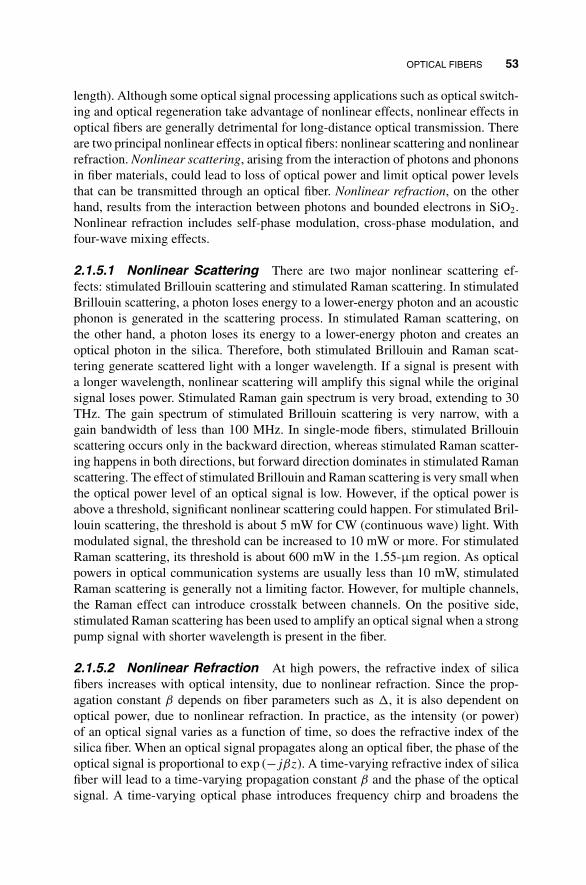
OPTICAL FIBERS 53
length). Although some optical signal processing applications such as optical switch-ing and optical regeneration take advantage of nonlinear effects, nonlinear effects inoptical fibers are generally detrimental for long-distance optical transmission. Thereare two principal nonlinear effects in optical fibers: nonlinear scattering and nonlinearrefraction. Nonlinear scattering, arising from the interaction of photons and phononsin fiber materials, could lead to loss of optical power and limit optical power levelsthat can be transmitted through an optical fiber. Nonlinear refraction, on the otherhand, results from the interaction between photons and bounded electrons in SiO2.Nonlinear refraction includes self-phase modulation, cross-phase modulation, andfour-wave mixing effects.
2.1.5.1 Nonlinear Scattering There are two major nonlinear scattering ef-fects: stimulated Brillouin scattering and stimulated Raman scattering. In stimulatedBrillouin scattering, a photon loses energy to a lower-energy photon and an acousticphonon is generated in the scattering process. In stimulated Raman scattering, onthe other hand, a photon loses its energy to a lower-energy photon and creates anoptical photon in the silica. Therefore, both stimulated Brillouin and Raman scat-tering generate scattered light with a longer wavelength. If a signal is present witha longer wavelength, nonlinear scattering will amplify this signal while the originalsignal loses power. Stimulated Raman gain spectrum is very broad, extending to 30THz. The gain spectrum of stimulated Brillouin scattering is very narrow, with again bandwidth of less than 100 MHz. In single-mode fibers, stimulated Brillouinscattering occurs only in the backward direction, whereas stimulated Raman scatter-ing happens in both directions, but forward direction dominates in stimulated Ramanscattering. The effect of stimulated Brillouin and Raman scattering is very small whenthe optical power level of an optical signal is low. However, if the optical power isabove a threshold, significant nonlinear scattering could happen. For stimulated Bril-louin scattering, the threshold is about 5 mW for CW (continuous wave) light. Withmodulated signal, the threshold can be increased to 10 mW or more. For stimulatedRaman scattering, its threshold is about 600 mW in the 1.55-µm region. As opticalpowers in optical communication systems are usually less than 10 mW, stimulatedRaman scattering is generally not a limiting factor. However, for multiple channels,the Raman effect can introduce crosstalk between channels. On the positive side,stimulated Raman scattering has been used to amplify an optical signal when a strongpump signal with shorter wavelength is present in the fiber.
2.1.5.2 Nonlinear Refraction At high powers, the refractive index of silicafibers increases with optical intensity, due to nonlinear refraction. Since the prop-agation constant β depends on fiber parameters such as �, it is also dependent onoptical power, due to nonlinear refraction. In practice, as the intensity (or power)of an optical signal varies as a function of time, so does the refractive index of thesilica fiber. When an optical signal propagates along an optical fiber, the phase of theoptical signal is proportional to exp (− jβz). A time-varying refractive index of silicafiber will lead to a time-varying propagation constant β and the phase of the opticalsignal. A time-varying optical phase introduces frequency chirp and broadens the
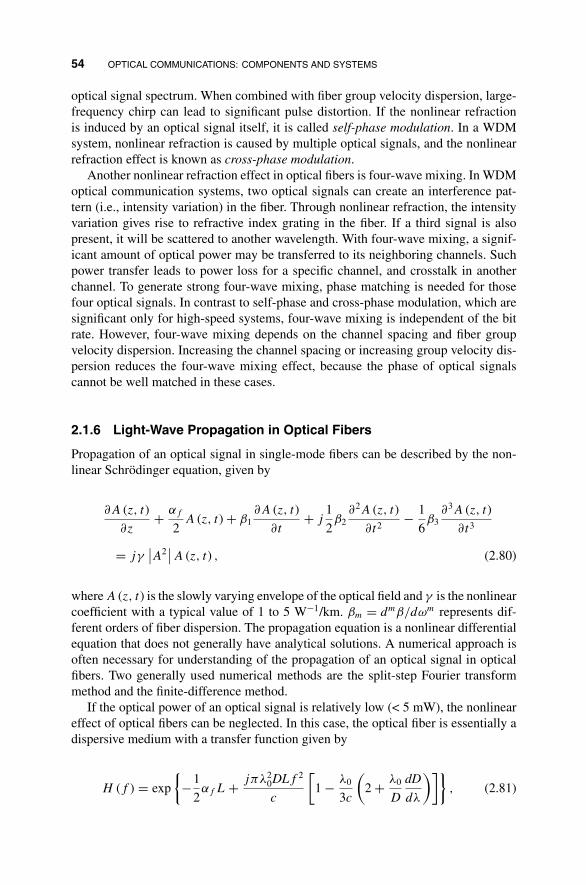
54 OPTICAL COMMUNICATIONS: COMPONENTS AND SYSTEMS
optical signal spectrum. When combined with fiber group velocity dispersion, large-frequency chirp can lead to significant pulse distortion. If the nonlinear refractionis induced by an optical signal itself, it is called self-phase modulation. In a WDMsystem, nonlinear refraction is caused by multiple optical signals, and the nonlinearrefraction effect is known as cross-phase modulation.
Another nonlinear refraction effect in optical fibers is four-wave mixing. In WDMoptical communication systems, two optical signals can create an interference pat-tern (i.e., intensity variation) in the fiber. Through nonlinear refraction, the intensityvariation gives rise to refractive index grating in the fiber. If a third signal is alsopresent, it will be scattered to another wavelength. With four-wave mixing, a signif-icant amount of optical power may be transferred to its neighboring channels. Suchpower transfer leads to power loss for a specific channel, and crosstalk in anotherchannel. To generate strong four-wave mixing, phase matching is needed for thosefour optical signals. In contrast to self-phase and cross-phase modulation, which aresignificant only for high-speed systems, four-wave mixing is independent of the bitrate. However, four-wave mixing depends on the channel spacing and fiber groupvelocity dispersion. Increasing the channel spacing or increasing group velocity dis-persion reduces the four-wave mixing effect, because the phase of optical signalscannot be well matched in these cases.
2.1.6 Light-Wave Propagation in Optical Fibers
Propagation of an optical signal in single-mode fibers can be described by the non-linear Schrodinger equation, given by
∂ A (z, t)
∂z+ α f
2A (z, t) + β1
∂ A (z, t)
∂t+ j
1
2β2
∂2 A (z, t)
∂t2− 1
6β3
∂3 A (z, t)
∂t3
= jγ∣∣A2
∣∣ A (z, t) , (2.80)
where A (z, t) is the slowly varying envelope of the optical field and γ is the nonlinearcoefficient with a typical value of 1 to 5 W−1/km. βm = dmβ/dωm represents dif-ferent orders of fiber dispersion. The propagation equation is a nonlinear differentialequation that does not generally have analytical solutions. A numerical approach isoften necessary for understanding of the propagation of an optical signal in opticalfibers. Two generally used numerical methods are the split-step Fourier transformmethod and the finite-difference method.
If the optical power of an optical signal is relatively low (< 5 mW), the nonlineareffect of optical fibers can be neglected. In this case, the optical fiber is essentially adispersive medium with a transfer function given by
H ( f ) = exp
{−1
2α f L + jπλ2
0DL f 2
c
[1 − λ0
3c
(2 + λ0
D
dD
dλ
)]}, (2.81)

OPTICAL TRANSMITTERS 55
where d D/Dλ is the dispersion slope. If the optical wavelength is far away fromthe zero-dispersion wavelength, second-order dispersion (dispersion slope) can beneglected, and the fiber transfer function can be simplified as
H ( f ) = exp
(−1
2α f L + jπλ2
0 DL f 2
c
). (2.82)
Neglecting nonlinear effect, an optical fiber introduce an attenuation factor and anonlinear phase factor.
2.2 OPTICAL TRANSMITTERS
Optical transmitters convert electrical signals to optical signals and launch the opti-cal signals into optical fibers for optical transmission. A key component in opticaltransmitters is an optical source. Semiconductor lasers are commonly used in opticaltransmitters because of their narrow spectral width, high-speed modulation, compactsize, and good reliability. Passive optical networks usually utilize direct modulationof semiconductor lasers for optical transmission up to 10 Gb/s. However, for trans-mitters with direction modulation, the wide spectrum of optical signals transmitted,combined with fiber dispersion, limits the optical transmission distance at high datarates. In high-performance optical communication systems, optical modulators areused to convert electrical signals to optical signals, while semiconductor lasers serveas CW (continuous wave) light sources. In this section we review operation principlesand characteristics of semiconductor lasers and optical modulators. Furthermore, thedesign of optical transmitters is discussed, with emphasis on the system performanceof optical transmissions.
2.2.1 Semiconductor Lasers
Semiconductor lasers were invented in 1962 with pulsed operation at liquid-nitrogentemperature (77 K). In the 1970s, CW semiconductor lasers operating at room temper-ature became available and widely used in optical communication systems with directmodulation. Since then, various types of semiconductor lasers have been developedwith improved performance and reliability, including FP (Fabry–Perot) lasers, DFB(distributed feedback) lasers, DBR (distributed Bragg reflector) lasers, and VCSELs(vertical cavity surface-emitting lasers). In addition, tunable semiconductor lasershave been demonstrated for optical networks with improved performance.
2.2.1.1 Principle of Operation The operation of semiconductor lasers is basedon stimulated emission. Figure 2.6 shows the band diagram of a semiconductor witha direct bandgap (i.e., the minimum of conduction band is coincident with the maxi-mum of the valence band). When the energy of a photon is larger than the bandgapof the semiconductor material, carriers (electrons and holes) in the semiconductorcan interact with photons in a number of ways. An electron in the valence band can

56 OPTICAL COMMUNICATIONS: COMPONENTS AND SYSTEMS
FIGURE 2.6 Optical processes in a direct bandgap semiconductor: absorption, sponta-neous emission, and stimulated emission. In absorption, the loss of photon energy generatesan electron–hole pair. In spontaneous emission, the recombination of an electron–hole pairgenerates a photon. In stimulated emission, a photon stimulates the recombination of anelectron–hole pair, and another photon with the same energy and direction as the incidentphoton is generated.
absorb the energy of a photon and end up in the conduction band. Meanwhile, ahole is generated in the valence band. This is the normal case of absorption in anysemiconductor materials. The excited electron in the conduction band will eventu-ally combine with a hole in the valence band and emit a photon when the transitionhappens. This is called spontaneous emission. The photon emitted by spontaneousemission has a random direction, but with an energy equal to the transition energy(from conduction band to valence band) of the electron. A third process, stimulatedemission, happens when a photon stimulates the transition of an electron in the con-duction band to the valence band and an additional photon is emitted with the sameenergy and direction as the incident photon. Through stimulated emission, opticalsignals can be amplified as more photons are generated in the process. For a semi-conductor material in equilibrium, there are more electrons in the valence band andmore holes in the conduction band. Therefore, the absorption process dominates bothspontaneous and stimulated emission, and the semiconductor material is absorptivefor optical signals with photon energy larger than its bandgap. For optical amplifica-tion to happen, the stimulated emission process must be stronger than the absorptionprocess. This can be achieved in nonequilibrium states with population inversion. Insemiconductor materials, population inversion requires that the probability of occu-pation for electrons in the bottom of the conduction band is larger than the probabilityof occupation for electrons in the valence band. In other words, there are a large num-ber of electrons in the bottom of the conduction band and a large number of holes inthe valence band. When a photon with appropriate energy (larger than the bandgapenergy) is incident in the semiconductor, there is a higher probability that the photonwill stimulate the recombination of electrons in the conduction band and holes in thevalence band than when the photon energy is absorbed by an electron in the valenceband. To achieve population inversion in semiconductor materials, external energy

OPTICAL TRANSMITTERS 57
must be injected into semiconductor materials to excite electrons from the valenceband to the conduction band. Optical energy or electrical current is commonly used asexcitation for semiconductor materials. Through stimulated emission, semiconductorlasers convert electrical energy (electrical current) to optical energy.
Essentially, a semiconductor is an optical cavity resonator with a semiconductorgain medium. The gain in the semiconductor material compensates for the losses inthe cavity, so that an optical wave can be bounced back and forth inside the cavitywithout loss of energy. The optical radiation modes of a laser are determined bythe properties of the cavity, such as the structure, dimension, and refractive indexof the cavity. The simplest cavity is a Fabry–Perot etalon (interferometer), whichis generally used in semiconductor lasers. Fabry–Perot lasers consist of two planereflectors or mirrors (semiconductor lasers generally use the cleaved end facets asthe reflection mirror) with a plane electromagnetic wave propagating along the axisnormal to the mirrors. The electromagnetic wave inside the laser cavity can be writtenas
E (t, x) = A exp [(g − αs) x/2] exp [ j (ωt − βx)] , (2.83)
where g is the power gain coefficient due to the gain medium inside the cavity, αs is thepower attenuation constant, and β is the propagation constant given by β = 2πns/λ.
Assume that the mirrors have reflection coefficients r1 and r2 and are separatedby a distance L (the length of the cavity). The electromagnetic wave will be reflectedback and forth inside the cavity. If a wave starts at one mirror (x = 0) as
E (t, 0) = A exp ( jωt) , (2.84)
after one round trip in the cavity the electromagnetic wave becomes
E ′ (t, x) = Ar1r2 exp [(g − αs) x/2] exp [ j (ωt − βx)] . (2.85)
The condition for steady-state oscillation is that the complex amplitude, that is, themagnitude and phase, of the return wave must be equal to the original amplitude andthe return wave must be equal to the original amplitude and phase. This gives
r1r2 exp [(g − αs) L] = 1 and exp ( j2βL) = 1. (2.86)
The first equation will enable us to determine which modes have sufficient gain foroscillation to be sustained and to calculate the amplitudes of these modes. The secondequation will enable us to find the resonant frequencies of the Fabry–Perot opticalcavity resonator.
Gain To sustain the laser oscillation, the gain must satisfy
r1r2 exp [(g − αs) L] ≥ 1; (2.87)

58 OPTICAL COMMUNICATIONS: COMPONENTS AND SYSTEMS
in other words,
g ≥ αs + 1
Lln
1
r1r2= αs + 1
2Lln
1
R1 R2, (2.88)
where R1 = r21 and R2 = r2
2 are the power reflection coefficient of the mirrors. Thefirst term on the right side of the equation, αs , includes all of the distributed losses,such as scattering and absorption. The second term represents the losses at the mirrors,a lumped loss that is averaged over the length 2L . If If the gain is equal to or greaterthan the total loss, oscillations will be initiated. As the amplitude increases, nonlinear(saturation) effects will reduce the gain. The stable amplitude of oscillation is theamplitude for which the gain has been reduced so that it exactly matches the totalloss.
Longitudinal Modes The condition for phase matching after a round trip gives
exp ( j2βL) = 1; (2.89)
that is,
2βL = 2mπ, (2.90)
where m is an integer. Since β = 2πns/λ, we find that the laser wavelength is givenby
λ = 2nL
m, (2.91)
where n is the refractive index of the semiconductor. Equation (2.91) gives therelationship between the laser wavelength and the laser cavity: The optical lengthof the cavity must be an integral number of half wavelengths. Different values of mcorrespond to different longitudinal modes.
For semiconductor lasers, the gain, g, is a function of frequency. There willbe a band of frequencies in FP lasers for which the gain is greater than the loss.Within that band, there will usually be several, or many, frequencies that satisfythe oscillation condition. At each of these frequencies, laser oscillation will occur.These frequencies, with their intensity and other characteristics, are called modes ofoscillation of the laser. For FP lasers, the loss is independent of the frequency (ormode independent). The mode closest to the gain peak becomes the dominant mode.Under ideal conditions, the other modes would not reach the oscillation condition(threshold) since their gains are always less than those of the dominant modes.However, in practice the difference in the gain is very small and the neighboringmodes on each side of the dominant mode have a significant portion of the totalpower. The spectrum of the FP lasers usually shows several significant side modes,and the spectrum width is about a few nanometers. Each mode emitted by FP lasers

OPTICAL TRANSMITTERS 59
propagates in an optical fiber at a slightly different speed, due to group velocitydispersion, and pulse broadening occurs for optical communication systems using FPlasers. The multimode nature of an FP laser limits its transmission distance operatingin 1.55 µm. Significant improvement in transmission distance and/or data rate can beachieved with single-longitudinal-mode lasers.
Single-Longitudinal-Mode Lasers In contrast with FP lasers, whose losses aremode independent, single-longitudinal-mode lasers are designed such that cavitylosses are different for different longitudinal modes of the cavity. Because of themode-dependent loss, the longitudinal mode with the smallest cavity loss reachesthreshold first and becomes the dominant mode. Other neighboring modes are dis-criminated by their higher losses, which prevent their buildup. Single-mode operationof semiconductor lasers is usually characterized by the side-mode suppression ratio(SMSR),
SMSR = Pmm
Psm, (2.92)
where Pmm is the power of the main lasing mode and Psm is the power of themost significant side mode. There are several techniques to achieve single-modeoperation for semiconductor lasers. DFB lasers, DBR lasers, VCSELs, and couple-cavity semiconductor lasers all operate in single longitudinal mode.
The feedback in distributed feedback (DFB) lasers is not localized at the facetsbut is distributed throughout the cavity length. This is achieved through an internalbuilt-in grating for a periodic variation of the mode index. Feedback occurs by meansof Bragg diffraction, where the forward- and backward-propagating waves are tightlycoupled with each other. Mode selectivity in DFB lasers results from the Braggcondition, and strong coupling occurs only for wavelength λB = 2n�, where � isthe grating period and n is the average mode index. Similarly, DBR lasers use Bragggratings as end mirrors, whose reflectivity is maximum for λB . The cavity loss ofDFB or DBR lasers is therefore minimum for the longitudinal mode closest to λB
and increases substantially for other longitudinal modes.The light is emitted in a direction normal to the active-layer plane, so the active
region is very short and does not provide much gain. Two high-reflectivity (>99.5%)DBR mirrors are grown expitaxially on both sides of the active layer to form amicrocavity. Because of the high-reflectivity DBR mirrors, loss of the cavity isrelatively small, so that VCSELs can lase with a relatively small gain. As VCSELshave an extremely small cavity length (1 µm), the mode spacing for VCSELs is muchlarger than the gain bandwidth, so there is only one longitudinal mode in the entiregain spectrum.
In couple-cavity semiconductor lasers, single-longitudinal-mode operation is re-alized by coupling the light to an external cavity. A portion of the reflected light fromthe external cavity is fed back to the laser cavity. The in-phase feedback occurs onlyfor those laser modes whose wavelength nearly coincides with one of the longitudinal

60 OPTICAL COMMUNICATIONS: COMPONENTS AND SYSTEMS
modes of the external cavity. In effect, the effective reflectivity of the laser facet fac-ing the external cavity becomes wavelength dependent and leads to mode-dependentlosses. The longitudinal modes that are closest to the gain peak and have the lowestcavity loss become the dominant modes.
Tunable Semiconductor Lasers Tunable light sources provide flexibility andreconfigurability for network provisioning, minimize production cost, and reducethe backup stock required. Commonly used options for tunable lasers are externalcavity lasers, multisection DFB/DBR lasers, and tunable VCSELs. Due to the costconcerns, it is desirable that tunable lasers can be directly modulated. An externalcavity laser is usually tuned by changing the characteristics of the external cavity,which consists of a grating or FP etalon. The tuning ranges of external cavity lasers areextremely wide, covering a few hundred nanometers. However, the long cavity lengthprevents high-speed modulation, so external cavity lasers are not suitable for fiberoptic communications. The tuning speed and stability are also issues with externalcavity lasers. Traditional DFB lasers can support high-speed direct modulation andbe thermally tuned over a few nanometers. However, the tuning speed is limitedto the millisecond range. Multisection DFB/DBR lasers usually consist of three ormore sections: an active (gain) section, a phase control section, and a Bragg section.Wavelength tuning is achieved by adjusting the currents in the phase-control andBragg sections. Using multisection DFB/DBR lasers, the tuning speed can reachnanoseconds by current injection, and tuning ranges over tens of nanometers can beachieved. Some multisection DFB/DBR lasers with sampled gratings can be tunedover 100 nm. The disadvantages of multisection DFB/DBR lasers are mode hoppingand complicated electronic control.
Tunable VCSELs use a MEMS (microelectromechanic system) structure thatchanges the cavity length through electrostatic control. The tuning speed can bea few microseconds and the tuning range can reach 10 to 20 nm. VCSELs havea potential for low-cost mass production because of simple one-step epitaxy andon-chip testing. However, the development of long-wavelength VCSELs has beenhindered by unsatisfactory optical and thermal properties of InP-based group III toV materials. New design using different materials and dielectric mirrors has lead tothe successful development of 1.3- and 1.5-m VCSELs. As the fabrication methodmatures, VCSELs will be a strong candidate for access networks.
2.2.1.2 Semiconductor Laser Characteristics A semiconductor laser is anEO (electrical–optical) converter that converts electrical energy into optical energy.Its operation characteristics are governed by the interaction of electrons and photonsinside the laser cavity. Based on laser rate equations, we describe the major propertiesof semiconductor lasers, including their steady-state output, small-signal frequencyresponse, and large-signal modulation characteristics.
Rate Equations Assume that a semiconductor laser operates in a single longitu-dinal mode above the threshold condition. The photon density and carrier density

OPTICAL TRANSMITTERS 61
inside the active region can be described by two coupled rate equations. The carrierrate equation is given by
dN (t)
dt= J (t)
qV− N (t)
τn− g0 (N (t) − N0)
1
1 + εS (t)S (t) , (2.93)
where N (t) is the carrier density, S (t) the photon density, J (t) the injection current, qthe elementary charge, τn the carrier lifetime, g0 the gain slope constant, N0 the carrierdensity at transparency for which the net gain is zero, and ε the gain compressionfactor. The first term on the right-hand side is the rate of carrier injection, the secondterm denotes spontaneous emission, and the third term represents stimulated emission.The rate equation for photon density can be written
dS (t)
dt= �g0 (N (t) − N0)
1
1 + εS (t)S (t) − S (t)
τp− �βN (t)
τn, (2.94)
where τp is the photon lifetime, � the mode confinement factor, and β the frac-tion of spontaneous emission coupled into the laser mode. The first term on theright-hand side denotes the increase in photon density due to stimulated emission,the second term is the rate of photon loss because of radiation (laser output) andabsorption, and the third term is the spontaneous emission coupled into the lasingmode.
Steady State Under steady-state conditions, the rates of changes in electron den-sity and photon density are zero. If we neglect the spontaneous emission and the gainsaturation factor for stimulated emission, we have
J
qV− g0
(N − N0
)S − N
τn= 0, (2.95)
�g0(N − N0
)(S) − S
τp= 0, (2.96)
where the overbars denote steady-state quantities. For a current such that J =�g0
(N − N0
)τp < 1, the gain is less than the loss, and the laser threshold has not
been reached. Below threshold, the photon density S = 0 if spontaneous emissionis neglected. The carrier density is N = τn J/qV (i.e., the carrier density increaseslinearly with the injection current).
The laser threshold is reached at an injection current for which �g0(N − N0
)τp = 1. From eq. (2.96) we have
N = N0 + 1
�g0τp≡ Nt h. (2.97)

62 OPTICAL COMMUNICATIONS: COMPONENTS AND SYSTEMS
Thus, at steady state above the laser threshold, the carrier density is clamped at athreshold level Nt h. The gain is also clamped at
g = g0 (Nt h − N0) = 1
�τp. (2.98)
The threshold current is obtained from eq. (2.97) by setting the photon density S = 0:
Jt h = qV Nt h
τn= qV
τn
(N0 + 1
�g0τp
). (2.99)
For an injection current J > Jt h, lasing starts in the semiconductor cavity. The photondensity is given by
S = 1
g0(N − N0
)(
J
qV− N
τn
)= �τp
qV
(J − qV Nt h
τn
)= �τp
qV
(J − It h
).
(2.100)
The output optical power of the semiconductor laser is related to the photon densityinside the laser cavity:
P = 1
2ηi nt
(vgαm
)hωSV ∝ (
J − It h), (2.101)
where αm = −ln (R1 R2) /2L is the loss associated with the cavity mirrors and ηi ntis the internal quantum efficiency, which indicates the fraction of injected electronsthat are converted into photons through stimulated emission. Above threshold, ηi ntis close to 100% for most semiconductor lasers. The factor of 1/2 makes P thepower emitted from each facet with equal reflectivities. The optical output power ofa semiconductor laser is linearly proportional to the injection current.
Modulation Dynamics The small-signal transfer function of semiconductor laserscan be obtained by applying a current of the form
J (t) = J + Jme jωt , (2.102)
where J is a dc bias current and the modulation current is small compared to the biascurrent, Jm J . Under first-order approximation, the electron density and photondensity can be written as
N (t) = N + Nme jωt , (2.103)
S (t) = S + Sme jωt . (2.104)

OPTICAL TRANSMITTERS 63
Substituting eqs. (2.103) and (2.104) into the coupled rate equations and using
1
1 + εS≈ 1 − εS for εS 1,
we can find the small-signal frequency response given by
H ( jω) = Sm
Jm= X
( jω)2 + jωY + Z, (2.105)
where
X = 1
qV
[�g0
(1 − ε S
)S + �β
τn
],
Y = g0(1 − ε S
)S − �g0
(N − N0
) (1 − 2ε S
) + 1
τn+ 1
τp,
Z = 1
τng0
(1 − ε S
) + 1
τn�g0 (β − 1)
(N − N0
) (1 − 2ε S
) + 1
τnτp.
Due to the interaction of photons and electrons, the response of a semiconductorlaser to an injection current resembles a second-order system with damping oscillationof the form
H ( jω)
H (0)= ω2
n
( jω)2 + 2ξωn ( jω) + ω2n
, (2.106)
where the natural frequency is given by
ωn =√
Z , (2.107)
and the damping ratio is
ξ = Y
2√
Z. (2.108)
The 3-dB bandwidth of the small-signal response is
BW3dB = ωn
[(1 − 3ξ 2
) +√
4ξ 4 − 4ξ 2 + 2]1/2
. (2.109)
Thus, the 3-dB bandwidth is proportional to the natural frequency ωn and de-creases with an increase in the sampling factor ξ . In practice, the 3-dB bandwidth of

64 OPTICAL COMMUNICATIONS: COMPONENTS AND SYSTEMS
FIGURE 2.7 Optical output power and frequency chirp of a semiconductor laser underlarge-signal modulation at 1.25 Gb/s. The solid line represents the laser output power, and thedashed line denotes the frequency chirp of the output signal. Due to the interaction betweenphoton and electrons, the response of the semiconductor laser exhibits overshoot and ringing.Th frequency chirp of the semiconductor laser is caused by the variation in carrier density andthe temperature effect, leading to significant spectrum broadening.
semiconductor lasers can be approximated by
BW3dB ∝ (J − Jt h
)1/2 ∝ P1/2; (2.110)
that is, the 3-dB bandwidth increases with an increase in bias current. For large-signal modulation, the rate equations of semiconductor lasers have to be solvednumerically. Figure 2.7 shows the pulse response of semiconductor lasers. Due tothe electron–photon interaction, the output power of a semiconductor laser showsrelaxed oscillation behavior, as demonstrated by overshoot and ringing in large-signalmodulation.
Frequency Chirp From Kramers–Kronig relations we know that whenever the op-tical gain of a semiconductor material changes, its refractive index changes as well.As a consequence, amplitude modulation in semiconductor lasers is always accompa-nied by phase modulation because of the carrier-induced changes in the mode index n.Two fundamental effects contribute to the frequency chirp of semiconductor lasers:the changes in temperature and the change in carrier concentration. Temperatureaffects the refractive index (increases with increased temperature) and the opticallength of the laser cavity (the product of the two, nL , determines the laser modefrequency). Temperature also changes the semiconductor bandgap (decreases withincreased temperature) and thus the gain spectrum. Carrier concentration affects boththe refractive index (decreases with increased carrier density due to plasma-induced

OPTICAL TRANSMITTERS 65
refractive index change) and the gain coefficient (proportional to carrier density).In DFB lasers, the lasing frequency is determined by the mode of the distributedfeedback structure. The gain spectrum and bandgap change do not affect the laserwavelength; so the dominant factor here is the refractive index change.
The phase modulation associated with intensity modulation in semiconductorlasers can be described by
dφ
dt= 1
2αc
[�g0 (N (t) − N0) − 1
τp
], (2.111)
where αc is the linewidth enhancement factor (also called the α parameter), as it leadsto an enhancement of spectral width associated with a single longitudinal mode. Fora single-mode laser, neglecting the gain compression factor ε and the spontaneousemission factor β, the rate equation for photon density becomes
dS
dt= �g0 (N − N0) S − S
τp. (2.112)
Therefore,
dφ
dt= 1
2αc
d ln S (t)
dt. (2.113)
Since the output power of the semiconductor laser is proportional to the photon den-sity, P(t) ∝ S(t), we have d (ln P(t)) = d (ln S(t)). The frequency chirp associatedwith intensity modulation can be written
� f = 1
2π
dφ
dt= 1
4παc
d (ln P (t))
dt. (2.114)
The linewidth enhancement factor can thus be determined by
αc = 2dφ (t)
d (ln P (t)). (2.115)
The linewidth enhancement factor is in the range 4 to 8, and 1 to 2 for quantumwell lasers. Under pulse operation, the chirp of the semiconductor lasers causes themode wavelength to vary during the pulse. The wavelength becomes shorter (positivefrequency chirp) during the leading edge of the pulse and longer (negative frequencychirp) during the trailing edge, as shown in Figure 2.7 The frequency chirp from adirectly modulated semiconductor laser causes significant broadening in the spectrumof the output optical signals. When combined with group velocity dispersion of anoptical fiber, the frequency chirp could cause significant pulse broadening and thusdegrade the system performance. At the 1.55-µm region, the dispersion coefficientof standard-mode fibers is positive, so higher-frequency spectral components of anoptical signal travel faster than do lower-frequency spectral components. Because of

66 OPTICAL COMMUNICATIONS: COMPONENTS AND SYSTEMS
the laser chirp, the leading edge (positive-frequency chirp) of an optical pulse willtravel faster than the trailing edge (negative-frequency chirp). Therefore, frequencychirp leads to pulse broadening in standard single-mode fibers.
2.2.2 Optical Modulators
Direct modulation of semiconductor lasers provides a compact and cost-effectivemeans of converting electrical signals to optical signals. However, there are somelimitations on direction modulation. The modulation speed is dependent on the dy-namics of electron–photon interaction in semiconductor lasers, limiting the bit rateof direction modulation up to 10 Gb/s (some specially designed semiconductor laserscan be modulated up to 40 Gb/s, but they are rarely used in practice). The frequencychirp associated with intensity modulation broadens the spectrum of the opticalsignal; when combined with fiber group velocity dispersion, laser chirp limits thetransmission distance. For high-bit-rate long-reach communication systems, externalmodulation is most commonly used. With external modulation, semiconductor lasersare used as a light source operating with fixed injection current and constant opticaloutput power, and an optical modulator is used to modulated the CW light. Opticalmodulators can operate with bit rates as high as 100 Gb/s and produce less chirpthan semiconductor lasers. Therefore, optical transmitters with external modulationprovide better performance than direct modulation, and such transmitters may beused in high-bit-rate (e.g., 10 Gb/s) or long-reach (>20 km) PONs.
Light modulation can be achieved by changes in amplitude, phase, polarization,or frequency of the incident light waves through changing the refractive index, ab-sorption coefficient, or the direction of the light transmitted in the external modulator.Among these, frequency modulation is very difficult to create, due to the great energyneeded, and is rarely used in practice (only in coherent communication systems).Polarization of the light wave is relatively difficult to control during its propaga-tion in common fibers (unless polarization-maintaining fiber is used), so polarizationmodulation is not used in commercial systems. Phase modulation is used primarily inadvanced systems (e.g., DPSK systems) for high-speed long-haul optical communica-tions. Most practical communication systems use an intensity modulation–direct de-tection (IM-DD) scheme. To achieve intensity modulation, the electroabsorption andelectrorefraction effects are commonly used. The electroabsorption effect changesthe absorption of the device and thus results in amplitude modulation (intensitymodulation). Semiconductor electroabsorption modulators have been widely used inoptical communication systems. The electrorefraction effect (also called the elec-trooptic effect) changes the index of refraction and leads to phase modulation; it canbe combined with a Mach–Zehnder interferometer or a directional coupler to achieveintensity modulation. A lithium niobate modulator, the most commonly used opticalmodulator, is based on the electrorefraction effect.
2.2.2.1 Lithium Niobate Modulators Lithium niobate is a nonlinear opticalcrystal with a 3m point-group symmetry. The refractive indices of LiNbO3 have a uni-axial form (no = nx = ny = 2.297 and ne = nz = 2.208), and its linear electrooptic

OPTICAL TRANSMITTERS 67
coefficient is given by
r =
⎡⎢⎢⎢⎢⎢⎢⎢⎢⎢⎢⎢⎢⎢⎢⎢⎢⎣
0 −r22 r13
0 r22 r13
0 0 r33
0 r51 0
r51 0 0
−r22 0 0
⎤⎥⎥⎥⎥⎥⎥⎥⎥⎥⎥⎥⎥⎥⎥⎥⎥⎦
, (2.116)
where r13 = 8.6 × 10⁻¹² m/V, r22 = 3.4 × 10⁻¹² m/V, r33 = 30.8 × 10⁻¹² m/V, andr51 = 28.0 × 10⁻¹² m/V. Since r33 is the largest coefficient, an applied electric fieldalong the z direction will be the most efficient for optical modulation. Therefore, forEx = Ey = 0, the index ellipsoid of the lithium niobate crystal becomes
x2
(1
n2o
+ r13 Ez
)+ y2
(1
n2o
+ r13 Ez
)+ z2
(1
n2e
+ r33 Ez
)= 1. (2.117)
Due to electrorefraction, the new refractive indices are now given by
nx = ny ≈ no − 1
2n3
or13 Ez, (2.118)
nz ≈ ne − 1
2n3
er33 Ez . (2.119)
Therefore, under an electrical field in the z direction, the lithium niobate crystalremains uniaxial and the optical axis remains unchanged, but the index ellipsoid isdeformed by the electric field. Light propagating along z will experience the samephase change regardless of its polarization state. However, light propagating along thex or y direction will experience a different phase change, depending on its polariza-tion. For an X-cut lithium niobate crystal, as shown in the Figure 2.8, two electrodesare placed symmetrically on both sides of the waveguide such that the bias field isalong the z direction. An incident optical signal with TE polarization will transmit as
ETE = zE0e− jk0(ne−n3er33 Ez/2)y . (2.120)
Similarly, for TM polarization,
ETM = x E0e− jk0(no−n3or13 Ez/2)y . (2.121)

68 OPTICAL COMMUNICATIONS: COMPONENTS AND SYSTEMS
X cut
E = Ez
Z cut
TM
TM
TE
TE
Incidentlightwave
Incidentlightwave
zx
z
x
z
x
V
V
V
V
Transmittedlightwave
Transmittedlightwave
y
z
x
y
FIGURE 2.8 Structure of X and Z-cut lithium niobate phase modulators. To induce maxi-mum refractive index change, an electric field in the z direction is preferred in lithium niobatemodulators. For X-cut lithium niobate modulators, two electrodes are placed on each side ofthe optical waveguide. For Z-cut lithium niobate modulators, one electrode is placed on thetop of the optical waveguide.
Since r33 > r13, TE polarization is more efficient for phase modulation in the caseof an X-cut lithium niobate crystal. For a Z-cut lithium niobate crystal, the electrodesare placed such that the waveguide is below one of the electrodes where the fieldis perpendicular to the Z-cut surface. In this case, the optical transmission for TEpolarization will be
ETE = x E0e− jk0(no−n3or13 Ez/2)y, (2.122)
and for TM polarization,
ETM = zE0e− jk0(ne−n3er33 Ez/2)y . (2.123)
In this case, TM polarization is preferred for most efficient phase modulation. Theanalysis above reveals that lithium niobate modulators have polarization-dependentresponse.
Lithium niobate modulator employs a Mach–Zehnder interferometer structure toconvert the phase modulation (due to electrorefraction) to intensity modulation, asshown in Figure 2.9. Light input to the modulator is via a single-mode waveguide. A

OPTICAL TRANSMITTERS 69
FIGURE 2.9 Intensity modulator with Mach–Zehnder interferometer structure. If the phasechange in two arms of Mach–Zehnder interferometer is zero, constructive interference occursat the output, and thus the output optical power is high. If the phase change in two arms ofMach–Zehnder interferometer is π , destructive interference occurs at the output, and thus theoutput optical power is low.
beamsplitter divides the light into two equal beams that travel through the two arms ofa Mach–Zehnder interferometer. By applying a voltage to the electrodes, the effectivepath lengths can be varied. In an ideally designed modulator of this type, the pathlengths L and guide characteristics are identical, so that with no applied voltage thesplit beams recombine in the output waveguide to produce the lowest-order modeonce more. If an electric field is applied so as to produce a phase change of π radiansbetween the two arms, the recombination results in an optical field that is zero at thecenter of the output waveguide, corresponding to the first-order mode. If the outputwaveguide is a single-mode guide, identical to the input guide, the first-order modeis cut off and dissipates rapidly over a short length by substrate radiation. Thus,the modulator can be switched from a transmitting to a nontransmitting state byapplication of a voltage. With proper choice of the polarization of the incident waveand the electrode design, the power transmitted, Pout, is given by
Pout = 1
4
∣∣e jβ1 L + e jβ1 L∣∣ Pin = cos2 (�βL/2) Pin, (2.124)
where Pin is the optical input power, �β = β1 − β2, and β1 and β2 are the propagationconstants in the two branches of the Mach–Zehnder interferometer, respectively. Thedifference between the propagation constants in two branches is given by
�β = 2π�n
λ0, (2.125)

70 OPTICAL COMMUNICATIONS: COMPONENTS AND SYSTEMS
where λ0 is the optical wavelength and �n is the refractive index change resultingfrom electrorefraction.
Modern lithium niobate modulators can operate over a wide wavelength regionand achieve an extinction ratio of more than 20 dB and/or a modulation bandwidthof about 100 Gb/s. However, lithium niobate modulators are bulky and require largemodulation voltages. The frequency chirp produced by lithium niobate modulatorscan be very small, and if a symmetric push-pull modulation scheme (both branchesof the modulator are applied with modulation voltages, one with positive voltage andthe other with negative voltage) is used, zero-frequency chirp can be achieved.
2.2.2.2 Electroabsorption Modulators The electroabsorption effect is theeffect with which the absorption coefficient changes with applied electric field.There are two main mechanisms for electroabsorption in semiconductors: the Franz–Keldysh effect and the quantum-confined Stark effect. Both of these electroabsorptioneffects are seen near the bandgap of semiconductors when electric fields are applied.The Franz–Keldysh effect is exhibited in conventional bulk semiconductors, whereasthe quantum-confined Stark effect happens in quantum well structures. In fact, thequantum-confined Stark effect can be shown to be the quantized version of theFranz–Keldysh effect.
The concept of the Franz–Keldysh effect is shown in Figure 2.10. With an ap-plied electrical field, we have a potential that varies linearly with distance. The
Conduction band
Valence band
Electron wavefunction
E
FIGURE 2.10 Franz–Keldysh effect. The sum of the band edge energy and the penetrationof an electron wavefunction into the bandgap lead to the absorption of photons with less energythan the bandgap energy of the semiconductor.

OPTICAL TRANSMITTERS 71
wavefunctions for the electrons or the holes become Airy functions and “tunnel” intothe bandgap region. Thus, overlap for electron and hole wavefunctions is possibleeven for photon energies lower than the bandgap energy, hence allowing optical ab-sorption below the bandgap energy. However, in the spectral region just below thebandgap, the effects of excitons are important and possibly dominant in the optical ab-sorption spectrum. In the presence of an electric field, the exciton can be field-ionizedrapidly, leading to lifetime broadening of the exciton absorption peak.
In quantum wells, the electroabsorption for electric fields perpendicular to thequantum well layers is quite distinct from that in bulk semiconductors. While ex-citons are polarized by the electric field, quantum wells prevent excitons from fieldionization. Therefore, instead of being broadened by the electric field, the excitonabsorption peaks are strongly shifted by the field. The shifts can be tens of meV,leading to significant absorption below the bandgap energy. Since the shift of theenergy levels with electric field in an atom is called the Stark effect, this shift of theexciton absorption peaks is called the quantum-confined Stark effect.
If a CW optical signal is incident at an electroabsorption modulator with lengthL , the output power of the modulator is given by
Pout = Pin exp [−α(V )L] , (2.126)
where α is the power absorption coefficient of the semiconductor material. As theabsorption coefficient α can be varied by an applied electric field, the output opticalpower can be modulated by an external voltage. However, the modulation charac-teristics of electroabsorption modulators depend on the operating wavelength, anda small amount of frequency chirp always accompanies the intensity modulation.Commercially available electroabsorption modulators can produce a 20-dB extinc-tion ratio with a small modulation voltage (<2 V). Bandwidths larger than 50 GHzhave been realized with traveling-wave electroabsorption modulators. In addition, anelectroabsorption modulator can be integrated with a semiconductor laser, leading toa compact device called an electroabsorption-modulated laser.
2.2.3 Transmitter Design
As a key component in optical communication systems, a transmitter must be designedand engineered with a number of specific requirements. Overall system performance,reliability, complexity, cost, size, and power consumption are just a few factors thatcome into play in transmitter design. More often than not, a designer has to balanceall these requirements; in other words, trade-off among these factors is necessaryfor good design. The performance of an optical transmitter directly determines theoverall system performance, especially the data rate and transmission distance. Keyparameters of an optical transmitter include average transmitter power, modulationspeed (bit rate), extinction ratio, optical output spectrum, intensity noise, and jitter.
Typically, for a low-cost system, direct modulation is used in optical transmitters.However, for a high-performance system, external modulation with optical modula-tors is utilized. As a general rule, telecommunication systems operating at 10 Gb/s

72 OPTICAL COMMUNICATIONS: COMPONENTS AND SYSTEMS
DataD Q
Reference
FIGURE 2.11 Block diagram of an optical transmitter. In an optical transmitter, data arefirst retimed by a flip-flop driven by the system clock. Then a laser/modulator driver, consistingof a predriver and a current steering output stage, modulates the laser or optical modulator.The output power of the laser is detected by a photodiode, and a feedback circuit is used tocontrol the laser output power.
or higher use external modulation; 2.5-Gb/s systems use either direct modulation orexternal modulation, depending on the transmission distance; systems with data rateslower than 2.5 Gb/s use direct modulation. Short-reach optical links operating in the1.3-µm region can also use direct modulation at 10 Gb/s, as the fiber dispersion issmall.
Figure 2.11 shows typical structures of transmitters using direction modulation orexternal modulation. In direction modulation, a laser driver turns the semiconductorlaser on and off, depending on the data input. The laser driver must be able to delivertens of milliamperes of current with a very small rise and fall time. Designing a goodlaser driver at a high bit rate often presents an engineering challenge. For externalmodulation, the semiconductor laser is operated in CW mode, and a modulator driverturns the optical modulator on and off. The modulator drivers need to provide enoughvoltage swing to achieve a good extinction ratio. In addition, automatic bias control isoften indispensable for modulator drivers. To keep the transmitted power constant (asrequired by most optical communication systems), a photodiode located at the backfacet of the semiconductor laser monitors the optical power, and the photocurrentdetected is used as a feedback control loop to stabilize the laser output power.
2.3 OPTICAL RECEIVERS
An optical receiver converts the transmitted optical signal back into an electricalsignal and recovers the data carried by the optical signal. A key component in opticalreceivers is the photodetector, an optical–electrical converter that converts opticalenergy to electrical current. The electrical current from the photodetector is thenamplified, and a clock and data recovery circuit recovers the data carried through the

OPTICAL RECEIVERS 73
optical communication system. In this section we introduce the operation principleof photodetectors and discuss the design of clock and data recovery circuits.
2.3.1 Photodetectors
Photodetectors absorb photons and generate electrical current that is proportional tooptical power. As discussed in Section 2.2.1, when a photon has energy greater thanthe bandgap of a semiconductor material, the photon energy will be absorbed andan electron–hole pair will be generated in the semiconductor. With applied voltage,the electron–hole pair will carry electric current in an optical receiver. In opticalcommunication systems, photodiodes (photodetectors with p-n and p-i-n junctions)are commonly used for photodetection.
2.3.1.1 PIN Photodiodes A PIN photodiode consists of an intrinsic semicon-ductor layer (in reality, a lightly doped semiconductor layer) sandwiched in the centerof a p-n junction, as shown in Figure 2.12 Under reverse bias, a depletion layer acrossthe p-n junction is created on both sides of the p-n junction and across the entire in-trinsic layer. The depletion layer has a very low carrier density and high impedance,and hence a large built-in electric field is established in this region. When photons(with energy greater than the semiconductor bandgap energy) impinge on the PINphotodiode, electron–hole pairs are generated in the depletion layer. Because of thelarge electric field inside the depletion region, electron–hole pairs are separated anddrift in opposite directions toward the p- or n- side, leading to electric current flowacross the p-i-n junction. The photocurrent (generated by the PIN photodiode underlight incidence) is proportional to the incident optical power, given by
Ip = Rd Pin, (2.127)
where Ip is the photocurrent, Pin is the incident optical power, and Rd is known as theresponsivity of the photodiode. The responsivity is related to the quantum efficiencyby
Rd = q
hνη, (2.128)
where the quantum efficienty η is defined as the ratio between the number of thephotogenerated electrons and the number of incident photons. The responsivity canbe improved by increasing the width of the intrinsic layer. Typically, the intrinsic layer
FIGURE 2.12 Structure of a PIN photodiode.

74 OPTICAL COMMUNICATIONS: COMPONENTS AND SYSTEMS
has a width of 20 to 50 µm to absorb all the incident photons, and the responsivitycan be as high as 0.9 A/W. However, the speed of photodiode response is limited bythe carrier transit time across the p-n junction, which is proportional to the width ofthe intrinsic region. The bandwidth of a photodiode is given approximately by
BW = 1
2π (τtr + τRC), (2.129)
where τtr is the transition time and τRC is the RC time constant induced by electricalparasitics. To improve the bandwidth of a photodiode, it is desirable to have a thindepletion layer. In practice, pin photodiodes with bandwidth larger than 100 GHzhave been made by using a very thin absorption layer. However, a thinner absorptionlayer reduces the responsivity of the photodiode. Therefore, there exists a trade-offbetween the photodiode bandwidth and responsivity. To improve photodiode perfor-mance, a Fabry–Perot cavity can be designed around the p-i-n junction, resultingin enhanced photon absorption with reduced intrinsic layer width. Alternatively,a waveguide photodiode can be implemented with an edge-coupled optical sig-nal. While the optical signal is traveling along the waveguide, the carrier movesin a direction perpendicular to the waveguide. Therefore, photodiode bandwidthand responsivity can be optimized separately with little compromise. Modern pho-todiode design can achieve a bandwidth over 300 GHz with traveling-wave pho-todiodes, where the electrode structure is designed to support traveling RF wavesand thus reducing the impact of the parasitic effect of electrodes on photodiodebandwidth.
2.3.1.2 Avalanche Photodiodes The receiver optical power is typically verylow for long-haul optical communication systems. Therefore, photodiodes with ahigh responsivity value are often preferred to generate large photocurrent. However,the responsivity of a PIN photodiode is limited by Rd = q/hν for the maximumquantum efficiency of η = 1. An avalanche photodiode (APD) can provide internalcurrent gain and thus can achieve a higher responsivity value.
The internal current gain in avalanche photodiodes is provided through impactionization under a large electric field. Photogenerated carriers in a photodiode areaccelerated by the electric field in the depletion region, and thus these carriers acquirekinetic energy from the electric field. When these carriers collide with the crystallattice, they will lose some energy to the crystal. If the kinetic energy of a carrieris greater than the bandgap energy, the collision can free a bound electron. The freeelectron and hole thus created can themselves acquire enough kinetic energy to causefurther impact ionization. The result is an avalanche, with the numbers of free carriersgrowing exponentially as the process continues. This cumulative impact ionizationproduces a large number of free carriers in the depletion region, which is greater thanthe number produced by photoionization. Therefore, the total current is greater thanthe primary photocurrent, and current amplification is achieved inside the photodiode.

OPTICAL RECEIVERS 75
The ratio of the total current to the primary photocurrent is the current amplificationof the APD,
M = IAPD
Iph, (2.130)
where IAPD is the total current generated by the APD and Iph is the current generatedby photon absorption. The responsivity of the APD is thus given by
RAPD = ηq
hνM. (2.131)
The structure of an avalanche photodiode is similar to that of the pin photodiodewith an avalanche region added on one end of the intrinsic region, as shown inFigure 2.13. The avalanche region must have a high internal electric field for theavalanche process to occur. Let α and β represent the ionization coefficients forelectrons and holes, respectively. Both α and β will be functions of the material,the electric field strength, and the temperature. For injected electrons, the currentmultiplication factors are
Me = (1 − k) exp[αwa(1 − k)]
1 − k exp[αwa(1 − k)], (2.132)
and for injected holes,
Mh = (1 − 1/k) exp[βwa(1 − 1/k)]
(1 − 1/k) exp[αwa(1 − 1/k)], (2.133)
where k = β/α and wa is the width of the avalanche amplification region.The avalanche process can extend the duration of the impulse response of
avalanche photodiode well beyond that attributable to the one-pass transit timesof electrons and holes. For the case of electron injection, the total duration is the sumof three times: the time required for the most distant primary electron to reach theavalanche region, the duration of the avalanche process, and the time required forall holes produced during avalanche to move back across the avalanche and intrinsic
FIGURE 2.13 Structure of an APD. Optical absorption occurs in the intrinsic layer, and thelarge electric field in the p layer creates an avalanche effect.

76 OPTICAL COMMUNICATIONS: COMPONENTS AND SYSTEMS
regions. The multiplication factor of the avalanche photodiode shows a frequencydependence as
M = M0
1 + j M0τ1ω. (2.134)
Therefore, the 3-dB bandwidth of a avalanche photodiode is given by
BW = 1
2π M0τ1, (2.135)
where τ1 is the effective transit time of the avalanche region. The bandwidth isinversely proportional to the low-frequency gain M0. This relation shows the trade-off between the APD gain and the bandwidth.
The noise associated with the avalanche current-multiplication process consistsof the sum of the amplified shot noise of the primary photocurrent and the excessnoise produced by the multiplication process. The excess noise is represented byan excess noise factor F , which is defined as the ratio of the total noise associatedwith IAPD to the noise that would exist in IAPD if the multiplication process producedno excess noise (i.e., F is the total noise divided by the multiplied shot noise). Themean-squared total noise is F times the multiplied shot noise, given by
〈i2n 〉 = 2q I M2FB, (2.136)
where I is the sum of the primary photocurrent and the dark current. When theavalanche process is initiated by electrons, the excess noise factor F is given by
Fe = Me
[1 − (1 − k)
(Me − 1)2
M2e
]. (2.137)
Thus, a small value of k = β/α is preferred for a smaller excess noise factor. However,when the avalanche process is initiated by holes,
Fh = Mh
[1 − (1 − 1/k)
(Mh − 1)2
M2h
]. (2.138)
Thus, for hole injection, a smaller 1/k = α/β is preferred; that is, a larger impactionization coefficient for holes leads to a small access noise factor Fh .
2.3.2 Optical Receiver Design
An optical receiver consists of a photodiode, a baseband preamplifier, a limitingamplifier, and a clock and data recovery circuit, as shown in Figure 2.14. Typicalrequirements of optical receivers include large bandwidth, large dynamic range, andhigh receiver sensitivity. The noise, gain, and bandwidth of the preamplifier and

OPTICAL RECEIVERS 77
LimiterTIA
AGC Clockrecovery
DataD Q
Decisioncircuit
FIGURE 2.14 Block diagram of an optical receiver. TIA, transimpedance amplifier; limiter,limiting amplifier.
the limiting amplifier directly affect the receiver sensitivity and data rate of theoverall communication system. The clock and data recovery circuit must provide fastresponse, low jitter, and long run (consecutive identical digits) tolerance.
The photocurrent generated by the photodiode is usually very low, so the sig-nal is prone to noise contamination. The preamplifier amplifies the photocurrent forfurther processing in later stages. To increase the receiver sensitivity, a large loadresistor can be used to increase the input voltage to the preamplifier. In addition, alarge impedance can reduce the thermal noise and improve the receiver sensitivity.However, the high load resistor will reduce the bandwidth of the optical receiver.Therefore, there exists a trade-off between the bandwidth and the receiver sensitivityfor optical receivers. Occasionally, an equalizer is designed to improve the band-width of high-impedance optical receivers. However, the equalizer will introducemore noise, especially at high frequencies. In high-performance optical receivers,a transimpedance amplifier (as shown in Figure 2.14) is generally used to provideboth large bandwidth and high receiver sensitivity. Because of the negative feedback,the input impedance of the preamplifier is reduced significantly, thus improving thebandwidth of the optical receiver. However, to improve the receiver sensitivity, thebandwidth of the transimpedance amplifier is designed to be 0.7 times the bit rate,which is a reasonable compromise between the noise and the intersymbol interferenceresulting from limited bandwidth.
The voltage level produced by the preamplifier is usually inadequate to drive theclock and data recovery circuit. Limiting amplifiers following the preamplifier areused to boost the signal level further. Therefore, limiting amplifiers are required toprovide enough gain with negligible intersymbol interference. The limiting amplifiersare designed with a cascade of differential amplifiers with enough bandwidth andrelative linear phase response.
Clock and data recovery circuits present another challenge in designing opticalreceivers. Figure 2.15 shows the architecture of clock and data recovery circuits. Aphase-locked loop is commonly utilized to recover the clock. Then the output of thephase-locked loop samples and retimes the data, reducing the jitter and intersymbolinterference. High data rate, stringent jitter, and loop bandwidth specifications requiresignificant design efforts in clock and data recovery circuits.

78 OPTICAL COMMUNICATIONS: COMPONENTS AND SYSTEMS
D QDataoutDatain
Phasedetector
Lowpassfilter
Voltage-controlledoscillator
Decisioncircuit
FIGURE 2.15 Block diagram of clock and data recovery circuits.
2.4 OPTICAL AMPLIFIERS
As optical signals propagate along optical fibers, the signal power is attenuated dueto fiber loss. For reliable communication, optical signal power needs to be kept ata level above the receiver sensitivity. Traditionally, when an optical signal is weak,it is converted back to electrical form and the signal is amplified electronically. Allthe noise and distortion can be removed in the case of digital communications. Theamplified waveform is then used to modulate a CW light wave to generate a cleanoptical signal with higher power for further transmission. This type of O-E-O (optical–electrical–optical) repeater was commonly used before optical amplifiers, especiallyerbium-doped fiber amplifiers, became dominant in long-haul optical communica-tions. An optical amplifier provides optical gain through stimulated emission whenthe gain medium is pumped optically or electrically to achieve population inversion.Whereas O-E-O repeaters work only for single channels, optical amplifiers can am-plify multiple incident optical signals simultaneously, and they are transparent to dataformat (e.g., bit rate and modulation format). Therefore, optical amplifiers provide asimpler and cost-efficient means to boost optical signal power for long-distance trans-mission. Optical amplifiers commonly used in optical communication systems areerbium-doped fiber amplifiers (EDFAs), semiconductor optical amplifiers (SOAs),and Raman amplifiers.
When a signal with low optical power propagates through an optical amplifier, eachsection of the amplifier adds optical power to the original signal through stimulatedemission. Amplification of the optical signal is described by
dP(z)
dz= g0 P (z) , (2.139)
where P (z) is the optical power at a distance z from the input end and g0 is the small-signal gain coefficient of the amplifier. Neglecting the gain saturation, the opticalsignal grows exponentially due to optical amplification,
P(z) = Pi exp(g0z), (2.140)

OPTICAL AMPLIFIERS 79
where Pi is the input optical power. At the output of the optical amplifier, the signalpower is
P(L) = Pi exp (g0L) , (2.141)
where L is the length of the optical amplifier. Thus, the power gain of the opticalamplifier is given by
G = exp(g0L). (2.142)
This equation gives the amplifier gain under small-signal conditions. When the opticalpower is large (comparable to the saturation power Ps), the gain coefficient g of theoptical amplifier is reduced as
g = g0
1 + P/Ps. (2.143)
Thus, the amplifier gain G decreases with an increase in the signal power. Thisphenomenon is called gain saturation. In this case, the amplification of optical signalis described by
dP(z)
dz= g0 P(z)
1 + P(z)/Ps. (2.144)
The optical power P (z) can be determined by
lnP(z)
P(0)+ 1
Ps[P(z) − P(0)] = g0z. (2.145)
By using the initial condition, Pi = P(0) and Po = P(L) = G Pi , we have
ln G + 1
Ps
(Po − Po
G
)= g0L . (2.146)
Hence, the amplifier gain under large-signal conditions is given by
G = 1 + Ps
Piln
G0
G, (2.147)
where G0 = exp(g0L). This equation shows that the amplifier gain decreases from itsunsaturated value G0 when the optical power becomes comparable to the saturationpower Ps . In practice, a parameter known as the output saturation power is usedto characterize the gain saturation effect of optical amplifiers. The output saturationpower is defined as the output power for which the amplifier gain G is reduced by afactor of 2 (3 dB) from its unsaturated value G0. From eq. (2.147) we can find the

80 OPTICAL COMMUNICATIONS: COMPONENTS AND SYSTEMS
saturation output power as
Psout = G0 ln 2
G0 − 2Ps . (2.148)
While providing signal gain, optical amplifiers add amplified spontaneous emis-sion (ASE) noise to its output, and thus degrade the signal-to-noise ratio (SNR) of theoptical signal. The spectral density of spontaneous emission-induced noise is nearlyconstant (white noise) and can be written
Ssp (ν) = (G − 1) nsphν, (2.149)
where nsp is called the spontaneous emission factor (or population inversion factor)of the amplifier. The spontaneous emission factor is given by
nsp = N2
N2 − N1, (2.150)
where N1 and N2 are the densities of the ground and excited states, respectively. Theeffect of spontaneous emission is to add fluctuation to the amplifier optical power.
Similar to the electronic amplifier, the SNR degradation in an optical amplifieris quantified by amplifier noise figure, Fn , which is defined as the ratio of the inputSNR to the output SNR. As the dominant noise source in an optical amplifier is theASE noise, its noise figure can be found as
Fn = SNRin
SNRout= 2nsp (G − 1)
G≈ 2nsp. (2.151)
As the spontaneous emission factor nsp is always larger than unity, the SNR of theamplified signal is degraded by a factor larger than 3 dB. Most optical amplifiershave a noise figure of 4 to 8 dB. The definition of noise figure above parallels thatused for RF amplifiers; however, there are differences that require clarification. Allof the noise on the output signal is assumed to be contributed by the amplifier, whichimplies that the input signal itself does not contribute to the output noise. The noisefigure therefore relates to the spectral density of the added ASE.
An optical amplifier can be used in various locations on a fiber optical commu-nication link. Depending on its location, it performs different functions (amplifyingoptical signal in general) and has different performance requirements. Typical ap-plications of optical amplifiers include as in-line amplifiers, booster amplifiers, andpreamplifiers. An in-line amplifier is used in the transmission path to amplify theweakened optical signal due to fiber loss. High gain, low noise, and high outputpower (high saturation power) are required. A booster amplifier is operated in thesaturation region and used immediately after the transmitter to boost its power. Forbooster amplifiers, high-gain, high-output power (high saturation power) is desired.A preamplifier is used in front of the receiver to boost the optical signal power for

OPTICAL AMPLIFIERS 81
detection. High gain and low noise are preferred for preamplification, and an in-linenarrow bandpass filter is often used to reduce the ASE noise.
Ideally, an optical amplifier should have high-gain, high-output power (no powersaturation or high saturation power) and low noise. For WDM applications, a largebandwidth (wide gain spectrum) and flat gain spectrum are also required. The tran-sient behavior of the optical amplifier is also an important consideration for systemapplications, and gain must be insensitive to variants in the input power of the signal.
2.4.1 Rare-Earth-Doped Fiber Amplifiers
Rare-earth elements such as erbium, neodymium, thallium, and ytterbium can bedoped into optical fibers to make fiber amplifiers operate in different wavelengthsfrom 0.5 to 3.5 µm. Amplifier characteristics such as the operating wavelengthand the gain bandwidth are determined by the dopants rather than the silica fiber(which plays the role of a host medium). EDFA is, by far, the most widely usedfiber amplifier, because its operating wavelength is coincident with the low-fiber-losswindow at the 1.55-µm band. Because EDFAs can amplify multiple wavelengths(tens of wavelength or even over 100 wavelengths), their deployment in 1990 hasled to commercial WDM optical communication systems with capacity exceeding100 Gb/s. Commercial EDFAs can provide a gain of over 30 dB and 20 dBm ofoutput power with about 35 nm of bandwidth and a very low noise figure (4 to 6 dB).
Typically, an EDFA consists of a length of optical fiber doped with Er3+ ions anda suitable optical pump. The gain characteristics of EDFAs depend on the pumpingscheme as well as on other dopants, such as the germanium and aluminum presentwithin the fiber core. The amorphous nature of silica broadens the energy level oferbium ions into bands. Many transitions can be used to pump the EDFA. Effi-cient pumping is achieved using semiconductor lasers operating near the 0.98- and1.48-µm wavelengths. The pumping scheme can be either a forward pump or a back-ward pump, as shown in Figure 2.16. The performance is nearly the same in thetwo pumping configurations when the signal power is small enough for the ampli-fier to remain unsaturated. In the saturation regime, the power-conversion efficiencyis generally better in the backward-pumping configuration, mainly because of theimportant role played by the amplified spontaneous emission. In the bidirectionalpumping configuration, the amplifier is pumped in both directions simultaneously byusing two semiconductor lasers located at the two fiber ends. This configuration re-quires two pump lasers but has the advantage that the population inversion, and hencethe small-signal gain, is relatively uniform along the entire amplifier length. In somehigh-performance EDFAs, two-stage pumping is used: forward pumping in the firststage for high gain and low noise amplification, and backward pumping in the secondfor high output powers. In addition, an optical isolator is placed immediately afterthe first amplifying stage (critical for a low noise figure) to prevent degradation of thefirst-stage performance due to the backward-propagation ASE noise from the secondstage. An optical filter can be placed after the first stage to prevent gain saturationcaused by the ASE peak around 1530 nm. Gain flattened filters and/or dispersioncompensation modules are usually inserted between these two stages.

82 OPTICAL COMMUNICATIONS: COMPONENTS AND SYSTEMS
WDM WDM
WDM WDM
WDM WDM
WDM WDMWDM WDM
Signal Signal
Signal Signal
Signal
Signal Signal
Signal
Isolator
pump pump
pump pump
pump pump
pump1 pump1 pump2 pump2
EDFA
EDFA
EDFA EDFA
EDFA
Forward Pump
Backward Pump
Dual Pump
Two-stage Pump
FIGURE 2.16 Various EDFA pump schemes.
Most EDFAs operate in the C-band (1528 to 1562 nm), which corresponds tothe peak of the 4I13/2–4I15/2 erbium energy-level transition. An erbium-doped fiber,however, has a relatively long tail to the gain shape, extending well beyond this range,to about 1605 nm, which corresponds to the tail of the 4I13/2–4I15/2 energy-leveltransition. This has stimulated the development of EDFA for the L-band from 1565to 1625 nm (note that part of the L-band in the 1610 to 1625 nm region is not coveredby L-band EDFA). Because L-band EDFA exploits the tail of the erbium gain band,emission and absorption coefficients are three to four times smaller than in the C-band.In addition, L-band EDFA operates at low average inversion in order to minimize theintrinsic gain ripple. The comparatively flatter intrinsic gain spectrum simplifies thedesign and implementation of gain-flattening filters. These two operation conditionsrequire erbium-doped fiber that is four to five times longer than that is required forthe C-band (assuming typical erbium concentration levels) or high erbium dopingconcentration (as high as 1900 ppm, compared to 300 to 500 ppm for typical EDFAs),and the pump powers required for L-band EDFAs are much higher than that arerequired for their C-band counterparts. Due to the smaller absorption cross sectionsin the L-band, these amplifiers also have higher amplified spontaneous emission.

OPTICAL AMPLIFIERS 83
Whereas EDFAs can only be used for light-wave systems operating near1.55 µm, fiber amplifiers operating at 1.3-µm wavelength can be realized by dopingZBLAN fiber (a fluoride fiber fabricated with ZrF4–BaF2–LaF3–AlF3–NaF) withpraseodymium (Pr3+) ions. Pr-doped fiber amplifiers can provide 30 dB gain and20 nm bandwidth around 1.3-µm wavelength with 1-W pump power in the wave-length region near 1.01 m. The pumping efficiency of Pr-doped fiber amplifiers isvery small (<0.2 dB/mW) compared with that of EDFA (as high as 10 dB/mW). Thesaturation power of such amplifiers is very high (200 mW). Relatively high cost andthe practical difficulty of working with fluoride fiber hinder their wide application.
2.4.2 Semiconductor Optical Amplifiers
A semiconductor optical amplifier has a structure very similar to that of a semicon-ductor laser except that it has no resonant cavity. Figure 2.17 shows the structureof a semiconductor optical amplifier. In a semiconductor optical amplifier, an activelayer (i.e., gain medium) with lower bandgap energy and higher refractive index issandwiched between a p material and an n material (which form a p-n junction).Therefore, a waveguide is effectively formed by these three layers of semiconductormaterials. Incident optical signal travels along the gain medium and undergoes am-plification. Two end facets of the device are coated with an antireflection layer, sothe device will not lase under a large injection current. This type of device is calleda traveling-wave semiconductor optical amplifier.
For a semiconductor optical amplifier with active layer length L , the amplifiergain can be found from standard Fabry–Perot interferometers and is given by
G (λ) = (1 − R1) (1 − R2) Gs(1 − Gs
√R1 R2
)2 + 4Gs√
R1 R2 sin2 φ (λ), (2.152)
where Gs = exp(gL) is the single-pass amplifier gain and R1 and R2 are the facetreflectivities. The phase shift is given by
φ = 2π nL
λ+ αcg0L
2
P
P + Ps, (2.153)
Antireflection coating
p
n
FIGURE 2.17 Structure of a semiconductor optical amplifier.

84 OPTICAL COMMUNICATIONS: COMPONENTS AND SYSTEMS
where n is the effective refractive index of the amplifier, α the linewidth enhancementfactor, g0 the unsaturated gain, and P and Ps the internal optical power and saturationpower, respectively. For an ideal traveling-wave SOA, R1 = R2 = 0, and hence G =Gs . The gain spectrum of an ideal SOA depends only on the gain profile of thesemiconductor material. However, in practice, the residual reflectivities can be madevery small (<0.1%) but nonzero. In this case, the gain spectrum shows a small ripplewhere the maximum and minimum gain ratio is given by
G R = Gmax
Gmin= 1 + Gs
√R1 R2
1 − Gs√
R1 R2. (2.154)
The gain ripple increases with increasing gain and increasing facet reflectivities.In addition to antireflection coating, angled- or buried-facet structure (as shown inFigure 2.18) is also commonly used to reduce the gain ripple. In an angled-facetstructure, the reflection wave is separated from the incident wave, and thus thereflectivities are effectively reduced. As an alternative, buried-facet structure spreadsthe optical field before it is reflected at the facet, so little of the power of the reflectedwave is coupled into the active layer. Commercially available traveling-wave SOAscan provide a peak gain of 20 to 30 dB with a gain ripple below 1 dB. The peak gainwavelength depends on the active layer material, and the gain bandwidth could be 30to 80 nm. A typical output saturation power of SOAs is 5 to 15 mW.
In addition to optical amplification, SOAs also add ASE noise at its output. Thenoise figure of an SOA is given by
Fn = 2 · N
N − N0· g
g − αint, (2.155)
Angled facet
Buried facet
FIGURE 2.18 Structures to reduce reflection in SOAs.

OPTICAL AMPLIFIERS 85
where N is the carrier density, N0 the transparency carrier density, and αint the internalloss coefficient. Residual facet reflectivities can increase the noise figure by a factorof 1 + R1G, where R1 is the reflectivity of the input facet. For most traveling-waveSOAs, R1G 1, and this additional factor is often neglected. Typically, Fn = 5 − 8for SOAs.
Compared to EDFA, SOAs can be designed to operate at any wavelength, depend-ing on the selection of gain medium. SOAs can also be integrated with a laser (as abooster amplifier) or photodiode (as a preamplifier). However, an SOA is inherentlya polarization-sensitive device. The amplifier gain for TE or TM mode could differas much as 6 dB. With proper design (e.g., square waveguide or polarization diversestructure), the polarization dependence could be reduced to about 1 dB. SOAs alsoshow significant nonlinearity when operating with large signal powers. When usedfor multiwavelength amplification, SOAs suffer from interchannel crosstalk. Threeprominent nonlinear effects are cross-gain modulation, cross-phase modulation, andfour-wave mixing. Even though these nonlinear effects are detrimental for opticalamplification applications, they are often employed for optical signal processing,such as wavelength conversion and all-optical regeneration.
2.4.3 Raman Amplifiers
Raman amplifier utilizes stimulated Raman scattering (as discussion in Section2.1.5.1) to transfer the energy of optical pump to an optical signal at a longer wave-length. Under high pump power, the optical fiber itself can be used as a gain mediumfor optical amplification. The optical amplification gain of fiber Raman amplifiersdepends on the properties of the transmission fiber, such as pump absorption, effectivearea, and Raman gain coefficient. The gain coefficient of a fiber Raman amplifier isproportional to the pump intensity and it can be written as
g (ω) = gr (ω)Pp
ap, (2.156)
where gr (ω) is the Raman gain coefficient and ap is the cross-sectional area of thepump beam inside the fiber. The Raman spectrum has a gain peak at a wavelengthshift of about 13 THz (about 100 nm for a 1.45-µm pump) and the gain bandwidth isabout 6 THz (about 50 nm in a 1.55-µm region). The large bandwidth and low noisefigure of fiber Raman amplifiers make them attractive for fiber optic communicationapplications. However, a relatively large pump power (>1 W) is required to realize alarge amplification gain.
For small-signal amplification and co-propagation of pump and optical signal, theoptical gain of a Raman amplifier is given by
Gr = exp(g0L). (2.157)
The small-signal gain g0 is given by
g0 = gr Pp0 Leff
αp L, (2.158)

86 OPTICAL COMMUNICATIONS: COMPONENTS AND SYSTEMS
where Pp0 is the input pump power and the effective length of the amplifier isLeff = [
1 − exp(−αp L)]/αp, where αp is the fiber loss at the pump wavelength. For
αLeff � 1, Leff ≈ 1/αp.Raman amplifiers offer great flexibility in choosing the wavelength of the ampli-
fication region (provided that a suitable pumping laser is available). EDFAs providesgains in the C- and L-bands (1530 to 1630 nm). Thus, Raman amplifier can providegain in the O-band (1260 to 1360 nm) and potentially open up other bands for WDM,such as the S-band (1460 to 1530 nm) and the E-band (1360 to 1460 nm). With theuse of multiple pumps at different wavelengths and different powers simultaneously,we can tailor the Raman gain shape. Today the most popular use of Raman amplifiersis to complement EDFAs by providing additional gain in a distributed manner in anultra-long-haul system.
Raman amplification is inherently low-noise. Spontaneous emission noise is rela-tively low. The major noise source is due to Rayleigh scattering of the pump signalin the fiber and spontaneous Raman scattering. However, Raman amplifiers exhibitsignificant cross-gain saturation. Raman scattering is inherently a very fast process,and the Raman gain responds to the pump power almost instantaneously. Fluctua-tions in pump power will cause the gain to vary and will appear as crosstalk to thedesired signal. Therefore, for Raman amplifiers, it is important to keep the pump ata constant power level. Having the pump propagate in the direction opposite to thesignal helps dramatically because fluctuations in pump power are then averaged overthe propagation time over the fiber. Another major concern with Raman amplifiersis crosstalk between the WDM signals due to Raman amplification. A modulatedsignal at a particular wavelength depletes the pump power and affects the gain seenby the wavelengths. Again, having the pump propagate in the direction opposite tothe signal reduces this effect dramatically.
2.5 PASSIVE OPTICAL COMPONENTS
Besides optical fiber, optical transmitters, optical receivers, and optical amplifiers,many passive optical components are used in optical communication systems. Com-monly used passive optical components in passive optical networks include opticalcouplers, optical filters, and multiplexers. Optical splitters are used to split opticalpower into multiple fibers; optical filters are utilized to filter out optical signals withspecific wavelengths; and optical multiplexers can combine or separate optical signalswith different wavelengths. Passive optical components do not require any externalpower to perform their functionalities, and hence they are more reliable and requireless maintenance effort.
2.5.1 Directional Couplers
A directional coupler consists basically of parallel optical waveguides sufficientlyclosely spaced that energy is transferred from one to the other by optical tunneling.This energy is transferred by a process of synchronous coherent coupling between theoverlapping evanescent tail of the modes guided in each waveguide. Photons of the

PASSIVE OPTICAL COMPONENTS 87
driving modes, say in guide 0, transfer into the driven mode in guide 1, maintainingphase coherence as they do. This process occurs cumulatively over a significantlength; hence, the light must propagate with the same phase velocity in each channelin order for this synchronous coupling to occur. The fraction of the power coupledper unit length is determined by the overlap of the modes in the separate channels.
Optical coupling between two waveguides can be described by coupled modetheory. Assume that A1(z) and A2(z) are optical fields propagating in two waveguidesof a directional coupler. The coupled mode equations for these two optical fields canbe written as
d A1(z)
dz= − jβ A1(z) − jκ A2(z),
d A2(z)
dz= − jβ A2(z) − jκ A1(z),
(2.159)
where two waveguides are assumed to be identical and lossless, and β is the propaga-tion constant in the waveguides. The coupling coefficient κ depends on the shape andseparation between the waveguides. Solving the coupling wave equations, we have
A1(z) = A cos κz exp( jβz), (2.160)
A2(z) = − j A sin κz exp( jβz). (2.161)
Thus, the optical power flow in the waveguides is given by
P1(z) = |A1(z)|2 = A2 cos2 κz, (2.162)
P2(z) = |A2(z)|2 = A2 sin2 κz. (2.163)
and the power coupling coefficient is given by
C = P2(z)
P1(0)= sin2 κz. (2.164)
The optical power transfers back and forth between the two waveguides as a functionof length, as shown in Figure 2.19. In addition, there exists a distinct phase differencebetween the amplitude of the fields in the two waveguides. Initially, the optical fieldA1(z) in waveguide 2 lags 90◦ behind the optical field A1(z) in waveguide 1, andthe power is transferred from waveguide 1 to waveguide 2. After κz = π/2, all ofthe optical power has been transferred to waveguide 1. Then for π/2 < κz < π , theoptical field in waveguide 1 lags 90◦ behind that in waveguide 2, and so on. This phaserelationship results from the basic mechanism that produces the coherent transfer ofenergy. The field in the driving guide causes a polarization in the dielectric materialwhich is in phase with it and which extends into the region between guides because ofthe mode tail. This polarization then acts to generate energy in the mode of the drivenguide. It is a basic principle of field theory that generation occurs when polarizationleads the field, while dissipation occurs when polarization lags the field. Thus, the

88 OPTICAL COMMUNICATIONS: COMPONENTS AND SYSTEMS
x z Guide 0
Pow
er (
a.u.
)
Guide 1
yw
sn1
P1(x, y) P2(x, y)
P1(z)
P2(z)
Z
n1n2
w
t
FIGURE 2.19 Optical power coupling between two parallel waveguides. P1(x, y) andP2(x, y) represent the mode distribution of two waveguides. Because of significant over-lap between P1(x, y) and P2(x, y), optical power can be coupled back and forth between thesetwo waveguides. The power variation along the z direction is shown by P1(z) and P2(z).
lagging field in the driven guide is to be expected. Because of this definite phaserelationship, the dual-channel coupler is a directional coupler. No energy can becoupled into a backward wave traveling in the −z direction in the driven waveguide.
Optical couplers (splitters) can be created by fused fibers. For example, two piecesof fiber are placed side by side in a flame, drawn, and fused together to form a 2×2fiber coupler. In this coupler, a long tapered section is created in each fiber, where thecore diameter is small. Thus, the normalized frequency V is reduced in the taperedsection, and the field is more weakly confined and extends outside the cladding area sothat efficient coupling occurs between the two fibers. The power coupling coefficientfrom one fiber to the other is
C = F2 sin2 ξ z
F, (2.165)
where
F2 = 1
1 + (234a3/λ3)(�a/a)2, (2.166)
ξ = 21λ5/2
a7/2. (2.167)

PASSIVE OPTICAL COMPONENTS 89
The power coupled from one fiber to the other can be varied by changing z, the lengthof the coupling region over which the fields from the two fibers interact. Here a is theeffective core radius in the coupling region, and �a is the difference in effective coreradii in the coupling region. If the core radius difference is zero (�a = 0), F = 1,and the power coupling coefficient becomes
C = sin2 ξ z. (2.168)
The coupling ratio can be made anywhere between 0 and 1 by varying the couplinglength and by adjusting the two effective core diameters in the coupling region. Sincethe coupling coefficient depends on the wavelength, fused fiber couplers can also bedesigned to deliver all the optical power at one wavelength to one output port and allthe optical power at another wavelength to the other output port. In this case we havea wavelength-division multiplexer/demultiplexer.
An optical power splitter can also be made with planar light-wave circuits. A Y-branch or multimode interference planar light-wave circuit can split the input opticalpower to two output waveguides. The coupling ratio of the Y-branches depends onthe structure and dimension of the waveguides.
An optical coupler is reciprocal; in one direction it is a 1 × N optical coupler; anoptical signal with power Pin is split into N branches with equal power, Pout = Pin/N(assume that the splitter is lossless). In the reversed direction, an optical signal withpower Pi entering one of the N branches will also come out of the common port withpower Pi/N .
2.5.2 Optical Filters
An optical filter is essentially a bandpass filter operating at optical frequencies whichselectively passes one or more wavelengths and rejects others. Optical filters are usedin WDM systems to separate optical signals with different wavelengths. Commonoptical filters include Fabry–Perot etalon, thin-film filters, Mach–Zehnder interfer-ometers, fiber Bragg gratings, and arrayed waveguide gratings.
2.5.2.1 Fabry–Perot Etalon A Fabry–Perot interferometer (FP etalon) consistsof a resonant cavity of length L formed by two parallel mirrors with power reflectivityR. An optical signal that enters the cavity will be reflected back and forth by two endmirrors of the FP etalon. Each time the optical signal reaches the output mirror, partof the optical signal is transmitted and the rest is reflected. The total output will bethe sum of all these transmitted signals with interference among them. Adding up allthe successive contributions to the output signal, the complex transfer function of theoptical field is
H ( f ) = Eout( f )
Ein( f )= 1 − R
1 − R exp(− j4π f τ )exp(− j2πτ ), (2.169)
where Eout( f ) and Ein( f ) are the input and output optical field, respectively, andτ is the one-way propagation time of the optical signal. The optical power transfer

90 OPTICAL COMMUNICATIONS: COMPONENTS AND SYSTEMS
function is given by
T ( f ) = |H ( f )|2 = (1 − R)2
(1 − R)2 + 4R sin2(2π f τ ). (2.170)
The optical power transfer function is a periodic function and its period is called afree spectral range, given by
FSR = 1
2τ= c0
2nL, (2.171)
where n is the refractive index of the cavity and c0 is the speed of light in vacuum.The optical power transfer is maximum for optical signals with wavelength
λ = 2nL
m. (2.172)
In other words, constructive interference occurs when a round trip in the cavity givesa phase shift of a multiple of 2π . The half-power bandwidth (full width at halfmaximum) is given by
BW = c0
2nL
1 − R
π√
R= FSR
F, (2.173)
where the finesse is defined as the ratio of FSR and bandwidth. To get high selectivity,it is necessary to have a high level of finesse, and this, in turn, requires a high mirrorreflectivity R. It is possible to cascade several etalons, each having a modest finesse,to gain a higher overall effective finesse. The FP filter can be tuned with cavity lengthchange through a piezoelectric effect or through the index changes of the cavitymaterials (such as liquid crystal). To tune the filter across one entire FSR, it is onlynecessary to change the mirror spacing by λ/2.
Thin-Film Filters A thin-film filter is essentially a Fabry–Perot etalon where themirrors surrounding the cavity are realized by using multiple reflective dielectricthin-film layers (wavelength-dependent mirror). A thin-film resonant multicavityfilter consists of two or more cavities separated by reflective dielectric thin-filmlayers. The effect of having multiple cavities on the response of the filter is that thetop of the passband becomes flatter and the skirts become sharper, both very desirablefilter features. The multiple dielectric slab structure is quite versatile, and a numberof well-known transfer functions, such as the Butterworth and Chebyshev functions,may be synthesized using such a structure. However, the synthesis of these filterscalls for a variety of dielectric materials with different refractive indices. This maybe a difficult requirement to meet in practice. It turns out, nonetheless, that veryuseful filter transfer functions can be synthesized using just two different dielectric

PASSIVE OPTICAL COMPONENTS 91
Pin1
3 dBCoupler
3 dBCoupler
Pin2
Pout1
Pout2
FIGURE 2.20 Structure of a Mach–Zehnder interferometer.
materials, a low- and a high-index dielectric. A particularly useful filter structureconsists of a few half-wavelength cavities (a thickness of dielectric equivalent to ahalf wave-length, i.e., two layers of quarter-wavelength film) separated by severalquarter-wavelength films (alternating layers of high- and low-index dielectrics withthickness equivalent to a quarter wavelength).
2.5.2.2 Mach–Zehnder Interferometer Figure 2.20 shows the structure ofa Mach–Zehnder interferometer. When an optical signal is incident on one of theinput ports of the Mach–Zehnder interferometer, the optical signal is split by a 3-dBcoupler at the input. Each split light wave traverses different paths and merges inanother 3-dB coupler at the output. The two paths differ by a delay of τ . The transferfunction for an optical field can be found as
[H11( f )
H12( f )
]= 1
2
[exp (− j2π f τ ) − 1
j exp (− j2π f τ ) + j
], (2.174)
and the power transfer function of a Mach–Zehnder interferometer is given by
[|H11( f )|2|H12( f )|2
]= 1
2
[sin2(π f τ )
cos2(π f τ )
], (2.175)
where H11 denotes the transfer function from input port 1 to output port 1, andH12 denotes the transfer function from input port 1 to output port 2. Both powertransfer functions are raised sinusoids, 90◦ out of phase with respect to each other.A Mach–Zehnder interferometer can be tuned by varying the relative delay throughelectro-optic or thermo-optic effects. The finesse of a Mach–Zehnder interferometeris only 2. In practice, a single Mach–Zehnder interferometer cannot provide suffi-cient wavelength selectivity, so multiple stages of Mach–Zehnder interferometers areusually cascaded to achieve a finesse comparable to that of Fabry–Perot etalons.
2.5.2.3 Fiber Bragg Gratings Bragg gratings are periodic perturbations, usu-ally periodic variations of the refractive index in an optical medium. If two waveswith propagation constant β1 and β2 propagate through a Bragg grating, energy can

92 OPTICAL COMMUNICATIONS: COMPONENTS AND SYSTEMS
be coupled from one wave to the other if the Bragg phase-matching condition issatisfied,
|β1 ± β2| = 2π
�, (2.176)
where λ is the period of the Bragg grating. For a reflective filter, optical signals canbe scattered in the opposite direction at the same wavelength if
2β0 = 2π
�. (2.177)
In other words, the wavelength of the reflective optical signal is given by
λ0 = 2neff�, (2.178)
where neff is the effective index of the Bragg grating.A fiber grating can be formed in the fiber core by ultraviolet light imprinting with
a two-beam interference method or phase mask method. When the germanium-dopedfiber core is exposed to an intense ultraviolet pattern, structure defects are formed, thuschanging the refractive index in the core. Fiber gratings are classified as short- andlong-period gratings. Short-period gratings are Bragg gratings which are generallyused as narrowband notch filters, where a forward-propagating mode with a Braggwavelength is strongly coupled to a backward-propagating mode. In long-period fibergratings, energy is coupled from the forward-propagating mode in the fiber core intoother forward-propagating modes in the cladding. The phase-matching condition forlong-period gratings is given as
∣∣βcore − βcladding
∣∣ = 2π
�. (2.179)
In general, the difference in propagation constants between two forward-propagatingmodes (in core and cladding, respectively) is quite small, leading to a fairly largevalue of grating period. Since the cladding mode is highly lossy, long-period gratingsare very efficient, and a band rejection filter can be tailored to provide almost exactequalization of an erbium gain spectrum. Hence, long-period fiber Bragg gratings arecommonly used as gain equalizers in EDFAs.
2.5.2.4 Arrayed Waveguide Gratings The arrayed waveguide grating is ageneralization of the Mach–Zehnder interferometer. Typically, an array waveguidegrating consists of M input ports, N output ports, and two identical focusing planarstar couplers connected by K uncoupled waveguides (arrayed waveguides), as shownin Figure 2.21. The length of adjacent waveguides differs by a constant value �L , sothey form a Mach–Zehnder type of grating.
When an optical signal is incident on one of the input ports, it is split and coupledinto those array waveguides. Since the waveguides have different lengths, when these

SYSTEM DESIGN AND ANALYSIS 93
FIGURE 2.21 Structure of an arrayed waveguide grating.
signals arrive at the output port, a constructive or destructive interference pattern willbe formed. Optical signals with different wavelengths will have constructive interfer-ence at different output ports. Therefore, when WDM optical signals are incident atone input port, they will separate into different outputs. Arrayed waveguide gratingsare typically used as multiplexers or demultiplexers in WDM optical communicationsystems.
2.6 SYSTEM DESIGN AND ANALYSIS
The performance of an optical communication system depends on many factors;fiber loss, dispersion, nonlinearities, and receiver noise are the four most importantlimiting factors. Fiber loss attenuates the signal power; after transmission over along length of optical fiber, the signal power could be very low. If the signal powerafter photodetection is lower than the noise level at the receiver, the signal cannot berecovered reliably. Fiber dispersion introduces pulse broadening and intersymbol in-terference and thus introduces bit errors at optical receivers. Fiber nonlinearities suchas self-phase modulation, cross-phase modulation, and four-wave mixing may reducesignal power, lead to signal distortion, and introduce crosstalk, and hence degradethe overall system performance. In this section we analyze the system performanceof an optical communication link and discuss the power budget and dispersion limitimposed by optical transmission channels.
2.6.1 Receiver Sensitivity
The primary factor in determining receiver sensitivity is the signal-to-noise ratio atthe optical receiver. The signal power at the receiver depends on the optical signalstrength and the photodetector. The major noise sources in optical receivers arethermal noise, shot noise, and ASE noise if an optical amplifier is used.
Noise Sources Thermal noise is due to the random motion of electrons in resis-tors or other electronic components. Electrons are always in motion because of theresistor’s thermal energy. The velocity and directions of electron motion are random,

94 OPTICAL COMMUNICATIONS: COMPONENTS AND SYSTEMS
and the intensity of this motion is proportional to the temperature. The effect of thisthermal motion of electrons is to produce a randomly varying voltage or current,called thermal noise. Thermal noise can be represented as a voltage source, vth,in series with the resistor or a current source, ith, in parallel with the resistor. Themean-squared values of the thermal noise are
〈v2th〉 = 4kB T RL � f,
〈i2th〉 = 4kB T � f/RL ,
(2.180)
where kB is the Boltzmann constant, T the absolute temperature, RL the load resis-tance, and � f the effective bandwidth.
The randomness of the photogeneration process in a photodiode produces a currentwith average value Iph (proportional to the optical power) but with fluctuationsabout this average value. The fluctuations can be explained on the basis of randomemission and generation times and the discrete quantity of charge on the electron. Thefluctuations are represented by a noise current called shot noise. The mean-squaredvalue of the shot noise current is given by
〈i2s 〉 = 2q Iph � f, (2.181)
where q is the elementary charge.
PIN Receivers For PIN receivers, the average photocurrent is
Iph = R Pin, (2.182)
where Pin is the average receiver optical power. The shot noise generated by thephotodiode is
〈i2s 〉 = 2q I B = 2q
(Iph + Id
)� f, (2.183)
where Id is the dark current (leakage current when no optical signal is incident) inthe photodiode. Thermal noise due to the load resistor is
〈i2th〉 = 4kB T � f
RL. (2.184)
Therefore, the signal-to-noise ratio for PIN receivers is
SNR = (R Pin)2
2q (R Pin + Id ) � f + 4kB T � f/RL. (2.185)
In most cases of practical applications, thermal noise dominates PIN receiver perfor-mance. Since the thermal noise current is inversely proportional to load resistor RL ,

SYSTEM DESIGN AND ANALYSIS 95
SNR can be improved by increasing the load resistor. This is the reason that mostoptical receivers use a high impedance of transimpedance amplifier.
APD Receivers Optical receivers that employ an APD generally provide a higherSNR for the same incident optical power. The improvement is due to the internal gain,which increases the photocurrent by a multiplication factor M so that the photocurrentbecomes
Iph = RAPD Pin = M R Pin. (2.186)
The shot noise generated by an APD is
〈i2s 〉 = 2q F M2 I B = 2q F M2
(Iph + Id
)� f, (2.187)
where the excess noise factor is given by
F = k M + (1 − k)(2 − 1/M). (2.188)
Again, the thermal noise for the load resistor is
〈i2th〉 = 4kB T � f
RL. (2.189)
Therefore, the signal-to-noise ratio for APD receivers is
SNR = (M R Pin)2
2q F M2 (M R Pin + Id ) � f + 4kB T � f/RL. (2.190)
For a given incident optical power Pin, there exist an optimum value of APD gainsuch that the signal-to-noise is maximized for an APD receiver. The optimum valueof the multiplication factor can be determined from
k M3opt + (1 − k)Mopt = 4kB T
q RL (R Pin + Id ). (2.191)
The optimum value Mopt depends on a large number of receiver parameters, suchas the dark current Id , the responsivity R, and the ionization coefficient ratio k.However, it is independent of receiver bandwidth. Mopt decreases with an increase ininput optical power Pin and is very sensitive to the ionization coefficient ratio k. Fork = 0, Mopt decreases inversely with Pin (In practice, the dark current is negligiblecompared with photocurrent in an APD.) By contrast, Mopt varies as P−1/3
in for k = 1.
PIN Receivers with Optical Preamplifiers When an optical preamplifier is placedin front of a PIN receiver, the optical signal power is improved but ASE noise is alsoadded. Typically, ASE noise is greater than the thermal noise in a PIN receiver

96 OPTICAL COMMUNICATIONS: COMPONENTS AND SYSTEMS
and becomes the dominate noise source. The signal generated in the preamplifiedreceivers is
Iph = G R Pin, (2.192)
where G is the optical amplifier gain. During photodetection, the ASE noise will beatwith the optical signal and create noise in the receiver known as signal-spontaneousbeat noise,
〈i2sig-sp〉 = 2hνR2G2 Fn Pin � f, (2.193)
where Fn is the noise figure of the optical amplifier. In addition, the ASE noise canbeat with itself, creating spontaneous-spontaneous noise in the receiver, given by
〈i2sp-sp〉 = (hνG RFn)2 �ν � f, (2.194)
where �ν is the bandwidth of the optical filter following the optical amplifier. Thisfilter can reduce the ASE noise power. Also, there is shot noise given by
〈i2s 〉 = 2qG R Pin � f, (2.195)
where the shot noise due to ASE noise current and dark current is neglected. The shotnoise can beat with ASE noise as well, and the spontaneous-shot beat noise is givenby
〈i2s-sp〉 = 2hνG RFn �ν � f. (2.196)
The signal-spontaneous beat noise and the spontaneous-spontaneous beat noise dom-inate among all the noise sources. Therefore, the signal-to-noise ratio in preamplifiedreceivers is given by
SNR = (G R Pin)2
2hνR2G2 Fn Pin � f + (hνG RFn)2 �ν � f. (2.197)
Receiver Sensitivity In an optical receiver, the signals I received are the sum ofthe signal (I1 for symbol 1 and I0 for symbol 0) and the noise. The decision circuitcompares the value sampled with a threshold value ID . If I > ID , the decision isbinary 1 or binary 0 for I < ID . Assume that the noise in the optical receiver isGaussian with variance (noise power) σ 2
1 for symbol 1 received and σ 20 with symbol

SYSTEM DESIGN AND ANALYSIS 97
0 received. The probability density function for the signal received is a Gaussianfunction which is given by
f1(I ) = 1√2πσ1
exp
[− (I − I1)2
2σ 21
]binary 1 sent,
f0(I ) = 1√2πσ0
exp
[− (I − I0)2
2σ 20
]binary 0 sent.
(2.198)
The probability of error when a binary 1 is transmitted is given by
P (0|1) =∫ ID
−∞
1√2π σ1
exp
[− (I − I1)2
2σ 21
]d I = 1
2erfc
(I1 − ID√
2 σ1
), (2.199)
and similarly, the probability of error when a binary 0 is sent is
P (1|0) =∫ ∞
ID
1√2π σ0
exp
[− (I − I0)2
2σ 20
]d I = 1
2erfc
(ID − I0√
2 σ0
), (2.200)
where erfc(·) is the complementary error function, defined as
erfc(x) = 2√π
∫ ∞
xxe−u2
du. (2.201)
Assume that the probabilities of sending binary 1 and binary 0 are equal; that is,P(0) = P(1) = 1/2. Then the average probability of error (bit error rate) is
BER = P(1)P(0|1) + P(1|0) = 1
4
[erfc
(ID − I0√
2 σ0
)+ erfc
(I1 − ID√
2 σ1
)].
(2.202)
The optimum threshold is the one that minimizes the probability of error. The optimumthreshold is determined by the equation
(I1 − ID)2
2σ 21
− (ID − I0)2
2σ 20
= lnP(1)
P(0)− ln
σ1
σ0. (2.203)
In practice, the threshold is chosen to make the probability of error P(0|1) and P(1|0)equal; that is,
I1 − ID
σ1= ID − I1
σ0. (2.204)

98 OPTICAL COMMUNICATIONS: COMPONENTS AND SYSTEMS
In this case, the threshold is given by
ID = σ0 I1 − σ1 I0
σ0 + σ1, (2.205)
and the probability of error is
BER = 1
2erfc
(Q√
2
), (2.206)
where
Q = I1 − I0
σ1 − σ0. (2.207)
The bit error rate decreases with increasing Q value. For Q = 6, the bit error rateis about 1.0 × 10⁻⁹, and for Q = 7, the bit error rate is approximately 1.0 × 10⁻¹².To achieve a certain bit error rate (e.g., BER = 1.0 × 10⁻⁹), the optical Pr powerreceived must be larger than a certain value Ps . This minimum received power Ps toreach a certain bit error rate is called receiver sensitivity.
2.6.2 Power Budget
In optical communication system design, a certain power budget is required to ensurethat enough power will reach the receiver to maintain reliable performance during theentire system lifetime. The minimum average power required by the optical receiver isspecified by the receiver sensitivity Ps , and the average launch power of a transmitteris generally specified by Pt . Then the power budget is expressed in the equation
Pt − Ps > CL + Ms, (2.208)
where CL is the total channel loss, Ms is the system margin, and the optical power isexpressed in units of dBm. The purpose of system margin Ms is to allocate a certainamount of power to additional sources of power penalty that may develop duringa system lifetime because of component degradation or other unforeseen events. Asystem margin of a few (3 to 10) dB is generally allocated during the design process.The channel loss CL includes fiber loss and all the other losses (such as connector loss,splice loss, and other passive component loss). In PONs, the channel loss consists offiber and splitter losses (neglecting connector and splice losses), given by
CL = α f L + Csplitter, (2.209)
where α f is the fiber loss in dB/km, L the fiber length, and Csplitter the splitter loss.Given a specific launch power of the transmitter and the receiver sensitivity, the

SYSTEM DESIGN AND ANALYSIS 99
maximum transmission distance in PONs is given by
L ≤ Pt − Ps − Csplitter
α f. (2.210)
Or in the case of a 20-km transmission distance (as specified by GPON/EPONstandards), the maximum splitter loss is
Csplitter ≤ Pt − Ps − α f L . (2.211)
Assume that the loss of a 1 × N splitter is 10 log N ; then the maximum number ofusers that can be supported by the PON system is given by
N ≤ 10(Pt −Ps−20α f )/10. (2.212)
Since PONs are mostly power-limited systems, the power budget is a very importantdesign parameter in PONs.
2.6.3 Dispersion Limit
Fiber dispersion can lead to pulse distortion and intersymbol interference. In additionto fiber loss, fiber dispersion imposes another limit on the bit rate–distance product ofoptical communication systems. A common design criterion for the fiber dispersionlimit is given by
B <1
4σD, (2.213)
where B is the bit rate and σ is the rms (root-mean-square) dispersion induced byoptical fibers. In PON systems, the upstream transmission uses a 1.3-µm window,where the fiber dispersion is minimum (for standard single-mode fiber). Hence, ifnarrow-linewidth DFB lasers are used at the transmitters, fiber dispersion is not asignificant limiting factor for upstream transmission. However, if a Fabry–Perot laseris used, the rms fiber dispersion is given by
σD = σλ |D| L , (2.214)
where σλ is the rms linewidth of the Fabry–Perot laser (usually, 2 nm), D is thefiber dispersion coefficient, and L is the fiber length. The dispersion parameter Ddepends on how close the operating wavelength is to the zero-dispersion wavelengthof the standard single-mode fiber. The bit rate–distance (BL) product of upstreamtransmission is thus given by
BL <1
4σλ |D| . (2.215)

100 OPTICAL COMMUNICATIONS: COMPONENTS AND SYSTEMS
At the 1.3-µm window, |D| is less than 3 ps/nm·km. Therefore, the BL product islimited to about 50 Gb/s·km. As the maximum transmission distance in GPON/EPONis only 20 km, fiber dispersion will not cause significant system performance degra-dation at 2.5 Gb/s even if a Fabry–Perot laser is used.
For downstream transmission at the 1.49- and 1.55-µm windows, fiber dispersioncould be a problem since the fiber dispersion coefficient is about 15 to 17 ps/nm·km.If a Fabry–Perot laser is used at the transmitter, the BL product will be limitedto 8 Gb/s·km. Therefore, fiber dispersion will limit the transmission distance to8 km for a bit rate of 1.0 Gb/s, less than the transmission distance required by theGPON/EPON standard. Therefore, a DFB laser operating in a single longitudinalmode is required for downstream transmission. For a narrow-source spectral width,the rms fiber dispersion is given by
σD = |β2| L , (2.216)
where the group velocity parameter β2 is related to the dispersion coefficient by
β2 = − λ2 D
2πc0. (2.217)
Therefore, for transmitters with DFB lasers, the BL product is limited by
B2L <1
16β2. (2.218)
At the 1.55-µm window, β2 ≈ 2 s2/km. Thus, the bit rate–distance product is limitedto about 3000 (Gb/s)2·km. However, eq. (2.218) works only for transmitters withexternal modulators. For direct modulation using DFB lasers, the frequeny chirpleads to a broadening of the signal spectrum and imposes a much more severelimitation on the BL product. If we assume an rms spectral width σλ = 0.1 nm foran optical signal from a direct modulated DFB laser, the dispersion limited is givenby
BL <1
4σλ |D| . (2.219)
Therefore, the BL product is limited to about 150 Gb/s·km. For a 20-km reach inPONs, direct modulation of DFB lasers works for the bit rate of current GPON/EPONstandards (maximum 2.5 Gb/s). However, for next-generation PONs with a 10-Gb/sdata rate, direct modulation could lead to a large power penalty in downstreamtransmission. In such cases, external modulation is required.

OPTICAL TRANSCEIVER DESIGN FOR TDM PONS 101
2.7 OPTICAL TRANSCEIVER DESIGN FOR TDM PONS
The optical transceiver (transmitter and receiver) used for optical-to-electrical con-version is a key component in optical communication systems. In a PON system, anoptical transmitter and receiver at the optical line terminal (OLT) or optical networkunits (ONUs) are typically packaged together to form a bidirectional optical sub-assembly (BOSA). Figure 2.22 shows the architecture of optical transceivers for anOLT and ONUs. The transmitter optical subassembly (TOSA) consists of a semicon-ductor laser (Fabry–Perot laser or DFB laser) and a laser driver. The receiver opticalsubassembly (ROSA) includes a photodiode (PIN or APD), a transimpedance ampli-fier, a limiting amplifier, and a clock and data recovery circuit. In addition to TOSAand ROSA, a duplex or triplex (WDM filter) is used to separate upstream and down-stream wavelengths. The duplex or triplex is usually a thin-film filter, but optical filters(e.g., Bragg grating or a Mach–Zehnder interferometer) based on planar light-wavecircuits are becoming a preferred option, as planar light-wave circuits are more com-pact, more reliable, and easier to assemble with TOSA and ROSA. As TDM PONsare being deployed on a large scale, significant effort has been put into designing anoptical transceiver with improved performance, lower cost, and better reliability. Thekey challenges in developing optical transceivers for FTTx applications are a higherlevel of integration, cost-effective packaging, and burst-mode optical transmission
D
Laser driver
Data
CLK
Data
CLK
Ref.
DecisioncircuitM
ux/D
emux
TIA
Clockrecovery
AGC
Limiter
Q
D Q
FIGURE 2.22 Block diagram of an optical transceiver.

102 OPTICAL COMMUNICATIONS: COMPONENTS AND SYSTEMS
technologies in the upstream link. For integration and packaging, optical transceiversare evolving toward planar light-wave circuits and monolithic photonic integratedcircuits.
2.7.1 Burst-Mode Optical Transmission
In a TDM PON system, all the users share the same fiber infrastructure from anOLT to the distribution node. In the downstream direction, data packets are broadcastto all ONUs. OLT transmitters and ONU receivers operate in a continuous mode,where synchronization is maintained at all times. Even if there are no data to sendto ONUs, the OLT transmitter has to transmit idle bit patterns so that the ONUs’receiver can retrieve the clock continuously from the downstream signal. However,in the upstream direction, all the users have to share the channel with the TDMAscheme. Packet collisions have to be avoided in the upstream transmission, so at anygiven time, only one packet (from one ONU) is allowed to reach the central office.The OLT coordinates the upstream transmission and schedules the transmission timefor each ONU. When an ONU wants to send data to the OLT, it transmits a burst ofdata in the time assigned by the OLT and then turns off its transmitter completelyto avoid interfering with other ONUs’ upstream transmission. Bursts of data fromdifferent ONUs following each other to the receiver at the central office are separatedby a certain guard time. This type of transmission is called burst-mode transmission.Figure 2.23 compares the data formats of continuous- and burst-mode transmission.Burst-mode optical transmission is a key technology for TDM PONs, in which aburst-mode transmitter at each ONU and a burst-mode receiver at the central office
Transmitter
Transmitter
Transmitter Continuous-Mode Transmission
idle signal idle signaldata
Burst-Mode Transmission
Receiver
Receiver
Receiver
Transmitter
Transmitter
Transmitter
Receiver
Receiver
Receiver
FIGURE 2.23 Comparison of continuous-mode transmission and burst-mode transmission.In continuous-mode transmission, continuous bit streams are sent from sources to destinations;if no data need to be sent, idle signals are sent. In burst-mode transmission, data are sent inbursts from sources to destinations. No idle signals are sent between bursts.

OPTICAL TRANSCEIVER DESIGN FOR TDM PONS 103
are indispensable. A burst-mode receiver at the central office is required to havevarious affordable input ranges and fast clock locking times. On the other hand, aburst-mode transmitter, located on the user side, has to show fast turn-on time as wellas good power suppression during an idle state. Designing high-speed burst-modeoptical transceivers is necessary and challenging when deploying passive opticalnetworks.
Burst-Mode Laser Drivers A burst-mode transmitter has to show fast turn-ontime as well as good power suppression. The design challenges for burst-modelaser/modulator drivers are rise and fall times and automatic power control. Conven-tional driver circuits are designed to maintain a constant bias current and voltage.However, good optical power suppression in the idle state requires that the bias beturned off quickly. Driver circuits have to be designed to have short turn-on/off per-formance. For automatic power control, conventional circuits often use slow monitorphotodiode and/or analog filters to average the signal and an analog control loop tomaintain the desired operating point. Burst-mode operation prevents the use of simpleanalog control loops. It is necessary to monitor optical output sampled at appropriatepoints in a burst waveform.
Burst-Mode Receivers Conventional optical receivers cannot be used for burst-mode detection because they are not able instantaneously to handle various packetsarriving with large differences in optical power and phase alignment. It is thereforenecessary to design receivers that can adapt to the variation in optical power andphase alignment on a packet-by-packet basis. The design challenges for burst-modereceivers are (1) dynamic sensitivity recovery, (2) level recovery, and (3) fast clockrecovery.
When a weak burst follows a strong burst, it is difficult to detect the weak signal.Dynamic sensitivity recovery is necessary for detection of the weak signal. Therecovery of the weak burst is limited by photodiode carrier transport effects, amplifierslew and charging rates, and unintentional automatic gain control effects.
For level recovery, a burst-mode receiver can be designed with a feedback or feed-forward structure. For the feedback design, a differential input/output transimpedanceamplifier and peak detection circuit form a feedback loop, whereas in the feed-forward design, the signal from the preamplifier is feedforward into a peak detec-tion circuitry. Both designs have been implemented in practice. A feedback structureenables the receiver to work more reliably, but a different input/output preamplifieris needed. A feedforward receiver has a faster response time and a conventionaldc-coupled preamplifier can be used, but, the circuitry needs to be designed care-fully to prevent oscillation in the receiver. Level recovery circuits with simple androbust design and good performance are still an open issue that requires furtherinvestigation.
For burst-mode clock recovery, the classical approach—phase-locked loops—canonly recover the clock and phase after thousands of bits and hence are not suitablefor burst-mode transmission. Novel clock recovery architectures such as gated VCOand oversampling have been proposed to fulfill the requirement of burst-mode clock

104 OPTICAL COMMUNICATIONS: COMPONENTS AND SYSTEMS
recovery. However, the jitter performance of these novel burst-mode recovery schemesis relatively poorer than that of the conventional phase-locked loop.
2.7.2 Colorless ONUs
Reliable and low-cost WDM light sources are indispensable for the successful de-ployment of future WDM PONs. In standard TDM PONs, conventional laser diodes,especially inexpensive FP lasers, are used routinely in both OLTs and ONUs. How-ever, for WDM PONs, multiwavelength laser diodes can be very expensive, especiallyif wavelength locking is required in DWDM networks. Cost-effective implementa-tion of WDM light sources at the ONU side is necessary for WDM PONs. Severalapproaches have been demonstrated for implementation of colorless ONUs in WDMPONs, such as spectral sliced broadband light sources, injection-locked FP lasers,and reflective SOAs. The wavelengths of these light sources are not determined bythe gain media themselves but by external factors such as optical filters or injectedsignals, so the wavelengths are easier to manage without worrying about temperatureor aging effects in ONUs. Table 2.1 compares the advantages and disadvantages ofvarious colorless ONUs.
Spectral Sliced Broadband Light Sources A comb of optical signals, each witha unique wavelength, can be achieved by slicing the spectrum of a broadband lightsource. The broadband light source can be superluminescent light-emitting diodesor EDFA or FP lasers. For wavelength selection, an AWG, usually deployed atthe remote node, will slice a narrow spectrum of the broadband optical signals, anddifferent wavelengths will be selected for different ONUs. If a tunable filter is used, thewavelengths of the optical comb can be tuned. The advantage of using spectral slicingis simple implementation and low cost. The disadvantages are limited modulationspeed, low power, and incoherent output, which will limit the transmission span.
Injection-Locked FP Lasers When an external narrowband optical signal is in-jected into a multiple longitudinal mode laser such as an FP laser, the lasing modewill be locked to a single mode. The external optical signal acts as a seed for laseroscillation in the FP cavity, and the mode that is nearest the peak wavelength ofthe injected optical signal will be locked to the injected light, and other modeswill be suppressed. The injected optical signal can be a spectral sliced broadbandlight source (e.g., ASE) or a modulated downstream signal. The advantages of usinginjection-locked FP lasers are simplicity and low cost, and the modulation speed canbe relatively high. The disadvantages are the limited locking range for wavelengthsand power. Modulation index, laser bias current, and the power of external opticalexcitation must be chosen carefully to maximize the efficiency of injection-lockedFP lasers. Since the optical signal from an ONU has the same wavelength as that ofthe injected optical signal, the backscattering of the injected signal could degrade theperformance of upstream transmission.

TA
BL
E2.
1W
DM
-PO
NA
ppro
ach
Com
pari
son
Sum
mar
y
App
roac
hC
omm
mun
icat
ion
Key
Com
pone
nts
Adv
anta
ges
Dis
adva
ntag
es
Tun
able
lase
rs•
Full-
dupl
ex•
Gbi
t/sO
NU
:tun
able
lase
rO
LT:W
DM
dem
ux•
Dyn
amic
wav
elen
gth
man
agem
ent
•C
ansh
are
fiber
from
ON
Uto
RN
ifus
ing
tuna
ble
rece
iver
sfo
rdo
wns
trea
m
•V
ery
high
cost
for
acce
ssne
twor
ks
BL
Sw
/spe
ctra
lsl
icin
g•
Full-
dupl
ex•
Few
Mbi
t/sO
NU
:LE
DB
LS
RN
:AW
GO
LT:W
DM
dem
ux
•In
expe
nsiv
eB
LS
•H
igh
slic
ing
pow
erlo
sslim
itsne
twor
kre
ach
•In
cohe
rent
outp
ut•
BL
Ssp
ectr
umw
idth
limits
num
ber
ofus
ers
per
RN
•H
igh
cros
stal
klim
itatio
ns•
No
fiber
shar
ing
from
ON
Uto
RN
Inje
ctio
n-lo
cked
FPL
D•
Full-
dupl
ex•
Few
Gbi
t/sO
NU
:FPL
D+
circ
ulat
orR
N:A
WG
OLT
:ASE
sour
ce
•In
expe
nsiv
eFP
LD
•R
equi
res
mor
eth
anon
efib
erto
the
ON
Udu
eto
back
scat
teri
ng•
Lim
ited
lock
ing
rang
e•
No
fiber
shar
ing
from
ON
Uto
RN
Cen
tral
ized
light
sour
ces
•H
alf-
dupl
exor
Full-
dupl
ex•
1-2
Gib
t/s
ON
U:S
OA
+ci
rcul
ator
orR
SOA
RN
:AW
GO
LT:W
DM
lase
rs,W
DM
dem
ux
•N
olig
htso
urce
atO
NU
•SO
Aca
nsi
mul
tane
ousl
yac
tas
ade
tect
or
•A
SEno
ise
•R
ayle
igh
back
scat
teri
ngan
dre
flect
ions
need
tobe
min
imiz
ed.
•N
ofib
ersh
arin
gfr
omO
NU
toR
N
Shar
edre
sour
ces
(HPO
N,D
WA
)•
Hal
f-du
plex
orFu
ll-du
plex
ON
U:F
ixed
Las
ers
orR
SOA
OLT
:Tun
able
Las
ers
OLT
orR
N:A
WG
•A
llow
smoo
thtr
ansi
tion
from
TD
Mto
Hyb
rid
TD
M/W
DM
tofu
llW
DM
•R
esou
rce
shar
ing
requ
ire
sche
dulin
gal
gori
thm
s
105

106 OPTICAL COMMUNICATIONS: COMPONENTS AND SYSTEMS
Centralized Light Sources Another alternative for colorless ONUs is use of acentralized source at the OLT. In this approach, no light source is deployed at ONUs;the OLT provides optical signals to ONUs, where the optical signals are modulatedby upstream data and sent back to the OLT. Since all the light sources are located atthe OLT, the requirements for wavelength provisioning and management are relaxedin a controlled environment. Two types of modulators, external modulators and semi-conductor optical amplifiers, have been used for upstream modulation. Comparedto external modulators, semiconductor optical amplifiers can provide signal gain forthe upstream transmission and thus achieve better performance. However, semicon-ductor optical amplifiers have limited modulation speed. To transmit efficiently bothupstream and downstream in a full-duplex manner at the same wavelength, variousdata modulation schemes have been implemented: FSK-ASK, PSK-ASK, and ASK-SCM. The disadvantage of using a centralized light source is the backscattering dueto the Rayleigh or Brillouin effect and the polarization sensitivity of the RSOAsor optical modulators. Also, the cost of RSOAs or external modulators can be anobstacle for practical deployment.
Self-Seeding RSOAs To eliminate the centralized source and reduce the associ-ated cost, self-seeded reflective SOA has been demonstrated for colorless ONUs. Inthis scheme, the ASE noise emitted from RSOA is spectrally sliced by the AWG atthe remote node, and a broadband filter reflectes the ASE noise back to RSOA. Thus,the RSOA is seeded by the spectrally sliced ASE noise, and no other light sourceis needed. The output from the self-seeding RSOA is incoherent and low RIN light,which can be directly modulated by upstream data. The self-seeding RSOAs have theadvantages of simplicity and low cost. The cost of RSOA is relatively higher than thatof FP lasers, but the scheme eliminates any other light sources and thus reduces theoverall system cost. The disadvantage of self-seeding RSOA is that the incoherentoutput could limit the transmission distance.
2.8 SUMMARY
In this chapter we present the fundamentals of optical communication systems anddiscuss the key components and enabling technologies for optical transmission inpassive optical networks.
Optical fiber is the transmission channel in optical communication systems. Inthe first section, characteristics of optical fibers, such as fiber mode, loss, dispersionand nonlinearities are examined in detail, and optical signal propagation in fibers isdiscussed. In the second section we discuss the operation and design of optical trans-mitters. The operating principles of semiconductor lasers and its major characteristicsare presented, and two types of optical modulators, lithium niobate modulator andelectroabsorption modulators, are discussed. The design of laser driver circuits is alsopresented, with a focus on laser drivers and power control circuits.
Next, we discuss two types of photodetectors commonly used in optical communi-cations: pin and avalanche photodiodes. Optical receiver circuits are also presented.

REFERENCES 107
Optical amplifiers are presented in the fourth section. Operating principles, the gainand noise figures of erbium-doped fiber amplifiers, semiconductor optical amplifiers,and Raman amplifiers are discussed in detail. Next we focus on passive opticalcomponents commonly used in passive optical networks. Operating principles ofoptical couplers and filters are also presented.
System performance of optical communication systems is analyzed in the sixthsection. Various noise sources in optical receivers are presented and a system’s bit er-ror rate is analyzed. The power budget and dispersion limit of optical communicationlinks are also discussed in this section.
Finally, optical transceiver design for FTTx applications is presented, burst-modeoptical transmission in the upstream link of TDM PON systems is discussed, andcolorless ONUs for future WDM PONs are described.
REFERENCES
1. G. P. Agrawal, Lightwave Technology, Vol. 1, Components and Devices, and Vol. 2,Telecommunication Systems, Wiley-Interscience, Hoboken, NJ, 2004.
2. I. P. Kaminow, T. Li, and A. E. Willner, Eds., Optical Fiber Telecommunications, 5th ed.,Academic Press, San Diego, CA, 2008.
3. R. Ramaswami and K. Sivarajan, Optical Networks: A Practical Perspective, 2nd ed.,Morgan Kaufmann, San Diego, CA, 2001.
4. J. A. Buck, Fundamentals of Optical Fibers, 2nd ed., Wiley-Interscience, Hoboken, NJ,2004.
5. T. Suhara, Semiconductor Laser Fundamentals, CRC Press, Boca Raton, FL, 2004.
6. E. Kapon, Semiconductor Laser, Vol. I, Fundamentals, and Vol. II, Materials and Struc-tures, Academic Press, San Diego, CA, 1998.
7. H. S. Nalwa, Photodetectors and Fiber Optics, Academic Press, San Diego, CA, 2001.
8. S. B. Alexander, Optical Communication Receiver Design, IEE, London, 1997.
9. E. Desurvire, Erbium-Doped Fiber Amplifiers: Principles and Applications, Wiley-Interscience, Hoboken, NJ, 2002.
10. N. K. Dutta and Q. Wang, Semiconductor Optical Amplifiers, World Scientific Publishing,2006.
11. M. N. Islam, Raman Amplifiers for Telecommunications, Vol. 1, Physical Principles, andVol. 2, Sub-systems and Systems, Springer-Verlag, New York, 2003.

CHAPTER 3
PASSIVE OPTICAL NETWORKS:ARCHITECTURES AND PROTOCOLS
In response to the steadily increasing demand for bandwidth and advanced network-ing services from residential as well as enterprise customers, passive optical networks(PONs) over the last decade have emerged as a matured access technology that offersflexibility, broad area coverage, and cost-effective sharing of expensive fiber links andnetworking equipment. Both ITU and IEEE have standardized solutions for PONsoperating at gigabit per second line rates [1]. ITU-T extends the early work of the fullservice access network (FSAN) working group, which brings efficient fiber accessto homes by creating ATM-based PON (APON). APON, the first standardized PONsolution, supports the legacy of ATM protocols at 622 Mb/s (OC-12) of downstreambandwidth and 155 Mb/s (OC-3) of upstream bandwidth. Since the initialization ofAPON and an improved solution for ITU-T G.983.1 broadband PON (BPON), newerstandards have been investigated to support gigabit rates and packet-based Internetapplications. Gigabit PON (GPON) was rectified by ITU-T in the G.984.x Recom-mendations to support gigabit rates and a mix of TDM, ATM, and Ethernet services,and to enhance security. At approximately the same time, the Ethernet in the first-mile(EFM) 802.3ah study group has standardized Ethernet PON (EPON) to leverage thecommercial success of Ethernet as a local area network (LAN) technology. The EFMeffort creates a minimal set of extensions to the IEEE 802.3 medium access control(MAC) and control sublayers.
Despite their similarities in common transmission wavelength and opticaltransceiver budget, the GPON and EPON standards differ substantially in the
Broadband Optical Access Networks, First Edition. Leonid G. Kazovsky, Ning Cheng, Wei-Tao Shaw,David Gutierrez, and Shing-Wa Wong.C© 2011 John Wiley & Sons, Inc. Published 2011 by John Wiley & Sons, Inc.
108

PON ARCHITECTURES 109
properties of their physical medium-dependent (PMD) layer, transmission conver-gence (TC) layer, OAM capabilities, and MAC layer. We will not discuss each PONstandard in full detail. Instead, topics are presented to serve as introductory materialsto gain insight into the various PON architectures and protocols. In the first part ofthe chapter we present the generic PON architecture and terminology, followed byspecific packet encapsulation methods employed by IEEE and ITU standards. Thenadditional details are presented on user data and control planes. These details includebandwidth assignment, autodiscovery and ranging, security, and path protection.Finally, we discuss a number of new topics, such as 10-Gb line rate, WDM, reachextension, and energy efficiency, that have emerged in recent IEEE and ITU standarddiscussions. We include essential information on these recently proposed topics tobridge the discussion to Chapter 4, where we deal with next-generation broadbandoptical access networks.
3.1 PON ARCHITECTURES
PON employs a physical point-to-multipoint (P2MP) architecture. Figure 3.1 showsthe architecture of a generic standard commercial TDM-PON. In this architecture,an optical line terminal (OLT) is connected and shared by multiple optical networkunits (ONUs) via a passive optical splitter. Downstream traffic is sent from OLTsusing a 1490-nm wavelength, and upstream traffic from ONUs is carried on a 1310-nm wavelength. In some PONs, analog video signal is still carried on the 1550-nmwavelength, although most analog video signal today has been replaced by digitalvideo signal.
The connection between an OLT and an ONU is called the optical distributionnetwork (ODN). At the user side, the ONU offers one or more ports through its
Optical Distribution Network (ODN)
Central Office
ONU-1UNI
1 2 N
Downstream (1490nm)
Cross-connect
ONU-2PassiveSplitter
OLT-1
OLT-21 2
N
OLT: Optical Line Terminal
ONU: Optical Network Unit
Node Interface ONU-N
SNIOLT-M
Upstream (1310nm)
SNI: Service
UN: User Network Interface
FIGURE 3.1 Standard TDM-PON architecture.
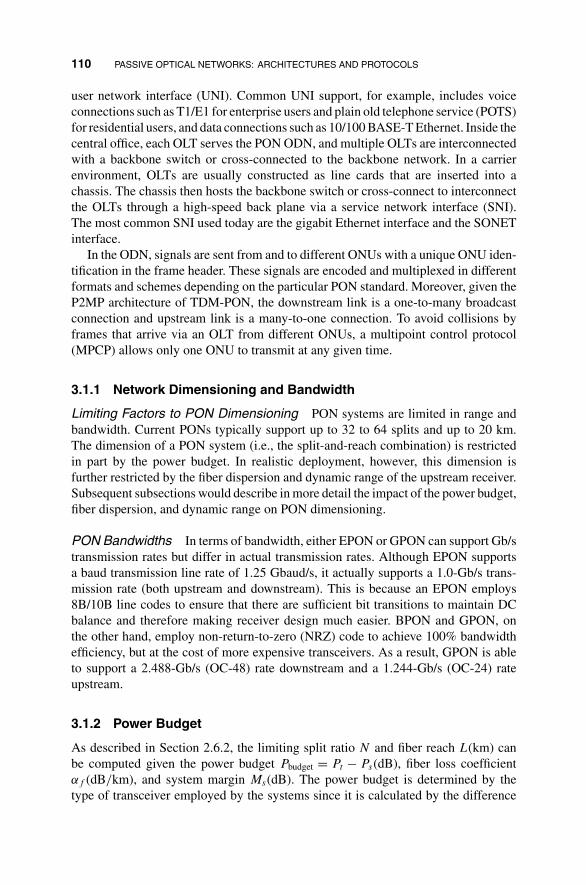
110 PASSIVE OPTICAL NETWORKS: ARCHITECTURES AND PROTOCOLS
user network interface (UNI). Common UNI support, for example, includes voiceconnections such as T1/E1 for enterprise users and plain old telephone service (POTS)for residential users, and data connections such as 10/100 BASE-T Ethernet. Inside thecentral office, each OLT serves the PON ODN, and multiple OLTs are interconnectedwith a backbone switch or cross-connected to the backbone network. In a carrierenvironment, OLTs are usually constructed as line cards that are inserted into achassis. The chassis then hosts the backbone switch or cross-connect to interconnectthe OLTs through a high-speed back plane via a service network interface (SNI).The most common SNI used today are the gigabit Ethernet interface and the SONETinterface.
In the ODN, signals are sent from and to different ONUs with a unique ONU iden-tification in the frame header. These signals are encoded and multiplexed in differentformats and schemes depending on the particular PON standard. Moreover, given theP2MP architecture of TDM-PON, the downstream link is a one-to-many broadcastconnection and upstream link is a many-to-one connection. To avoid collisions byframes that arrive via an OLT from different ONUs, a multipoint control protocol(MPCP) allows only one ONU to transmit at any given time.
3.1.1 Network Dimensioning and Bandwidth
Limiting Factors to PON Dimensioning PON systems are limited in range andbandwidth. Current PONs typically support up to 32 to 64 splits and up to 20 km.The dimension of a PON system (i.e., the split-and-reach combination) is restrictedin part by the power budget. In realistic deployment, however, this dimension isfurther restricted by the fiber dispersion and dynamic range of the upstream receiver.Subsequent subsections would describe in more detail the impact of the power budget,fiber dispersion, and dynamic range on PON dimensioning.
PON Bandwidths In terms of bandwidth, either EPON or GPON can support Gb/stransmission rates but differ in actual transmission rates. Although EPON supportsa baud transmission line rate of 1.25 Gbaud/s, it actually supports a 1.0-Gb/s trans-mission rate (both upstream and downstream). This is because an EPON employs8B/10B line codes to ensure that there are sufficient bit transitions to maintain DCbalance and therefore making receiver design much easier. BPON and GPON, onthe other hand, employ non-return-to-zero (NRZ) code to achieve 100% bandwidthefficiency, but at the cost of more expensive transceivers. As a result, GPON is ableto support a 2.488-Gb/s (OC-48) rate downstream and a 1.244-Gb/s (OC-24) rateupstream.
3.1.2 Power Budget
As described in Section 2.6.2, the limiting split ratio N and fiber reach L(km) canbe computed given the power budget Pbudget = Pt − Ps(dB), fiber loss coefficientα f (dB/km), and system margin Ms(dB). The power budget is determined by thetype of transceiver employed by the systems since it is calculated by the difference

PON ARCHITECTURES 111
between transmitter launch power Pt and receiver sensitivity Ps . For the reasonsgiven below, both EPON and GPON support very similar dimensioning since theyrely on virtually the same underlying physical system.
Both EPON and GPON standards support similar transceivers in class A (Pbudget =20 dB) and class B (Pbudget = 25 dB) optical transceivers. GPON further supportsclass C (30 dB) optical transceivers. Typical class A transceivers could mean theuse of a DFB laser/APD receiver at the OLT and PIN laser/FP receiver at the ONU.Class C transceivers would utilize a DFB laser/APD receiver at both the OLT andthe ONU. In practice, both EPON and GPON have converged to adopt to the useof class B+ (28 dB)-type transceivers to cost-effectively enable sufficient powerbudget. It should be noted that most commercial DFB/APD transceivers can supportmore than a 28-dB budget. However, an additional 3 to 4 dB of margin is built in toaccount further for laser power fluctuation due to outdoor temperature variation andtransceiver aging. Temperature variation is an important factor in PON because ONUlasers are being deployed without support from expensive temperature controllers.
EPON and GPON standards are also adopted to the same wavelength plan (i.e.,1490 nm downstream and 1310 nm upstream), for reasons described in Section 2.1.3.Specifically, the downstream transmission window is between 1480 and 1500 nm, andthe upstream transmission window is between 1260 and 1360 nm. In addition, ITUG.983.3 specifies an enhancement band in the 1550 and 1560 nm window to reservefor analog video (ITU J.185/186) or additional digital service overlays. Among thesewavelength windows, fiber losses in the upstream 1310-nm window is the limitingfactor since signal experiences the greatest attenuation in the 1310-nm window.
To summarize, the following equation should be used when determining the max-imum split and fiber reach of a PON system:
Pbudget(dB) > α1310 nmL + 10 log10(N ) + Ms(dB). (3.1)
The typical fiber loss coefficient at 1310 nm is expected to be 0.38 dB/km, andthus a class B+ budget should be able to support a combination of 20 km and 64users with 2.33 dB of system margin. The margin reserves a portion of budget tooffset uncertainties, such as various points of connector losses, and transceiver aging.Reserving sufficient system margin is an important consideration for the operatorsbecause it could reduce the potential service outage time and thus save maintenancecosts. In reality, most deployment guidelines are conservative and assume the fiberloss coefficient to be above 0.5 dB/km. A 1-dB connector loss is considered furtherfor the worst-case scenario. As a result, a class B+ power budget would support only12 km and 32 users with less than 3 dB of system margin.
Chromatic Dispersion As described in Section 2.6.3, fiber dispersion is one ofthe limiting factors for current PON systems. This is evident by eq. (2.219), where itis concluded that the bandwidth–physical reach product. The limit is 1000 Gb/s · kmfor a DM-DFB at only about 8 Gb/s · km for 1310 nm FP laser. In fact, the BPONand GPON standards further specify an aggressive 60-km-reach limitation basedon the use of low-quality Fabry–Perot lasers with a large linewidth near 1 nm.

112 PASSIVE OPTICAL NETWORKS: ARCHITECTURES AND PROTOCOLS
However, as pointed out in the discussion for power budget, the 60-km limit isoverly optimistic without reserving system margin and considering worst-case fiberpropagation effects. The situation, however, is expected to change when future better-quality photonic components are expected to support future PON systems. In thesecases, the BL-related issues would be even more relevant as future PON systems areexpected to drive for a combination solution of higher bandwidth and longer reach.
3.1.3 Burst-Mode Operation
In Section 2.7.1 we describe the burst-mode transmission observed in the upstreamdirection of PON traffic due to many ONUs sharing and taking turns to transmitover the same fiber link. Due to upstream burst-mode transmission, PONs need toaccount additionally for ONU laser ON and OFF times, OLT gain control adjustment,and clock recovery time. Figure 3.2 illustrates the effect of these parameters on theefficiency of the upstream transmission. The guard time includes the time for theprevious ONU to turn the laser off and the new ONU to turn the laser on, a smalltolerance for timing drift between successive transmitting ONUs, plus the time for theOLT to adjust the AGC gain level and recover the clock. In GPON, the “preamble” isused to allow both level recovery (AGC) and clock recovery. Delimiter (GPON) orcode-group alignment (EPON) are used to find the start of the data.
In EPON, the standard body chose a relaxed set of parameters (i.e., laser ONtime = laser OFF time = 512 ns and gain adjustment or recovery time <= 400 ns).GPON, on the other hand, allocates only 32 bits (25.7 ns) for laser ON and OFF anda very stringent 44 bits (35.4 ns) for gain control adjustment and clock recovery. As atrade-off, a fast AGC circuit would not be able to support as wide a dynamic range aswould a slower AGC circuit. Thus, GPONs require further ONUs to suppress outputpower to reduce the dynamic range seen by OLTs.
To achieve fast gain adjustment, the dynamic range of the input signals must belimited. As a result, the differential distance between the nearest and farthest ONUmust be limited to ensure that the AGC circuit can function within the specified gainadjustment time.
Overall, these parameters are selected to meet different design goals. IEEE EPONtypically takes the most aggressive cost-cutting steps, whereas ITU-T BPON andGPON would select more aggressive specifications to maximize performance effi-ciency (i.e., 100% bandwidth utilization, shorter burst-mode overhead, packet as-sembly and fragmentation, and a higher power budget). Although the verdicts on
laserturn-off
laserturn-on
laserturn-off
laserturn-on
tAGC tCDR tAGC tCDRData Data
Inter-ONUguard time
Time
FIGURE 3.2 Timing diagram for upstream transmission.

PON ARCHITECTURES 113
the commercial success of EPON and GPON have yet to be determined, what thesedesign choices do create are leaving some doors open for additional research anddevelopment. In particular, researchers and engineers have worked extensively onimproving the remaining bandwidth efficiency of EPON, whereas GPON’s strin-gent requirement on AGC and CDR time has inspired many innovative solutions toimprove the performance and yield of the circuits.
3.1.4 PON Packet Format and Encapsulation
The main difference between EPONs and GPONs is in the type of packet or frametransmission they support. Today, the majority of Internet traffic is Ethernet, and so isthe majority of the PON traffic. Ethernet PON is a direct extension of the IEEE 802.3Ethernet LAN standard to fiber optic access networks. Figure 3.3 illustrates the MPCPphysical data unit (PDU) frame format used by EPON. The MPCP-PDU frame isbased on the IEEE 802.3z gigabit Ethernet (GbE) frame format and effectively hidesthe EPON header within the GbE preamble section. EPON also supports point-to-point emulation (P2PE) to make EPON links look virtually like a point-to-pointsystem. EPON MPCP and P2PE extensions of Ethernet MAC are defined in clauses64 and 65 of IEEE 802.3. Details of the MPCP and EPON control methods aredescribed in Section 3.4.2.
There is a common misunderstanding that GPON cannot support Ethernet trafficefficiently. That is not true. What is true is that GPON inherits part of ATM networkingand format from its predecessor APON and BPON. However, GPON further adoptsthe GPON encapsulation method (GEM), which uses a generic framing procedure(GFP) to support any packet type in addition to packet fragmentation and packetreassembly. From this perspective, GPON is more flexible than EPON because it cansupport a mix of ATM, Ethernet, and TDM service. Moreover, the ability to support
SFD: Start-of-Frame Delimiter
DA: Destination Address
Source AddressGeneric 802.3z MAC Frame Format
SA:
FCS: Frame Check Sequence
LLID: Logical Link ID
CRC: Cyclic Redundancy CheckDA SA Length/Type Data Unit FCSSFDPreamble
4variable26617Bytes
Fields
10101010 10101010 10101010 10101010 10101010 10101010 10101010 10101011
DA SA 88-0816 OpCode FCSEPON HeaderFields TimeStampspecific OpCode
field/pad
10101010 10101010 10101010 1010101010101011 LLID LLID CRC
402668Bytes 42 4
802.3ah MPCP-PDU Format
FIGURE 3.3 802.3z GbE frame format and 802.3ah MPCP–PDU frame format.

114 PASSIVE OPTICAL NETWORKS: ARCHITECTURES AND PROTOCOLS
packet fragmentation and reassembly is not available in traditional Ethernet-basedMAC. Details on the GPON GEM are given in Section 3.5.2.
3.1.5 Dynamic Bandwidth Allocation, Ranging, and Discovery
Dynamic Bandwidth Allocation To avoid packet collision in the upstream direc-tion, a channel arbitration technique must be in place to avoid data collision and sharethe bandwidth resources fairly to the ONUs. Both EPON and GPON employ central-ized dynamic bandwidth allocation (DBA) methods. Centralized DBA can guaranteeservice to individual ONUs while ensuring high bandwidth efficiency. Alternatively,a distributed arbitration method either cannot support guaranteed service, or elsewould require an ONU to communicate bandwidth arbitration messages. This wouldtake a very long time because the fiber round-trip time (RTT) is approximately 200 µsfor a 20-km PON. Because EPON and GPON use different frame formats, the DBAalgorithm and operation look very different in each standard. However, in each casethe DBA would allocate upstream time slots to different ONUs such that no collisionis observed at the OLT. This would require accurate ranging and timing to measurethe RTT between the OLT and ONU such that the OLT can appropriately offset theupstream time slots granted to ONUs to avoid upstream packet collision.
Ranging and Discovery Ranging is carried out in the autodiscovery process. Ineither EPON or GPON, the autodiscovery process allows newly powered-up (cold)ONUs or ONUs that have lost synchronization (warm) to join the network. Besidesmaking logical registration of new ONUs (cold), the autodiscovery process addition-ally performs two functions. First, it allows an OLT to use the receiver burst to lockits clock to the receiver ONU clock and to adjust the gain level. Moreover, it performsa ranging process to measure the RTT between the OLT and the ONU.
3.1.6 Reliability and Security Concerns
Reliability Because standard TDM-PON employs a passive and point-to-multipointarchitecture, the inherent reliability and security of the network are weak. In PON sys-tems, service downtime could occur due to fiber cuts, splitter failures, and transceiverfailures. The location of the failure could also be categorized at the truck fiber, at thedistribution fiber, at the splitter, at the OLT, or at the ONU. Each type and locationof failure could cause service downtime for every user (a trunk group) of PON or asubset of users (a branch group). Service downtime could be estimated by multiplyingmean time to repair (MTTR) and the failures in time (FIT) factors. An unprotectedtree PON architecture, as illustrated in Figure 3.1, is expected annually to experienceapproximately 40 minutes of service downtime. There are two ways to reduce theservice downtime expected. The first approach enhances the optical diagnostic andmonitoring techniques to ensure that the cause of the failure is identified correctly andefficiently when a failure is first observed. The second approach enhances the PONarchitecture by introducing redundant fiber path and automatic protection switch-ing (APS) techniques. Although most of the TDM-PON deployment does adapt to

PON STANDARDS HISTORY AND DEPLOYMENT 115
an unprotected tree architecture, ITU-T G.983.1 does suggest four types of pro-tection switching architectures with different protection levels. Moreover, G.983.5and G.983.2 standards specify the reference model for resiliency and redundancy aswell as specifying the control and management interface to support the protectionfeatures. Details of these architectures and others are described later in the chapter.IEEE does not specify any particular protection switching or suggest any redundantswitching architecture. EPON vendors, however, could elect to provide their ownproprietary solutions, and Japanese operators are known for deploying ring-type fibertruck networks with APS capability.
Security In the downstream direction, TDM-PON signals are broadcast physicallyto all ONUs even if the logical traffic is only intended to be sent to one or a few ONUs.As a result, the downstream channel is highly susceptible to eavesdropping by mali-cious users. The biggest security weakness occurs during the ranging process, whenthe OLT broadcasts the identification serial number of the ONU ranged. Potentially,a malicious user could use this information to masquerade as a user victim or simplyas a spoof. To improve the security, G.983.1 initially specifies a churning procedureto scramble downstream data with a key established between an ONU and an OLT.Although churning does provide some enhanced level of security, encryption shouldbe employed in the application layer when security concerns become very important.ITU-T 984.3 further recommends the use of the 128-bit advanced encryption standard(AES) technique in GPON to enhance downstream security. The IEEE 802.ah EPONstandard again does not specify any downstream encryption standard, but many ASICvendors today do provide their own encryption mechanisms on commercial EPONchip sets.
3.2 PON STANDARDS HISTORY AND DEPLOYMENT
3.2.1 Brief Developmental History
The history of PON could be dated back to the early 1990s, when an FSAN con-sortium studied the feasibility of extending fiber optics access service to end users.Officially, APON was proposed in 1995 by FSAN to provide business customerswith multiservice broadband offerings. ATM (multiservice) and PON (inexpensive)presented the best mix for achieving that target. However, ATM does not live up tothe expectation of becoming the universal network protocol; instead, IP and Ethernetquickly evolved into that role. As a result, the ITU-T study group 15 (SG15) delib-erately chose the name broadband PON (BPON) to avoid a naming association withthe ATM technology. Nevertheless, BPON still relies on ATM networking by nature.BPON defines a line rate as a multiple of 8 kHz, the most basic frame repetition ratefor SONET/SDH. An OLT distributes the 8-kHz clock from the OLT to an ONU tosupport TDM services such as voice applications more easily. The ITU-T G.983.1BPON standard was published originally in 1998 and redefined in 2005 to add ahigher line-rate option.

116 PASSIVE OPTICAL NETWORKS: ARCHITECTURES AND PROTOCOLS
TABLE 3.1 Comparison of Standardized BPON, GPON, and EPON Parameters
Parameter BPON GPON EPON
Maximum/diff.reach
20 km/20 km 60 km/20–40 km 20 km/20 km
Maximum splitratio
128 128 —
Line rate 155.52–622.08/ 1244.16/2488.32 Mb/s 1250/1250 Mb/s(up/down) 155.52–1244.16 Mb/s
Coding NRZ + scrambling NRZ + scrambling 8b10bData rate Equals the line rate Equals the line rate 1000 Mb/sODN loss 20/25/30 dB 20/25/30 dB 20/24 dB
tolerance 28 dB (best practice) 28 dB (best practice) 29 dB (actualsystems)
US overheads Fixed 3 bytes Guard: 25.7 ns Guard: 2 µs154 ns (155.52 Mb/s) Preamble: 35.4 ns Laser on/off: 512 ns38.4 ns (622.08 Mb/s) Delimiter: 16.1 ns AGC/CDR: 400 ns
Due to its underlying ATM structure, BPON ONUs and OLTs are required to im-plement ATM switching capabilities. ITU-T G.983 actually specifies OLTs and ONUsas a whole to function as virtual path (VP) and virtual connection (VC) switches.Moreover, an additional translation between ATM and Ethernet needs to be imple-mented at the ONU user network interface (UNI) and OLT service network interface(SNI). These complications make BPON equipment unfavorably costly and hinderthe growth of BPON systems in a fast-evolving broadband market. Gigabit-capablePON (GPON) is developed to be the next-generation PON technology developed byITU-T after BPON. GPON is specified such that it can cope better with the changestoward Ethernet and IP communication technologies and meet the fast-growing band-width demands. The GPON standard was first rectified by the ITU-T G.984 standardin 2003.
At approximately the same time, the EPON standard was being developed inde-pendently by the IEEE standard body to extend basic Ethernet LAN MAC to supportnew fiber access physical layers. The work of EPON was begun in March 2001 bythe IEEE 802.3ah FEM study group and finished in June 2004.
Table 3.1 summarizes the operational parameters for BPON, GPON, and EPONstandards. As explained earlier, note that all B−, G−, and EPON have convergedtoward a class B+ type of optics. Class B+ (28 dB ODN loss tolerance) can usuallysupport up to 20 km of reach and a 64 split ratio. The upstream burst overhead forGPON is calculated based on a 1.244-Gb/s bit rate.
3.2.2 FTTx Deployments
Optical access networks come in many flavors: point-to-point (P2P), active, or passivepoint-to-multipoint (P2MP). The term FTTx is used broadly and refers to “fiber to thex,” where x could refer to one of several popular deployment scenarios. Figure 3.4

BROADBAND PON 117
End-userCabinet BuildingCO
BusinessFiber P2P
Layer 2LAN Switch
Residential
FTTC
FTTB
VDSL2
VDSL2LANPON
GE
OLTOLT
Wireless
SplitterFTTH
VDSL2OLT
: Fiber
: Copper/Cable
FIGURE 3.4 Architecture for an optical access network.
shows the most common reference FTTx deployment types. In the figure, fiber tothe cabinet (FTTC), fiber to the building (FTTB), and fiber to the home (FTTH)represent different levels of fiber penetration. FTTC and FTTB refer to deploymentwhere end users are connected through the hybrid use of coaxial cable (also calledHFC), twisted pair, or radio. The differences between FTTC and FTTB can be seenby the level of fiber penetration, where FTTC generally connects to a remote activecabinet and FTTB places ONU inside a multidwelling unit (MDU). For the FTTH typeof deployment, fiber to the business (FTTB) and fiber to the premises (FTTP) are usedto further indicate connection to either business or residential users. Sometimes, inperhaps a confusing manner, the term fiber to the curb (FTTC) is used interchangeablywith FTTB, and the term fiber to the node (FTTN) is also used interchangeably withFTTC.
Although each type of FTTx deployment could be understood with a differentlevel of fiber penetration, most users of the term FTTx do not necessarily describethe particular physical configuration. For example, FTTC and FTTN are often usedinterchangeably, and FTTP is sometimes viewed as a generic term for either FTTB orFTTH. Users employ the term FTTx to indicate expectations regarding service-levelagreements (SLAs), customer devices, service offerings, and investment paybackperiods.
3.3 BROADBAND PON
Since the initial rectification by ITU-T in 1998, broadband PON (BPON) has beendeployed in North America by the regional Bell operating companies for both FTTNand FTTP types of deployment. ITU-T 983.1 specifies the reference architecture,

118 PASSIVE OPTICAL NETWORKS: ARCHITECTURES AND PROTOCOLS
transceiver characteristics, transport fame structure, and ranging functions in BPON.In addition, the remaining 983.x standards make explicit recommendations in thefollowing areas:
� G.983.2: ONT management and control interface� G.983.3: third wavelength band for downstream video transmission� G.983.4: dynamic bandwidth assignment� G.983.5: enhanced survivability� G.983.6: control and management interface to support protection feature
Note that user terminals are called optical networking terminals (ONTs) insteadof ONUs in the ITU standards. In this chapter, the term ONT is used when referringto BPON or GPON, and the term ONU is used when referring to EPON systems. Inthe rest of this section we present details of the BPON standard to guide readers to anunderstanding of BPON operation as well as the implications during upgrade fromBPON to future PON systems.
3.3.1 BPON Architecture
Permissible Data Rates The original ITU-T 983.1 standard supported155.52 Mb/s (OC-3) and 622.08 Mb/s (OC-12) in either the downstream or up-stream direction. Later, a new 1244.16 Mb/s (OC-24) transmission rate is added inresponse to increasing bandwidth demand. BPON leaves the choice of a specificcombination of downstream and upstream rates to vendors, and Table 3.2 shows thepermissible downstream/upstream data-rate pairs for BPON.
Wavelength Allocation The original downstream and upstream wavelength planfor BPON was set at 1260 to 1360 nm (1310 ± 50 nm) and 1480 to 1580 nm(1530 ± 50 nm), respectively. One hundred nanometers of bandwidth window wasselected to give sufficient bandwidth after taking into account the fiber dispersiveeffect and the use of inexpensive FP laser components for the upstream band. Inresponse to the pressing demand for broadcast video and data, however, BPON addsan additional downstream band at the original G.983.1 DS band.
TABLE 3.2 Permissible BPON Downstream/Upstream Data-Rate Pairs
Downstream (Mb/s) Upstream (Mb/s)
155.52 155.52622.08 155.52622.08 622.08
1244.16 155.521244.16 622.08

BROADBAND PON 119
20nm100nm
digital services(1539-1565nm)
Wavelength (nm)
video distribution(1550-1560nm)
13101200 1490 16001400
ITU G.983 Wavelength Plan
-
Downstream
1310/1490 Diplexer
TxUpstream
-
Downstream
1310/1490/1550Triplexer
TxUpstream
VideoEnhancement
Rx
Block Diagram of ONT with Basic Bands Only Block Diagram of ONT with Enhancement Band
Rx
FIGURE 3.5 BPON wavelength plan and ONT options.
Figure 3.5 shows the wavelength allocation plan for BPON. This wavelength planis also used for GPON systems. Two enhancement band options provide the ability tocarry analog TV overlays (option 1: 1550 to 1560 nm) or additional digital servicessuch as SONET/SDH links for high-bandwidth TDM services (option 2: 1539 to1565 nm). Additional wavelength filters must be added to the ONT to support theenhancement band wavelengths. Additional filter losses and wavelength crosstalkmust also be considered in enhancement-capable systems. These enhancement filterloss and isolation requirements are specified as part of the G.983 standard.
Video Delivery Architectures Enhancement band option 1 was used in the BPONsystem to overlay analog video transmission. Figure 3.6 depicts a common analogvideo overlay architecture. In this architecture, video is overlaid in the 1550-nmenhancement band using a subcarrier multiplexing (SCM) technique. The source ofthe video is fed from a remote headend that receives, for example, the traditionalradio TV broadcast mentioned in Section 1.4.1. The RF-modulated signals are thensubcarrier-multiplexed onto a 1550-nm laser source at the video server. The benefitof this architecture is that users are not required to use anything other than thetraditional analog television. The number of broadcast channels that can be supportedis limited, however. More channels can still be supported under this architecture, butit would require narrowcast transmission architecture (i.e., the ability to switch thereceiving channels based on user selection). The dotted component in Figure 3.6further illustrates narrowcast support in analog video overlay architecture. In thisarchitecture, the user selects the channel using a set-top box with analog tuningability, such as a cable set-top box, to communicate with the headend via Internet

120 PASSIVE OPTICAL NETWORKS: ARCHITECTURES AND PROTOCOLS
Central OfficeRemote Headend ONT
RF Video Server1310/1490nm
DataPassiveSplitter
OLT
EDFAEDFARF Video
Signal1550nm
InteractiveiS
ChannelSelection1550nm
Voice
2.1.
WDMFilter
Crossconnect
OLT
OLT
OLT
SDHCross
connect
Services
Metro POP…
Voice
ONT Triplexer
Directly to TV1.To traditional 2.cable set top box
RF: Radio Frequency
POP: Point of Presence
EDFA: Erbium Doped Fiber Amplifier
FIGURE 3.6 BPON analog video overlay architecture.
group management protocol (IGMP). The headend video server then determines theproper program and thus the RF spectrum to transmit over PON.
With the advent of high-definition (HD) TV, and as demands for in-home distribu-tion of multimedia contents continue to rise, the analog video transmission model canno longer sufficiently support the bandwidth scalability and user responsiveness un-der the new demands. On the other hand, in-band IP-based video and the multimediadelivery model address these issues by supporting on-demand content delivery andenable more interactive capability between a home and a video service provider. AnIP-based solution also has the benefit of converging video with voice and data trans-mission. Figure 3.7 shows the in-band IP video distribution architecture, in whichthe ONT no longer requires a triplex filter. For other than technical reasons, a userneeds to obtain a new set-top box from the video service provider (VSP) to supportthe video distribution services via IGMP and/or the video on demand (VOD) proto-col. To support fast channel selection, the VSP builds a hierarchy of VOD serversat the headend and access central office to cache popular content nearby the users.The in-band IP-based model is gaining momentum in recent deployments as access
Central OfficeRemote Headend
PassiveSplitter
OLTEncoder
VODVOD1310/1490nm
ONTDataVoice
VOD: Video on Demand Server
Crossconnect
OLT
OLT
OLT
SDHCross
connect
Transcoder
Metro POP…
Voice
To IP SetTop Box
FIGURE 3.7 BPON in-band IP video delivery architecture.

BROADBAND PON 121
TABLE 3.3 Comparison of Analog, IP, and Hybrid Video Delivery Architectures
Pros Cons
Analog Mature technology Analog video qualityNo new set-top box required Requires ONT triplexerScalable to a large take rate (broadcast) Not a converged network
IP Supports HDTV and better video quality Requires IP set-top boxMore interactive Data bandwidth is sharedNo ONT tripler required Channel selection requires IGMPA converged network Does not scale well
Hybrid Supports HDTV, interactive, and more Not a converged networkLarge combined bandwidth Requires triplexer, set-top box,Scales well and IGMP
operators aggressively migrate into providing HDTV to compensate for continuingrevenue erosion in traditional voice and data services.
Where analog video overlay infrastructure is already in place, there is an ad-ditional benefit to employing a hybrid IP/analog video delivery architecture. Thehybrid infrastructure allows the operator to support a combined large bandwidth inthe PON data and RF overlay spectrum. Since most subscribers already have anRF-based solution, IP service could be used additionally to support a narrowcasttype of service. Table 3.3 summarizes the pros and cons of employing each of thethree most common video delivery architectures. In short, IP service is expected toprovide better-quality pictures and interactive features, but at a greater price. In re-ality, the choice for the specific deployment depends heavily on the availability oflegacy video transmission infrastructure and the market in the particular community(i.e., the take rate for IP service expected if they were to be deployed).
Interoperability BPON stresses vendor interoperability in system implementa-tions. It is important because interoperability allows operators to exercise choicesin selecting either OLT or ONU vendors. In particular, an OLT card is expected to beable to support ONTs implemented from other vendors, and vice versa. In addition,the OLTs should interact with operators’ heterogeneous mix of service network in-terfaces. As a result of the interoperability requirement, however, the cost of BPONequipment suffers because it has to implement additional SNI ports that it may notbe used in certain deployment scenarios.
3.3.2 BPON Protocol and Service
BPON transport and signaling protocol is specified based on ATM since telecommu-nication network operators had had extensive ATM switching infrastructure at thetime that ITU G.983 recommendations were being developed. Besides being a maturetechnology, ATM also supports scalable traffic management and robust quality-of-service (QoS) controls. As a result, BPON protocol is very closely related to ATMnetworking.

122 PASSIVE OPTICAL NETWORKS: ARCHITECTURES AND PROTOCOLS
3.3.2.1 ATM Cell and Services ATM is a circuit-switching technique basedon fixed-size 53-byte (53B) packets called cells. The impetus for a short fixed-sizecell is the ability to switch or multiplex quickly between traffic flows. This is animportant feature during the development of ATM because it is designed primarilyto support voice traffic. Small data cells enable an ATM network to reduce jitterby multiplexing data streams. In other words, urgent voice cells can be multiplexedwithin 53B intervals, avoiding the large jitter that could otherwise be incurred bylarge data cells.
An ATM cell consists of a 48B payload and a 5B header. The 5B header has twotypes of format: a user–network interface (UNI) and a network–network interface(NNI). An ATM header supports a virtual path identifier (VPI), virtual circuit identifier(VCI), payload-type indicator (PTI), cell loss priority (CLP), and header error check(HEC) (Figure 3.8). The UNI format also supports a 4-bit (4b) generic flow control(GFC) field. In BPON, the GFC field is not used and is always set to zero when aUNI format is used.
The details of the fields are described below.
� VPI. A virtual path is a logical bandwidth pipe that can consist of multiplevirtual connections. Depending on whether the ATM cell is sent via a UNI orNNI formatted header, the VPI header supports either 8b (256) or 12b (4096)virtual path connections. The G.983 recommendation limits the number ofvirtual paths to less than 4096.
� VCI. Virtual connection is the lowest level of connection defined in an ATMnetwork. VCI is 16b long and supports up to 65,536 different virtual channelsfor each virtual path. The combination of VPI and VCI identifies a uniquevirtual circuit for the ATM cell in a ATM port, or in each PON. A virtual circuitis allocated and defined through specified QoS characteristics.
� PTI. PTI is 3b long and the first bit indicates whether the cell is user data (0) orOAM data (1). The second bit indicates if the cell has experienced congestion(yes = 1; no = 0) during its transmission. If the current switch experiences
GFC: Generic Flow Control
VPI: Virtual Path Identifier
VCI: Virtual Circuit IdentifierGeneric ATM Cell Format
PTI: Payload Type Indicator
CLP: Cell Loss Priority
HEC: Header Error CheckPayloadHeader
Bytes
Fields
VPI(8b) VCI(16b) HEC(8b)User-NetworkInterface (UNI)
VPI(12b) VCI(16b) HEC(8b)
GFC(4b) PTI(3b) CLP(1b)
Network-NetworkInterface (NNI)
5 48
FIGURE 3.8 ATM cell format.

BROADBAND PON 123
congestion switching the cell, the bit is turned to 1. If the cell is OAM data, thethird bit is used for OAM functions. Otherwise, the third bit is used to indicateif the cell is the last in a series of ATM adaptation layer 5 (AAL5) cells. ATMdefines several AAL layers to support different levels of QoS. AAL5 is usedfor packet data communication that could be segmented at the transmitting endand reassembled at the receiving end in a connectionless service.
� CLP. CLP is a 1b field to indicate the priority of the cell. CLP = 0 indicates ahigh priority and the interim switch must forward the cell with its every effort,even with congestion. CLP = 1 indicates that the interim switch could dropconsiderably in congestion situations. An example of a cell labeled as CLP = 1is when the cells represent additional traffic above the committed informationrate (CIR) in a negotiated connection.
� HEC. HEC is a 8b checksum to protect the ATM header.
An important characteristic of ATM is its ability to support different levels of QoS.In ATM networks, five classes of QoS are specified, as summarized in Table 3.4. EachQoS service class is further characterized by the parameters described below.
According to the service-level agreement (SLA), the following user-rate parame-ters are defined in terms of cells per second:
� Peak cell rate (PCR): maximum rate at which a user can be allowed to transmit� Sustainable cell rate (SCR): average cell rate measured over a period� Minimum cell rate (MCR): guaranteed transmission rate of a user by a service
provider according to the SLA
In addition to SLA-defined rate parameters, users also negotiate network-relatedtraffic attributes according to different QoS service classes. These attributes include:
� Cell transfer delay (CTD): end-to-end cell delays� Cell delay variation (CDV): measured difference between minimum and max-
imum CTD
TABLE 3.4 ATM QoS Service Classes
Service Class Description AAL Level Example
Constant bit rate Guaranteed PCR, supports 1 Voice and VODreal-time applications
Variable bit rate Specified PCR and SCR, 2 Video, packetizedreal time (VBR-rt) guaranteed CDV voiceNon-real time Similar to VBR-rt — Bank transactions,
without guaranteed CDV reservation systemsAvailable bit rate Guaranteed MCR, — Credit card validation,
PCR limited e-mail, fax, etc.Unspecified bit rate PCR limited, analogous 5 General TCP/IP
to best-effort traffic applications

124 PASSIVE OPTICAL NETWORKS: ARCHITECTURES AND PROTOCOLS
FunctionsBPON Layers
Path Layer
Adaptation
ATM cell/ BPON frame conversionCell transmission
Network/user
Transmission Convergence(TC) Layer PON
Sub-layer frame conversion
RangingCell slot allocationBandwidth allocation
Physical Medium
Transmission Sub-layer
O/E/O conversion
Privacy and securityFrame alignmentBurst synchronizationBit/byte synchronization
Dependent (PMD) Layer Fiber connection
FIGURE 3.9 BPON protocol layer structure.
3.3.2.2 BPON Protocol Layers and Functional Blocks Figure 3.9 showsthe BPON protocol layer structure as defined in the G.983.1 recommendations. Theprotocol layer structure consists of a physical media dependent layer (PMD), a pathlayer, and a transmission convergence layer (TC). The PMD layer defines the bit rate,line code (NRZ), operating wavelengths, and transceiver requirements.
In BPON, the path layer corresponds to the ATM virtual path (VP) layer asdefined by ITU-T recommendation I-732. The OLT and ONT in BPON as a wholecan be viewed as a VP switch. G.983.1-specified functions of the OLT and ONT arepresented to illustrate the concept. Figure 3.10 shows the OLT and ONT functionalblocks.
Details of the function for these OLT and ONT functional blocks are providedbelow.
OLT Functional Blocks
� Service port. OLT service ports interface with an SNI to connect to the corenetwork. The service port handles the insertion of ATM cells into the up-stream SONET/SDH payloads and retrieval of ATM cells from the downstreampayloads. An additional feature such as protection switching could also beimplemented at the service port level.
� Transmission multiplexer (MUX). An OLT MUX provides VP connectionsbetween the service port and the ODN interface. Different VPs are assignedto different services at each PON. Different information types, such as data,signaling, and OAM flows, are classified further by VCs of the VP.
� ODN interface. The line terminal handles the optoelectronic conversion process.Moreover, the ODN handles the insertion of ATM cells into the downstreamtransmission frames and extraction of ATM cells from the upstream frames.

BROADBAND PON 125
Transmission ATM
ODNInterface-1
Core shellService shell
Service port function
mux/demuxCrossconnect
…ODN
Interface-N
Service port
…
shell
…CoreNetwork
Splitterfunction
OAM PowerCommon
Service shell
User port functionTransmission
Core shell
Customer & service
ODN
User port
…mux/demuxmux/demux
Common shell
…
CustomerInterfaceFunction
functionOAMPower
FIGURE 3.10 BPON OLT and ONT functional blocks.
ONT Functional Blocks
� User port. ONT user ports interface over UNI to connect to customer terminals.� Transmission multiplexer (MUX). ONT MUX multiplexes service interfaces to
the ODN interface. Only valid ATM cells would pass through the ONT MUX.� ODN interface. This is similar to the ODN interface at OLT. The ODN interface
at ONT handles the optoelectronic conversion process and the conversion ofATM cells to and from BPON transmission frames. It is worthwhile to note thatthe interface must acquire synchronization on the downstream frame bit beforetransmitting upstream frames.
The Recommendation G.983 series does not specify the functions of VC. However,its use is left open to vendor implementations. In addition to providing VP switchingand optoelectronic conversion, the OLT and ONT combine to provide OAM func-tionalities. Details of the OAM, as well as other topics regarding the TC layer, aredescribed next.
3.3.3 BPON Transmission Convergence Layer
In BPON, information is transmitted in the form of either an ATM cell or a physical-layer operation, administration, and maintenance (PLOAM) cell. Both cells have afixed 53-byte (53B) format. ATM cells are used to carry data, and PLOAM cells are

126 PASSIVE OPTICAL NETWORKS: ARCHITECTURES AND PROTOCOLS
27B(Grants31 +
Downstream PLOAM Cell
11
Header
Bytes 5 CRC 4B)
Fields
IDENT
Grants(1-7) Grants(22-27)…
1 2
CRC
1 110
Message_fields(1-10)
CRCCRC
SYNCH Message_IDMessage_PON_ID BIP
5Bytes 1 1 16 1171 10 1
HeaderFields
IDENT
RXCF(1-16)Message_fields(1-10)
BIPMessage_IDMessage_PON_ID
CRC
LCF(1-17)
Upstream PLOAM Cell
IDENT: Identification
SYNCH: Synchronization Bytes
BIP: Bit Interleaved Parity
LCF: Laser Control Field
RXCF: Receiver Control FieldCRC: Cyclic Redundant Check
FIGURE 3.11 BPON PLOAM cell format.
used to carry physical-layer management information. ATM and PLOAM cells aretransmitted in a fixed frame structure.
3.3.3.1 PLOAM Cell Format Since the ATM cell format has been introduced,the PLOAM cell format is described here before introducing BPON transmissionframe structures. Figure 3.11 shows the downstream and upstream PLOAM cellformats.
The PLOAM cell uses the same 5B header as the ATM cell. The rest of the PLOAMfields are described below.
Downstream PLOAM
� Identification (IDENT). The last bit of the IDENT byte is set to “1” if it is thefirst PLOAM cell of a downstream frame. The PLOAM identification field isused further by ONT to synchronize with the downstream frame by correctlydetecting the PLOAM header and receiving the “1” IDENT frame bit.
� Synchronization bytes (SYNCH). This 2B SYNCH field is used to transport a1-kHz reference clock signal from the OLT to the ONT. At the OLT, a counterincrements every 51.4 ns (tinterval = 8 bits/155.52 Mb/s) or every 1B whenoperating at a 155.52-Mb/s bit rate. The OLT writes the least significant 15b ofits counter in the least significant 15b of the SYNCH field. The most significant1 bit of the SYNCH field is filled with the most significant bit of the OLT counter.ONT synchronizes its local counter upon the reception of the SYNCH field.The counter is reset every 1 ms at the OLT to convey the 1-kHz reference signal.

BROADBAND PON 127
� Grants. Each PLOAM cell has 27 grants. Each 1B grant could contain eithera data grant, a PLOAM grant, a divided slot grant, a ranging grant (FD16),an unassigned grant (FE16), or an idle grant (FF16). Each grant correspondsto an upstream time slot in the upstream frame. The value of the data grantcorresponds to 1B ONT ID (0–63) for indicating an upstream time slot grant.The ONT can response a data grant with either an upstream data cell or an idlecell. On the other hand, an ONT always responds to a PLOAM grant with anupstream PLOAM cell. A divided slot grant is used to assign a minislot in theDBA process, which would be described in later sections. Unassigned grantsare used to indicate an unused upstream slot. When an idle grant is transmitted,the ONT simply ignores the idle grant. An idle grant is used when the numberof upstream slots available is less than the number of grants available in thePLOAM cells, which is the case when the downstream operating bit rate isabove 155.52 Mb/s. The type of grant is indicated by the message field.
� Downstream PLOAM messages. A downstream message is defined byRecommendation G.983 to convey information such as ranging, churningkey assignment, VP or VC configuration, and so on. In the PLOAM cell, themessage is further divided into three fields. The PON ID is a unique ONUnumber assigned during the ranging process. This PON ID could be from 0to 63. The format for the message type and message contents is available inSection 8.3.8 of Recommendation G.983 and is outside the scope of this book.
� Cyclic redundancy check (CRC). The CRC fields protect groups of seven grantsusing generating polynomials g(x) = x8 + x2 + x + 1. It is able to detect up to3 bits of error. Error correction is not performed and the entire block of grantsis ignored when an error is detected. For the last group of six grants (22–27),a dummy seventh grant with value 0016 is assumed. For the message group,the CRC field is the reminder of the division between g(x) and the polynomialcreated with the content of the 12B message field.
� Bit interleaved parity (BIP). The BIP field is used to monitor the bit error rate(BER) in the downstream link. The BIP is a good estimate of the BER whenthe BER is smaller than 10−4.
Upstream PLOAM
� IDENT. The IDENT field is not used in upstream PLOAM cells.� Laser control field (LCF) and receiver control field (RXCF). In concept, LCF and
RXCF are used by the ONT to maintain the nominal optical output power andby the OLT to recover the appropriate gain threshold level. The implementationof LCF is vendor dependent and depends on the type of laser driver employedby the ONT.
� The rest of the upstream fields (i.e., message fields, CRC, and BIP) have prop-erties similar to those of the corresponding downstream PLOAM fields.
3.3.3.2 Transmission Frames The BPON downstream bit rate operates at155.52, 622.08, or 1244.16 Mb/s. The downstream transmission frame has a fixed

128 PASSIVE OPTICAL NETWORKS: ARCHITECTURES AND PROTOCOLS
56 Cells (2 PLOAM + 54 ATM) = 152.67µs
BPON Downstream Transmission Frame
PLOAMCell(1)
ATM Cell(2)
… ATM Cell(27)
PLOAMCell(2)
ATM Cell(54)
ATM Cell(28)
…
…ATM or PLOAM(1)
ATM or PLOAM(2)
ATM or PLOAM(53)
54 Cells (Each with 3B Overhead) = 152.67µs
Guard Time (1B)
Preamble(1B)
Delimiter(1B)
BPON Upstream Transmission Frame (Rec. G.983.1)
FIGURE 3.12 BPON transmission frame (at 155.52 Mb/s).
size of 152.67 µs. Figure 3.12 illustrates a downstream transmission frame at a rateof 155.52 Mb/s. The frame contains two PLOAM cells and 54 ATM cells, wherethe PLOAM cell is inserted in between every 27 ATM cells. The downstream framesize is multiplied by 4 to 224 cells for a 622.08-Mb/s bit rate and multiplied by8 to 448 cells for a 1244.16-Mb/s bit rate. Downstream frames are broadcast in aTDM fashion, and each ONT will only pass on the ATM data that are destined to itssubscriber based on the VPI/VCI combination.
The upstream frame contains 53 time slots, each of which is 56B long. Eachupstream time slot contains a 3B overhead in addition to the 53B ATM/PLOAM cell.The content of the overhead field is programmed by the OLT and is defined by theUpstream overhead message in the downstream PLOAM cells. The purpose of these3B overheads is noted below.
� Guard time. The guard time is reserved for laser on/off time. It provides enoughdistance between two consecutive cells to avoid a collision. The minimum guardtime length is 4b, which corresponds to 25.6 ns for a 155.52-Mb/s bit rate. Theguard time could be expanded to 1B long to 12.8 ns for 622.08-Mb/s bit rate.
� Preamble. The preamble defines the clock and data recovery time in BPON.Bit-level synchronization is achieved here. The preamble is only 1B long andthe BPON has a stringent clock and data recovery time requirement of 51.2 nsfor 155.52 Mb/s and 12.8 ns for a 622.08-Mb/s bit rate. In BPON, the guardtime plus the preamble is equivalent to the inter-ONU guard time in Figure 3.3.
� Delimiter. The delimiter is a unique pattern used to indicate the start of an ATMor PLOAM cell. Byte-level synchronization is achieved using the delimiterfield.

BROADBAND PON 129
An ONT sends an upstream PLOAM when it receives the PLOAM grant fromOLT. The PLOAM cell rate is defined by OLT, and for each ONT the minimumPLOAM cell rate is at least one PLOAM cell for every 100 ms.
3.3.3.3 Upstream TDMA BPON upstream employs time-division multiple ac-cess (TDMA), where each ONT takes a turn in transmitting an upstream time slot.The assignment of ONT transmission to a time slot is allocated through the corre-sponding data grant in the downstream PLOAM cell. The PLOAM cell is availableto all ONTs. An ONT always checks the PON ID in the data grant and comparesit to its own assigned serial number. If there is a match, the ONT can then send itsinformation or send an idle data cell when it does not have information to send.
In the case of a symmetrical 155.52-Mb/s transmission bit rate, each upstreamframe contains 53 time slots and the downstream frame needs to provide the corre-sponding grants, which are mapped to the two PLOAM cells. As a result, the last grantof the second PLOAM cell is an idle grant (FF16). For a symmetrical 622.08-Mb/stransmission bit rate, the last grant of every even-numbered PLOAM cell is an idlegrant. For an asymmetrical transmission bit rate (e.g., 622.08-Mb/s downstream and155.52-Mb/s upstream), PLOAM cells 3 through 8 are filled with idle grants.
In the early BPON implementations, the bandwidth was guaranteed at a fixedvalue to the specific subscriber. The service sold to the subscriber is fixed and an earlyscheme makes fixed bandwidth allocations to the subscribers. However, this methodis not efficient, as a large amount of bandwidth is either under- or overutilized, due tothe bursty nature of Internet traffic. As a result, a more efficient method of allocatingbandwidth to each user dynamically is amended by Recommended G.983.4.
3.3.3.4 Ranging Since the ONT sends information to the OLT using time-division multiple access (TDMA), each ONT must be precisely synchronized withall other ONTs. To achieve synchronization across all ONTs, the OLT first uses theranging process to determine the distance of each ONT from the OLT. In BPON,the maximum logical differential distance is 20 km. This corresponds to 200 µs ofround-trip delay (RTT) or 69 cells (56B) + 192 bits. After ONT distances and theirrelative single trip-delay differences are known, the OLT uses the grant assignmentto ensure that upstream slots from any two ONTs would not collide.
In addition to measuring the logical distance between the ONT and the OLT, theranging procedure is also used to connect to new ONT (cold) or in-service ONT(warm) that has detected lost byte-level synchronization. In the case of cold ONT, theOLT assigns the PON ID after the ranging process. Figure 3.13 illustrates the BPONranging procedure. In sequence, the OLT first sends an unassigned grant (FE16) toopen the ranging window. Then the OLT sends ranging grants in successive down-stream PLOAM cells (downstream data and upstream data grants are queued duringthe ranging procedure). The ONT immediately responses to the ranging grant with theranging cell. Upon receiving the ranging cell, the OLT measures the arrival phase ofthe arriving cell and notifies the ONT of the equalization delay. The ONT then adjuststhe transmission phase to the notified value to achieve bit-level synchronization.

130 PASSIVE OPTICAL NETWORKS: ARCHITECTURES AND PROTOCOLS
RTT + cells
Min Tresponse Ranging Window (minimum 73 cells)
OLT
Ranging Grant(s) (PLOAM) Ranging cell Ranging cell
Max Max Tresponse N
ONT-1Tresponse{ONT 1}
ONT-n
(maximum Max T responsedistance)
FIGURE 3.13 BPON ranging procedure.
BPON ONTs are required to process PLOAM grant information before PLOAMmessage fields. The standard further mandates a response time between 3136b and4032b (at 155.52 Mb/s), which translates to seven to nine cells. The response time,Tresponse is specified to allow sufficient signal processing time at the ONT. As a result,the ranging window is considered open after at least minimum Tresponse since thefirst ranging grant is sent. In addition, the ranging window is reserved for at least73 cells (minimum Twindow) to receive at least one ONT ranging cell. This is becauseminimum Tresponse + minimum Twindow − maximum TRTT − maximum Tresponse =2Tcell − T192bits > 1Tcell. The ranging window could be expanded if the OLT is ex-pecting more than one ranging cell.
During the ranging process, multiple ONTs could respond to the broadcast rangingrequest at the same time and cause a collision. To resolve the contention, a binarytree mechanism is used to range the ONTs individually. The binary tree mechanismsends a Serial number mask message before a ranging grant to all ONTs in thestandby state. The Serial number mask message is increased with one bit at a timeuntil only one ONT responds with the ranging cell. In a binary tree mechanism,ONT responses to the ranging grant only when its unique serial number matchesthe Serial number mask message. After the contention is resolved, the remainingranging would be performed using normal ranging grants.
3.3.4 BPON Dynamic Bandwidth Allocation
Dynamic bandwidth allocation (DBA) is a methodology to allow OLT to reallocatebandwidth quickly across the entire PON according to current traffic conditions. Inthe original Recommendation G.983.1, DBA is not specified. To improve upstreambandwidth use, Recommendation G.983.4 adds DBA to BPON. G.983.4 also intro-duces traffic container (T-CONT) buffers, and all bandwidth grants are allocated inthe T-CONT level.

BROADBAND PON 131
ONU-1 T-CONT
ONU-2DBAScheduler
OLTT-CONT
ONU-N T-CONT
T-CONT Buffer
TCAdapter
ONT
VPVCVC
UNI
Class BufferPriority Control
T-CONTVP
ONT with T-CONT BufferT-CONT Layer Structure
FIGURE 3.14 BPON T-CONT architecture.
3.3.4.1 T-CONT and Divided Slot In a BPON DBA process, grant allocationis associated directly with T-CONT-type classification. This classification enablesPON to better handle traffic flows with similar characteristics. An ONT can havemultiple T-CONTs, and the T-CONTs in an ONT operate independent of one another.Figure 3.14 illustrates the BPON T-CONT architecture.
A T-CONT can multiplex multiple streams of traffic, and each ONT could havemultiple T-CONTs. Recommendation G.983.4 further classifies T-CONT into fivedifferent types. OLTs could create or delete T-CONTs for an ONT depending onthe current traffic and operational parameters specified in the SLA. Examples of theparameters include service priority and QoS. The priority of the data grants includefixed bandwidth, assured bandwidth, nonassured bandwidth, and best-effort band-width. Both fixed and assured bandwidth are guaranteed, but bandwidth is reservedonly during actual communications. Nonassured and best-effort bandwidth are as-signed dynamically under control of the DBA algorithm. Each one of the T-CONTtype is specified to support one or more of these priority classes. Table 3.5 summarizesthe classification of the various T-CONT types.
3.3.4.2 DBA Protocol To dynamically determine the number of data grantsassigned to a T-CONT, the OLT needs to know the traffic status of the T-CONT.Two possible schemes are specified by Recommendation G.983.4. In an ONT statusreporting (SR) scheme, the ONT reports T-CONT buffer depths to the OLT. In an
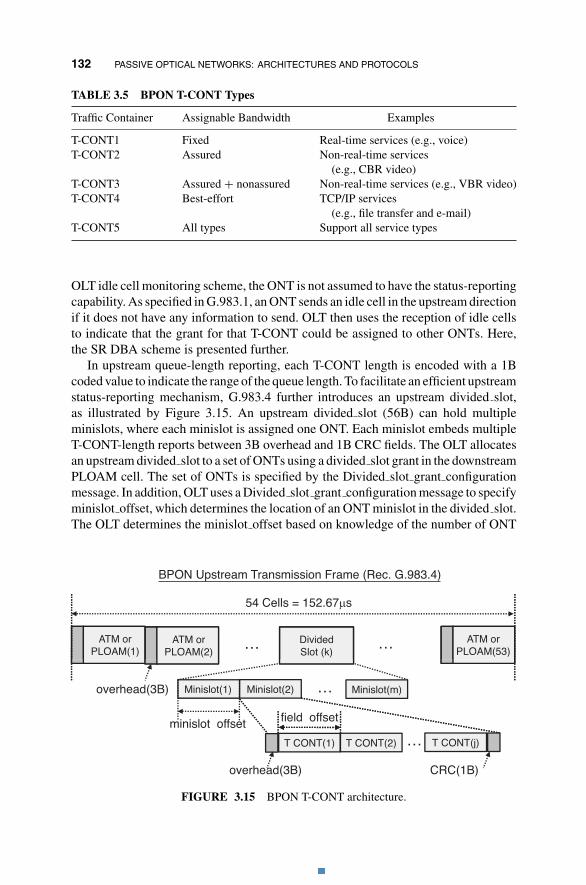
132 PASSIVE OPTICAL NETWORKS: ARCHITECTURES AND PROTOCOLS
TABLE 3.5 BPON T-CONT Types
Traffic Container Assignable Bandwidth Examples
T-CONT1 Fixed Real-time services (e.g., voice)T-CONT2 Assured Non-real-time services
(e.g., CBR video)T-CONT3 Assured + nonassured Non-real-time services (e.g., VBR video)T-CONT4 Best-effort TCP/IP services
(e.g., file transfer and e-mail)T-CONT5 All types Support all service types
OLT idle cell monitoring scheme, the ONT is not assumed to have the status-reportingcapability. As specified in G.983.1, an ONT sends an idle cell in the upstream directionif it does not have any information to send. OLT then uses the reception of idle cellsto indicate that the grant for that T-CONT could be assigned to other ONTs. Here,the SR DBA scheme is presented further.
In upstream queue-length reporting, each T-CONT length is encoded with a 1Bcoded value to indicate the range of the queue length. To facilitate an efficient upstreamstatus-reporting mechanism, G.983.4 further introduces an upstream divided slot,as illustrated by Figure 3.15. An upstream divided slot (56B) can hold multipleminislots, where each minislot is assigned one ONT. Each minislot embeds multipleT-CONT-length reports between 3B overhead and 1B CRC fields. The OLT allocatesan upstream divided slot to a set of ONTs using a divided slot grant in the downstreamPLOAM cell. The set of ONTs is specified by the Divided slot grant configurationmessage. In addition, OLT uses a Divided slot grant configuration message to specifyminislot offset, which determines the location of an ONT minislot in the divided slot.The OLT determines the minislot offset based on knowledge of the number of ONT
BPON Upstream Transmission Frame (Rec. G.983.4)
…ATM or PLOAM(1)
ATM or PLOAM(2)
ATM or PLOAM(53)
54 Cells = 152.67µs
DividedSlot (k)
…
Minislot(2)Minislot(1) Minislot(m)overhead(3B) …
field offsetminislot offset
T CONT(1) T CONT(2) … T CONT(j)
CRC(1B)overhead(3B)
FIGURE 3.15 BPON T-CONT architecture.
GIGABIT-CAPABLE PON 133
T-CONTs, which is also created or deleted using a Divided slot grant configurationmessage. A field offset value is further specified if the ONT has more than oneT-CONT.
3.3.5 Other ITU-T G.983.x Recommendations
Since the initial ratification of G.983.1 in 1998, the ITU-T body has developed a seriesof G.983 recommendations to enhance the original system. In this chapter, G.983.1,983.3, and 983.4 standards are covered. In Section 3.3.1-3 we cover important aspectsof G.983.1 concerning the PMD and TC layer of BPON. In Section 3.3.1 we presentan enhanced wavelength range and associated filter requirement to support additionalservice signals, such as video, as specified by G.983.3. In Section 3.3.4 we describeG.983.4 protocol and requirements to incorporate DBA into BPON systems.
Recommendation G.983.2 Management and Control Interface Recommen-dation G.983.2 specifies ONT management and control interface specification(OMIC) for BPON. The G.982.2 standard specifies the protocol-independent man-agement information base (MIB). The MIB describes the information exchange pro-cedure between the OLT and the ONT. The OLT manages the ONT in a master–slaveinterface using an ATM connection called an ONT management and control chan-nel (OMCC). An OMCC connection is established by setting up a unique VPI/VCIcombination for each ONT using PLOAM messages. G.983.2 also specifies variousOAM functions and parameters in the standard.
Protection Switching Recommendation G.983.5 specifies functions that extendthe original G.983.1 standard to enable enhanced survivability and network protec-tion mechanisms. In particular, the standard “describes BPON survivable architecture,protection performance criteria, protection switching, and protection switching pro-tocols.” It is noteworthy to point out that incorporation of a G.983.4 DBA functionaffects the protection switching protocol. As a result, part of the G.983.4 standardspecifies an updated protection switching protocol to support DBA. More details onprotection switching are presented separately in a later section.
3.4 GIGABIT-CAPABLE PON
ITU-T G.983 standards were developed based on ATM technology with the expec-tation that ATM would become the universal network protocol. Instead, however,Ethernet evolved successfully into that role. To support non-ATM-based SNI andUNI, BPON needs to implement expensive translation functions between ATM andthe Ethernet interface. To adapt to the change in the telecommunication world, ITU-Tcreated a G.984 series standard for gigabit-capable PON (GPON). GPON is not onlyan enhancement of BPON, but is specified with higher supported bit rates, bettersecurity with advanced encryption standard (AES), and other features. GPON further

134 PASSIVE OPTICAL NETWORKS: ARCHITECTURES AND PROTOCOLS
TABLE 3.6 GPON and BPON Architecture Comparison
Characteristic GPON BPON
DS bit rates (Mb/s) 155.52, 622.08, 1244.16, 2488.32 155.52, 622.08, 1244.16US bit rates (Mb/s) 155.52, 622.08, 1244.16, 2488.32 155.52, 622.08Transmission frames GTC frame with GEM Fixed frame with ATM cellsDownstream security AES Key churning AES (later)
services Full services (i.e., additionally Telephony, SONET/SDH,include 10/100BASE-T Ethernet) TDM, ATM
supports Ethernet protocol and increases the bandwidth efficiency significantly byincorporating the GPON encapsulation method (GEM).
GPON Architecture GPON inherits its main characteristics from BPON in thePMD and TC layer. However, drastic changes are made in terms of a faster bitrate, use of GEM, and enhanced security. Table 3.6 summarizes the key differencesbetween GPON and BPON architecture.
In GPON, the aggregate bit rate in either direction is improved to support up to2.488 Gb/s in addition to the original 155.52 Mb/s, 622.08 Mb/s, and 1.244 Gb/s(downstream only) bit rate. Most of the GPON deployment selects the 2.488-Gb/sdownstream and 1.244-Gb/s upstream bit-rate pair to support high-bit-rate accessservices and avoid OLT burst-mode receiver implementation issues. A GPON trans-mission convergence (GTC) layer, which specifies the GTC frame and GEM method,is described in full detail next.
3.4.1 GPON Physical Medium–Dependent Layer
The GPON PMD layer has most of the same requirements as that in a BPON. Forexample, both PON standards specify the use of class A, B, and C optics with the samelogical reach and split ratio. Besides improving bit rates, a few notable additions areadded to the G.984.2 GPON PMD standard to enhance GPON performance. Thesekey additions are described in this subsection.
3.4.1.1 Upstream Burst Overhead and Timing As explained before, suc-cessive upstream bursts must reserve enough guard time to allow laser on/off time,timing drift tolerance, level recovery, clock recovery, and the start of the burst de-limitation. Whereas the G.983.1 BPON standard specifies a fixed 3B overhead tosupport these functions, the G.984.2 GPON standard specifies variable-length up-stream physical layer overhead (PLOu) and allows more time to adapt to upstreamburst operations.
In summary, G.984.2 specifies 4B, 8B, 12B, 24B (PLOu) based on 155.52-,622.08-, 1244.16-, and 2488.32-Mb/s upstream bit rates, respectively. Each (PLOu)field could be further divided into a subfield for guard time, preamble, and delim-iter. The length and division of (PLOu) is recommended based on a combination of

GIGABIT-CAPABLE PON 135
physical and implementation constraints. The guard time (Tg) is set to be larger thanthe expected laser on/off time (Ton and Toff), and the total timing uncertainty arisesin propagation time due to fiber and component variations that could be caused bytemperature drifts and other environmental effects. The delimiter time (Td ) is selectedto allow the OLT to perform byte-level synchronization with a very low probabilityof severed error burst (Pseb) under severed upstream BER conditions.
The delimiter is constructed such that its shifted version over the preamble bit hasa large Hamming distance d. It can be verified numerically that the d = int(N/2) − 1for a delimiter of size between 8 and 20 bits (with a repeating “1010” pattern).The relationship between the number of bits in the delimiter N and the number ofbits of error the receiver can tolerate, E , or the error-correcting capability, couldthen be approximated as E = int(N/4) − 1. Given a certain BER rate, Pseb could becomputed by
Pseb = N
E + 1× BERE+1 = N
int(N/4)× BERint(N/4) (3.2)
It can then be verified that N has to be at least larger than 16 bits to suppress Pseb tobelow 1.8 × 10⁻¹³ given BER at the 1 × 10⁻⁴ level.
After considering the minimum required (Tg) and (Td ), the rest of the time in(PLOu) is dedicated to the preamble time (Tp) to complete burst-mode clock and datarecovery (CDR) operation. Although GPON allows a longer Tp than that allowed byBPON to relax the CDR requirement, meeting the GPON CDR timing requirementis still a challenging task for circuit developers. As a result, the cost of GPON CDRis typically higher than for EPON CDR. Table 3.7 summarizes the recommendedallocation of upstream burst overhead (PLOu).
3.4.1.2 Laser Power Control In GPON, the OLT burst-mode receiver (BMRx)circuit requirement affects the use of a highly sensitive APD receiver at a 1244.16-Mb/s bit rate. The OLT receiver (APD + BMRx) must provide both high sensitivityand large dynamic range for burst-mode reception above a 1-Gb/s bit rate. A largedynamic range imposes a compromise to the multiplication factor M of the APDreceiver, and a high incoming burst could potentially overload the OLT receiver.
To reduce the dynamic range experienced by the OLT receiver, the transmittingpower of an ONT laser that located near the OLT could be regulated to avoid overload
TABLE 3.7 Allocation of GPON Upstream Overhead
Upstream Bit Rate (Tg) (Tp) (Td ) Total Time(Mb/s) (bits) (bits) (bits) (bits/ns)
155.52 6 10 16 32/205.8622.08 16 28 20 64/102.9
1244.16 32 44 20 96/77.22488.32 64 108 20 192/77.2

136 PASSIVE OPTICAL NETWORKS: ARCHITECTURES AND PROTOCOLS
of the OLT receiver. G.984.2 specifies three ONT output power modes. Each modespecifies a range for the mean launched power for coarse ONT power leveling control.The OLT receiver measures the incoming power level and compares it to powerthreshold(s) to determine if it needs to issue a power control message to the ONT.OLT power measurement is usually implemented by monitoring a small part of thereceiver current IAPD. Four decibels of uncertainty is allowed to ensure a stablepower-leveling mechanism.
In practice, the receiver monitoring circuitry is not very accurate, due to electroniceffects. As a result, the OLT could combine the use of monitored BER values to trig-ger ONT power control. ONT power control could be either OLT- or ONT-activated,although in practice the former is used (if at all) because ONT implementations typi-cally lack power monitoring tools. To control ONT power, OLT sends a downstreamPLOAM Change Power Level (CPL) message and moves the ONT to one of thethree power-level modes.
3.4.1.3 GPON Forward Error Correction G.983.2 further recommends op-tional use of forward error correction (FEC) coding to either lowering the cost ofthe transceiver component or further extending the system’s physical reach. GPONinvestigates the use of FEC for two reasons. First, a higher bit rate reduces thereceiver sensitivity. This is because a higher bit rate introduces more noise to the re-ceiver because it has a wider bandwidth. As mentioned in Section 2.3.2, opticalreceiver sensitivity and bandwidth have a reciprocal relationship and thus fundamen-tal improvement of receiver quality is required to improve the bandwidth withoutreducing the sensitivity. In addition, a high bit rate induces a larger chromatic dis-persion. As mentioned in Section 2.6.2, the chromatic dispersion induced by a DFBtype of laser is small even in a GPON system. However, the use of a multilongitu-dinal mode (MLM) laser such as an FP laser would induce more dispersion due toa wider laser linewidth. Moreover, an MLM laser would introduce mode partitionnoise (MPN) that causes a power penalty, to further degrade the power budget.
G.983.3 recommends the use of a cyclic code called Reed–Solomon (RS) coding toprovide optical coding gain, defined as the difference in optical power at the receiverpower, with and without BER, for BER = 10−10. The RS FEC scheme transmitsredundant information along with the original information. If some of the originaldata are lost or received in error, the redundant information is used to reconstructthe data. The design and error correction capability of the cyclic code is defined by(n, n−m), where n is the size of the codeword (original bits + redundant bits) andm is the number of cyclic check bits (redundant information). G.983.3 defines anoptional RS(255,239) FEC to encode the entire GTC frame (with the exception ofthe existing CRC in the GTC frame). RS(255,239) is first defined in the ITU-T G.709optical transport network (OTN) standard and can provide 3 to 4 dB of optical codinggain in OTNs. The FEC, however, adds about another 6.2% overhead to the payload.
In current practice, GPON FEC option is rarely turned on because of the popularityof class B+ optics that can satisfy a 2.488/1.244-Gb/s transmission bit rate. The useof FEC in future 10-Gb/s PON systems, however, seems inevitable, due not only to

GIGABIT-CAPABLE PON 137
the implementation limitation of the transceiver but also to the physical constraintdue to chromatic dispersion.
3.4.2 GPON Transmission Convergence Layer
The G.984.3 GPON TC (GTC) layer specification defines the GPON frame format,bandwidth allocation, ranging, OAM, and encryption method. In this subsection wefocus on presenting details of the GTC frame format and GPON encapsulation method(GEM). The advanced encryption standard (AES) technique is also mentioned briefly,with more details presented in a later section.
3.4.2.1 GPON Transmission Convergence Downstream Frame GPONdownstream transmission consists of fixed 125-µs GTC frames, as illustrated byFigure 3.16. Each GTC downstream frame consists of a downstream physical controlblock (PCB) and payload. The payload could carry either a fixed-size ATM cell(only in GPON equiment built on an earlier G.984-2004 version of the standard) orvariable-size GEM frames. Details of the PCB are provided below.
Downstream Physical Control Block
� Frame synchronization (Psynch). The 4B Psynch uses a 0xB6AB31E0 16 pat-tern that allows the ONT to find the beginning of the frame. During initialization,an ONT could move from the Hunt state to the Synch state by identifying twoconsecutive Psynch fields. An ONT falls back to the Hunt state from the SynchState if it misses five consecutive Psynch fields. The Psynch field is also the onlyfield in the GTC frame that is not scrambled. The rest of the GTC frame, in-cluding the rest of the PCB and all of the payload, is scrambled by a scramblingpolynomial of x7 + x6 + 1.
PCB: Physical Control Block GPON GTC Downstream Frame
Psynch: PCB Synchronization
Ident: Identification
FEC Id: FEC IndicatorGEM SectionATM Section
N*53B
PayloadPCBd
125µs
PayloadPCBd PayloadPCBd
Psynch(4B) Ident(4B) PLOAM(13B) Plend(4B) Plend(4B) US BW Map(N*4B)
BIP(1B)
FEC Id(1b)Superframe
Reserved(1b) BW Map length(12b)
ATM Partition CRC(8b)Counter(30b) length(12b) length(12b)
FIGURE 3.16 GPON GTC downstream frame format.

138 PASSIVE OPTICAL NETWORKS: ARCHITECTURES AND PROTOCOLS
� Identification (Ident). The Ident field includes a 1b FEC option on/off indicatorand 30b superframe counter. The superframe counter is used by the encryp-tion system. The superfarme counter is incremented at the reception of everycorrectly received Ident field. Thus, it may also be used as a low-rate synchro-nization reference clock, similar to Psynch.
� Downstream PLOAM field (PLOAM d). PLOAM d has the same 13B fieldformat and similar message format as the BPON PLOAM message. Some addi-tional messages, such as threshold-crossing alerts and power-leveling control,are specified further.
� BIP. Similar to a BPON PLOAM BIP, this BIP can be used to detect errors thatoccurred in PCB and may also be used to estimate the link BER.
� Downstream payload length indicator (Plen d). The 4B Plen d gives the lengthof the upstream bandwidth allocation map in the PCB part (Blen) and the lengthof ATM section in the payload part (Alen). The Plen d field is protected by aCRC-8b field and is sent twice to provide additional error robustness.
Upstream Physical Control Block
� Upstream bandwidth allocation map (US BW map). The US BW map is avariable-size field that allocates upstream transmission slots. Figure 3.17 illus-trates the US BW map format. Each US BW map is 8B long and contains anallocation-ID (12b), flags (12b), a start slot time (2B), a stop slot time (2B),and a CRC (1B). The lowest 254 allocation-IDs are used to address the ONTdirectly, and the other 4 bits are used to be associated with a particular T-CONTor OMCC within that ONT. Note that allocation-IDs 254 and 255 are reservedfor unknown (during ranging) and unassigned ONTs (no upstream allocation),respectively. The flags of the ONTs are used to indicate a certain control func-tion that requests the ONT to send PLS u, PLOAM u, a dynamic bandwidthreport (DBR u), or to turn on upstream FEC encoding. In addition, the start andend time fields are used to locate the exact timing for that allocated upstreamtime slot. Figure 3.17 also shows an example of upstream bandwidth allocationwith three ONTs upstream with a time slot allocated. Note that the start andstop time counter is reset to zero at the beginning of the GTC frame.
3.4.2.2 GPON Transmission Convergence Upstream Frame A GTC up-stream frame consists of multiple GTC bursts from ONTs based on an upstream trans-mission time slot allocated by the OLT. Figure 3.18 illustrates the frame structure ofa GTC upstream frame. Each upstream frame matches the size of the downstreamtransmission frame to 125 µs. Each GTC burst has the following fields.
� Upstream physical layer overhead (PLO u). The PLO u first contains a 8Bburst overhead (at 1244.16 Mb/s) to account for the preamble, and a delimiterof the burst overhead. Note that the guard time part of the burst overhead isaccounted for by the OLT during upstream time slot allocation. As mentionedearlier, this part of PLO u is required only between successive upstream bursts

GIGABIT-CAPABLE PON 139
US BW map (N*8B)
ONT BW ONT BW ONT BW allocation entry-1 allocation entry -2 allocation entry-N
…
Alloc ID FlagsStartTime(2B) StopTime(2B) CRC(1B)
GPON US BW Map Format
(12b) (12b)
GTC PCB GTC
Alloc IDONT 2
Start slot240
End slot440
Alloc IDONT 1
Start slot80
End slot200
Alloc IDONT 2
Start slot460
End slot
PayloadBW map
600
US Time slot (ONT 1)
US Time slot (ONT 2)
US Time slot (ONT 3)
GPON US BW Map Method
FIGURE 3.17 GPON GTC upstream bandwidth map format and allocation method.
sent by different ONTs. In addition to the burst overhead, the PLO u includesanother 3B of burst header. The burst header includes a BIP (1B), ONT-ID field(1B), and indication (Ind) field (1B). The BIP field records all bit error detectedsince the last BIP was transmitted. The Ind field reports the status related toPLOAM u waiting, FEC status, and a remote defect indicator (RDI) statusto indicate a high downstream BER rate. Burst-synchronous bit scrambling isapplied to an entire upstream burst content, with the exception of the PLO u.
� Upstream PLOAM field (PLOAM u). The 13B PLOAM u field is defined byG.983.1 and, similarly, to GPON PLOAM d; a few new additional messagetypes are added to enhance OAM functions and a power-leveling mechanism.
Burst Overhead (4+8B at 1244.16Mbps)
Burst Header (3B) GTC overhead GTC payload
BIP(1B)
Preamble Delimiter PLOAMd(13B) PayloadDBRuGuardTime PayloadDBRu
ONT ID(1B) Ind(1B)
FIGURE 3.18 GPON GTC upstream frame format (G.984.3-2008).
140 PASSIVE OPTICAL NETWORKS: ARCHITECTURES AND PROTOCOLS
� Upstream dynamic bandwidth report (DBR u). Each DBR u field reports thetraffic status of the transmitting T-CONT (through the alloc ID field). Thelength of the DBA u reporting field could be coded into either 1B or 2B,depending on the DBA allocation format requested. OLT informs ONT ofthe type of DBA report to be used during the ONT activation process using theOMCI channel. Because the DBA u field reports traffic status when an upstreamT-CONT allocation is made to the ONT, it is also considered as a piggybackreporting mechanism. The DBR u field is appended with a 1B CRC field toprotect the DBR u.
It is noteworthy to point out that the latest ratification of the G.984.3 standard(March 2008) made a number of significant changes in the GTC layer from theearlier version (February 2004 and its subsequent amendments). Most notably, theATM partition of the GTC payload is altogether deprecated. As a result, the Alenwithin the Plen field is always set to 0, and no more ATM cells are transmitted ineither the downstream or upstream GTC payload.
In terms of DBA, G.984.3-2004 relies on three mechanisms to report upstreamqueue lengths in the status-reporting (SR) DBA mode. In addition to the DBR type ofpiggyback reporting mechanism, G.984.3-2004 further specifies the status indication(using the idle Iden field of the PLO u header) and entire upstream DBA payload-reporting mechanisms. Moreover, the DBR u field originally also employs a thirdreporting mode, which is 4B in size, but it is also dropped in the new standard. In fact,the entire G.984.3-2008 standard builds the DBA service performance model basedon the recommendation of using only a 1B DBA u report field. Despite these changesin G.984.3-2008, however, specific implementation of the upstream scheduler as wellas the traffic-monitoring (TM; known as nonstatus reporting in G.984.3-2004) DBAmethod is still open for vendor implementation.
Other notable changes in G.984.3-2008 include deprecation of the ONT power-leveling sequence (PLS) mechanism due to the lack of an ONT transmitter power-monitoring tool. Thus, the upstream PLS field is also dropped from the upstreamframe. To accommodate these changes, G.984.3-2008 further specifies that a set ofcompliant rules be outlined further to ensure interoperability with GPON devicesbuilt on the earlier 2004 version.
3.4.2.3 GPON Encapsulation Method The GPON encapsulation method(GEM) allows the GPON protocol to support variable-size frames such as Ethernet.GEM also provides (1) multiplexing of GEM ports and (2) payload fragmentationand reassembly. In the G.984.3-2008, GEM frames further become the only trafficbeing carried by the GTC protocol. Figure 3.19 illustrates the structure of the GEMframe.
The following list summarizes the GEM header fields.
� GEM payload length indicator (PLI). The PLT is a 12-bit field used to indicatethe length of the GEM payload section in bytes. As a result, GEM permitsfragments up to a size of 4095 bytes.

GIGABIT-CAPABLE PON 141
GEM Header (5B)
PLI(12b) Port ID (12b) HEC(13b) PayloadPTI(3b)
GPON GEM Frame Format (G.984.3-2008)
PLI: Payload Length Indicator
PTI: Payload Type IndicatorT-CONTPort-ID
Port-ID
Servicesidentified by
GEMHEC: Header Error Correction
port
GEM Based T-CONT
FIGURE 3.19 GPON encapsulation method (GEM) frame format.
� GEM port identification (Port-ID). The Port-ID is a unique traffic identifier onthe PON to provide traffic multiplexing. Each Port-ID contains a user transportflow (port services), and an Alloc-ID/T-CONT could have one or more activeport services.
� GEM payload-type indicator (PTI). The PTI field is used to indicate whetherthe current GEM frame is the end of a data fragment. The LSB is set to 1 if theGEM frame is either an unfragmented frame or the end of a data fragment. Thesecond bit is used similarly to indicate if the current GEM frame is the end of aGEM OAM.
� GEM header error correction (HEC). GEM uses a combination of cyclicBCH(39,12,2) code and a single parity check bit.
ONTs receive downstream data based on a matched Port-ID for local service. In theupstream burst frame, each T-CONT subburst frame could contain data from multipleservice ports, as illustrated by the GEM-based T-CONT layer structure in Figure 3.19.In addition to service multiplexing, the GEM frame also enables fragmentation.Figure 3.20 illustrates two cases of GEM fragmentation. In the first case, GEMis fragmented across three different GTC payloads. However, GEM fragmentationcannot straddle a multiple GTC frame boundary. As a result, the fragmentation mustbe aware of the number of bytes remaining in the frame and fragment the user dataaccordingly. In addition, if the remaining time in the GTC payload section is less thanthe minimum size of the GEM frame (5B), an idle (and incomplete) GEM header issent to fill the void. In the second case, user data are fragmented to allow the insertionof a time-sensitive data frame. Each ONT is required to have at least two GEMreassembly buffers to support the use of time-urgent fragmentation. OLT should notinterleave more than two users’ data to the ONT unless it can determine that the ONThas additional reassembly capability. Similarly, OLT is required to have at least twoGEM reassembly buffers for each Alloc-ID.

142 PASSIVE OPTICAL NETWORKS: ARCHITECTURES AND PROTOCOLS
GTC Payload K GTC Payload K+1 GTC Payload K+2
Fragment #1PTI
= 000 Fragment #3PTI
= 001Fragment #2
PTI= 000
Re-assembled User
General GEM Fragmentation and Re-assembly Process
1 of 3 2 of 3 3 of 3Data Frame
Urgent Frame #1PTI
= 000
GTC Payload K+1
Fragment #1PTI
= 001Urgent Frame #2
PTI= 000
GTC Payload K+1
Fragment #2PTI
= 001
GPON Pre-emption Process Using GEM Fragmentation
Port ID = yPort ID = x1Port ID = x2 Port ID = y
FIGURE 3.20 GEM fragmentation and reassembly process. The figure shows two ex-amples: a generic fragmentation process and a GPON preemption process using GEMfragmentation.
3.4.2.4 GPON Downstream Encryption Method Downstream data inGPON, as in any PON system, is broadcast to all ONTs via a shared feeder fiber.GPON standards strongly enhance the downstream data integrity over BPON stan-dards, where downstream data are protected using only a key churning technique.This technique is, however, a low-cost hardware solution that has severe flaws. ABPON key churning technique employs a 16-bit key and applies XOR directly onthe data with the key. Data protected by key churning can be broken as long as thetext of the key is known. A 16b key, for example, could be derived in as few as 512attempts. An attempt to strengthen the key using periodic updates does not improvethe situation significantly.
To ensure better privacy and data integrity, GPON specifies a much stronger en-cryption process to secure downstream transmissions. Specifically, the OLT launchesthe key exchange process by sending a PLOAM message to the ONT. The ONTthen generates a key and feeds it back to the OLT. The upstream communication isassumed to be secured, and thus the key is known only to honest ONTs and OLTs.After that, the OLT employs the advanced encryption standard (AES) mechanism toencipher the downstream data on a 16-byte block basis using that key. Among allONTs, only the one that supplied the key can decipher the encrypted downstreamdata correctly.
3.4.3 Recent G.984 Series Standards, Revisions, and Amendments
Besides making notable changes to the TC layer in G.984.3-2008, the ITU-T bodyrecently introduced a series of new standards, standard revisions, and amendments.
GIGABIT-CAPABLE PON 143
These include the G.984.5, and G.984.6, G.984.4-2008 revisions, and G.984.2 amend-ment 2. Some of the more significant changes are noted below.
3.4.3.1 G.984.2 Amendment 2: Transceiver Performance MonitoringG.984.2 amendment 2 adds physical-layer transceiver performance monitoring toprovide optical layer supervision (OLS) capability. The specification defines the per-formance requirement for OLT/ONT temperature and transceiver power monitoring.In the amendment, both OLTs and ONTs are expected to support ±3◦C. OLTs areexpected to provide ±2 dB and ONTs ±3 dB of transceiver power measurement.The measured values are expected to serve as an alarm and be sent using an elementmanagement system (EMS) over OMCI channels. Details of the OMCI and the useof EMS are outlined in the G.984.4-2008 revision.
3.4.3.2 G.984.5: Enhancement Band G.984.5 specifies the wavelength al-location and ONT/OLT filter requirement to reserve an enhancement wavelengthband for future wavelength-division multiplexing (WDM) types of upgrades. Thestandard considers a coexistence situation where new data services could be overlaidin WDM wavelengths over existing GPON signals. The standard provides severalwavelength options, depending on the existence of the legacy enhancement bandsignal (1550–1560 analog video service) and the cost consideration of the ONTfilter types.
In the most ambitious scenario, the standard specifies an enhancement band be-tween 1524 and 1625 nm. The standard requires that current ONTs implement awavelength-blocking filter to avoid service interruption at the time of upgrade. OLTalso requires a reciprocal triband filter to separate legacy signals from newly insertedwavelength signals at the time of upgrade. The particular WDM system is, however,outside the scope of this standard.
3.4.3.3 G.984.2 Amendment 2 and G.984.6: Single-Sided and MidspanReach Extension G.984.2 amendment 2 also indicates the use of class C+ opticsto support 32 dB of power budget and up to 60 km of maximum fiber length. Theamendment expects to turn on the FEC option in both the upstream and downstreamdirections to enhance receiver sensitivity. On the OLT receiver side, optical pream-plification techniques such as SOA preamplification could be used to further enhancethe upstream receiver (1290 to 1330 nm) sensitivity.
G.984.6 describes reference midspan reach extender architectures that would pro-vide an excess of 27.5 dB of the power budget in both the optical trunk line (OTL)section and the ODN. The OTL is defined as the extended single feeder fiber thatconnects the OLT to the reach extender box. The reference architectures investigatethe use of an all-optical amplifier option, an O/E/O conversion option, and a hy-brid option. The particular type of optical amplifier and the specific architecture areoutside the scope of this standard.

144 PASSIVE OPTICAL NETWORKS: ARCHITECTURES AND PROTOCOLS
3.5 ETHERNET PON
As explained earlier, when the full service access network (FSAN) initiative wasbegun in 1995, the impetus of selecting ATM networking technology is that it wouldbecome the universal networking standard. FSAN submitted the BPON standardproposal in 1997, and BPON was formally ratified by ITU-T in 1998. However,Ethernet has quickly become the universal standard that ATM envisioned. Widespreaduse of Ethernet in both a local area network and a metro area network makes it anattractive alternative to support an access network. In January 2001, a new IEEE studygroup called Ethernet in the First Mile (EFM) was created to extend existing Ethernettechnology into subscriber access areas. Ethernet technology over point-to-multipoint(P2MP) fiber, also known as Ethernet PON (EPON), quickly gained momentum forits ability to support full optical access with more relaxed timing requirements andthe capability to encapsulate variable-size frames. IEEE EFM formally ratified IEEEstandard 802.3ah in June 2004 to support the physical and data link layers of theEPON network. Since the introduction of EPON, it has quickly captured the interestof industry because EPON significantly simplifies the interoperability with EthernetMAN and WAN equipment compared to the use of BPON equipment. Unlike ITU-TB/GPON standards, IEEE 802.3ah specifies only a small portion of an EPON systemand thus also creates significant interests from the research community to addressinteresting challenges that are omitted from the standard.
3.5.1 EPON Architecture
The scope of IEEE 802.3ah, like the rest of the IEEE 802.3 standards, focusesexclusively on the physical and data link layers of the Open Systems Interconnection(OSI) reference model. IEEE 802.3ah specifies the EPON architecture in terms of itsphysical medium–dependent sublayer, P2MP protocol specification, and extensionsfor reconciliation, physical coding, and physical medium attachment sublayers.
3.5.1.1 EPON Physical Medium–Dependent Sublayer EPON PMD sub-layer is defined by clause 60 of the IEEE 802.3ah standard. The PMD sublayerdefines 1000BASE-PX10-U/D and 1000BASE-PX20-U/D for 10- and 20-km P2MPtransceiver specifications. Table 3.8 summarizes the EPON PMD options. The op-erating wavelength range is the same as the one for BPON (i.e., 1260 to 1340 nmupstream and 1480 to 1500 nm downstream).
Details of the OLT and ONU transceiver specifications could be found in clause 60of the IEEE 802.3ah standard. The difference between 1000BASE-PX10 and -PX20specifications reside primarily in the OLT transceiver, where 1000BASE-PX20 usesbetter transmitter and APD receiver specification’s than those of PIN-type receivers.The specifications of ONU transceivers were intentionally made very similar so thatthe same type of ONU could be made to support both -PX10 and -PX20 systems. Thishelps facilitate lower-cost EPON component development by encouraging economiesof scale.

ETHERNET PON 145
TABLE 3.8 EPON PMD Options
Parameter 1000BASE-PX10-U/D 1000BASE-PX20-U/D
Distance (km) 10 20Data rate (Gb/s) 1 1Minimum channel 5.0/5.0 10.0/10.0
insertion loss (dB)Maximum channel 20.0/19.5 24.0/23.5
insertion loss (dB)Maximum split 16 (without FEC) 16 (without FEC)
ratio 32 (with FEC) 32 (with FEC)
One of the key distinctions between EPON and B/GPON is the relaxed timingrequirement. BPON first specifies a stringent set of laser-on/off time (guard time)and preamble time (CDR). In EPON, the timing requirement is relaxed significantlyto make the component as inexpensive as possible. As a result, the standard specifiesthe following parameters: laser-on/off times = 512 ns, CDR time ≤ 400 ns. This setof requirements is defined to facilitate high yield and to minimize the digital controlinterface. However, high physical burst overhead does translate into low efficiency.As a result, the CDR time is negotiable and the standard permits the use of betterperforming PMD components to enhance efficiency.
In a traditional Ethernet system, there is no global synchronization. All transmittersrun on their local clocks to maintain low cost. A receiver derives the clock from thedata received, and mismatches between clock sources are accounted for by adjustingthe interframe gap (IFG) between Ethernet frames. In an EPON system, however,upstream ONU bursts are multiplexed using a TDMA method, and precise timingacross all ONUs must be maintained. To maintain a common reference clock with anOLT, EPON ONUs are mandated to acquire loop timing from the OLT. This meansthat the ONU clock (MAC layer MPCP clock) should track the OLT MPCP clockfrom the received downstream signal. In this way, the OLT could still operate aninexpensive clock crystal with ±100 parts per million from the nominal frequency.ONUs are able to remain synchronized at all times because OLT should constantlytransmit either data or idle frames.
3.5.1.2 Extensions to Other Sublayers Because of its P2MP architecture,EPON requires a certain extension to conform to existing IEEE 802.3 clauses.
Reconciliation Sublayer (RS) In Ethernet, layer 2 connection is achieved usingan IEEE802.1D-based bridge. An Ethernet switch forwards an incoming packet fromthe input port to one or more of its output port(s). Because a traditional Ethernetsystem has P2P Ethernet connectivity, packets are only directed forward withoutbeing sent back to the same input port. In effect, a layer 2 Ethernet switch examinesthe SA and DA of each frame received and drops those from the same domain.

146 PASSIVE OPTICAL NETWORKS: ARCHITECTURES AND PROTOCOLS
Due to the directionality of the passive splitter, ONUs cannot see each other’supstream traffic. Thus, OLT is required to help forward any inter-ONU communica-tions. Without a modification to the standard, an IEEE 802.1D switch connecting tothe OLT would simply discarded any such inter-ONU transmission frames becausethey would appear to come from the same domain. To resolve this issue, subclause65.1 of IEEE 802.3ah defines a point-to-point-emulation (P2PE) function in the RSsublayer. The P2MP function tags each Ethernet frame with a unique logical linkID (LLID) in the preamble for each upstream ONU frame. The MSB of the LLIDfield indicates the mode bit, where “0” indicates P2PE operation and “1” indicatessingle-copy broadcast (SCB) that broadcast the traffic back to all ONUs.
Physical Coding Sublayer (PCS) PCS defines the 8b/10b line coding and anoptional FEC. EPON adapts the 8b/10b line coding used by the IEEE 802.3z gigabitEthernet standard. An 8b/10b line code produces a sufficient number of zero–one andone–zero transitions and dc balanced output to ensure easy clock recovery. However,this increases the baud transmission rate to 1.25 Gbaud/s. After 8b/10b line coding,the PCS further defines a data detection function to control the laser-on/off function.In short, the data detection function could be seen as a delay line that turns the laseron or off at the appropriate time after detecting waiting or completion of data fromMAC. In EPON a 10-bit 8b/10b encoded data signal is called a code group. EPONPCS also defines the same RS(255,239) cyclic code as in GPON FEC. The use ofFEC in EPON is also optional.
Physical Medium Attachment Sublayer (PMA) The PMA sublayer specifies thetime interval required by the OLT to acquire bit-level synchronization using the CDRprocess and autocorrelation process. As mentioned earlier, T CDR is required to bewithin 400 ns, and the PMA specifies an additional 32 ns for code group alignment.
3.5.1.3 EPON Framing EPON transmits variable-size Ethernet frames such asthe one shown in Figure 3.3. Both a generic Ethernet frame and an EPON framecontain the destination and source MAC address (DA and SA, 6B each), payloadlength/type (PLT 2B), a variable-size payload section, and CRC (4B). When PLTis above 1500 (the maximum payload size), it is used to indicate a specific type ofEthernet frame. The actual payload length ranges from 46 to 1500 bytes.
The main difference is in the EPON header. The EPON header modifies thepreamble and start of the frame delimiter (SFD) part of the Ethernet MAC frameto include LLID so as to enable the P2PE function. The SFD byte is moved to thethird byte of the preamble, which is renamed to the start of the LLID delimiter(SLD). EPON data frames could further incorporate an optional VLAN control, asillustrated in Figure 3.21. The optional 4B VLAN tag control is added to identifya virtual network associating a set of communication entities. The tag control fieldcarries a 3b priority value that selects one of the eight priority queues, which forupstream transmissions will be the OLT.

ETHERNET PON 147
Tag ControlDA SA PTL FCSEPON HeaderFields Data Payload
4668Bytes 46-15002 4
g
SLDPattern Pattern LLIDx2 CRC
1B2B2B1B2B
CFIPriority VLAN IDTag Type
3b16b 1b 12b
SLD: Start of LLID Delimiter
PTL: Payload Type/Length Indicator
CFI: Canonical Format Indicator
IEEE 802.3ah EPON Data Frame Format
with Optional VLAN Tagging
VLAN: Virtual LAN
DA SA 88 0816 OpCode FCSEPON HeaderFields TimeStampspecific OpCode
field/pad
IEEE 802.3ah EPON MPCPPDU Frame Format
402668Bytes 42 4
FIGURE 3.21 EPON Data frame format with optional VLAN tags and GEM MPCP frameformat.
3.5.2 EPON Point-to-Multipoint MAC Control
EPON point-to-multipoint MAC control (MPMC) is defined by clause 64 of the IEEE802.3ah standard. It defines primarily the multipoint control protocol (MPCP) thatperforms ranging, bandwidth arbitration, and discovery functions.
3.5.2.1 Multiple Point Control Protocol The MPCP controls rely on the useof the MPCP data unit (MPCPDU). As illustrated in Figure 3.21, the MPCPDU has afixed 64B frame size (without counting the 8B EPON overhead). Six types of MPCPcontrol frame are defined in the standard. The MPCP control frame is identified by88-0816 in the PTL, and the type of MPCP control frame is identified by the 2Bopcode. The corresponding opcode and the type of MPCP message are listed below.
� 000116: PAUSE. The PAUSE message was used originally for flow controlpurpose. It was developed for a P2P Ethernet network for an overloaded receiverto stop receiving from its peer.
� 000216: GATE. There are two types of GATE messages: discovery GATE andnormal GATE. Discovery GATE is used to advertise a discovery slot for alluninitialized ONU. Normal GATE is used to grant an upstream transmissionopportunity to a single ONU.
� 000316: REPORT. ONU uses a REPORT message to report its local queue statusto an OLT. An ONU can report the status of a variable number of queues usingan REPORT message.
� 000416: REGISTER REQ. An initialized ONU uses a REGISTER REQ mes-sage to respond to a discovery GATE message.
� 000516: REGISTER. The OLT sends a REGISTER message to a newly discov-ered ONU and assigns a unique LLID.

148 PASSIVE OPTICAL NETWORKS: ARCHITECTURES AND PROTOCOLS
� 000616: REGISTER ACK. REGISTER ACK is the final registration acknowl-edgment sent by an ONU in the discovery process.
The format of these control frames is presented in more detail during our discussionof ranging, autodiscovery, and DBA processes. Other details of the MPCP controlframes may be found in clause 64 of the IEEE 802.3ah standard.
Ranging Process In EPON, all ONUs are synchronized to the OLT clock basedon a loop-timing mechanism. Thus, an ranging process, which measures the RTTbetween an OLT and an ONU, can be carried out using normal GATE and REPORTcontrol messages. Figure 3.22 illustrates how RTT can be determined by the GATEand REPORT processes. The OLT sends a normal GATE message with the timestamp T0. The ONU would respond to the GATE message with a REPORT messageafter some delays, TR . The time stamp on the REPORT message T1 represents exactlyT0 + TR because the ONU has precise loop timing from the OLT. Upon receiving theREPORT message at T2, OLT could then use the information T2 − T1 to determinethe RTT.
Autodiscovery Process Similar to the GPON discovery process, an EPON au-todiscovery process allows an ONU to register and join or rejoin the system. The termauto- is used because an EPON OLT broadcasts periodically to open up a discoverywindow for all uninitialized ONUs to respond. Figure 3.23 shows the autodiscov-ery process. The corresponding formats for the MPCP control messages used inautodiscovery are shown in Figure 3.24.
The autodiscovery process consists of the following steps.
� An OLT periodically opens a discovery window (discovery GATE). The discov-ery GATE message advertises a discovery time slot to every uninitialized ONU.
T2T0RTT+TR
OLT timeTo
T1
ONU timeT1
ONU timeTo
TR
TR (Response Time) = T1 –T0
RTT + TR = T2 –T0
T1 CFI: Canonical Format Indicator
VLAN: Virtual LAN
FIGURE 3.22 EPON ranging process.

ETHERNET PON 149
discoveryWindow
maxRTT
minRTT
Discovery slot
REGISTER REQ
Discovery slottime
time
time
Discovery slot
RandomDelay
Discovery slot
discoveryWindow V
discoverySlot + (maxRTT minRTT)
DiscoveryGATE
OLT
NearONU
FarONU
FIGURE 3.23 EPON autodiscovery process.
The length of the discovery slot is selected to be longer than the size of the ONUREGISTER REQ. The minimum size of the discovery window is related to thediscovery time slot, as shown in Figure 3.23. The reason that the discovery slotand discovery window should be larger than the minimum size requirement isto avoid upstream collisions during the autodiscovery process. In EPON, theminimum RTT time is assumed to be zero. Upstream collision is possible duringautodiscovery because there could be more than one uninitialized ONU in thesystem, and their discovery slots could be overlapped.
DA
6B 6B 2B 2B
2B 2B 31B
38B
34B
35B
1B
1B1B
1B
1B
1B2B 2B
2B 2B
DiscoveryGATE
REGISTER_REQ
REGISTER
REGISTER_ACK
4B
4B 4B Bytes
MPCPDU
40B
SA OpCode TimeStamp
Grantstart time
Flag
flag
flag
AssignedPort
EPG
EAP EST
PendingGrants
Grantlength
SynchTime
SynchTime
Pad = 0
EPG: Echoed Pending Grants
EAP: Echoed Assigned Port
EST: Echoed Synch Time
Pad = 0
Pad = 0
Pad = 0
FCSOpCode specificfield/pad
88-0816
0916
FIGURE 3.24 EPON discovery GATE, REGISTER REQ, REGISTER, and REGISTERACK message formats.

150 PASSIVE OPTICAL NETWORKS: ARCHITECTURES AND PROTOCOLS
� Uninitialized ONU responds to a discovery GATE message (REGISTER REQ).An ONU sends the REGISTER REQ message during the discovery time slotafter a random delay. The random delay is added to avoid persistent collisionfrom more than one uninitialized ONU that share an overlapped discovery slot.
� OLT registers ONU (REGISTER). Upon receiving a valid REGISTER REQmessage from an uninitialized ONU, the OLT assigns a unique LLID to thesingle ONU. Because the message is sent without establishing a logical linkbetween the OLT and the ONU (i.e., the ONU has not learned its LLID), themessage has a broadcast LLID field but uses the ONU MAC address in theDA. For all other MPCPDU control messages, the DA MAC address is set to adefault 0180C200000116 multicast address.
� ONU acknowledges (REGISTER ACK). An ONU replies to the OLT with asimple REIGSTER ACK message to indicate either Nack or Ack.
Figure 3.24 and Table 3.9 show further details of the autodiscovery control messageformats.
� Discovery GATE. The discovery GATE message includes only a single grantand, additionally, advertises a synch field to an ONU. Because of differentburst-mode receiver implementation at the OLT, the AGC and CDR intervalsmay be different. The synch field communicates the OLT’s burst-mode syn-chronization time to the ONU. Since both TAGC and TCDR cannot be longerthan 400 ns in EPON, the maximum allowed synchronization time is 832 ns(including an additional 32 ns for code group alignment), or 52 time quanta(EPON defines a 16-ns TQ, and the MPCP clock counter advances based on aTQ interval). Additionally, the discovery GATE message specifies the MPCPclock start time and discovery time slot length.
� REGISTER REQ. The REGISTER REQ message could indicate either a reg-istration (flag = 1) or deregistration (flag = 0) request. When ONU sendsa REGISTER REQ message to the OLT, it also sends a pending grant fieldto indicate its ability to store future grants. This is because an ONU is re-quired to store grant parameters until its local clock reaches the grant starttime value.
� REGISTER. The REGISTER message assigns LLID to an ONU using theassigned port field. It also uses the ONU MAC address in the DA since the
TABLE 3.9 Contents of DA and OpCode for Autodiscovery Messages
MPCPDU Type Destination Address OpCode
Discovery gate 0180C200000116 000216
REGISTER REQ 0180C200000116 000416
REGISTER ONU MAC address 000516
REGISTER ACK 0180C200000116 000616

ETHERNET PON 151
logical connection has not yet been established. The flag field is used to indi-cate the registration type to ONU; these types could register, deregister, nack,and ack. IEEE 802.3ah does not specify that the synch time in the REGISTERbe the same as that in the discovery GATE message. Thus, it is possible that avendor could use information learned about the ONU in the REGISTER REQmessage to reduce the synchronization time. Finally, the OLT echoed the pend-ing grants reported by ONU to indicate that it is aware of the ONU’s bufferlimitation.
� REGISTER ACK. The REGISTER ACK message completes the autodiscoveryprocess and includes a single flag to indicate ack or nack. In addition, it echoedthe assigned port and synchronization time values received.
As mentioned earlier, a random delay is added by the ONU after the beginning ofeach discovery time slot to avoid persistent collision with another ONU’s upstreamcontrol message. In the case of a collision, the OLT would not receive a validREGISTER REQ or REGISTER ACK message from the ONU. The OLT wouldperiodically open a discovery window to allow these ONUs to join the networkand resolve contention in the next discovery window. In these cases, the size of thediscovery time slot and the periodicity of the discovery window would affect theperformance of collision probability. The IEEE 802.3ah standard does not specifythe details of these parameters and leaves implementation to the vendor.
Bandwidth Grant and Report Process One of the main functions of EPONMPCP is to enable bandwidth arbitration. It is important to note that IEEE 802.3ahdoes not specify the implementation details of DBA, and the standard leaves theimplementation of DBA open to vendor innovation. Instead, the standard enables abandwidth grant and report mechanism using normal GATE and REPORT controlmessages.
The following list provides details of the normal GATE and REPORT controlmessage formats, which are illustrated in Figure 3.25.
� Normal GATE message. A normal GATE message includes a mandatory 1-bytefield to indicate the number of grants (3b), the type of GATE message (1b), andthe force upstream queue report bitmap (4b). In a normal GATE, each grantrequires a 6-byte field to indicate the start of grant time (4B) and the length ofgrant time (2B). The number of grants of a normal GATE message is between0 and 4, and as a result of zero padding could be 39, 27, 21, or 15 bytes long.A normal GATE is indicated by a “0” in the type of the GATE field, where thediscovery GATE sets the bit to “1.” The force upstream queue report bitmapmandates the ONU to report the upstream queue status in the correspondingOLT for possible upstream grant time slots. When an OLT mandates the ONUto report upstream queue status, it would possibly grant a larger upstream timeslot, to include room for the upstream REPORT message in addition to datamessages requested.

152 PASSIVE OPTICAL NETWORKS: ARCHITECTURES AND PROTOCOLS
DA
6B 6B 2B 2B 4B 4B40B
SA OpCode TimeStamp FCSOpCode specificfield/pad
88-0816
(2B)
Grant 1Length
(4B)
Grant 1Start
(2B)
Grant 4Length
15-39B
Pad = 0
0-39B
Pad = 0
(4B)
Grant 4Start
1B
Bytes(optional)
MPCPDU
NormalGATE
REPORT
No. grantsand flags
(2B)
(3-17B) (3-17B)
Queue1report
(2B)
Queue8report
(1B)
Reportbitmap
Queue set #1 Queue set #k
1B
No. queuesets
FIGURE 3.25 EPON normal GATE and REPORT message formats.
� REPORT message. Each REPORT message could include a variable number ofqueue sets. For each queue set, the ONU uses a 1-byte report bitmap to indicatethe subset of eight ONU upstream queues that would be reported. The actualqueue length is reported according to the number of TQ (16b)’s in a 2B field.The REPORT message could include any of 0 to 13 queue sets, depending onthe number of queues reported in each queue set. For example, a REPORTmessage could contain two queue sets for reporting full eight queues (34B) or13 queue sets for reporting only one queue (39B).
The reason that the REPORT message is specified to include a multiple queueset in EPON is to avoid wasting bandwidth. In particular, the OLT DBA functionmight grant only a portion of the bandwidth requested. Since Ethernet frames cannotbe fragmented, unfit frames have to be deferred to the next time slot, resulting insignificant unused bandwidth. Reporting multiple queue sets allows the ONU toreport upstream queue length according to some predefined threshold. If a framedoes not fit into the threshold, the ONU would choose a slot size that is smaller thanthe threshold and preserve the upstream bandwidth for other ONUs. The standarddoes not provide details on how the threshold should be determined, but it doesdictate that each queue set specify the cumulative length (including overhead, i.e.,8B preamble and 16B IFG) from the head of the FIFO queue.
3.5.3 Open Implementations in EPON
The IEEE 802.3ah standard intentionally leaves many details outside the specifica-tions except for the basic physical and data link layers. This is done to preserveflexibility in terms of implementations and to encourage vendor innovations. Theobjective of the former is to maintain a low-cost device and a fast time to market.For example, the physical synchronization time has a relaxed requirement to allow

ETHERNET PON 153
a low-cost burst-mode receiver, but the standard leaves room to incorporate a betterdevice to enhance system efficiency. Some of the details omitted include interestingproblems that stimulate academic research studies in addition to vendor implemen-tations. For example, dynamic bandwidth allocation and the provision of guaranteedservice levels are two very interesting problems that have received much attentionfrom the research community. However, EPON open implementations have also ledto confusion in the market place and a lack of interoperability. For example, JapaneseEPON will not work with a Chinese EPON.
The following short list summarizes some of the most interesting topics left openby the IEEE 802.3ah standard: dynamic bandwidth allocation (DBA), SLA guar-anteed mechanisms, discovery slot and window assignment, protection switchingarchitecture, downstream security and encryption, and OLT burst-mode receiver lim-itation. In this section we address some of the key developments in DBA and dataencryption.
3.5.3.1 Dynamic Bandwidth Allocation Although details of DBA andscheduling are not specified by the standard, vendors and researchers have devel-oped many interesting schemes to facilitate high bandwidth utilization and robustSLA provisioning. The best known DBA algorithm is called interleaved polling andadaptive cycle time (IPACT) DBA. IPACT utilizes a just-in-time scheduling strat-egy to dynamically allocate upstream and to achieve high bandwidth utilization.Figure 3.26 is a working example of how an IPACT scheme would function.
Entry Table
ONU RTT
T1rtt t1start-1 BW1
up
BW 2up
BWkup
t 2start-1
t kstart-1
T2rtt
Tkrtt
Start TxTime
GrantedBW
1
2
k
BW1up
BW 2up
BWkup
GrantedBW
BW1up
BW 2up
BWkup
GrantedBW
OLT
ONUk
ONUelse
uplink
downlink Datak tknext-∆
Datak
BWk-1reg + Datak-1 BWk+1
reg + Datak+1
BWkreg
BWkreg BWk+1
reg
Tg
TgTg
t
t
t
ONUk waits forupstream
transmission
Datak
DatakDatak-1
tknext-∆
FIGURE 3.26 EPON DBA process.

154 PASSIVE OPTICAL NETWORKS: ARCHITECTURES AND PROTOCOLS
IPACT DBA The objective of the IPACT scheme is to maximize bandwidth uti-lization by pipelining ONU requests. In IPACT, the OLT keeps active records of thebandwidth requests sent through REPORT messages from an ONU. The bandwidthrequested is granted to the ONU using a GATE message in the next traffic cycle.Successive GATE messages are timed according to their respective RTT such thatupstream collision is avoided. The ONU responds to the GATE message immediately(i.e., just-in-time). The IPACT scheme could schedule upstream traffic bursts in apipelined fashion such that successive bursts are separated by the minimum specifiedguard time. In this way, upstream bandwidth utilization is maximized.
In the grant allocation scheme above, called gated service, the OLT grants exactlyhow much an ONU has requested in the preceding traffic cycle. Although the schemeprovides robust bandwidth utilization, it does not perform well in terms of bandwidthfairness. A large request from one ONU could potentially block upstream transmissionfrom the other ONUs, creating a large latency in other services.
IPACT could be enhanced significantly in terms of QoS and fairness by limitingthe size of the grants to a fixed value. In the limited service scheme, IPACT is able toprovide both robust bandwidth utilization and fairness across ONUs. The article byKramer et al. [2] is a good reference on further details of the IPACT scheme.
System Implementation Issues During development of the EPON standard, ajust-in-time DBA scheme such as IPACT has been proposed, but the eventual ratifica-tion of the standard does not adopt the just-in-time scheme. This is because Ethernetdoes not have frame fragmentation ability. Thus, a GATE message itself cannot beused to indicate the timing of upstream transmission because a GATE message couldbe blocked by a long Ethernet frame in transmission. As a result, the GATE messageis defined to carry the start time in addition to just simply sending the length of theupstream slot granted.
Moreover, EPON operates in a multiservice environment and the operators needto honor their SLA agreements. An online and purely reactive type of DBA schemesuch as IPACT does not always provide the performance operators needed to honortheir SLA agreements. As a result, many other DBA schemes have been investigatedsince the introduction of IPACT to investigate off-line scheduling, hybrid online/off-line scheduling, predictor-based scheduling, and so on [3]. The objective of theseDBAs is to provide class-of-service-oriented bandwidth allocation with reasonablecomplexity and hardware delays. Due to its pioneering nature in the field, however,IPACT is still used extensively as a performance benchmark for these new DBAschemes.
3.5.3.2 Downstream Encryption Mechanisms IEEE 802.3ah does notspecify security, in particular encryption, mechanisms for EPON. As mentionedearlier, implementing encryption is important in protecting the data integrity in anyP2MP PON system. As a result, many systems do implement vendor-specific encryp-tion mechanism in the EPON chip set. The lack of standard specifications encouragedvendor innovations, but it also created a compliant and interoperability issue.

ETHERNET PON 155
Today, most EPON chip set manufacturers adopt the AES-128 standards, similarto the standards used by GPON to encrypt downstream EPON frames. In some cases,a stronger public key infrastructure (PKI) cryptography technique is used to protectthe integrity of the encryption key during protocol exchanges.
3.5.4 Unresolved Security Weaknesses
Although the AES-128 encryption technique can effectively protect against down-stream eavesdropping, other known types of security weaknesses still reside in theEPON system. The article by Hajduczenia et al. [4] provides a comprehensive reviewof the development and existing questions concerning EPON security issues. It isimportant to note that these problems are generic to any P2MP-based PON system,and the solution to these security weaknesses is still an active area of research.
3.5.4.1 Upstream Denial of Service Attack A denial of service (DoS) attackcould occur in PON when a malfunctioning (babbling/promiscuous) or malicious usersends an in-band message that could disrupt valid ONU services. Regardless of thesource (whether it is malicious or innocent due to hardware defects), the effect ofupstream disruption could be costly. In EPON, for example, operation of a keep-alivemechanism would cause the system to restart, thus bringing down an entire systemwith meticulously crafted security mechanisms.
To address the problem, the PON system must be able to detect the source ofattack and counter the security threat. However, a PON lacks the mechanisms to eitherdetect or counter upstream DoS attacks. If the upstream disruption blocks upstreamtransmission from other ONU users, it is inherently difficult for the OLT to determinethe source of attack using a higher-layer detection method. If a passive power-monitoring technique is available (such as the OLT transceiver power-monitoringtool specified by G.984.2 amendment 2), the OLT could potentially determine thelocation of the attack based on the strength of the receiving power. Knowing the opticalreceiver power during the time of attack does not guarantee knowledge of the locationof attack, however. Even if OLT could detect the source of attack automatically, aPON does not have any active switching comparability that can block the malicioususer from disrupting the network further.
In current implementation, operators assume the occurrence of upstream disrup-tion to be rare and use manual monitoring (optical time-domain reflectometry andpower measurement) and an intervention method (physical shutdown) to resolve DoSattacks.
3.5.4.2 Masquerade or Replay Attack If a malicious ONU user can listenand decrypt traffic of another ONU user, the malicious ONU can monitor informationof another targeted ONU, including LLID, MAC address, and so on. The malicioususer can then easily steal the identity of the victimized ONU to disguise and mas-querade as the target ONU and steal its identity. Masquerade attack is very difficultto detect once it is under way since the malicious user is seen as the valid user. Se-cure authentication and/or upstream encryption could potentially solve the problem.

156 PASSIVE OPTICAL NETWORKS: ARCHITECTURES AND PROTOCOLS
However, it should be noted that malicious ONU users, even if they fail to decipherthe collected information, can still relay the signals collected and replay them in thenetwork to cause a disturbance with unpredictable consequences.
3.6 IEEE 802.AV-2009 10GEPON STANDARD
The IEEE EPON standard shows many distinct benefits over the BPON standard interms of greater bandwidth efficiency and more relaxed timing requirements. How-ever, the GPON standard addresses the bandwidth efficiency and Ethernet protocoladaptation issue successfully by introducing GEM. It also provides a much higherdownstream bit rate than the one that EPON provides. On the other hand, the perfor-mances of burst-mode optical components have improved, and some of the originalEPON relaxed timing requirements have become the critical bandwidth-limiting bot-tleneck.
In response to a demand for higher-bit-rate and burst-mode hardware equipment,the IEEE 802.3 working group in March 2006 held a call for interest (CFI) that aimedto leapfrog the 2.5-Gb/s option and opted directly for the 10-Gb/s EPON option. TheIEEE P802.3av task force [5] was then formed in September 2006. In October 2009,the IEEE 802.3av standard [6] was officially ratified as an amendment to the 802.3avstandard.
3.6.1 10GEPON PMD Architecture
The 802.3av standard confines the changes to the 10GEPON system primarily withinthe PMD sublayer. The intention is to leave the existing OAM, DBA, and networkmanagement system (NMS) unchanged, such that 10GEPON users could expectbackward compatibility toward 1GEPON equipment. The 802.3av standard adds twonew clauses to the IEEE 802.3 documentation that addresses PMD and extension toRS and PCS/PMA sublayers. In this subsection we note the important amendmentsin these two new clauses.
3.6.1.1 Bit Rates and Power Budget The 10GEPON standard specifies sev-eral power budget options. PRX options define the power budget for an asymmetrical10.3125-Gb/s downstream and a 1.25-Gb/s upstream bandwidth combination. PRoptions define the power budget for symmetrical 10.3125-Gb/s transmission. Eachoption comes with three additional classes. Table 3.10 summarizes the 10GEPONpower budget options.
It is important to note that the PR10 and PR20 classes of the power budget forPRX and PR systems are the same as those for the PX10 and PX20 systems. Asexplained in Section 2.3.2, the optical receiver sensitivity would suffer additionallosses when receiving a higher bandwidth. To compensate for the loss budget, the10GEPON standard recommends the use of better OLT transceiver components aswell as use of the FEC to offset the losses expected.

IEEE 802.AV-2009 10GEPON STANDARD 157
TABLE 3.10 Bit Rate and Power Budget Options of IEEE 802.3av PMD
Rate/ DS Line US Line PowerBudget Rate Rate Budget OLT Tech. ONU Tech.Type (Gbaud/s) (Gbaud/s) (dB) (DS/US) (DS/US)
PRX10 10.3125 1.25 20 EMLa /APDb PIN/DMLb,c
PRX20 10.3125 1.25 24 EML + SOA/APDb PIN/DMLb
PRX30 10.3125 1.25 29 EML/APDb APD/Hi DMLb
PR10 10.3125 10.3125 20 EML/APD PIN/DMLPR20 10.3125 10.3125 24 EML + SOA/APD PIN/DMLPR30 10.3125 10.3125 29 EML/APD APD/Hi DML
aEML, electroabsorption modulated laser.bThe FEC option is turned off at a 1.25-Gbaud/s transmission rate.cDML, direct modulated laser.
Another important note is that 10GEPON applies 64b/66b line coding to the10.3125-Gbaud/s line rate. In this case, the actual data rate is 10 Gb/s. The choice of64b/66b has many implications in terms of the burst overhead and FEC alignment.Some of these details are provided in a later section.
3.6.1.2 FEC and Optical Coding Gain EPON standard initially considers anRS(255,239) FEC option but eventually opts for RS(255,223) for a higher opticalcoding gain but at twofold higher overhead. Table 3.11 compares the differencebetween these two types of coding techniques.
Figure 3.27 shows about 6.4 dB of optical coding gain from a 10GEPON prototypesystem. In the figure, optical coding gain is defined further as the improvement inreceiver sensitivity given the same 10−12 BER level. It is important to note that theoptical coding gain is smaller than the electrical coding gain. This is because theoptical gain is affected further by the noise characteristics of the optical receiverdevices. In the example illustrated, an APD type of receiver is used, and thermalnoise and shot noise are mixed in an APD receiver. The presence of thermal noisereduces the perceived optical gain. In this case, the results show that optical codinggain is approximately 70 to 90% of the electrical coding gain. In the case where a PINreceiver is used and thermal noise is the dominant factor in the receiver, the opticalcoding gain would be worse and only about half of the electrical coding gain.
TABLE 3.11 Comparison of RS(255,239) and RS(255,223) at a 10.3125-Gbaud/sline rate
FEC Code Overhead US Overhead Coding Gaina Input Burst ToleranceType (%) (%) (dB) at 10−12 BER (bits)
RS(255,239) 6.3 7.34 5.9 1.8 × 10⁻⁴ 57RS(255,223) 12.5 13.53 7.2 1.1 × 10⁻³ 121
aElectrical coding gain.

158 PASSIVE OPTICAL NETWORKS: ARCHITECTURES AND PROTOCOLS
10-3
10-4
10-5
Bt e
rror
rat
o
10-6
10-710-810-910-1010-1110-1210-13
36 35 34 33 32 31 30 29
Average Received Power (dBm)
6.4dB
w/FECwo/FEC
28 27 26 25
FEC : RS (255,223)Rate : 10GbpsDistance : 20Km
24 23 22
FIGURE 3.27 10GEPON RS(255,223) optical coding gain.
3.6.1.3 Wavelength Plan and Coexistence The 10GEPON standard spec-ifies the upstream transmission wavelength in the range 1260 to 1280 nm and thedownstream transmission wavelength in the range 1575 to 1580 nm. The idea be-hind the wavelength selection is that the future 10GEPON system is expected tocoexist with the 1GEPON system using TDMA in the upstream and WDM in thedownstream. Details of coexistence architecture are presented later.
As described in Section 3.1.2, FP lasers are no longer applicable in 10G systems,due to their high chromatic dispersion power penalty. As a result, the original 100-nm upstream window is no longer necessary. Thus, a narrower upstream wavelengthband is preferred. Since a 20-nm transmission window is sufficient even for uncooledDFB lasers, the 10GEPON standard defines the lowest block of a 20-nm transmis-sion window (i.e., 1260 to 1280 nm) for 10G-ONUs. The remainder of the 80-nmtransmission window is reserved for future use.
In the downstream direction, the downstream wavelength is selected both toavoid collisions with legacy downstream signals and to minimize additional opticaltransceiver components in the ONU. Similar to the G.984.5 wavelength enhancementstandard, 10GEPON ONUs are required to install a bandpass filter (BPF) to filter outlegacy signals, including video signals at the 1550 to 1560-nm spectrum. As a result,the standard settles on the wavelength range 1575 to 1580 nm to minimize the costand insertion loss caused by the BPF. Five nanometers of the transmission windowis selected for a cooled 10-Gb/s DFB laser.
3.6.2 10GEPON MAC Modifications
To ensure maximum compatibility toward legacy 1GEPON systems, the IEEE802.3av standard makes few modifications even to MAC layer operations. Thus,the structure of both upstream and downstream Ethernet framing are in principlepreserved. However, the addition of the new FEC option, the 64b/66b line code, and

IEEE 802.AV-2009 10GEPON STANDARD 159
their combination do require corresponding changes in the framing process to ensureproper synchronization. In addition, the potential mix of 1G- and 10G-capable ONUswould also require a modified MPCPDU for the OLT to properly acquire ONU’stransmission capability.
3.6.2.1 10GEPON Framing with FEC Consideration Due to 64b/66b linecoding, each code block in the 10G signal is taken as 66 bits. FEC encodes the outputof the line coding block and operates on each code block. Since RS(255,223) isemployed, each FEC code word can operate on 27 blocks (222B + 6b) of payloadand generate four blocks of parity checks.
In the downstream direction, the ONU should synchronize on the boundary ofboth the 66b code block and the FEC code word boundary. Since the FEC code wordis aligned to the code block, finding the FEC code word would also implicitly locatethe code block boundary. As a result, the ONU could rely on a simple code wordsynchronization process that could lock to the 31-block pattern within about 6 µs. The6-µs synchronization time is considered trivial considering the much larger overheadby the autodiscovery process. The code word synchronization process uses a circularbuffer with a 32 FEC code word and searchs for a 31-block pattern with the EPONsynchronization header.
Upstream burst framing is modified to enable for OLT to lock to the FEC codeword boundary on pre-FEC data. Modified upstream burst framing is illustrated inFigure 3.28. To facilitate FEC code word and 66b code block synchronization, the lastcode block in the synch time portion of the upstream burst is changed into a uniquestart of data (SOD) delimiter. However, the data scrambler would lose synchronizationduring locking to the SOD delimiter because the delimiter is not scrambled, in orderto preserve its unique pattern. As a result, two more idle code blocks are addedat the beginning of the payload section to allow the scrambler to resynchronize andthe OLT to detect a start of packet (SOP) after the scrambler gains synchronization.The last two added idle code blocks effectively increase the length of the upstreampayload section, and corresponding changes in the calculation of the upstream queueREPORT are also required to account for the expanded burst size. In addition, theupstream data detection function is modified to further delay the transmission of datato account for the added idle blocks.
High frequency pattern for fast AGC and CDR
Burst Delimiter
Burst synchpattern
FEC codeword FEC codeword
Scrambled and FEC-protected IDLE block forscrambler re-sync
Scrambled and FEC-protected IDLE block forfirst packet delineation
FIGURE 3.28 10GEPON upstream burst frame format.

160 PASSIVE OPTICAL NETWORKS: ARCHITECTURES AND PROTOCOLS
3.6.2.2 MPCPDU Modifications Some MPCP protocol is modified in theamended 802.3av standard to support corresponding changes in the PMD sublayer.For example, 10GEPON OLT/ONU units now need to learn about system transmis-sion capability during the autodiscovery process. For another example, the original1GEPON standard specifies very relaxed timing requirements: 512 ns for ONU laser-on/off time and ≤ 832 ns for AGC, CDR, and code group alignment time. It has beenobserved that all existing ONU lasers in the marketplace perform much better thanthe timing specified. However, the original standard fixes the laser-on/off guard timeand thus prevents the system from performing to its full capability. As a result, amechanism to negotiate the laser-on/off time flexibly is added to the MPCP protocolin the 10GEPON specification.
Mixed-Mode Autodiscovery Process The autodiscovery process in a mixed-mode 1G- and 10GEPON system must be able to advertise OLT’s upstream receivingcapability (1G or 10G upstream) and preferably could allow different classes of ONUto register in separate windows. To facilitate the mixed-mode autodiscovery process,the following MPCPDU control messages are modified.
� Discovery GATE. A 1-byte discovery information bitmap is added after theoriginal synchronization field to indicate OLT’s capability (bit 0) and typesof discovery window (bits 1 and 2). The discovery window could either bededicated for 1G ONU (bit 1 = 1), 10G ONU (bit 2 = 1), or both (both bits setto 1). The reason for differentiating the autodiscovery window is to prevent theONU from attempting registration during the discovery window, where it hasno chance of succeeding.
� REGISTER REQ. A 1-byte discovery information bitmap is added after theoriginal pending grants field. This bitmap is symmetrical to the one added inthe discovery GATE message and serves a similar purpose.
Adjustable Laser-On/off Time To facilitate flexible adaptation of ONU laser-on/off time into upstream burst guard time, the IEEEP802.3av task force consideredtwo options. The first was to use OAM query through the OMCI channel, and thesecond was to incorporate the ONU/OLT exchange within the MPCP protocol. Thelatter option was selected because it allows the OLT to learn the ONU burst guard timeparameter from the beginning. Since the MPCP state machine would be modified in10GEPON, adding other minor changes would not add significantly to the cost. Themodified MPCPDU control messages are:
� REGISTER REQ. A 2-byte laser-turn-on time (1B) and laser-turn-off time (1B)by which information is added after the newly added discovery informationbitmap.
� REGISTER ACK. The OLT echoed the received laser-turn-on/off time using asymmetrical 2-byte field in the REGISTER ACK message.

IEEE 802.AV-2009 10GEPON STANDARD 161
Broadcast LLID The standard specifies a different broadcast LLID for the 10Gbroadcast channel (0x7FFE16) and the 1G broadcast channel (0x7FFF16). The pur-pose of the unique broadcast LLID assignment is to simplify Ethernet switching inthe OLT, which is expected to support a mix of 10G (XUAI–XGMII interface) and1G channels.
3.6.3 10GEPON Coexistence Options
Future 10GEPON systems are expected to gradually replace the 1GEPON system.During the upgrading process, a mixture of 10GEPON (with mixed 1G and 10Gupstream transmission capability) and legacy 1GEPON ONUs are expected to sharethe same optical distribution network infrastructure. As a result, a coexistence-capableoption is desirable to allow both systems to serve over the same physical infrastructure.
3.6.3.1 10GEPON Coexistence Architecture The 10GEPON coexistencearchitecture depends on a hybrid WDM–TDMA technique. In the downstream di-rection, 10GEPON signals are transmitted over the range 1575 to 1580 nm and a10G-ONU uses a BPF to filter out the 10G signal over a legacy signal. A legacy ONUwould, however, also need to install a new wavelength-blocking filter to block outthe 10G signal at the time of the first 10G signal upgrade.
There are more possibilities in the upstream direction because a 10GEPON ONUcould transmit at either 1 or 10 Gb/s, or both. The 10GEPON PMD specificationsintentionally set ONU transceiver characteristics similar to those used by 1GEPON.As a result, 10GEPON ONUs would transmit in the 1260- to 1280-nm transmissionwindow and overlap with the original 1G signal. To multiplex the signal in the timedomain, the system would use a dual-rate TDMA scheme to separate a 10G signalburst from a 1G signal burst (the operation to multiplex a new 1G signal and a legacy1G signal is trivial). In this scenario, OLT needs to employ a dual-rate-capable APDreceiver.
3.6.3.2 Coexistence Options Using a downstream WDM overlay and an up-stream TDMA technique, 10GEPON can offer a number of coexistence options.Table 3.12 summarizes the plausible 1G- and 10GEPON coexistence options.
TABLE 3.12 1G- and 10G-EPON Coexistence Options
Downstream Transmission Upstream Transmission ONU Supported Type
2 λ Single rate 1G-EPON10G-PRX-EPON (1G US)
1 λ (1570–1580 nm) Dual rate 10G-PRX-EPON (1G US)10G-PR-EPON (10G US)
2 λ Dual rate 1G-EPON10G-PRX-EPON (1G US)10G-PR-EPON (10G US)

162 PASSIVE OPTICAL NETWORKS: ARCHITECTURES AND PROTOCOLS
Overall, the IEEE 802.3av standard defines the 10GEPON PMD parameters andsome MAC and MPCP modifications. The objective of the specification is to en-courage the use of low-cost optical components and enable architecture that couldbe backwardly compatible with existing 1GEPON systems. Like its IEEE 802.3ahpredecessor, this first version of this IEEE 802.3av specification leaves many areasopen to vendor innovation. Some of the newer issues, such as designs of a high-performance OLT dual-rate receiver and mixed-mode DBA scheduling, could createinteresting new research areas for future study.
3.7 NEXT-GENERATION OPTICAL ACCESS SYSTEM DEVELOPMENTIN THE STANDARDS
Interest in pursuing a more capable next-generation optical access (NGA) networkis already evident by the ratification of ITU-T G.984.5 (WDM), G.984.6 (reachextension), and IEEE 802.3av (10GEPON) standards. One of the major drivingforces in NGA is further reduction in the operating expense and capital expense ofoptical access networks. Despite the use of different approaches, the objectives ofthese new standards are similar. They all look to support more users, over a longerreach, at a faster rate, and at lower cost.
3.7.1 FSAN NGA Road Map
To classify NGA development based on the expected demand and maturity of thenecessary technology, FSAN further specifies two generations of NGA network.Figure 3.29 shows the FSAN NGA road map. Backward compatibility is the keyto NGA-1 networks, which could be further classified into single-wavelength down-stream or upstream bit-rate enhancement or WDM. ITU-T G.984.5 and IEEE 802.3avstandards could all be considered as NGA-1 types of networks. In addition, FSAN alsopredicts the demand for such networks in the future. With the expectation that better
G PON
NG-PON1 incl.long-reach option
NG-PON2E.g. Higher-rate TDM
DWDMElect. CDMOFDM, etc.WDM option to
enable overlaid G/XGPONand/or PtoP overlay
XG PON(US: 2.5G or 10G,
DS: 10G)
Optical power splitter deployed for Giga PON(no replacement/no addition)
Splitter for NG PON2(Optical splitter orsomething new)
Equipment
be common
as much as
possible
Co-existence
Now ~2010 ~2015
Cap
acity
FIGURE 3.29 FSAN NGA road map.

NEXT-GENERATION OPTICAL ACCESS SYSTEM DEVELOPMENT IN THE STANDARDS 163
TABLE 3.13 Summary and Comparison of ITU-T G.984.5, G.984.6, and IEEE 802.3avStandards
Characteristics 802.3av G.984.5/6
DS bit rate (Gb/s) 10DS wavelength (nm) 1575–1580 1524–1635US bit rate (Gb/s) 10/1US wavelength (nm) 1260–1280 1260–1360Max. loss budget (dB) 29 28/55Max. reach (km) 20 20/60DS coexistence WDM WDMUS coexistence TDMA WDMOLT requirement Dual-rate receiver
components and technology would become available in the future, NGA-2 networksare not constrained by existing ODN parameters. NGA-2 may very well use a newfiber network and, for example, employ arrayed waveguide grating (AWG) in placeof a passive splitter. The ITU-T G.984.6 recommendation is considered an early typeof NGA-2 network, as it is expected to use optical amplifier technology to supportODNs with up to a 60-km logical reach distance. Table 3.13 further summarizes andcompares these recently ratified NGA standard options.
3.7.2 Energy Efficiency
In response to a growing awareness of the energy consumption issue in telecommu-nication networks, both the ITU-T and IEEE standard bodies have proposed studiesof energy-saving techniques for PONs. Conserving energy is not only a noble causefor the operators but a realistic one as well. This is because a significant amountof energy is expected to be consumed by the access segment of the network in thefuture. Figure 3.30 illustrates the breakdown of energy consumption in the currentcore/metro/FTTH network hierarchy.
As the computations in the figure illustrate, the majority of energy consumed ina future network could reside in the ONU. To combat the problem, the ITU-T isexploring a dozing-mode option that would put POTS into a low-energy-consumingrole but maintain operation of a 911 lifeline. The IEEEP802.3av task force alsostudied a ONU sleep-mode option that would put an ONU into a sleep mode when itis inactive. Recent proposals have suggested the feasibility of putting an ONU intoa sleep mode even when it has active traffic, by exploring the gap in current trafficallocation cycles [7].
There is also growing (or renewed) interest in consolidating the number of centralaccess offices because of the high energy footprints (and thus bills) related to centraloffice buildings. This is because significant amounts of operating expense are cur-rently being spent just to support the electrical supply and cooling of these buildings.NGA-2 long-reach PONs seem to be a promising solution that could fundamentally
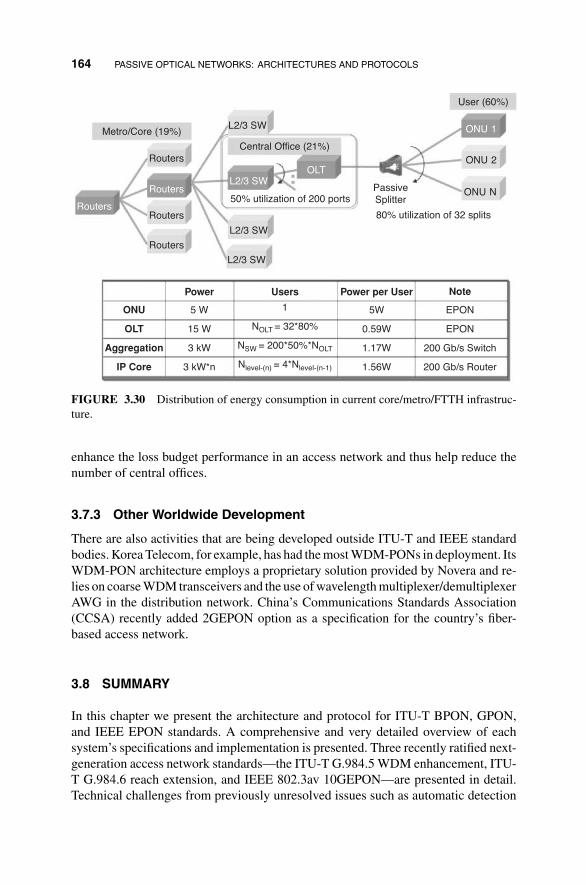
164 PASSIVE OPTICAL NETWORKS: ARCHITECTURES AND PROTOCOLS
Metro/Core (19%)L2/3 SW
Central Office (21%)
OLTL2/3 SW
50% utilization of 200 ports
80% utilization of 32 splits
PassiveSplitter
User (60%)
ONU 1
ONU 2
ONU N
L2/3 SW
L2/3 SW
Routers
Routers
Routers
Routers
ONU
OLT
Aggregation
IP Core
Power Users Power per User Note
5 W
15 W
3 kW
3 kW*n
5W
0.59W
1.17W
1.56W
1
NOLT = 32*80%
NSW = 200*50%*NOLT
Nlevel-(n) = 4*Nlevel-(n-1)
EPON
EPON
200 Gb/s Switch
200 Gb/s Router
Routers
FIGURE 3.30 Distribution of energy consumption in current core/metro/FTTH infrastruc-ture.
enhance the loss budget performance in an access network and thus help reduce thenumber of central offices.
3.7.3 Other Worldwide Development
There are also activities that are being developed outside ITU-T and IEEE standardbodies. Korea Telecom, for example, has had the most WDM-PONs in deployment. ItsWDM-PON architecture employs a proprietary solution provided by Novera and re-lies on coarse WDM transceivers and the use of wavelength multiplexer/demultiplexerAWG in the distribution network. China’s Communications Standards Association(CCSA) recently added 2GEPON option as a specification for the country’s fiber-based access network.
3.8 SUMMARY
In this chapter we present the architecture and protocol for ITU-T BPON, GPON,and IEEE EPON standards. A comprehensive and very detailed overview of eachsystem’s specifications and implementation is presented. Three recently ratified next-generation access network standards—the ITU-T G.984.5 WDM enhancement, ITU-T G.984.6 reach extension, and IEEE 802.3av 10GEPON—are presented in detail.Technical challenges from previously unresolved issues such as automatic detection

REFERENCES 165
of upstream denial of service attacks, as well as new ones such as mixed-modedynamic bandwidth allocation, are presented. Finally, we summarize the latest frontsin fiber access networks, including energy efficiency and deployment outside ITU-Tand IEEE specifications.
REFERENCES
1. PON standards: ITU-T G.983 for APON and BPON, G.984 for GPON, IEEE 802.3ah forEPON, and 802.3av for 10GEPON.
2. G. Kramer, B. Mukherjee, and G. Pesavento, IPACT: a dynamic protocol for an EthernetPON, IEEE Commun., vol. 40, no. 2, Feb. 2002, pp. 74–80.
3. Y. Luo, S. Yin, N. Ansari, and T. Wang, Resource management for broadband access overtime-division multiplexer passive optical networks, IEEE Network, vol. 21, no. 5, Sept.–Oct.2007, pp. 20–27.
4. M. Hajduczenia, P. Inacio, H. de Silva, M. Freier, and P. Monteiro, On EPON securityissues, IEEE Commun. Survey Tutorials, vol. 9, no. 1, 1st quarter 2007, pp. 68–83.
5. IEEE P802.3av Task Force, 10Gb/s, Ethernet Passive Optical Network Archive, http://www.ieee802.org/3/av/.
6. 802.3av-2009, IEEE Standard for Information Technology, Part 3, Amendment 1, PhysicalLayer Specification and Management Parameters for 10Gb/s Passive Optical Networks,Oct. 30, 2009.
7. S.-W. Wong, L. Valcarenghi, S.-H. Yen, D. Campelo, S. Yamashita, and L. Kazovsky,Sleep mode for energy saving PONs: advantages and drawbacks, presented at the 2nd IEEEGreenComm Workshop, Nov. 2009.

CHAPTER 4
NEXT-GENERATION BROADBANDOPTICAL ACCESS NETWORKS
In Chapters 1 to 3 we presented an overview of several broadband access technologies,the basic components and systems that are used in optical communications, and thecurrent network architectures and protocols for time-division multiplexed passiveoptical networks (TDM-PONs), including BPON, GPON, EPON, and 10GEPON.
In this chapter we present and discuss further development of passive opticalnetworks. We start by taking a look at the evolution paths currently envisioned forTDM-PON networks, mostly in terms of bandwidth increase and reach extension.Then we discuss wavelength-division multiplexed passive optical network (WDM-PON) components and network architectures that have been developed in researchlaboratories and have been used in a few trial deployments around the world. TheseWDM-PONs can provide much higher bandwidths to customers by making use ofmany wavelengths, in contrast to TDM-PONs, which have just one wavelength fordata transmission in each direction (downstream and upstream).
We then present an overview of research hybrid TDM/WDM-PON network archi-tectures. These network architectures allow for a progressive evolution from TDM-PON to WDM-PON. By the time WDM-PON network start being deployed, a con-siderable number of TDM-PON deployments will be in place. Thus, WDM-PONnetworks would ideally make use of the outside plant deployed for TDM-PONs,minimizing the changes to this plant and disturbing the current TDM-PON cus-tomers as little as possible. The hybrid TDM/WDM-PON architectures discussed inthis chapter provide a smooth upgrade path from TDM-PON to WDM-PON.
Broadband Optical Access Networks, First Edition. Leonid G. Kazovsky, Ning Cheng, Wei-Tao Shaw,David Gutierrez, and Shing-Wa Wong.C© 2011 John Wiley & Sons, Inc. Published 2011 by John Wiley & Sons, Inc.
166
TDM-PON EVOLUTION 167
We conclude by presenting briefly protocols that allow resource sharing in WDM-PON. This is useful in making it possible to share expensive WDM resources, suchas tunable lasers, among many users; this reduces the overall cost per user. Wealso discuss scheduling algorithms to provide QoS in WDM-PON networks. Thesealgorithms, and the provision of QoS, are important access deployments, where thesame connection may be used for multiple purposes and the traffic may combine data,video, and voice.
4.1 TDM-PON EVOLUTION
As we saw in earlier chapters, passive optical networks (PONs) lower network main-tenance costs from those of to active networks by eliminating the need for power-consuming elements and supporting infrastructure in the optical distribution network(ODN). TDM-PONs are reasonably priced for access deployments since they usecomponents that are relatively inexpensive for optical networks. TDM-PONs use the1490-nm attenuation window for downstream transmission and the 1310-nm atten-uation window for upstream transmission. Since the manufacturing technology for1310-nm transmitters is very well developed, the components to transmit in this rangeare inexpensive. This allows the cost of an optical network unit (ONU), of which oneis needed per customer, to be reasonable.
In the last few years, the number of TDM-PON deployments in Asia and NorthAmerica has increased considerably. In Asia the preferred technology has beenEthernet PON (EPON), (sometimes referred to as GEPON in Asia), while in NorthAmerica, deployments have used primarily broadband PON (BPON) and, more re-cently, gigabit PON (GPON) [1].
Even though the downstream and upstream data rates in EPON and GPON arerelatively high (1 Gb/s for EPON and 2.5 Gb/s for GPON), this bandwidth is sharedamong 16 to 128 users. At present, this sharing does not affect the performanceperceived by the end user. This is because, currently, most of the use of the Internetis for bursty data (e.g., HTTP browsing, SMTP e-mail, P2P file sharing, or FTP datatransfers), which can be statistically multiplexed without the end user noticing it [2].However, video and other multimedia streams are quickly becoming the predominanttype of traffic in terms of both use and traffic percentage. This is particularly sofor home subscribers, who are increasingly using online video services. Multimediastreams require high bandwidths (e.g., around 20 Mb/s are needed for a high-definitionvideo channel). This required bandwidth cannot be statistically multiplexed, sincethey are continuous data streams and can easily saturate the capacity of currentTDM-PON technologies.
Several enhancements have been proposed for TDM-PONs, which we reviewin this section. The main concern of these enhancements has been to increase thedownstream bandwidth to the customer. This can be achieved in many ways, suchas by increasing the line bit rate for everyone, which requires the simultaneousupgrade of all the customers in the network, or by increasing the line bit rate just for

168 NEXT-GENERATION BROADBAND OPTICAL ACCESS NETWORKS
new customers through electrical multiplexing or spectral line coding, enabling thecoexistence with legacy TDM-PON users.
Another important concern of research has been to extend the reach of TDM-PONsso that the area covered, and thus the number of users serviced by the same network,increases without needing to deploy new networks. We also present and discuss themechanisms proposed for doing this.
4.1.1 EPON Bandwidth Enhancements
The most direct approach to enhancing a TDM-PON network capacity is to increasethe line bit rate. As discussed earlier, the P802.3av 10GEPON task force was createdto achieve speeds in the 10-Gb/s range on EPON. From a technical perspective, oneof the main challenges at this data rate is to support burst-mode transmission in theupstream direction at the optical line terminal (OLT). It is difficult to achieve this withcurrent conventional integrated-circuit technology [3]. Even if this technical difficultyis overcome or an alternative technology such as silicon germanium is developed tomeet this requirement, the cost might be too high for access networks. Because ofthis, the 802.3av task force plans to standardize an asymmetrical version with 1-Gb/sdata rate in the upstream direction.
In addition to the 10-Gb/s burst-mode transmission issue, service providers needto ensure that the enhanced rate signals can coexist with the existing signals if theyplan to gradually upgrade their existing subscriber base to the higher rate services.An abrupt service upgrade to all existing subscriber bases would require a new ONUfor every existing user before the enhanced rate service could be deployed.
It has been shown that the signals can be effectively separated using electricmultiplexing or spectral line coding [4]. Both approaches, however, have disadvan-tages. Electrical multiplexing, which inserts higher-data-rate frames between existingframes, requires each new ONU to be equipped with a multirate clock recovery cir-cuit. In addition, scrambling coding standards and forward error correction (FEC)schemes need to be extended. The effects of fiber dispersion at 10 Gb/s also need tobe considered.
Due to the disadvantages of same-wavelength overlaying, enhanced rate signalscould be launched at new wavelengths outside of the upstream and downstream basicbands. This, in effect, would mean that WDM techniques would be needed.
4.1.2 GPON Bandwidth Enhancements
WDM enhancement is a promising way to make better use of the deployed fibercapacity and provide new network services. Service providers can provide premiumservices to a subset of users on additional CWDM or DWDM wavelengths, differentto the upstream and downstream basic bands (1260 to 1360 and 1480 to 1500 nm,respectively). The preferred wavelength range for WDM enhancements is 1530 to1605 nm, since in this window there is low attenuation in commonly deployedstandard single-mode fiber (ITU-T G.652 and it corresponds to the erbium-dopedfiber amplifiers’ (EDFAs) gain window.

TDM-PON EVOLUTION 169
The ITU G.983.3 amendment specifies two options for the enhancement band:1539 to 1565 nm for digital services or 1550 to 1560 nm for video distribution.For example, in the United States, Verizon uses the 1550-nm overlay to provide RFbroadcast video signals [5].
In order to allow coexistence, WDM enhancements in GPON require wavelengthblocking filters to avoid interference with the downstream basic band at the ONUs. Inanticipation of future WDM enhancements, the full service access network (FSAN)working group is contemplating standardization through the ITU of such blockingfilters to make legacy GPON ONUs blind to new WDM wavelengths [6].
4.1.3 Line Rate Enhancements Research
Service providers who have already invested in PON deployments require TDM-PONenhancement plans that will minimize upgrading costs and avoid disturbing existingcustomers. Table 4.1 summarizes the two most likely techniques for line bit-rateenhancements without disturbing current customers. Line bit-rate enhancements arethose that increase data transmission speeds over the links. In contrast, WDM en-hancements, which we discuss in the following sections, use new optical wavelengthsfor data transmission.
The electrical multiplexing technique consists of making use of the empty down-stream windows that are not being used at the current rate (e.g., 1 Gb in EPON) totransmit data at a much higher rate (e.g., 10 Gb). In this case, legacy ONUs are sup-ported, since they simply will not be able to receive the higher-bit-rate transmission.The issue with the new OLT and ONUs to support this technique is that they requirehaving the ability to clock and data recovery at the two different rates.
The spectral line coding technique refers to making use of the available electricalsignal spectrum to simultaneously transmit legacy bit-rate and higher bit-rate streamsas discussed in the following section.
4.1.3.1 SUCCESS-LCO Service Overlay In this section we discuss the ser-vice overlay technique to increase the bandwidth of passive optical networks, asdescribed by Hsueh et al. [4]. Consider the network architecture shown in Figure 4.1,in which a new OLT and new ONUs share the same infrastructure with the existingequipment. It is not trivial to smoothly upgrade the downstream service. In conven-tional TDM PON, existing ONUs typically have a broadband transmit/receive opticalfilter (1300 nm/1500 nm), as opposed to a narrowband wavelength-selective filter.
TABLE 4.1 TDM-PON Line Bit-Rate Enhancements
Technique Advantages Disadvantages
Electrical multiplexing Supports legacy ONUs New OLT/ONUs require multirateclock and data recovery.
Spectral line coding Supports legacy ONUs; simplesoftware implementation
Lower efficiency due to coding

170 NEXT-GENERATION BROADBAND OPTICAL ACCESS NETWORKS
Baseband transmissionat a certain wavelength
Coded signal atanother wavelength
Coexistence of signals
PD
PD: Photo DectectorLPF: Low Pass FilterWDM: WDM filter
LPF
OLTOLDONUOLD
OLTNEW
ONUNEW
Popt
λ
Received electrical signal
Received signal
Received signal
Pelect
f
Popt
λ
Popt
λ
PD LPFWDM Pelect
f
Pelect
f
FIGURE 4.1 Upgrading existing TDM-PON using an overlay.
Therefore, any enhancements must take into account that existing ONUs will see allwavelengths that make it onto their leg of the distribution fiber.
To enable a smooth upgrade and service coexistence, three techniques are dis-cussed in [4]: (1) launching new services in new wavelengths and retrofitting theexisting equipment and/or infrastructure; (2) using a subcarrier multiplexing (SCM)technique to move the spectrum of the new service out of the baseband of existingONU; and (3) using spectral line coding to shape the spectrum of the new ser-vice to minimize its interference with existing users. Compared to the spectral linecoding technique, the first two methods are less favorable, due to the cost of hard-ware replacement and optical/electrical components. In principle, using spectral linecode enables a graceful upgrading path without replacing existing PON equipment.During the upgrading period, only end users demanding enhanced services are re-quired to replace their equipment. Line codes are flexible and can be reconfiguredwhenever necessary. Therefore, researchers focused on investigating the spectral linecode technique to allow for the coexistence of the existing lower-bit-rate signal andhigher-bit-rate overlay signal.
In an effort to capitalize on the advantages of both SCM and WDM, novel linecodes were developed that suppress low-frequency components while maintainingdc balance [4]. The goal is to push the frequency content of the new high-bit-ratestream out of the baseband of the existing signal with minimal overhead. Figure 4.1illustrates the spectral-shaping line codes assisted with WDM to provide a gracefulupgrade for PONs. The existing OLT sends its traffic in nonreturn-to-zero (NRZ)

TDM-PON EVOLUTION 171
Dn raw data
Sn coded signal
Processing Window
: xn inserted bits
FIGURE 4.2 Coding hierarchy, consisting of a processing window, cells, data bits, andinserted bits.
format at a certain downstream wavelength. The new OLT, on the other hand,transmits its traffic at another wavelength, and the spectral power in the basebandregion is avoided on purpose.
On the ONU side, the high-bit-rate signal from the new OLT is rejected by thelow-pass filter (LPF) in the existing ONUs, while the signal from the existing OLT isfiltered out by the WDM filter in the new ONUs. One clear advantage of this schemeis that the existing OLT, ONUs, and fiber plant remain unchanged. As subscribersupgrade their ONUs, they become members of the high-bit-rate PON. After allsubscribers upgrade their ONUs, the old OLT is removed, and the new OLT can bereconfigured to maximize the data throughput.
The basic idea of the proposed line-coding technique is periodical insertion ofextra bits to tailor the spectral shape of the coded signal. The data stream is dividedinto fixed-length processing windows of L bits (e.g., L = 256), which consist ofsmall cells of C bits (e.g., C = 8). Figure 4.2 shows the coding hierarchy. A long pro-cessing window ensures long-term spectral properties, while small cells simplify bitprocessing. The processing windows can be partially overlapped, but the differencebetween overlapping and nonoverlapping windows is insignificant for reasonablewindow sizes. A cell contains data bits from the raw data stream and the inserted bitswhose values are to be determined. Data bits and inserted bits are located in prede-fined positions in each cell. Decoding on the receiver side is straightforward: simplyextracting data bits from their predefined positions in each cell. During networkpower-up or upon system reconfiguration, cell-level synchronization and signalingare necessary for the receiver to acquire correct positions of data bits in the bit stream.Details regarding the algorithm and analysis of the spectral line code are provided inthe article by Hsueh et al. [4].
Finally, Figure 4.3 depicts the experimental setup used to compare four differentoverlay schemes, each with different efficiency and spectral overlap. The authorschose to compare codes at the same baud rate (10 Gbaud/s) because the baud rate isdetermined by the hardware. Under the same hardware constraint, one can easily tunethe data rate by reconfiguring the line code in firmware or software. In all cases, the1-Gbaud/s baseband signal source emulating existing service is a bit-error-rate tester(BERT) BERT1, which modulates the distributed-feedback (DFB) laser DFB1. The
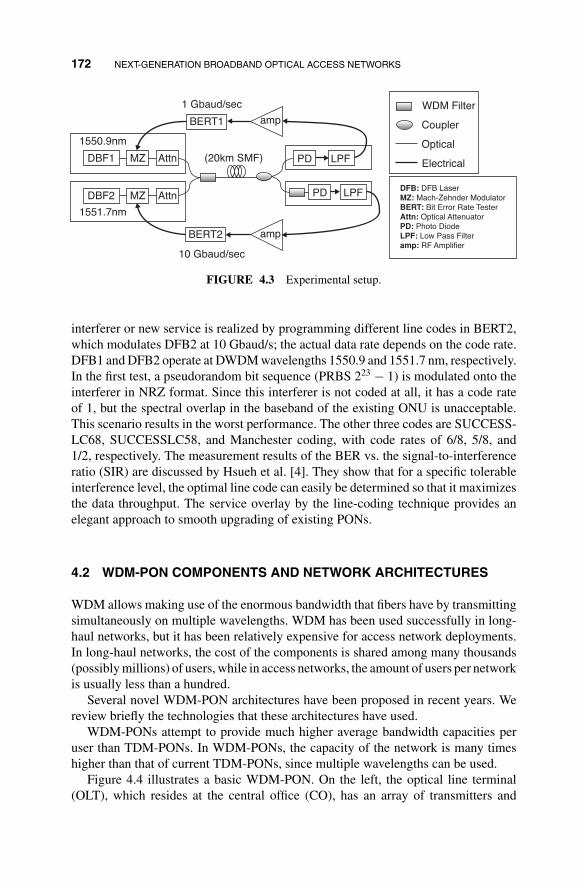
172 NEXT-GENERATION BROADBAND OPTICAL ACCESS NETWORKS
PD LPF
1 Gbaud/sec WDM Filter
Coupler
Optical
Electrical
DFB: DFB LaserMZ: Mach-Zehnder ModulatorBERT: Bit Error Rate TesterAttn: Optical AttenuatorPD: Photo DiodeLPF: Low Pass Filteramp: RF Amplifier
10 Gbaud/sec
1550.9nm
DBF1 MZ Attn
BERT1
(20km SMF)
amp
BERT2
1551.7nm
DBF2 MZ Attn
amp
PD LPF
FIGURE 4.3 Experimental setup.
interferer or new service is realized by programming different line codes in BERT2,which modulates DFB2 at 10 Gbaud/s; the actual data rate depends on the code rate.DFB1 and DFB2 operate at DWDM wavelengths 1550.9 and 1551.7 nm, respectively.In the first test, a pseudorandom bit sequence (PRBS 223 − 1) is modulated onto theinterferer in NRZ format. Since this interferer is not coded at all, it has a code rateof 1, but the spectral overlap in the baseband of the existing ONU is unacceptable.This scenario results in the worst performance. The other three codes are SUCCESS-LC68, SUCCESSLC58, and Manchester coding, with code rates of 6/8, 5/8, and1/2, respectively. The measurement results of the BER vs. the signal-to-interferenceratio (SIR) are discussed by Hsueh et al. [4]. They show that for a specific tolerableinterference level, the optimal line code can easily be determined so that it maximizesthe data throughput. The service overlay by the line-coding technique provides anelegant approach to smooth upgrading of existing PONs.
4.2 WDM-PON COMPONENTS AND NETWORK ARCHITECTURES
WDM allows making use of the enormous bandwidth that fibers have by transmittingsimultaneously on multiple wavelengths. WDM has been used successfully in long-haul networks, but it has been relatively expensive for access network deployments.In long-haul networks, the cost of the components is shared among many thousands(possibly millions) of users, while in access networks, the amount of users per networkis usually less than a hundred.
Several novel WDM-PON architectures have been proposed in recent years. Wereview briefly the technologies that these architectures have used.
WDM-PONs attempt to provide much higher average bandwidth capacities peruser than TDM-PONs. In WDM-PONs, the capacity of the network is many timeshigher than that of current TDM-PONs, since multiple wavelengths can be used.
Figure 4.4 illustrates a basic WDM-PON. On the left, the optical line terminal(OLT), which resides at the central office (CO), has an array of transmitters and

WDM-PON COMPONENTS AND NETWORK ARCHITECTURES 173
TX1
RX1
TX32
RX32
TX1
λ1
λ1
λ32λ32
RX1
TX32
RX32
ONU32
ONU1OLT
SMF
MUXDEMUX
MUXDEMUX
FIGURE 4.4 Basic WDM-PON.
receivers. Each transmitter–receiver pair is set at the wavelength band of the port ofa multiplexing device to which the pair is connected. In this case, the multiplexingdevice is an arrayed waveguide grating (AWG). In this example, ONUn transmits andreceives on wavelength λn . A single-mode fiber (SMF) connects the OLT AWG toanother AWG in the distribution network. Each port of the second AWG is connectedto a different ONU. Each ONU has a passive splitter that is connected on one endto a transmitter and on the other to a receiver. In this particular architecture, thereceiver need not be wavelength selective; however, the transmitter needs to be setat the particular wavelength of the AWG port to which it is connected. It is worthnoting that the distribution network may include multiple AWGs cascaded to increaseflexibility, as discussed by Maier et al. [7].
For optical transmitters, conventional laser diodes such as Fabry–Parot (FP) lasers,distributed feedback (DFB) or distributed Bragg reflector (DBR) lasers, and verticalcavity surface emitting lasers (VCSELs) are normally used under direct modulation.Optical receivers generally use PIN detectors or avalanche photodiodes (APDs) forphotodetection. Passive splitters can be implemented with fused fibers or planarlight-wave circuits (PLCs), and athermal AWGs are commonly used as multiplexers/demultiplexers.
In the following sections we discuss some of the most important enabling tech-nologies for WDM-PON and the corresponding network architectures.
4.2.1 Colorless ONUs
Architecture such as the one described in Section 4.4 is quite expensive for accessnetworks, and having a separate ONU for each PON customer creates an inventoryproblem. Cost-effective implementation of WDM light sources at the ONU sideis necessary for WDM-PONs. They also need to be colorless, that is, wavelengthindependent, so that the equipment is the same across all customers. If the ONUs arenot colorless, the service provider would need to have multiple types of replacementONUs in stock and would need to arrange a particular type of ONU for each customer.
174 NEXT-GENERATION BROADBAND OPTICAL ACCESS NETWORKS
For example, customer 7 might only be able to use ONUs that operate on λ7 insteadof being able to use a generic colorless ONU. This creates additional installation,operational, and maintenance expenses for the service provider and, ultimately, forthe end user.
Several approaches have been proposed and demonstrated for the implementationof colorless ONUs in WDM-PONs, such as a spectral sliced broadband light source,an injection-locked Fabry–Parot (FP) laser, or a reflective semiconductor opticalamplifier (RSOA). The wavelengths of these light sources are not determined by thegain media but by external factors: optical filters or injected signals. As a result, thewavelengths are easier to manage without worrying about temperature changes oraging effects in the ONUs.
A lot of research has gone into making RSOAs, currently the technology of choicefor colorless ONUs [8]. We discuss RSOAs in a centralized light sources architecturebelow. Some of the main issues that RSOAs have for this purpose are their noise levelsand the speed at which they can be modulated. The reach that they can provide is alsomore limited than in technologies with a light source in the ONU, since they have todeal with back-reflection Rayleigh backscattering in the upstream transmission [9].These issues may eventually justify the use of tunable lasers at the ONU. Tunablelasers are also a colorless ONU option, since all the ONUs can be identical, with eachone tuning to a different wavelength. However, the main issue in this case is the costof the components. Other options that have been considered are electroabsorptionmodulators (EAMs) and reflective electroabsorption modulators (REAMs) [10].
4.2.2 Tunable Lasers and Receivers
We now discuss the feasibility of using tunable lasers and receivers for WDM-PONand the resulting network architecture.
4.2.2.1 Tunable Lasers Tunable light sources provide flexibility and reconfig-urability for network provisioning, minimize production cost, and reduce the backupstock required. Commonly used options for tunable lasers (TLs) are external cavitylasers, multisection DFB/DBR lasers, and tunable VCSELs. Due to cost concerns, it isdesirable that tunable lasers be modulated directly, not through external modulators.
An external cavity laser is usually tuned by changing the characteristics of theexternal cavity, which consists of a grating or FP etalon. The tuning ranges of externalcavity lasers are extremely wide, covering a few hundred nanometers. However, thelong cavity length prevents high-speed direct modulation, so external cavity lasersare not suitable for fiber optic communications. Tuning speed and stability are alsoissues with external cavity lasers.
Traditional DFB or DBR lasers can support high-speed direct modulation andbe thermally tuned over a few nanometers. However, the tuning speed is limitedto the millisecond range. Multisection DFB/DBR lasers usually consist of three ormore sections: an active (gain) section, a phase control section, and a Bragg section.Wavelength tuning is achieved by adjusting the currents in the phase-control andBragg sections. Using multisection DFB or DBR lasers, the tuning speed can reach

WDM-PON COMPONENTS AND NETWORK ARCHITECTURES 175
nanoseconds by current injection, and tuning ranges over tens of nanometers can beachieved. Some multisection DFB/DBR lasers with sampled gratings can be tunedover 100 nm [11]. The disadvantages of multisection DFB/DBR lasers are modehopping and complicated electronic control.
VCSELs emerged as a new type of semiconductor lasers in the 1990s. A typicalVCSEL consists of a layer of gain medium sandwiched between two oppositely dopeddistributed Bragg reflectors. VCSELs have a potential for low-cost mass productionbecause of simple one-step epitaxy and on-chip testing. However, the developmentof long-wavelength VCSELs has been hindered by the unsatisfactory optical andthermal properties of InP-based group III to V materials. New designs using differentmaterials and dielectric mirrors have led to successful development of 1.3- and 1.5-µmVCSELs. A primary tuning mechanism for VCSELs uses a MEMS structure thatchanges the cavity length through electrostatic control. The tuning speed can be afew microseconds and the tuning range can reach 10 to 20 nm [12]. As its fabricationmatures, VCSELs will be a strong candidate for access networks.
4.2.2.2 Tunable Receivers A tunable receiver can be implemented using atunable optical filter and a broadband photodiode. Although this approach provides asimple solution, it can be bulky and expensive. As an alternative, CMOS-controlledtunable photodetectors with an integrated filtering mechanism in the photon-detectionprocess have been reported [13]. The device consists of a few metal–semiconductor–metal detectors laid side by side with interleaved metal fingers. As multiple wave-lengths impinge on the photodetector, different wavelengths form different fringepatterns. When a specific biasing pattern is applied to the biasing fingers, the photode-tector can select one wavelength while canceling out the rest. Since the wavelengthof this device is set electronically, the tuning time is essentially limited by the elec-tronics switching time, which is on the order of nanoseconds. The channel spacingis limited by the coherence length of the laser system, and can be much less than thestandard 50-GHz DWDM requirement. The detecting algorithm for the device canbe applied to either 1550- or 850-nm optical systems. In addition, this device allowsspectral shaping to adapt to specific system applications.
The disadvantage of this device is a limited scalability of the integrated interfer-ometer. In order to have satisfactory spectral responses, the device needs to havean integrated interferometer that generates a few harmonic interference patterns si-multaneously. This interferometer will become more complicated as the wavelengthnumber in the access network scales up. It thus prevents a single device from beingapplied in a large access network. This limitation can be relaxed by the proper designof access network architectures.
4.2.2.3 Network Architectures Figure 4.5 shows what a WDM-PON withtunable lasers and receivers would look like. It would be very similar to Figure 4.4,except that in this case each laser and receiver can be tuned to whatever wavelength hasbeen assigned to that ONU. That is, each ONU is colorless using tunable components.The TLs would need to cover a wide range of DWDM channels, as many as the rangeof the AWG MUX/DMUX. The wavelength output of the TL needs to be precise in

176 NEXT-GENERATION BROADBAND OPTICAL ACCESS NETWORKS
SMF
OLT ONU1
ONU32
MUXDEMUX
MUXDEMUX
TX
RX
λ1
TX
RX
TX
RX
TX
RX
λ32
λ1
λ32
FIGURE 4.5 WDM-PON with tunable lasers and receivers.
order to stay within the AWG port band to which it connects. Thus, tunable laserdiodes require expensive temperature-stabilization control circuitry. Even thoughhaving identical ONUs solves the inventory problem, the cost of these tunable devicesat the moment is too high to be cost-effective for access. On the other hand, employingTLs in the CO can be economically feasible when they are time-shared among users.
4.2.3 Spectrum-Sliced Broadband Light Sources
A comb of optical signals, each with a unique wavelength, can be achieved byslicing the spectrum of a broadband light source. The broadband light source canbe a superluminescent light-emitting diode [14], EDFA [15], or FP laser [16]. Forwavelength selection, an AWG, usually deployed at the remote node, will slice anarrow spectrum of the broadband optical signals, and different wavelengths will beselected for different ONUs. If a tunable filter is used, the wavelengths of the opticalcomb can be tuned.
Network Architectures The spectral slicing technique was first used [17] fordownstream transmission, and later [14,18,19] for upstream transmission. Figures 4.6and 4.7 illustrate the downstream and upstream transmission with a broadband lightsource (BLS) using a spectral slicing approach. We describe the upstream case; thedownstream case is analogous, just in the reverse direction. Note that the AWGhas cyclic properties, so if both systems were to coexist (i.e., BLS with spectrumslicing was used in both directions), the wavelength range could be different in eachdirection to avoid issues with backreflections and Rayleigh backscattering in the samewavelength.
In the upstream case, each ONU has a BLS that is modulated with upstream data.Upon reaching the WDM MUX/DEMUX, the spectrum of each ONU is “sliced.”After that, multiple data streams can be multiplexed onto the distribution networkfiber. At the OLT, the signals are demultiplexed and a separate receiver is used foreach ONU.

WDM-PON COMPONENTS AND NETWORK ARCHITECTURES 177
λλ
BLS
BLS
ONU1
ONUN
λ
Popt
λ
PoptPopt
Popt
λ
Popt
SMF
RX1
RXN
OLT
AWG AWG
FIGURE 4.6 Broadband light sources WDM-PON: downstream transmission.
Compared to the WDM MUX/DMUX, the BLS spectrum should be sufficientlywide and its output power large enough so that even after being spectrally sliced(which leads to significant optical power loss, e.g., 10 dB [18]), the remaining powerwill still be enough to traverse the feeder fiber (about 20 km by current standards).This, added to the coupling, connectors, and devices losses, may induce up to 20 to30 dB of additional loss after spectral slicing.
A sharp filtering profile is necessary in the WDM MUX/DMUX to reduce thecrosstalk between adjacent channels. Another issue with the AWG is its thermalsensitivity. Since these devices are placed in the outside plant and not powered,
λλ
λ
λ
RX1
RXN
ONU1
ONUN
Popt
PoptPopt
Popt
λ
Popt
SMF
BLS
BLS
OLT
AWG AWG
FIGURE 4.7 Broadband light sources WDM-PON: upstream transmission.

178 NEXT-GENERATION BROADBAND OPTICAL ACCESS NETWORKS
their wavelength properties should be insensitive to temperature changes. Theoreticalanalysis and experimental results [20] have shown that the adjacent-channel crosstalkcan be a problem for this technique.
The main advantages of spectral slicing are simple implementation and low cost.The disadvantages are limited modulation speed, low power, and incoherent outputthat limits the transmission span.
A BLS with spectral slicing introduces some limitations to the network topology aswell. In particular, the signals from different ONUs share the same spectrum. There-fore, they cannot be combined until after they have been spectrally sliced at the AWG;otherwise, upstream traffic collisions may occur. This reduces the flexibility of thenetwork, since some TDM-PON deployments have more than just one splitting point.
4.2.4 Injection-Locked FP Lasers
When an external narrowband optical signal is injected into a multiple-longitudinal-mode laser such as an FP laser, the lasing mode can be locked to a single mode.The external optical signal acts as a seed for laser oscillation in the FP cavity, andthe mode that is the nearest the peak wavelength of the injected optical signal willbe locked to the injected light and other modes will be suppressed, as shown inFigure 4.8 [21]. The injected optical signal can be a spectral sliced broadband light
0
–20(a)
(b)
(c)
–40
–60
0
–20
–40
–60Pow
er (
dBm
)
013 mA0 mA–20
–40
–60
1545 1550
Wavelength (nm)
1555 1560
FIGURE 4.8 Injection locking a Fabry–Perot laser. (From [25].)

WDM-PON COMPONENTS AND NETWORK ARCHITECTURES 179
ONU1
ONUN
Up BiDiN
Up BiDi1
Down BiDiN
Down BiDi1
OLT
SMF
AWGAWG
3-dBCoupler
Up BLS
UpSLD
UpBPF
Down BLS
DownSLD
DownBPF
FIGURE 4.9 Injection-locked FP laser WDM-PON. (From [26].)
source (e.g., ASE) [22] or a modulated downstream signal [23]. The advantages ofusing injection-locked FP lasers are simplicity and low cost, and the modulationspeed can be relatively high. The disadvantages are the limited wavelength lockingrange, high power required, and questionable stability. The modulation index, laserbias current, and power of external optical excitation must be chosen carefully tomaximize the efficiency of injection-locked FP lasers [24].
Network Architectures Several network architectures have been reported basedon injection-locked lasers [16,26], and even an actual deployment by Novera andKorea Telecom in Korea uses this technology [27]. Figure 4.9 shows an example inboth the downstream and upstream directions. At the CO, the upstream BLS generatesoptical power that is sent downstream. This optical power is sliced by the remoteAWG and is used to injection-lock the ONU FP laser. The locked FP laser is thenmodulated and the data are sent in the upstream direction.
In this architecture, higher optical injection power is required for a higher datarate to achieve colorless operation [26]. Since the signal is transmitted on the samewavelength as the injection seed light, the BLS power cannot arbitrarily increasebecause of Rayleigh backscattering and reflections. The scalability of this architectureneeds further investigation.
4.2.5 Centralized Light Sources with RSOAs
Another alternative for colorless ONUs is to use centralized light sources (CLSs) atthe OLT, as shown in Figure 4.10. In this approach, no light source is deployed atthe ONUs; the OLT provides optical signals to ONUs, where the optical signals aremodulated with the upstream data, possibly amplified, and sent back to the OLT. Sinceall light sources are located at the OLT, the requirements for wavelength provisioningand management are relaxed due to a centralized environment. The OLT manageson its own which wavelengths to use; there is no need for a wavelength assignmentprotocol between the OLT and the ONUs.

180 NEXT-GENERATION BROADBAND OPTICAL ACCESS NETWORKS
TX1
TXM
RX1
RX
RX
RSOA
SOA
RXN
OLT
SMF
AWG
AWG
Circulator
ONU1
ONUN
FIGURE 4.10 Centralized light sources: WDM-PON.
There are several options for modulating at the ONU, including Mach–Zehndermodulators, semiconductor optical amplifiers (SOAs), and reflective SOAs (RSOAs),which can all be used for upstream modulation. SOAs and RSOAs can modulateand amplify the signal simultaneously, making them preferable to an amplifier +modulator configuration, which would require two separate devices and thus extramanufacturing cost.
To transmit both downstream and upstream in a fully duplex manner in the samewavelength, various data modulation schemes have been proposed, including ASK-ASK using different power offset values, FSK-ASK, and SCM-SCM. These differentschemes provide different capabilities and limitations [8].
There are some disadvantages to the CLS approach as well. Since the transmissionin both directions is done on the same wavelength, there is some noise, particularly inthe upstream direction, due to Rayleigh backscattering or the Brillouin effect. Anotherdisadvantage is the polarization sensitivity of the RSOAs or optical modulators.Creating RSOAs that are less polarization dependent has been an important issue formanufacturers in the past few years.
Currently, RSOAs are still expensive for access networks, since they need a ther-moelectric cooler (TEC) in the same package. Manufacturers are currently workingon RSOAs based on new materials that can provide good performance without theTEC control mechanism, making them less expensive and power consuming. Thiswould also allow the RSOA to fit in a TO-CAN package, allowing for a smallerfootprint within the ONU [28]. In such a case, there would be no manufacturing lim-itations to prevent these devices from having very low costs, adequate for an ONU,when mass-produced.
Network Architectures CLS architectures were first proposed by Frigo et al. [29]and developed further by Kani et al. [30], Takesue and Sugie [31], and in the

WDM-PON COMPONENTS AND NETWORK ARCHITECTURES 181
SUCCESS-HPON architecture, which we discuss below. There has been increasedinterest in these architectures recently, due to the possibility of low-cost RSOAs. Anactual deployment of this technology in Korea was recently announced [32].
Figure 4.10 illustrates a generic CLS architecture. In this case, all the light sourcesare at the OLT. These provide optical power for both downstream and upstreamtransmission. The downstream transmission case is straightforward from the OLT,then the ODN and the ONU.
Upstream data transmission works as follows: The transmitters at the OLT providea carrier at the particular wavelength of an ONU; the ONU amplifies and modulatesthis carrier with its queued data, and sends it back upstream. A passive circulator atthe OLT directs these upstream data onto an AWG followed by an array of receivers,one for each ONU. Since traffic in opposite directions is transmitted on the samewavelength and the same fiber, Rayleigh backscattering and reflections need to beminimized throughout the network. To achieve the goals, the optical power of thecarrier needs to be high enough for upstream transmission, but limited to preventsignificant Rayleigh backscattering interference.
Clean connectors throughout the distribution network are required to minimizethe reflections. This is particularly important in this type of network, since boththe continuous wave to be modulated and the signal travel through the same fiber.Backreflections can create issues in this type of setup.
Figure 4.10 also illustrates two possible ONU designs. ONU1 has a circulatorand a splitter. Incoming data are received by a receiver that does not need to betunable while the incoming carrier is modulated and sent back. An SOA is used asan amplifier and modulator due to its potential for integration with the electronics ofthe ONU [30]. ONUN illustrates a simpler design using a one-port RSOA. Again, thedownstream data are received by a photodiode receiver while the upstream data aremodulated onto a CW by the RSOA. In a paper by Prat et al. [33], the RSOA actsas a detector as well by measuring the voltage difference produced by the change incarrier density inside the cavity.
4.2.6 Multimode Fiber
There are several architectures that employ a centralized light sources approach(e.g., [29–31,33,34]) and SUCCESS-HPON, which we discuss later in the chapter.Most of these architectures have been developed on the premise that single-modefiber (SMF) is being used in the ODN. While SMF shows high signal integrity inthe long-haul network, it takes a large amount of time and money to install SMFin the field. On the other hand, multimode fiber (MMF) is easy to install and hasalready been installed on many campuses and local area networks. Therefore, thepossibility of using MMF in an optical access network is of interest despite the factthat the bandwidth–distance product is limited by the modal dispersion in MMF.There are several efforts to increase the bandwidth–distance product. As a result,data transmission through a few kilometers at more than 1 Gb/s is already achievable,as reported [35–37]. In this section we discuss a CLS access network that includesMMF, as presented by Kim et al. [38,39]. Using physical mode confinement, the

182 NEXT-GENERATION BROADBAND OPTICAL ACCESS NETWORKS
OLT
TX
MZ
SOA
VA3dB coupler
Upstream
Downstream
SMF (15 km) SMF or MMF (1 km) ONU
Wavelengthmeter
PD
PC
PC
FIGURE 4.11 CLS + MMF experimental setup.
MMF link shows a performance comparable to that of the SMF link. The resultswere verified using BER measurements. Considering the fact that the MMF currentlyprevails in many local area networks, this architecture can expedite and complementPON deployments.
As shown in Figure 4.11, the network architecture follows the conventional frameof other centralized light source networks. To transmit a signal, a DFB laser is locatedat the OLT. Although the OLT supplies a carrier to the all ONUs, since the incomingsignal will decrease as it goes through the downstream link, we need an amplifier inthe ONU to compensate for the power budget of the overall signal path. Therefore,each ONU has an SOA and an intensity modulator to transmit the upstream signal.The upstream traffic passes through the same fiber link as does the downstreamtraffic and arrives at the receiver in the OLT. In bidirectional transmission, it hasbeen reported that the upstream signal is more degraded than the downstream signalbecause the former is more exposed in Rayleigh scattering [33]. Therefore, in thisexperiment the authors investigate only the worst case (i.e., upstream transmission).
Generally, a passive splitter is located near the ONU in the PON access network.Hence, the authors divide the entire data link into two segments. One is from theOLT to the splitter, and the other is from the splitter to the ONU. A 15-km-long SMFis placed in segment 1 and 1-km-long MMF in segment 2. The MMF has a gradedindex and a 50-µm core diameter. To connect the single-mode component, both endsof the MMF are core aligned and spliced with a small piece of SMF pigtailed by aconventional physical contact adaptor. Since the authors observe the performance of asingle ONU, the passive splitter does not give a significant effect except contributingto the power budget. Because of this, the authors do not include the passive splitter inthe experiment setup: instead, using less SOA gain. Table 4.2 summarizes the loss ofeach component in the data link. Compared to an SMF of the same length, the MMFhas additional 1.1 dB of loss caused by the core misalignment between the SMF andthe MMF connection as well as a higher-order mode filtering at the interface fromthe MMF to the SMF connection.
To create upstream data, the DFB laser in the OLT again provides a CW at1550 nm that is remotely modulated at the ONU with NRZ-coded (223 − 1)-word

WDM-PON COMPONENTS AND NETWORK ARCHITECTURES 183
TABLE 4.2 CLS + MMF Loss of Components
System OLT Segment 1 (15 km) Segment 2 (1 km) ONU
Component Circulator SMF MMF SMF Circulator PC MZ
Loss (dB) 1.42 3.1 2 0.9 1.3 1 6
PRBS at 1.25 Gb/s through the intensity modulator. The overall power budget of theround trip signal path is 23.64 dB (before the 3-dB coupler). Therefore, a 2-dBmCW is launched from the OLT and the gain of the SOA is set to 10 dB. The gain ofthe SOA can be increased with the amount of the loss in the passive splitter, whichdepends on the number of ONUs. The signal received is coming from the isolator inthe OLT and passing through an optical attenuator (HP 8156A) and a power splitter.One branch of the power splitter goes into an error analyzer (HP 70843A) after aSMF pigtailed commercially available photodiode, while the other is monitored by alight-wave multimeter (HP 8153A). As the power received is changed by varying thevalue of the optical attenuator, the bit error rate (BER) is measured along the varyinglevels of power received for three separate cases. First, a baseline without a fiber linkis measured, and then the SMF (15 km) + MMF (1 km) link is measured. Replacingsegment 2 with 1-km-long SMF, a third measurement is made. Comparing the threecases, the degree of difference caused by the MMF link is clear.
Figure 4.12 shows the results for the three cases. Comparing the baseline tocase 3, there is a 3-dB power penalty. Although the effect of the chromatic dispersion
Back-to-Back
1E-3
Received Power (dBm)
Bit
Err
or
Rat
e
1E-4
1E-5
1E-6
1E-7
1E-8
1E-9
1E-10
1E-11
1E-1225 24 23 22 21 20 19 18 17 16 15
SMFMMF
FIGURE 4.12 CLS + MMF BER measurements at the OLT.

184 NEXT-GENERATION BROADBAND OPTICAL ACCESS NETWORKS
10–5 BER 10–11 BER
800 ps800 ps
FIGURE 4.13 CLS + MMF eye diagrams.
for the 16-km-long fiber link at 1.25 Gb/s may be ignored, the signal can still beaffected by Rayleigh backscattering. Furthermore, there can be other noise sources,such as imperfect isolation of the circulators and noise coming from the SOA in theONU. When segment 2 is changed to a 1-km-long MMF, the signal can be degradedfurther, due to the modal dispersion. However, since the upstream signal is launchedwith the polarization controlled, the signal feasible to the upstream data link can beoptimized. With finely tuned polarization control, a BER performance of up to 10−11
can be achieved with an additional 2-dB power penalty compared to case 3.The eye diagram for case 2 at low and high BERs are shown in Figure 4.13. The
left figure has a vague eye, and it becomes closed as time goes on, while a clear eyecan still be seen on the right.
From this experiment, it is determined that CLS transmission in a SMF + MMFconfiguration is a pausible promising access network configuration. Using a corealigned connection and polarization control, high BER performance can be achievedwith just a 2-dB-higher power penalty than that of the SMF link. Therefore, MMFcan play a complementary role in the deployment of WDM-PON. For further detailson this approach, readers are referred to a paper of Yam et al. [38].
4.3 HYBRID TDM/WDM-PON
In hybrid TDM/WDM PONs, TDM and WDM components coexist in the sameODN. Usually, some customers are served by the TDM infrastructure and others bythe WDM infrastructure. The reason for this type of coexistence is that it may bedesirable to make use of the same infrastructure deployed for TDM-PON to provideWDM-PON capabilities. As we will see next, this has to do with the evolution fromTDM-PON to WDM-PON.
4.3.1 TDM-PON to WDM-PON Evolution
The WDM-PON architectures discussed earlier do not take into consideration theprevious deployment of TDM-PON ODN. By the time that WDM-PON deployments

HYBRID TDM/WDM-PON 185
begin in earnest, a huge number of TDM-PON ODNs will have been deployed.Because of this, network operators will be unwilling to incur large new infrastructurecosts and would prefer a smooth transition from TDM-PON to WDM-PON in termsof both cost and service. This migration from TDM-PON to WDM-PON must happenin a way that satisfies several operational, cost, and flexibility requirements. Some ofthese requirements are the following:
� Service disruptions to the current users must be avoided.� Service levels to current users should not be downgraded.� The network should support legacy TDM infrastructure and equipment when
possible (e.g., fiber deployments, legacy ONUs).� The cost of new WDM equipment should be minimized and reasonable for
access networks.� If possible, the cost of the network should increase slowly as new bandwidth
demands are satisfied.� If possible, the new WDM-PON architecture must be flexible enough to accom-
modate different WDM-PON ONU technologies.
The first two service-level requirements are quite obvious. The support for legacyinfrastructure and equipment comes from the fact that it would be difficult to changeequipment and technologies instantaneously across the ODN. Thus, ideally, a time ofcoexistence between legacy and new technologies should be allowed. Managing thecost of deploying the new WDM-PON technology is also an important issue. Finally,the last requirement is given because, as we have seen, there are several proposalsfor WDM-PON ONUs, and currently it is not clear which technology, convention,or protocol will be the most widely deployed. Because of this, ideally, the topologyand architecture should be such that they will support multiple WDM-PON ONUtechnologies.
The technology used in the new WDM-PON should also satisfy some require-ments, for it to be worthwhile to go through a migration from TDM-PON:
� Provide much higher bandwidths (e.g., 10 times as much) per user than thoseof current TDM-PONs, to justify the investment.
� Be flexible and scalable for future bandwidth demand increases.� For small business users, enhanced security and protection features are desir-
able.
If the new WDM-PON technology is just marginally superior to TDM-PON inend-user bandwidth capacity, the upgrade will not be worth it. The new architectureshould be flexible, so that it can adapt to new technologies that may crop up in theWDM-PON space and scalable so that it can support many users. In addition, manysmall business users will make use of the good bandwidths supported by TDM-PONand WDM-PON. For these users, enhanced security and protection features (such ascontinuity in the event of a fiber cut) are very important.

186 NEXT-GENERATION BROADBAND OPTICAL ACCESS NETWORKS
The authors’ research group at Stanford University has proposed two smooth mi-gration architectures from TDM-PON to WDM-PON developed under the StanfordUniversity aCCESS (SUCCESS) project umbrella; these are the hybrid TDM/WDMPON (SUCCESS-HPON) and the dynamic wavelength allocation (SUCCESS-DWA)architectures, which are discussed in subsequent sections, along with other ap-proaches and evolutions.
4.3.2 Hybrid Tree Topology Evolution
As we discussed before, current TDM-PONs have been deployed using a tree networktopology. Such is the case for the three major types of deployments: BPON, GPON,and EPON. The standards allow for flexibility in the topology regarding the numberof splitters and the splitting ratio of each, setting only the minimum and maximumattenuations supported (i.e., the attenuation range). For example, the ODN classes A,B, B+, and C, as defined in the standards, correspond to the 5 to 20, 10 to 25, 13 to28, and 15 to 30 dB ranges. These attenuation ranges, in turn, limit the total numberof users and the maximum distance between the OLT and the ONUs.
Even though many splitters could be throughout the ODNs, most current TDM-PON deployments in North America and Asia usually have only one 1 : 32 splitter[5,40] and a maximum reach of 20 km, as shown in Figure 4.14. In Japan, mostdeployments have a 1 : 4 splitter at the CP and 1 : 8 splitters at the remote nodes.Currently, there is as well a convergence of PON deployments toward the class B+ODN (i.e., 13 to 28 dB range and 20 km reach) [40]. Since most of these PONs havebeen deployed from scratch, the fiber optic cables used in these deployments usuallyhave several extra backup or dark fibers between the CO and the splitter and a fewextra fibers from the splitter to the home (i.e., they are fiber-rich deployments, as weexplain below). The number of fibers that have been included in these deploymentsis higher than the number needed even in the case of a high take rate; since the cost ofredeploying extra fibers in the future for additional services is much greater, operators
Central Office
Remote Node
1:32 Passive Splitter
20 kmmax.
. . .
ODN Customers
ONU1
ONU2
ONU32
OLT
FIGURE 4.14 Typical TDM-PON deployment.

HYBRID TDM/WDM-PON 187
have included them already. The precise numbers depend on the expected take rate foran area, the cost of adding fibers, and the economic objectives for the following years.
We discuss now two alternative evolution paths for tree topologies from TDM-PON to WDM-PON. The first evolution path is for fiber-lean scenarios, where noextra fibers are available, and thus TDM-PON and WDM-PON wavelengths mustcoexist in the same fiber. The second evolution path is for fiber-rich scenarios, suchas the one just mentioned above, where at least one extra fiber is available from theCO to the splitter and from the splitter to each ONU.
4.3.2.1 Fiber-Lean and Fiber-Rich Deployments We can classify TDM-PON deployments into two categories: Fiber-lean deployments are those in which nonew unused fibers are available in the ODN; in contrast, in fiber-rich deployments,backup or dark fibers were installed initially and are available for further networkdevelopment (Table 4.3).
Fiber-Lean Deployments WDM enhancements can take place in both fiber-leanand fiber-rich deployments. In fiber-lean deployments, since there are no additionalunused fibers, we need to make use of the currently used fibers. There are two naturalways of introducing new wavelengths on this type of deployment.
1. By making use of wavelength blocking filters, the TDM-PON ONUs can elim-inate the interference cause by new wavelengths introduced. What makes a bigdifference on whether or not using wavelength-blocking filters makes econom-ical sense is when they are deployed and installed. If it is part of the initialdeployment, the cost of installing them is minimized. However, if their use isan afterthought and are added afterward, the cost of installing them throughoutthe network for every customer will be quite high. Another issue is that they
TABLE 4.3 TDM-PON WDM Enhancements
Advantages Disadvantages
Fiber-lean techniquesWavelength
blocking filtersInexpensive a priori filtering
at ONUExpensive a posteriori
filtering at ONU; may affectpower budget and reach
Remote nodemodification
Wavelength selectivitywithout making changes toexisting ONUs
Requires ODN changes; mayaffect power budget andreach
Fiber-rich techniquesBundled fiber Simple deployment by adding
wavelength MUX/DEMUXin ODN
Extra bundled fiber is notalways available
New fiberdeployment
Completely new infrastructurefor enhanced PON
Very expensive and unlikelyto happen

188 NEXT-GENERATION BROADBAND OPTICAL ACCESS NETWORKS
may require additional power to reach the ONU from the OLT, thus affectingthe power budget or reach specifications.
2. An easier approach, especially in the case in which the changes are beingdone as an afterthought, is to modify the remote node. This allows all themodifications to take place in a single place (the remote node) instead ofat hundreds or thousands of places (the ONUs), thus making the logistics andpracticality of this approach much better. Modifying the remote node allows forwavelength selectivity without making changes to the existing ONUs. Again,as in the wavelength-blocking filters approach, because of the filtering andchanges to the remote node, which is passive, the changes may affect the powerbudget or reach specifications.
Fiber-Rich Deployments In the case of fiber-rich deployments, where unusedfibers that were installed during the initial deployment of the ODN are availableto make these enhancements, the approach is more straightforward. These unusedbundled fibers can be used by a WDM overlay to provide WDM enhancements overthe same ODN. We discuss this and provide an example in the following sections.
Of course, the last fiber-rich technique is to add new fibers to the ODN simplybut expensively. This approach is very expensive and thus unlikely to happen, butwe would like to suggest considering it as an option as well. It is worth notingthat, in general, the attainable increase in network throughput is much greater withWDM enhancements than with the line rate enhancements discussed previously, sincecompletely new wavelength channels become available.
4.3.2.2 Fiber-Lean Evolution In the fiber-lean scenario, the new WDM-PONwavelengths must coexist with the TDM-PON wavelengths in the same fiber. To dothis, two waveband combiner/splitters (WCS) are installed, one at the CO and theother at the RN, and a new 1 : 32 athermal AWG MUX/DEMUX is installed at theRN, as shown in Figure 4.15. The legacy TDM-PON ONUs are not changed at all.
HPON OLT
HPON ONU
FarLegacy ONU
NearLegacy ONU
WSC WSC
Legacy OLT
ODN CustomersCentral Office
Remote Node
1:32 AWG MUX/DEMUX
OptionalOptical Amplifiers
1:32 PassiveSplitter
FIGURE 4.15 Fiber-lean tree upgrade with optional amplifiers.
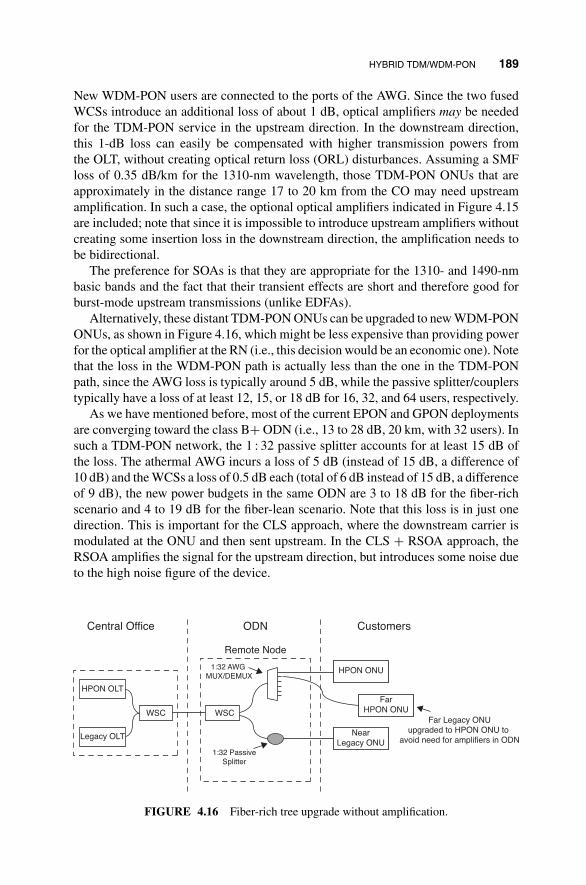
HYBRID TDM/WDM-PON 189
New WDM-PON users are connected to the ports of the AWG. Since the two fusedWCSs introduce an additional loss of about 1 dB, optical amplifiers may be neededfor the TDM-PON service in the upstream direction. In the downstream direction,this 1-dB loss can easily be compensated with higher transmission powers fromthe OLT, without creating optical return loss (ORL) disturbances. Assuming a SMFloss of 0.35 dB/km for the 1310-nm wavelength, those TDM-PON ONUs that areapproximately in the distance range 17 to 20 km from the CO may need upstreamamplification. In such a case, the optional optical amplifiers indicated in Figure 4.15are included; note that since it is impossible to introduce upstream amplifiers withoutcreating some insertion loss in the downstream direction, the amplification needs tobe bidirectional.
The preference for SOAs is that they are appropriate for the 1310- and 1490-nmbasic bands and the fact that their transient effects are short and therefore good forburst-mode upstream transmissions (unlike EDFAs).
Alternatively, these distant TDM-PON ONUs can be upgraded to new WDM-PONONUs, as shown in Figure 4.16, which might be less expensive than providing powerfor the optical amplifier at the RN (i.e., this decision would be an economic one). Notethat the loss in the WDM-PON path is actually less than the one in the TDM-PONpath, since the AWG loss is typically around 5 dB, while the passive splitter/couplerstypically have a loss of at least 12, 15, or 18 dB for 16, 32, and 64 users, respectively.
As we have mentioned before, most of the current EPON and GPON deploymentsare converging toward the class B+ ODN (i.e., 13 to 28 dB, 20 km, with 32 users). Insuch a TDM-PON network, the 1 : 32 passive splitter accounts for at least 15 dB ofthe loss. The athermal AWG incurs a loss of 5 dB (instead of 15 dB, a difference of10 dB) and the WCSs a loss of 0.5 dB each (total of 6 dB instead of 15 dB, a differenceof 9 dB), the new power budgets in the same ODN are 3 to 18 dB for the fiber-richscenario and 4 to 19 dB for the fiber-lean scenario. Note that this loss is in just onedirection. This is important for the CLS approach, where the downstream carrier ismodulated at the ONU and then sent upstream. In the CLS + RSOA approach, theRSOA amplifies the signal for the upstream direction, but introduces some noise dueto the high noise figure of the device.
HPON OLT
Legacy OLT
Central Office
WSCWSC
HPON ONU
FarHPON ONU
Far Legacy ONUupgraded to HPON ONU to
avoid need for amplifiers in ODNNear
Legacy ONU
ODN Customers
Remote Node
1:32 AWG MUX/DEMUX
1:32 PassiveSplitter
FIGURE 4.16 Fiber-rich tree upgrade without amplification.

190 NEXT-GENERATION BROADBAND OPTICAL ACCESS NETWORKS
ODN Customers
:
Central Office
Remote Node
1:32 AWG MUX/DEMUX
1:32 Passive Splitter
HPON OLT
Legacy OLT Legacy ONU
HPON ONU
Bundled fibers
FIGURE 4.17 Fiber-rich tree upgrade.
4.3.2.3 Fiber-Rich Evolution In the fiber-rich scenario, an athermal AWGMUX/DEMUX is installed at the remote node (RN), collocated with the splitter, asshown in Figure 4.17. The MUX/DEMUX capabilities of this AWG would be thesame as the ratio of the splitter (e.g., typically 1 : 32). On the network side, one extrafiber available between the CO and the RN is used, while on the users’ side, eachport of the AWG is connected to one extra fiber that reaches each customer. Thus,each customer now has two fiber paths to the CO: a legacy path for TDM-PONand a new path for WDM-PON. The addition of the athermal AWG at the RN isperformed by a skilled technician. Depending on how the extra fiber to the home wasterminated during the initial deployment, and the access that the user has to the ONU(in North America, for example, the ONU cabling can usually only be accessed bythe operating company) installation of WDM-PON equipment in the home can bedone by either a skilled technician or the user. The cost of using the extra fibers isquite low, since the deployment cost was assumed during the initial rollout. A greenfield WDM-PON ODN is also assumed to be minimally different (AWG instead ofsplitter) to a TDM-PON ODN and thus is not much more expensive.
4.3.2.4 SUCCESS-DWA SUCCESS-DWA PON is a novel optical access net-work architecture designed for the next-generation access networks, which employsdynamic wavelength allocation (DWA) [41]. As is shown later, the scalability ofthe SUCCESS-DWA PON allows the network to easily bridge the large gap be-tween TDM and WDM-PONs. In addition, the architecture provides excellent costefficiency and network performance by sharing bandwidth across multiple physi-cal PONs. Existing arbitrary field-deployed PON infrastructures remain intact whenbrought together in a SUCCESS-DWA PON.
Downstream Transmission Figure 4.18 shows the architecture of SUCCESS-DWA PON. Fast tunable lasers (TLs), cyclic AWG, and thin-film WDM filters con-stitute the key components of the system. The TLs and AWG reside in the CO, whilethe WDM filters are within the ONU. Note that the field-deployed infrastructure is

HYBRID TDM/WDM-PON 191
Central Office
AWG
AWG
TL5PON1
Ch 1 User 1
User16
User17
User32
User33
User48
User49
User64
Ch16
Ch 1
Ch 1
Ch16
Ch 1
Ch16
Ch16
PON2
PON3
PON4
TL6
TL7
TL8
TL1
TL2
TL3
TL4
RX
Up/Down
FIGURE 4.18 SUCCESS-DWA downstream architecture.
compatible with TDM-PONs. In the basic architecture, the cyclic AWG multiplexesthe TLs and routes the TL outputs to different physical PONs depending on thewavelength. Each ONU within a single PON contains a unique fixed-wavelengthfilter and a burst-mode receiver. The key lies in the fact that the passband of theONU filter encompasses the free spectral range of the AWG. For example, 200-GHzONU filters would work with a 4 × 4 cyclic 50-GHz AWG. The relative filter shapesare illustrated in Figure 4.19. In this architecture, any tunable laser can individuallyaddress any ONU across separate physical PONs at any given time [41].
For each downstream frame, the TLs tune to the appropriate wavelengths andtransmit the data to the corresponding end users. The transmission durations forend users are globally managed to achieve optimal network performance. The traf-fic scheduling allows free moving of bandwidth among physical PONs, which isvery useful to accommodate bursty Internet traffic. All TLs share the load, shiftingbandwidth across the separate physical PONs as necessary. The authors refer to thistechnique as dynamic wavelength allocation (DWA).
ONUWDM Channel 1
1 2 3 4 5 6 7 8 61 62 63 64
λOLT AWG Channels
ONUWDM Channel 2
ONUWDM Channel 16
FIGURE 4.19 Wavelength bands for AWG channels and thin-film WDM filter.

192 NEXT-GENERATION BROADBAND OPTICAL ACCESS NETWORKS
To illustrate the flexibility of this architecture, compare an initial deployment offour TDM-PONs to a SUCCESS-DWA PON that spans four physical PONs. In theinitial deployment stage, the first several subscribers would probably scatter acrossmultiple PONs, and in the worst case they may be spread across all four PONs. In thefour TDM-PON cases, then, all four OLTs (lasers) must be activated, despite the factthat some OLTs may only be serving a few subscribers. With the SUCCESS-DWAPON, on the other hand, it is sufficient to deploy only one TL and AWG in theCO, and the subscribers across multiple PONs are all serviced by the single TL. Asdemand grows, additional TLs can be added to the AWG. When the subscriptionrate is high enough, the two scenarios seem to converge; both have four transmittersserving all subscribers. However, the SUCCESS-DWA PON enjoys the benefit ofstatistical multiplexing over a larger customer base, so its performance will exceedthat of the four TDM-PONs. For the performance of statistical multiplexing gain,readers are referred to a paper by Hsueh et al. [42].
When demand dictates, the SUCCESS-DWA PON can be scaled beyond theconventional TDM-PONs. The darkly shaded AWG in Figure 4.18 illustrates theconcept. By connecting some of the physical PONs to additional AWG + TLs sets,the architecture shifts from four TLs serving four PONs to four TLs each servinga single PON. If 8 × 8 AWGs are utilized, 16 end users can be served by eightTLs, which results in a very high-performance network, close to a full WDM-PON.The excellent scalability provides a smooth and graceful upgrade from a TDM-PONtoward a WDM-PON. The step-by-step system upgrade easily tracks user demands,and the initial overhead can be even lower than that of conventional TDM-PONs. Inaddition, the TLs provide protection for each other, maintaining service to all physicalPONs in the event of a failure.
Upstream Transmission The measured upstream traffic rates are strongly relatedto the downstream traffic rates in access networks. Users enjoying high-speed down-loads also expect a commensurate data rate in the upstream. This suggests that ahigh-performance upstream scheme is desirable. Depending on the performance re-quirements, there is a wide range of possible scenarios for upstream transmission.Hsueh et al. [41] investigated five upstream schemes for SUCCESS-DWA PON andevaluated them in terms of cost, performance, and scalability, as summarized inFigure 4.20.
For scheme A, users within a group transmit on the same upstream wavelength andtime-share the same PD in the OLT. It is static in wavelength allocation and providesa baseline for comparison with the other schemes. Schemes B and C are distributedDWA schemes in which the tunability is spread across the ONUs. The distributedschemes allow more flexibility since the deployment of tunable devices can be judgedby user demands. On the other hand, schemes D and E are centralized DWA schemesin which the tunability resides in the OLT. The tunable DeMux is described in theliterature [42]. Qualitatively, full tunability results in the best performance. SchemeE exhibits full tunability but at the cost of an expensive, centralized tunable DeMux.Scheme C can provide equal performance if all users are equipped with TLs. Whereasthe centralized schemes subject all ONUs to the high cost of the tunable device, the

HYBRID TDM/WDM-PON 193
ONU
ONU
ONU
OLT
OLT
LD
TL
λm
λ
λ
λ
λ
λ
DeMux
DeMux
λn
FIGURE 4.20 Five upstream schemes for SUCCESS-DWA.
distributed schemes require only those ONUs that demand high performance to beupgraded. Therefore, the added design flexibility of distributed schemes B and Cmakes them preferable.
A complete upstream SUCCESS-DWA PON architecture is shown in Figure 4.21.Four physical PONs are connected to an OLT, and an AWG functions as the DeMuxfor routing the incoming wavelengths to the corresponding PDs. It is worth noting thatthe AWG does not require cyclic features, and the upstream and downstream AWGspass completely different wavelengths and require different channel spacings. Hence,separate AWGs are necessary for up/downstream. Similar to the downstream, onlyone PD + receiver module is activated in the initial deployment. To cover all ONUsresiding on different physical PONs, the first several subscribers from different PONsare assigned specific upstream wavelengths (i.e., the first several subscribers fromPON1 are assigned to λ1, the first several subscribers from PON2 are assigned λ2,and so on). When the number of users increases, a second PD + receiver module canbe installed in the OLT. For new subscribers to be served by the second PD, they areassigned λ2 on PON1, λ1 on PON2, and so on. Similarly, the upstream architecturecan scale up as the downstream. When demand dictates, additional AWG + PD/RXsets can be added (illustrated by the AWG in Figure 4.21) to shift from four PDs serv-ing four PONs to four PDs serving each PON. For the bandwidth-demanding users,

194 NEXT-GENERATION BROADBAND OPTICAL ACCESS NETWORKS
OpticalDeMux(AWG)
OpticalDeMux(AWG)
PD5PON1 ONU1 λ1λ2
λ3λ4
λ4λ1λ2λ3
λ3λ4λ1λ2
λ2λ3λ4λ1
ONUN
ONU1
ONUN
ONU1
ONUN
ONU1
ONUN
PON2
PON3
PON4
PD6
PD7
PD8
PD1PD2
PD3
PD4
TX
Up/Down
FIGURE 4.21 SUCCESS-DWA upstream architecture for users across multiple PONs.
tunable devices can replace the fixed-wavelength transmitters, as in schemes B and C.However, unlike the downstream architecture, which requires fast TLs (10 ns tuningtimes) to achieve DWA on the order of microseconds, the upstream DWA schemes per-form slower wavelength reallocations (on the order of milliseconds) due to the moreinvolved communications between the OLT and ONUs for transmission scheduling.
Experimental Testbed Hsueh et al. [41] described the details of design and imple-mentation issues of the key building blocks of SUCCESS-DWA PON, including fasttunable lasers, burst-mode receivers, and scheduling algorithms with QoS support.A testbed is constructed and video streaming experiments in the downstream areperformed to show the feasibility of the integrated system. As shown in Figure 4.22,
FIGURE 4.22 SUCCESS-DWA experimental testbed.

HYBRID TDM/WDM-PON 195
the experimental testbed consists of two fast TLs coupled by an AWG. Each TL ismodulated externally at 1.25 Gb/s by a Mach–Zehnder modulator. Four user wave-length channels are defined, and 16 subscribers share bandwidth in both the wave-length and time domains. The WDM filter in the OLT separates the downstream andupstream traffic occupying different wavelength bands. The WDM filter in the ONUnot only separates the up/downstream traffic but also provides the necessary filteringcorresponding to the ONU’s user wavelength channel. Burst-mode level recovery andCDR are implemented in both the OLT and ONUs. In the ONU, a laser driven by adc-coupled amplifier realizes a burst-mode transmitter. Processors are necessary toperform the framing procedure, line coding, and scheduling algorithm. We designedPCBs with field-programmable gate arrays (FPGAs) as processors in the OLT andONUs. The average packet latency and jitter of a realistic SUCCESS-DWA PONsystem are also measured on the testbed. For further details, readers are referred tothe literature [41].
4.3.3 Tree to Ring Topology Evolution
All currently deployed TDM-PON networks are based on a tree topology, with afeeder fiber, a splitter at the remote node, and distribution fibers to each customer. Inthe long term, the access topology can go from multiple trees to a ring topology. Thishas been considered in developed markets to provide protection and restoration. Inemerging markets, it has also been considered since ring topologies are sometimesa more cost-efficient way to provide service to many users with less infrastructure.The feeder fiber in this case can be shared among many more users than in a treetopology. In developed markets, even though this would require a higher investmentin deploying the extra fiber required for the ring, this topology allows for greaterresource sharing and alternative paths for protection and restoration.
There are two ways to achieve protection and restoration: (1) a particular high-endbusiness customer can be connected to two remote nodes (i.e., be multihomed) andswitch from one to the other in case of a fiber cut; (2) semipassive RNs with switchesthat sense traffic timeouts can shift from one side of the ring to the other after a certaintimeout period, similar to what happens in other well-known ring networks, such asSONET.
Given these advantages, some researchers have proposed the use of ring topologieseven for initial PON deployments in the greenfield [43,44].
4.3.3.1 SUCCESS-HPON Figure 4.23 illustrates the SUCCESS-HPON net-work migration scenario from a tree topology to a ring topology. Figure 4.23(a)shows the existing tree TDM-PONs connected to the same CO. Each TDM-PON hasits own cabling and OLT inside CO. Figure 4.23(b) shows the first migration step ofthe existing network infrastructure. The passive couplers of the PONs are replacedwith CWDM RNs. The feeder fibers of PONs are replaced by a single fiber ringthat strings the RNs served by this CO. Note that distribution fibers are untouchedduring this migration. From an ONU’s point of view, the functionality of the opticalaccess network is exactly the same; only a short downtime for upgrade is needed.
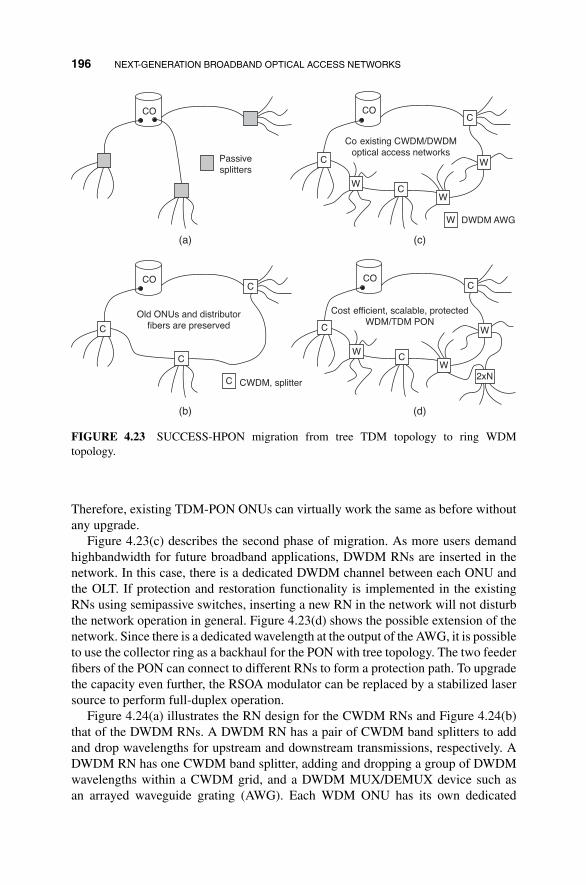
196 NEXT-GENERATION BROADBAND OPTICAL ACCESS NETWORKS
Passivesplitters
DWDM AWG
(a)
(b)
(c)
(d)
CWDM, splitter
Old ONUs and distributorfibers are preserved
Cost efficient, scalable, protectedWDM/TDM PON
Co existing CWDM/DWDMoptical access networks
CO CO
CO
C
C
C
C
C
C
C
W
W
W
2xN
W
COC
C
C W
W
W
FIGURE 4.23 SUCCESS-HPON migration from tree TDM topology to ring WDMtopology.
Therefore, existing TDM-PON ONUs can virtually work the same as before withoutany upgrade.
Figure 4.23(c) describes the second phase of migration. As more users demandhighbandwidth for future broadband applications, DWDM RNs are inserted in thenetwork. In this case, there is a dedicated DWDM channel between each ONU andthe OLT. If protection and restoration functionality is implemented in the existingRNs using semipassive switches, inserting a new RN in the network will not disturbthe network operation in general. Figure 4.23(d) shows the possible extension of thenetwork. Since there is a dedicated wavelength at the output of the AWG, it is possibleto use the collector ring as a backhaul for the PON with tree topology. The two feederfibers of the PON can connect to different RNs to form a protection path. To upgradethe capacity even further, the RSOA modulator can be replaced by a stabilized lasersource to perform full-duplex operation.
Figure 4.24(a) illustrates the RN design for the CWDM RNs and Figure 4.24(b)that of the DWDM RNs. A DWDM RN has a pair of CWDM band splitters to addand drop wavelengths for upstream and downstream transmissions, respectively. ADWDM RN has one CWDM band splitter, adding and dropping a group of DWDMwavelengths within a CWDM grid, and a DWDM MUX/DEMUX device such asan arrayed waveguide grating (AWG). Each WDM ONU has its own dedicated
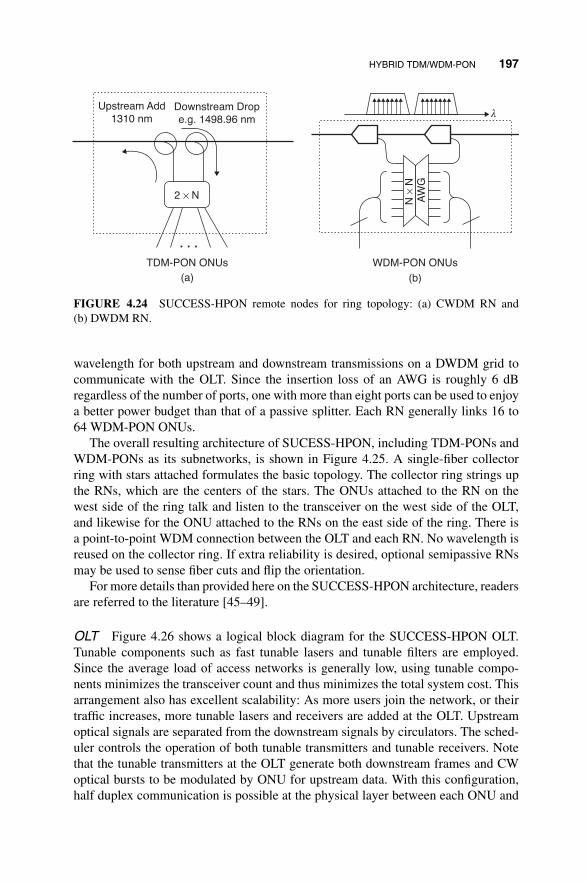
HYBRID TDM/WDM-PON 197
Upstream Add1310 nm
2 × N
λ
N ×
NA
WG
TDM-PON ONUs(a)
WDM-PON ONUs(b)
. . .
Downstream Drope.g. 1498.96 nm
FIGURE 4.24 SUCCESS-HPON remote nodes for ring topology: (a) CWDM RN and(b) DWDM RN.
wavelength for both upstream and downstream transmissions on a DWDM grid tocommunicate with the OLT. Since the insertion loss of an AWG is roughly 6 dBregardless of the number of ports, one with more than eight ports can be used to enjoya better power budget than that of a passive splitter. Each RN generally links 16 to64 WDM-PON ONUs.
The overall resulting architecture of SUCESS-HPON, including TDM-PONs andWDM-PONs as its subnetworks, is shown in Figure 4.25. A single-fiber collectorring with stars attached formulates the basic topology. The collector ring strings upthe RNs, which are the centers of the stars. The ONUs attached to the RN on thewest side of the ring talk and listen to the transceiver on the west side of the OLT,and likewise for the ONU attached to the RNs on the east side of the ring. There isa point-to-point WDM connection between the OLT and each RN. No wavelength isreused on the collector ring. If extra reliability is desired, optional semipassive RNsmay be used to sense fiber cuts and flip the orientation.
For more details than provided here on the SUCCESS-HPON architecture, readersare referred to the literature [45–49].
OLT Figure 4.26 shows a logical block diagram for the SUCCESS-HPON OLT.Tunable components such as fast tunable lasers and tunable filters are employed.Since the average load of access networks is generally low, using tunable compo-nents minimizes the transceiver count and thus minimizes the total system cost. Thisarrangement also has excellent scalability: As more users join the network, or theirtraffic increases, more tunable lasers and receivers are added at the OLT. Upstreamoptical signals are separated from the downstream signals by circulators. The sched-uler controls the operation of both tunable transmitters and tunable receivers. Notethat the tunable transmitters at the OLT generate both downstream frames and CWoptical bursts to be modulated by ONU for upstream data. With this configuration,half duplex communication is possible at the physical layer between each ONU and

198 NEXT-GENERATION BROADBAND OPTICAL ACCESS NETWORKS
W
W
C
C
W
TDM-PON ONU
CentralOffice
λ43
λ23λ22
λ21
λ42
λ41
λ3
λ4
λ2
λ2
λ2 λ4,
λ4,λ3,
λ1,
λ1
. . .
. . . λ’3
λ’3,
λ’1,
λ’1
TDM-PON RN
WDM-PON ONU
WDM-PON RN
C
FIGURE 4.25 Ring topology SUCCESS-HPON.
the OLT. Compared to a similar architecture [30] with a two-fiber ring, two sets oflight sources, and two sets of MUX/DEMUX to perform full-duplex communica-tions, the SUCCESS-HPON architecture lowers costs dramatically. As a trade-off,it needs carefully designed MAC protocol and scheduling algorithms to provide ef-ficient bidirectional communication. The authors have developed both, and they arediscussed in the next section.
DownstreamTraffic Queues
UpstreamGrant Queues
UpstreamTraffic
MACScheduler
TunableTransmitter 1 M:1 Coupler
N:1 Splitter
To/FromRemote Node
Circulator
TunableTransmitter M
TunableReceiver 1
TunableReceiver N
FIGURE 4.26 SUCCESS-HPON OLT.
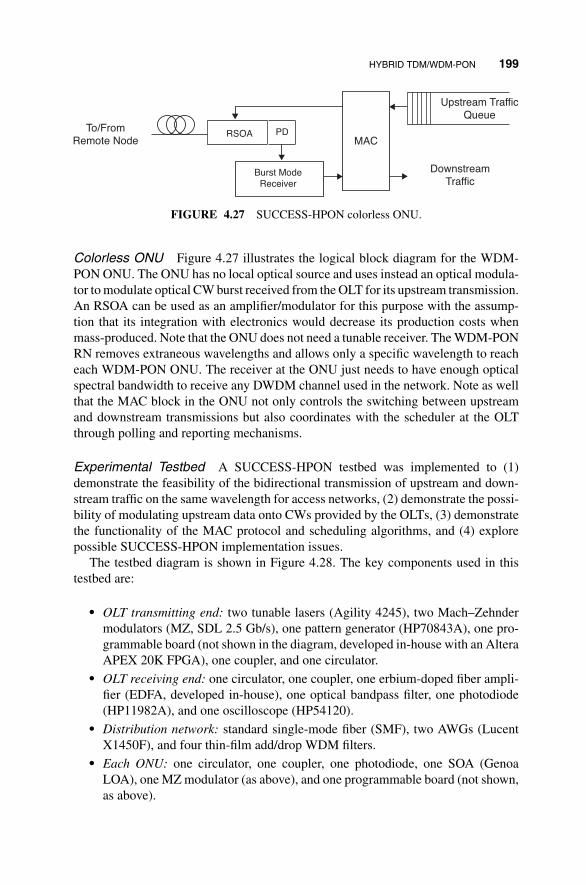
HYBRID TDM/WDM-PON 199
DownstreamTraffic
To/FromRemote Node
Upstream TrafficQueue
MAC
Burst ModeReceiver
RSOA PD
FIGURE 4.27 SUCCESS-HPON colorless ONU.
Colorless ONU Figure 4.27 illustrates the logical block diagram for the WDM-PON ONU. The ONU has no local optical source and uses instead an optical modula-tor to modulate optical CW burst received from the OLT for its upstream transmission.An RSOA can be used as an amplifier/modulator for this purpose with the assump-tion that its integration with electronics would decrease its production costs whenmass-produced. Note that the ONU does not need a tunable receiver. The WDM-PONRN removes extraneous wavelengths and allows only a specific wavelength to reacheach WDM-PON ONU. The receiver at the ONU just needs to have enough opticalspectral bandwidth to receive any DWDM channel used in the network. Note as wellthat the MAC block in the ONU not only controls the switching between upstreamand downstream transmissions but also coordinates with the scheduler at the OLTthrough polling and reporting mechanisms.
Experimental Testbed A SUCCESS-HPON testbed was implemented to (1)demonstrate the feasibility of the bidirectional transmission of upstream and down-stream traffic on the same wavelength for access networks, (2) demonstrate the possi-bility of modulating upstream data onto CWs provided by the OLTs, (3) demonstratethe functionality of the MAC protocol and scheduling algorithms, and (4) explorepossible SUCCESS-HPON implementation issues.
The testbed diagram is shown in Figure 4.28. The key components used in thistestbed are:
� OLT transmitting end: two tunable lasers (Agility 4245), two Mach–Zehndermodulators (MZ, SDL 2.5 Gb/s), one pattern generator (HP70843A), one pro-grammable board (not shown in the diagram, developed in-house with an AlteraAPEX 20K FPGA), one coupler, and one circulator.
� OLT receiving end: one circulator, one coupler, one erbium-doped fiber ampli-fier (EDFA, developed in-house), one optical bandpass filter, one photodiode(HP11982A), and one oscilloscope (HP54120).
� Distribution network: standard single-mode fiber (SMF), two AWGs (LucentX1450F), and four thin-film add/drop WDM filters.
� Each ONU: one circulator, one coupler, one photodiode, one SOA (GenoaLOA), one MZ modulator (as above), and one programmable board (not shown,as above).

200 NEXT-GENERATION BROADBAND OPTICAL ACCESS NETWORKS
TLS: λ2
TLS λ1
thin-film A/D
circulator
passive splitter
ONU1 ONU2
ONU3
scope
pattern generator
AWG AWG
SMF:2.2km SMF:15km
SMF:5kmSMF:15kmSMF:2.2km
ONU
SOA AM
OBPF EDFA
OLT
75/25
FIGURE 4.28 Testbed diagram.
At the OLT transmitting end, two tunable lasers use different wavelengths tocommunicate with ONU1 and ONU2; these wavelengths are determined by the dis-tribution network components as explained below. The pattern generator and theprogrammable board control the MZ modulators to generate downstream data at a1.25-Gb/s rate and/or CW bursts. Downstream traffic and CW bursts pass throughports 1 and 2 of the circulators to enter the ring.
The collector ring is composed of four standard single-mode fiber (SMF) sec-tions of 2.2, 15, 15, and 2.2 km. Each remote node has at least one thin-filmCWDM add/drop filter, and two of them have an AWG with a channel spacingof 100 GHz. Since no athermal AWGs were available at the time, we used con-ventional temperature-stabilized AWGs. The combined wavelength characteristicsof the add/drop filters and the AWGs at each remote node determine the wavelengthassigned to a particular WDM-PON ONU and used by the OLT to communicatewith it. A single wavelength for each ONU, as mentioned before, is used for bothdownstream and upstream communication. The total distances from the OLT to theONUs are 2.2, 22.2, and 2.2 km, respectively.
Each ONU connects to its fiber through port 2 of its own circulator. Downstreamdata and CWs are received through port 3, while upstream data (that have beenmodulated on the CW) is sent through port 1. An optical power splitter is used: 25%goes to the receiver and 75% goes to the SOA and MZ. The power budget for thedownstream signal is enough to achieve error-free transmission. The splitter allocatesmore power for the upstream transmission since it needs to travel back to the OLT.Since the electronic driver circuitry to modulate the SOA is currently unavailableand the SOA is not designed for fast switching, the SOA only amplifies the CW inour testbed. The modulation is then performed by an external MZ modulator thathas a 6-dB loss. This MZ modulator again is controlled by a programmable board,different from the one at the OLT. When the ONU is receiving downstream data, themodulator is turned off to prevent upstream interference.
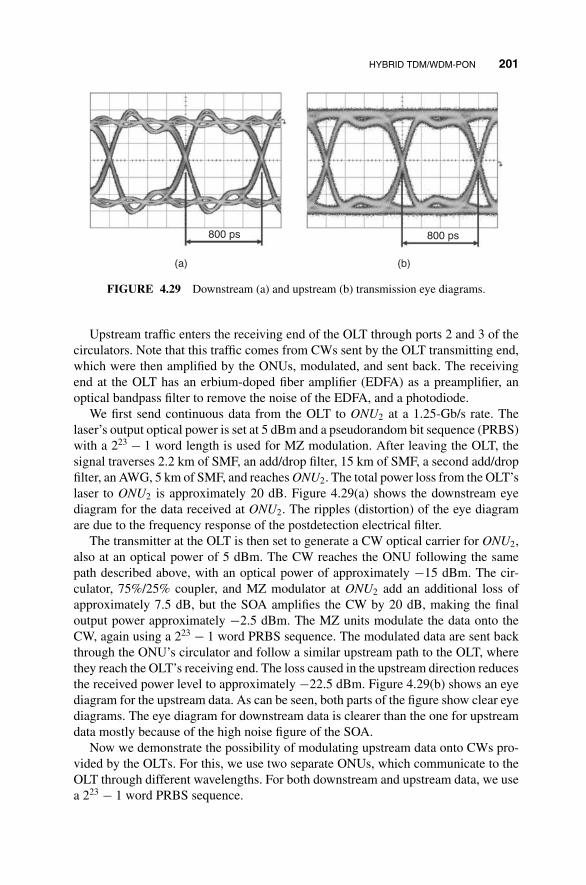
HYBRID TDM/WDM-PON 201
(a)
800 ps 800 ps
(b)
FIGURE 4.29 Downstream (a) and upstream (b) transmission eye diagrams.
Upstream traffic enters the receiving end of the OLT through ports 2 and 3 of thecirculators. Note that this traffic comes from CWs sent by the OLT transmitting end,which were then amplified by the ONUs, modulated, and sent back. The receivingend at the OLT has an erbium-doped fiber amplifier (EDFA) as a preamplifier, anoptical bandpass filter to remove the noise of the EDFA, and a photodiode.
We first send continuous data from the OLT to ONU2 at a 1.25-Gb/s rate. Thelaser’s output optical power is set at 5 dBm and a pseudorandom bit sequence (PRBS)with a 223 − 1 word length is used for MZ modulation. After leaving the OLT, thesignal traverses 2.2 km of SMF, an add/drop filter, 15 km of SMF, a second add/dropfilter, an AWG, 5 km of SMF, and reaches ONU2. The total power loss from the OLT’slaser to ONU2 is approximately 20 dB. Figure 4.29(a) shows the downstream eyediagram for the data received at ONU2. The ripples (distortion) of the eye diagramare due to the frequency response of the postdetection electrical filter.
The transmitter at the OLT is then set to generate a CW optical carrier for ONU2,also at an optical power of 5 dBm. The CW reaches the ONU following the samepath described above, with an optical power of approximately −15 dBm. The cir-culator, 75%/25% coupler, and MZ modulator at ONU2 add an additional loss ofapproximately 7.5 dB, but the SOA amplifies the CW by 20 dB, making the finaloutput power approximately −2.5 dBm. The MZ units modulate the data onto theCW, again using a 223 − 1 word PRBS sequence. The modulated data are sent backthrough the ONU’s circulator and follow a similar upstream path to the OLT, wherethey reach the OLT’s receiving end. The loss caused in the upstream direction reducesthe received power level to approximately −22.5 dBm. Figure 4.29(b) shows an eyediagram for the upstream data. As can be seen, both parts of the figure show clear eyediagrams. The eye diagram for downstream data is clearer than the one for upstreamdata mostly because of the high noise figure of the SOA.
Now we demonstrate the possibility of modulating upstream data onto CWs pro-vided by the OLTs. For this, we use two separate ONUs, which communicate to theOLT through different wavelengths. For both downstream and upstream data, we usea 223 − 1 word PRBS sequence.

202 NEXT-GENERATION BROADBAND OPTICAL ACCESS NETWORKS
2 ms
(a)
2 ms
leading edge ofupstream traffic on λ1
leading edge ofCW burst on λ1
(c)
2 ms
(b)
FIGURE 4.30 Downstream and upstream transmission timing diagrams.
The two lasers at the OLT transmit at the 1550.92-nm (λ1) and 1550.12-nm (λ2)wavelengths, assigned to ONU1 and ONU2 respectively. The MZ modulators at theOLT are controlled by a programmable board, generating downstream traffic and CWbursts piggybacked together within a l-ms frame, as shown in Figure 4.30(a) and (b).
The add/drop filters and AWG assignments at the RNs ensure that λ1 is receivedby ONU1 and λ2 by ONU2. The MZ modulators at the ONUs are again controlled bya programmable board which turns them off while receiving downstream traffic (or inthe idle state) and turns them on when receiving the CW to modulate the data onto it.
The receiver at the OLT detects the upstream traffic on both λ1 and λ2. In thisexperiment, since the CWs in two different wavelengths do not overlap, there is noneed for tunable receivers. Figure 4.30(c) shows the upstream traffic pattern retrievedby the oscilloscope at the OLT receiving end. Note that the timing of downstreamand upstream traffic on λ2 is aligned; however, there is a forward time shift of theupstream traffic on λ1 compared with the downstream data on λ1. The reason is thatthe distance between the OLT and ONU1 is shorter; therefore, so is the correspondinground-trip time (RTT). This factor is taken into account by the MAC protocol.
4.4 WDM-PON PROTOCOLS AND SCHEDULING ALGORITHMS
Just as in TDM-PON, in some WDM-PON network architectures resources areshared. These resources can, for example, be particular wavelengths or tunable re-sources. Whenever there is a shared resource in data transmission, a media access

WDM-PON PROTOCOLS AND SCHEDULING ALGORITHMS 203
control protocol is required to allocate use of this resource to multiple parties. In thissection we discuss some MAC protocols that have been developed for WDM-PON.
Another important issue is the scheduling of these resources according to somegoal. For example, if the same tunable laser is used among many users, how shouldit be scheduled in a way that can provide service to all of them, and, if possible, in afair manner. Or, if a single laser is used for multiple types of traffic, each in a separatequeue, what scheduling algorithm should be used to guarantee higher priority to real-time traffic over data traffic. We also discuss some WDM-PON scheduling algorithmsin this section.
4.4.1 MAC Protocols
Media access control (MAC) protocols are used to regulate the access of entitieswishing to transmit data to the media that transmits them. For example, the well-known Ethernet standard uses carrier-sense multiple access with collision detection(CSMA/CD) to regulate access to the wire media.
4.4.1.1 SUCCESS-HPON MAC Protocol The SUCCESS-HPON architec-ture described in Section 4.3 is a good example of a WDM-PON network thatrequires a MAC protocol to share the transmission medium. The tunable lasers at theOLT need to allocate their time among competing ONUs. This needs to be done forboth downstream and upstream traffic, since the ONUs transmit upstream data bymodulating a continuous wave (CW) sent by the OLT. In turn,an ONU needs to knowwhen it can modulate the CW grant that it has received from the OLT to transmitupstream data, and for how long.
Figure 4.31 illustrates the frame formats that are used. All frame formats havean 8-bit preamble and a 16-bit delimiter to allow for clock synchronization and toindicate the beginning of the frame, respectively. The uppermost frame format is usedfor downstream data transmission: a payload of multiple Ethernet frames. The nextdownstream frame is used to provide a continuous wave grant to the ONU. The 8-bitflags section of the downstream frame is used to indicate whether the downstreamframe is for downstream data or is a grant to be used for upstream data. They alsoindicate whether the ONU should report its queued traffic in the upstream frame. Thisinformation is transmitted from the OLT to the ONU in the downstream frame that issent for upstream transmission.
Ethernet frames or IP packets can be carried in the payload part of SUCCESS-HPON frames. Each ONU reports the amount of traffic waiting in its upstream trafficqueue in octets in the 16-bit report field in an upstream frame. The OLT uses thegrant field to indicate the actual size of each grant (also in octets).
Using the frames above, and similar to GPON and EPON systems [50], theSUCCESS-HPON OLT polls to check the amount of upstream traffic stored at theONUs and sends grants followed by CWs to allow the ONUs to transmit upstreamtraffic. Since there is neither a separate control channel nor a control message em-bedding scheme using escape sequences as described by Kramer et al. [51], the MAC

204 NEXT-GENERATION BROADBAND OPTICAL ACCESS NETWORKS
Overhead
8-BitPreamble
16-BitDelimiter
8-BitFlags
Ethernet Frame
8-BitPreamble
8-BitPreamble
16-BitDelimiter
16-BitDelimiter
8-BitFlags
16-BitReport
16-BitGrant
Grant (CW)
or
Ethernet Frame
Ethernet Frame Ethernet Frame
Order of Transmission
ForDownstream
ForUpstream
Overhead
Overhead
FIGURE 4.31 SUCCESS-HPON frame formats.
protocol has to rely on in-band signaling, where the report and grant fields are definedfor the polling process. For further details on the specific values of the flags used inthe frames, readers are referred to the literature [45,48].
4.4.2 Scheduling Algorithms
Scheduling algorithms in WDM-PON are used to schedule the use of shared resources(e.g., tunable lasers) among multiple competing users or among different types oftraffic. The details of different scheduling algorithms (e.g., how they calculate whento take turns, how they package and unpackage the data payload) determines theperformance and convenience of an algorithm. A good scheduling algorithm candramatically minimize the number of shared resources that are needed to serve a givennumber of end users. In this section we present some of the scheduling algorithmsthat have been developed for WDM-PON architectures.
4.4.2.1 SUCCESS-HPON Resource Scheduling The SUCCESS-HPONarchitecture requires scheduling algorithms that are able to assign all the resourcesavailable, including tunable lasers, tunable receivers, and wavelengths, to avoid con-flicts among them and to provide efficient bidirectional data communication betweenthe OLT and the ONUs. This discussion is based on results presented in the litera-ture [45,47,48].
The scheduling algorithms and MAC protocols for SUCCESS-HPON are basedon intelligent scheduling of tunable components over multiple wavelengths [52].Like current GPON and EPON systems [51], the OLT polls the ONUs to check the

WDM-PON PROTOCOLS AND SCHEDULING ALGORITHMS 205
amount of upstream data queued stored inside them and sends grants, along withthe corresponding CWs, to allow the ONUs to transmit their upstream traffic. TheSUCCESS-HPON protocol, however, is distinctive from previous protocols in that:
� It uses the TCM technique [53] (also known as “Ping-Pong”) to provide half-duplex bidirectional transmission between the OLT and the ONUs.
� There is no separate control channel or frames.� There is no embedding of control messages with escape sequences like those
proposed by Jia et al. [52].
To schedule all the resources in SUCCESS-HPON efficiently, we have developednovel algorithms that take into account the demands and allocate the resources intime, just like DBA algorithms do in TDM-PONs. In this section we discuss thesealgorithms.
We consider a SUCCESS-HPON system with W wavelengths (corresponding toW ONUs), M tunable lasers, and N tunable receivers. Note that because the tunablelasers are shared by both upstream and downstream traffic whereas tunable receiversare not, generally W ≥ M ≥ N . This is also a consequence of the fact that usuallythere will be more downstream than upstream traffic. A guard band between succes-sive frames of G nanoseconds takes into account not only the tuning time of lasersand receivers at the OLT, but also the effect of unstable local ONU clock frequen-cies. Each ONUi has a round-trip time RTTi . Since we do not equalize end-to-enddelays among ONUs, the round-trip times usually differ from one another. Two moreparameters are of importance: ONU TIMEOUT, a timer per ONU, reset whenevera grant frame is sent downstream to the corresponding ONU, and MAX GRANT, alimit on the maximum size of a grant (i.e., the payload part of the CW burst) for ONUupstream traffic.
The OLT manages and stores the following MAC protocol global status variablesfor resource scheduling purposes:
� CAT: array of channel available times. CAT[i] = t , where i = 1, 2, . . . , W ,means that the wavelength λi will be available for transmission after time t .
� TAT: array of transmitter available times. TAT[i] = t , where i = 1, 2, . . . , M ,means that the i th tunable transmitter will be available for transmission aftertime t .
� RAT: array of receiver available times. RAT[i] = t , where i = 1, 2, . . . , N ,means that the i th tunable receiver will be available for reception after time t .
� RTT: array of round-trip times (RTTs) between the OLT and the ONUs. RTT[i]denotes the RTT between the OLT and the i th ONU.
The scheduling algorithms developed make use of all the parameters discussedabove to schedule the resources. We describe them briefly here; for a detailed

206 NEXT-GENERATION BROADBAND OPTICAL ACCESS NETWORKS
explanation of each, readers are referred to the literature [45,47,48]. The threealgorithms are:
� Algorithm 1: Sequential scheduling. In this algorithm, as requests for down-stream and upstream data are received, the next available tunable transmitter,receiver, and channel are scheduled and the request is addressed as soon aspossible.
� Algorithm 2: Batch earlier departure first (BEDF). In this algorithm the ideaof batching a small queue of requests and addressing them as a group is usedas shown in Figure 4.32. The major concern is to provide room for schedulingoptimization by forming a task set consisting of multiple frames by a batchingprocess.
� Algorithm 3: Sequential scheduling with schedule-time framing (S3F). Thisis an improved sequential scheduling algorithm; it can encapsulate multiplepayload packets in the same transmission. The scheduling is done at the endof each frame transmission. For the purpose of granting downstream traffic,we maintain a downstream transmission counter per downstream VOQ. Whengranting upstream traffic based on a request received from an ONU, we alsogrant downstream traffic as well based on the VOQ status at the time of thearrival of the report message. Granting downstream traffic is done by settingthe said grant counter to the minimum of the queue length of the VOQ andMAX GRANT. When scheduling downstream transmission, the grant countervalue controls the number of Ethernet frames to be scheduled and transmittedin one SUCCESS frame through the procedure shown in the algorithm below.
Snapshots of VOQsat the beginning of batch periods
Scheduling results ofthe 1st batch
1st batch period 2nd batch period 3rd batch period Time
Scheduling results of the2nd batch + remnants
from the 1st batch
FIGURE 4.32 Scheduling example showing the interleaving of scheduling and transmissionphases in BEDF.

WDM-PON PROTOCOLS AND SCHEDULING ALGORITHMS 207
The sequential scheduling algorithm has two main problems. First, downstreamtraffic is given an implicit priority over upstream traffic; when the network is heavilyloaded, downstream traffic goes through whereas upstream traffic does not. Thesecond problem is that the sequential scheduling algorithm saturates itself at loads ofabout 35% of the maximum capacity.
In S3F, the benefit of granting and schedule-time framing of downstream trafficis three-fold. First, by encapsulating multiple Ethernet frames in one SUCCESS-HPON frame as in upstream transmission, the overhead due to the SUCCESS-HPONframing and the guard bands can be reduced. Second, the waste of tunable transmittersand channels can also be minimized and therefore minimize scheduling delays bypreventing the spread of smaller frames over multiple transmitters and channels.This is illustrated in the examples in Figures 4.33 and 4.34, where it is assumedthat for both framing schemes, there are three Ethernet frames at t1 in the VOQ forchannel 1, four Ethernet frames at t2 for channel 2, and one Ethernet frame at t3for channel 3. t ′
i denotes the resulting scheduled transmission time of the first framefor channel i , so the corresponding scheduling delay is given by t ′
i − ti . There issome inefficient use of transmitters in the arrival-time framing, where each incomingEthernet frame is encapsulated in a SUCCESS-HPON frame at the moment of itsarrival. The impact of this inefficiency will become clear when the scheduling delayof the frame for channel 3 in Figure 4.33 is compared to that of the schedule-time
Time EF
EF EF
EF EF
EF
EF
EF
H3
H2
H2
H1
H1H2
H2
H1
G
G
G
G
t 3′
t 2′
t 1′t 1
t 3
t 2
G1 2 3 TX
FIGURE 4.33 Arrival-time framing used in the sequential algorithm.

208 NEXT-GENERATION BROADBAND OPTICAL ACCESS NETWORKS
Time
t 3′
t 1′t 1
t 3
t 2t 2′
G
G
1 2 3 TX
EF
EF
EF
EF
EF
EF
EF
EF
H3
H2
H1
EFEthernetFrame
SUCCESS WDM-PONFrame Header for Channel iH1
FIGURE 4.34 Schedule-time framing used in the S3F algorithm.
framing in Figure 4.34. Third, by integrated and intelligent granting of both upstreamand downstream traffic, the traffic flows can be better controlled to guarantee fairnessand to support QoS in the future.
The authors have developed a simulation model for the performance evaluationof the algorithms mentioned using an objective modular network testbed in C++(OMNeT++) [54]. These algorithms can provide efficient and fair bidirectional com-munications between the OLT and the ONUs in the SUCCESS-HPON architecture.
A summary of the results discussed in the literature [45,47,48] is shown in Fig-ures 4.35, 4.36 and 4.37. In Figure 4.35, we can see the throughput for a givennetwork load. The network load has been normalized; 1.0 would mean that the in-coming traffic rate is the same as that of the transmitters, and 0.5 would mean thatthe incoming traffic rate is half the rate of the transmitters. As soon as the throughputline deviates from a 45◦ angle, the network is being saturated. As we can see in thefigure, algorithm 1 saturates at around 30%, algorithm 2 around 85%, and algorithm3 around 90%. It is clear from this how the design of such algorithms can seriouslyaffect the performance of the network.
Figure 4.36 also shows that the algorithms are progressively better. The graphillustrates the delay experienced by an incoming packet, in miliseconds, given anetwork load. Whenever the delay grows vertically, the network is considered to besaturated and the packet delays become intolerable. Algorithms 3 saturates, creatingconsiderable delay, only at normalized network loads of around 0.9.

WDM-PON PROTOCOLS AND SCHEDULING ALGORITHMS 209
100%
80%
60%
40%
20%
0%0.0 0.2 0.4 0.6 0.8 1.0
Normalized Network Load
Thr
ough
put
Algorithm 1~ 30 %
Algorithm 2~ 85 %
Algorithm 3~ 90 %
FIGURE 4.35 Scheduling algorithms throughput.
Figure 4.37 illustrates the scalability of the SUCCESS-HPON approach, in whichshared tunable transmitters are used. In comparison to GPON or EPON networksat 2.5 or 10 Gb/s, where the maximum incoming traffic rate will not go beyondthese values, the shared tunable transmitters approach can incrementally increasethe number of such transmitters as the load on the network increases. That is, asmore and more users sign up to use the network, more tunable resources can beinstalled to satisfy higher demands. In the example in Figure 4.37, with two tunabletransmitters at 10 Gb/s each, an overall network thoughput of almost 20 Gb/s can
5
4
3
2
1
00.0 0.2 0.4 0.6 0.8 1.0
Normalized Network Load
ThroughputLatency
(ms)
Low trafficrequires polling
Algorithm 1~ 30 %
Algorithm 2~ 85 %
Algorithm 3~ 90 %
FIGURE 4.36 Scheduling algorithms delay.

210 NEXT-GENERATION BROADBAND OPTICAL ACCESS NETWORKS
80
60
40
20
00 20 40
Network Load (Gbit/s)
2 TXs (10 Gbit/s each)
Thr
ough
put (
Gb
t/s)
60 80
G/EPON 10 Gbit/s
GPON 2.5 Gbit/s
4 TXs
8 TXs
FIGURE 4.37 Sharing resources for scalability.
be supported; similarly for four tunable transmitters (almost 40 Gb/s) and for eighttunable transmitters (almost 80 Gb/s).
4.4.2.2 SUCCESS-DWA QoS Traffic Scheduling Multiple services may beflowing simultaneously in an access network. For example, voice, video, Web data,and e-mail may all be using the same distribution fibers at the same time. To ensurethat higher-priority traffic such as real-time video is given priority over traffic thatis not so time-sensitive, such as e-mail download, quality of service policies need tobe applied and enforced. This policies determine how the priority is handled and insome cases the implementation as well. In SUCCESS-DWA, a buffering scheme wasused to provide two different priorities to flowing traffic.
To support QoS on SUCCESS-DWA PON, strict-priority traffic scheduling al-gorithms were investigated [41]. The traffic is categorized into high-priority (HP)and best effort (BE) traffic. Specifically, to improve the scalability and reduce thecomplexity of the buffering strategy in an OLT, we propose a TL-buffering schemefor the OLT of the SUCCESS-DWA PON. The block diagram of the TL-bufferingscheme is shown in Figure 4.38. The incoming traffic is divided and stored in
FIGURE 4.38 Block diagram of the TL-buffered scheme in an OLT.

REFERENCES 211
separate HP and BE buffers before scheduling. Depending on the packet arrivaltime and priority and the availability of TLs, the HP traffic can be serviced at theearliest possible time and the prioritized traffic is highly differentiated. The perfor-mance of the TL-buffering scheme is evaluated in comparison with a conventionalvirtue-output-queuing (VOQ) scheme, and the results show that the average latencyand jitter of HP traffic outperforms that of the VOQ buffering strategy [42].
4.5 SUMMARY
In this chapter we review the technologies and network architectures for the futuredevelopment of TDM-PON. We present bandwidth enhancements that have beenproposed for EPON and GPON and line rate enhancements that have been researchedfor TDM-PON in general. Extending the reach of TDM-PON is another importantenhancement in which research and standardization efforts are ongoing.
The natural progression for TDM-PON is to move toward WDM-PON, wherethe enormous bandwidth of multiple wavelengths can be used. We discuss themost promising technologies and network architectures for WDM-PON, includingspectrum-sliced broadband light sources, injection-locked Fabry–Perot lasers, andRSOAs in a centralized light sources network. Since tunable lasers may also be usedas colorless ONUs, we discuss them as well.
Service providers would like to find a way to move progressively from TDM-PONdeployment to WDM-PONs, using the same ODNs as those that deployed for TDM-PONs. We present the requirements for such an evolution and the possible evolutionpaths from TDM-PON to WDM-PON for fiber-rich and fiber-lean deployments. Wediscuss evolutionary paths for tree topology as well as possible migration paths fromtree to ring topology to provide protection and restoration services.
WDM-PONs that make use of shared resources such as tunable transmitters andreceivers require specialized MAC protocols and scheduling algorithms. We reviewsome of these protocols and algorithms, which allow these networks to grow in ascalable manner as demand increases.
REFERENCES
1. D. Gutierrez, K. S. Kim, S. Rotolo, F.-T. An, and L. G. Kazovsky, FTTH standards,deployments and research issues (invited paper), presented at the Joint Conference onInformation Sciences 2005, Salt Lake City, UT, July 2005.
2. N. K. Shankaranaryanan, Z. Jiang, and P. Mishra, User-perceived performance of Webbrowsing and interactive data in HFC cable access networks, Proceedings of the IEEEInternational Conference on Communications, Helsinki, Finland, June 2001.
3. L. G. Kazovsky, Burst-mode metro and access networks (invited paper), presented at theOptical Fiber Communication Conference OFC 2007, Anaheim, CA, Mar. 2007.
4. Y.-L. Hsueh, M. S. Rogge, W.-T. Shaw, J. Kim, S. Yamamoto, and L. G. Kazovsky,Smooth upgrade of existing passive optical networks with spectral-shaping line-codingservice overlay, IEEE/OSA J. Lightwave Technol., vol. 23, no. 8, Sept. 2005, pp. 2629–2637.

212 NEXT-GENERATION BROADBAND OPTICAL ACCESS NETWORKS
5. M. Abrams, P. C. Becker, Y. Fujimoto, V. O’Byrne, and D. Piehler, FTTP deploymentsin the United States and Japan: equipment choices and service provider imperatives,IEEE/OSA J. Lightwave Technol., vol. 23, no. 1, Jan. 2005, pp. 236–246.
6. Calix press release, Calix to host full service access network group fall meeting, Sept.2006.
7. G. Maier, M. Martinelli, A. Pattavina, and E. Salvadori, Design and cost performance ofthe multistage WDM-PON access networks, IEEE/OSA J. Lightwave Technol., vol. 18,no. 2, Feb. 2000, pp. 125–143.
8. C. Arellano, C. Bock, J. Prat, and K.-D. Langer, RSOA-based optical network unitsfor WDM-PON, presented at the Optical Fiber Communication Conference OFC 2006,Anaheim, CA, Mar. 2006.
9. Y. J. Lee, K. Y. Cho, A. Murakami, A. Agata, Y. Takushima, and Y. C. Chung, Reflectiontolerance of RSOA-based WDM PON, presented at the Optical Fiber Communication/National Fiber Optic Engineers Conference, Feb. 2008.
10. B. Schrenk, J. A. Lazaro, and J. Prat, Employing feed-forward downstream cancellationin optical network units for 2.5G/1.25G RSOA-based and 10G/10G REAM-based passiveoptical networks for efficient wavelength reuse, presented at the International Conferenceon Transparent Optical Networks, June 2009.
11. P.-J. Rigole, S. Nilsson, L. Backbom, T. Klinga, J. Wallin, B. Stalnacke, E. Berglind, andB. Stoltz, Access to 20 evenly distributed wavelengths over 100 nm using only a singlecurrent tuning in a four-electrode monolithic semiconductor laser, IEEE Photon. Technol.Lett., vol. 7, no. 11, Nov. 1995, pp. 1249–1251.
12. C. J. Chang-Hasnain, Tunable VCSEL, IEEE J. Sel. Top. in Quantum Electron., vol. 6,no. 6, Nov.–Dec. 2000, pp. 978–997.
13. R. Chen, H. Chin, D. A. B. Miller, K. Ma, and J. S. Harris, Jr., MSM-based integratedCMOS wavelength tunable optical receiver, IEEE Photon. Technol. Lett., vol. 17, no. 6,June 2005, pp. 1271–1273.
14. S. S. Wagner and T. E. Chapuran, Broadband high-density WDM transmission usingsuperluminescent diodes, IEEE Electron. Lett., vol. 26, no. 11, May 1990, pp. 696–697.
15. D. K. Jung, H. Kim, K. H. Han, and Y. C. Chung, Spectrum-sliced bidirectional pas-sive optical network for simultaneous transmission of WDM and digital broadcast videosignals, IEEE Electron. Lett., vol. 37, no. 5, Mar. 2001, pp. 308–309.
16. S. L. Woodward, P. P. Reichmann, and N. C. Frigo, A spectrally sliced PON employingFabry–Perot lasers, IEEE Photon. Technol. Lett., vol. 10, no. 9, Sept. 1998, pp. 1337–1339.
17. M. H. Reeve, A. R. Hunwicks, W. Zhao, S. G. Methley, L. Bickers, and S. Hornung, LEDspectral slicing for single-mode local loop applications, IEEE Electron. Lett., vol. 24,no. 7, Mar. 1988, pp. 389–390.
18. M. Zirngibl, C. H. Joyner, L. W. Stulz, C. Dragone, H. M. Presby, and I. P. Kaminow,LARnet, a local access router network, IEEE Photon. Technol. Lett., vol. 7, no. 2, Feb.1995, pp. 215–217.
19. D. K. Jung, S. K. Shin, C.-H. Lee, and Y. C. Chung, Wavelength-division-multiplexedpassive optical network based on spectrum-slicing techniques, IEEE Photon. Technol.Lett., vol. 10, no. 9, Sept. 1998, pp. 1334–1336.
20. R. D. Feldman, Crosstalk and loss in wavelength division multiplexed systems employingspectral slicing, IEEE/OSA J. Lightwave Technol., vol. 15, no. 10, Oct. 1997, pp. 1823–1831.

REFERENCES 213
21. S. Kobayashi, J. Yamada, S. Machida, and T. Kimura, Single-mode operation of 500 Mb/smodulated AlGaAs semiconductor laser by injection locking, IEEE Electron. Lett., vol. 16,no. 19, Sept. 1980, pp. 746–748.
22. S.-M. Lee, K.-M. Choi, S.-G. Mun, J.-H. Moon, and C.-H. Lee, Dense WDM-PON basedon wavelength-locked Fabry–Perot laser diodes, IEEE Photon. Technol. Lett., vol. 17,no. 7, July 2005, pp. 1579–1581.
23. L. Y. Chan, C. K. Chan, D. T. K. Tong, F. Tong, and L. K. Chen, Upstream traffic transmitterusing injection-locked Fabry–Perot laser diode as modulator for WDM access networks,IEEE Electron. Lett., vol. 38, no. 1, Jan. 2002, pp. 43–45.
24. F.-T. An, K. S. Kim, Y.-L. Hsueh, M. Rogge, W.-T. Shaw, and L. G. Kazovsky, Evolution,challenges and enabling technologies for future WDM-based optical access networks(Invited paper), presented at the Joint Conference on Information Systems JCIS 2003,Research Triangle Park, NC, Sept. 2003.
25. H. D. Kim, S.-G. Kang, and C.-H. Le, A low-cost WDM source with an ASE injectedFabry–Perot semiconductor laser, IEEE Photon. Technol. Lett., vol. 12, no. 8, Aug. 2000,pp. 1067–1069.
26. D. J. Shin, Y. C. Keh, J. W. Kwon, E. H. Lee, J. K. Lee, M. K. Park, J. W. Park, Y. K. Oh,S. W. Kim, I. K. Yun, H. C. Shin, D. Heo, J. S. Lee, H. S. Shin, H. S. Kim, S. B. Park,D. K. Jung, S. Hwang, Y. J. Oh, D. H. Jang, and C. S. Shim, Low-cost WDM-PON withcolorless bidirectional transceivers, IEEE/OSA J. Lightwave Technol., vol. 24, no. 1, Jan.2006, pp. 158–165.
27. H.-J. Park, H. Yoon, T. Park, S.-J. Park, and J. H. Kim, Recent research activities ofWDM-PON in Korea, presented at the Optical Fiber Communication and the NationalFiber Optic Engineers Conference, Mar. 2007.
28. CIP Photonics press release, Ground breaking technology deployed by consor-tium to enable uncooled operation of advanced photonic devices, Feb. 2006,http://www.wordsun.com/cip9.htm.
29. N. J. Frigo, P. P. Iannone, P. D. Magill, T. E. Darcie, M. M. Downs, B. N. Desai, U. Koren,T. L. Koch, C. Dragone, H. M. Presby, and G. E. Bodeep, A wavelength-division multi-plexed passive optical network with cost-shared components, IEEE Photon. Technol. Lett.,vol. 6, no. 11, Nov. 1994, pp. 1365–1367.
30. J. Kani, M. Teshima, K. Akimoto, N. Takachio, H. Suzuki, K. Iwatsuki, and M. Ishii, AWDM-based optical access network for wide-area gigabit access services, IEEE Commun.,vol. 41, no. 2, Feb. 2003, pp. S43–S48.
31. H. Takesue and T. Sugie, Wavelength channel data rewrite using saturated SOA modulatorfor WDM networks with centralized light sources, IEEE/OSA J. Lightwave Technol.,vol. 21, no. 11, Nov. 2003, pp. 2546–2556.
32. J. H. Lee, S.-H. Cho, H.-H. Lee, E.-S. Jung, J.-H. Yu, B.-W. Kim, S.-H. Lee, J.-S. Koh,B.-H. Sung, S.-J. Kang, J.-H. Kim, K.-T. Jeong, and S. S. Lee, First commercial deploymentof a colorless gigabit WDM/TDM hybrid PON system using remote protocol terminator,J. Lightwave Technol., vol. 28, no. 4, Feb. 15, 2010.
33. J. Prat, C. Arellano, V. Polo, and C. Bock, Optical network unit based on a bidirectionalreflective semiconductor optical amplifier for fiber-to-the-home networks, IEEE Photon.Technol. Lett., vol. 17, no. 1, Jan. 2005, pp. 250–252.
34. S. B. Tridandapani, B. Mukherjee, and G. Hallingstad, Channel sharing in multihop WDMlightwave networks: Do we need more channels? IEEE/ACM Trans. Network., vol. 5, no. 5,Oct. 1997, pp. 719–727.

214 NEXT-GENERATION BROADBAND OPTICAL ACCESS NETWORKS
35. X. Zhao and F. S. Choa, Demonstration of 10-Gb/s transmissions over 1.5-km-long mul-timode fiber using equalization techniques, IEEE Photon. Technol. Lett., vol. 14, no. 8,Aug. 2002, pp. 1187–1189.
36. S. S.-H. Yam, F.-T. An, S. Sinha, M. E. Marhic, and L. G. Kazovsky, 40 Gb/s transmis-sion over 140 m of 62.5 µm multimode fiber using polarization-controlled launch, pre-sented at the Conference on Lasers and Electro-Optics CLEO 2004, San Francisco, May2005.
37. T. Itoh, H. Fukuyama, S. Tsunashima, E. Yoshida, Y. Yamabayashi, M. Muraguchi,H. Toba, and H. Sugahara, 1 km transmission of 10 Gb/s optical signal over LegacyMMF using mode-limiting transmission and incoherent light source, presented at theOptical Fiber Communication Conference OFC 2005, Anaheim, CA, Mar. 2005.
38. S. S.-H. Yam, J. Kim, D. Gutierrez, and F. Achten, Optical access network using centralizedlight source, single mode fiber + broad wavelength window multimode fiber, IEEE/OSAJ. Opt. Network., vol. 5, no. 8, Aug. 2006, pp. 604–610.
39. J. Kim, S. S.-H. Yam, D. Gutierrez, and L. G. Kazovsky, BER performance on ac-cess network using centralized light sources and single mode + multi mode fiber, pre-sented at the Optical Fiber Communication Conference OFC 2006, Anaheim, CA, Mar.2006.
40. R. Davey, J. Kani, F. Bourgart, and K. McCammon, Options for future optical accessnetworks, IEEE Commun., vol. 44, no. 10, Oct. 2000, pp. 50–56.
41. Y.-L. Hsueh, M. S. Rogge, S. Yamamoto, and L. G. Kazovsky, A highly flexible andefficient passive optical network employing dynamic wavelength allocation, J. LightwaveTechnol., vol. 23, no. 1, Jan. 2005, pp. 277–286.
42. Y.-L. Hsueh, M. S. Rogge, W.-T. Shaw, S. Yamamoto, and L. G. Kazovsky, Qualityof service support over SUCCESS-DWA: a highly evolutional and cost-effective opticalaccess network, presented at the Optical Fiber Communication Conference 2005, Mar.2005.
43. C. Bock, J. Prat, and S. D. Walker, High-density ring-tree advanced access topologydelivering bandwidth on demand over a resilient infrastructure, presented at the EuropeanConference on Optical Communications ECOC 2006, Cannes, France, Sept. 2006.
44. J. J. Lepley, M. P. Thakur, I. Tsalamanis, S. D. Walker, K. Habel, K.-D. Langer,G.-J. Rijckenberg, A. Ng’oma, A. M. J. Koonen, and J. S. Wellen, Interoperability oflast mile access technologies over a passive optical ring network: results of the MUSEdemonstration, presented at the European Conference on Optical Communications ECOC2006, Cannes, France, Sept. 2006.
45. F.-T. An, K. S. Kim, D. Gutierrez, S. Yam, E. Hu, K. Shrikhande, and L. G. Kazovsky,SUCCESS: a next-generation hybrid WDM/TDM optical access network architecture,IEEE/OSA J. Lightwave Technol., vol. 22, no. 11, Nov. 2004, pp. 2557–2569.
46. F.-T. An, D. Gutierrez, K. S. Kim, J. W. Lee, and L. G. Kazovsky, SUCCESS-HPON:a next-generation optical access architecture for smooth migration from TDM-PON toWDM-PON, IEEE Commun., vol. 43, no. 11, Nov. 2005, pp. S40–S47.
47. K. S. Kim, D. Gutierrez, F.-T. An, and L. G. Kazovsky, Batch scheduling algorithm forSUCCESS WDM-PON, presented at the IEEE Global Telecommunications ConferenceGLOBECOM 2004, Dallas, TX, Nov. 2004.
48. K. S. Kim, D. Gutierrez, F.-T. An, and L. G. Kazovsky, Design and performance analysis ofscheduling algorithms for WDM-PON under SUCCESS-HPON architecture, IEEE/OSAJ. Lightwave Technol., vol. 23, no. 11, Nov. 2005, pp. 3716-3731.

REFERENCES 215
49. D. Gutierrez, K. S. Kim, F.-T. An, and L. G. Kazovsky, SUCCESS-HPON: migrating fromTDM-PON to WDM-PON, presented at the European Conference on Optical Communi-cations ECOC 2006, Cannes, France, Sept. 2006.
50. K. S. Kim, On the evolution of PON-based FTTH solutions, Inf. Sci., vol. 149, no. 1–2,Jan. 2003, pp. 21–30.
51. G. Kramer, B. Mukherjee, and G. Pesavento, IPACT: a dynamic protocol for an EthernetPON (EPON), IEEE Commun., vol. 40, Feb. 2002, pp. 74–80.
52. F. Jia, B. Mukherjee, and J. Iness, Scheduling variable-length messages in a single-hopmultichannel local lightwave network, IEEE/ACM Trans. Network., vol. 3, no. 4, Aug.1995, pp. 477–488.
53. B. Bosik and S. Kartalopoulos, A time compression multiplexing system for a circuitswitched digital capability, IEEE Trans. Commun., vol. 30, no. 9, Sept. 1982, pp. 2046–2052.
54. A. Varga, OMNeT++: discrete event simulation system, Version 3.2, http://www.omnetpp.org/, Oct. 2005.

CHAPTER 5
HYBRID OPTICAL WIRELESSACCESS NETWORKS
Optical and wireless networks were developed initially for different communica-tion purposes and applied in different scenarios. Optical network technology wasdeveloped for long-distance and high-bandwidth communications, and wireless net-work technology for short-distance communication systems that do not require highbandwidth but do require flexibility. In the last two decades, however, due to theinsatiable growth of bandwidth demand and the desire of end users for ubiquitousInternet access, optical and wireless communication technologies have been em-ployed in last-mile connections to enhance bandwidth and to enable flexibility andmobility, respectively. Today we are witnessing the convergence of optical and wire-less technologies at the access segment of the Internet hierarchy (Figure 5.1).
To date, various optical and wireless access solutions have been developed toaddress various challenges of access networks, such as broadband service, cost-efficiency, and demand for mobility. For example, passive optical networks (PONs)[1,2] have emerged to replace copper wire access networks for bandwidth enhance-ment, and IEEE 802.16 (WiMAX) [3,4] has been developed to provide cost-effectiveand flexible Internet access. Since current optical and wireless access technologiesaim to address different issues, it is difficult for any single technology to resolve allthe challenges in access networks. For example, albeit optical access technologiesenable broadband services, the dedicated infrastructure to a user’s house leads to sig-nificant deployment cost, and network availability is confined within a residential andbusiness unit. Similarly, despite its ubiquitous and flexible connectivity, the limited
Broadband Optical Access Networks, First Edition. Leonid G. Kazovsky, Ning Cheng, Wei-Tao Shaw,David Gutierrez, and Shing-Wa Wong.C© 2011 John Wiley & Sons, Inc. Published 2011 by John Wiley & Sons, Inc.
216

WIRELESS ACCESS TECHNOLOGIES 217
OpticalNetwork
WirelessNetwork
HybridOptical
WirelessAccess
LongHaul MAN
OpticalAccess LAN
CellularWirelessAccess
(Low)(High) Bandwidth
FIGURE 5.1 Convergence of optical and wireless networks at the access segment.
bandwidth of wireless access technologies prevents simultaneous broadband accessamong a large number of users.
In light of the complementary characteristics of optical and wireless technolo-gies, a hybrid optical wireless access network may provide a desirable compromiseamong bandwidth, cost, and network availability issues. Specifically, a hybrid opticalwireless access architecture consists of wireless networks in a user’s proximity andoptical networks as the backhaul. In the front end, wireless networks are deployed topenetrate into a user’s vicinity, facilitating ubiquitous connectivity and minimizingthe deployment cost. In the back end, the broadband optical backhaul networks aredeployed to connect the wireless network and the central office that manages theentire network. Compared with wireless access solutions that are limited in band-width, a hybrid optical wireless architecture should be able to facilitate bandwidthupgrade in the wireless segment by deploying more resources in the optical segment.On the other hand, compared with optical access solutions that require deployinginfrastructure to a user’s proximity, a hybrid optical wireless architecture shouldbe able to reduce the service cost by replacing the last/first hundreds of feet ofinfrastructure on the optical segment with ubiquitous wireless links. As a result, a hy-brid optical wireless access network should enable scalable bandwidth provisioningaccording to the demand in a cost-effective manner. Since in-depth knowledge of op-tical access networks has been provided in earlier chapters, in the following sectionswe introduce two emerging wireless access technologies: WiMAX and Wi-Fi meshnetworks, as background knowledge, before we dive into hybrid optical–wirelessaccess networks.
5.1 WIRELESS ACCESS TECHNOLOGIES
5.1.1 IEEE 802.16 WiMAX
The mobile worldwide interoperability for microwave access (WiMAX) is an emerg-ing wireless access technology designed to replace wireline access technologies suchas coaxial cable and digital subscriber loop (DSL) and to support mobile communi-cations. It is based on the IEEE 802.16 2004 air interface standard [3], specifying

218 HYBRID OPTICAL WIRELESS ACCESS NETWORKS
FIGURE 5.2 Mobile WiMAX network architecture.
the basic technologies and performance requirements in the physical (PHY) andmedium access control (MAC) layers, and on the IEEE 802.16e amendment [4], anamendment to add features and attributes that are necessary to support mobility inthe WiMAX network.
The typical mobile WiMAX network illustrated in Figure 5.2 serves fixed, no-madic, and mobile users. A WiMAX base station covers a cell with radius up to1 km in urban areas, 1 to 3 km in a suburban area, and more than 10 km in arural area. For mobile users a mobile WiMAX can support up to 120 km/h withhandoff. The target applications of a WiMAX network include voice over Internetprotocol (VoIP), videoconferencing, streaming media, interactive real-time gaming,Web browsing, instant messaging, and multimedia downloading. Some of these ap-plications consume significant bandwidth and/or require short end-to-end latency.Connections in mobile WiMAX are based on an Internet protocol (IP) end-to-endnetwork, which is an integrated data-communications network that uses an IP addressfor the end-to-end connection. This architecture separates the last-mile access networkfrom the IP connectivity service and supports global roaming and interworking withother systems.
Concerning system capacity, the peak downlink throughput of a mobile WiMAXnetwork can achieve up to 60 Mb/s and uplink 28 Mb/s (given a 10-MHz channelbandwidth allocation; the channel bandwidth allocation will be explained later). Likemost other wireless systems, the capacity of mobile WiMAX depends heavily onthe geographical distribution of users. The maximum throughput occurs when allusers are close to the base station and with the line-of-sight wireless link. Wheremost users are at the edge of a cell, the downlink throughput decreases to 2 Mb/sand the uplink to 400 kb/s. In more general cases, where users are evenly dis-tributed within a cell, the throughout varies depending on dynamic user demand.To achieve fair bandwidth allocation among users, a scheduler with a proper fair-ness algorithm should be employed in a mobile WiMAX network. In the follow-ing sections we introduce the key features and enabling technologies of a mobileWiMAX system.

WIRELESS ACCESS TECHNOLOGIES 219
5.1.1.1 RF Bands Specified in Mobile WiMAX Multiple radio-frequencybands are specified in the mobile WiMAX standard [3]. These bands are eitherlicensed or license-exempt.
10 to 66-GHz Licensed Bands In 10 to 66-GHz bands, due to the high radio fre-quency, a line-of-sight (LOS) propagation environment is required, and the multipatheffect is negligible. In this band, channel bandwidths of 25 or 28 MHz are typicallyassigned for high throughput. With raw data rates in excess of 120 Mb/s, transmissionat these bands is well suited for point-to-multipoint (PMP) access serving applicationsfrom small and home offices to medium-sized and large office applications.
Frequencies Below 11 GHz Frequencies below 11 GHz do not require an LOSpropagation environment, and the multipath effect may be significant due to the longerwavelength. The ability to support near-LOS and non-LOS (NLOS) scenarios requiresadditional PHY functionality, such as the support of advanced power managementtechniques, interference mitigation and coexistence, and multiple antennas.
License-Exempt Frequencies Below 11 GHz (Primarily 5 to 6 GHz) Forlicense-exempt bands below 11 GHz, the LOS propagation environment and multipatheffects are similar to those of licensed bands below 11 GHz. Nonetheless, the license-exempt nature introduces additional interference and coexistence issues, whereasregulatory constraints limit the radiated power allowed. Note that this band is usedexclusively in a mobile WiMAX network to support mobility.
5.1.1.2 Orthogonal Frequency-Division Multiplexing in WiMAX As inmost other broadband wireless communications systems, a multicarrier modulation(MCM) scheme is used in mobile WiMAX, which is a powerful and practical tech-nique to achieve high data rates over frequency-selective channels [5,6]. In typicalMCM systems, various transmission parameters, such as modulation scheme, cod-ing rate, and transmitter power, can be adjusted to optimize the overall performanceaccording to the channel characteristics, if they are available. In particular, ratherthan allocating equal power and data rate among the subcarriers, one can adapt tothe propagation environment by dynamically allocating power and data rate acrosssubcarriers to optimize system throughput in an MCM system [7,8].
Among different MCM schemes, orthogonal frequency-division multiplexing(OFDM) is an extended, multiuser orthogonal frequency-division multiplexing thatcan accommodate many users at the same time on the same channel [9]. OFDMis used in a mobile WiMAX system because it provides tolerance to multipath,frequency-selective fading, scalable channel bandwidth, and high compatibility withadvanced antenna technology [10]. As shown in Figure 5.3, in an OFDM system theRF spectrum is divided into multiple-frequency subcarriers to facilitate multiplexing.The subcarriers in a WiMAX system are categorized into three types, dependingon their functions (as in Figure 5.4): (1) data subcarriers for data transmission, (2)pilot subcarriers for channel estimation and system synchronization, and (3) nullsubcarriers for guard bands and dc carriers. The input data stream for each user is

220 HYBRID OPTICAL WIRELESS ACCESS NETWORKS
Transmit PulseShaping
MultipathChannel
Receive PulseMatched Filter
e jw0t e –jw0t
a0(t ) â0(t )g(t )
h(t )
e jw1t
a1(t ) g(t )
e jwN–1t
aN–1(t ) g(t )
g* (–t )
e –jw1t
â1(t )g* (–t )
e –jwN–1t
âN –1(t )g* (–t )
FIGURE 5.3 OFDM system architecture.
divided into several parallel data paths or substreams, each at a reduced data rate,and the substreams are modulated and transmitted on separate orthogonal subcarri-ers. Given these subcarriers, resource/bandwidth allocation can be achieved in boththe time and frequency domains by means of symbols and subcarriers, respectively;thus, the bandwidth for each user can be adjusted dynamically and flexibly accordingto demand. Due to the reduced data rate in each subcarrier, the symbol duration isincreased, which in turn improves the robustness to delay spread that often occursin a non-line-of-sight wireless channel. By introducing a guard time that is greaterthan the delay spread for each OFDM symbol, the intersymbol interference (ISI) dueto delay spread can almost be eliminated. The frequency diversity of the multipathchannel is exploited by coding and interleaving the information across the subcarriersprior to transmission. By using frequency-selective scheduling, the right subcarriersare selected for each user to minimize the impact of frequency-selective fading.
WiMAX supports various modulation schemes and coding rates: BPSK, QPSK,16QAM, and 64QAM, and the coding efficiency ranges from 1/2 to 5/6, to furtherboost the level of system capacity. The combinations of modulations and code ratesprovide a fine resolution of data rates, as shown in Figure 5.5, in the 5- and 10-MHz
DataSub-carriers
DCSub-carrier
PilotSub-carriers
GuardSub-carriers
FIGURE 5.4 OFDMA subcarrier in a WiMAX system.

WIRELESS ACCESS TECHNOLOGIES 221
Parameter
System Bandwidth 10 MHz5 MHz
102.9 microseconds5 milliseconds
4844
512 102492 104
13627217
18412072030
18428056035
6036015
FFT SizeNull Sub-CarriersPilot Sub-CarriersData Sub-Carriers
Sub-ChannelsSymbol Period, TsFrame Duration
OFDM Symbols/FrameData OFDM Symbols/Frame
Mod.
QPSK 1/2 CTC, 6x 0.530.791.583.17
4.756.349.509.5012.6714.2615.84
0.380.571.142.28
3.434.576.856.859.1410.2811.42
1.061.583.176.34
9.5012.0719.0119.0126.3428.5131.68
0.781.182.354.70
7.069.4114.1114.1118.8221.1723.52
1/2 CTC, 4x
3/4 CTC
3/4 CTC1/2 CTC
1/2 CTC2/3 CTC3/4 CTC5/6 CTC
1/2 CTC, 2x1/2 CTC, 1x
16QAM
64QAM
Rate ID Modulationrate
Coding Informationbits/symbol
Information bits/OFDM symbol
Peak data rate in 5 MHz(Mb/s)
0
1
2
3
4
5
6
BPSK
QPSK
QPSK
16QAM
16QAM
64QAM
64QAM
1/2
1/2
3/4
1/2
3/4
2/3
3/4
0.5
1
1.5
2
3
4
4.5
88
184
280
376
568
760
856
1.89
3.95
6.00
8.06
12.18
16.30
18.36
Code Rate5 MHz Channel 10 MHz Channel
Downlink
DownlinkRate, Mbps
DownlinkRate, Mbps
UplinkRate, Mbps
UplinkRate, Mbps
DownlinkUplink Uplink
FIGURE 5.5 Modulations and code rates for mobile WiMAX. (From [10].)
channels. Each frame has 48 OFDM symbols, with 44 OFDM symbols available fordata transmission. The amount of error tolerated depends on the reliability and QoSrequirements of each connection.
In an OFDM system, the data can be modulated using inverse fast Fourier transform(IFFT), which enables bandwidth scalability by proportioning the FFT size accordingto the channel bandwidth. In this way, not only is the implementation complexityreduced, but also a mobile WiMAX system is transparent to the higher layers and

222 HYBRID OPTICAL WIRELESS ACCESS NETWORKS
is compatible with various RF spectrum regulations in different countries to achieveworldwide interoperability, as its name suggests.
Compatibility with advanced antenna technology is a significant strength of anOFDM system, because it slices a wideband frequency-selective channel into a num-ber of narrowband subcarriers. This allows signal processing of advanced antennatechnology over flat subcarriers without the complex equalizers that are often requiredin a wideband, frequency-selective fading channel. Currently, mobile WiMAX sup-ports space-time coding, spatial multiplexing, and smart antenna beamforming, whichare powerful techniques to improve spectral efficiency and system capacity.
5.1.1.3 Duplex Scheme and Frequency Reuse in a WiMAX SystemWiMAX standards [3] support time-division-duplex (TDD), frequency-division-duplex (FDD), and half-duplex FDD operation. TDD requires only one channelfor transmitting downlink and uplink subframes at two distinct time slots, whereasFDD requires two distinct channels for transmitting downlink and uplink subframesin the same time slot. In half-duplex FDD operation, a user device can only transmitor receive at any given time. Currently, the initial release of a WiMAX certifica-tion profile will consider the TDD scheme only for the following reasons: (1) TDDenables flexible bandwidth allocation between downlink and uplink to support anefficient asymmetric traffic pattern; (2) TDD assures channel reciprocity for bettersupport of link adaptation, MIMO, and other closed-loop advanced antenna tech-nologies; (3) unlike FDD, TDD requires only a single channel for both downlink anduplink, so that it provides greater flexibility for adaptation to varied global spectrumallocations; and (4) transceiver designs for TDD implementations are less complexand therefore less expensive. To counter interference issues, however, TDD requiressystemwide synchronization. With ongoing releases, FDD profiles will be consid-ered by the WiMAX Forum to address specific market opportunities where localspectrum regulatory requirements either prohibit TDD or are more suitable for FDDdeployment.
Due to the scarce spectrum resources, the frequency channels must be reusedthroughout a WiMAX system by controlling the transmission power of the basestation and user devices, as in cellular systems. To maximize spectral efficiency,WiMAX supports a frequency reuse of 1 (i.e., all cells operate on the same frequencychannel). However, due to heavy co-channel interference, users at the cell edge maysuffer degradation in connection quality in frequency reuse of 1 deployment. SinceOFDMA divides the frequency channel into subchannels, the interference at the celledge can easily be addressed by reconfiguring the subchannels. The reuse pattern ofsubchannels can be configured so that all the subchannels can be used to serve usersclose to the base station, while a fraction of the subchannels are allocated to serveusers at the cell edge. Figure 5.6 shows an exemplary reuse pattern, where F1, F2,and F3 are three different subchannels. In this configuration, a full-load frequencyreuse of 1 is maintained for users close to the base station, to maximize spectralefficiency, whereas fractional frequency reuse is used to improve user connectionquality and throughput at the cell edge.

WIRELESS ACCESS TECHNOLOGIES 223
F3
F1F2
F1+F2+F3
FIGURE 5.6 Subchannel reuse pattern source.
5.1.1.4 MAC Protocol of WiMAX In wireless network systems, medium ac-cess control (MAC) plays a key role in bandwidth efficiency and user experience. InIEEE 802.11, for example, the MAC protocol uses contention-based access; that is,all subscriber stations that wish to pass data through a wireless access point are com-peting for the channel on a random-interrupt basis. As traffic loading increases, thecontention will cause a large amount of interference among the subscriber stations,which not only reduces bandwidth efficiency but also leads to significant perfor-mance degradation such as lower throughput, longer packet delay, and even packetdrop. This performance degradation challenges services such as voice over IP orvideo streaming, which are sensitive to quality of service (QoS), to be supported inWi-Fi networks.
In contrast, the MAC protocol of IEEE 802.16 uses a scheduling algorithm forwhich the subscribers just need to contend once (for initial entry into the network).After a full round of contention, each subscriber is allocated an access time slotby the base station. The resource allocated to one subscriber station by the MACscheduler can vary from a single time slot to the entire frame, thus providing a largerange of throughput to a specific subscriber station at any given time. Furthermore,for each user the resource allocation information is conveyed at the beginning ofeach frame, so the scheduler can effectively change the resource allocation on aframe-by-frame basis to adapt to the bursty nature of the traffic. Besides improvingbandwidth efficiency, the scheduling algorithm also allows the base station to controlQoS parameters by balancing the time-slot assignments among the application needsof the subscriber stations. In fact, the WiMAX standard was developed at the outset forthe delivery of broadband services, including voice, data, and video. The applicationsinclude IPTV, VoIP, videoconferencing, Web services, and computer data services.It is designed to support bursty data traffic with high peak-rate demand [11] whilesimultaneously supporting streaming video and latency-sensitive voice traffic overthe same channel. In the next section we review in more detail the QoS supportedby WiMAX.

224 HYBRID OPTICAL WIRELESS ACCESS NETWORKS
5.1.1.5 Quality of Service Support As mentioned, the fundamental premiseof the WiMAX MAC protocol is to support QoS. With a fast air interface, fine band-width granularity, and a flexible resource allocation mechanism, QoS requirementscan be met for a wide range of data services, such as voice and video. As defined inthe MAC protocol, QoS is provided via service flows with a particular set of QoSparameters [3]. Before providing a certain type of data service, the base station anduser terminal first establish a unidirectional logical link between the peer MACscalled a connection. The outbound MAC then associates packets traversing the MACinterface into a service flow to be delivered over the connection. The service flows canbe mapped to fine granular IP sessions or coarse differentiated service code points toenable end-to-end IP-based QoS. Additionally, subchannelization and medium accessprotocol (MAP)-based signaling schemes provide a flexible mechanism for optimalscheduling of broadcast and unicast traffic using space, frequency, and time physicalresources over the air interface on a frame-by-frame basis. The QoS parameters asso-ciated with the service flow define the transmission ordering and scheduling on the airinterface. The connection-oriented QoS can therefore provide accurate control overthe RF interface. The service flow parameters can be managed dynamically throughMAC messages to accommodate the dynamic bandwidth demand. The service flow–based QoS mechanism applies to both downlink and uplink, to improve QoS inboth directions.
5.1.1.6 Mobile Multihop Relay WiMAX Networks The WiMAX networkdefined in the IEEE 802.16-2004 air interface standard [3] and IEEE 802.16e amend-ment [4] is a single-hop wireless network. To improve the network coverage andflexibility of the current mobile WiMAX standard with limited wired connectionsto WiMAX base stations, a new task group, IEEE 802.16j [12], was established in2006 to support mobile multihop relay (MMR) operation in the current IEEE 802.16estandard. A topology envisioned for a future IEEE 802.16j MMR network is depictedin Figure 5.7. To accommodate the multihop transmission between WiMAX sta-tions, numerous technical challenges, such as the OFDMA frame structure, routingpath management, handoff, security, and relay reliability need to be addressed whilemaintaining compatibility with the current WiMAX standard. In fact, using multihop
Base Relay Relay Relay Link
StationStationRelay Station
Link
FIGURE 5.7 IEEE 802.16j: mobile multiple relay WiMAX network.

WIRELESS ACCESS TECHNOLOGIES 225
communications to enhance network coverage and flexibility with a limited wired con-nection is not a new idea. For example, mobile ad-hoc networks (MANETs) [13] areinfrastructure-less, decentralized wireless networks. In a MANET every network en-tity can move and function as a router that discovers and maintains routes to other en-tities in the network. Historically, MANETs have been developed for special applica-tions such as on battlefields, in emergency networks, and in wireless sensor networks.Another example is the wireless mesh network (WMN), an infrastructure-based, hi-erarchical multihop network. In a WMN, wireless mesh routers, deployed as networkinfrastructure, interface with a subscriber’s device and relay traffic to and from othermesh routers. The goal of WMNs is to provide an affordable and scalable wirelessaccess solution for community and metropolitan areas [14]. Given the rapid advancein wireless communications, WMNs have been commercialized using high-speed,cost-effective wireless interfaces and technologies. In some U.S. cities, for example,WMNs using IEEE 802.11a/b/g as the interface have been deployed to provide wire-less Internet access services [15,16]. By upgrading to higher-data-rate technologiessuch as mobile WiMAX, WMNs have been considered a promising wireless accesssolution to replace or complement existing access networks in metropolitan areas. Inthe hybrid optical–wireless architecture to be introduced, therefore, we use WMN asthe wireless segment. In the following sections we introduce WMNs in detail.
5.1.2 Wireless Mesh Networks
A wireless mesh network (WMN) consists of multihop wireless communicationlinks to forward traffic to and from wired Internet entry points [14], as depicted inFigure 5.8. On a WMN, any node can communicate with any other through a routecomprising multiple wireless links (e.g., nodes A and B via the route formed by nodes1, 2, and 3). A WMN dynamically self-configures and automatically maintains the
3
21
A
Wireless Mesh Node
B45
6
FIGURE 5.8 Generic wireless mesh network.

226 HYBRID OPTICAL WIRELESS ACCESS NETWORKS
mesh connectivity among nodes in the network. One important feature of WMNs isthe self-healing capability: for example, if the link between nodes 1 and 2 fails, thetraffic between nodes A and B can go through the route formed by nodes 4, 5, and 6.
A WMN originates from mobile ad hoc networks [13], which have been developedhistorically for specific applications. Fueled by the advances of wireless technologiesand ad hoc networking optimization, in the last decade WMNs have found moregeneral applications, such as the extension of wireless local area networks, citywidewireless access networks, community wireless networks, and public safety networks[17]. Compared to conventional single-hop wireless networks, WMNs enhance net-work coverage cost-effectively and improve load balancing across the network. Inaddition, WMNs have several advantages, such as robustness to node failures, fastnetwork deployment, ease of maintenance, and low initial deployment cost [14,17].
Depending on the applications and type of nodes, WMNs can be categorized asclient WMNs or infrastructure WMNs.
5.1.2.1 Client Wireless Mesh Networks Client WMNs are infrastructure-less, peer-to-peer wireless networks. As illustrated in Figure 5.9, a client WMNconsists of only one type of mesh nodes, client devices that provide end users with anapplication interface. These client devices perform traffic routing and mesh config-uration functionalities among themselves, and they usually have mobility. Recently,an IEEE technical task group under IEEE 802.11 has been working to develop anew client WMN standard, the IEEE 802.11s [18]. Based on the PHY interface andMAC protocol defined by IEEE 802.11a/b/g, IEEE 802.11s focuses on the networkformation, maintenance, and traffic routing. For portable client devices such as laptopand PDA, the transmission power is usually limited, so IEEE 802.11s is consideredas an extension of wireless local area networks (WLANs).
5.1.2.2 Infrastructure Wireless Mesh Networks An infrastructure WMNhas a hierarchical network architecture consisting of two types of wireless nodes:wireless mesh routers and client devices (Figure 5.10). Wireless mesh routers aredeployed as infrastructure without mobility; client devices are usually mobile andprovide an application interface to end users. In this architecture there are two link
Client Device
FIGURE 5.9 Client wireless mesh network.

WIRELESS ACCESS TECHNOLOGIES 227
Internet
Client DeviceMesh Router Gateway Router
FIGURE 5.10 Infrastructure wireless mesh network.
layers: (1) the links between a mesh client and a mesh router, and (2) the links betweenmesh routers. As in Figure 5.10, wireless mesh routers form a self-configuring,self-healing mesh network. Among mesh routers, one or some mesh routers havewired connections to the Internet, called gateway routers, and traffic is distributedor aggregated from or to the routers. Considering Figure 5.8, upstream traffic fromthe end user is first transmitted by the mesh client and received by the nearby meshrouter (i.e., router 2). Then the packets are relayed to one of the nearby gatewayrouters, gateway router A or B. The downstream traffic is forward from the gatewayrouter to the end user in the same manner but in the reverse direction. IEEE802.11technologies are widely used in the lower layer of most infrastructure WMNs dueto their wide popularity among portable electronic devices and PCs and their lowcost. The higher layer link can be built using various types of radio technologies,in addition to the most used IEEE 802.11 technologies. Infrastructure WMNs areemerging as a promising wireless access solution to complement or even replacewired access networks because of its cost-effectiveness, scalable architecture, andflexible network deployment.
Since this book’s emphasis is on access networks, in the rest of this chapterwe focus on infrastructure WMNs, and WMN is referred to hereafter as infrastruc-ture WMN.
5.1.2.3 PHY and MAC Layers of WMN As mentioned earlier, IEEE802.11b/a/g (Wi-Fi) technologies are widely exploited both in the links betweenmesh routers and in the links between mesh routers and client devices [15,16,19].These Wi-Fi-based WMNs are going to be deployed in urban areas in North Amer-ica. However, due to the multihop communications among mesh routers in an openenvironment, as network load increases, co-channel interference among mesh routerswill increase significantly. As designed originally for local area networks, the PHYtechnology and CSMA-CA (carrier-sense multiple access with collision avoidance)protocol of Wi-Fi are not optimized for high-load situations. Therefore, the network

228 HYBRID OPTICAL WIRELESS ACCESS NETWORKS
TABLE 5.1 Summary of IEEE 802.11 Standards
Parameter 802.11b 802.11g 802.11a 802.11n
Maximum bit rate (Mb/s) 11 54 54 200+Nonoverlapping channels 3 × 20 MHz 3 × 20 MHz 15 × 20 MHzMaximum uplink distance (m) 100 100 50 100
efficiency at the higher layer of Wi-Fi based WMNs will degrade significantly as thenetwork is highly loaded. The family of IEEE 802.11 standards is summarized inTable 5.1.
To improve the overall network performance of WMNs, therefore, new technolo-gies and protocols in the PHY and MAC layers and a new routing protocol have beenproposed [17]. In the PHY layer, for example, smart antenna, multi-input multi-output(MIMO), and multichannel/interface systems are being explored to enhance networkcapacity. MAC protocols based on distributed time- and code-division multiplexingaccess are expected to improve the bandwidth efficiency from CSMA/CA protocols[17]. Furthermore, in WMNs, since packets are routed among mesh routers in thepresence of interference, shadowing, and fading, a cross-layer design is requiredto optimize routing in WMNs. To accommodate the projection of demand increasefor Wi-Fi-based WMN, WMN vendor companies have proposed using WiMAX(IEEE 802.16) to enhance the higher-layer link capacity of WMNs [15]. Ultrahigh-bandwidth standards such as the emerging IEEE 802.16m, which aims to provide1-Gb/s and 100-Mb/s shared bandwidth for residential and mobile users [20], can beemployed to further enhance capacity.
5.1.2.4 Routing in Wireless Multihop Networks Routing for wirelessmultihop networks has been researched extensively in the context of wireless ad hocnetworks. There exist several algorithms or protocols for routing with varying per-formance parameters. Basically, these routing protocols can be categorized into twoclasses: the proactive class and the reactive class, represented by the optimizedlink state routing (OLSR) [21] and ad hoc on-demand distance vector (AODV)[22] protocols, respectively. The proactive routing protocols compute possible pathsto all destinations, regardless of the traffic demand between the communicatingnode pairs, and store them in routing tables. Since these tables need to be updatedin a time-varying environment, the overhead may become prohibitively high for alarge network. The reactive routing protocols, on the other hand, compute routingpaths on an “on-demand” basis, as determined by the dynamics of the traffic cate-gories and network topology. The overhead for maintaining a large routing table canthus be avoided. However, for reactive routing protocols the delay in establishinga new path is longer. The proactive and reactive routing protocols are summarizedin Figure 5.11.
More recently, in the context of wireless community networks, several routing met-rics have been suggested to incorporate underlying physical layer conditions [23–26].For example, the expected transmission count (ETX) is proposed [25] to minimize

WIRELESS ACCESS TECHNOLOGIES 229
Reactive RoutingProactive Routing
Destination
Source
• Routes calculated before needed;• Keep routing-information to all nodes;
• Route calculated when needed;• Not keep routing-information to all node;
• Issues: big routing table & bandwidth overhead for large network size.
• Example: Optimized link state routing (OLSR)
• Issues: High delay for large network size.
• Example: Ad-hoc On-Demand Distance (OLSR) Vector (AODV)
FIGURE 5.11 Routing in wireless ad hoc networks.
the expected total number of packet transmissions required to deliver a packet suc-cessfully to the destination. The metric incorporates the effects of packet loss rates inboth the forward and reverse directions of a link and the interference among the suc-cessive hops of a path. In [25], ETX was adapted into two conventional shortest-pathrouting protocols, DSDV [27] and DSR [28], and was shown to improve the networkperformance via simulations and a test bed implementation consisting of 29 nodes inan office building. A similar metric, the expected transmission time (ETT) [23,24],considers the bandwidth of a link as well as the loss rate. The metric was used in arouting scheme for networks employing multiple radio interfaces and was shown toimprove performance over a scheme based on ETX. In [26], another routing algorithmbased on a cross-layer approach is proposed. The authors introduce physical layermetrics representing the transmission rate, interference, and packet error rate (PER),and develop a heuristic algorithm for joint power control and routing to optimize theinformation-theoretic capacity [29] of “dense” multihop wireless networks. Simula-tion results showed that the heuristic algorithm improved network throughput notice-ably compared to AODV [22], DSDV [27], and DSR [28], commonly benchmarkedrouting protocols.
Although WMN is one type of wireless multihop network, it is very differentfrom wireless ad hoc networks in terms of network architectures and applications.For example, wireless ad hoc networks are designed to support mobility among thenodes, to minimize power consumption, and to forward peer-to-peer traffic amongthe nodes. On the other hand, the wireless mesh routers in WMNs have no mobility,less power consumption constraint, and higher computational capability. In addition,the traffic pattern in WMNs is very different from the peer-to-peer traffic in wirelessad hoc networks since in WMNs, if not all, forwarded most, traffic is between agateway router and end users [30]. The differences between WMNs and wirelessad hoc networks are summarized in Figure 5.12.

230 HYBRID OPTICAL WIRELESS ACCESS NETWORKS
Computation PowerTraffic TypeBackhaulNodeAbility
Wireless Ad-Hoc Network
Mobile No Any node toany node
Battery Low
Wireless Mesh Network
Sink/source at YesStationarygateway
HighPlugged
FIGURE 5.12 WMNs vs. wireless ad hoc networks.
To date, most routing protocols of WMNs have been retrofitted based on wirelessad hoc network architectures. Therefore, we envision that more research should beconducted on the routing algorithm specifically for WMNs.
5.1.2.5 Propagation Environments and Models of Wireless Mesh Net-works Although there has been extensive research in communications techniquesand networking protocols for wireless ad hoc networks and more recently for WMNs,most research is based on idealized propagation models that make analysis tractablebut do not represent all the issues of radio propagation in a real environment. As a re-sult, protocols and algorithms tailored to these idealized environments do not actuallyperform as expected in real networks. In this section we review some critical issuesin a propagation model when a WMN is deployed in highly populated urban areas.
Without loss of generality, the urban area where a WMN is deployed can beassumed to have a square grid of buildings and streets. Both users on the streetand users in buildings should be considered in the propagation model. For users inbuildings, additional attenuation due to building penetration needs to be addressed.[31–37]. Mesh routers are usually placed on streetlight poles in urban areas. Hence,the topology of WMNs can be assumed to be grid networks. The distance betweenadjacent mesh routers is one of the key parameters used when deploying a WMN;it is a complicated function of many factors across various network layers, suchas the SINR required for targeted error performance under physical layer (PHY)configurations, a medium access control (MAC) scheme, and a routing strategy.
Essentially three components are involved in characterizing and modeling thepropagation of radio signals:
1. Distance-dependent path loss: describes the trend in the average signal powerreceived, as a function of the distance between the transmitter and the receiver;
2. Large-scale fading or shadowing: characterizes fluctuation in the signal powerreceived locally averaged over several wavelengths. Note that the distance-dependent path loss and large-scale fading jointly describe large-scale varia-tions in the signal strength received.
3. Small-scale fading or multipath fading: characterizes the fluctuation on theorder of a wavelength around the local average signal strength, which is causedby replicas of the signal transmitted, with random-phase shifts that arrive andadd up at the receiver.
WIRELESS ACCESS TECHNOLOGIES 231
The characteristics of each component depend strongly on the propagation envi-ronment and system parameters, such as channel bandwidth, carrier frequency, andantenna configurations at both transmitter and receiver. For highly populated urbanareas, measurement, characterization, and modeling of radio propagation have beenreported [34–41]. In particular, references 38 and 40 provide good models and pa-rameters for large-scale variation: reference 38 suggested urban propagation modelsbased on extensive measurements conducted in San Francisco, and reference 40 pro-posed models based on measurements made in central Stockholm. Next we describethe three components in detail.
5.1.2.6 Capacity and Scalability Issues of Wireless Mesh NetworksThe insatiable demand for bandwidth from end users requires access network tosupport high and scalable capacity, which is, however, a challenging issue for WMNsbecause the traffic aggregation on the relay links between mesh routers tends togrow as the number of hops increases. Unlike fiberoptic access networks, where thecapacity can be enhanced by adding more wavelengths, the bandwidth resource ofwireless networks is so scarce and expensive that the capacity cannot be increasedby increasing the frequency channels. Although the bandwidth efficiency of WMNscan be enhanced by employing advanced PHY technologies and MAC protocols, fre-quency reuse is still the most effective way to enhance the overall capacity. In cellularsystems, the network capacity can be enhanced by deploying more base stations inan area, which results in smaller cells, a technique called cell splitting. In WMNs,however, straightforward cell splitting (i.e., deploying more wireless mesh routers inan area) will not lead to capacity enhancement [14,17].
To clarify this issue, let us consider the one-dimensional WMN shown in Fig-ure 5.13(a). In this one-dimensional WMN, each mesh router (MR) is modeled asa node that connects to other nodes and the local water tank with pipes. The watertank models the service area (or cell) under each mesh router. In each water tank, thetraffic load of users (DMR) is modeled as water. The thickness of the pipes signifiesthe capacity of the links, and we assume that the capacities of two types of linksor layers (CMR-user, CMR-MR) are independent. The gateway router (GR), whichhas backhaul connection to the Internet, is the outlet of the entire system, where weassume that there is only upstream traffic.
As the traffic load from end users increases under each mesh router, the linkcapacity between the mesh router and end users may be exhausted, as indicated inFigure 5.13(b). To reduce the loading of each mesh router, we can deploy more meshrouters in a given area with lower transmission power, as in Figure 5.13(c), similarto cell splitting in cellular systems. Note that after cell splitting, the pipe between thegateway router and its adjacent mesh router needs to conduct the aggregated flows(Dagg) from more mesh routers; in this exemplar system the number increases fromthree in Figure 5.13(a) to five in Figure 5.13(c).
Also note that the pipe connecting the routers may become thinner after cellsplitting because of the increased co-channel interference from other routers. Sincethe link connecting the gateway router and its adjacent mesh router needs to aggregatetraffic on the basis of additional mesh routers, the aggregated load (Dagg) may soon

232 HYBRID OPTICAL WIRELESS ACCESS NETWORKS
CMR-user
CMR-MR
MR MR MR GR
Dagg
WiredBackhaul
DMR DMRDMR DMR
WiredBackhaul
(a)
CMR-user
CMR-MR
MR
Dagg
MR MR GR
WiredBackhaul
DMR DMR DMR DMR
WiredBackhaul(b)
CMR-user
CMR-MR
MR MR MR MR MR GR
Dagg
Pipe may be thinner due to increased interference
WiredBackhaul
DMR DMR DMR DMR DMR DMR
WiredBackhaul
(c)
FIGURE 5.13 Scalability in a one-dimensional exemplar WMN. MR, wireless mesh router;GR, wireless gateway router; Dagg, aggregated data rate; CMR-MR, link capacity betweenadjacent MRs, CMR-user, link capacity between an MR and users; DMR, total user demandwithin the area served by an MR.

WIRELESS ACCESS TECHNOLOGIES 233
Dagg
CMR-user
CMR-MR
MR
agg
MR MR MR MR GRWiredBackhaul
DMR DMR DMR DMR DMR DMR
WiredBackhaul
(d)
Wired
CMR-user
CMR-MR
MR MR MR MR GRGR
Dagg
WiredBackhaul
WiredBackhaul
(e)
DMR DMR DMR DMR DMR DMR
Wired Backhaul WiredBackhaul
FIGURE 5.13 (Continued) Scalability in a one-dimensional exemplar WMN.
exhaust the pipe capacity connecting the gateway router and its adjacent mesh router,as shown in Figure 5.13(d). The bandwidth insufficiency of this link will choke eachmesh router’s throughput and the overall network capacity of a WMN. In other words,after cell splitting, although each router’s average loading is reduced, the throughputof each router and the overall capacity of the WMN may not necessarily increase. Toimprove the performance, a straightforward solution is to upgrade the link capacityby exploiting more frequency channels and radio interfaces on the routers [17] (i.e.,widening the pipes of the model). However, since the number of available channelsin the license-free bands is few and the right to use the licensed bands is veryexpensive, this approach is limited either by the finite capacity or by the cost. Insteadof resorting to upgrading the capacity of wireless links, the throughput per router andoverall capacity can be enhanced by scaling the number of gateway routers in accordwith that of the mesh routers [i.e., replacing the middle mesh router with anothergateway router, as illustrated in Figure 5.13(e)]. After placing this gateway router,traffic flows from some mesh routers can be routed to the new gateway router, andthus the bottleneck at the original gateway router link is mitigated.
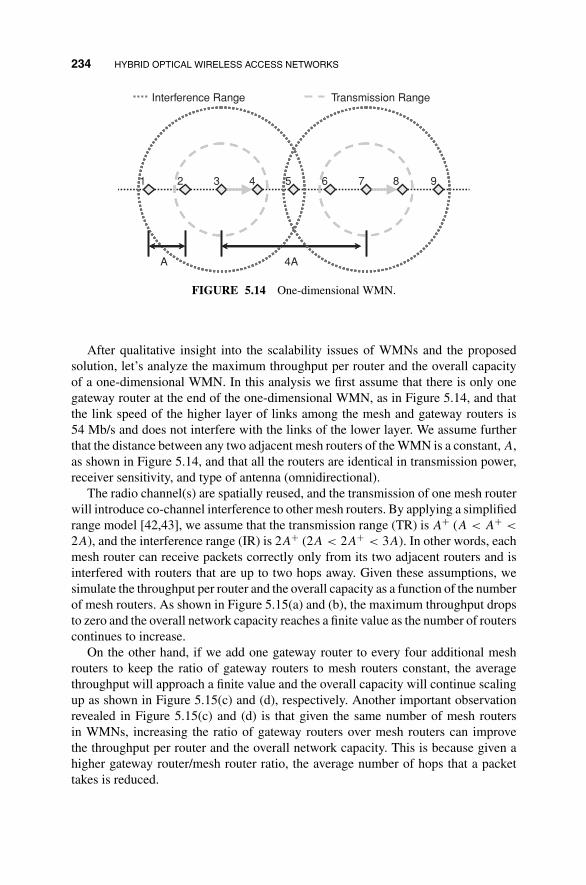
234 HYBRID OPTICAL WIRELESS ACCESS NETWORKS
Transmission RangeInterference Range
1 2 3 4 5 6 7 8 9
4AA
FIGURE 5.14 One-dimensional WMN.
After qualitative insight into the scalability issues of WMNs and the proposedsolution, let’s analyze the maximum throughput per router and the overall capacityof a one-dimensional WMN. In this analysis we first assume that there is only onegateway router at the end of the one-dimensional WMN, as in Figure 5.14, and thatthe link speed of the higher layer of links among the mesh and gateway routers is54 Mb/s and does not interfere with the links of the lower layer. We assume furtherthat the distance between any two adjacent mesh routers of the WMN is a constant, A,as shown in Figure 5.14, and that all the routers are identical in transmission power,receiver sensitivity, and type of antenna (omnidirectional).
The radio channel(s) are spatially reused, and the transmission of one mesh routerwill introduce co-channel interference to other mesh routers. By applying a simplifiedrange model [42,43], we assume that the transmission range (TR) is A+ (A < A+ <
2A), and the interference range (IR) is 2A+ (2A < 2A+ < 3A). In other words, eachmesh router can receive packets correctly only from its two adjacent routers and isinterfered with routers that are up to two hops away. Given these assumptions, wesimulate the throughput per router and the overall capacity as a function of the numberof mesh routers. As shown in Figure 5.15(a) and (b), the maximum throughput dropsto zero and the overall network capacity reaches a finite value as the number of routerscontinues to increase.
On the other hand, if we add one gateway router to every four additional meshrouters to keep the ratio of gateway routers to mesh routers constant, the averagethroughput will approach a finite value and the overall capacity will continue scalingup as shown in Figure 5.15(c) and (d), respectively. Another important observationrevealed in Figure 5.15(c) and (d) is that given the same number of mesh routersin WMNs, increasing the ratio of gateway routers over mesh routers can improvethe throughput per router and the overall network capacity. This is because given ahigher gateway router/mesh router ratio, the average number of hops that a packettakes is reduced.

WIRELESS ACCESS TECHNOLOGIES 235
Throughput v.s. Number of routers
1 Channel & 1 radio/node (without GW scaling)2 Channels & 2 radios/node (without GW scaling)
Number of mesh routers
120
100
80
60
40Thr
ough
put (
Mbp
s)
20
00 5 10 15 20 25
GW: Gateway routerMR: Mesh router
(a) Throughput vs. number of routers without increase of gateway(link rate equals to 54Mbps)
Total capacity v.s. Number of routers
1 Channels & 1 radio/node (without GW scaling)2 Channels & 2 radios/node (without GW scaling)
Number of mesh routers
120
90
100
80
70
60
40
50
Cap
acty
(M
bps)
20
30
100 5 10 15 20 25
GW: Gateway routerMR: Mesh router
(b) Capacity vs. number of routers without increase of gateway(link rate equals to 54Mbps)
FIGURE 5.15 Throughput per router and overall capacity of a one-dimensional WMN.

236 HYBRID OPTICAL WIRELESS ACCESS NETWORKS
Throughput v.s. Number of routers
1 Channels & 1 radio/node, Num(GW)/Num(MR)=1/4
2 Channels & 2 radios/node, Num(GW)/Num(MR)=1/42 Channels & 2 radios/node, Num(GW)/Num(MR)=1/3
Number of mesh routers
120
100
80
60
40Thr
ough
put (
Mbp
s)
20
00 5 10 15 20 25
GW: Gateway routerMR: Mesh router
(c) Throughput vs. number of routers with increase of gateway(link rate equals to 54Mbps)
Total capacity v.s. Number of routers
1 Channels & 1 radio/node, Num(GW)/Num(MR)=1/4
2 Channels & 2 radios/node, Num(GW)/Num(MR)=1/42 Channels & 2 radios/node, Num(GW)/Num(MR)=1/3
Number of mesh routers
450
350
400
300
250
200
150Cap
acty
(M
bps)
100
50
00 5 10 15 20 25
GW: Gateway routerMR: Mesh router
(d) Capacity vs. number of routers with increase of gateway(link rate equals to 54Mbps)
FIGURE 5.15 (Continued) Throughput per router and overall capacity of a one-dimensional WMN.
WIRELESS ACCESS TECHNOLOGIES 237
As a result, to enable flexible increase of wireless gateway routers in a WMN, abroadband and scalable backhaul network is required. The backhaul network needsto connect cost-effectively to numerous wireless gateway routers scattered geograph-ically throughout a large area, and to accommodate the increase of wireless gatewayrouters in the future.
The backhaul network for WMNs is built on either wireless or wired infrastructure.In the following sections we review these backhaul technologies.
5.1.2.7 Backhaul Network Example for WMNs To reduce deployment timeand cost, wireless backhaul is an attractive solution for network operators. Takingthe proposal of a wireless access network for San Francisco [44] as an example,wireless point-to-multipoint and ring links are deployed to collect and distributeWMN traffic across the city. The network architecture is shown in Figure 5.16(a),which forms a hierarchical wireless access network. There are five types of nodes inthe hierarchical architecture: wireless mesh routers, wireless gateway routers, accesstowers, aggregation towers, and master towers. As shown in Figure 5.16(b), there arethree layers, consisting of wireless links between different types of nodes.
� First layer (mesh layer): consists of wireless links between wireless meshrouters and gateway routers of a WMN, which are deployed throughout theurban area and penetrate a user’s premises to provide ubiquitous, blanket-coverage connection.
� Second layer (capacity injection layer): consists of high-speed point-to-multipoint wireless links between the access tower and wireless gateway routersof a WMN and aggregates the traffic from the mesh layer. For each access tower,approximately 300 Mb/s of bandwidth [45] is shared among multiple wirelessgateway routers.
� Third layer (backhaul layer): consists of (a) point-to-point wireless links be-tween the access towers and aggregation towers, and (b) point-to-point wirelesslinks among the aggregation towers and master tower.
The wireless links among the aggregation towers and master tower form a ringnetwork, and a pair of radios is used to facilitate redundancy. Note that in thislayer each point-to-point link has a dedicated (unshared) bandwidth that is lessthan 1 Gb/s.
Note that the second and third layers jointly constitute the backhaul for the lowerWMN layer. Proprietary wireless technologies have been employed to realize thebackhaul network [44]. Although this proposed wireless backhaul is readily de-ployed to bring the service up quickly, its capacity is very limited for supporting theaggregated traffic of the entire city. The capacity in the second and third layers willtherefore be exhausted soon after the network is deployed. The bandwidth insuffi-ciency in the backhaul layers will be further exacerbated as the bandwidth of thelower WMN layer is enhanced by employing advanced wireless technologies.

238 HYBRID OPTICAL WIRELESS ACCESS NETWORKS
Access
Aggregation Tower
AccessTower
Master Tower
BackhaulLayer Capacity Injection
Layer
BackboneRouter
Mesh Layer
Municipal AreaMunicipal Area
(a)
AggregationTower
MasterTower
Backhaullayer
Point to Point wireless links < 1Gbps
BackhaulLayer
CentralOffice
CapacityInjection
layer
Point to Multipoint, ~300Mbps (shared)
AccessTowerCapacity
Injection Layer
Meshlayer
Wireless mesh, 54MbpsMesh (shared)
Layer
Wireless Gateway Router
Wireless Mesh
Router
EndUser(b)
Wireless Gateway Router
Wireless Mesh
Router
EndUser
FIGURE 5.16 Hierarchical wireless access network (proposed by Google-Earthlink to thecity of San Francisco).

WIRELESS ACCESS TECHNOLOGIES 239
5.1.2.8 Broadband Backhaul Technologies To aggregate the huge volumeof WMN traffic from an urban area, a broadband backhaul network is impera-tive. Besides providing high capacity, the backhaul network should also supportlong-distance transmission to collect traffic from numerous gateway routers that aredensely deployed in an urban area. To fulfill these two requirements simultaneously,copper wire technologies may not be an appropriate solution because of their limitedbandwidth–distance product. The bit rate and transmission distance of the advanceddigital subscriber loop technology, VDSL2, and the coaxial cable are summarizedin Figure 5.17(a) and (b). As a result, we imagine that ultrabroadband wireless
160
140
120
100
80
60
40
20
0300 400 500 600 700 800 900
length [m]
symmetrical rate with Xtalk mitigation
100 Mb/ssymmetric@ 500 m
(100-PASS-TS)
symmetrical rate without Xtalk mitigation
bt r
ate
[Mb/
s]
1000 1100 1200
(a) Bit rate versus distance of VDSL2
(b) Attenuation of coaxial cable
FIGURE 5.17 Fundamental limit of the transmission distance of copper wire technologies.

240 HYBRID OPTICAL WIRELESS ACCESS NETWORKS
TABLE 5.2 Comparison of Broadband Backhaul Technologies for WMN
Millimeter-Wave Optical FiberParameter (60 GHz) Free-Space Optics Access
Maximum rate 1.25 Gb/s per TX/RX 1.25 Gb/s per TX/RX 2.5/1.25 Gb/s per λ
Maximum distance(km)
1.2 2 20
Link type Point-to-point Point-to-point Point-to-pointReliability Low (line of sight) Low (line of sight) MediumCapacity scalability Medium High (WDM) High (WDM)Dominant cost Tx/Rx Tx/Rx Infrastructure
deployment
technologies and fiber optics are appropriate candidates. Let’s review and comparethese two types of solutions.
For wireless backhaul approaches, millimeter-wave [46] and free-space optical[47] technologies are two candidates because of their high capacity. However, dueto their high carrier frequencies, these broadband wireless technologies are stronglysubject to line-of-sight conditions and thus reliability becomes an issue: Links maydegrade or be broken due to obstruction or even to harsh weather conditions. Thedegraded or broken backhaul link will affect numerous downstream WMN users.In addition, these wireless technologies can operate at full rate only within certaindistance limitations: The maximum distance between millimeter-wave transceiversis 1.2 km [46], and the maximum distance between free-space optical transceivers is2 km [47]. This distance limitation will increase the deployment cost and constrainthe flexibility as a backhaul network is deployed. The data rate, cost, and trans-mission distance of commercial millimeter-wave and free-space optical products aresummarized in Table 5.2.
In contrast to these broadband wireless backhaul technologies, fiber optical back-haul has an ultrahigh capacity, long transmission distance, and high reliability, as alsosummarized in Table 5.2. Some may argue that the cost of infrastructure deploymentof optical networks requires expensive investment. Thanks to technological advances,the cost of optical devices has dropped significantly and is now less than that of broad-band wireless equipment. In the next section we investigate the deployment cost ofthe fiber-optical infrastructure for access networks.
5.1.2.9 Deployment Cost of Backhaul Network Based on TDM-PONHistorically, fiber optical telecommunications technology was costly, so it was em-ployed mainly for long-haul systems. Nonetheless, to realize the last-mile opticalconnection to end users, new optical fiber deployment techniques and strategies havebeen developed for passive optical networks to reduce the deployment cost. Cur-rently, there are three deployment methods: (1) aerial: stringing fibers above theground, sometimes using existing utility poles; (2) buried: digging trenches to installfiber; and (3) conduit: placing fiber in existing conduit underground.

HYBRID OPTICAL–WIRELESS ACCESS NETWORK ARCHITECTURE 241
TABLE 5.3 Cost of Fiber Deployment for PON
Deployment Method Deployment Cost ($/km)
Aeriala 900Trenchinga 1200Existing conduita 700New conduitb 4000
aRonald Heron, Alcatel, Inc., NFOEC 2007 Keynote.bM. Hajduczenia et al., Optimized passive optical network deployment,J. Opt. Networking, Sept. 2007.
The typical costs of the three deployment methods are summarized in Table 5.3. Bycomparing the dominant costs of wireless technologies and optical access networks,the use of fiber optic networks as an economically feasible solution for backhaulconnection to a WMN is justified. Note that besides deploying new optical fibers,in urban areas dark fibers or dim fibers (parts of the fibers have been used forcommunications) are deployed along the streets. These fibers can readily be employedas part of the backhaul network at even lower cost.
As optical technology is used to provide backhauling to WMNs, the integrationof optical fiber backhaul and WMNs leads to a hybrid access network architecture.In the following sections we introduce hybrid optical–wireless access networks.
5.2 HYBRID OPTICAL–WIRELESS ACCESSNETWORK ARCHITECTURE
A generic hybrid optical–wireless access network is illustrated in Figure 5.18, wherewireless links provide ubiquitous links in end-users’ premises, and optical backhaulaggregates the wireless traffic. A cellular system and its backhauling network com-prise perhaps one of the first hybrid optical–wireless networks. In this type of hybridnetwork, the wireless base stations are connected to the central office/network serverthrough dedicated optical point-to-point links. Compared to the aggregated voice/datatraffic of a wireless base station, however, the dedicated high-speed optical link over-provisions bandwidth, and the infrastructure topology prohibits bandwidth and devicesharing among multiple base stations.
Optical Backhaul Wireless Mesh Networks
Central OfficeResidential & Mobile Users
FIGURE 5.18 Hybrid optical–wireless access network.

242 HYBRID OPTICAL WIRELESS ACCESS NETWORKS
Another type of hybrid optical and wireless network is the radio over fiber (ROF)technology [48]. ROF technologies allow signals of wireless communication systems,such as cellular systems and WLAN, to be transmitted transparently over optical fiber.Since the optical fiber system is transparent to the wireless signal, all the processing,such as modulation/demodulation, coding/decoing, handover, and so on, is carriedout in a central station. The two ends of the optical systems translate wireless signalto and from wireless radio signal only in the physical (PHY) layer. Since our focusis on the hybrid network architecture, which includes the physical, data link, andnetworking layers, ROF is outside the scope of our interest.
In metro WMNs, numerous wireless routers need to be deployed in users’ premisesto provide blanket coverage. The traffic of these wireless routers that are geographi-cally scattered across an urban area is forwarded to a few central offices or networkservers. To connect to widely scattered wireless routers and accommodate the ever-increasing traffic growth from end users, a cost-effective, scalable, and multiplexedoptical backhaul technology is desirable.
To fulfill these requirements, TDM-PON technology is a promising solution be-cause of its technological maturity and cost justification. The benefits of using TDM-PON to backhaul WMNs include (1) cost-effectiveness: TDM-PON allows a largeportion of infrastructure and devices in the central office to be shared among end users,the ONUs/wireless nodes; (2) bandwidth efficiency: the inherent statistical multiplex-ing of TDM-PON optimizes bandwidth usage; (3) topology flexibility: TDM-PONsupports different types of network topologies, such as tree, bus, and ring [49], inconnecting to widely scattered WMN routers.
5.2.1 Leveraging TDM-PON for Smooth Upgrade of HierarchicalWireless Access Networks
A hybrid optical wireless architecture that uses TDM-PON technology to connect tothe WMNs deployed in a metropolitan area has been proposed [50,51]. The generichybrid optical and wireless architecture is illustrated in Figure 5.19, where the back-haul network consists of a fiber ring and tree networks. ONUs are deployed at theends of tree networks and connected to wireless nodes. Since TDM-PON streamsare multiplexed at different wavelengths, a large number of TDM-PON streams willrequire dense wavelength-division multiplexing (DWDM) for both downstream andupstream traffic. At the joint of the ring and a tree network, a low-loss wavelengthadd/drop filter is installed to add or drop a wavelength set, consisting of multiple wave-lengths, to separate the downstream and upstream traffic. The wavelength add/dropfilters segregate the physical network into numerous point-to-multipoint networks,on which dedicated wavelengths carry traffic between the central office and wirelessgateway routers. Hence, TDM-PON technology can readily be employed. Note thatalthough not shown, optical amplifiers may be required to compensate for the com-ponent loss along the optical ring network and at the joint nodes if a large number ofONUs are connected at the ends of the tree network.
Under this hybrid optical–wireless architecture, the upstream traffic is first receivedby a nearby mesh router via the links of the lower layer and then relayed to a nearby

HYBRID OPTICAL–WIRELESS ACCESS NETWORK ARCHITECTURE 243
Optical tree networks
3
215
6
AB
C
Wireless mesh network
Optical ring network
4
Wireless aggregation point
Wireless gatewayOptical backbone nodeCentral Hub Optical aggregation nodeWireless link Optical link
Wireless mesh router
End user
IntegratedIntegrated IntegratedIntegrated
End userGateway RouterCentral Hub Mesh RouterPHYMAC
PHYMAC
PHYMAC
RoutingRouting
PHYMAC
Routing
PHYMAC
Routing
FIGURE 5.19 Proposed hybrid optical–wireless access network [50,51].
gateway router through multihop communications. In Figure 5.19, for example, router4 aggregates traffic of nearby end users and relays it over routers 3, 2, and 1 to reachgateway router A. Once traffic reaches the gateway router, it is forwarded to thecentral office over the optical backhaul. For the downstream traffic, packets are firstrouted to one of the gateway routers, such as B in Figure 5.19, then forwarded on aspecific route (e.g., through routers 5, 3, and 4) to the end user.
Since the optical backhaul and WMNs are implemented with different technolo-gies, such as Ethernet PON (EPON) and Wi-Fi, interoperability is needed at theinterface between the ONU and wireless gateway router. To address this issue, theoptical backhaul and WMN can be either fused at the networking layer using anIP router, or employ an application-specific integrated circuit (ASIC) designed totranslate the packet formats.
Integration of the point-to-multipoint optical backhaul and WMNs paves multipleroutes between the central hub and an end user. An integrated routing paradigmthat can dynamically choose the optimum route is therefore essential for a hybridoptical–wireless network. Although routing in WMNs by itself is a challenging issue,as described earlier, we assume that the optical backhaul can help to collect somenetwork conditions in WMNs, such as link status, traffic loading, and interferenceand help to determine the optimum route. An integrated routing algorithm to achieveload balancing as congestion occurs in the wireless mesh network has been proposed[51]. This integrated routing algorithm is discussed in the following sections.
244 HYBRID OPTICAL WIRELESS ACCESS NETWORKS
Hybrid architecture can be used to smoothly upgrade a hierarchical wireless accessnetwork, as discussed earlier. In fact, a wireless backhaul in a hierarchical wirelessaccess network [Figure 5.16(b)] enables quick and cost-effective deployment, soit is strategic to deploy a hierarchical wireless access network and then upgradeincrementally to a hybrid network. In the following section we describe the smoothupgrading path.
5.2.2 Upgrading Path
The proposed hybrid architecture is designed to smoothly upgrade a hierarchical wire-less access network [Figure 5.16(a) and (b)]. The upgrading path proposed [51,52]begins with the replacement of the optical link at the backhaul layer in Figure 5.16(b).Because the top layer aggregates traffic from the lower layers, this layer will becomethe first bandwidth bottleneck.
Figure 5.20(a) shows the upstream wireless segments next to the central office.These wireless links aggregate traffic from the downstream segments along the ring,so they need to be upgraded first. Figure 5.20(b) shows the upgrade of the first wirelesslink; a fiber is deployed to replace the wireless link. A TDM PON stream at a pair ofwavelengths (a λ1 pair) is allotted to facilitate communications between the centraloffice and the first aggregation tower. The λ1 pair consists of two different wavelengthsfor separating the downstream and upstream traffic. At the first aggregation tower, alow-loss optical wavelength add/drop is installed to add or drop the wavelength pairλ1. The wireless links under the first aggregation tower (i.e., the capacity injectionlayer in Figure 5.16) and the wireless link between the first and second aggregationtowers (i.e., the backhaul layer in Figure 5.16) remain intact. Note that the firstaggregation tower enjoys the full bandwidth provisioned by the TDM-PON stream,and if needed, more wavelength pairs that carry TDM-PON streams can be allottedin addition to the λ1 pair.
Figure 5.20(c) illustrates that the upgrade proceeds to the second wireless linkin the backhaul layer. In Figure 5.20(c), a λ2 pair is allotted to carry a new TDM-PON stream, which bypasses the first aggregation tower and drops at the secondaggregation tower. The replacement can be applied to the subsequent wireless linksuntil the entire backhaul layer is upgraded.
As the wireless links in a ring network can be upgraded with optical links, thewireless links between the aggregation and access towers can also be upgraded withoptical links. Note that in reference 44, a point-to-point wireless link is dedicated tofacilitate communication between the aggregation tower and a nearby access tower.So point-to-multipoint topology of the aggregation and access towers is based onmany expensive point-to-point links. To upgrade these links, we can simply installan ONU by the access tower to replace the wireless link. Figure 5.20(d) shows thatas the wireless links are gradually upgraded, the point-to-multipoint MAC protocolof TDM-PON will automatically manage the point-to-multipoint network and itsbandwidth allocation.
Once the bottleneck in the backhaul layer is resolved by upgrading to optical links,the capacity injection layer will become the next bandwidth bottleneck. The upgrade

HYBRID OPTICAL–WIRELESS ACCESS NETWORK ARCHITECTURE 245
Backhaul Layer
Central OfficeAggregation
Tower AggregationTower(a)
MUX
OLT1
λ’s Add/Drop
Central Office
AggregationTowerλ1
λ1, λ2, λ3,..
AggregationTower
ONU
A
Avg. Bandwidth Allocation
(b)
λ2, λ’s Add/DropMUX
OLT2
OLT1λ’s Add/Drop
Central Office
O
λ2 AggregationTower
λ1Aggregation
TowerONU
B
ONU
A
Avg. BandwidthAllocation
Avg. BandwidthAllocation
λ1, λ2
(c)
FIGURE 5.20 Smooth upgrading path of the wireless backhaul proposed by Google andEarthlink for a wireless access network in San Francisco.

246 HYBRID OPTICAL WIRELESS ACCESS NETWORKS
MUX
OLT2
OLT1λ’s Add/Drop
Central Office SplitterSplitter
AggregationTower
ONUba
AONU
AccessTower
ONU ONU …ba
ONU
ONU ONU
c d
AccessTower
aA ab
c
Avg. Bandwidth Allocation
Avg. Bandwidth Allocation
b d
(d)
MUX
λ-band Add/Drop (<1dB loss) λ-band Add/Drop
(<1dB loss)
OLT3
OLT2
OLT1
Central Office
Access
SplitterSplitter
ONUONU ONU
Tower
…ONU ONU ONU ONU
ba
baA
A
b
Avg. Bandwidth Allocation
Avg. Bandwidth Allocation
District X(e)
FIGURE 5.20 (Continued) Smooth upgrading path of the wireless backhaul proposed byGoogle and Earthlink for a wireless access network in San Francisco.

HYBRID OPTICAL–WIRELESS ACCESS NETWORK ARCHITECTURE 247
can be realized with the same principle by further deploying ONU at a wirelessgateway router to gradually replace wireless links, as shown in Figure 5.20(e). Ifa certain district needs more bandwidth [e.g., district X in Figure 5.20(e)], anotherTDM-PON stream on a different wavelength pair can be allotted. Passive opticalfilters will be required at the ONU to separate different wavelengths. Note that theupgrade will eventually result in the hybrid optical–wireless architecture illustratedin Figure 5.19.
5.2.3 Reconfigurable Optical Backhaul Architecture
In a hybrid optical–wireless network, the bandwidth demand from different districtscan vary drastically within a certain time period. For example, a business districtwill require a large bandwidth during daytime but little during nighttime, and theresidential district the opposite. Instead of overprovisioning based on the peak demandor underprovisioning to optimize the network investment, it is desirable to have areconfigurable network on which the bandwidth can be reallocated among districtsserving multiple TDM-PON streams. Given the TDM/WDM backhaul structure, thereconfigurability can be realized by using tunable optical transceiver at the ONU. Forexample, in Figure 5.21 districts X and Y are both connected to the same physicaltree network and are served by PON1 and 2, respectively. Assume that tunabletransceivers are used at ONUs and that each ONU will only transmit and receivea certain wavelength pair. If PON1 is highly loaded and PON2 is not at a certainmoment, by tuning the transmitting and receiving wavelengths of ONU3 from 1D,1U to 2D, 2U, ONU3 is enabled to join PON2 to reduce PON1’s loading. In this waythe bandwidth is reallocated based on the dynamic demand.
To optimize the bandwidth utilization with the reconfigurability proposed, the cen-tral hub needs to monitor the bandwidth demand and allocate the bandwidth basedon TDM-PON technologies. Figure 5.22 shows an example that can be implemented
λ Add/Drops
λ1, λ2, λ3,.. λ3,...
Backbone Fiber
λ1D,U λ2D,U
PON 1Splitter/Coupler
ONU ONU
Central Office
ONU
λ1 , λ2
Heavily loaded
PON 2ONU1 ONU2 ONU3 ONU4 ONU5 ONU6
λ2D,Uλ1D,U
Lightly loadedONU ONU
ONU
X Y
TunableOptical Transceiver
District(Heavily Loaded)
District(Lightly Loaded District)
FIGURE 5.21 Reconfigurable optical backhaul.

248 HYBRID OPTICAL WIRELESS ACCESS NETWORKS
Bandwidth Management Module
Network Terminal CardMonitor OLT buffer depths
BUF(1)
BUF(2)TE(1) OLT(1)
λ1
λ2
P1 P2
striper
BUF(N × M)
TE(2)
TE(N)
…
BUF(3)scheduler
OLT(2)
OLT(N)… …From backbone
λN
MUX/DMUX
TE: Traffic Estimator; BUF: BufferN: number of OLTs; M: max. number of ONU under an OLT
OLT buffer
FIGURE 5.22 System architecture in the central office.
in the central office to fulfill this purpose. Behind the OLTs, a network terminal (NT)is devised to manage multiple TDM-PONs. In the NT, the system bandwidth man-agement module monitors the buffer depth of each OLT continually for downstreamtraffic. When any PON is heavily loaded, reflected by the OLT buffer depth exceed-ing a certain threshold, the system bandwidth management module will instruct theheavily loaded PON to deregister some ONUs and reregister them to lightly loadedPON(s). The number of ONUs to be moved depends on the average loading amongPONs, which are monitored continuously by the traffic estimators (TEs). Before anONU is deregistered, its packets queued in the OLT will be emptied. After an ONUis deregistered, the incoming traffic to that ONU is stored temporarily in the queueof NT until reregistration is complete. Note that the aforementioned ONU deregistra-tion and registration can readily be realized by MPCPDU messages (deregistrationand registration processes) and PLOAM messages (deactivation and ONU activationprocedures) for EPON and GPON, respectively.
As applied to optical access networks, tunable transceivers have been proposedfor different purposes, such as bandwidth efficiency improvement [52], networkscalability [53], and inventory simplification [54]. Due to the rapid advance of opticaltechnology, various tunable laser technologies have been developed [54]. To optimizethe cost issue, one of the promising solutions is tunable long-wavelength vertical-cavity surface-emitting lasers (VCSELs) [55]. Lower cost results from integratedmanufacturing, easy packaging, and testing. Recently, an integrated fast wavelength-selective photodetection was developed [56]. Its tuning time is in the nanosecondrange, and the monolithic design facilitates cost reduction.
With slowly tunable transceivers, the tuning time can be a major overhead drainduring reconfiguration, leading to network performance degrading. For example, asthe traffic loading of a PON oscillates, reconfiguration will be triggered frequently andthe network efficiency decreases. To minimize performance degradation, the buffersize can be increased with the higher threshold of a reconfiguration trigger. As recon-figuration is triggered, the tuning time will take a relatively small fraction of overhead

HYBRID OPTICAL–WIRELESS ACCESS NETWORK ARCHITECTURE 249
compared to the time needed to empty the packets stored in the OLT buffer, and thenetwork efficiency could be improved. With this approach, although the efficiency isimproved, packets will suffer more delay from a longer queuing time in the buffer, andthe QoS degrades. To relieve QoS degradation, traffic differentiation (i.e., first for-warding high-priority traffic) is a solution to enhance the QoS during reconfiguration.
5.2.3.1 Performance Simulation of the Reconfigurable Optical Back-haul The performance of the proposed reconfigurable architecture is comparedwith fixed architectures through simulations. Assume that both the reconfigurableand fixed architectures consist of two EPONs and that the aggregated traffic is Pois-son traffic. First we simulate the average packet delay of the two PONs in botharchitectures. In the simulation, (1) the average load of PON2 is fixed at 0.2 and thatof PON1 is changed from 0 to 1.2 at t = 1 s; (2) the buffer size in the OLT is 128 MB[57]; (3) the network reconfiguration is triggered as the OLT buffer depth exceeds50% (buffer depth refers to the total queued bits/bytes in a buffer); and (4) total re-configuration overhead is 250 ms (including ONU deregistration, transceiver tuningtime, ONU registration, and propagation delays). The traffic estimator is realized by alow-pass filter (LPF) with an averaging window of 10 ms. Figure 5.23 shows the dy-namic response to a variation in traffic load. The traffic allocation between two PONsis measured at P1 in Figure 5.22, the outputs of the NT card. As shown, the reconfig-urable architecture is able to balance the overall traffic load between two PONs afterTP1, which is approximately
TP1 ≈ TH
Din − Dout+ OV (5.1)
where TH is the buffer depth threshold triggering reconfiguration, Dout the OLT datarate, Din the traffic rate allocated to the OLT, and OV the reconfiguration overhead(i.e., tunable devices).
2.52.5TP1=2.75secTraffic allocated to O
LTs
(Gbps)
Traffic allocated to OLT
s(G
bps)
Reconfigurable Backhaul ArchitectureFixed Backhaul Architecture
1.5
1
2
1
2
1.5
0.5
0
0.5
01 2 30 4 5
PON-1PON-2
PON-1PON-2
6 7 8Time (sec)
1 2 30 4 5 6 7 8Time (sec)
FIGURE 5.23 Traffic throughput at P1 in Figure 5.23.

250 HYBRID OPTICAL WIRELESS ACCESS NETWORKS
OLT1 Buffer Depth
Fixed PONReconf. PON
Fixed PONReconf. PON
1.2
1.4
OLT1 Packet Rejection Ratio
Packet R
ejection Ratio (%
)
25
0.8
1
0.6
Buffer D
epth (Gb)
10
15
20
0.4
0
0.25
01 2 30 4 5 6 7 8
Time (sec)1 2 30 4 5 6 7 8
Time (sec)
PON1 input loading: 0.2 → 1.2 PON1 input loading: 0.2 → 1.2
FIGURE 5.24 Buffer depth and packet rejection ratio of PON1 in both architectures.
Figure 5.24 shows the buffer depth and packet loss of PON1 in both architectures.After a reconfiguration period, the buffer depth decreases in PON1 of the reconfig-urable architecture due to load balancing, while that of the fixed architecture keepsincreasing, which eventually results in packet loss. The estimated maximum bufferdepth of PON1,
BDMAX = TP1 × (Din − Dout) (5.2)
Figure 5.25 shows the throughput of each PON and the combined throughput ofboth architectures, measured at P2 in Figure 5.22. The results show that the combined
1.8
1.6
2.5
Reconfigurable BackhaulArchitecture Fixed Backhaul Architecture
TP1 =2.75sec
1.2
0.8
1.4
1
Throughput (G
bps)
1.5
2
PON-1PON-2Combined
PON-1PON-2Combined
Throughput (G
bps)0.4
0
0.6
0.2
0.5
1
01 2 30 4 5 6 7 8
Time (sec)1 2 30 4 5 6 7 8
Time (sec)
PON1 input loading: 0.2 → 1.2 PON1 input loading: 0.2 → 1.2
FIGURE 5.25 Throughput of each PON and combined throughput of both architectures;measured at P2 in Figure 3.4.

HYBRID OPTICAL–WIRELESS ACCESS NETWORK ARCHITECTURE 251
PON2 Loading 20% PON2 Loading 20%14000 105
104
103
102
101
12000
10000
8000
6000
4000
2000
00 20 40 60 80 100 120 140 160 180
(Linear-Scale)
(Log-Scale)
Fixed BackhaulReconfigurable Backhaul
Fixed BackhaulReconfigurable Backhaul
Traffic Loading (%)0 20 40 60 80 100 120 140 160 180
Traffic Loading (%)
Ave
rage
Pac
ket D
elay
(us
)
Ave
rage
Pac
ket D
elay
(us
)
FIGURE 5.26 Long-term average packet delay of both PONs (varying load for PON1 andfixed load for PON2).
throughput of both PONs will reach the maximum rate to dequeue the stored packetsin OLT1, and the required time, TP2, is approximately
TP2 ≈ TP2 + BDMAX
Dout − Din,new(5.3)
where Din,new is the new traffic rate allotted to OLT1.Figure 5.26 shows the long-term average packet delay of two PONs in log and
linear scales with different loads for PON1 and a fixed load for PON2. Accordingto the linear scale, the fixed architecture’s performance reaches its limit as the loadreaches 90%, whereas the reconfigurable system does not reach its limit until theoverall load reaches 180%. On the log scale, after passing 90%, the reconfigurablebackhaul is insensitive to load increasing due to reconfiguration.
5.2.3.2 Experimental Testbed of Reconfigurable Optical BackhaulAfter reviewing the performance improvement via dynamic load balancing realizedby reconfigurable backhaul, it is desirable to investigate its hardware feasibility,performance, and compatibility to TDM-PON technologies. For these purposes, anexperimental testbed (Figure 5.27) was built [51]. It consists of two OLTs equippedwith fixed optical transceivers and an ONU equipped with a tunable transceiver.The functionality performed by an OLT and ONUs are programmed in a 1.25-Gb/sfield-programmable gate array (FPGA). To facilitate the reconfiguration process,reconfiguration control interfaces (RCI) are implemented in the FPGA at the ONUand the central office as shown in Figure 5.27. After reconfiguration is triggered, theRCI in the central office will direct that some ONUs be moved from a heavily loadedPON (e.g., PON1) to a lightly loaded PON (e.g., PON2). The process includes thefollowing steps.
1. The RCI at the central office sends new wavelength information [e.g., λ2d,u ofthe lightly loaded OLT (i.e., OLT2) to the heavily loaded OLT (i.e., OLT1)],

252 HYBRID OPTICAL WIRELESS ACCESS NETWORKS
Tunable TX: Tunable transmitter
RCI: Reconfiguration Control Interface
TX1 1591nm
Central Office
RX1
TX2
OLT1
OLT2
RCI DMUX
MUX
Band-splitter1586nm
1550.1nm
opticalfiber
RX2FPGA+SERDES
1550.9nm
Splitter
Optical Network Unit (ONU)
li
Tunable TXONU RCI
1550.1nm → 1550.9nm
Band-splitter Tunable RX
FPGA+SERDES1591nm → 1586nm
T iunable RX: Tunable receiver
FIGURE 5.27 Reconfiguration experimental testbed.
and the OLT will arrange the next available data packet to deliver the new wave-length information to the ONU to be deregistered. (Note that this informationcan be piggybacked on data packets as specified by the TDM PON standards.)
2. The RCI at the central hub instructs the heavily loaded OLT (e.g., OLT1) toderegister the to-be-reconfigured ONU.
3. The RCI behind the ONU stores the new wavelength information, generates anacknowledgment (ACK) signal, and passes it on to the ONU for transmission.The ONU will then arrange that the next available data packet delivers theACK.
4. Upon reception of the ACK signal from upstream packets, the heavily loadedOLT passes it to the RCI at the central office. The RCI will proceed to instructthe heavily loaded OLT to start the standard deregistration process specified inTDM-PON standards [1,2].
5. After the deregistration ACK is delivered by the ONU, the RCI at the ONUwill tune the wavelengths of the tunable transceiver to the new wavelengths ofthe designated OLT (e.g., from λ1d,u to λ2d,u).
6. After receiving the deregistration ACK from the ONU, the RCI at the centraloffice will wait for a certain amount of time (the waiting time is preset accordingto the tuning time of the optical tunable transceiver at the ONU) and instructthe designated OLT (e.g., OLT2) to start the standard discovery process definedin TDM-PON standards [1,2] to discover and register the new ONU.
To realize and examine the handshaking protocol, Figure 5.28 summarizes the statediagrams of the RCIs at the central hub, the heavily and lightly loaded OLTs, the

HYBRID OPTICAL–WIRELESS ACCESS NETWORK ARCHITECTURE 253
Idle
Receive reconfig. command from System Bandwidth
Instruct heavily loaded OLT to send reconfig. info. & deregister the to-be-reconfigured ONU
Management
Wait for ACK from heavily loaded OLT
Inform System Bandwidth Management of Reconfig.
failureReceive ACK fromTimer
expires heavily loaded OLT
Wait for reconfig. periodof the ONU transceiver
Instruct designated OLT toperform autodiscovery process
Timer expires OR incorrectONU
ReceiveACK from designated
Wait for ONU registration from designated OLT
registration OLT
(a) State diagram of the reconfiguration control interface at the central office
Idle (normal operation)
Receive reconfig. instruction from Reconfig. Ctrl. Interface
Send PHY info. of designatedOLT to the to-be-deregistered ONU
Wait for ACK from the Inform reconfig.
Ctrl. Interface to-be-deregistered ONU
Receive ACK from the ONU(s)
of reconfig. failure
Timer expires
Deregister the ONU
Inform Reconfig. Ctrl. Interface of ONU deregisteration
(b) State diagram of the heavily loaded OLT
FIGURE 5.28 State diagrams of the RCIs in the central office, heavily and lightly loadedOLTs, an ONU, and RCI behind the ONU.

254 HYBRID OPTICAL WIRELESS ACCESS NETWORKS
Receive instruction from
Idle (Normal Operation)
Autodiscovery fails after N trials
Reconfig. Ctrl. Interface to perform the autodiscovery process
Autodiscovery Autodiscoveryperformedperiodically
Report registration failure to
Reconfig. Ctrl. Interface
Report registration success & ONU’s MAC address
to Reconfig. Ctrl. Interface
New ONUregistered
(c) State diagram of the designated lightly loaded OLT
Idle (Normal operation)
Inform Reconfig.
Receivereconfig. info.
Ctrl. Interface atONU of upcoming
Reconfig.
Deregistration
Reconfig. the transceiver
AutodiscoveryProcess
(d) State diagram of the reconfigured ONU
FIGURE 5.28 (Continued) State diagrams of the RCIs in the central office, heavily andlightly loaded OLTs, an ONU, and RCI behind the ONU.
reconfigurable ONU, and the RCI at the reconfigurable ONU, which are implementedin commercial FPGA chips. Note that the discovery, deregistration, and registrationprocesses are programmed according to the IEEE 802.3ah EPON standards.
The tunable transmitter at ONU is the same as the one used in reference 58, whichtunes from 1552.52 to 1550.92 nm within 80 ns. The tunable receiver at the ONUis implemented using an MEMS tunable filter, which has a wide tuning range: from1591 to 1525 nm by changing the control voltage from 0 to 35 V. Throughout thetuning range, the insertion loss is less than 1 dB. To examine the transient responseof the tunable filter, a light at 1586 nm is transmitted continuously to the tunable

HYBRID OPTICAL–WIRELESS ACCESS NETWORK ARCHITECTURE 255
Idle
Receive reconfig. instruction & λ pairof the designated OLT
Tune
to the λ pairDeregistrationfrom current PON system
of original OLT
Tune the transceiver to theλ pair of designated OLT
Wait for registration
registrationsucceeds
registrationfails
transceiver
(e) State diagram of the reconfiguration controlinterface at the reconfigured ONU
FIGURE 5.28 (Continued) State diagrams of the RCIs in the central office, heavily andlightly loaded OLTs, an ONU, and RCI behind the ONU.
filter, and the tunable filter tunes to receive between 1591 and 1586 nm by changingits control voltage. As shown in Figure 5.29, after the control voltage is changed,it takes 33.6 µs for the filter to stabilize to receive 1596-nm light. Since the tuningtime is much longer than that of the tunable transmitter, the reconfiguration overheadincurred in the PHY layer is dominated by the tunable receiver. To accommodate thetuning time, the period between deregistration (step 2: deregister ONU from heavilyloaded PON) and reregistration (step 4: reregister the ONU to lightly loaded PON)issued by an RCI at the central office is thus programmed as 50 µs in FPGA.
5.2.3.3 Control Packet Format To facilitate the communication of an RCI onthe ONU and central office sides, a control packet is used on the testbed and its formatis shown in Figure 5.30. It consists of the following parts:
1. Preamble (60 bytes): for clock and level recovery; specifically to facilitateupstream reception
2. Sync bytes (4 bytes): delimiter for bit synchronization
3. Frame ID: for statistics and error-checking purposes
4. Tx: sender ID
5. Rx: receiver ID
6. Frame type: indicates the type of MAC frame
7. Payload: carries RCI commands such as deregistration, ACK, new wavelengthinformation, etc.

256 HYBRID OPTICAL WIRELESS ACCESS NETWORKS
211.2 usV 5
4
3
2
1
0
–1
0.35
0.3
0.25
0.2
0.15
0.1
0.05
0
–0.05
–6 –5 –4 –3 –2 –1 0 1 2
–6 –5 –4 –3 –2 –1 0 1 2
Con
tro
Sgn
a
33.6 usV
10–4s
Fte
r re
spon
se
1591nm → 1586nm
10–4
TX: 1586nm
10 s*Measured after Photo Diode
FIGURE 5.29 Dynamic response of the tunable receiver.
RCI commands:Reconfiguration & ACKNew wavelength information
D
To facilitate upstream reception
Receiver IDSender ID
Dummy bits
ID
30~60 bytes 2 bytes4 bytes
Preamble Sync Frame Frame Type
2 bytes
PayloadTX RX
2 bytes2 bytes 100 bytes
Delimiter for bit synchronization
Statistics &error checking
Type of MAC frames
FIGURE 5.30 Control frame format.

HYBRID OPTICAL–WIRELESS ACCESS NETWORK ARCHITECTURE 257
5.2.3.4 Experimental Results The experimental result is shown in Fig-ure 5.31, where the ONU deregistration from the OLT1, reconfiguration period,and the ONU discovery and registration performed by the OLT2 are demonstrated.Note in Figure 5.31 that the propagation delay is insignificant compared to the re-configuration period.
The signals marked with numbers in Figure 5.31 are outputs measured on theFPGA boards, which indicate the following events:
1. OLT1 sends a deregistration message.
2. ONU receives the deregistration message.
3. ONU sends an ACK.
4. OLT1 receives the ACK.
5. After a 50-µs reconfiguration period, OLT2 sends a discovery gate message.
6. ONU receives the discovery gate message.
7. ONU sends a registration request.
8. OLT2 receives the registration request.
9. OLT2 sends a registration message.
10. ONU receives the registration message.
11. ONU sends a registration ACK.
12. OLT2 receives the registration ACK.
4GHz/1GHz LA E
AccumulateOff
Acquired 17:37:5326 Jun 2007
External Clock Period = 18.768 nsSamples/External Clock = 4
Sample Offset0 s
50us
sec/Div20.0 us
Delay0
MarkersOff
OLT1_TX
OLT2_TX
OLT2_TX
ONU_RX
ONU_RX
ONU_RX
ONU_TX
OLT_RX
(1)
(5)
(9)
(6)
(10)
(7 & 11)
(8 & 12)
(2)
(3)
(4)
s
Waveform Acq. Control Print Run
FIGURE 5.31 Experimental results of a reconfiguration testbed.

258 HYBRID OPTICAL WIRELESS ACCESS NETWORKS
5.3 INTEGRATED ROUTING ALGORITHM FOR HYBRIDACCESS NETWORKS
In Section 5.1.2.4 we mentioned that most routing protocols for WMNs are derivedfrom wireless ad hoc networks, which is different from WMNs in terms of nodemobility, power constraint, and computation capability. In addition, the traffic patternin a WMN is very different from that of wireless ad hoc networks because most, ifnot all, traffic in a WMN is forwarded between the gateway routers and end users,as in other access networks [30]. Hence, conventional proactive and reactive routingprotocols developed for wireless ad hoc networks need to be modified if they wereto be applied to WMNs for optimized performance.
On the hybrid optical wireless access network, there usually exist multiple routingpaths between the central hub and an end user because of the point-to-multipointtopologies of the optical backhaul and WMNs. Different routing paths consist ofdifferent optical and wireless links. In determining an end-to-end routing path, thewireless link generally has a higher routing cost than that of its optical counterpart,because wireless links interfere with each other and share limited bandwidth resourcein an open space. Although optical backhaul does not play a critical role in routingcost, it can help to improve the overall routing performance. Assuming that a wirelessgateway can derive network conditions in its neighborhood, such as link status,interference, and traffic loading of its neighboring wireless mesh routers, all theinformation from different gateways can readily be collected by the central officethrough the optical backhaul. Then the central office can use the information fromgateways to optimize packet routing on a WMN. In other words, with the help ofthe optical backhaul, a centralized system management is realized and results in acentralized routing paradigm.
Based on the characteristics of hybrid optical wireless network, an integrated rout-ing algorithm has been proposed [51]. This algorithm computes the optimum routebased on the up-to-date wireless link state and average traffic rate. For any wirelessmesh router, this algorithm will select the optimum route, composed of wireless links,wireless gateway/ONU, and optical links, under given network conditions. Specif-ically, this algorithm will adapt to each router’s traffic and perform dynamic loadbalancing among WMNs within a district. The integrated routing paradigm proposedis described by the following steps, and the corresponding operations in the systemare illustrated in Figure 5.32.
1. Wireless link state update. Each wireless mesh router probes the link statesperiodically using neighboring routers. The probing can be done by measuringthe retransmission ratio [25] or transmission loss rate [24] in both directions.The measurement verifies connectivity and reflects the quality and capacityof wireless links that vary over time. Each wireless mesh router then broad-casts the link states in a bounded flooding manner; that is, the packet canpropagate on a WMN for only a limited number of hops, as illustrated in Fig-ure 5.33. The hop-count limit, Hmax, is assigned according to the (wirelessgateway router)/(wireless mesh router) ratio: A small ratio will require a large

INTEGRATED ROUTING ALGORITHM FOR HYBRID ACCESS NETWORKS 259
79
OLT1
Optical
Route Assignment
4
OLT2
Backhaul
ONU2
3
5
68
CentralHub
ONU1
Interface2
Gateway22
Interface1
Gateway1
Mesh Router11
WM
N
Mesh Router2
Mesh Router4Mesh Router3
FIGURE 5.32 Integrated routing paradigm in an exemplar system.
hop-count limit. As such, only the nearby wireless gateway routers will receivethe broadcast from each mesh router. Compared to wireless ad hoc networks,the overhead of the link-state update under the hybrid architecture is signif-icantly lower because the fixed infrastructure and network engineering leadto less channel variation. A high gateway/router ratio will further reduce theoverhead by limiting the propagation of update broadcast on the WMN.
2. Local WMN route calculation. Based on the link-state updates, the interface be-tween the optical terminal and wireless gateway router calculates the optimumroute for each mesh router within the hop-count limit in both the downstream
Hub
HMAX = 4
FIGURE 5.33 Bounded flooding of link-state information.

260 HYBRID OPTICAL WIRELESS ACCESS NETWORKS
and upstream directions using a shortest-path algorithm with the link states ascost [24,25].
3. Route cost report. Each optical terminal reports to the central hub the calculatedroute cost in both directions for each wireless mesh router within Hmax.
4. Gateway association. After receiving the reports from all optical terminals,the route assignment module will associate every wireless mesh router withthe gateway router that has the lowest cost. The comparison result between awireless mesh router and different wireless gateway routers is stored for futurereference to enable load balancing.
5. Congestion monitoring. At the interface between an optical terminal and a wire-less gateway router, a low-pass filter is dedicated to each associated wirelessmesh router to measure the average flow rates in both directions. Based on themeasurement, a capacity table is continuously updated to monitor the overallloading of the local WMN. To calculate the capacity, the interference in thelocal WMN can be measured using a technique proposed by Padhye et al. [59].If loading at a certain area exceeds a congestion threshold, the interface willlocate the k furthermost router(s) RT{1,2, . . . ,k}, of which the flows pass thehot zone and can reduce the congestion sufficiently if the flows are removed.If some routers among RT{1,2, . . . ,k} exceed a minimum hop-count thresholdHmin, these routers will be categorized to RTflow control{1,2, . . . ,i} and the restof the routers to RTload balancing{1,2, . . . , j}; note that i + j = k.
6. Congestion report. The interface that detects congestion (e.g., interface 1 inFigure 4.21) sends a congestion report, including RTload balancing{1,2, . . . , j} andRTflow control{1,2, . . . ,i}, to the route assignment module.
7. Alternative gateway router look-ups. For each router inRTload balancing{1,2, . . . , j}, the route assignment module checks the gate-ways that received a link-state update (e.g., interface 2 in Figure 4.21) basedon the stored comparison result described in step 4.
8. Wireless gateway router reassociation. The reassociation begins with gatewayswith the lowest cost. The interfaces of the gateway will then check whether theloading threshold will be exceeded if the flows are added. If the threshold willbe exceeded, the route assignment module will negotiate with the gateway withthe second lowest cost, and so on. If routers among RTload balancing{1,2, . . . , j}fail to be associated with a new gateway, they will be included in RTflow control.
9. Flow control. After RTload balancing{1,2, . . . , j} are reassociated, flow controlwill be executed in RTflow control.
5.3.1 Simulation Results and Performance Analysis
The performance improvement achieved by the proposed algorithm implementssimulation with NS-2 [60]. The simulation scenario consists of four gateways and 192mesh routers as shown in Figure 5.34, where the distance between any two adjacentnodes is 100 m. An IEEE 802.11b module implemented in NS-2 is used, and the data

INTEGRATED ROUTING ALGORITHM FOR HYBRID ACCESS NETWORKS 261
GR2GR1
Optical-wirelessgatewayY(m)
Wireless meshrouter
Hot-zone
GR3GR4
X(m)
FIGURE 5.34 Bounded flooding of link-state information.
1.5Integrated
Routing Algorithm
0.5
1.0
Thr
ough
put M
b/s
MinimumHop Algorithm
1.51.00.50.00.0
Nominal data rate11 Mb/s
Load, Mb/s
FIGURE 5.35 (a) Average throughput and packet delay comparison.

262 HYBRID OPTICAL WIRELESS ACCESS NETWORKS
200
150
50
100
De
ay m
s
MinimumHop Algorithm
Integrated
1.51.00.50.00
Load, Mb/s
Routing Algorithm
FIGURE 5.35 (Continued) (b) Average throughput and packet delay comparison.
rate is up to 11 Mb/s. Poisson random traffic and a two-way radio propagation modelare used throughout the simulation. It is assumed that every mesh router has uniformtransmission power and receiver sensitivity. By applying a range model describedin the literature [42,43], we assume that the transmission range and the interferenceranges equal 120 and 180 m, respectively. Each node has only one radio interface andis equipped with an omnidirectional antenna. Note that in this simulation scenario, theshortest-path routing with the link state as cost is reduced to minimum-hop routing.We inject uniform background traffic to each mesh router, and the average flow rateout of each gateway to the nearby 48 mesh routers is 1% of the data rate. Assumethat there is a hot zone, as shown Figure 5.34. Additional loadings are injected onrouters in the hot zone and increase the overall loading from 0.1 Mb/s to 1.5 Mb/s. Thecongestion threshold is set to be 8% (0.88 Mb/s) of the data rate (i.e., after the flow rateof a certain router exceeds 0.88 Mb/s, the interface will detect congestion and send acongestion report to the central hub). The throughput and packet delay performanceof mesh routers in the hot zone is investigated. The simulation results in Figure 5.35(a)and (b) show that after the additional loading in the hot zone exceeds 0.77 Mb/s (in thepresence of 0.11 Mb/s background traffic), flows to the boundary routers are shiftedto other three gateways to balance the loading based on the algorithm proposed. Asa result, the throughput and delay are improved by about 25%.
5.4 SUMMARY
In this chapter we introduce a hybrid optical–wireless access network. To addressdifferent challenges simultaneously, a hybrid network should be broadband, ubiqui-tous, scalable, and cost-effective. Both optical and wireless segments complement

REFERENCES 263
its counterpart to fulfill these requirements. We review WiMAX technology to dateand a wireless mesh network that enables the wireless segment of the hybrid archi-tecture. We also review a hybrid optical–wireless network architecture that consistsof reconfigurable optical backhaul and wireless mesh network. The reconfigurableTDM/WDM optical backhaul aims to address the scalability issue in WMN and up-grade for hierarchical wireless access networks. TDM-PON technology is leverageddue to its scalable MAC, flexible architecture, cost-effectiveness, and technologicalmaturity. Reconfigurability is implemented in the optical backhaul for bandwidth re-allocation to improve resource utilization. The experimental testbed demonstrates itsfeasibility. An integrated routing algorithm is developed for this hybrid architecture.This algorithm takes advantage of the optical backhaul to collect a real-time loadingsituation and network conditions and then locate the optimum ONU/gateway androute in a WMN. Simulation results show that throughput and delay improvement re-sult from load balancing among multiple gateways. Although hybrid optical–wirelessaccess is a green research field, it is a practical solution to addressing the challengesencountered by different solutions in the last-mile connection. We envision that moreresearch effort will need to be directed to the network architecture, enabling device, in-tegrated routing algorithm, QoS, resilience, and multicast in a hybrid optical–wirelessaccess network in the near future.
REFERENCES
1. ITU-T G.984.
2. IEEE 802.3ah.
3. IEEE Standard 802.16-2004, Air Interface for Fixed Broadband Wireless Access Systems.
4. IEEE Standard 802.16e, Air Interface for Fixed and Mobile Broadband Wireless AccessSystems: Amendment for Physical and Medium Access Control Layers for Combined Fixedand Mobile Operation in Licensed Bands.
5. A. Bahai and B. Saltzbert, Multi-carrier Digital Communication: Theory and Applicationsof OFDM, Kluwer Academic, Norwell, MA, 1999.
6. D. Love and R. Heath, OFDM power loading using limited feedback, IEEE Trans. Veh.Technol., vol. 54, no. 5, Sept. 2005.
7. H. Moon, Efficient power allocation for coded OFDM systems, Ph.D. dissertation, StanfordUniversity, Aug. 2004.
8. O. Awoniyi, O. Oteri, and F. Tobagi, Adaptive power loading in OFDM-based WLANsand the resulting performance improvement in voice and data applications, Proceedingsof the of IEEE Vehicular Technology Conference, Sept. 2005, vol. 2, pp. 789–794.
9. Richard Van Nee and Ramjee Prasad, OFDM for Wireless Multimedia Communications,Artech House, Norwood, MA, 2000.
10. Arunabha Ghosh, David R. Wolter, Jeffrey G. Andrews, and Runhua Chen, Broadbandwireless access with WIMAX current performance benchmarks and future potential, IEEECommun., vol. 43, no. 2, Feb. 2005, pp. 129–136.
11. G. Nair, J. Chou, T. Madejski, K. Perycz, P. Putzolu, and J. Sydir, IEEE 802.16 mediumaccess control and service provisioning, Intel Technol. J., vol. 8, Aug. 2004.

264 HYBRID OPTICAL WIRELESS ACCESS NETWORKS
12. http://wirelessman.org/relay/index.html.
13. http://w3.antd.nist.gov/wctg/manet.
14. R. Bruno, M. Conti, and E. Gregori, Mesh networks: commodity multihop ad hoc networks,IEEE Commun., Mar. 2005, pp. 123–131.
15. http://www.tropos.com/.
16. http://www.belairnetworks.com/.
17. I. Akyildiz, A survey on wireless mesh networks, IEEE Radio Commun., Sept. 2005,pp. S23–S30.
18. H. Aoki, S. Takeda, K. Yaggu, and A. Yamada, IEEE 802.11a Wireless LAN Mesh NetworkTechnology, NTT DoCoMo Technical Journal, vol. 8, no. 2, Sept. 2006, pp. 13–21.
19. J. Bicket, D. Aguayo, S. Biswas, and R. Morris, Architecture and evaluation of an un-planned 802.11b mesh network, presented at MOBICOM 2005, Aug. 2005.
20. http://www.ieee802.org/16/tgm/.
21. T. Clausen and P. Jaquet, Optimized Link State Routing Protocol (OLSR), RFC 3626,Oct. 2003.
22. E. Perkins, E. Belding-Royer, and S. Das, Ad Hoc on Demand Distance Vector (AODV)Routing, RFC 3561, July 2003.
23. R. Draves, J. Padhye, and B. Zill, Comparisons of routing metrics for static multi-hopwireless networks, ACM Special Interest Group on Data Communications (SIGCOMM),Aug. 2004, pp. 133–144.
24. R. Draves, J. Padhye, and B. Zill, Routing in multi-radio, multi-hop wireless meshnetworks, ACM International Conference on Mobile Computing and Networking(MOBICOM), 2004, pp. 114–128.
25. D. Couto, D. Aguayo, J. Bicket, and R. Morris, A high-throughput path metric for multi-hop wireless routing, Wireless Networks, vol. 11, no. 4, July 2005.
26. L. Iannone and S. Fdida, MRS: a simple cross-layer heuristic to improve throughputcapacity in wireless mesh networks, presented at the Conference on Future NetworkingTechnologies (CoNEXT), Oct. 2005.
27. C. Perkins and P. Bhagwat, Highly dynamic destination-sequenced distance-vector(DSDV) routing for mobile computers, Comput. Commun. Rev., Oct. 1994, pp. 234–244.
28. D. Johnson and D. Maltz, Dynamic source routing in ad hoc wireless networks, in MobileComputing, vol. 353, pp. 153–181, Kluwer Academic, Norwell, MA, 1996.
29. P. Gupta and P. Kumar, The capacity of wireless networks, IEEE Trans. Inf. Theory, vol. 46,no. 2, Mar. 2002, pp. 388–404.
30. J. Jun and M. L. Sichitiu, The nominal capacity of wireless mesh networks, IEEE WirelessCommun., Oct. 2003, pp. 8–14.
31. H. Hoffman and D. Cox, Attenuation of 900 MHz radio waves propagating into a metalbuilding, IEEE Trans. Antennas Propag., vol. 30, no. 4, pp. 808–811, July 1982.
32. J. Durante, Building penetration loss at 900 MHz, Proceedings of the IEEE VehicularTechnology Group, 1973.
33. P. Wells, The attenuation of UHF radio signals by houses, IEEE Trans. Veh. Technol.,vol. VT-26, no. 5, Nov. 1977, p. 358.
34. D. Cox, R. Murray, and A. Norris, 800 MHz attenuation measured in and around suburbanhouses, Bell Lab. Tech. J., vol. 63, July–Aug. 1984, pp. 921–954.

REFERENCES 265
35. D. Cox, R. Murray, and A. Norris, Measurements of 800 MHz radio transmission intobuildings with metallic walls, Bell Lab. Tech. J., vol. 62, Nov. 1983, pp. 2695–2717.
36. D. Cox, R. Murray, and A. Norris, Antenna height dependence of 800 MHz attenuationmeasured in houses, IEEE Trans. Veh. Technol., vol. VT-34, May, 1985, pp. 108–115.
37. H. Arnold, D. Cox, and R. Murray, Macroscopic diversity performance measured in the800-MHz portable radio communications environment, IEEE Trans. Antennas Propag.,vol. 36, no. 2, Feb. 1988.
38. W. Smith, Urban propagation modeling for wireless systems, Ph.D. dissertation, StanfordUniversity, Feb. 2004.
39. M. Feuerstein et al., Path loss, delay spread, and outage models as functions of an-tenna height for microcellular system design, IEEE Trans. Veh. Technol., vol. 43, no. 3,Aug. 1994, pp. 487–498.
40. J. Berg, R. Bownds, and F. Lotse, Path loss and fading models for microcells at 900 MHz,Veh. Tech. Conf. Rec., May 1992, pp. 666–671.
41. A. Goldsmith and L. Greenstein, A measurement-based model for predicting coverageareas of urban microcells, IEEE J. Sel. Areas Commun., vol. 11, no. 7, Sept. 1993,pp. 1013–1023.
42. J. Broch et al., A performance comparison of multi-hop wireless ad-hoc network routingprotocols, Proceedings of ACM/IEEE MOBICOM’98, Dallas, TX, 1998.
43. J. Li, C. Blake, D. S. J. De Couto, H. I. Lee, and R. Morris, Capacity of ad hoc wirelessnetworks, Proceedings of ACM SIGMOBILE, Rome, Italy, July 2001.
44. http://www.sfgov.org/site/tech connect page.asp.
45. http://motorola.canopywireless.com/.
46. http://www.connectronics.com/proxim/GigaLink.htm.
47. http://www.mrv.com/products/line/terescope.php.
48. A.M.J. Koonen, M. Garcıa Larrode, A. Ng’oma, K. Wang, H. Yang, Y. Zheng, andE. Tangdiongga, Perspectives of Radio over Fiber Technologies, OThP3 OFC/NFOEC,2008.
49. G. Kramer and G. Pesavento, Ethernet passive optical network (EPON): building a next-generation optical access network, IEEE Commun., vol. 40, no. 2, Feb. 2002, pp. 66–73.
50. W.-T. Shaw, S.-W. Wong, N. Cheng, and L. G. Kazovsky, MARIN Hybrid Optical-WirelessAccess Network, OFC 2006 OThM3.
51. W.-T. Shaw, S.-W. Wong, N. Cheng, K. Balasubramanian, X. Zhu, M. Maier, and L. G.Kazovsky, Hybrid architecture and integrated routing in a scalable optical-wireless accessnetwork, J. Lightwave Technol., vol. 25, no. 11, Nov. 2007, pp. 3443–3451.
52. T. Chen, H. Woesner, Y. Ye, and I. Chlamtac, Wireless gigabit ethernet extension, Broad-band Networks, vol. 1, 2005, pp. 425–433.
53. Y.-L. Hsueh, W.-T. Shaw, L. G. Kazovsky, A. Agata, and S. Yamamoto, SUCCESS PONdemonstrator: experimental exploration of next-generation optical access networks, IEEEOpt. Commun., Aug. 2005, pp. S26–S33.
54. Jens Buus, Tunable lasers in optical networks, J. Lightwave Technol., vol. 24, no. 1,Jan. 2006.
55. C. J. Chang-Hasnain, Tunable VCSEL, IEEE J. Sel. Top. Quantum Electron., vol. 6, no. 6,Nov. 2006.

266 HYBRID OPTICAL WIRELESS ACCESS NETWORKS
56. R. Chen, D. A. B. Miller, K. Ma, and J. S. Harris, Jr., Novel electrically controlled rapidlywavelength selective photodetection using MSMs, IEEE J. Sel. Top. Quantum Electron.,vol. 11, no. 1, Jan.–Feb. 2005, pp. 184–189.
57. http://www.teknovus.com/files/TK3722%20PB1.pdf.
58. W.-T. Shaw et al., MARIN: metro-access ring integrated network, presented at GLOBE-COM 2006, San Francisco, Nov. 2006.
59. J. Padhye, S. Agarwal, V. N. Padmanabhan, L. Qiu, A. Rao, and B. Zill, Estimation oflink interference in static multi-hop wireless networks, Proceedings of the 2005 InternetMeasurement Conference, pp. 305–310.
60. http://www.isi.edu/nsnam/ns/.

INDEX
Absorption, 56. See also Electroabsorptionmodulators (EAMs)
Access networks, 1, 3. See also Broadband accessnetworks
challenges facing, xiiihybrid fiber coax, 9
Access technologies, 4–6bandwidth and reach for, 5comparison of, 5–6competition in, 29future, 1–2
Acknowledgment (ACK) signal, 252. See alsoREGISTER ACK message
Ac power lines, 18Active optical networks (AONs), xivAd hoc on-demand distance vector (AODV),
228ADSL standard, 7–8. See also Asymmetric DSL
(ADSL)Advanced encryption standard (AES) technique,
115, 137, 142. See also AES-128 standardsAdvanced Mobile Phone System (AMPS), 24Aerial optical fiber deployment technique,
240–241AES-128 standards, 155. See also Advanced
encryption standard (AES) technique
Amplified spontaneous emission (ASE) noise, 80,95–96, 106
Amplifier gain, 79, 83Amplifier noise figure, 80Amplitude shift keying (ASK), 20Analog TV broadcasting, 31Analog video delivery architecture, 121Analog video signals, 27Antenna technology, advanced, 222APD receivers, 95, 157. See also Avalanche
photodiodes (APDs)APON standard, 12. See also ATM-based PON
(APON); Passive optical networks (PONs)Application-specific integrated circuit (ASIC), 243Arrayed waveguide gratings (AWGs), 92–93, 163,
173, 177, 190–191. See also AWG entriestemperature-stabilized, 200
Arrival-time framing, 207Asymmetrical transmission, 7Asymmetric DSL (ADSL), 6. See also ADSL
standard; Digital subscriber line/loop (DSL)Asynchronous transfer mode (ATM), 12, 115–116,
121–123. See also ATM entries;Non-ATM-based service network interfaces
ATM adaptation layer 5 (AAL5) cells, 123.See also Asynchronous transfer mode (ATM)
Broadband Optical Access Networks, First Edition. Leonid G. Kazovsky, Ning Cheng, Wei-Tao Shaw,David Gutierrez, and Shing-Wa Wong.C© 2011 John Wiley & Sons, Inc. Published 2011 by John Wiley & Sons, Inc.
267

268 INDEX
ATM-based PON (APON), 108, 115. See alsoAPON standard; ATM-PON; Passive opticalnetworks (PONs)
ATM cell, 125–126ATM cell format/services, 122–123ATM network protocol, 133ATM-PON, 12. See also ATM-based PON
(APON); Passive optical networks (PONs)ATM QoS service classes, 123ATM virtual circuits, 8Autodiscovery process, 114, 148–151
mixed-mode, 160Automatic bias control, 72Automatic protection switching (APS) techniques,
114Avalanche current-multiplication process, noise
associated with, 76Avalanche photodiodes (APDs), 74–76, 173.
See also APD receiversstructure of, 75
AWG channels, wavelength bands for, 191.See also Arrayed waveguide gratings (AWGs)
AWG MUX/DEMUX, 190. See also DEMUXAWG + PD/RX sets, 193
Backbone networks, 2Backhaul layer, 237Backhaul network deployment cost, 240–241Backhaul point-to-point connections, 22Back-reflection Rayleigh backscattering, 174Backreflections, 181Bandpass filter (BPF), 158Bandwidth, of a photodiode, 74Bandwidth demand, xiii, 1, 5, 29
monitoring, 247–248WDM-PON and, 13–15
Bandwidth-distance product, 181Bandwidth efficiency, of wireless mesh networks,
231Bandwidth grant, EPON, 151–152Bandwidth requirements, of multimedia
applications, 5Base station controller, 24, 25Batch earlier departure first (BEDF) algorithm,
206BER performance, 184. See also Bit error rate
(BER)Bessel function, 40, 42Best effort (BE) traffic, 210, 211Bidirectional amplifiers, 9Bidirectional optical subassembly (BOSA), 101Bidirectional pumping configuration, 81Bidirectional transmission, 182, 199Binary tree mechanism, 130
Bit error rate (BER), 97, 98, 127. See also BERperformance; CLS + MMF BERmeasurements
Bit-error-rate tester (BERT), 171–172Bit interleaved parity (BIP), 127, 138Bit rate-distance (BL) product, 99–100Bit rates, 10GEPON standard, 156–157Booster amplifier, 80BPON analog video overlay architecture, 120.
See also Broadband PON (BPON); Passiveoptical networks (PONs)
BPON architecture, 118–121versus GPON architecture, 134
BPON downstream/upstream data-rate pairs, 118BPON dynamic bandwidth allocation, 130–133BPON in-band IP video delivery architecture,
120BPON key churning technique, 142BPON ONTs, 130BPON parameters, comparison with GPON and
EPON parameters, 116BPON PLOAM cell format, 126. See also
Physical-layer operation, administration, andmaintenance (PLOAM) cell format
BPON protocol layers/functional blocks, 124–125BPON protocol/service, 121–125BPON ranging process, 129–130BPON standard, 12–13, 115–116BPON T-CONT architecture, 131, 132BPON T-CONT types, 132BPON transmission convergence layer, 125–130BPON transmission frames, 127–129BPON wavelength plan, 119Bragg diffraction, 59Bragg gratings, 91–92Brillouin effect, 180Broadband access, pervasive, 4Broadband access networks, 1, 4Broadband access services, 29–30Broadband access technologies, 1–33. See also
Broadband backhaul technologies;Broadband fiber access
access technologies and, 4–6broadband over power lines, 18–20broadband services and emerging technologies,
28–31communication networks, 2–4digital subscriber line, 6–8future, 1–2growth of, 28–29hybrid fiber coax, 9–11optical access networks, 11–17summary of, 31–32wireless access technologies, 20–28

INDEX 269
Broadband backhaul technologies, 239–240comparison of, 240
Broadband communication over power lines, 1Broadband demand, 32Broadband deployment wave, 29Broadband fiber access, European efforts in,
xiv“Broadband for all” society, 29Broadband light sources, spectrum-sliced, 104,
176–178Broadband optical access networks, importance
of, xi. See also Next-generation broadbandoptical access networks
Broadband over power lines (BPL), 18–20, 32challenges in, 20modem, 19–20
Broadband PON (BPON), 108, 110, 115,117–133, 167. See also BPON entries;Passive optical networks (PONs)
ONT management and control interfacespecification for, 133
Broadband power-line communications, 19Broadband services, future, 30Broadcast LLID, 161. See also Logical link ID
(LLID)Buried optical fiber deployment technique,
240–241Burst-mode laser drivers, 103Burst-mode operation, 112–113Burst-mode optical transmission, 102–104Burst-mode receivers (BMRx), 102–104, 135Burst-mode transmitters, 102, 103
Cable access, 29Cable modem, 1, 9, 10. See also
Modulator/demodulator (modem)Cable networks, 9Capacity, of wireless mesh networks, 231–237Capacity injection layer, 237Carrier concentration, 64–65Carrier density, 61–62Carrierless amplitude phase (CAP) modulation
method, 8Carrier rate equation, 61Carrier-sense multiple access with collision
avoidance (CSMA/CA), 22, 227–228Cavity losses, 59C-band, 82CDR time, 145. See also Clock and data recovery
(CDR)Cell delay variation (CDV), 123Cell-level synchronization, 171Cell loss priority (CLP), 123Cell splitting, 231
Cell transfer delay (CTD), 123Cellular networks, 24–25Central access offices, consolidating, 163–164Centralized dynamic bandwidth allocation, 114Centralized light sources (CLSs), 106. See also
CLS entriesarchitectures of, 180–181with RSOAs, 179–181
Channel loss, 98China Communications Standards Association
(CCSA), 164Chromatic dispersion, 47, 49–51, 111–112Class A transceivers, 111Class B+ (28 dB)-type transceivers, 111Class C transceivers, 111Class-of-service-oriented bandwidth allocation,
154Client devices, 226–227Client wireless mesh networks, 226Clock and data recovery (CDR), 135. See also
CDR timeClock and data recovery circuits, 77–78Clock recovery architectures, 103–104CLS + MMF BER measurements, 183. See also
Bit error rate (BER); Centralized lightsources (CLSs); Multimode fibers (MMFs)
CLS + MMF experimental setup, 182CLS + MMF loss of components, 183CMOS-controlled tunable photodetectors, 175Coax cable access bandwidth, 31Coaxial cables, 6, 9. See also Hybrid fiber coax
(HFC)Code group, 146Coding hierarchy, 171Coexistence options, 10GEPON, 161–162Coherent transmission systems, xiCollector ring, 200Colorless ONUs, 104–106, 173–174. See also
Optical network units (ONUs)SUCCESS-HPON, 199
Communication, free-space optical, 16–17Communication networks, 2–4
evolution of, 30Communication satellites, modern, 26Complementary code keying (CCK), 22Complementary error function, 97Complex amplitude, 57Conduit optical fiber deployment technique,
240–241Confinement factor, 44Congestion monitoring, 260Congestion report, 260Connection, 224Continuous-mode transmission, 102

270 INDEX
Continuous wave (CW), 182–183, 203. See alsoCW optical carrier
Continuous wave semiconductor lasers, 55Control frame format, 256Control packet format, 255–256Copper wire technologies, transmission distance
of, 239Couple-cavity semiconductor lasers, 59–60Coupled mode theory, 87Coupling coefficient, 87Coupling length, 49Coupling ratio, 89Cross-gain saturation, 86Cross-phase modulation, 54CWDM (coarse wavelength-division
multiplexing) band splitters, 196CWDM RN, 197. See also Remote nodes (RNs)CW optical carrier, 201. See also Continuous
wave (CW)Cyclic redundancy check (CRC), 127Cylindrical coordinates, 39
Data link layer, DOCSIS, 10–11Data modulation schemes, 106, 180Data Over Cable Service Interface Specifications
(DOCSIS), 10–11. See also DOCSIS entriesData rates, 7
BPL-supported, 20in BPON architecture, 118in cellular networks, 25
Data subcarriers, 219–220Data transmission, 3
shared resources in, 202–203DBA protocol, 131–133. See also Dynamic
bandwidth allocation (DBA)DBR mirrors, 59. See also Distributed Bragg
reflector (DBR) lasersDedicated twisted pairs, 9Delimiter, 128DEMUX, tunable, 192. See also AWG
MUX/DEMUX; MUX/DEMUX; WDMMUX/DEMUX
Denial of service (DoS) attack, upstream, 155Dense wavelength-division multiplexing
(DWDM), 242. See also DWDM RNsDepletion layer, 73DFB/DBR lasers, 60, 174–175. See also
Distributed Bragg reflector (DBR) lasers;Distributed feedback (DFB) lasers
DFB lasers, 100lasing frequency in, 65
Differential binary-phase shift keying (DBPSK),22
Differential-dispersion parameter, 51Differential material dispersion parameter, 50Differential quadrature-phase shift keying
(DQPSK), 22Digital communication links, 25Digital encoding techniques, 24Digital encoding technologies, 32Digital subscriber line/loop (DSL), 1, 5–6, 6–8,
29. See also DSL entries; Voice over DSL(VoDSL)
next-generation, 31Digital video broadcasting (DVB) standards, 26Direct bandgap semiconductor, 55–56Directional couplers, 86–89Direction modulation, 66–71, 72Direct modulation, 71Direct sequence spread spectrum (DSSS), 20, 22Discovery GATE message, 150, 160Discovery process, 114Discrete multitone (DMT) modulation method, 8Dispersion, chromatic, 111–112. See also Fiber
dispersionDispersion coefficient, of standard-mode fibers, 65Dispersion-flattened fibers, 51Dispersion limit, 99–100Dispersion-shifted fiber, 51Dispersion slope, 51, 55Distance-dependent path loss, 230Distributed Bragg reflector (DBR) lasers, 173.
See also DBR mirrors; DFB/DBR lasersDistributed feedback (DFB) lasers, 59, 173.
See also DFB/DBR lasersDivided slot, 132–133DOCSIS+, 27. See also Data Over Cable Service
Interface Specifications (DOCSIS)DOCSIS PON (DPON), 16. See also Passive
optical networks (PONs)DOCSIS-S, 26DOCSIS specifications, 27Dominant mode, 58Downstream encryption mechanisms, EPON,
154–155Downstream payload length indicator, 138Downstream physical control block, 137–138Downstream PLOAM, 126. See also
Physical-layer operation, administration, andmaintenance (PLOAM) cell format
Downstream PLOAM field, 138Downstream PLOAM messages, 127Downstream transmission frame, 127–128Downstream transmission, in SUCCESS-DWA
PON, 190–192Driver circuits, 103
INDEX 271
DSL access multiplexer (DSLAM), 7. See alsoDigital subscriber line/loop (DSL)
DSL configuration, 7DSL standards, 7Duplex scheme, WiMAX, 222DVB-RCS (Digital Video Broadcasting–Return
Channel via Satellite), 26DWDM RNs, 196–197. See also Dense
wavelength-division multiplexing (DWDM);Remote nodes (RNs)
Dynamic bandwidth allocation (DBA), 13, 114,153–154. See also DBA protocol
BPON, 130–133Dynamic sensitivity recovery, 103Dynamic wavelength allocation (DWA), 186, 191.
See also SUCCESS-DWA; SUCCESS-DWAPON
EDFA pump schemes, 82. See also Erbium-dopedfiber amplifiers (EDFAs)
EH modes, 43Electrical multiplexing technique, 169Electrical–optical (EO) converter, 60Electrical power distribution grid, 18Electroabsorption effect, 70Electroabsorption-modulated laser, 71Electroabsorption modulators (EAMs), 70–71,
174. See also Reflective electroabsorptionmodulators (REAMs); Semiconductorelectroabsorption modulators
Electromagnetic field, in fiber core and cladding,42
Electron density, 61, 62Electron-hole pair, 73Electron injection, 75Electrooptic effect (electroreflection effect),
66Element management system (EMS), 143Emerging technologies, 30–31Energy consumption, distribution of, 164Energy-saving techniques, for PONs, 163–164Enhanced data rates for GSM evolution (EDGE),
24Enhancement band, 143EPON autodiscovery process, 148–151. See also
Ethernet PON (EPON); Passive opticalnetworks (PONs)
EPON bandwidth enhancements, 168EPON deployments, 189EPON downstream encryption mechanisms,
154–155EPON framing, 146–147EPON header, 146
EPON parameters, comparison with BPON andGPON parameters, 116
EPON physical media-dependent layer, 13EPON physical medium-dependent sublayer,
144–145EPON PMD options, 145. See also Physical
medium-dependent (PMD) layerEPON point-to-multipoint MAC control (MPMC),
147–152EPON security weaknesses, 155–156EPON standards, 111
development of, 116EPON sublayer extensions, 145–146Erbium-doped fiber, 82Erbium-doped fiber amplifiers (EDFAs), 78,
81–83, 86, 201. See also L-band EDFAEthernet frames, 203, 207Ethernet in the first mile (EFM), 144Ethernet in the first-mile 802.3ah study group,
108Ethernet over fiber, 15–16Ethernet PON (EPON), 29, 108–109, 110,
112–116, 144–156, 167. See also EPONentries; GPON/EPON; Passive opticalnetworks (PONs)
open implementations in, 152–155report process for, 151–152
Excess noise factor, 76Excitons, 71Expected transmission count (ETX), 228–229Expected transmission time (ETT), 229Extended Total Access Communication System
(ETACS), 24External cavity lasers, 60, 174External modulation, 66, 71–72External modulators, 106
Fabry–Perot cavity, 74Fabry–Perot interferometer (FP etalon), 89–91Fabry–Perot (FP) lasers, 57–59, 173
injection-locked, 104, 174, 178–179Failures in time (FTT), 114Fast clock recovery, 103–104FEC code word boundary, 159. See also Forward
error correction (FEC)Feeder fibers, 195Fiber Bragg gratings, 91–92. See also Optical fiber
entriesFiber dispersion, 47–52, 93, 99–100Fiber dispersion parameter, 49–50Fiber-lean deployment, 187–188Fiber-lean evolution, 188–189Fiber-lean tree upgrade, 188

272 INDEX
Fiber loss, 45–47, 93fundamental limit on, 46
Fiber loss coefficient, 111Fiber loss spectrum, factors contributing to, 45Fiber mode, 38–44Fiber nonlinearities, 93Fiber optical backhaul, 240Fiber optic communication system, 34Fiber-rich deployment, 187, 188Fiber-rich evolution, 190Fiber-rich tree upgrade, 189–190Fiber structure, 35–38Fiber to the building (FTTB), 117Fiber to the cabinet (FTTC), 117Fiber to the home (FTTH), 117. See also FTTH
connectionsFiber to the node (FTTN), 117Fiber to the x (FTTx), 12. See also FTTx entriesField distribution, 40
in fiber core and cladding, 40–42for a single-mode fiber, 44
Field-programmable gate arrays (FPGAs), 195,251
Field radius, 44Field theory, 87–88Filter transfer functions, 90–91First-generation satellites, 25First-last-mile bottleneck, 5First mile, 4Flow control, 260Forward error correction (FEC), 136–137, 157,
168. See also FEC code word boundaryFourth-generation wireless networks, 20Four-wave mixing effects, 54Frame formats, 203–204Frame synchronization (Psynch), 137Franz–Keldysh effect, 70–71Free carriers, 74Free-space optical communications, 32Free-space optical networks, 16–17Free-space optical technologies, 240Free spectral range (FSR), 90Frequencies, below 11 GHz, 219Frequency chirp, 64–66Frequency-division-duplex (FDD), 222Frequency hopping direct sequence (FHSS), 22Frequency modulation, 66Frequency reuse, in WIMAX, 222Frequency shift keying (FSK), 20FSAN NGA road map, 162–163. See also Full
service access network (FSAN)FTTH connections, 30. See also Fiber to the house
(FTTH)
FTTx applications, optical transceivers for,101–102. See also Fiber to the x (FTTx)
FTTx deployments, 30, 116–117FTTx networks, 1, 5, 6, 11Full service access network (FSAN), 144Full service access networks working group, 12,
13, 108, 169
G.983 recommendations, 133G.984.6 standard, 163G.984 Series Standards/Revisions/Amendments,
142–143Gain, 57–58Gain coefficient, 79, 85Gain peak, 85Gain ripple, 84Gain saturation, 79, 81Gain spectrum, 84Gated service, 154GATE messages, 147, 148, 154. See also
Discovery GATE message; Normal GATEmessage
Gateway association, 260Gateway router look-ups, 260Gateway routers (GRs), 227, 231–237, 243Gaussian distribution, 44Gaussian function, 97GEM fragmentation/reassembly process, 142.
See also GPON encapsulation method(GEM)
GEM header error correction (HEC), 141GEM payload length indicator (PLI), 140GEM payload-type indicator (PTl), 141GEM port identification (Port-ID), 141General packet radio service (GPRS), 24Generic flow control (GFC) field, 122Generic framing procedure (GFP), 113Geostationary orbit, 26Gigabit-capable PON (GPON), 29, 108–109, 110,
112–116, 116, 133–143, 167. See also GPONentries; Passive optical networks (PONs)
Global communication infrastructuredevelopment of, 1hierarchical architecture of, 2
Global positioning system (GPS), 25GPON architecture, 134. See also Gigabit-capable
PON (GPON); Passive optical networks(PONs)
GPON bandwidth enhancements, 168–169GPON deployments, 189GPON downstream encryption method, 142GPON encapsulation method (GEM), 13, 113,
137, 140–142

INDEX 273
GPON/EPON, fiber dispersion in, 100. See alsoEthernet PON (EPON)
GPON forward error correction, 136–137GPON parameters, comparison with BPON and
EPON parameters, 116GPON physical medium-dependent layer,
134–137GPON standards, 12–13, 111GPON transmission convergence downstream
frame, 137–138GPON transmission convergence (GTC) layer,
134GPON transmission convergence layer,
137–142GPON transmission convergence upstream frame,
138–140GPON upstream overhead, allocation of, 135Graded-index fibers, 37Grants, 127Group velocity, 47Group velocity dispersion, 49, 59, 65Group velocity dispersion parameter, 49–50Guard time, 128
HDSL, 8. See also Digital subscriber line/loop(DSL)
Header error check (HEC), 123HE modes, 43, 44Hierarchical architecture, 237Hierarchical wireless access networks, 238
TDM-PON for upgrade of, 242–244High-bit-rate long-reach communication systems,
66High-capacity research issues, xiiHigh-definition (HD) TV, 120High load resistor, 77High-performance optical communication
systems, 55High-priority (HP) traffic, 210, 211High-speed access over power lines, 18High-speed data, 10High-speed fiber optic communication systems,
polarization mode dispersion in, 52Hybrid fiber coax (HFC), 5, 9–11
in networks, 3, 16Hybrid IP/analog video delivery architecture,
121Hybrid modes, 43Hybrid optical–wireless access network
architecturereconfigurable optical backhaul architecture
and, 247–257TDM-PON technology and, 242–244
Hybrid optical–wireless access networks,216–266
generic, 241integrated routing algorithm for, 258–262upgrading path and, 244–247
Hybrid TDM/WDM-PON, 184–202. See alsoPassive optical networks (PONs);TDM/WDM (Time-divisionmultiplexing/wavelength-divisionmultiplexing)
Hybrid tree topology evolution, 186–195Hybrid video delivery architecture, 121Hybrid WDM-TDMA technique, 161. See also
Time-division multiple access (TDMA);Wavelength-division-multiplex- entries
ICT ALPHA, xivICT OASE, xivICT SARDANA, xivIDENT (identification) field , 126, 127, 138IEEE standards
802.11 standards and technologies, 21–22,227–228
802.11s mesh networking, 226802.16 WiMAX, 217–225802.3ah EPON, 112, 152–153. See also
Ethernet PON (EPON)802.3av 10GEPON, 156, 158, 162, 163802.3z gigabit Ethernet (GbE) frame format,
113In-band IP video delivery, 120Incumbent local exchange carriers (ILECs), 29Index ellipsoid, 67Infrastructure wireless mesh networks,
226–227PHY and MAC layers of, 227–228
Injection current, 62Injection-locked Fabry–Perot (FP) lasers, 104,
174, 178–179In-line amplifier, 80Integrated access services, 30Integrated interferometer, 175Integrated routing algorithm
for hybrid access networks, 258–262simulation results and performance analysis of,
260–262Integrated routing paradigm, steps in,
258–260Intensity modulation, 66
frequency chirp associated with, 65Intensity modulation–direct detection (IM-DD)
scheme, 66Intensity modulator, 69

274 INDEX
Interexchange carriers (IXCs), 29Interference, in wireless networks, 22Interframe gap (IFG), 145Interleaved polling and adaptive cycle time
(IPACT) DBA, 153–154. See also Dynamicbandwidth allocation (DBA)
Intermodal dispersion, 47–49Internal quantum efficiency, 62Internet
growth of, 1bottlenecks in, 31
Internet group management protocol (IGMP),120
Internet protocol (IP) technologies, 4. See alsoIn-band IP video delivery; IP entries
Internet users, as drivers of broadbandapplications, 28
Interoperability, BPON, 121Intersymbol interference (ISI), 220Intramodal dispersion, 47, 49–51Intrinsic layer, 73–74Inverse fast Fourier transform (IFFT), 221IP-based mobile system, 24. See also Internet
protocol (IP) technologiesIP over WDM optical networks, 30IP packets, 203IP TV, 4, 31. See also Internet protocol (IP)
technologiesIP video delivery architecture, 121ITU G.983.3 amendment, 169ITU standards, 108, 109ITU-T BPON, 112. See also Broadband PON
(BPON)ITU-T G.983.x recommendations, 133ITU-TG.984.5 standard, 163ITU-T G.984 series standard, 133–134ITU-T G.7041 generic framing procedure, 13ITU-T standardization, 108, 115
Japan, broadband subscribers in, 30Just-in-time DBA scheme, 154. See also Dynamic
bandwidth allocation (DBA)Just-in-time scheduling strategy, 153
Ka-band, 25Kazovsky, Leonid, xi–xiiKey churning, 142Korea Telecom, 164, 179Ku-band, 25
Large-scale fading/shadowing, 230Laser control field (LCF), 127
Laser diodes, 173Laser driver design, 72Laser-on/off time, adjustable, 160–161Laser oscillation, 58Laser power control, 135–136Lasers. See also Continuous wave semiconductor
lasers; Couple-cavity semiconductor lasers;Distributed Bragg reflector (DBR) lasers;Distributed feedback (DFB) lasers; Externalcavity lasers; Fabry–Perot (FP) lasers;Multisection DFB/DBR lasers;Semiconductor lasers;Single-longitudinal-mode lasers; Tunablelasers (TLs); Vertical-cavity surface-emittinglasers (VCSELs)
modes of oscillation of, 58tunable, 174–175, 176, 194, 197, 203tunable semiconductor, 60
Laser wavelength, laser cavity and, 58Last mile, 4Last-mile bottleneck, 4–5, 32Last-mile point-to-multipoint wireless access
technology, 26L-band EDFA, 82. See also Erbium-doped fiber
amplifiers (EDFAs)Legacy infrastructure, 185Level recovery, 103License-exempt frequencies, below 11 GHz,
219Light modulation, 66Light ray travel, 36Light sources, WDM, 104–106Light-wave propagation, in optical fibers, 54–55Light waves, propagation constant of, 38–39Limiting amplifiers, 77Line-coding technique, 171Line-of-sight (LOS) propagation environment,
219Line rate enhancements research, 169Linewidth enhancement factor, 65Link capacity, upgrading, 233Lithium niobate crystal, index ellipsoid of, 67Lithium niobate modulators, 66–70
operation of, 70LMDS architecture, 27. See also Local multipoint
distribution service (LMDS)Local area networks (LANs), 2–3Local loss minima, wavelength regions for, 45Local multipoint distribution service (LMDS),
26–28Local WMN route calculation, 259–260Logical link ID (LLID), 146. See also Broadcast
LLID

INDEX 275
Longitudinal modes, 58–59Long-period fiber grating, 92Long-wavelength VCSELs, 60. See also
Vertical-cavity surface-emitting lasers(VCSELs)
Loss mechanisms, 45Low-attenuation fibers, 45Low loss, 52–53Low-loss optical fibers, 45Low-pass filter (LPF), 249
Mach–Zehnder interferometer, 66, 68–69, 91MAC layer, of wireless mesh networks, 227–228.
See also Media access control (MAC)protocols
MAC layer control, 22MAC layer MPCP clock, 145MAC protocol global status variables, 205MAC scheduler, 223Management information base (MIB), 133Manchester coding, 172Masquerade attack, 155–156Material absorption, 46Material dispersion, 49Material dispersion parameter, 50Material purification, 46MAX GRANT, 205Maxwell=s equations, 38–39Media access control (MAC) protocols, 203–204.
See also MAC entriesWiMAX, 223
Medium access protocol (MAP)-based signalingscheme, 224. See also Multiple accessprotocol (MAP)
Mesh access, 21Mesh backhaul, 21Mesh layer, 237Mesh network, 17Mesh routers (MRs), 231–234Mesh topology, 23Metropolitan area networks (MANs), 3
research in, xiiiMicroelectromechanic system (MEMS) structure,
60Midspan reach extension, 143Millimeter-wave technologies, 240Minimum cell rate (MCR), 123Minimum modal dispersion, 37Mixed-mode autodiscovery process, 160MMDS architecture, 28Mobile ad hoc networks (MANETs), 225,
226Mobile broadband wireless access (MBWA), 6
Mobile multihop relay WiMAX networks,224–225
Mobile switching center, 24, 25Mobile WiMAX. See also Worldwide
interoperability for microwave access(WiMAX)
modulations and code rates for, 221RF bands specified in, 219
Mobile WiMAX network architecture, 218Mobile WiMAX system capacity, 218Modal dispersion, 36, 47–49Mode coupling, 49Mode field diameter, 44Models, of wireless mesh networks, 230–231Mode partition noise (MPN), 136Modes of oscillation, 58Modulation dynamics, 62–64Modulation methods, 8Modulation speed, 6lModulator/demodulator (modem), 7. See also
Cable modembroadband over power lines, 19–20
Modulator drivers, 72Modulators. See also Electroabsorption
modulators (EAMs); External modulators;Intensity modulator; Lithium niobatemodulators; Modulator/demodulator(modem); MZ modulators; Opticalmodulators; Reflective electroabsorptionmodulators (REAMs); Semiconductorelectroabsorption modulators
electroabsorption, 70–71lithium niobate, 66–70
MPCPDU messages, 248. See also Multiple pointcontrol protocol (MPCP)
MPCPDU modifications, 160–161Multicarrier modulation (MCM) scheme, 219Multichannel multipoint distribution service
(MMDS), 27–28Multihop wireless communications, 21Multilongitudinal mode (MLM) laser, 136Multimedia applications, 29
bandwidth demands and, 11bandwidth requirements of, 5emerging, 4
Multimedia networks, striving to build, 1Multimedia streams, 167Multimode fibers (MMFs), 35–37, 181–184Multipath fading, 230Multiple access protocol (MAP), 11–12. See also
Medium access protocol (MAP)-basedsignaling scheme
Multiple-frequency channels, 6

276 INDEX
Multiple point control protocol (MPCP), 110,147–152
Multiplication factors, 75–76Multiplying mean time to repair (MTTR), 114Multisection DFB/DBR lasers, 60, 174–175Multisystem operators (MSOs), 16, 29MUX/DEMUX, 198. See also DEMUX; OLT
MUX; ONT MUX; Transmission multiplexer(MUX); WDM MUX/DEMUX
AWG, 190MZ modulators, 200, 202
National information highways, ramps and accessroutes to, 4
Network architectures. See also Hybridoptical–wireless access network architecture;Mobile WiMAX network architecture;Next-generation broadband optical accessnetworks; Optical access networkarchitectures; Passive optical networkarchitectures; Topologies;Wavelength-division multiplexed passiveoptical networks (WDM-PONs); WDM-PONnetwork architectures
based on injection-locked lasers, 179BPON, 118–121GPON, 134SUCCESS-HPON, 181TDM-PON, 109–110WDM-PON, 172–184
Network dimensioning, 110Networking bottleneck, xiiiNetwork–network interface (NNI), 122Network terminal (NT), 248New services, launching, 170Next-generation broadband optical access
networks, 166–215hybrid TDM/WDM-PON, 184–202TDM-PON evolution, 167–172WDM-PON components and network
architectures, 172–184WDM-PON protocols and scheduling
algorithms, 202–211Next-generation broadband technologies, 29Next-generation optical access system
development, 162–164NGA-2 networks, 163Noise, avalanche-process, 76Noise figure, 80
of an SOA, 84–85Noise sources, 94Non-ATM-based service network interfaces, 133.
See also Asynchronous transfer mode (ATM)
Nonlinear effects, 54Nonlinear refraction, 53–54Nonlinear scattering, 53Nonlinear Schrodinger equation, 54Non-LOS (NLOS) scenarios, 219Non-return-to-zero (NRZ) code, 110Non-return-to-zero (NRZ) format, 170–171Normal GATE message, 151Null subcarriers, 219–220Numerical methods, 54
OCDM PON, 16. See also Passive opticalnetworks (PONs)
ODN interface, 124, 125. See also Opticaldistribution networks (ODNs)
OFDMA, 222OLT DBA function, 152. See also Dynamic
bandwidth allocation (DBA); Optical lineterminal (OLT)
OLT functional blocks, 124OLT idle cell monitoring scheme, 132OLT MUX, 124. See also MUX/DEMUXOLT power measurement, 138OLT receiver, 135–136OLT transmitting end, 199, 2001GEPON coexistence options, 161ONT functional blocks, 125. See also Optical
networking terminals (ONTs)ONT management and control interface
specification (OMIC), 133ONT management and control channel (OMCC),
133ONT MUX, 125. See also MUX/DEMUXONT status reporting (SR) scheme, 131ONT synchronization, 129ONU clock, 145. See also Optical network units
(ONUs)ONU designs, 181ONU sleep-mode option, 163ONU TIMEOUT, 205Open implementations, in EPON, 152–155Open systems interconnection (OSI) reference
model, 144Operating expenses (OPEX), 29Operation, administration, maintenance, and
provisioning (OAMP), 16Optical access network architectures, 117
standardized, 6Optical access networks, 11–17
additional types of, 15–17next-generation, 30types of, 116–117
Optical access solutions, 216, 217

INDEX 277
Optical access system development,next-generation, 162–164
Optical amplification gain, 85Optical amplifier performance, 80–81Optical amplifier power gain, 79Optical amplifiers, 45, 78–86, 107
Raman amplifiers, 85–86rare-earth-doped fiber amplifiers, 81–83semiconductor optical amplifiers, 83–85
Optical backhaul architecture, reconfigurable,247–257
Optical code-division multiplexing (OCDM), 16Optical coding gain, 136, 157Optical communication components/systems,
34–107optical amplifiers, 78–86optical fibers, 35–55optical receivers, 72–78optical transceiver design for TDM-PONS,
101–106optical transmitters, 55–72passive optical components, 86–93system design and analysis, 93–100
Optical communication system design, 93–100power budget in, 98–99receiver sensitivity in, 93–98
Optical communication systemsfiber loss in, 45–47system performance of, 107
Optical communication technology, growth of, 34Optical couplers, 88Optical coupling, 87Optical detector, 34Optical distribution networks (ODNs), 11,
109–110, 167. See also ODN interfaceOptical–electrical–optical (O-E-O) repeater, 78Optical fiber(s), 34, 35–55, 106. See also Fiber
entrieslight-wave propagation in, 54–55nonlinear effects in, 52–53
Optical fiber access networks, xiiiOptical fiber deployment techniques, 240–241Optical fiber loss spectrum, 46Optical filters, 86, 89–93, 101Optical gain, of a Raman amplifier, 85Optical input power, 69Optical isolator, 81Optical line terminal (OLT), 11, 14, 101, 102,
104–106, 109–110, 168, 172–173. See alsoOLT entries; SUCCESS-HPON OLT
TL-buffering scheme in, 210–211Optical modulators, 55, 66–71Optical multiplexers, 86
Optical networking terminals (ONTs), 11, 118.See also ONT entries
Optical networks. See Passive optical networks(PONs)
Optical network technology, 216Optical network units (ONUs), 11, 14, 101, 102,
104–106, 109–110. See also Colorless ONUs;ONU entries; SUCCESS-HPON colorlessONU; TDM-PON ONUs; WDM-PON ONUs
Optical power, 79Optical power attenuation, 45Optical power coupling, 88–89Optical power flow, 87Optical power splitter, 89, 200Optical power transfer function, 89–90Optical preamplifiers, 95–96Optical pulse, dispersion of, 47Optical radiation modes, 57Optical receiver bandwidth, 77Optical receiver block diagram, 77Optical receivers, 34, 72–78
design of, 76–77Optical return loss (ORL) disturbances, 189Optical signal
amplification of, 78–79energy of, 42–43group velocity of, 47power of, 78
Optical source, 55Optical splitters, 86Optical technologies, 30Optical transceiver block diagram, 101Optical transceiver design
for TDM-PONs, 101–106Optical transceivers, 17Optical transmitter, 34Optical transmitter block diagram, 72Optical transmitter design, 71–72Optical transmitters, 55–72Optical waveguides, parallel, 86, 88Optical wireless communication, 16–17Optimized link state routing (OLSR), 228Optimum index profile, 37Optimum threshold, 97–98Orthogonal frequency-division multiplexing
(OFDM), 20. See also QAM/OFDM datasignals
in WiMAX, 219–222Output saturation power, 79–80Overlay schemes, comparing, 171–172
P802.3av 10GEPON task force, 168Packet collisions, 102

278 INDEX
Packet encapsulation methods, 109Packet switching, 4PAM signals, 8Passive optical components, 86–93Passive optical network architectures, 11,
108–165. See also TDM-PON entriesreliability of, 114–115security of, 115
Passive optical networks (PONs), xiv, 11–12, 31,30, 32, 38, 55, 166, 167, 216. See alsoATM-based PON (APON); Broadband PON(BPON); DOCSIS PON (DPON); EthernetPON (EPON); Gigabit-capable PON(GPON); Radio-frequency PON (RF PON);10-Gb/s PONs; SUCCESS-HPON entries;Time-division multiplexed passive opticalnetworks (TDM-PONs);Wavelength-division multiplexed passiveoptical networks (WDM-PONs)
buffer depth and packet loss of, 250–251burst-mode operation in, 112–113channel loss in, 98–99energy-saving techniques for, 163–164fiber deployment cost for, 241traffic allocation between, 249
PAUSE message, 147Payload-type indicator (PTI), 122Peak cell rate (PCR), 123Peer-to-peer Web traffic, 29Phase matching, 54Phase-matching condition, 92Phase modulation, 66
intensity modulation and, 65Phase shift, 83–84Photocurrent, 94, 95Photodetectors, 72–76, 106Photodiode design, 74Photogenerated carriers, 74Photon density, 61–62
rate equation for, 61, 65Photonics and Networking Research Laboratory
(PNRL), xi, xiiiPhotonic technologies, development of, 34PHY layer, of wireless mesh networks, 227–228Physical coding sublayer (PCS), 146Physical Layer, DOCSIS, 10Physical-layer operation, administration, and
maintenance (PLOAM) cell format, 125–127.See also PLOAM entries
Physical medium attachment sublayer (PMA), 146Physical medium-dependent (PMD) layer, 10, 109Pilot subcarriers, 219–220“Ping-Pong” technique, 205p-I-n junction, 73, 74
PIN photodiodes, 73–74PIN receivers, 94–95
with optical preamplifiers, 95–96Planar light-wave circuits (PLCs), 173PLOAM cell rate, 129PLOAM cells, 128PLOAM messages, 248. See also Downstream
PLOAM entries; Upstream PLOAM entriesdownstream, 127upstream, 127
p-n junction, 73, 74Point-to-multipoint (P2MP) architecture, 109Point-to-multipoint fiber, 144Point-to-multipoint topology, 244Point-to-multipoint wireless access, 22–23Point-to-point emulation (P2PE), 113Point-to-point-emulation function, 146Point-to-point Ethernet optical access networks,
15Point-to-point optical wireless links, 17Polarization mode dispersion, 47, 51–52Polarization mode dispersion parameter, 52Polarization modulation, 66PON bandwidths, 110. See also Passive optical
networks (PONs)PON deployment, convergence of, 186PON dimensioning, 110PON packet format/encapsulation, 113–114PON standards, 115–117
development of, 12–13history of, 115–116
Population inversion, 56–57Population inversion factor, 80Power attenuation, 45Power budget, 98–99, 110–112
10GEPON standard, 156–157Power coupling coefficient, 88, 89Power-leveling sequence (PLS) mechanism, 140Power-line communication technology, 18–19Power reflection coefficient, 58Power transfer function, 91Power transmitted, 69Pr-doped fiber amplifiers, 83Preamble, 128Preamplifier, 76, 77, 80–81Primary photocurrent, 74–75Proactive routing protocols, 228Probability density function, 97Propagation constant, 41, 38–39, 43, 48Propagation delay, 36, 47–48, 49Propagation environments, of wireless mesh
networks, 230–231Propagation equation, 54Proprietary wireless technologies, 237

INDEX 279
Protection switching, 133Pseudorandom bit sequence (PRBS), 201Psynch. See Frame synchronization (Psynch)Public key infrastructure (PKI) cryptography
technique, 155Public-switched telephone networks (PSTN),
3, 4Pulse broadening, 52, 59Pulse distortion, 49, 51Pumping schemes, 81–82Pump power, 86
QAM/OFDM data signals, 27. See alsoOrthogonal frequency-division multiplexing(OFDM); Quadrature amplitude modulation(QAM)
QoS traffic scheduling, SUCCESS-DWA,210–211. See also Quality of service entries
QPSK (quadrature phase-shift keying)modulation, 9, 10
Quadrature amplitude modulation (QAM), 8Quadrature amplitude modulation (QAM), 10Quadrature amplitude modulation (QAM).
See also QAM/OFDM data signalsQuality of service (QoS), 3. See also QoS traffic
schedulingQuality-of-service controls, 121Quality of service support, 223–224Quantum-confined Stark effect, 70, 71Quantum efficiency, 73Quantum wells, 71
Radio access technologies, 21Radio-frequency PON (RF PON), 16. See also
Passive optical networks (PONs); RF entriesRadio over fiber (ROF) technology, 242Radio signal propagation, characterizing and
modeling components of, 230–231Raman amplifiers, 78, 85–86Raman–Brillouin scattering, 46Raman gain coefficient, 85Ranging, 114Ranging process, 115, 129–130
EPON, 148Rare-earth-doped fiber amplifiers, 81–83Rate equations, 60–61Rayleigh backscattering, 180, 181Rayleigh scattering, 46–47, 86Reactive routing protocols, 228Real-time voice/video, 30Receiver optical subassembly (ROSA), 101Receivers, tunable, 175, 176Receiver sensitivity, 93–98Reconciliation sublayer (RS), 145–146
Reconfigurable optical backhaul, experimentaltestbed of, 251–255
Reconfigurable optical backhaul architecture,247–257
Reconfigurable optical back-performancesimulation, 249–251
Reconfiguration control interfaces (RCIs),251–254
state diagrams of, 253–255Reconfiguration testbed, experimental results of,
257Reed–Solomon (RS) coding, 136Reflective electroabsorption modulators
(REAMs), 174Reflective semiconductor optical amplifiers
(RSOAs), 174centralized light sources with, 179–181self-seeding, 106
Refractive index (indices), 67temperature and, 64
Refractive index fluctuation, in fiber materials, 46Refractive index inhomogeneities, 47REGISTER ACK message, 148, 150, 151, 160.
See also Acknowledgment (ACK) signalREGISTER message, 147, 150–151REGISTER REQ message, 147, 149–150, 160Remote nodes (RNs), 196–197, 199
modification of, 188Replay attack, 155–156REPORT message, 147, 152Resource scheduling, SUCCESS-HPON, 204–210Responsivity
APD, 75photodiode, 73–74
RF bands, in mobile WiMAX, 219. See alsoRadio-frequency PON (RF PON)
RF interference, 22RF signals, 20, 21RF technologies, 32RF video broadcasting signals, over optical fibers,
16Rms (root mean square) fiber dispersion, 99, 100Round-trip time (RTT), 114, 148, 202, 205Route cost report, 260Routing, in wireless multihop networks, 228–230.
See also Gateway router entries; Integratedrouting entries; Local WMN routecalculation; Mesh routers (MRs); Optimizedlink state routing (OLSR); Proactive routingprotocols; Reactive routing protocols;Throughput per router; Wireless gatewayrouter reassociation; Wireless mesh routers
Routing algorithm, integrated, 243Routing paths, 258

280 INDEX
Satellite communication, 32Satellite Earth station, 26Satellite systems, 25–26Scalability, of wireless mesh networks, 231–237Schedule-time framing, 208Scheduling algorithms, 205–208
WDM-PON, 204–211Scheduling algorithm throughput, 209Second-order dispersion parameter, 51Security weaknesses, EPON, 155–156Self-phase modulation, 54Self-seeding RSOAs, 106. See also Reflective
semiconductor optical amplifiers (RSOAs)Semiconductor electroabsorption modulators, 66Semiconductor lasers, 55–66. See also Continuous
wave semiconductor lasers; Couple-cavitysemiconductor lasers
amplitude modulation in, 64characteristics of, 60–66direct modulation of, 66–71frequency chirp of, 64–65operation of, 55–60pulse response of, 64response to injection current, 63
Semiconductor materials, population inversion in,56–57
Semiconductor optical amplifiers (SOAs), 78,83–85, 84–85, 106, 180, 200
Sequential scheduling algorithm, 206Sequential scheduling with schedule-time framing
algorithm, 206Service convergence, 3–4Service-level agreements (SLAs), 117, 123, 154Service network interface (SNI), 110, 116Service port, 124SHDSL, 8. See also Digital subscriber line/loop
(DSL)Short-period gratings, 92Shot noise, 94, 95, 96Side-mode suppression ratio (SMSR), 59Signal-spontaneous beat noise, 96Signal-to-noise ratio (SNR), 80, 93
for APD receivers, 95for PIN receivers, 94–95
Silica fibers, refractive index of, 53Single-longitudinal-mode lasers, 59–60Single-mode condition, 43–44Single-mode fibers (SMFs), 35, 37–38, 173, 181
dispersion parameter of, 50–51fiber loss of, 45intramodal dispersion in, 49
Single-sided reach extension, 143Small-scale fading, 230
Small-signal frequency response, 63SONET/SDH links, 119Spectral line coding technique, 169, 170Spectral-shaping line codes, 170Spectral (spectrum) sliced broadband light
sources, 104, 174, 176–178Splitter loss, 98–99Spontaneous emission, 56Spontaneous emission factor, 80Spontaneous emission-induced noise, spectral
density of, 80Spontaneous-shot beat noise, 96Spontaneous-spontaneous noise, 96Spot size, 44, 52Stable amplitude of oscillation, 58Stanford University aCCESS (SUCCESS) project,
186. See also SUCCESS entriesStark effect, 70, 71Start of data (SOD) delimiter, 159Star topology, 23Steady-state conditions, 61–62Steady-state oscillation, 57Step-index fibers, 36Stimulated Brillouin gain spectrum, 53Stimulated Brillouin scattering, 53Stimulated emission, 55, 56–57Stimulated Raman gain spectrum, 53Stimulated Raman scattering, 53, 85Subcarrier multiplexing (SCM) technique, 119,
170Subchannelization, 224Subchannels, reuse pattern of, 222Submarine links, 3SUCCESS-DWA, 186SUCCESS-DWA downstream architecture, 191SUCCESS-DWA experimental testbed, 194–195SUCCESS-DWA PON, 190–195SUCCESS-DWA QoS traffic scheduling, 210–211SUCCESS-DWA upstream architecture, 194SUCCESS-DWA upstream schemes, 193SUCCESS-HPON, 186, 195–202. See also
Passive optical networks (PONs)SUCCESS-HPON architecture, 181SUCCESS-HPON colorless ONU, 199. See also
Optical network units (ONUs)SUCCESS-HPON experimental testbed, 199–202SUCCESS-HPON frame formats, 203–204SUCCESS-HPON framing, 207SUCCESS-HPON MAC protocol, 203–204SUCCESS-HPON OLT, 197–198, 203. See also
Optical line terminal (OLT)SUCCESS-HPON protocol, 205SUCCESS-HPON resource scheduling, 204–210

INDEX 281
SUCCESS-HPON ring topology, 198SUCCESS-HPON scalability, 209–210SUCCESS-HPON subnetworks, 197SUCCESS-LCO service overlay, 169–172Sustainable cell rate (SCR), 123Symmetrical connections, 8Synchronization bytes (SYNCH), 126System margin, 98
TCM technique, 205T-CONT layer structure, 141. See also Traffic
container (T-CONT) buffersTDM-PON architecture, 109–110. See also
Passive optical networks (PONs);Time-division multiplexed passive opticalnetworks (TDM-PONs)
TDM-PON deployments, 167, 186TDM-PON enhancements, 167–168TDM-PON evolution, 167–172TDM-PON line bit-rate enhancements, 169TDM-PON ONUs, 189. See also Optical network
units (ONUs)TDM-PON technology, hierarchical wireless
access networks and, 242–244TDM-PON upgrading, 170TDM-PON WDM enhancements, 187TDM/WDM (Time-division
multiplexing/wavelength-divisionmultiplexing), 31
Telecommunication fibers, 44Telecommunication industry, transmission
capacity of, 4TE mode, 4310-Gb/s PONs, 30–31. See also Passive optical
networks (PONs)10GEPON coexistence architecture, 16110GEPON coexistence options, 161–16210GEPON framing, with FEC consideration, 15910GEPON MAC modifications, 158–16110GEPON PMD architecture, 156–15810GEPON system, coexistence with 1GEPON
system, 15810 to 66-GHz licensed bands, 219TE polarization, 67, 68Thermal noise, 93–94, 95Thermoelectric cooler (TEC), 180Thin-film filters, 90–91Thin-film resonant multicavity filter, 903-dB bandwidth, 63–64
of an avalanche photodiode, 763-dB coupler, 91Three-phase power, 18–19Threshold current, 62
Throughput per router, 234–235Time-division-duplex (TDD), 222Time-division multiplexed passive optical
networks (TDM-PONs), 12, 30, 32, 166, 192.See also Passive optical networks (PONs);TDM-PON entries
evolution to WDM-PON, 184–186fiber loss in, 45optical transceiver design for, 101–106
Time-division multiple access (TDMA), upstream,129
Time-varying optical phase, 53–54Time-varying refractive index, 53TL-buffering scheme, OLT, 210–211TM mode, 43TM polarization, 67, 68Topologies. See also Network architectures
LAN, 3mesh, 23point-to-multipoint, 244star, 23SUCCESS-HPON ring, 198tree, 186–195WiMAX network, 23
Topology evolutionhybrid tree, 186–195tree to ring, 195
Total current, 74–75Total internal reflection, 36Total modal dispersion, 48–49Traffic container (T-CONT) buffers, 130–133.
See also T-CONT layer structureTraffic estimators (TEs), 248Traffic-monitoring (TM), 140Traffic scheduling, SUCCESS-DWA, 210–211Transceiver performance monitoring, 143Transceivers, 111. See also Optical transceiversTransfer functions, 90
filter, 90–91Transimpedance amplifier, 77Transmission convergence (TC) layer, 109
GPON, 137–142Transmission frames, BPON, 127–129Transmission multiplexer (MUX), 124, 125.
See also MUX/DEMUXTransmission timing diagrams, 202Transmitter optical subassembly (TOSA), 101Traveling-wave semiconductor optical amplifiers
(SOAs), 83, 84. See also Semiconductoroptical amplifiers (SOAs)
Tree topology evolution, hybrid, 186–195Tree to ring topology evolution, 195Triple play, 29

282 INDEX
Tunable components, intelligent scheduling of,204–205
Tunable lasers (TLs), 174–175, 176, 190–191,194, 197, 203
Tunable laser technologies, 248Tunable receivers, 175, 176, 254–256Tunable semiconductor lasers, 60Tunable transceivers, 247, 248Tunable VCSELs, 60TV broadcasting, 31Twisted pairs, 6, 8
dedicated, 9Two-way broadband communication links over
satellites, 26
Ultrahigh-speed access networks, xiUniversal mobile telecommunication system
(UMTS), 24Upstream bandwidth allocation map (US BW
map), 138, 139Upstream burst framing, 159Upstream burst overhead/timing, 134–135Upstream data transmission, 181Upstream denial of service attack, 155Upstream divided slot, 132–133Upstream dynamic bandwidth report, 140Upstream physical control block, 138Upstream physical layer overhead (PLOu ),
134–135, 138–139Upstream PLOAM, 127. See also Physical-layer
operation, administration, and maintenance(PLOAM) cell format
Upstream PLOAM field, 139Upstream queue-length reporting, 132Upstream time-division multiple access (TDMA),
129Upstream transmission, in SUCCESS-DWA PON,
192–194Upstream transmission frame, 128User end, performance at, 4–5User network interface (UNI), 110, 122User port, 125
Valence band, 55–56V-band, 26VDSL1, 7VDSL2, 7–8VDSL standards, 7–8. See also Very high-speed
DSL (VDSL)Vertical-cavity surface-emitting lasers (VCSELs),
59, 175, 173, 248tunable, 60
Very high-speed DSL (VDSL), 6. See also Digitalsubscriber line/loop (DSL); VDSL entries
Very small aperture terminals (VSATs), 25Video broadcasting, 3–4, 25Video delivery architectures, in BPON
architecture, 119–121Video on demand (VOD) protocol, 120Video over IP, 31Video service provider (VSP), 120Video services, 29Virtual circuit identifier (VCI), 122Virtual path identifier (VPI), 122Virtue-output-queuing (VOQ), 206, 207, 211VLAN control, 146Voice communications, 24Voice conversation service, 3Voice over DSL (VoDSL), 8. See also Digital
subscriber line/loop (DSL)Voice over Internet Protocol (VoIP), 4, 218
Waveband combiner/splitters (WCS), 188Wavefunctions, 71Waveguide dispersion, 48, 49Waveguide dispersion parameter, 50Waveguide imperfections, 47Waveguide photodiode, 74Wavelength add/drop filters, 242Wavelength allocation, in BPON architecture,
118–119Wavelength blocking filters, 187–188Wavelength-division multiplexed passive optical
networks (WDM-PONs), 13–15, 31, 32, 104,166–167, 192. See also Passive opticalnetworks (PONs); Wavelength-division-multiplexed (WDM) systems; WDM-PONentries
scheduling algorithms, 204–211TDM-PON evolution to, 184–186technology requirements for, 185
Wavelength-division-multiplexed (WDM)systems, xi. See also Wavelength-divisionmultiplexed passive optical networks(WDM-PONs); WDM entries
Wavelength-division multiplexer/demultiplexer,89
Wavelength-division multiplexing (WDM)technology, 3
Wavelength plan, 10GEPON standard, 158Wavelength tuning, 60Wave number, 41Wave propagation equations, 39WDM enhancements, 168, 187. See also
Wavelength-division-multiplexed (WDM)systems
WDM filter, 101WDM FTTx network, 14

INDEX 283
WDM light sources, 104WDM MUX/DEMUX, 176–177. See also
MUX/DEMUXWDM optical communication systems, 54, 81WDM-PON approach comparison summary, 105.
See also Wavelength-division multiplexedpassive optical networks (WDM-PONs)
WDM-PON components, 172–184WDM-PON network architectures, 172–184,
202WDM-PON ONUs, 189, 199WDM-PON protocols, 202–204WDM-PON RN, 199. See also Remote nodes
(RNs)WDM-PON scheduling algorithms, 204–211WDM technologies, 31Wide area networks (WANs), 3
research in, xiiiWideband code-division multiple access
(WCDM), 24Wi-Fi mesh networks, 21–22. See also Wireless
fidelity (Wi-Fi); Wireless mesh networks(WMNs)
WiMAX access networks, 22–24. See alsoWorldwide interoperability for microwaveaccess (WiMAX)
WiMAX base stations, 23WiMAX MAC layer, 23WiMAX modulation schemes, 220–221WiMAX networks, 23–24
mobile multihop relay, 224–225topology of, 23
WiMAX standard, 223WiMAX subcarriers, 219–220Wireless access networks, 31Wireless access points, 21Wireless access solutions, 216, 217Wireless access technologies, 20–28, 217–241
cellular networks, 24–25LMDS and MMDS systems, 26–28
satellite systems, 25–26Wi-Fi mesh networks, 21–22WiMAX access networks, 22–24
Wireless backhaul, upgrading path of, 245–246Wireless cable, 27Wireless cellular networks, 20Wireless fidelity (Wi-Fi), 6, 31, 32. See also Wi-Fi
mesh networksWireless gateway router reassociation, 260Wireless links, 244Wireless link state update, 258–259Wireless mesh networks (WMNs), 225–241,
258–259. See also Wi-Fi mesh networksbackhaul network example for, 237capacity and scalability issues of, 231–237point-to-multipoint optical backhaul and, 243propagation environments and models of,
230–231using TDM-PON to backhaul, 242versus wireless ad hoc networks, 230
Wireless mesh routers, 226, 227Wireless multihop networks, routing in, 228–230Wireless networks, 1Wireless technologies, 32
advantages of, 6Worldwide interoperability for microwave access
(WiMAX), 6, 31, 32, 217. See also WiMAXentries
duplex scheme and frequency reuse in, 222MAC protocol of, 223orthogonal frequency-division multiplexing in,
219–222“World Wide Wait,” 5
X-cut lithium niobate crystal, 67, 68xDSL, 7. See also Digital subscriber line/loop
(DSL)
ZBLAN fiber, 83Z-cut lithium niobate crystal, 68