
Local government broadband initiatives
41
Page 1 of 41 Local Government Broadband Initiatives Sharon E. Gillett William H. Lehr Carlos Osorio Massachusetts Institute of Technology Program on Internet and Telecoms Convergence (ITC) 1 September 18, 2003 Abstract The future for Internet access is broadband. Federal and state policymakers are exploring initiatives to promote the deployment and adoption of broadband services, and in recent years, an increasing number of local governments have joined them. While the first generation of narrowband dial-up access was able to piggyback on the near universal availability of the mature telephone network, broadband relies on communications infrastructure that is both more heterogeneous and less evenly distributed. These local infrastructure differences suggest a greater role for local communities in affecting how next generation access will evolve. A few case studies of local government broadband initiatives exist, but there is little systematic data or research categorizing the range of activity or assessing the effectiveness of these efforts. This paper represents a first step in an ongoing research effort to better understand the factors that influence a community’s decision to act, its choice of what to do, and the effectiveness of its actions. In recognition of the diversity of initiatives observed, the paper presents a taxonomy to classify the range of policies that local governments are adopting, according to four roles of government vis a vis broadband: as user, rule- maker, financier, and infrastructure provider. After discussing examples of each type of initiative within the taxonomy, the paper analyzes a sample of communities with municipal electric utilities (M.E.U.s). 2 . From a match of the sample of M.E.U. 1 {sharon, wlehr, [email protected] }. Corresponding author: Sharon Gillett. We gratefully acknowledge the financial support of the industrial partners of the MIT ITC, listed at http://itc.mit.edu , and the Digital Government Program of the U.S. National Science Foundation, Award #EIA-0306723. 2 The database on M.E.U.s and their communications service offerings was provided by the American Public Power Association (APPA), a trade association of public power companies (for additional information on the APPA, see http://www.appanet.org ). In particular we acknowledge the assistance o f Ron Lunt, Director of Broadband Services for the APPA, who provided invaluable help in acquiring and interpreting the data.
Transcript of Local government broadband initiatives

Page 1 of 41
Local Government Broadband Initiatives Sharon E. Gillett William H. Lehr Carlos Osorio
Massachusetts Institute of Technology
Program on Internet and Telecoms Convergence (ITC) 1 September 18, 2003
Abstract
The future for Internet access is broadband. Federal and state policymakers are exploring initiatives to promote the deployment and adoption of broadband services, and in recent years, an increasing number of local governments have joined them. While the first generation of narrowband dial-up access was able to piggyback on the near universal availability of the mature telephone network, broadband relies on communications infrastructure that is both more heterogeneous and less evenly distributed. These local infrastructure differences suggest a greater role for local communities in affecting how next generation access will evolve.
A few case studies of local government broadband initiatives exist, but there is little systematic data or research categorizing the range of activity or assessing the effectiveness of these efforts. This paper represents a first step in an ongoing research effort to better understand the factors that influence a community’s decision to act, its choice of what to do, and the effectiveness of its actions. In recognition of the diversity of initiatives observed, the paper presents a taxonomy to classify the range of policies that local governments are adopting, according to four roles of government vis a vis broadband: as user, rule-maker, financier, and infrastructure provider.
After discussing examples of each type of initiative within the taxonomy, the paper analyzes a sample of communities with municipal electric utilities (M.E.U.s).2. From a match of the sample of M.E.U.
1 {sharon, wlehr, [email protected]}. Corresponding author: Sharon Gillett. We gratefully acknowledge the financial support of the industrial partners of the MIT ITC, listed at http://itc.mit.edu, and the Digital Government Program of the U.S. National Science Foundation, Award #EIA-0306723. 2 The database on M.E.U.s and their communications service offerings was provided by the American Public Power Association (APPA), a trade association of public power companies (for additional information on the APPA, see http://www.appanet.org). In particular we acknowledge the assistance of Ron Lunt, Director of Broadband Services for the APPA, who provided invaluable help in acquiring and interpreting the data.
Page 2 of 41
communities to demographic data from the 2000 Census, we find that on average, these M.E.U.s are more often found in mid-sized communities that are more likely to be in rural counties. Those that offer communications are in the vanguard: although they represent only about a quarter of all M.E.U.s, their number has grown more than 10% annually for the past two years.
Within the subset of our sample of M.E.U.s that offer communication services, our analysis finds two distinct segments. While the average U.S. community has a population of around 8,000 people and the average M.E.U community around 42,000, the average population is around 6,000 in M.E.U communities that offer only consumer services, and around 158,000 in those that offer only wholesale commercial services. This size-based split suggests two separate rationales for public-sector interventions in different local contexts. Smaller communities may be less well-served by the private sector, as commercial carriers perceive them to be too costly to serve economically given the current state of broadband technology and demand. Larger communities, on the other hand, may experience an abundance of competitive entry that suggests a coordinating or facilitating role for the local government (for example, to encourage competition but minimize street cuts by bringing fiber installation under city management, while leaving the actual use of the fiber to the commercial sector).
The paper also provides a preliminary econometric exploration of the factors that lead M.E.U.s to provide communications infrastructure and services, based on demographic and cost-related data available from the Census. It concludes with a discussion of issues to consider for further research. These include the addition of regressors such as the extent of competitive alternatives and the local political environment; a deeper understanding of M.E.U.’s choices with regard to wholesale-only vs. retail business models, especially in providing consumer services; and extension of the data set beyond municipal electric utilities.
I. Introduction
The future of the Internet is broadband. Information technology played a critical role in the resurgence in economic growth in the United States in the last half of the 1990s,3 and a range of industry groups and analysts have stressed the importance of broadband access for continuing the evolution of advanced communication services and overall economic
3 See Jorgenson, Dale, "Information Technology and the U.S. Economy," American Economic Review, vol 91, no 1 (March 2001) 1-32.

Page 3 of 41
growth.4 Innovative productive practices in business, government, education, health care and daily life are now critically dependent on the ability to communicate information quickly and inexpensively. With more than two-thirds of adults now on-line in the United States, the Internet has become a critical component of our communications infrastructure.5
During the first generation of Internet growth, the typical user connected via a low-speed dial-up connection supported over a plain old telephone line. These connections need to be set-up each time a user wishes to connect to the Internet and their low speed severely limits the quality of the user experience and the services that can be supported. Higher-speed, always-on "broadband" is needed to uncork this "last mile" bottleneck, enhance the usability of the Internet, and provide a platform for the development of advanced interactive multimedia services.
The deployment of consumer broadband began in the mid-1990s with the offering of modem services by cable television companies.6 Since then, the availability of broadband access (through cable modems, DSL and other technologies) has increased substantially, and over a quarter of all Internet-connected homes have chosen to adopt it. 7 However, broadband penetration is not distributed uniformly either geographically or demographically.8 Furthermore, the quality of broadband and range of consumer choice available also varies substantially and is quite limited in many communities. Given the increasing importance of information technology in our ever more knowledge-based and
4 See Crandall, R. and C. Jackson, "The $500 Billion Opportunity: The Potential Economic Benefit of Widespread Diffusion of Broadband Internet Access," mimeo, Criterion Economics, Washington, DC, July 2001; or, see the website for the Information Technology Industry Council, an industry group of high-tech firms, including Intel and others, that are actively involved in lobbying for pro-broadband policy initiatives (see http://www.itic.org/sections/Broadband.html). 5 According to Harris Interactive Polling data, 67% of adults in the U.S. use the Internet from somewhere, with 57% using it from home. Of those with Internet access, 27% have broadband connections (see "Internet penetration rate slows," Silicon Valley/San Jose Business Journal, February 5, 2003 (available at: http://sanjose.bizjournals.com/sanjose/stories/2003/02/03/daily41.html). 6 See Gillett, Sharon and William Lehr, "Availability of Broadband Internet Access: Empirical Evidence," paper presented to the Twenty-Seventh Annual Telecommunications Policy Research Conference, September 25-27, 1999, Alexandria, VA. 7 See note 5 supra. 8 See the FCC Broadband Deployment reports at http://www.fcc.gov/wcb/iatd/comp.html. In particular, data as of December 31, 2002 show that while on average 88% of U.S. zip codes have high-speed subscribers nationwide, only 60% of the least densely populated zip codes have any, vs. 99% of the most densely populated. These data generally overstate broadband availability, for a variety of reasons explained by the FCC in their most recent report; see also www.netmapusa.org for finer-grained and potentially more accurate maps of broadband availability within particular states. Furthermore, the FCC’s data do not measure quality (other than a speed threshold) or price, meaning that even in communities where broadband is available, it is not necessarily cost-effective or technically satisfactory. Complementary to the FCC’s focus on residential broadband, (Gabel and Huang, 2003) examine the geographic distribution of business-oriented data communications services and find similar disparities: for example, only 28% of U.S. wire centers offered packet switching services (such as ATM and Frame Relay) as of 2001.

Page 4 of 41
communications-intensive economy, communities that are unserved or underserved with broadband are increasingly at a competitive disadvantage.
What constitutes "broadband access" is not a precise term, however, for the purposes of our analysis here, we use the term to refer generically to Internet access services that are technically satisfactory and cost-effective from the perspective of end-users. That is, given the state of applications and infrastructure elsewhere in the Internet, access is "broadband" if it represents a noticeable improvement over standard dial-up access and, once in place, is no longer perceived as the limiting constraint on what can be done over the Internet.9 In most locales, the current version of broadband access is provided via cable or DSL modems and supports about a factor-of-10 improvement over traditional dial-up modems offering 50Kbps.10 There are also a number of wireless (e.g., 802.16 WiMax and 802.11 WiFi) and wireline (e.g., FTTC and FTTH) technologies in consideration for residential deployment that also can support much higher bandwidth. Deploying these next generation services ubiquitously will require substantial new investment – on the order of hundreds of billions of dollars nationally – and the economic viability of such services is still unproven.
Because we believe that communities will want these capabilities in time (which implies that substantial new local infrastructure investment will be needed) and because we believe that the optimal technologies/deployment strategies will vary by locale,11 we expect local policymakers to play a critical role in influencing how local access infrastructure evolves. Local governments have little control over some important factors (such as state and federal policy, and the technical state of the art) that influence the geographic distribution of broadband. However, local authorities have varying degrees of influence over other key factors, including local government policies that bear on communications infrastructure deployment, the business and residential demographics that shape demand, and the nature and quality of existing infrastructure (i.e. history).
The role of local factors in determining local broadband availability has motivated a number of communities to take actions aimed at improving their circumstances.12 In particular, local governments have gotten involved through their role as stewards of local economic development, their need to improve the efficiency and quality of government service delivery through e-government (including online service delivery to local residents and businesses, as well as intra- and inter-governmental communications), their
9 This is consistent with the first definition of broadband provided by the Computer Science and Telecommunications Board of the National Research Council: “Local access link performance should not be the limiting factor in a user’s capability for running today’s applications.” (CSTB, 2002, p. 78). 10 That is, current consumer broadband services in the U.S. usually provide around 1Mbps downstream and a few 100Kbps upstream. 11 For example, wireless technologies that work in the arid Southwest may be unsuitable in tree covered New England. Or, the choice of next generation infrastructure for a green-field new development is likely to be different than for a community that is upgrading legacy infrastructure. 12 See Computer Science and Telecommunications Board (CSTB), 2002. Broadband: Bringing Home the Bits. National Academy Press, pp. 206-215.

Page 5 of 41
responsibility for K-12 schooling and other quality of life issues, and in some cases their responsibility for other local infrastructures such as water and electricity. In addressing these issues, local governments have adopted a diverse array of policies to stimulate broadband, ranging from municipal supply of infrastructure to provision of incentives to commercial providers.
Historically, our local communications infrastructure has been based on the telephone networks owned and operated by companies that generally offer services over areas that are larger than a single community. These telephone companies are regulated as common carriers by state Public Utility Commissions (PUCs) and the Federal Communications Commission (FCC). Although cable television services are municipally franchised, their role in providing 2-way communication services is relatively new (i.e., cable modem services only began to be offered after 1996 and cable telephony services even more recently). The role of local communities in providing advanced communication services is relatively new, but the number of communities that have considered initiatives has been increasing rapidly, with new announcements occurring daily.
Due to the relative novelty of the phenomenon, comprehensive nationwide data about local broadband policies has not yet been collected or evaluated.13 This lack of data leaves policymakers with little guidance regarding the role that particular local government policies play in furthering or frustrating federal and state broadband policy goals of competition and universal deployment. The consequences are also unfortunate for local policymakers; lacking common knowledge about what has worked elsewhere, they are forced to waste resources reinventing each other's wheels.
A necessary first step toward collecting data about local government broadband policies is identifying the range of policies under consideration. Section II of this paper therefore lays out a taxonomy of local government broadband policies that classifies actions into four types of initiatives, according to the role of government as (1) broadband user; (2) rule-maker; (3) financier; and (4) infrastructure developer.
The last type of action involves the most extensive form of local government initiative. In the most extreme case, the local government manages the design, funding, construction, and operation of local access services. As the first component of our research into local broadband initiatives, we have collected data on a number of communities which have municipal power utilities, as identified by the American Public Power Association (APPA). These communities have already established an active role in providing basic infrastructure services.
13 Clark and Baker (2003) note that the lack of data hindered their ability to develop a decision-support tool/process model for communities to use in developing broadband strategies vis-à-vis broadband (see, Clark, Kelly E. and Paul M.A. Baker, 2003. “Municipal Advanced Telecommunication Infrastructure Project (MuniTIP).” Georgia Center for Advanced Telecommunications Technology, Office of Technology Policy & Programs, OTP Policy Study No. 50103. http://www.gcatt.org/otp/papers/MuniTIP.pdf).

Page 6 of 41
In Section III we discuss our preliminary analysis of the characteristics that distinguish these communities from other communities around the United States. From a match of the sample of M.E.U. communities to demographic data from the 2000 Census, we find that on average, these M.E.U.s are more often found in mid-sized communities that are more likely to be in rural counties. Those that offer communications are in the vanguard: although they represent only about a quarter of all M.E.U.s, their number has grown more than 10% annually for the past two years.
Within the subset of our sample of M.E.U.s that offer communication services, our analysis finds two distinct segments. While the average U.S. community has a population of around 8,000 people and the average M.E.U community around 42,000, the average population is around 6,000 in M.E.U communities that offer only consumer services, and around 158,000 in those that offer only wholesale commercial services. This size-based split suggests two separate rationales for public-sector interventions in different local contexts. Smaller communities may be less well-served by the private sector, as commercial carriers perceive them to be too costly to serve economically given the current state of broadband technology and demand. Larger communities, on the other hand, may experience an abundance of competitive entry that suggests a coordinating or facilitating role for the local government (for example, to encourage competition but minimize street cuts by bringing fiber installation under city management, while leaving the actual use of the fiber to the commercial sector).
Section III also provides a preliminary econometric exploration of the factors that lead M.E.U.s to provide communications infrastructure and services, based on demographic and cost-related data available from the Census. Section IV concludes with a discussion of issues to consider for further research. These include the addition of regressors such as the extent of competitive alternatives and the local political environment; a deeper understanding of M.E.U.’s choices with regard to wholesale-only vs. retail business models, especially in providing consumer services; and extension of the data set beyond municipal electric utilities.
II. Taxonomy of Local and Regional Initiatives
Our aim in constructing a taxonomy of local and regional broadband initiatives is to provide a framework for structuring discussion in communities considering whether to undertake a broadband initiative, and if so, what type of initiative to pursue. Additionally, this taxonomy provides a foundation for future research directed at tracking the progress and effectiveness of local broadband stimulation efforts.
Our taxonomy is constructed based on data we collected from as many initiatives as we could identify from searches of government reports, academic and trade literature, and contacts with industry, government, and academic researchers engaged in studying or

Page 7 of 41
implementing these initiatives.14 It builds on the classification of supply- vs. demand-side initiatives in (Laudeman, 1999)15, the discussion of municipal networking and public-private partnerships in (Strover and Berquist, 2001), and the classifications of local government actions in relation to the private sector in (Johnson, 1999)16 and (NATOA, 2003)17. We distinguish four categories of local government action, based on the nature of the government’s role:
1. Government as broadband user. Government indirectly attracts commercial broadband deployment through demand-side policies. In particular, government uses its local leadership role and/or its role as a major telecommunications customer to assess, stimulate or aggregate demand.
2. Government as neutral rule-maker. Government adopts or reforms local ordinances that affect the ease of commercial deployment, such as rights-of-way, utility pole attachments, road and building construction codes, zoning policies affecting wireless antenna placement, and cable franchise agreements.
3. Government as financier. Government provides subsidies for broadband users or providers, which may be direct or indirect in the form of planning or equipment grants, tax credits, or other incentives.
4. Government as infrastructure developer. Government adopts supply-side policies in which a division of local government is ultimately responsible for the provision of one or more components of network infrastructure.
In the following sub-sections, for each category, we explain and provide examples of specific actions that governments can take, and briefly discuss the interaction of local strategies with state and federal policies. Before proceeding, it is worth noting that local government’s role as an infrastructure developer has proven controversial in terms of its impact on federal and state broadband competition and deployment policy goals. On the
14 Associations we have worked with to date include the National Association of Telecommunications Officers and Advisors (NATOA’s membership consists primarily of local government officials responsible for communications and IT), the American Public Power Association (APPA, a trade association for municipal electric utilities), and the International City/County Management Assocation (ICMA), which collects data about counties as well as cities with population over 2,500. Numerous other national associations of local and regional governments exist, and as this research progresses we continue to establish such partnerships.
15 See Laudeman, Greg, 1999. “Georgia's Small Town Telecomms: Approaches to Developing Community Information Infrastructure.” Journal of Municipal Telecommunications , Vol. 1 No. 2. http://munitelecom.org/v1i2/Laudeman.html. 16 Johnson, Andrea, 1999. “A City Guide: Developing, Using, and Regulating Regional Telecommunications Networks under the Telecommunications Act of 1996.” In Deborah Hurley and James H. Keller, eds., The First 100 Feet: Options for Internet and Broadband Access. MIT Press. 17 See National Association of Telecommunications Officers and Advisors (NATOA), 2003. “Making Sure No Citizen is Left Behind: A Report on How Local Government is Promoting the Availability of Advanced Telecommunications Services to All Consumers.” Draft Report.

Page 8 of 41
one hand, municipally-provided infrastructure may further universal service and competition goals by providing additional alternatives to commercial deployments, especially in areas where these are limited by unfavorable economics. On the other hand, government-sponsored deployments may diminish broadband competition by “crowding out” private-sector deployments in the short or long term.
A. Government as Stimulator of Demand (Buyer, Facilitator of Aggregation, or Lead User)
Inadequate broadband availability may be a rational response by commercial providers who do not perceive adequate demand to justify private sector investment, or even when services are available, community leaders may be unhappy with the level of choice, quality, or pricing of such services. If demand is limited, government can help stimulate its growth; if demand is too fragmented, government can facilitate demand aggregation; or if service pricing or quality is less than what is desired, government may be able to use its monopsony power as bargaining leverage to negotiate more favorable tariffs. In some cases, private sector service providers may simply be unaware of the state of demand, and local government can help educate potential providers.18 Demand aggregation can create monopsony power, and can also lower the costs for carriers to offer service. For example, local government is often one of the largest sources of commercial demand for advanced communication services and a term contract for servicing this demand can be used to entice a carrier to extend infrastructure to a community.
18 Youtie (1999, p. 1) describes a 1994 situation in West Georgia where “business and educational institutions could not interest another provider or their local government in spearheading advanced infrastructure deployment, because telecommunications vendors had different account managers for each type of organization – large industry, institutional, educational, government, etc. –which ignored the combined demand for infrastructure in the community” (see Youtie, Jan, 1999. “West Georgia Telecommunications Alliance: Carrollton, Georgia.” http://www.ceds.gatech.edu/bestpractices/cases/wgta.htm.)

Page 9 of 41
Table 1: Demand-side Interventions Type of Government Intervention
Examples
Measure Demand • Demand Assessment (Surveys or online registration) Stimulate Demand • “Extension” programs (Training businesses in effective
ICT use) • Community technology centers (Training citizens,
primarily disadvantaged, in ICT use, e.g. Atlanta); • Sectoral pilots (E-government, distance education,
telemedicine etc.) • Community information services (Web pages for local
businesses and community groups, e.g. Blacksburg [Virginia] Electronic Village)
Aggregate Demand • Buying Cooperative (Group pricing) • Anchor Tenant (Government’s telecom contract in
exchange for broader infrastructure availability, e.g. Chicago CivicNet)
Table 1 summarizes key elements of demand stimulation and aggregation approaches. Assessment of existing demand is an especially important initial step, both for determining whether the problem with inadequate broadband service availability is too little or overly fragmented demand. As a trusted third party, local government may have an advantage in serving as an information clearing house for both consumers and providers interested in learning about available options and opportunities. Governments can carry out such assessments directly, or participate in public-private partnerships, or leave them entirely to the private sector. For example, the state of Massachusetts provided seed funding for a survey of demand that was conducted by Berkshire Connect, a public-private partnership begun in 1997 to improve communications infrastructure availability in rural Berkshire County. 19 Administering this survey also gave community leaders the opportunity to educate local businesses about the benefits of broadband. In West Georgia, a similar survey was carried out entirely by a local private-sector-led community group, without the participation of local government (Youtie, 1999). Alternatively, in the U.K., individual users can now register their demand for broadband on web sites run by British Telecom (BT)’s wholesale division, by commercial Internet Service Providers, or by U.K. government-sponsored regional economic development agencies acting as neutral brokers. As of April 2003, BT estimated that “more than 300,000 individuals have registered their interest, and so far 44 exchanges have been upgraded [to support Digital Subscriber Line broadband] as a result.” Like Berkshire Connect, such programs have elements of demand stimulation as well; for example, BT
19 Public-sector partners included the University of Massachusetts, the Berkshire Regional Planning Commission, the Massachusetts Technology Collaborative, and local community leaders. For further details, see Gillett, Sharon, 2001. “Berkshire Connect: A Case Study of Demand Aggregation.” http://itc.mit.edu/itel/docs/2001/Berkshire_Connect.pdf.

Page 10 of 41
now supports local “campaigns” to bring registration levels over the necessary threshold in particular (generally rural) communities.20
As BT’s registration efforts illustrate, measurement initiatives can cut both ways, revealing latent demand in some communities and confirming perceived weaknesses in others. Where demand is weak, government initiatives that stimulate it – whether as their primary intention or as an indirect side-effect - can be especially effective. For example, the state of Ohio’s Broadband Initiative, announced in September 2002, includes eVantage Ohio, a program “to train small businesses in the use of e-commerce … in cooperation with Ohio's Small Business Development Center network.”21 eVantage is typical of numerous local and regionally-based information and communications technology (ICT) outreach and training programs for businesses, representing the next wave of government “extension” programs beyond agriculture and manufacturing. Governments have also undertaken programs to train individual users, typically through Community Technology Centers aimed at closing the “digital divide” among disadvantaged populations. For example, (Kvasny and Keil, 2002) describe Atlanta, Georgia’s free training programs.22
Other government efforts to stimulate demand are more indirect, and rely on government acting as a lead user to create compelling content and applications to drive adoption. These may be in the domain of education, health care, or delivery of government services. For example, many state legislatures now stream video of their legislative and court proceedings.23 Similarly, the Town of Blacksburg, Virginia streams video of Town Council meetings, representing one of many such outgrowths of the Blacksburg Electronic Village (BEV), a community ICT outreach program run by the local
20 See “BT to Launch Broadband for Small Communities” (http://www.btplc.com/Mediacentre/Archivenewsreleases/2003/nr0312.htm) and http://www.bt.com/broadband for more on BT’s broadband registration and campaigns , and http://www.demandbroadband.com for similar efforts by the East of England Development Agency (EEDA), a U.K. government-sponsored regional economic development authority. 21 See “Governor Announces Broadband Initiative” (http://www.state.oh.us/gov/releases/092602broadband.htm) and (Technet/Analysys, 2003) p. 30. 22 Kvasny and Keil (2002) critique the programs for falling short of participant’s expectations. In contrast, (Youtie, 1999, p. 3) describes the success of the West Georgia Telecommunications Alliance, a private-sector led knowledge networking and demand aggregation initiative, at training alliance members in Internet use through weekly sessions at the local library. At the federal level, the U.S. government has also played a substantial role in the establishment of Community Technology Centers in disadvantaged neighborhoods: see the U.S. Department of Housing and Urban Development and the Department of Education (http://www.hud.gov/offices/hsg/mfh/nnw/nnwindex.cfm). 23 See (Technet/Analysys, 2003, p. 19) and http://www.mediachanneltv.com/shows/emopo9.htm for a listing of programs available.

Page 11 of 41
university, Virginia Tech, since the early 1990’s.24 BEV hosts web pages of local content, as well as encompassing other elements of our taxonomy as described below.25
Finally, government leadership can facilitate the aggregation of demand within a geographic area. For example, the Ohio Department of Development administers the Ohio Broadband Link, a program that negotiates volume discounts with providers based on the combined purchasing power of businesses within the state. The state covers the administrative costs of running the buying cooperative, and passes the discounts through from providers to participating members.26 The state thus functions as a kind of reseller for commercial providers, reducing the sales and marketing costs required to serve a large number of smaller customers.27 Other initiatives, such as the Commonwealth of Pennsylvania’s Keystone Communications Project, add geographic cost averaging as an integral element of the buying cooperative, requiring providers to offer similar services at similar prices regardless of the customer’s location. 28 Anchor tenancy, which involves government aggregating its own buying power as a strategy to attract providers, is conceptually separate from a buying cooperative, but the two strategies are often combined in practice. For example, Pennsylvania combined the networking contracts of multiple state agencies into a single contract, guaranteeing a large volume of state business to a provider willing to make reduced telecommunications pricing available to state and local government offices in underserved rural areas. Anchor tenancy, which requires a level of government scale large enough to attract interest from the private sector, has also been used in the state of Colorado for its Multi-Use Network Project, and proposed in the City of Chicago for its CivicNet initiative.29
Compared to other approaches in our taxonomy, demand-side initiatives involve low cost and risk for governments, which helps explain their popularity. To the best of our knowledge, their cost and effectiveness have not been systematically studied. Although most demand-side initiatives are relatively uncontroversial, anchor tenancy in particular can create policy tensions. The contract between the government and the private-sector partner needs to be worthwhile for the commercial provider, but at the same time not be so long and exclusive that the government’s goal of stimulating competitive deployment
24 See http://www.bev.net 25 It is useful to distinguish efforts such as BEV’s to gather and disseminate community information electronically, often referred to as “community networks” by practitioners and in published literature, from community construction and operation of physical networks, which we refer to as “municipal networks” and discuss in more detail below. 26 See (TechNet/Analysis, 2003, p. 35) and http://www.state.oh.us/gov/releases/092602broadband.htm. 27 Initiatives with private-sector leadership have also adopted this role, such as the West Georgia Technology [formerly Telecommunications] Alliance (Youtie, 1999; Laudeman, 1999) and Berkshire Connect (Gillett, 2001). 28 See http://www.keycomm.state.pa.us/keycomm/site/default.asp. Berkshire Connect also features “all for one and one for all” pricing. 29 See http://www.colorado.gov/dpa/doit/mnt/ and http://www.cityofchicago.org/CivicNet/ for further details of these initiatives.
Page 12 of 41
is subverted by the creation of a new de facto monopoly for the government’s own business.
Policy challenges can also arise if the government wishes to extend the economies of scale it achieves through demand aggregation to private sector customers for economic development purposes. Commercial providers may view this type of development as unfairly undercutting their business. Innovative solutions to such public-private boundary issues can usually be found, as long as the public and private partners maintain a healthy working relationship. In Pennsylvania, for example, where the statewide network ran near (but not to) an industrial park, a public-private joint venture was used to build an on-ramp, with half the funding coming from the state’s economic development budget, and the other half from the private-sector provider.30
From this summary of initiatives it is apparent that governments at all levels have attempted to stimulate demand for broadband through a range of roles vis a vis the private sector: facilitator, buyer, and lead user. At one extreme, governments have done little more than encourage private-sector-led efforts to measure, stimulate, and aggregate demand. At the other extreme, governments have contributed their own demand to an aggregation, taking on the administrative complexities of combining networks from different agencies and branches of government, and contracting with the private sector for supply. In between, governments have led by example, adopting the best practices of the private sector to provide broadband-enabled content, applications, and training.
While examples of each type of approach can be found at local (i.e. municipal) and regional (i.e. county and state) levels, demand aggregation is more commonly adopted as a regional approach. Few underserved municipalities have enough demand, even in the aggregate, to attract new telecommunications investment by themselves (Chicago, the 3rd largest city in the US, is a notable exception, promising $32m of annual aggregate demand through CivicNet). Most communities that wish to pursue demand-side strategies will need to participate in statewide programs (such as Ohio’s eVantage buying cooperative) where available, or partner with others in their region to define a suitably large aggregation of users. In very low density regions, reasonable aggregations ma y not be geographically possible, and alternative approaches will need to be considered.
B. Government as Rule-Maker: Policy Changes
Another way for local governments to make their communities more attractive to commercial providers is to adopt or reform local policies so as to reduce the cost or shorten the time required for private-sector deployments. Examples of local policies that affect the ease of commercial deployment are summarized in Table 2.
30 Personal communication, Luc Miron, Executive Director, Key-Net Alliance (http://www.oit.state.pa.us/key-net/site/default.asp).

Page 13 of 41
Table 2: Policy Reforms Type of Policy
Examples
Access to Local Facilities
• Franchising/Licensing and Rights of Way (Use of streets and other public property)
• Utility pole attachment (Rules for adding wires and equipment) • Zoning (Rules for facilities placement, esp. wireless antennas)
Coordinated Planning
• Conduit installation during road construction (e.g. Chicago CivicNet)
• Antenna siting (e.g. Dubuque, IA) Industry-specific Regulation
• Negotiation of cable franchise agreement (Cable system upgrades, deployment of networks for municipal use, schools and libraries, etc.)
Deployment of network facilities to support broadband often requires the use of public property. Wireless antennas may need to be placed on radio towers, water towers or other tall structures. Installing wires or conduits may require digging up roads, accessing sewers, or attaching cables or electronic equipment to utility poles, which in some communities (particularly those with a municipal electric utility) are owned by the local government.
Local governments may find that they are inadvertently driving away commercial communications infrastructure investment through policies that result in cumbersome permit application processes, indeterminate or long periods of time for permit issuance, or excessive fees for the use of public property. If this is the case, then reforming the necessary policies can lower the cost for commercial providers to deploy infrastructure in the community, in some cases tipping the balance enough to attract new investment.
Governments can also simplify deployments for commercial providers by coordinating them with municipal public works planning. For example, Chicago’s CivicNet initiative proposes to coordinate commercial telecommunications conduit installation with municipal road repairs and water main installations. (NATOA, 2003, p. 18) reports that the City of Dubuque, Iowa took a coordinated approach to wireless antenna placement, offering the use of city property such as water towers and the rooftops of government buildings in order to reduce the need for new structures. As a result, Dubuque was able to add 24 new antenna sites – serving six mobile telephone providers and one wireless Internet Service Provider – with a net gain of only 3 towers.
A 1999 telecommunications survey conducted by the International City/County Management Association (ICMA) found that 93% of local governments had a franchise agreement with a cable company, with a 12.2 year average term length. 31 Cable franchise
31 Aggregate survey results are available at http://www2.icma.org/upload/bc/attach/{3056C41E-BEAA-4777-86C6-E0A649802A87}tele99web.pdf. Interestingly, 3.2% of local governments surveyed reported

Page 14 of 41
renewals, when they happen, can be used by municipalities as a negotiating lever to achieve broadband-related goals. A well-known example is Portland, Oregon, which attempted to compel its cable provider to offer “open access” to the cable network by unaffiliated Internet Service Providers. (NATOA, 2003, pp. 9-12) lists numerous other communities that have included broadband-related goals – such as cable system upgrades and the provision of data networks for town facilities (“I-Nets”) - in cable franchise negotiations.
As with demand-side interventions, the effects of local government policy interventions have not been systematically assessed. However, the ICMA survey gives a sense of how widely applicable they can be: nearly half of local governments surveyed had an ordinance for franchising local rights or way, or had developed an ordinance regulating the siting of cellular and wireless communication towers.
Localities are not always independent in setting such policies; they must also conform to the state and federal policy context. Right-of-way policies in particular have received intense federal and state attention.32 (TechNet/Analysys, 2003, pp. 10-13) describes a range of policies that have been adopted by 26 states to make right-of-way management less of a barrier to deployment. These policies typically constrain local authority by imposing limitations on fees, requirements for in-kind compensation, or the amount of time for municipalities to process permit applications, as well as standardizing permit applications statewide.33 Local pole attachment policies must also comply with federal and state regulations.34 Similarly, the options available to communities in cable franchise negotiations may be constrained by the FCC’s ongoing efforts to classify cable-based broadband as an information service.35
Numerous other policies at higher levels of government influence local broadband availability. Perhaps the most important of these is the federal Communications Act of 1934 that created the FCC and assigned it authority for regulating interstate telecommunications services. More recently, the Telecommunications Act of 1996
that they had provided incentives to attract competing cable providers. Unfortunately, this survey has not been repeated since 1999. 32 See (NTIA, 2003) and (NARUC, 2002). 33 Michigan, for example, created the Metropolitan Extension Telecommunications Rights-of-Way Oversight (METRO) Authority in 2002 to administer common fees and enforce maximum delays statewide. See (TechNet/Analysys, 2003, p. 27) and Michigan Newswire, “Engler: "Fast Lane to Future is Now Open" Governor Signs Bills to Speed Broadband Deployment,” http://www.michigan.gov/minewswire/0,1607,7-136-3452_3479-20210--M_2002_3,00.html 34 See a news update regarding the FCC’s pole attachment rules at http://www.appanet.org/legislativeregulatory/broadband/poles/poleattachments.cfm and attorney Jim Baller’s guide to state and federal pole attachment rules at http://www.baller.com/library-art-practical.html. 35 See FCC Declaratory Ruling, March 14, 2002, http://ftp.fcc.gov/Bureaus/Cable/News_Releases/2002/nrcb0201.html. Among other things, in this ruling the FCC chose to exercise forbearance with respect to the U.S. Court of Appeals decision in the Portland case.

Page 15 of 41
(TA96) amended the earlier Act and adopted a novel framework to manage the transition from monopoly utility regulation of local telephone companies to local competition. The TA96 put in place a number of important provisions that are having a major impact on the evolution of local services. First, the TA96 required incumbent telephone companies to provide wholesale access to their legacy networks to competitors, referred to as Competitive Local Exchange Carriers (CLECs). Some municipal service providers have sought to take advantage of these CLEC provisions to extend their services. Second, the TA96 calls for the reform interstate access charges which historically have been a major source of subsidies from long distance to local telephone services, and for the reform of universal service mechanisms. These reforms alter the availability of funding for local infrastructure investment. Third, the TA96 requires the FCC to monitor the progress of advanced communication services, and if it determines that these are progressing too slowly, to take actions to encourage deployments. Fourth, the TA96 eliminated all state and local regulations that previously may have restricted competitive entry. The implementation and interpretation of this important legislation is ongoing, and its ultimate implications for local communications policy initiatives remains uncertain.
In addition to federal regulatory oversight, local autonomy over communications policy is constrained by state Public Utility Commissions and a variety of state telecommunications-related legislation, and by international treaties.
C. Government as Financier: Subsidies
A third option for local governments is to use their budgets as sources of financial incentives to stimulate broadband, as summarized in Table 3.
Table 3: Subsidies Target of Subsidy Examples Providers • Grants
• Loans (typically at lower-than-market interest rates) • Tax Incentives
Users • Equipment • Service (typically for a limited time)
Community Groups • Planning Grants • Training • Non-profit deployments
Financial incentives can be aimed at stimulating supply, demand, or both. Subsidies to commercial providers may be in the form of outright grants, low-cost loans, or tax incentives. Alternatively, they may take the form of one-time concessions in right-of-way or licensing fees, as opposed to across-the-board changes to these policies as discussed in the previous section.
Subsidies to users are typically temporary in nature, or targeted at disadvantaged groups. For example, LaGrange, Georgia gave away WebTV equipment and service for a 1-year period in an attempt to get more of their socio-economically disadvantaged citizens

Page 16 of 41
online.36 Unfortunately, the attempt was largely unsuccessful, reflecting barriers to adoption that go beyond the cost of access, as well as unpopular limitations of the chosen technology (the WebTV devices used had no print capability, for example).
Although they have not been systematically studied to date, broadband-related subsidies appear to be more common at state and federal levels, where budgets are significantly larger. Michigan, for example, offers tax credits and low-cost financing to “telecommunications providers who invest in new broadband infrastructure,” as well as to users buying hardware and software that will increase the use of broadband.37 States are often the source of planning grants used by local communities to assess their broadband situation and decide what to do about any problems, as for example the state of Massachusetts did for the Berkshire Connect initiative. States also administer telephone universal service funds, as well as federal social welfare funds that may in some circumstances be used to help close broadband divides. For example, Pennsylvania administers a $3.3m digital divide grant program based on federal funds from the Temporary Assistance to Needy Families (TANF) program. One of their 2002 grants was $457,000 to the Glendale School District (located in economically disadvantaged coal country) to extend wireless broadband Internet access from one school to neighboring schools as well as citizens, and to give laptops to community members who partake of training opportunities (Government Technology, 2002).38 Federal funds may also be distributed directly, as for example the $1.4B (in FY2003) Rural Broadband Loan and Loan Guarantee Program enacted as part of the 2002 Farm Bill, and administered by the U.S. Rural Utilities Service to provide low-cost loans for commercial deployments in rural areas.
D. Government as Infrastructure Developer: Municipal Networking
The remaining strategy that local governments can pursue to stimulate broadband is to develop one or more aspects of the necessary infrastructure themselves. As Table 4 illustrates, the decision to participate on the supply side is not unitary, but rather a chain of subsidiary decisions about which groups of users to serve, which aspects of the infrastructure to focus on, and what role(s) local government should play. U.S.
36 See Youtie, Jan, Philip Shapira, and Greg Laudeman, "Transitioning to a Knowledge Economy: the LaGrange Internet TV Initiative," paper presented to Telecommunications Policy Research Conference, Alexandria, VA, October 2002 (available at: http://intel.si.umich.edu/tprc/papers/2002/100/LGIAI-TPRC-2002.pdf) and Keil, Mark, Garret W. Meader, and Lynette Kvasny, 2003. “Bridging the Digital Divide: The Story of the Free Internet Initiative in LaGrange, Georgia.” HICSS. 37 See Michigan Newswire, “Engler: "Fast Lane to Future is Now Open" Governor Signs Bills to Speed Broadband Deployment,” http://www.michigan.gov/minewswire/0,1607,7-136-3452_3479-20210--M_2002_3,00.html and (TechNet/Analysys, 2003, p. 34). 38 Another example of a combined national-regional initiative can be found in the U.K.’s “Rabbit” initiative, for “Remote Area BroadBand Inclusion Trial.” The U.K. government and regional economic development authorities have joined forces to provide a subsidy of £4-700 (or one year of service, whichever is less) for small businesses in geographically underserved areas where DSL and cable modem are unavailable, and more expensive options like satellite broadband are the only ones available. See http://www.rabbit-broadband.org.uk/

Page 17 of 41
communities that have adopted supply-side approaches exhibit great diversity across these subsidiary choices.
Table 4: Modes of Local Government Infrastructure Development Decision Factor
Options
Targeted Users • Government (including schools, municipal facilities) • Businesses • Residents
Type of Infrastructure
• Ducts or conduit (possibly with dark fiber) • “First mile” network (connections to customer premises) • Interconnection point(s) (e.g. neutrally administered “carrier
hotel”) • “Middle mile” connection (backhaul links to other locations)
Technology (when applicable)
• Wireless (unlicensed or licensed) • Wired (copper, hybrid fiber-coax, fiber)
Services • Broadband (Internet access, other data communications) • Video (cable TV) • Voice (telephony)
Government Responsibility
• Finance (bonds: special issue or general obligation) • Build (may contract to private sector) • Operate (may contract to private sector)
Business Model • Wholesale (local government sells capacity to carriers, or leases dark fiber to anyone but with no associated service, or provides “open access” platform to multiple ISPs)
• Retail (local government sells higher-level services to end users)
Just as measurement of existing demand is an essential first step for pursuing demand-side strategies, assessment of existing supply is a critical input to formulation of a supply-side strategy. Based on an assessment of the communications needs and existing resources available to different groups of users, government can prioritize infrastructure developments for itself, local businesses, and citizens. It is not uncommon for a local government to deploy a network first for its own needs, and later exploit any excess capacity to offer services to nearby businesses.
A local infrastructure survey also helps a government determine the specific types of infrastructure and services that are most lacking, or that it can most effectively boost. Numerous communities that already have municipally run electricity networks have found it feasible to construct first-mile networks for communications services, and the recent emergence of lower-cost wireless networking alternatives appears to be making

Page 18 of 41
this option feasible for more communities as well.39 Depending on the options provided by the selected technology, communities may also face the decision of whether to stimulate video and voice services in addition to broadband data communications.
Solving the first-mile access problem, however, may expose other problems such as high backhaul costs, particularly in remote locations facing distance-dependent pricing for communications circuits. Blacksburg, VA addressed this issue by setting up a neutral interconnection facility for exchange of traffic among local ISPs, so that intra-town traffic could avoid having to incur back-haul costs.40
Whichever aspects of infrastructure a local government chooses to develop, a key decision it faces is where to draw the functional boundary between itself and the private sector. Infrastructure construction and operations can readily be contracted out to private companies, following the recommendations of privatization advocates (Savas, 2000, chapter 9). Project financing, however, remains the essence of local government’s responsibility.41 Local financing may consist of special-issue bonds that have to be repaid out of service-related revenues, or of general obligation bonds that can be repaid out of tax collections. Local government’s access to funds with a longer-term payback period, potentially lower interest cost, or taxpayer backing has proven to be a lightning rod for controversy. From the perspective of local governments, these financial terms are key to making broadband deployment economically feasible in places where it otherwise would not be. From the perspective of current or would-be private sector operators in a community, however, these terms give municipalities an unfair competitive advantage.42
In between these two perspectives lies a compromise whereby local government uses its “unfair” financial advantage only for solving the problem of unfavorable network deployment economics, while leaving the provision of higher-level services to the private sector.43 In other words, local government adopts the wholesale business models shown in Table 4. Such models have received support from industry as well as state and federal
39 (NATOA, 2003 p. 17) describes a municipally driven broadband wireless deployment in McAlester, Oklahoma, a community with no municipal electric utility. Similar plans are reported as being underway in other Oklahoma communities through the facilitation of the Oklahoma Municipal Services Organization (OMSC), a non-profit offshoot of the Oklahoma Municipal League that is focusing on municipal wireless networking installations. See also (Blackwell, 2002) for a description of municipal wireless systems in Ellaville, GA; Pocahontas, IA; and Buffalo, MN (all of which are municipal electric communities). 40 Blacksburg’s “Multimedia Services Access Point” is described at http://www.bev.net/services/msap.php. Aside from addressing backhaul costs, it also enhanced performance. 41 When government’s role is purely as a financing agent, the resulting strategy may alternatively be viewed as a form of subsidy. 42 Recourse to general tax revenue may also motivate taxpayers to stop local government from moving ahead with a proposed broadband project See http://www.tricitybroadband.com/ for a recent example of this phenomenon in Kane County, IL (the cities of Geneva, St. Charles, and Batavia). 43 This position is often articulated via the metaphor that “government should run the roads, but leave the taxi services to the private sector.” It is interesting to consider what public bus services might imply for this metaphor.

Page 19 of 41
policy makers,44 and have been used extensively by municipal electric utilities offering business communications services (see discussion below). It appears, however, that only four of the 62 utilities that provided broadband to residential users at the end of 2002 did so with an “open access” model.45
Like all other local broadband strategies, municipal infrastructure provision takes place within a state and federal context. Sometimes this context encourages municipal networking. Iowa operates a public statewide communications network that municipal networks are allowed to connect to, reducing their backhaul costs. Utah’s history of using inter-local agreements led 18 communities to band together into the UTOPIA project, an ongoing attempt to achieve economies of scale in planning, financing and constructing municipal last-mile fiber networks.46
More typical, however, are policies that restrict municipal action, which have been enacted in at least 15 states and challenged at multiple levels, increasing uncertainty for municipal planners.47 These policies range from outright prohibitions as in Texas, which “bars municipalities and municipal electric utilities from offering telecommunications services to the public either directly or indirectly through a private telecommunications provider;” to partial restrictions as in Washington, which prevents county-wide Public Utility Districts (but not municipalities) from offering retail services, but allows them to sell wholesale telecommunications services; to explicit permissions as in Nebraska, which allows municipalities to lease dark fiber, subject to various restrictions.48 This heterogeneity reflects different geographic, historical, and political circumstances in each
44 For example, the state of Washington requires Public Utility Districts that offer broadband to offer only wholesale services. The wholesale-only model was advocated by Reed Hundt in remarks at the April 2003 NARUC-NECA Broadband Summit, and is an explicit policy recommendation of (TechNet/Analysys, 2003). 45 Personal communications, Ron Lunt, APPA, based on our definition of “open access” as the M.E.U. providing broadband transport only, and allowing more than one ISP to serve consumers over its network. Three communities that adopted this model voluntarily are Spencer, IA; Ashland, OR; and Tacoma, WA. Grant County, WA is a Public Utility District and therefore prohibited by state law from selling retail services. Many of the newer municipal FTTH deployments have announced their intention to operate in a wholesale-only mode. 46 Details of the Utopia project can be found at http://www.utopianet.org. This project applies the benefits of aggregation to the supply side. 47 At the time of this writing, the Supreme Court has agreed to weigh in on one such challenge (FCC vs Missouri Municipal League). The root of the challenge is Section 253(a) of the Telecommunications Act of 1996, which stipulates that state and local laws may not prohibit “any entity” from providing telecommunications services. “Any entity” has been variously interpreted as possibly excluding public entities. For further details on legal challenges, see slides 9-11 in http://www.neca.org/MEDIA/JAMESBALLER.PDF. 48 These examples are selected from more complete lists in (APPA, 2002, p. 4), (NATOA, 2003) and updates received in personal communications from attorney Jim Baller and Analysys consultant Michael Kende. Relevant state laws for the states described here are Texas Utilities Code, § 54.201, et seq.; Revised Code of Washington §54.16.330; and Nebraska Legislative Bill 827, approved by the Governor May 25, 2001.

Page 20 of 41
state, as well as differing philosophies about whether municipal entry stimulates or hinders broadband deployment and competition.
III. Analysis of Communications Services Provided by Municipal Electric Utilities
Community efforts to build or operate communications infrastructure represent the most direct form of local government intervention and are therefore of particular interest when considering the role of the public sector in stimulating broadband. The preceding discussion highlighted the range of activities that could be undertaken in this category of initiative. To begin the process of understanding these sorts of initiatives, we identified a sample of communities with municipal electric utilities (M.E.U.) based on a directory published by the American Public Power Association (APPA).49
For an M.E.U. community, many of the costs of setting up a municipal broadband company have already been incurred. As the local power company, the M.E.U. already has access to conduit, a fleet of trucks to provide outside plant and customer premise servicing, and a service relationship with consumers and businesses in the community. Thus, we should not be surprised to find these types of communities in the vanguard of local efforts to provide wholesale and/or retail communication services in lieu of – or in competition with – services provided by private sector carriers such as the cable provider or local telephone company.
The APPA directory lists over 2,000 municipally-owned power companies. Although these represent a large share of the 3,152 electric power utilities in the United States (as of 2000), they accounted for only 16% of power sales – the majority of which are provided by much larger investor-owned utilities (see Table 5). The public utilities range from tiny utilities serving less than a hundred consumers to huge ones serving hundreds of thousands of consumers, and are distributed all over the United States (Table 6).
Table 5: U.S. Electric Utility Statistics, 200050 Number Sales (Megawatt-hours)
Publicly Owned Utilities 2,009 516,681 Investor Owned Utilities 240 2,437,982 Cooperatives 894 305,792 Federal Power Agencies 9 49,094 Total 3,152 3,309,549 Share Publicly owned
64%
16%
49 See note 2, supra. 50 Source: "2002 Annual Directory & Statistical Report," American Public Power Association, page 13.

Page 21 of 41
We anticipate that a complex set of factors will influence an M.E.U. community's decision of whether to offer communication services, and if so, which services to offer. Likely influences include:
• Demographics (Demand-Side Factors): How large is the community? Is it growing rapidly? Does the community already demonstrate demand for Internet services? Do inhabitants have the skills and resources to take advantage of advanced services?
• Supply-side Factors: What are the costs for constructing and operating facilities? What technologies are suitable for use in the community?
• Competitive Alternatives: What services are planned or already available from private-sector carriers? Is the relationship between the community and private-sector carriers cooperative or adversarial?
• Policy Environment: Is statewide policy favorable to municipally provided communication services? What is the form of local government? What are the community’s finances like? Is there a prior history with municipal communication services?
Although this list is undoubtedly incomplete, it already includes a number of factors that are difficult to measure quantitatively. At this stage in our data collection and analysis, we have focused on demographic and supply-related factors for which suitable proxies are available in data from the 2000 Census.51 These include community characteristics such as housing density, population, age distribution, educational attainment, and labor force participation and are discussed in more detail below.
Because we focus on community-based initiatives, we exclude utilities that serve multiple communities as an aggregate (e.g., public utility districts/public power districts that serve entire counties). Additionally, we were not able to match all of the utilities uniquely to community-level Census data. Consequently, our working sample includes data on 1,815 of the APPA communities spread out across the U.S. (Table 6).
51 We matched APPA communities to Census data aggregated according to Census place names, a new aggregate that was created with the 2000 Census. There are approximately 25,000 unique "places" in the Census data.

Page 22 of 41
Table 6: Distribution of APPA Communities by State (and mean APPA community population by state)
U.S. Total (1,815 communities): Mean population 16,670
State # APPA Utilities
Mean Populationfor APPA
communitiesState # APPA Utilities
Mean Population for APPA
communities AK 33 10,197 ND 12 1,604 AL 35 17,819 NE 120 2,745 AR 15 20,163 NH 3 2,830 AZ 10 135,966 NJ 9 13,142 CA 33 214,239 NM 7 13,171 CO 29 24,533 NV 4 125,515 CT 3 16,393 NY 47 6,956 DE 9 10,558 OH 85 20,375 FL 32 51,389 OK 62 6,069 GA 51 11,247 OR 15 12,477 IA 135 2,895 PA 34 4,844 ID 11 7,413 RI 1 4,742 IL 41 11,900 SC 21 8,481 IN 73 5,939 SD 34 6,508 KS 119 3,785 TN 58 32,100 KY 24 11,794 TX 70 31,681 LA 21 10,121 UT 39 11,839 MA 20 24,261 VA 16 17,861 MD 4 13,439 VT 12 4,496 ME 4 3,794 WA 20 51,941 MI 40 34,050 WI 81 5,203 MN 124 5,134 WV 2 4,427 MO 88 8,543 WY 13 3,789 MS 23 10,678 MT 1 957 NC 72 13,549
While the APPA has members all across the U.S., municipally-owned power companies appear somewhat more prevalent in the Midwest and West.
The APPA database identifies the utility by name, the community in which the utility is located, and what sorts of communication services (if any) were offered as of the end of 2002.52 The communities in our sample provided a diverse array of communication services that can be grouped loosely into four categories: (1) services for the internal use
52 The data on services is based on an APPA-administered survey, with self-reporting by the utilities and review by APPA personnel.
Page 23 of 41
of the utility; (2) data services for the local government; (3) services provided to consumers; and (4) services provided to commercial customers. The internal-use services included voice communications and various electricity network metering/monitoring services.
The residential consumer services include telephony and cable TV, as well as Internet access services, including dial-up and broadband modems. The commercial services include leased lines and dark fiber leasing. Table 7 summarizes how these communities break down in terms of the range of telecommunication services offered; Table 8 presents a subset of this information more visually.
The services provided for internal use of the electric utility and the municipality may be regarded as "internal," and the services provided to commercial and residential customers as "external." Internal services represent a form of self-provisioning, and so are analogous to when a commercial customer puts up a building or campus network or installs a PBX to handle on-site traffic. The services that are internal to the utility include automatic meter reading and system control and data acquisition (SCADA). These are intrinsic to the utility’s basic function as a power company, while the provisioning of municipal data services involves providing high-capacity data lines to a relatively few government sites. Offering these services requires a smaller incremental commitment in infrastructure and business processes (e.g., billing/customer services) dedicated to telecommunication services than does the decision to offer wholesale communication services to unaffiliated third parties (e.g., fiber leasing), or retail services to businesses and residential consumers. While both types of services substitute for private sector alternatives, M.E.U.s that offer external services compete more directly with private-sector carriers.
We observe that some M.E.U.s may start by offering internal services, or equivalently, that the infrastructure used to provide internal services can provide scope or scale economies that lower the costs of subsequently offering external services. Additionally, the decision by a M.E.U. to offer telecommunication services may prompt private carriers to accelerate service plans, which may result in the M.E.U. subsequently deciding not to offer the service. While we expect that there are dynamic effects that are important to explaining how local broadband access evolves, our data set does not presently allow us to track these changes.

Page 24 of 41
Table 7: Breakdown of Utilities Offering Different Communication Services
Number in
sample
Population (mean)
Total Census “Places” in U.S. 24,861 8,019 Total Communities with Municipal Electric Utility 1,815 16,690 Utilities offering at least one communication service 445 42,449 Utilities offering at least one service for internal use:
327
53,423
Internal telephone service 76 124,861 Automated meter reading 129 59,720 System control & data acquisition 281 62,629 Municipal data communications
181
41,123
Utilities offering municipal data or internal services 362 50,172 Utilities offering at least one service to residential/consumer customers53:
170
16,436
Cable Television 95 12,238 Local Telephone 35 10,566 Long Distance Telephone 29 15,230 Video on Demand 8 31,850 Wireless services54 29 20,231 ISP55 118 18,144 Broadband Modem 62 18,104 Utilities offering at least one service to commercial customers:
167
73,011
Leased (Private) Lines 98 35,870 Dark Fiber Leasing 128 88,412 Number offering commercial or residential service
236
53,376
Number offering commercial, no residential 66 148,523 Number offering commercial & residential service 101 23,668 Number with broadband modem & telephone service 19 10,221 Number with broadband modem & commercial service 54 19,796 Number with fiber leasing, no residential or leased lines 52 158,413
53 We have classified telephone and wireless services as residential, although these may also be provided to commercial customers. 54 Utility provides a radio frequency based commercial service (e.g., PCS Service). 55 This includes dial-up access.

Page 25 of 41
Table 8
Of the 24,861 total communities uniquely identified in our database, 1,815 of these (7.3%) are APPA communities. Of the APPA communities, 445 (or 24.5%) offered some kind of communication service at the end of 2002, an increase of approximately 14% over the previous year.56
Table 7 illustrates great diversity in the range of services offered. Not surprisingly given the nature of the sample, the most common types of service to offer are communication services for internal use by the electric utility, followed closely by data services offered to the municipal government. Of the utilities providing a communication service, only slightly more than half (236) offer services to either residential or commercial customers, and less than half of those (101) offer services to both. Thus, only a small fraction of the APPA communities offer any substantial range of communication services to end-users. This is not surprising considering the relatively early stage in the development of
56 The APPA reported that 511 utilities offered some kind of communications service at the end of 2002, up from 450 at the end of 2001 (see, "Public Power: Powering the 21st Century with Community Broadband Services (available at http://www.appanet.org/LegislativeRegulatory/industry/TelecomFactSheet5-03.pdf for data for 2002; and http://www.appanet.org/LegislativeRegulatory/Broadband/CommunityBroadbandFact.pdf for 2001 data). These numbers differ from the counts in our database because we have excluded county-wide utilities and other communities that we could not match to Census “place” data.

Page 26 of 41
broadband, and the prevailing assumption (especially prior to the recent meltdown in the telecommunications sector) that competitive markets would assure ample private-sector provision of access alternatives for most communities.
Our data indicate only 62 communities provide consumer broadband services, and the majority of these (49) provide broadband via cable modems,57 while the remaining communities likely use a mix of technologies ranging from DSL modems to FTTH to wireless.58 Only 19 communities are providing both consumer broadband and telephone services, implying that only a small fraction of even those communities that provide both commercial and residential services are offering the telecommunication services we associate with most ILECs.
While we expect the number of APPA communities offering advanced communication services to continue to grow, the small size of the current sample limits what can be done econometrically at this stage. As a starting point, we have examined the following demand- and supply-side indicators, selected from the 2000 Census: 59
57 Because these communities also provide municipal cable TV services, we infer that the broadband offering is via cable modem. 58 Of the 13 non-CATV communities with broadband, only one of these communities reports offering a telephone service, although 5 report wireless services. One of those that does not report either, Taunton MA, is deploying FTTH. 59 This list of indicators is preliminary and is presented as representative of the types of data included in the 2000 Census. We are in the process of refining our selection of demographic characteristics.

Page 27 of 41
• Population: the population provides a gross measure of the size of the communities. Because of scale economies, larger communities might be expected to have more extensive public sector apparatus. On the other hand, these communities may be better able to sustain private sector providers for telecommunication and power services and so may be less likely to require government provisioning for these services.
• Housing Density: this provides a measure of how urban the community is, and also an indication of the costs of constructing infrastructure. Density is inversely related to infrastructure costs.
• % Housing Stock Older Than 1990: this provides a measure of the "newness" of the housing stock in the community. This number should be lower for communities that are younger or are growing/rebuilding rapidly. We would hypothesize that younger communities may have newer infrastructure which may make it easier for them to offer communication services. On the other hand, rapidly growing communities may be relatively more attractive to private service providers, which may make it less likely that the municipal power company would offer communication services.
• Per Capita Income : this provides a measure of the relative wealth of the inhabitants. From other studies, we know that Internet usage is positively correlated with wealth (and educational attainment), and so this provides a proxy for the level of demand for communication services. Wealthier communities are more likely able to afford and demand advanced communication services, but they may also be more likely to be served by private sector providers.
• % Population 18 Years Old or Younger: this provides a measure of the age distribution in the community. It is negatively correlated with per capita income. Also, Internet usage varies by age. In future analyses, we may include a finer break-out on age demographics.
• % Non-White Population: this provides a measure of the racial mix in the community. The % non-white population is negatively correlated with per capita income.
• % Population With a Bachelor's Degree: this is a measure of educational attainment. This is expected to be positively correlated with Internet usage and is positively correlated with per capita income.
• % Labor Force in Management or Professional Services: this is a measure of the labor force participation composition of the community. White collar workers in management and professional services are more likely to use advanced communication services. This provides another proxy for the demand for telecommunication services.
Tables 9 and 10 summarize these factors for selected segments within the APPA sample.

Page 28 of 41
Table 9: Comparative Demographics for Communities (mean values)
All Communities with
Municipal Electric Utility
Consumer Broadband
Business & Consumer
Service
Only Business
Population (2000) 8,019 16,690 18,104 23,668 148,522 Housing Density (Units/Sq Mile) 541 545 592 601 867 % Housing stock older than 1990 86.0% 88.1% 85.5% 85.8% 84.3% Per Capita Income $ 18,913 $ 17,235 $ 18,122 $ 18,120 $ 19,308 % pop less than age 18 25.72% 25.42% 24.90% 24.80% 24.46% % non-white pop 15.16% 14.50% 19.41% 19.55% 25.55% % pop with bachelor degree 11.30% 11.11% 12.92% 13.28% 15.00% % labor force mgmt or prof 27.38% 26.62% 28.94% 28.90% 31.73% # Observations 24,861 1,815 62 101 66
Table 10: Communities with Municipal Electric Utilities (2000 Mean Population, [number])
No Business Services Business Services
No Consumer Services
11,207 [1,579]
148,522 [66]
Consumer Services
5,852 [69]
23,668 [101]

Page 29 of 41
Three observations of particular interest are evident from Tables 9 and 10: • First, the typical APPA community is twice as large as the typical US community,
and appears to differ in other respects as well. However, it is unclear from the table alone whether these differences are significant.
• Second, APPA communities that only offer business services appear quite distinct.
They are much larger than the typical APPA community and have a substantially higher average housing density, suggesting that they are more "urban."
• Third, APPA communities that offer consumer services such as broadband, or offer
consumer services in conjunction with commercial services, are much smaller than those that offer only commercial services.60
One possible explanation for these preliminary results is that the APPA utilities are most likely to offer consumer services when alternative private sector services are lacking (i.e., the local telephone company or cable company is not already offering services).61 Additionally, the apparent bias in favor of offering business services in larger, more "urban" communities is likely related to demand-side factors (i.e., these markets provide the largest demand base for advanced services and are the most receptive to wholesale services being offered by the utilities). In many of these business-only markets, the APPA utility is leasing dark fiber and presumably its customers include private-sector telecommunication service providers in addition to commercial end-users.
To further explore these results, we estimated several regressions. For this analysis, we supplemented the data with the following additional variables:
60 As Table 10 indicates, the mean population of communities that offer only consumer services is 6k, whereas the mean population of communities that offer only business services is 149k, or that offer both business and consumer services is 24k. 61 Recall that in 49 of the 62 APPA communities providing consumer broadband, the APPA utility is also a cable TV provider.

Page 30 of 41
• % Workers in government: This is the share of workers that are employed in government. The labor share of workers in management and professional services turned out not to be significant, presumably because its positive effect on demand was already reflected by other variables (e.g., per capita income) or because many of these workers are commuters who use computers at work but may not at home. We would anticipate that communities with a higher share of residents employed in the government would have a larger government sector and so we would expect this to be positively correlated with the presence of a M.E.U. and with the likelihood that an M.E.U. offers a communication service.
• State broadband policy ranking: A consulting firm, Analysys, ranked the top twenty-five states in terms of the favorableness of public policy towards broadband deployments.62 We used this ordinal ranking (assigning a rank of 26 for all states that are not included in the top 25). Presumably, an M.E.U. in a state that is favorable to broadband might be more likely to offer communication services. Similarly, a state that has an activist broadband policy may be more positively inclined toward government provision of infrastructure services so may make it more likely that communities have M.E.U.s. We are in the process of identifying better controls for the policy environment.
• State average TELRIC: This is an estimate of the state-wide average total cost of providing basic telephone service infrastructure, as estimated by the Federal Communications telecommunications cost model.63 This provides a statewide proxy for the costs of constructing new local communications infrastructure.
We first estimate a logit model to confirm that the APPA communities are statistically distinguishable from the typical community in the U.S. The results shown in Table 11 indicate that relative to the U.S. as a whole, APPA communities are significantly different with respect to most of the factors considered.
The APPA communities typically exhibit:
62 See Analysys/TechNet, 2003. “The State Broadband Index: An Assessment of State Policies Impacting Broadband Deployment and Demand.” http://www.analysys.com/pdfs/technetbroadband.pdf 63 TELRIC estimates are state-wide averages for the forward-looking, long-run incremental cost for constructing a local telephone network as measured by the cost of providing Unbundled Network Element Platform (UNE-P) service. The estimates are from the FCC's Synthesis Cost model.

Page 31 of 41
• Larger populations • Older housing stock • Lower per capita income • Older populations (smaller share of population younger than 18) • Lower share non-white population • More educated populations (larger share of population with undergraduate
degrees) • Larger government sector (higher share of labor force in government –
significant at 90% level) • More likely to be located in broadband-friendly states • More likely to be located in higher infrastructure cost states (as measured by
TELRIC) • Higher housing density (not significant)
Table 11: Logit Regression of Pr(Community is APPA)
Population (000s) 0.001 [0.000]** % Housing stock older than 1990 1.511 [0.240]** Per Capita Income ($000s) -0.054 [0.006]** % pop less than age 18 (computed) xageless18=(pop-dage18)/pop
-1.075
[0.460]* % Population less than age 18 -0.360 [0.141]* % Population with bachelor degree 3.397 [0.420]** % workers in government 0.463 [0.274] State broadband policy ranking -0.013 [0.003]** State average TELRIC ($/month) 0.021 [0.006]** Housing Density (000s/sq. mile) 0.010 [0.036] Constant -3.221 [0.325]** Observations 24835 Standard errors in brackets
* significant at 5%; ** significant at 1% APPA communities are somewhat larger than the typical community included in the 2000 Census of “places.” This result reflects both sampling bias and, potentially, scale economies associated with operating a municipal power company. The sampling bias arises because the smallest communities that are not served by private power companies may be served by rural cooperatives that are not in the APPA sample, or by APPA utilities that serve multiple communities in a county and so were excluded from our analysis. The scale effect arises because there is likely a minimum efficient scale that is

Page 32 of 41
required before operating a M.E.U. is economically viable. Smaller communities may lack the financial and technical resources, and the demand for services is too limited, to justify incurring the fixed costs of supporting a municipal power company.
Second, older capital stock, lower per capita income, and lower non-white population suggests more "rural" communities.64 Additionally, these are communities that are less attractive to private carriers and so are more likely to be under-served, and hence, in need of government-provided infrastructure services. This is also consistent with the positive effect of higher infrastructure costs (as measured by TELRIC) and a larger share of the population that works for the government. The lack of a significant dependence on housing density and the indication of a positive dependency on educational attainment are somewhat counter-intuitive.
Taken together, the above results suggest that APPA communities are stratified in mid-sized communities. This is consistent with our expectation that private power companies would concentrate on the larger markets, while rural cooperatives serve the smallest communities.
While these results are intriguing, it is more interesting to consider how these factors are likely to impact the probability that an APPA community offers communication services. Table 12 provides the results from a logit regression to estimate the probability that an APPA community offers one or more communication services. These results suggest that the APPA communities which offer communication services (445 out of 1,815 o4 24.5%) exhibit:
• Larger populations • Younger housing stock • Lower per capita income (not significant) • Smaller share of population less than 18 • Larger share of non-white population • Larger share of population with undergraduate degrees • Smaller share of population working in government • In more broadband-friendly state (not significant) • Lower infrastructure cost states (not significant) • Higher housing density
(Coefficient effects in bold reverse direction of influence from regression results reported in Table 11. All coefficients are significant at the 95% level unless indicated otherwise.)
64 The classification of communities into rural or urban is not straightforward and changes over time. This is discussed further below.

Page 33 of 41
Table 12: Logit Regression Pr(APPA Community offers a communication service)65
Population (000s) 0.003 [0.001]* % Housing stock older than 1990 -2.069 [0.668]** Per capita income ($000s) -0.003 [0.017] % Population less than age 18 -4.206 [1.423]** % Non-white population 1.864 [0.358]** % Population with bachelor degree 6.301 [1.411]** % Workers in government -1.887 [0.826]* State broadband policy ranking -0.006 [0.007] State average TELRIC ($/month) -0.016 [0.017] Housing Density (000s/sq. mile) 0.405 [0.178]* Constant 1.220 [0.919] Observations 1815 Standard errors in brackets * significant at 5%; ** significant at 1%
These results are consistent with our earlier explanation and suggest that among the APPA communities, the more "urban" (denser) and newer/growing ones (younger housing stock) are more likely to offer communication services. This is consistent with these communities having lower costs for adding communication services to the municipal power company’s infrastructure.
The characterization of communities as more "urban" is based on the Department of Agriculture's (DoA) urban/rural classification scheme for 2003. The DoA classifies all U.S. counties into one of nine classifications, the first three of which we code as "urban" and the remaining six we code as "rural."66 Communities in "urban" counties are coded as "urban." Table 13 shows that communities are more likely to be classified as "urban" if:
65 Dependent variable is binary coded 1 if M.E.U. offers at least one of the communication services. 66 See http://www.nal.usda.gov/ric/faqs/ruralfaq.htm for additional information on the Department of Agriculture's rural-urban coding scheme.
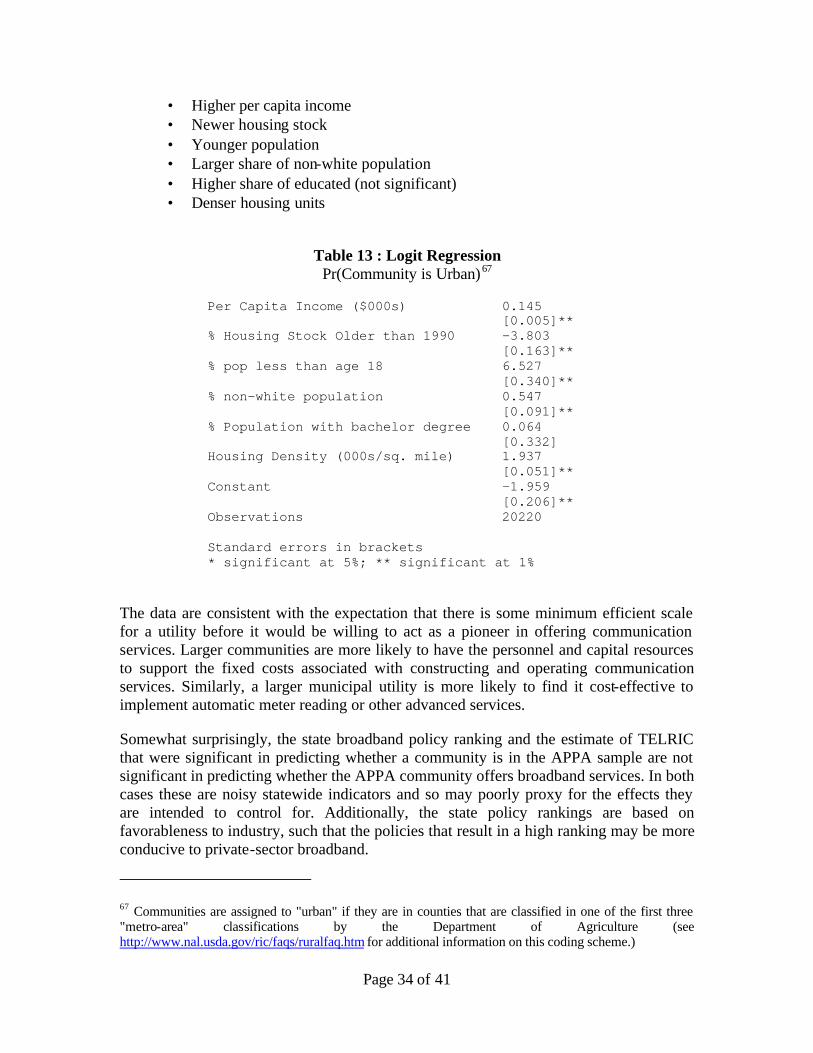
Page 34 of 41
• Higher per capita income • Newer housing stock • Younger population • Larger share of non-white population • Higher share of educated (not significant) • Denser housing units
Table 13 : Logit Regression Pr(Community is Urban)67
Per Capita Income ($000s) 0.145 [0.005]** % Housing Stock Older than 1990 -3.803 [0.163]** % pop less than age 18 6.527 [0.340]** % non-white population 0.547 [0.091]** % Population with bachelor degree 0.064 [0.332] Housing Density (000s/sq. mile) 1.937 [0.051]** Constant -1.959 [0.206]** Observations 20220 Standard errors in brackets
* significant at 5%; ** significant at 1%
The data are consistent with the expectation that there is some minimum efficient scale for a utility before it would be willing to act as a pioneer in offering communication services. Larger communities are more likely to have the personnel and capital resources to support the fixed costs associated with constructing and operating communication services. Similarly, a larger municipal utility is more likely to find it cost-effective to implement automatic meter reading or other advanced services.
Somewhat surprisingly, the state broadband policy ranking and the estimate of TELRIC that were significant in predicting whether a community is in the APPA sample are not significant in predicting whether the APPA community offers broadband services. In both cases these are noisy statewide indicators and so may poorly proxy for the effects they are intended to control for. Additionally, the state policy rankings are based on favorableness to industry, such that the policies that result in a high ranking may be more conducive to private-sector broadband.
67 Communities are assigned to "urban" if they are in counties that are classified in one of the first three "metro-area" classifications by the Department of Agriculture (see http://www.nal.usda.gov/ric/faqs/ruralfaq.htm for additional information on this coding scheme.)

Page 35 of 41
Finally, Table 14 presents logit regression results that demonstrate that the communities that offer only wholesale services are typically larger and more "urban" than other APPA communities in general, or that offer at least one communication service, that or offer at least one external communication service. This provides preliminary evidence for our hypothesis regarding why the larger communities provide only wholesale services, and why the M.E.U.s that provide retail services, or residential services in particular, are more likely to be in smaller "rural" communities (see Table 15).
Table 14: Logit Regressions Pr(M.E.U. offers only fiber leasing) for different sub-samples
#1: all APPA communities #2: all APPA communities that offer at least one communication service #3: all APPA communities that offer an external communication service #1
#2 #3
Population (000s) 0.003 0.004 0.018 [0.001]** [0.002] [0.007]* Urban (Code=1 if in DoA Metro County)
1.079 0.590 0.718
[0.228]** [0.261]* [0.353]* Constant -3.286 -1.406 -0.665 [0.172]** [0.190]** [0.225]** Observations 1473 341 180 Standard errors in brackets
* significant at 5%; ** significant at 1%
Table 15: Logit Regression Pr(Community offers residential service) given it provides a communication service
Population (000s) -0.025 [0.007]** Urban (Code=1 if in DoA Metro County) -0.083 [0.442] Constant 1.894 [0.292]** Observations 180 Standard errors in brackets
* significant at 5%; ** significant at 1%
These econometric analyses should be considered preliminary, as we do not yet have proxies to control for other factors that we believe will have an important impact on whether an M.E.U. decides to offer communication services. Additional factors that we are in the process of incorporating in our dataset include:

Page 36 of 41
• Indicators of competitive services (e.g., Availability of cable and/or DSL broadband from private-sector providers, dummies to control for ILEC or cable company identification).
• Indicators of demand for Internet access (e.g., ISPs in community, home PC ownership, evidence of telecommuting).
• Other indicators of demand for broadband (e.g., Presence of university? IT intensive businesses?)
• Indicators of community resources and strong local leadership (e.g., Town budget?)
• Characteristics of local political environment (e.g., Form of government?).
We are also seeking information on locally-provided communication services in non-APPA communities (e.g., rural cooperatives and municipal broadband provided by others than a municipal power company). With such additional data, we expect to be able to further refine our understanding of the impact of these factors on local broadband promotion efforts.
IV. Conclusions and Future Research Directions
It is evident from the examples and statistics presented in this paper that local government involvement in broadband has been growing in recent years. The deployment of broadband infrastructure is more contingent on local context than narrowband (dialup) has been. As the relevance of broadband Internet access to local economic development and quality of life becomes increasingly evident to communities, we expect their involvement in the development of broadband infrastructure to continue growing.
In spite of the growing importance of local governments in the evolution of "last mile" infrastructure, little systematic research is available with which to quantify or evaluate the extent of such activity and its impact. To help remedy this deficit, this paper has presented a taxonomy of local government broadband initiatives, highlighting the great diversity of approaches and conditions that characterize local initiatives. It has also presented a preliminary analysis of one sample of communities pursuing one type of approach: a sample of municipally-based electric utilities (i.e., communities which have already identified themselves as actively involved in the provisioning of basic infrastructure services), and a sub-sample of those that have chosen to offer some form of communications service.
Within that sub-sample, the analysis in this paper has highlighted a population-based split that suggests distinctly different rationales for public sector involvement in broadband infrastructure in varying local contexts. In the smallest communities in the sample, the public sector probably provides broadband – including consumer-oriented services – because no one else does. In the largest communities, public sector involvement may be motivated more by the opposite problem, with the government attempting to minimize the impact on physical infrastructure (such as local roads and aerial wiring) in the presence of abundant private-sector competition. Alternatively or in addition, larger

Page 37 of 41
communities may be the ones more likely to have deployed fiber for internal utility and/or municipal use, positioning them to exploit scale and scope economies in making excess capacity available to other (primarily commercial) users with similar service needs.
Demographic data beyond size did not significantly deepen our insight into what motivated the communities in our sample to choose particular communications services (if any) to offer. To explore this question further, we are in the process of adding regressors to control for the range of communication service alternatives available and for differences in the form of community governance. Unfortunately, as with other studies of broadband deployment, this research is hampered by a lack of good data on the geographic dispersion of such demand-side factors as home-PC ownership and broadband adoption rates, or supply-side factors such as the pricing for broadband services. We plan surveys to help remedy such data deficiencies.
An area of particular interest for further research is the community’s choice of whether to offer retail services or concentrate on wholesale service provision, both in the business and consumer spaces. We are especially interested in understanding a community's decision to adopt an “open access" approach (i.e., provide basic platform services to multiple retail communication providers) as opposed to vertically integrating forward into retail services. To date, it appears that only four of 62 communities with operational consumer broadband service have adopted an open access framework (although several communities proposing to build fiber to the home have announced plans to adopt an open access model). It appears to be far more common for a municipal utility that serves consumers to integrate forward into retail services. Given that policy trends in several states seem to be pointing towards canonizing the wholesale-only model, it seems important to understand whether the apparently limited number of working examples of this model is a reflection of technical limitations of first generation systems, scale differences among communities, or idiosyncracies of the small number of communities involved (e.g., the community’s history in offering cable television service, or the existence of local private-sector partners willing to operate under the open access model). If local differences are found to be key in determining the viability of the wholesale-only model, this would suggest that decision authority regarding the choice of model should be local as well.
Another interesting question of particular relevance to state and federal universal service policies is the impact of local government efforts on private-sector incentives to provide infrastructure. For example, do municipal efforts to provide broadband serve as a substitute for private-sector services? Does the municipal broadband "crowd-out" private sector investment or does it serve as a spur?
A further area of inquiry relates to the choice of technology. For example, has the further development of wireless technologies such as WiFi and fixed wireless loop alternatives sufficiently reduced the cost of local infrastructure to the point where local governments now find it financially viable to offer infrastructure? Does the availability of wireless, with its lower impact on physical infrastructure (less need to dig up roads, etc.), make a
Page 38 of 41
larger group of communities – including those with no municipal electric utility – more likely to provide communications infrastructure in the public sector?
The roll-out of broadband services is very much a dynamic process. We should not be surprised to find that local government may play an early catalyst role in stimulating the development of infrastructure, but later, as the market matures, we may find private-sector carriers assuming the principal role for providing services. It is also possible that local governments may extend their role. For example, a utility that initially provides only internal communication services may use the experience and infrastructure as a platform for launching retail services. Finally, we expect local incentives to act to be heavily influenced by ongoing technical trends in wireless and fiber optic technologies that continue to make alternative infrastructure platforms more cost effective, and by the development of last mile competition. If cable and telephone duopoly competition turns out to be suitably robust, there may be little need for local governments to intervene; alternatively, if local competition is not adequate, this may provide an increased impetus for communities to self-provision.
In any case, better information regarding what local governments are doing to promote broadband and why they make the choices they do is critical to answering these and other important questions.

Page 39 of 41
References
American Public Power Association, 2002. “Public Power: Powering the 21st Century with Community Broadband Services.” http://www.appanet.org/pdfreq.cfm?PATH_INFO=/legislativeregulatory/industry/TelecomFactSheet5-03.pdf&VARACTION=GO
Analysys/TechNet, 2003. “The State Broadband Index: An Assessment of State Policies Impacting Broadband Deployment and Demand.” http://www.analysys.com/pdfs/technetbroadband.pdf
Barrett, Marianne, 1995. “Direct Competition in Cable Television Delivery: A Case Study of Paragould, Arkansas.” Journal of Media Economics 8(3), pp. 77-93.
Barrett, Marianne, 1996. “Strategic Behavior and Competition in Cable Television: Evidence From Two Overbuilt Markets.” Journal of Media Economics 9(2), pp. 43-62.
Blackwell, Gerry, 2002. “Fixed Wireless Business: Small Cities Serve Their Own.” ISP-Planet, June 25, http://www.isp-planet.com/fixed_wireless/business/2002/municipal.html
Clark, Kelly E. and Paul M.A. Baker, 2003. “Municipal Advanced Telecommunication Infrastructure Project (MuniTIP).” Georgia Center for Advanced Telecommunications Technology, Office of Technology Policy & Programs, OTP Policy Study No. 50103. http://www.gcatt.org/otp/papers/MuniTIP.pdf
Computer Science and Telecommunications Board (CSTB), 2002. Broadband: Bringing Home the Bits. National Academy Press.
Crandall, R. and C. Jackson, "The $500 Billion Opportunity: The Potential Economic Benefit of Widespread Diffusion of Broadband Internet Access," mimeo, Criterion Economics, Washington, DC, July 2001.
Emmons, William M. III and Robin A. Prager, 1997. “The effects of market structure and ownership on prices and service offerings in the U.S. cable television industry.” Rand Journal of Economics 28(4), pp. 732-750.
Federal Communications Commission, 2003. “High-Speed Services for Internet Access: Status as of December 31, 2002.” Industry Analysis and Technology Division, Wireline Competition Bureau. http://www.fcc.gov/Bureaus/Common_Carrier/Reports/FCC-State_Link/IAD/hspd0603.pdf
Gabel, David and Guang-lih (Kenneth) Huang, “Promoting Innovation: The Impact of Local Competition and Regulation on Deployment of Advanced Telecommunications Services for Businesses.” (forthcoming, available at http://itc.mit.edu).
Gillett, Sharon, 2001. “Berkshire Connect: A Case Study of Demand Aggregation.” http://itc.mit.edu/itel/docs/2001/Berkshire_Connect.pdf

Page 40 of 41
Gillett, Sharon and William Lehr, "Availability of Broadband Internet Access: Empirical Evidence," paper presented to the Twenty-Seventh Annual Telecommunications Policy Research Conference, September 25-27, 1999, Alexandria, VA.
Glaeser, Edward L. “Public Ownership in the American City.” NBER Working Paper 8613, http://www.nber.org/papers/w8613
Government Technology, 2002. “Pennsylvania Targets Digital Divide.” http://www.govtech.net/news/news.phtml?docid=2002.12.09-33355
Johnson, Andrea, 1999. “A City Guide: Developing, Using, and Regulating Regional Telecommunications Networks under the Telecommunications Act of 1996.” In Deborah Hurley and James H. Keller, eds., The First 100 Feet: Options for Internet and Broadband Access. MIT Press.
Jorgenson, Dale, "Information Technology and the U.S. Economy," American Economic Review, vol 91, no 1 (March 2001) 1-32.
Keil, Mark, Garret W. Meader, and Lynette Kvasny, 2003. “Bridging the Digital Divide: The Story of the Free Internet Initiative in LaGrange, Georgia.” HICSS.
Kvasny, Lynette and Mark Keil, 2002. “The Challenges of Redressing the Digital Divide: A Tale of Two Cities,” 23rd International Conference on Information Systems.
Laudeman, Greg, 1999. “Georgia's Small Town Telecomms: Approaches to Developing Community Information Infrastructure.” Journal of Municipal Telecommunications, Vol. 1 No. 2. http://munitelecom.org/v1i2/Laudeman.html
National Association of Regulatory Utility Commissioners (NARUC), 2002. “Promoting Broadband Access Through Public Rights-of-Way and Public Lands.” http://www.naruc.org/Committees/telecom/row.pdf
National Association of Telecommunications Officers and Advisors (NATOA), 2003. “Making Sure No Citizen is Left Behind: A Report on How Local Government is Promoting the Availability of Advanced Telecommunications Services to All Consumers.” Draft Report (available at www.natoa.org, and in summary form in Journal of Municipal Telecommunications Policy 11(3), Fall 2003, pp. 23-26.
National Telecommunications and Information Administration (NTIA), 2003. “50-State Survey of Rights-of-Way Statutes.”
Rizzuto, Ronald J. and Michael O. Wirth, 1998. Costs, Benefits, and Long-Term Sustainability of Municipal Cable Television Overbuilds. Denver, CO: GSA Press.
Rizzuto, Ronald J., 2002. "Municipal Telecommunication Overbuilds: The Track Record and New Incarnations", Feb 28 2002 presentation at Great Lakes Cable Expo, Indianapolis.

Page 41 of 41
Savas, E.S., 2000. Privatization and Public-Private Partnership.,” Chatham House, Seven Bridges Press.
Strover, Sharon and Lon Berquist, 2001. “Developing Telecommunications Infrastructure: State and Local Policy Collisions” in Benjamin M. Compaine and Shane Greenstein, eds., Communications Policy in Transition: The Internet and Beyond, MIT Press, pp. 221-240.
Tuerck, David G., Jonathan Haughton, James P. Angelini, and John S. Barrett, 2001. Cashing in on Cable: Warning Flags for Local Government, The Beacon Hill Institute at Suffolk University (available at: http://www.beaconhill.org/BHIStudies/BHIcablestudy103001.pdf )
Youtie, Jan, 1999. “West Georgia Telecommunications Alliance: Carrollton, Georgia.” http://www.ceds.gatech.edu/bestpractices/cases/wgta.htm
Youtie, Jan, Philip Shapira, and Greg Laudeman, "Transitioning to a Knowledge Economy: the LaGrange Internet TV Initiative," paper presented to Telecommunications Policy Research Conference, Alexandria, VA, October 2002 (available at: http://intel.si.umich.edu/tprc/papers/2002/100/LGIAI-TPRC-2002.pdf).