APPENDIX H - Whitehaven Coal
87
Environmental Assessment Tarrawonga Coal Project Tarrawonga Coal Pty Ltd ROAD TRANSPORT ASSESSMENT APPENDIX H
-
Upload
khangminh22 -
Category
Documents
-
view
0 -
download
0
Transcript of APPENDIX H - Whitehaven Coal

Environmental
AssessmentTarrawonga Coal Project
Tarrawonga Coal Pty Ltd
RO
AD
TR
AN
SP
OR
T
AS
SE
SS
ME
NT
AP
PE
ND
IX H
ROAD TRANSPORT
ASSESSMENTAPPENDIX H

Tarrawonga Coal Project
Road Transport Assessment
24 October 2011
Prepared for
Tarrawonga Coal Pty Ltd
Halcrow Suite 20, 809 Pacific Highway, Chatswood, NSW 2067 Australia Tel +61 2 9410 4100 Fax +61 2 9410 4199 www.halcrow.com/australasia Halcrow has prepared this report in accordance with the instructions of Tarrawonga Coal Pty Ltd for their sole and specific use. Any other persons who use any information contained herein do so at their own risk.
© Halcrow Pacific Pty Ltd, 2011
Tarrawonga Coal Project Road Transport Assessment Prepared for
Tarrawonga Coal Pty Ltd This report has been issued and amended as follows:
Rev Description Date Prepared by Approved by
0 Draft for internal review 25/05/2011 PJD KJH 1 Preliminary draft for client review 26/05/2011 PJD KJH 2 Draft for revised Project scope 17/06/2011 PJD KJH 3 Draft for revised scope and RTA DGR issues 02/08/2011 PJD KJH 4 Draft for client review 11/08/2011 PJD KJH 5 Revised draft for client review 19/08/2011 PJD KJH 6 Amended Project details 16/09/2011 PJD KJH 7 Revised draft for review 21/09/2011 PJD KJH 8 Final Draft 12/10/2011 PJD KJH 9 Final 24/10/2011 PJD KJH
Doc: 00413540.doc
Final, 24 October 2011 i
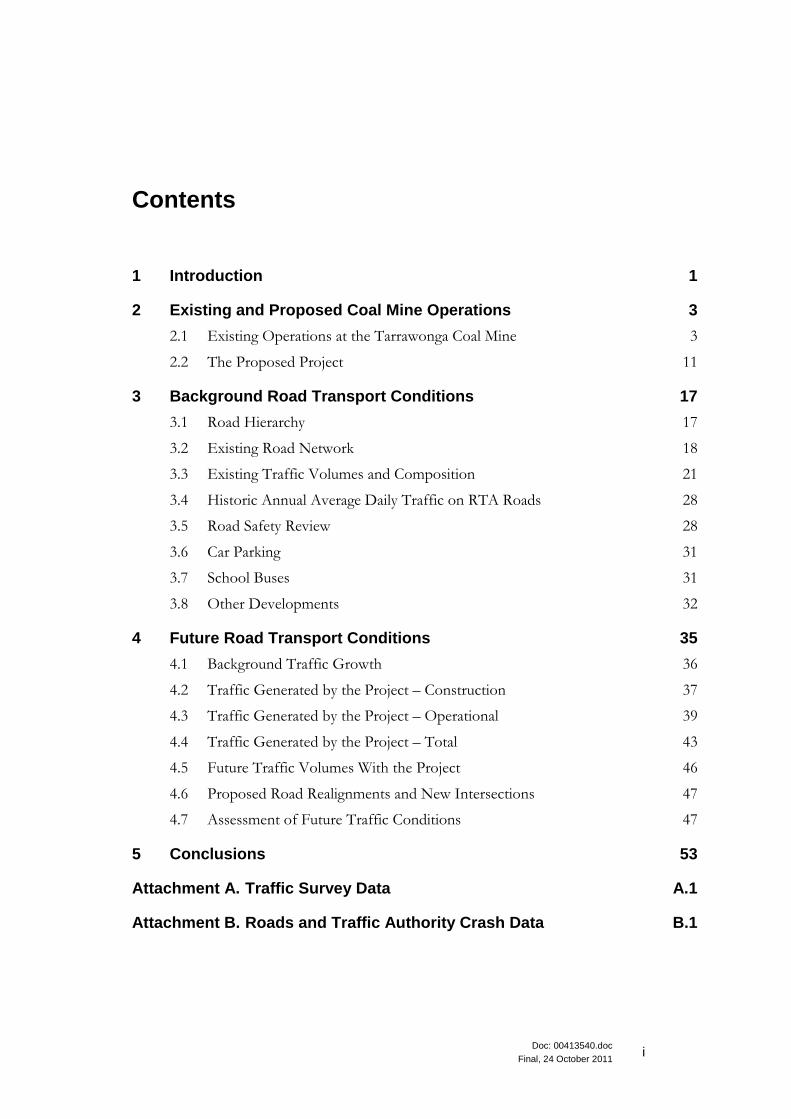
Contents
1 Introduction 1
2 Existing and Proposed Coal Mine Operations 3
2.1 Existing Operations at the Tarrawonga Coal Mine 3
2.2 The Proposed Project 11
3 Background Road Transport Conditions 17
3.1 Road Hierarchy 17
3.2 Existing Road Network 18
3.3 Existing Traffic Volumes and Composition 21
3.4 Historic Annual Average Daily Traffic on RTA Roads 28
3.5 Road Safety Review 28
3.6 Car Parking 31
3.7 School Buses 31
3.8 Other Developments 32
4 Future Road Transport Conditions 35
4.1 Background Traffic Growth 36
4.2 Traffic Generated by the Project – Construction 37
4.3 Traffic Generated by the Project – Operational 39
4.4 Traffic Generated by the Project – Total 43
4.5 Future Traffic Volumes With the Project 46
4.6 Proposed Road Realignments and New Intersections 47
4.7 Assessment of Future Traffic Conditions 47
5 Conclusions 53
Attachment A. Traffic Survey Data A.1
Attachment B. Roads and Traffic Authority Crash Data B.1

Doc: 00413540.doc
Final, 24 October 2011 ii
List of Tables
Table 2.1 – Distribution of Employee Trips to and from TCM (percent) 6
Table 2.2 – Average Weekday Traffic Generated by TCM in 2010 (vehicles/day) 10
Table 3.1 – Surveyed Daily Two Way Traffic Volumes (vehicles/day) 22
Table 3.2 – Surveyed Average Weekday Peak Hour Two Way Traffic (vehicles/hour) 23
Table 3.3 – Average Weekday Traffic Composition 24
Table 3.4 – Level of Service Criteria for Two Lane Highways 26
Table 3.5 – Average Weekday TCM and Non-TCM Traffic (vehicles/day) 27
Table 3.6 – Historic Annual Average Daily Traffic Data (1992 to 2005) 28
Table 3.7 – Crashes on TCM Related Roads (1 Oct 2005 - 30 Sep 2010) 30
Table 4.1 – Average Weekday Non-TCM Daily Traffic (vehicles/day) 36
Table 4.2 – Average Daily Project Construction Traffic Year 1 (2013) (vehicles/day) 38
Table 4.3 – Average Daily Project Additional Traffic Generation Year 1 (2013) (vehicles/day) 44
Table 4.4 – Average Daily Project Additional Traffic Generation Year 4 (2016) and Year 17 (2029) (vehicles/day) 45
Table 4.5 – Average Weekday Daily Traffic With Project (vehicles/day) 46
List of Figures
Figure 1 – Local Road Network and Traffic Survey Locations
Figure 2 – Project General Arrangement
Figure 3 – New Mine Facilities Area
Doc: 00413540.doc
Final, 24 October 2011 iii
References
Austroads (2004) Vehicle Classification System. Austroads (2009) Guide to Traffic Management Part 3: Traffic Studies and Analysis.
Hansen Bailey (2010) Maules Creek Coal Project Preliminary Environmental Assessment.
Hyder Consulting (2010) Maules Creek Project Traffic and Transport Impact Assessment.
PAEHolmes (2011) Air Quality and Greenhouse Gas Assessment.
Parsons Brinkerhoff (2010) Continuation of Boggabri Coal Mine Traffic Impact Assessment.
Roads and Traffic Authority (1996) Road Design Guide.
Roads and Traffic Authority (2002) Guide to Traffic Generating Developments.
Roads and Traffic Authority (2007) Operating Conditions: specific permits for oversize and over-mass vehicles and loads.
Tarrawonga Coal Pty Ltd (2005), R.W. Corkery & Co Pty Ltd on behalf of East Boggabri Coal Pty Ltd Transport Route Construction Management Plan for the East Boggabri Coal Mine.
Tarrawonga Coal Pty Ltd (2010) Annual Environmental Management Report for the Tarrawonga Coal Mine (ML 1579) 01 May 2009 – 30 April 2010.
Traffic Authority of NSW (1978) Functional Classification of Roads.
Transportation Research Board (2000) Highway Capacity Manual. Wilkinson Murray (2011) Noise and Blasting Impact Assessment.
Doc: 00413540.doc
Final, 24 October 2011 1
1 Introduction
This report has been prepared on behalf of Tarrawonga Coal Pty Ltd (TCPL) to present the results of an assessment of the road transport implications of a proposal to continue and extend operations at the Tarrawonga Coal Mine (TCM) and to increase annual run-of-mine (ROM) coal production from 2.0 million tonnes per annum (Mtpa) up to 3.0Mtpa. The proposed development is known as the Tarrawonga Coal Project (the Project). This study has been undertaken with reference to the road transport components of the Director General’s environmental assessment requirements for this Project, which require:
Traffic and Transport – including: - accurate predictions of the road and rail (if any) traffic of the project; - a detailed assessment of the potential impacts of this traffic on the capacity, efficiency and
safety of the road (and if necessary rail) network; and - plans of the proposed road re-alignments;
The rail components of the Director General’s environmental assessment requirements are addressed separately in the Main Report of the Environmental Assessment and in the Noise and Blasting Impact Assessment (Wilkinson Murray, 2011) presented in Appendix C of the Environmental Assessment. In addition, the issues raised by the New South Wales Roads and Traffic Authority (RTA) in their letter to the Department of Planning (dated 11 April 2011) have been considered and addressed during the preparation of this assessment. The assessment has been prepared in accordance with the Guide to Traffic Generating Developments (RTA, 2002), and where relevant, makes reference to the RTA’s (1996) Road Design Guide and Austroads standards.

Introduction
Doc: 00413540.doc
Final, 24 October 2011 2
An appreciation of the existing traffic situation around the TCM can be gained by examining the existing road network, traffic volumes on the existing road network, traffic generated by the existing transport activity at the TCM, observed growth in background traffic, and safety aspects of the road system. These aspects are discussed in this report, along with potential impacts from the Project. The remainder of the report is set out as follows: • Section 2 describes the existing and proposed operating characteristics of the TCM. • Section 3 describes the existing road transport conditions on the road system
around the TCM. • Section 4 assesses the potential impacts of the Project including consideration of the
Project in the context of cumulative traffic growth. • Section 5 presents the conclusions of the investigation.

Doc: 00413540.doc
Final, 24 October 2011 3
2 Existing and Proposed Coal Mine Operations
2.1 Existing Operations at the Tarrawonga Coal Mine The TCM is owned and operated by TCPL, which is a joint venture between Whitehaven Coal Mining Pty Ltd (Whitehaven) (70% interest) and Boggabri Coal Pty Ltd (a wholly-owned subsidiary of Idemitsu Australia Resources Pty Ltd) (30% interest). It is located approximately 15 kilometres (km) north-east of Boggabri and 42km north-northwest of Gunnedah in New South Wales. The location of the TCM in its regional context is shown on Figure 1 of this report. Vehicular site access to the TCM is via Goonbri Road as shown in Figure 1. Conventional open cut truck and shovel mining methods are used at the TCM. Open cut mining and material handling at the TCM is currently undertaken during the following approved hours of operation: • Monday to Friday from 7.00am to 3.30am the following morning (i.e. 20.5 hours per
24 hour period); and • Saturday from 7.00am to 6.00pm. ROM coal is crushed and screened on-site and then transported via the approved ROM coal road transport route (haul route) (refer to Figure 1) to the Whitehaven Coal Handling and Preparation Plant (CHPP), which is located approximately 35km to the south on the outskirts of Gunnedah. At the CHPP, the sized ROM coal is further crushed, screened and washed or bypassed before being loaded onto trains for despatch and sale. Sized ROM coal despatch from the TCM occurs between 7.00am and 9.15pm Monday to Friday, and 7.00am and 5.15pm Saturdays, excluding public holidays. The approved haul route between the TCM and the CHPP (refer to Figure 1) includes a combination of public and private roads and provides the shortest and least trafficked route between the TCM and the CHPP. The haul route was constructed in 2006 in accordance with the approved Transport Route Construction Management Plan for the East Boggabri Coal Mine (TCPL, 2005).


Existing and Proposed Coal Mine Operations
Doc: 00413540.doc
Final, 24 October 2011 5
The TCM is located within Narrabri Shire Council, about 10km north of its boundary with Gunnedah Shire Council. The haul route from the TCM to the CHPP includes sections in the Narrabri Shire Council and Gunnedah Shire Council areas. TCPL and Whitehaven have entered into road maintenance agreements with the Narrabri Shire Council and Gunnedah Shire Council. The road maintenance agreement with Narrabri Shire Council covers the section of the haul route within the Narrabri Shire, and requires the road and intersections to be maintained in good condition at all times at TCPL’s cost. Maintenance requirements are determined through joint inspections carried out every four months. The road maintenance agreement with Gunnedah Shire Council covers the maintenance of roads used by Whitehaven in association with the TCM as well as other Whitehaven mines and facilities in the region, e.g., the CHPP at Gunnedah, Canyon Coal Mine (under closure), and Rocglen Coal Mine. Under this agreement, Whitehaven is required to pay 95% of road maintenance costs incurred by Gunnedah Shire Council for Hoad Lane and Blue Vale Road. The maintenance requirements are determined through an annual joint inspection.
2.1.1 Workforce The existing TCM workforce of 86 full time on-site personnel, including on-site contractors, functions on a shift basis, as follows: • 6.30am to 6.30pm – 24% of total workforce; • 7.00am to 5.00pm – 38% of total workforce; and • 4.30pm to 2.30am – 38% of total workforce. Employees travel to and from the TCM by car, and TCPL has advised a typical occupancy of 1.2 employees per vehicle. The 86 employees arriving and leaving at the start and end of shifts would thus typically generate some 144 light vehicle trips per day (vehicle trips/day). A trip is a one way movement, so an employee’s vehicle arriving and departing generates two vehicle trips.

Existing and Proposed Coal Mine Operations
Doc: 00413540.doc
Final, 24 October 2011 6
The workforce is primarily drawn from the local area around Gunnedah, Boggabri, Manilla and Narrabri. TCPL has provided the following information on the distribution of the source of the existing employees at the TCM, based on a survey conducted in December 2010: • Gunnedah 54%; • Boggabri 21%; • Narrabri 13%; • Manilla 9%; and • Other 3%. The survey identified the approach and departure routes used by employees travelling to and from the TCM, which are summarised in Table 2.1. Table 2.1 – Distribution of Employee Trips to and from TCM (percent)
Source and Route Approach to TCM
Depart from TCM
Gunnedah Haul Route 54% 54% Boggabri Kamilaroi Hwy-Rangari Rd-Leards Forest Rd-Goonbri Rd 5% 5% Kamilaroi Hwy-Rangari Rd-Haul Route 10% 7% Braymont Rd-Barbers Lagoon Rd-Rangari Rd-Haul Route 6% 6% Braymont Rd-Barbers Lagoon Rd-Rangari Rd-Leards Forest Rd-Goonbri Rd 0% 3% Manilla Rangari Rd-Haul Route 9% 9% Narrabri Kamilaroi Hwy-Rangari Rd-Haul Route 6% 6% Kamilaroi Hwy-Rangari Rd-Leards Forest Rd-Goonbri Rd 7% 7% Other Goonbri Rd 1% 1% Dripping Rock Rd 1% 1% Rangari Rd-Haul Route 1% 1% Total 100% 100%
Existing and Proposed Coal Mine Operations
Doc: 00413540.doc
Final, 24 October 2011 7
2.1.2 Deliveries and Visitors A review of the site log book for a typical week in late 2010 indicates that there were 233 deliveries and visitors during the week, of which 15% (35 deliveries) were made by heavy vehicles. Over the week, deliveries and visitors therefore generated some 396 light vehicle trips and 70 heavy vehicle trips. The heavy vehicles include rigid trucks, semi-trailers and B-doubles. Deliveries and visitor trips are spread evenly throughout the day, generally between 6.00am and 6.00pm, and generally approach and depart the TCM from and to the following locations: • Gunnedah 80%; • Boggabri 10%; and • Narrabri 10%. Delivery and visitor vehicles to and from Gunnedah would use the haul route, while those travelling to and from Boggabri and Narrabri are assumed to use Kamilaroi Highway, Rangari Road and the haul route to access the TCM. It is conservatively estimated that 20% of delivery and visitor trips may occur on the average weekday. In reality, these would be spread throughout the week, including Saturdays, with day-to-day random variations.
2.1.3 Sized ROM Coal Haulage The TCM produces sized ROM coal that is transported by a haulage contractor utilising a fleet of on-highway haulage trucks (e.g. B-Doubles) from the TCM to the CHPP for export. In addition, domestic specification coal is collected from the TCM by domestic customers. The maximum transport rate for sized ROM coal is 2Mtpa, and for domestic specification coal is 450,000 tonnes per annum [tpa]. The maximum amount of ROM coal produced from the TCM is 2Mtpa however, so the combined maximum ROM coal transport rate is 2Mtpa. As noted in Section 2.1, sized ROM coal is transported by road from the TCM to the CHPP, making use of an approved haul route (refer to Figure 1), which is a combination of public and private roads.
Existing and Proposed Coal Mine Operations
Doc: 00413540.doc
Final, 24 October 2011 8
During the 2009-2010 Annual Environmental Management Report reporting period, i.e., April 2009 to May 2010, sized ROM coal production at the TCM was 1.69 million tonnes (Mt), and sized ROM coal haulage generated an average of 132 trucks per coal haulage day, or 264 truck trips per coal haulage day (TCPL, 2010). On a pro-rata basis, the existing maximum production of 2Mtpa would be expected to generate 156 trucks per coal haulage day, or 312 truck trips per coal haulage day. This is verified by data collected at the TCM over one week from 30 November to 6 December 2010, which shows that 940 trucks were despatched from the TCM over that week. This is equivalent to an average of 157 trucks per coal haulage day during that week. Sized ROM coal despatch occurs between 7.00am and 9.15pm Monday to Friday, and 7.00am and 5.15pm Saturdays (excluding public holidays), and is spread evenly over these periods. It is noted that the last load is despatched from the TCM at 9.15pm Monday to Friday and at 5.15pm on Saturdays. These trucks arrive at the CHPP by 10.00pm Monday to Friday and by 6.00pm Saturdays.
2.1.4 Domestic Specification Coal Haulage Domestic specification coal is sold direct from the TCM to customers, who arrange collection from the site. At the maximum transport rate for domestic specification coal, i.e., 450,000tpa, 36 trucks collect coal from the TCM per coal haulage day. This generates some 72 truck trips on the road network. During 2010, domestic specification coal despatch was much lower than 450,000tpa and it is estimated that an average of seven trucks per coal haulage day collected coal from the TCM, generating 14 truck trips per coal haulage day on the road network. These trucks depart evenly between 7.00am and 9.15pm Monday to Friday, and between 7.00am and 5.15pm on Saturdays (excluding public holidays). The key destinations for this coal are typically: • Sydney 36%; • Tamworth 35%; • Gunnedah 16%; and • Narrabri 13%.

Existing and Proposed Coal Mine Operations
Doc: 00413540.doc
Final, 24 October 2011 9
Trucks collecting domestic specification coal use the approved haul route when arriving at and departing from the TCM. It is noted that although the vehicle movements associated with the collection of domestic specification coal are related to the TCM, they are not operated by TCPL or TCPL contractors. Therefore, these trucks do not form part of the TCPL’s operations.
2.1.5 Total TCM Traffic Generation and Distribution Based upon the typical weekly and daily traffic characteristics described above, the typical average daily traffic generation of the TCM and its distribution on the surrounding road network is summarised in Table 2.2. Table 2.2 demonstrates that the traffic generated by the TCM is generally concentrated along the haul route between the TCM and the CHPP, with TCM daily volumes on other roads in the surrounding region being very low, at up to about 60 vehicles per day. Heavy vehicles associated with the TCM are concentrated on the haul route.

Existing and Proposed Coal Mine Operations
Doc: 00413540.doc
Final, 24 October 2011 10
Table 2.2 – Average Weekday Traffic Generated by TCM in 2010 (vehicles/day)
SiteA Road and Location Employees Delivery and Visitor
Sized ROM Coal
Domestic Specification
CoalB Total
Percent Heavy Vehicle
Haul Route 1 TCM Access Rd 144 94 312 14 564 60.3% 2 Haul Route south of Goonbri Rd 121 94 312 14 541 62.9% 3 Blue Vale Rd south of Shannon Harbour Rd 78 76 312 14 480 70.3% 4 Blue Vale Rd northeast of Kamilaroi Hwy 78 76 312 14 480 70.3% 5 Kamilaroi Hwy btwn Blue Vale Rd and CHPP 78 76 312 12 478 70.2% 6 CHPP Access Rd 0 0 312 0 312 100.0%
Other Locations 7 Dripping Rock Rd east of Goonbri Rd 2 0 0 0 2 0.0% 8 Goonbri Rd east of Leards Forest Rd 20 0 0 0 20 0.0% 9 Leards Forest Rd north of Goonbri Rd 0 0 0 0 0 0.0%
10 Barbers Lagoon Rd south of Rangari Rd 10 0 0 0 10 0.0% 11 Rangari Rd east of Haul Route 12 0 0 0 12 0.0% 12 Rangari Rd west of Haul Route 30 18 0 0 48 5.6% 13 Rangari Rd east of Kamilaroi Hwy 38 18 0 0 56 4.8% 14 Therribri Rd north of Rangari Rd 0 0 0 0 0 0.0% 15 Shannon Harbour Rd east of Blue Vale Rd 0 0 0 0 0 0.0% 16 Kamilaroi Hwy south of Rangari Rd 20 10 0 2 32 10.9% 17 Braymont Rd at Namoi River Bridge 10 0 0 0 10 0.0% 18 Kamilaroi Hwy north of Blue Vale Rd 0 0 0 2 2 100.0%
A Refer to Figure 1; B Not operated by TCPL or TCPL contractors

Existing and Proposed Coal Mine Operations
Doc: 00413540.doc
Final, 24 October 2011 11
2.2 The Proposed Project 2.2.1 Project Description
The main activities associated with the development of the Project would include (refer to Figure 2): • continued development of mining operations in the Maules Creek Formation to
facilitate a Project ROM coal production rate of up to 3Mtpa, including open cut extensions: o to the east within Mining Lease (ML) 1579 and Mining Lease Application
(MLA) 2; and o to the north within Coal Lease (CL) 368 (MLA 3) which adjoins ML 1579;
• ongoing exploration activities; • construction and use of a services corridor (including haul road link) directly from
the Project open cut mining operation to the upgraded Boggabri Coal Mine Infrastructure Facilities1;
• use of upgraded Boggabri Coal Mine Infrastructure Facilities for the handling and processing of Project coal and the loading of Project product coal to trains for transport on the Boggabri Coal Mine private rail spur to the Werris Creek Mungindi Railway1;
• construction and use of a new mine facilities area including relocation of existing mine facilities infrastructure and service facilities;
• use of an existing on-site mobile crusher for coal crushing and screening of up to 150,000 tonnes (t) of domestic specification coal per annum for direct collection by customers at the mine site;
• use an existing on-site mobile crusher to produce up to approximately 90,000 cubic metres (m³) of gravel materials per annum for direct collection by customers at the mine site;
• progressive backfilling of the mine void behind the advancing open cut mining operation with waste rock and minor quantities of coarse reject material;
• continued and expanded placement of waste rock in the Northern Emplacement (including integration with the Boggabri Coal Mine emplacement) and Southern Emplacement, as mining develops;
1 Subject to approvals and upgrades being in place for the transfer of Project ROM coal to the Boggabri Coal Mine
Infrastructure Facilities.


Doc: 00413540.doc
Final, 24 October 2011 13
• progressive development of new haul roads and internal roads, as mining develops; • realignment of sections of Goonbri Road and construction of new intersections; • construction of an engineered low permeability barrier to the east and south-east of
the open cut to reduce the potential for local drainage of alluvial groundwater into the open cut;
• removal of a section of Goonbri Creek within the Project open cut and the establishment of a permanent Goonbri Creek alignment and associated flood bund to the east and south-east of the open cut;
• progressive development of sediment basins and storage dams, pumps, pipelines and other water management equipment and structures;
• continued development of soil stockpiles, laydown areas and gravel/borrow areas; • ongoing monitoring and rehabilitation; and • other associated minor infrastructure, plant, equipment and activities. An indicative layout of the new mine facilities area, including the internal road network and parking facilities, is shown on Figure 3. The proposed life of the Project is 17 years, commencing 1 January 2013.
2.2.2 Road Transport Aspects of the Project Key aspects of the Project which relate directly to potential impacts on the road transport network are summarised below. Life of Mine • The overall life of the mine would be extended to approximately 2029. Materials Haulage • Transport of up to 2Mtpa of sized ROM coal from the TCM to the CHPP for
export, utilising the approved haul route prior to suitable approvals and upgrades being in place for the transfer of Project ROM coal to the Boggabri Coal Mine Infrastructure Facilities (expected to occur during Project Year 1).


Doc: 00413540.doc
Final, 24 October 2011 15
• Reduction in the maximum amount of domestic specification coal collected from the TCM by domestic customers from 450,000tpa to 150,000tpa, utilising the haul route from Gunnedah or via Kamilaroi Highway, Rangari Road and the haul route from Boggabri and surrounding areas.
• No change to sized ROM or domestic specification coal haulage despatch hours, i.e., between 7.00am and 9.15pm Monday to Friday and between 7.00am and 5.15pm on Saturdays, excluding public holidays.
• Transport of sized ROM coal from the TCM to the Boggabri Coal Mine via an internal haul road link after suitable approvals and upgrades are in place for the transfer of Project ROM coal to the Boggabri Coal Mine Infrastructure Facilities (expected to occur during Project Year 1).
• Collection of 90,000m3 of crushed gravel per annum from the TCM by customers, utilising the haul route from Gunnedah or via Kamilaroi Highway, Rangari Road and the haul route from Boggabri and surrounding areas.
• Gravel collection would occur between 7.00am and 9.15pm Monday to Friday and between 7.00am and 5.15pm on Saturdays, excluding public holidays.
• The maximum combined transport rate for sized ROM coal, domestic specification coal and gravel would not exceed 2Mtpa.
• Short-term transport of fill material (bentonite) would be required for the construction of the low permeability barrier for three months during Project Year 12.
• Fill material (bentonite) deliveries would occur between 6.00am and 6.00pm Monday to Friday and between 7.00am and 5.15pm on Saturdays, excluding public holidays.
Workforce • Increase in light vehicle traffic generation as a direct result of the increase in
employees from 86 to 120 full time on-site personnel. • Modifications to shift arrangements to accommodate 24 hour operations. Nominal
shift start and finish times at full development would be as follows: o Administration personnel – 7.00am to 5.00pm weekdays; o Mining Operations Day Personnel – 6.30am to 7.00pm; and o Mining Operations Night Personnel – 6.30pm to 7.00am.

Doc: 00413540.doc
Final, 24 October 2011 16
• Increase in light vehicle traffic generation associated with the construction workforce, which would comprise 20 additional personnel, for the construction and development activities required during the life of the Project.
Deliveries and Visitors • Increase in deliveries of materials and consumables and visitors associated with the
construction and development activities required during the life of the Project. • Increase in deliveries of consumables and visitors directly resulting from increased
ROM coal production and on-site activity. • No change to deliveries and visitor hours, i.e., generally between 6.00am and 6.00pm
daily. Road System • Realignment of sections of Goonbri Road and construction of new intersections.
Background Road Transport Conditions
Doc: 00413540.doc
Final, 24 October 2011 17
3 Background Road Transport Conditions
An appreciation of the existing road transport conditions can be gained by examining the road network, existing traffic volumes, past growth in traffic volumes, and the safety history of the locality. These aspects are discussed below.
3.1 Road Hierarchy It is usual to classify roads according to a road hierarchy, in order to determine their functional role within the road network. Changes to traffic flows on the roads can then be assessed within the context of the road hierarchy. Roads are classified according to the role they fulfil and the volume of traffic they should appropriately carry given their classification. There are various classification systems used by local authorities and the RTA. The Traffic Authority of NSW (1978) has set down the following guidelines for the functional classification of roads: • Arterial Road – typically a main road carrying over 15,000 vehicles per day
(vehicles/day) and fulfilling a role as a major inter-regional link (over 1,500 vehicles per hour [vehicles/hour]).
• Sub-arterial Road – defined as secondary inter-regional links, typically carrying volumes between 5,000 and 20,000 vehicles/day (500 to 2,000 vehicles/hour).
• Collector Road – provides a link between local roads and regional roads, typically carrying between 2,000 and 10,000 vehicles/day (250 to 1,000 vehicles/hour). At volumes greater than 5,000 vehicles/day, residential amenity begins to decline noticeably.
• Local Road – provides access to individual allotments, carrying low volumes, typically less than 2,000 vehicles/day (250 vehicles/hour).

Doc: 00413540.doc
Final, 24 October 2011 18
In recent years the RTA has adopted a classification system relating to funding purposes. It defines roads as: • State Roads – performing an important state function for which the RTA funds
100% of the maintenance cost. State roads are essentially arterial roads, and include Freeways, State Highways, and many Main Roads.
• Regional Roads – roads performing a significant regional function and for which the RTA and Council contribute 50% each towards maintenance. Regional roads are essentially sub-arterial roads, and include some lesser Main Roads.
• Local Roads – roads performing a local or collector function and for which the Council funds 100% of the maintenance cost.
3.2 Existing Road Network
The existing road network in the vicinity of the TCM is shown in Figure 1 and is described below. Kamilaroi Highway (State Highway 29) is a State Road which runs generally north-south to the west of the TCM, and provides a link between the upper Hunter region and the north-west of NSW, providing access to regional centres such as Gunnedah, Boggabri, Narrabri and Bourke. In the vicinity of the TCM, Kamilaroi Highway has a single travel lane in each direction, with auxiliary turn lanes at some intersections, and a posted speed limit of 100 kilometres per hour (km/hr). At the Kamilaroi Highway intersection with Rangari Road, Kamilaroi Highway is widened to provide a separate right turn lane and a left turn deceleration lane. The Kamilaroi Highway intersection with Blue Vale Road, Kamilaroi Highway has separate deceleration and acceleration lanes to accommodate the slower moving coal trucks on the haul route with minimum disruption to the through traffic.

Doc: 00413540.doc
Final, 24 October 2011 19
Rangari Road (Main Road 357) is a Regional Road which runs approximately east-west to the south of the TCM, and links between Kamilaroi Highway to the west and Manilla to the east. Rangari Road typically has a single travel lane in each direction, and a posted speed limit of 80km/hr. Rangari Road crosses the Namoi River about 1.6km to the east of its intersection with Kamilaroi Highway. At this bridge, Rangari Road is narrowed to a single lane with a 10km/hr speed limit, and eastbound traffic is required to give way to westbound traffic. Traffic associated with the existing Boggabri Coal Mine uses Rangari Road to access Leards Forest Road. Rangari Road is also known as Boggabri-Manilla Road and Manilla Road. Goonbri Road is a local road that provides access to the TCM, and has a single travel lane in each direction. Aside from a short section near its intersection with Leards Forest Road, Goonbri Road is unsealed. Hoad Lane provides a local road connection northwards from Blue Vale Road at Braymont Road/Shannon Harbour Road to north of the Canyon Coal Mine (under closure), then an east-west connection to Braymont Road. A private road access to the Canyon Coal Mine intersects with Hoad Lane at a tee intersection. South of the Canyon Coal Mine access road, Hoad Lane has a sealed surface, with a single travel lane in each direction, and centre road markings along most of its length. A right turn deceleration lane is provided in Hoad Lane/Blue Vale Road for northbound vehicles turning right into Shannon Harbour Road. An acceleration lane is provided in Hoad Lane/Blue Vale Road for vehicles which have turned left into Hoad Lane/Blue Vale Road from Shannon Harbour Road. To the north of the Canyon Coal Mine access road, and to the east of Braymont Road, Hoad Lane has an unsealed surface. It is noted that the road traffic noise criteria for Hoad Lane in TCM Development Consent (DA 88-4-2005 MOD 1) are based on the collector road classification. Blue Vale Road is a local road that provides a north-south connection from Kamilaroi Highway to the north-west of Gunnedah to the intersection of Hoad Lane, Shannon Harbour Road and Braymont Road. At this intersection, Hoad Lane and Blue Vale Road form the main road, with Shannon Harbour Road and Braymont Road being staggered tee intersections. Blue Vale Road has a sealed surface with a single travel lane in each direction and centre line marking along much of its length.

Doc: 00413540.doc
Final, 24 October 2011 20
It is noted that the road traffic noise criteria for Blue Vale Road in the TCM Development Consent (DA 88-4-2005 MOD 1) are based on the collector road classification. Leards Forest Road is a local rural road with a single travel lane in each direction. It extends northwards from Rangari Road and connects to Harparary Road to the north. The Boggabri Coal Mine has its vehicular access off Leards Forest Road. Its intersection with Rangari Road is a give way controlled tee intersection with no additional turn lanes or deceleration lanes. It typically does not have road markings, and the northern section of Leards Forest Road between the Boggabri Coal Mine access road and Harparary Road has an unsealed gravel surface. Braymont Road provides a local road link from the township of Boggabri east and south-east to meet with Blue Vale Road some 20km north of the Gunnedah township. Braymont Road crosses the Namoi River via a bridge to the east of Boggabri. To the west of the river, Braymont Road has a sealed surface with a single travel lane in each direction, and to the east of the river, it has an unsealed surface, and follows a straight east-west alignment for about 6km, before a 90 degree bend where it intersects with Barbers Lagoon Road at a three way intersection. Between there and Blue Vale Road, it has an unsealed surface, with the exception of a short distance of sealed road on its approach to Blue Vale Road. Barbers Lagoon Road is a local road and extends in a north-south direction between Braymont Road in the south and Rangari Road in the north. The northernmost 700 metres (m) of Barbers Lagoon Road has a sealed surface, with a single travel lane in each direction and a marked centre line on its approach to Rangari Road. The remaining length of Barbers Lagoon Road has an unsealed surface and follows a reasonably straight north-south alignment, with the exception of a dog-leg about 1.2km north of Braymont Road.

Doc: 00413540.doc
Final, 24 October 2011 21
3.3 Existing Traffic Volumes and Composition 3.3.1 Traffic Surveys
Traffic survey data has been collated on roads around the TCM from surveys conducted by the Gunnedah Shire Council and TCPL. At each location, hourly traffic volumes were recorded by direction. At some locations, the classification of vehicles was also undertaken using the Austroads (2004) Vehicle Classification System, which is included in Attachment A. The majority of the surveys were conducted over one week from 30 November to 6 December 2010, with some exceptions. The locations of the traffic data collection are shown on Figure 1.
3.3.2 Surveyed Traffic Volumes The results of the traffic surveys are summarised in Table 3.1 and full results are presented in Attachment A. The surveys indicate that generally, weekday traffic volumes are the most significant, with Saturdays typically being busier than Sundays. The volume of traffic generated by the TCM is significantly higher on weekdays than on Saturdays or Sundays. Table 3.2 presents the average weekday peak hourly volume measured at each of the survey locations. The average weekday peak hourly volume is the maximum volume recorded in any one hour period throughout the day. The time of each peak volume is therefore not necessarily the same at each location, and at some locations, the peak volume occurred during more than one hour. The peak hour volumes are typically in the range of 8 to 12 percent of the daily volumes.

Doc: 00413540.doc
Final, 24 October 2011 22
Table 3.1 – Surveyed Daily Two Way Traffic Volumes (vehicles/day)
SiteA Road and Location Average Weekday Saturday Sunday
Haul Route 1 TCM Access Rd 564 287 51 2 Haul Route south of Goonbri Rd 540 278 70 3 Blue Vale Rd south of Shannon Harbour RdB 480 230 80 4 Blue Vale Rd northeast of Kamilaroi HwyC 1,515 997 145 5 Kamilaroi Hwy between Blue Vale Rd and CHPP 3,188 2,226 1,702 6 CHPP Access Rd 673 193 10 Other Locations
7 Dripping Rock Rd east of Goonbri Rd 21 4 3 8 Goonbri Rd east of Leards Forest Rd 57 27 24 9 Leards Forest Rd north of Goonbri Rd 311 99 112
10 Barbers Lagoon Rd south of Rangari Rd 51 37 40 11 Rangari Rd east of Haul Route 67 50 37 12 Rangari Rd west of Haul Route 637 344 132 13 Rangari Rd east of Kamilaroi Hwy 369 105 117 14 Therribri Rd north of Rangari Rd 62 49 59 15 Shannon Harbour Rd east of Blue Vale RdB 217 74 31 16 Kamilaroi Hwy south of Rangari Rd 2,028 1,391 1,325 17 Braymont Rd at Namoi River BridgeD 122 - - 18 Kamilaroi Hwy north of Blue Vale Rd 2,488 1,946 1,762
A Refer to Figure 1; B Survey 8-14 February 2011; C Survey 4-10 November 2010; D Data available for Tuesday to Friday only

Doc: 00413540.doc
Final, 24 October 2011 23
Table 3.2 – Surveyed Average Weekday Peak Hour Two Way Traffic (vehicles/hour)
SiteA Road and Location
Peak Hourly Volume
Percent of Daily
Volume Time of
Peak Hour
Haul Route 1 TCM Access Rd 65 11.5% 4pm-5pm 2 Haul Route south of Goonbri Rd 52 9.6% 4pm-5pm 3 Blue Vale Rd south of Shannon Harbour RdB 43 9.0% 6am-7am,
4pm-5pm 4 Blue Vale Rd northeast of Kamilaroi HwyC 114 7.5% 3pm-4pm 5 Kamilaroi Hwy between Blue Vale Rd and CHPP 244 7.7% 3pm-4pm 6 CHPP Access Rd 55 8.2% 12pm-1pm,
5pm-6pm Other Locations
7 Dripping Rock Rd east of Goonbri Rd 3 14.3% 5pm-6pm 8 Goonbri Rd east of Leards Forest Rd 8 14.0% 4pm-5pm 9 Leards Forest Rd north of Goonbri Rd 48 15.4% 5am-6am
10 Barbers Lagoon Rd south of Rangari Rd 5 9.8% 3pm-4pm, 5pm-6pm
11 Rangari Rd east of Haul Route 8 11.9% 6am-7am 12 Rangari Rd west of Haul Route 60 9.4% 4pm-5pm 13 Rangari Rd east of Kamilaroi Hwy 43 11.7% 5am-6am 14 Therribri Rd north of Rangari Rd 6 9.7% 1pm-2pm,
3pm-4pm 15 Shannon Harbour Rd east of Blue Vale RdB 18 8.3% 9am-10am 16 Kamilaroi Hwy south of Rangari Rd 154 7.6% 4pm-5pm 17 Braymont Rd at Namoi River BridgeD 15 12.3% 4pm-5pm,
5pm-6pm 18 Kamilaroi Hwy north of Blue Vale Rd 202 8.1% 4pm-5pm
A Refer to Figure 1; B Survey 8-14 February 2011; C Survey 4-10 November 2010; D Data available for Tuesday to Friday only
3.3.3 Traffic Composition The surveys described in Section 3.3.1 also provided data on the composition of traffic on the key roads. Light vehicles include motorcycles, cars, vans, 4WDs, and utes (including those towing a trailer or caravan). Heavy vehicles include single unit trucks and buses with two to four axles and articulated vehicles such as semi-trailers, rigid trucks with trailers and B Doubles. Table 3.3 summarises the composition of the traffic on the average weekday over the survey period.

Doc: 00413540.doc
Final, 24 October 2011 24
Table 3.3 – Average Weekday Traffic Composition Percent SiteA Road and Location
Light Heavy Haul Route 1 TCM Access Rd 37.2 62.8 2 Haul Route south of Goonbri Rd 30.9 69.1 3 Blue Vale Rd south of Shannon Harbour RdB 43.3 56.7 4 Blue Vale Rd northeast of Kamilaroi HwyC 61.2 38.8 5 Kamilaroi Hwy between Blue Vale Rd and CHPP 68.1 31.9 6 CHPP Access Rd 19.9 80.1 Other Locations 7 Dripping Rock Rd east of Goonbri Rd 66.7 33.3 8 Goonbri Rd east of Leards Forest Rd 88.3 11.7 9 Leards Forest Rd north of Goonbri Rd 93.0 7.0 10 Barbers Lagoon Rd south of Rangari Rd 90.2 9.8 11 Rangari Rd east of Haul Route 94.0 6.0 12 Rangari Rd west of Haul Route 47.7 52.3 13 Rangari Rd east of Kamilaroi Hwy 89.9 10.1 14 Therribri Rd north of Rangari Rd 94.8 5.2 15 Shannon Harbour Rd east of Blue Vale RdB 38.5 61.5 16 Kamilaroi Hwy south of Rangari Rd 81.2 18.8 17 Braymont Rd at Namoi River BridgeD 93.6 6.4 18 Kamilaroi Hwy north of Blue Vale Rd 45.1 54.9
A Refer to Figure 1, B Survey 8-14 February 2011; C Survey 4-10 November 2010; D Data available for Tuesday to Friday only The proportional contribution to total daily traffic varies significantly on the roads in the local region.
3.3.4 Roadway Capacity The Austroads (2009) Guide to Traffic Management Part 3: Traffic Studies and Analysis provides guidelines for the capacity of two lane, two way rural roads, which in turn, refers to the Highway Capacity Manual (Transportation Research Board, 2000), known as HCM 2000.
Doc: 00413540.doc
Final, 24 October 2011 25
The capacity of a road is defined as the maximum hourly rate at which vehicles can reasonably be expected to traverse a point or uniform section of a lane or roadway during a given time period under the prevailing roadway, traffic and control conditions. The capacity of a single traffic lane will be affected by factors such as the pavement width and restricted lateral clearances, the presence of heavy vehicles and grades. Level of Service (LOS) is defined as a qualitative measure describing the operational conditions within a traffic stream as perceived by drivers and/or passengers. A LOS definition generally describes these conditions in terms of factors such as speed and travel time, freedom to manoeuvre, traffic interruptions, comfort, convenience and safety. LOS A provides the best traffic conditions, with no restriction on desired travel speed or overtaking. LOS B to D describes progressively worse traffic conditions. LOS E occurs when traffic conditions are at or close to capacity, and there is virtually no freedom to select desired speeds or to manoeuvre in the traffic stream. The service flow rate for LOS E is taken as the capacity of a lane or roadway. HCM 2000 distinguishes between different categories of two lane two way roads, with Class I being roads on which motorists expect to travel at relatively high speeds. They most often serve long-distance trips or provide connecting links between facilities that serve long-distance trips. Class II roads are those on which motorists do not necessarily expect to travel at high speeds, and may function as access routes to Class I facilities, serve as scenic or recreational routes or pass through rugged terrain. The LOS for Class I roads is defined in terms of both percent-time-spent-following (PTSF) and average travel speed. On Class II roads, LOS is defined only in terms of PTSF. It is noted that the unsealed roads providing access for the TCM would have lower capacities than the typical Class II sealed roads addressed by the HCM assessment methods, however these are considered below as a guide to the current Levels of Service on these roads. Most arterial roads such as Kamilaroi Highway are considered to be Class I, however the primary determinant of a road’s classification for operational analysis is the drivers’ expectations, which may not necessarily agree with the functional classification. The PTSF is a measure of the level of opportunities to overtake. The LOS criteria for Class I and Class II two-lane highways are as shown in Table 3.4.

Doc: 00413540.doc
Final, 24 October 2011 26
Table 3.4 – Level of Service Criteria for Two Lane Highways Class I Highways Class II Highways
Level of Service Percent-Time-Spent-Following
Average Travel Speed (km/h)
Percent-Time-Spent-Following
A ≤ 35 > 90 ≤ 40 B > 35-50 > 80-90 > 40-55 C > 50-65 > 70-80 > 55-70 D > 65-80 > 60-70 > 70-85 E >80 ≤ 60 85
Source: Exhibit 20-2 and Exhibit 20-4, HCM 2000 HCM 2000 presents detailed methods for calculating the PTSF, however it also presents a basic relationship between traffic flow rate and PTSF for base conditions on a two way road. This indicates that below a two way peak hourly two way volume of around 650 vehicles per hour, the PTSF would typically be below 40 percent, and LOS would be A for Class II roads (refer to Table 3.4). Below a two way peak hourly volumes of around 550 vehicles per hour, the PTSF would typically be below 35 percent, and LOS would be A for Class I roads. Comparing this against the peak hourly volumes presented in Table 3.2, it is clear that the existing peak hourly volumes are well below 550 vehicles per hour on Kamilaroi Highway and below 650 vehicles per hour at all other surveyed sites. The LOS at each of the surveyed sites is therefore considered to be A. More detailed analysis is not considered warranted in this case, as the peak hourly volumes are so far below the volume threshold where poorer service levels would result, and the terrain and road geometry is unlikely to result in significant impacts on the free flow speeds on the routes.
3.3.5 TCM Traffic Generation The results of the traffic survey conducted on the TCM access road indicate that over the surveyed week, the TCM generated an average of 564 vehicles trips per weekday. This correlates with the expected average of 564 vehicles per weekday determined in Table 2.2 by considering the typical daily generation by different types of vehicles. Table 3.5 compares the surveyed average weekday traffic volumes on the surrounding road system with the calculated volume of traffic generated by the TCM at the same locations. From this, the volume of traffic with no association with the TCM is calculated.

Doc: 00413540.doc
Final, 24 October 2011 27
Table 3.5 – Average Weekday TCM and Non-TCM Traffic (vehicles/day)
SiteA Road and Location Surveyed Total Traffic
Calculated TCM
TrafficB
Calculated Non-TCM
TrafficC
Haul Route 1 TCM Access Rd 564 564 0 2 Haul Route south of Dripping Rock Rd 540 541 -1 3 Blue Vale Rd south of Shannon Harbour Rd 480 480 0 4 Blue Vale Rd northeast of Kamilaroi Hwy 1,515 480 1,035 5 Kamilaroi Hwy btwn Blue Vale Rd and CHPP 3,188 478 2,710 6 CHPP Access Rd 673 312 361 Other Locations 7 Dripping Rock Rd east of Goonbri Rd 21 2 19 8 Goonbri Rd east of Leards Forest Rd 57 20 37 9 Leards Forest Rd north of Goonbri Rd 311 0 311 10 Barbers Lagoon Rd south of Rangari Rd 51 10 41 11 Rangari Rd east of Haul Route 67 12 55 12 Rangari Rd west of Haul Route 637 48 589 13 Rangari Rd east of Kamilaroi Hwy 369 56 313 14 Therribri Rd north of Rangari Rd 62 0 62 15 Shannon Harbour Rd east of Blue Vale Rd 217 0 217 16 Kamilaroi Hwy south of Rangari Rd 2,028 32 1,996 17 Braymont Rd at Namoi River Bridge 122 10 112 18 Kamilaroi Hwy north of Blue Vale Rd 2,488 2 2,486
A Refer to Figure 1; B Refer to Table 2.2; C The negative value calculated is of no practical significance, and is considered to be zero in the analysis which follows. Table 3.5 indicates that with the exception of on the haul route itself, the TCM-generated traffic volume is low on surrounding roads, and generally makes only a minor contribution to total traffic volumes. Background non-TCM traffic on the haul route is typically very low, with the exception of the southern end of the haul route, on Kamilaroi Highway and Blue Vale Road close to Gunnedah township, i.e. Sites 4 and 5 on Figure 1.

Doc: 00413540.doc
Final, 24 October 2011 28
3.4 Historic Annual Average Daily Traffic on RTA Roads The RTA publishes traffic volume data at selected locations on its roads. Available data on roads in the vicinity of the TCM was collated. Table 3.6 presents historic annual average daily traffic (AADT) data for the RTA’s surveyed locations in the local area, and shows how changes in daily traffic volumes have occurred on these roads over that period. It should be noted that the AADT represents the average number of axle pairs (rather than vehicles) passing in both directions during a 24 hour period, estimated over a period of one year. Table 3.6 – Historic Annual Average Daily Traffic Data (1992 to 2005)
Location 1992 1996 1999 2002 2005 Average
Change per Year
Kamilaroi Highway SH29 92.227 11km West of SH17 Newell Hwy 1,636 1,623 - - - -3 92.289 5km South of SH17 Newell Hwy 1,750 1,903 2,309 2,240 - 49 92.293 South of MR357 Rangari Road 1,867 - 2,163 2,232 1,832 -3 Rangari Road MR357 92.168 East of MR72 Narrabri Rd 153 - 138 162 175 2 The historic AADT data indicates that while there have been some fluctuations recorded in the AADT, these have not resulted in significant increases or decreases in volumes over the relevant period. Table 3.6 demonstrates that the greatest average change over the period was recorded on Kamilaroi Highway south of Newell Highway, with an increase of around 50 axle pairs per year from 1992 to 2002.
3.5 Road Safety Review Validated crash data was obtained from the RTA for the most recent five year period available, being from 1 October 2005 to 30 September 2010. The data is presented in Attachment B.
Doc: 00413540.doc
Final, 24 October 2011 29
The data is based on crashes reported to the Police, and included the area approximately bounded by the Werris Creek – Mungindi Railway to the west, north to Baan Baa, east to Wean Road and south to the boundary of Gunnedah township (refer to Attachment B for a map of the data area). There were 63 reported crashes in the study area, which included one fatal crash, 29 injury crashes, and 33 non-injury tow-away crashes. The RTA data nominates speed as a factor in 18 of the crashes, fatigue as a factor in ten of the crashes, and alcohol as a factor in four of the crashes. No factors were nominated for the remaining 31 crashes. The data was reviewed with regard to crashes which occurred on roads of direct interest to the TCM, notably along the haul route and on roads used by employees and visitors to access the TCM. It is noted that some of the descriptions of the location of crashes are fairly broad, e.g. “5km north of Gunnedah township” thus the exact location of the crash cannot be clearly identified from the data provided. The following summary of crashes in Table 3.7 includes those which occurred on the haul route, or nearby to the haul route, and on the roads used by employees and delivery vehicles to access the TCM, with the exception of those parts of Kamilaroi Highway not on the haul route. TCPL also provided data on incidents involving their vehicles, with the following incidents noted: • 2004 – coal truck overturned at the intersection of Blue Vale Road and Kamilaroi
Highway; • 2006 – coal truck trailer released from truck and collided with tree on Blue Vale
Road; • 2007 – coal truck overturned on the haul route south of Dripping Rock Road; • 23/09/2008 – coal truck rollover near Canyon corner; • 10/12/2008 – light vehicle collision with a coal truck; • 5/05/2009 – a tyre blowout caused two coal trucks to side swipe each other near
the Blue Vale speedway; • 25/09/2009 – coal truck rollover on the corner of Rangari Road, turntable came
apart (included in Table 3.7); and • 18/02/2011 – a light vehicle rollover near Canyon corner injuring driver.

Doc: 00413540.doc
Final, 24 October 2011 30
Table 3.7 – Crashes on TCM Related Roads (1 Oct 2005 - 30 Sep 2010) Date Location Description Factors
6.30am Thu 3/4/2006
Kamilaroi Hwy 5km north of Gunnedah township
618584 southbound car struck an animal on the road
Fine weather Dry road
3.30pm Sat 29/4/2006
Rangari Rd 2km west of Wean Racecourse
518820 westbound car left the carriageway to the left on a straight section
Fine weather Dry road
11.00am Sat 8/7/2006
Wean St 5.39km east of Boggabri township
528464 eastbound four wheel drive left the carriageway to the right on a left hand bend and struck an object
Speed Fine weather Dry road
7.30am Sun 9/7/2006
Rangari Rd 5km east of Blue Vale Rd
528532 eastbound car left the carriageway on a straight section to the left
Fatigue Dry road
1.00pm Mon 2/11/2006
Blue Vale Rd 640m south of Vickery Rd
554911 southbound semitrailer left the carriageway to the left on a left hand bend and struck an object
Fine weather Dry road
5.05pm Wed 10/12/2008
Blue Vale Rd 8km north of Gunnedah township
649912 northbound B-double pulled out to the right overtaking a light truck which was also turning right
Fine weather Dry road
2.20pm Tue 5/5/2009
Blue Vale Rd 9.725km north of Kamilaroi Hwy
660016 northbound large rigid truck on the incorrect side of the road collided head on with a southbound B-double which was in its lane
Fine weather Dry road
1.10pm Fri 25/9/2009
Rangari Rd 16km east of Kamilaroi Hwy
686531 southbound B-double moving forward in a driveway left the carriageway to the left on a left hand bend
Speed Fine weather Dry road
12.30pm Sun 10/1/2010
Braymont Rd 80m east of Hull Rd
696487 westbound light truck left the carriageway to the right on a right hand bend and struck an object
Speed Fine weather Dry road
4.45pm Wed 19/5/2010
Rangari Rd 5.44km east of Kamilaroi Hwy
710481 westbound large rigid truck lost control and left the carriageway on a curve
Speed Fine weather Dry road
6.50pm Thu 18/2/2010
Rangari Rd 110m west of the iron bridge
699410 northbound motorcycle moving forward in a driveway collided with a westbound light truck
Fine weather Dry road
6.25pm Mon 9/8/2010
Kamilaroi Hwy 50m south of Blue Vale Rd
720826 southbound car collided with northbound large rigid truck at temporary roadworks, one injury
Fine weather Dry road

Doc: 00413540.doc
Final, 24 October 2011 31
Review of the RTA crash data and TCPL incident data has identified no particular causation factors on the local roads used by the TCM coal trucks and employees. The majority of the RTA reported crashes involved loss of control of the vehicle, causing the vehicle to leave the carriageway. The RTA reported crashes occurred in fine weather on dry road surfaces, thus it is considered that local weather and road surface conditions do not adversely contribute to the crash history of the area.
3.6 Car Parking Significant areas of on-site car parking are available at the TCM for staff, visitors and on-site contractors.
3.7 School Buses School buses operate in the local area, providing access for students to the local schools, including primary schools in Gunnedah and Boggabri, and a high school in Gunnedah. The school buses are run by numerous operators, and the majority do not operate close to the haul route. A school bus route, Blue Vale to Gunnedah, operates along and across the haul route. This route operates between 7.50am and 8.40am, and between 3.20pm and 3.58pm on school days. This school bus route starts and ends on Hoad Lane west of the haul route, and crosses the haul route in an east-west direction on Hoad Lane, where the haul route operates north-south on the Canyon Coal Mine road. At this location, the buses on Hoad Lane have right of way. The buses continue along Hoad Lane, and operate along the haul route between Hoad Lane at the eastern Canyon Coal Mine access road, and Blue Vale Road at the Old Blue Vale Road intersection. Currently this route stops at five properties near the haul route, four of which are on the length of Hoad Lane which is not the approved haul route. The bus stops at these properties between 7.50am and 7.56am on the way to St Xavier’s School, St Mary’s School and Gunnedah South School, and between 3.52pm and 3.58pm on the return journey in the afternoon. The fifth property is on Old Blue Vale Road near Gunnedah, which is also not on the haul route, and the bus stops here at 8.20am and 3.30pm. It is understood from the operator that until recently, this route also stopped at a property on Blue Vale Road, however those residents have since moved. There may soon be another stop at another property on Hoad Lane, also not on the haul route.

Doc: 00413540.doc
Final, 24 October 2011 32
In accordance with Condition 38(b) of Development Consent (DA 88-4-2005 MOD 1) for the TCM, coal trucks must reduce speed to 40km/hr in the vicinity of the school bus when it is operating on Hoad Lane. As noted above, the school bus does not currently stop on that part of Hoad Lane which is used by coal haulage trucks.
3.8 Other Developments 3.8.1 Boggabri Coal Mine
The Boggabri Coal Mine is located to the immediate north of the Project. In October 2009, Boggabri Coal Pty Limited submitted a Project Application to the NSW Department of Planning and Infrastructure for the continuation of its mining operations for a further 21 years. Parsons Brinckerhoff (2010) prepared a traffic impact assessment for inclusion in the Continuation of the Boggabri Coal Mine Environmental Assessment and estimated that the Boggabri Coal Mine would result in the following additional vehicle movements: • additional 353 operational employees would generate approximately 527 vehicle
trips per day during peak production (2016); and • 150 construction employees would generate approximately 224 vehicle trips per day
during peak construction (2016). Given the above, it has been assumed that the Continuation of the Boggabri Coal Mine would generate an additional 751 trips per day during peak construction (Year 4 of the Project) and approximately 527 trips per day thereafter. The full increase in construction and operational employees would not occur immediately however, and for the purpose of this assessment, it has been assumed that during Year 1 of the Project (2013), 50% of the peak additional construction and operational workforce would be on the Boggabri Coal Mine site, i.e., 378 vehicle trips per day. The Continuation of the Boggabri Coal Mine construction workforce described above would upgrade the Boggabri Coal Mine Infrastructure Facilities to receive ROM coal from the Project during 2013 (Year 1 of the Project). The morning and afternoon peak hours for the Continuation of the Boggabri Coal Mine are expected to be 5.45am to 6.45am and 5.00pm to 6.00pm, respectively (Parsons Brinckerhoff, 2010).
Doc: 00413540.doc
Final, 24 October 2011 33
The Boggabri Coal Mine has its vehicular access off Leards Forest Road, and a section of Leards Forest Road would be closed to through traffic in the future. It is anticipated that traffic that previously used Leards Forest Road would use Therribri Road or Kamilaroi Highway once Leards Forest Road has been closed (Parsons Brinckerhoff, 2010). The potential cumulative effects of the proposed Continuation of the Boggabri Coal Mine have been considered in the context of the Project traffic flows in Section 4.5.
3.8.2 Maules Creek Project Aston Coal 2 Pty Ltd lodged a Project Application to the NSW Department of Planning and Infrastructure for the Maules Creek Project in August 2010. The Maules Creek Project would include the development of surface infrastructure and open cut mining activities for a period of 21 years (Hansen Bailey, 2010) and is located approximately 5km to the north-northeast of the Project. Hyder Consulting (2010) prepared a traffic and transport impact assessment as part of the Maules Creek Project Environmental Assessment. That assessment estimated that the Maules Creek Project would result in the following additional vehicle movements, noting that shuttle buses would be used to transport the majority of employees (Hyder Consulting, 2010): • 470 operational employees would generate approximately 78 vehicle trips per day
during peak production (2020); • 340 construction employees would generate approximately 128 vehicle trips per day
during peak construction (2012); and • heavy vehicle deliveries would generate approximately 66 vehicle trips per day
during peak construction (2012). Leards Forest Road would be used initially to access the Maules Creek Project and then Therribri Road would be utilised once the site access road has been completed. Light vehicles (including employee shuttle buses) would obtain access to the site via Kamilaroi Highway, Rangari Road, Therribri Road/Leard Forest Road. Heavy vehicles would access the site via Blue Vale Road, Braymont Road, Barbers Lagoon, Rangari Road and Therribri Road/Leards Forest Road (Hyder Consulting, 2010).
Doc: 00413540.doc
Final, 24 October 2011 34
It has conservatively been assumed that the peak Maules Creek Project construction activity (nominally 2012) would coincide with Year 1 activity of the Project (nominally 2013). Further, it is assumed that up to half of the operational traffic may also be present during the peak construction period. This assessment wherefore assumes that the Maules Creek Project would generate approximately 233 vehicle trips per day during Year 1, and approximately 78 vehicle trips per day thereafter. The potential cumulative effects of the Maules Creek Project have been considered in the context of the Project traffic flows in Section 4.5. The morning and afternoon peak hours for the Maules Creek Project are expected to be 5.00am to 6.00am and 6.00pm to 7.00pm, respectively (Hyder Consulting, 2010).
Future Road Transport Conditions
Doc: 00413540.doc
Final, 24 October 2011 35
4 Future Road Transport Conditions
The remainder of this report assesses the likely implications of the Project on the road network surrounding the TCM. The future stages of particular interest to the Project with regard to road transport conditions are: • Year 1 (2013), during which Project construction activity would peak, and increases
in operational traffic and background growth in non-Project traffic would be expected. This scenario would also include construction and operational traffic from the Continuation of the Boggabri Coal Mine (refer to Section 3.8.1) and construction and some operational traffic from the Maules Creek Project2 (refer to Section 3.8.2);
• Year 4 (2016), during which maximum Project operational activity would occur at the same time as increases in background growth in non-Project traffic. This scenario would also include peak construction and operational traffic from the Continuation of the Boggabri Coal Mine and peak operational traffic from the Maules Creek Project; and
• Year 17 (2029), during which maximum Project operational activity would occur at the same time as maximum background growth in non-Project traffic. This scenario would also include peak operational traffic from the Continuation of the Boggabri Coal Mine and the Maules Creek Project. For the “No Project” scenario, the TCM would have ceased operation, thus there would be no TCM operational traffic.
Traffic movements during the decommissioning stage of the Project would be significantly lower than the construction and operational stages of the Project identified above. The potential road transport impacts associated with the decommissioning stages of the Project would therefore be less than the construction and operational stages of the Project (assessed in this section) and therefore do not warrant further consideration in this study.
2 Although peak construction for the Maules Creek Project is expected to occur in 2012 (Hyder Consulting, 2010), this assessment conservatively assumes that it would occur during Year 1 (2013) of the Project, i.e., during peak Project construction.
Doc: 00413540.doc
Final, 24 October 2011 36
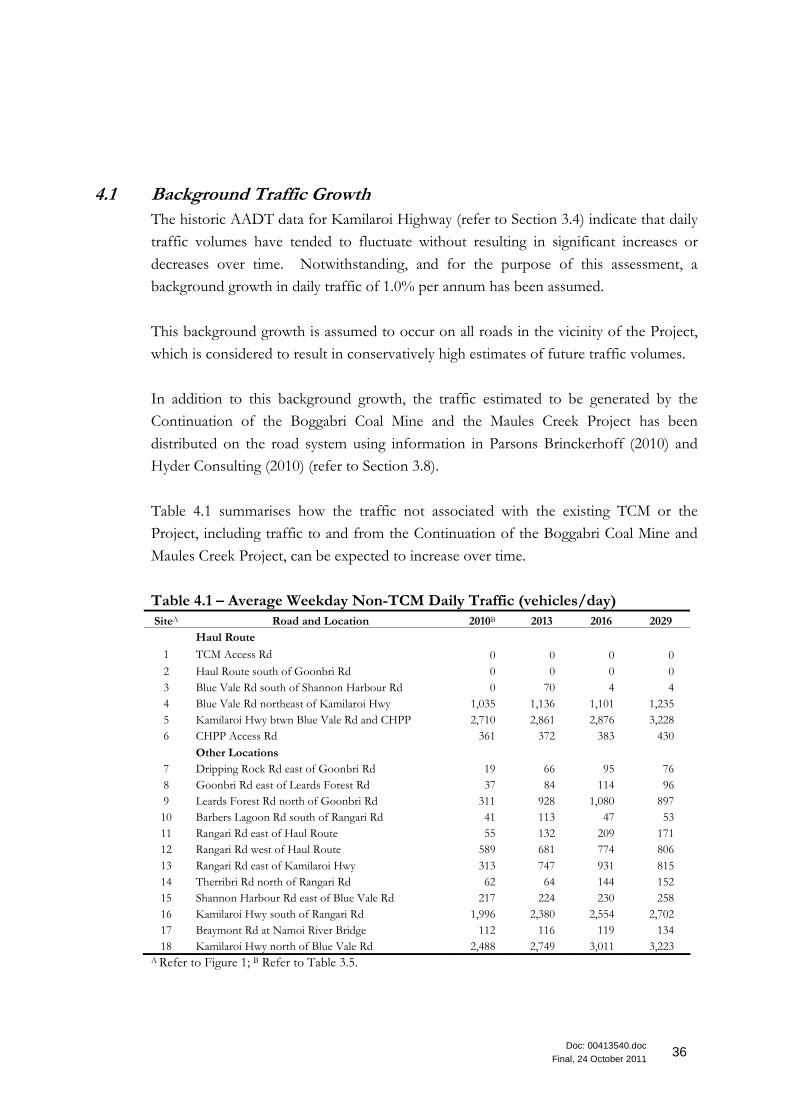
4.1 Background Traffic Growth The historic AADT data for Kamilaroi Highway (refer to Section 3.4) indicate that daily traffic volumes have tended to fluctuate without resulting in significant increases or decreases over time. Notwithstanding, and for the purpose of this assessment, a background growth in daily traffic of 1.0% per annum has been assumed. This background growth is assumed to occur on all roads in the vicinity of the Project, which is considered to result in conservatively high estimates of future traffic volumes. In addition to this background growth, the traffic estimated to be generated by the Continuation of the Boggabri Coal Mine and the Maules Creek Project has been distributed on the road system using information in Parsons Brinckerhoff (2010) and Hyder Consulting (2010) (refer to Section 3.8). Table 4.1 summarises how the traffic not associated with the existing TCM or the Project, including traffic to and from the Continuation of the Boggabri Coal Mine and Maules Creek Project, can be expected to increase over time. Table 4.1 – Average Weekday Non-TCM Daily Traffic (vehicles/day) SiteA Road and Location 2010B 2013 2016 2029
Haul Route 1 TCM Access Rd 0 0 0 0 2 Haul Route south of Goonbri Rd 0 0 0 0 3 Blue Vale Rd south of Shannon Harbour Rd 0 70 4 4 4 Blue Vale Rd northeast of Kamilaroi Hwy 1,035 1,136 1,101 1,235 5 Kamilaroi Hwy btwn Blue Vale Rd and CHPP 2,710 2,861 2,876 3,228 6 CHPP Access Rd 361 372 383 430 Other Locations 7 Dripping Rock Rd east of Goonbri Rd 19 66 95 76 8 Goonbri Rd east of Leards Forest Rd 37 84 114 96 9 Leards Forest Rd north of Goonbri Rd 311 928 1,080 897 10 Barbers Lagoon Rd south of Rangari Rd 41 113 47 53 11 Rangari Rd east of Haul Route 55 132 209 171 12 Rangari Rd west of Haul Route 589 681 774 806 13 Rangari Rd east of Kamilaroi Hwy 313 747 931 815 14 Therribri Rd north of Rangari Rd 62 64 144 152 15 Shannon Harbour Rd east of Blue Vale Rd 217 224 230 258 16 Kamilaroi Hwy south of Rangari Rd 1,996 2,380 2,554 2,702 17 Braymont Rd at Namoi River Bridge 112 116 119 134 18 Kamilaroi Hwy north of Blue Vale Rd 2,488 2,749 3,011 3,223
A Refer to Figure 1; B Refer to Table 3.5.

Doc: 00413540.doc
Final, 24 October 2011 37
Table 4.1 demonstrates that significant changes to traffic that is not associated with the TCM can be expected in the region in the future.
4.2 Traffic Generated by the Project – Construction The peak construction phase of the Project would occur during Year 1 (2013) and would include the following: • relocation of the mine facilities area; • construction of a services corridor to the Boggabri Coal Mine; and • re-alignment of sections of Goonbri Road and construction of new intersections. Other construction and development activities would be required during the life of the Project for short periods. These would be related to construction of the permanent Goonbri Creek alignment, low permeability barrier, the later stages of the realignment of sections of Goonbri Road and construction of new intersections. These later construction stages would occur for short periods after the cessation of the transport of sized ROM coal on the haul route, i.e., after a significant reduction in the Project-related traffic movements. The potential road transport impacts associated with these later construction stages would therefore be less than the construction and operational stages of the Project (assessed in this section) and therefore have not been considered further in this study. All construction activities would generally be undertaken during daytime hours up to seven days a week.
4.2.1 Workforce The Project is expected to attract some 20 additional employees during the peak construction phase during Year 1 (2013). It is assumed that the travel routes of the additional employees would be similar to those of the existing workforce (refer to Section 2.1.1). Car pooling for construction employees would be very limited, and thus for this assessment, it has been assumed that each construction employee would drive a vehicle to and from the site each day. Construction would occur between 7.00am and 6.00pm. On this basis, the additional 20 construction employees would generate an additional 40 light vehicle trips per day.

Doc: 00413540.doc
Final, 24 October 2011 38
4.2.2 Deliveries and Visitors The Project is expected to result in an increase of an average of 55 deliveries and visitors each day associated with construction activity. It is expected that deliveries and visitors would generate a mix of light vehicle trips (85%) and heavy vehicle trips (15%), and would be spread evenly across the day between 6.00am and 6.00pm, with vehicles from similar sources and using similar routes to the existing deliveries and visitor traffic (refer to Section 2.1.2). The Project construction activity would thus result in an increase of 110 vehicle trips per day, of which 18 trips would be expected to be made by heavy vehicles. Deliveries during the construction period would generally be unloaded within the mine facilities area (refer to Figures 2 and 3).
4.2.3 Total Traffic The total traffic generated by the Project construction activity, and its distribution on the surrounding road network is summarised in Table 4.2 below. Table 4.2 – Average Daily Project Construction Traffic Year 1 (2013) (vehicles/day) SiteA Road and Location Employee Delivery and
Visitor Total
Haul Route 1 TCM Access Rd 40 110 150 2 Haul Route south of Goonbri Rd 34 110 144 3 Blue Vale Rd south of Shannon Harbour Rd 22 88 110 4 Blue Vale Rd northeast of Kamilaroi Hwy 22 88 110 5 Kamilaroi Hwy between Blue Vale Rd and CHPP 22 88 110 6 CHPP Access Rd 0 0 0 Other Locations 7 Dripping Rock Rd east of Goonbri Rd 0 0 0 8 Goonbri Rd east of Leards Forest Rd 5 0 5 9 Leards Forest Rd north of Goonbri Rd 0 0 0 10 Barbers Lagoon Rd south of Rangari Rd 3 0 3 11 Rangari Rd east of Haul Route 4 0 4 12 Rangari Rd west of Haul Route 8 22 30 13 Rangari Rd east of Kamilaroi Hwy 11 22 33 14 Therribri Rd north of Rangari Rd 0 0 0 15 Shannon Harbour Rd east of Blue Vale Rd 0 0 0 16 Kamilaroi Hwy south of Rangari Rd 5 11 16 17 Braymont Rd at Namoi River Bridge 3 0 3 18 Kamilaroi Hwy north of Blue Vale Rd 0 0 0
A Refer to Figure 1
Doc: 00413540.doc
Final, 24 October 2011 39
Table 4.2 demonstrates that the traffic generated by the construction phase of the Project would tend to be concentrated along the haul route, with lesser volumes on Rangari Road between the haul route and Kamilaroi Highway.
4.3 Traffic Generated by the Project – Operational As discussed in Section 2.2, the Project would generate additional operational traffic as a result of: • an increase in the workforce from 86 people to 120 people; • an increase in Project deliveries and visitors; and • the addition of transport of gravel from the TCM. Changes to local traffic conditions would also result from the proposed realignment of sections of Goonbri Road and construction of new intersections. The various components of the proposed changes to operational traffic conditions are discussed in this section.
4.3.1 Workforce The Project would result in an increase in on-site employees from the existing 86 full time personnel to 120 full time personnel. It is assumed that the travel characteristics of the additional employees would be similar to those of the existing workforce (refer to Section 2.1.1). On this basis, the additional 34 full time employees would generate an additional 56 light vehicle trips per day. Nominal start and finish times for the Project would be as follows: • Administration personnel – 7.00am to 5.00pm weekdays; • Mining Operations Day Personnel – 6.30am to 7.00pm; and • Mining Operations Night Personnel – 6.30pm to 7.00am.

Doc: 00413540.doc
Final, 24 October 2011 40
The full increase in employees would not occur immediately however, and it is anticipated that in Year 1 (2013), there would be 103 full time employees, who would generate an additional 28 light vehicle trips per day above those generated by the existing 86 employees.
4.3.2 Deliveries and Visitors The Project is assumed to result in additional deliveries and visitors to the TCM as a direct result of the increase in mining activity. It is estimated that the Project would result in an additional 20 deliveries/visitors per week above the existing 233 weekly deliveries/visitors (refer to Section 2.1.2). Deliveries and visitors would continue to generate a mix of light vehicle trips (85%) and heavy vehicle trips (15%), and would be spread evenly across the day between 6.00am and 6.00pm, with similar sources to the existing deliveries and visitors. The Project would thus result in an increase of 40 vehicle trips per week, of which, six trips would be expected to be made by heavy vehicles. The full increase in delivery and visitor activity would not occur immediately, and it is anticipated that in Year 1 (2013), the Project would result in an additional ten deliveries/visitors per week, i.e., 20 vehicle trips per week, above the existing level. Deliveries during the operational period would generally be unloaded at the mine facilities area (refer to Figures 2 and 3).
4.3.3 Sized ROM Coal Haulage The Project would include the continuation of the transport of up to 2Mtpa of sized ROM coal to the CHPP via the haulage route during Year 1 (or prior to suitable approvals and upgrades being in place for the transfer of Project ROM coal to the Boggabri Coal Mine Infrastructure Facilities). The sized ROM coal would be collected from the coal load out bin in the mine facilities area (refer to Figures 2 and 3) for transport to the CHPP.
Doc: 00413540.doc
Final, 24 October 2011 41
As discussed in Section 2.1.3, 156 trucks per coal haulage day would be required to transport at the maximum coal production rate of 2Mtpa. This represents no change from the 2010 operational levels, i.e., no additional truck movements would be generated. After suitable approvals and upgrades are in place for the transfer of Project ROM coal to the Boggabri Coal Mine Infrastructure Facilities (expected to occur during Year 1), all of the sized ROM coal would be transported to the Boggabri Coal Mine using internal haul road links and therefore transport of sized ROM coal on the haul route would cease.
4.3.4 Domestic Specification Coal Domestic specification coal would be collected from the mobile crushing and screening plant in the mine facilities area (refer to Figures 2 and 3) at a maximum rate of 150,000tpa. At this maximum transport rate, 12 trucks per coal haulage day would collect domestic specification coal from the Project. This would generate 24 truck trips per day on the road network. This represents an increase from the 2010 operational domestic specification coal levels (refer to Section 2.1.4) of five trucks per coal haulage day, generating ten truck trips per coal haulage day. In addition to the existing haul route from Gunnedah, domestic specification coal would be transported via Kamilaroi Highway (north of Rangari Road), Rangari Road and the haul route after the commencement of Project. The hours for the collection of domestic specification coal for the proposed Project are assumed to remain the same as the existing collection hours discussed in Section 2.1.4. It is noted that although the movements associated with the collection of domestic specification coal are related to the TCM, these trucks are not operated by TCPL or TCPL contractors. They therefore do not form part of TCPL’s operations with regard to the Project. Notwithstanding this, they have been included in this assessment as part of the future operational traffic conditions.

Doc: 00413540.doc
Final, 24 October 2011 42
4.3.5 Gravel Sales The Project would result in the collection of up to 90,000m3 crushed gravel per annum from the mobile crushing and screening plant in the mine facilities area (refer to Figures 2 and 3), utilising the haul route from Gunnedah or via public roads from Boggabri, i.e., Kamilaroi Highway, Rangari Road and the haul route. Once the collection of gravel has commenced, gravel sales are expected to generate 22 trucks per day (44 heavy vehicle trips per day), with 90 percent being to/from Narrabri, and 10 percent to/from Gunnedah. The trucks travelling to and from Gunnedah would use the haul route, while those to and from Narrabri would use the Kamilaroi Highway, Rangari Road and the haul route to access the TCM. The truck trips would be spread evenly throughout the day, with despatch being between 7.00am and 9.15pm Monday to Friday, and between 7.00am and 5.15pm on Saturdays (excluding public holidays). It is noted that although the movements associated with the collection of crushed gravel are related to the TCM, these trucks are not operated by TCPL or TCPL contractors. They therefore do not form part of TCPL’s operations with regard to the Project. Notwithstanding this, they have been included in this assessment as part of the future operational traffic conditions.
4.3.6 Low Permeability Barrier Fill Material Fill material (bentonite) for the construction of the low permeability barrier would be transported to the Project over a three month period in Year 12 of the Project. Fill material transport is expected to generate two trucks per day (four heavy vehicle trips per day) during this period. The trucks would use the haul route to access the Project. The truck trips would be spread evenly throughout the day, between 6.00am and 6.00pm Monday to Friday, and between 7.00am and 5.15pm on Saturdays (excluding public holidays). Given the short-term nature (three months) and the small number of movements (four heavy vehicle trips per day), it is considered that the transport of fill material would be within the range of daily traffic variation and would have a negligible impact on the surrounding road system.

Doc: 00413540.doc
Final, 24 October 2011 43
4.4 Traffic Generated by the Project – Total Table 4.3 summarises the expected additional traffic on the roads around the TCM which would result from the Project for Year 1 (2013), and Table 4.4 summarises the expected additional traffic on the roads around the TCM which would result from the Project during Year 4 (2016) and Year 17 (2029). Table 4.3 and Table 4.4 demonstrate that after Year 1 (2013) (or after suitable approvals and upgrades are in place for the transfer of Project ROM coal to the Boggabri Coal Mine Infrastructure Facilities), the Project would result in a decrease in sized ROM coal haulage trips on the surrounding road system, due to the proposed movement of ROM coal internally to the Boggabri Coal Mine. Additional employees, deliveries and the sale of gravel and domestic specification coal would generate small volumes of traffic which would be more than offset by the reduction in sized ROM coal truck trips. Only small increases of up to 44 vehicles per day in Year 1 (2013), and 58 vehicles per day in Year 4 (2016) and Year 17 (2029) are predicted on all other roads.

Future Road Transport Conditions
Doc: 00413540.doc
Final, 24 October 2011 44
Table 4.3 – Average Daily Project Additional Traffic Generation Year 1 (2013) (vehicles/day)
Construction Operational
SiteA Road and Location Workforce Delivery and Visitor Workforce Delivery
and Visitor
Sized ROM Coal
Haulage
Domestic Specification
Coal HaulageB
Gravel HaulageB Total
Haul Route 1 TCM Access Rd 40 110 28 4 0 0 0 182 2 Haul Route south of Goonbri Rd 34 110 24 4 0 0 0 172 3 Blue Vale Rd south of Shannon Harbour Rd 22 88 16 3 0 -2 0 127 4 Blue Vale Rd northeast of Kamilaroi Hwy 22 88 16 3 0 -2 0 127 5 Kamilaroi Hwy btwn Blue Vale Rd and CHPP 22 88 16 3 0 0 0 129 6 CHPP Access Rd 0 0 0 0 0 0 0 0 Other Locations 7 Dripping Rock Rd east of Goonbri Rd 0 0 0 0 0 0 0 0 8 Goonbri Rd east of Leards Forest Rd 5 0 4 0 0 0 0 9 9 Leards Forest Rd north of Goonbri Rd 0 0 0 0 0 0 0 0 10 Barbers Lagoon Rd south of Rangari Rd 3 0 2 0 0 0 0 5 11 Rangari Rd east of Haul Route 4 0 2 0 0 0 0 6 12 Rangari Rd west of Haul Route 8 22 6 1 0 2 0 39 13 Rangari Rd east of Kamilaroi Hwy 11 22 8 1 0 2 0 44 14 Therribri Rd north of Rangari Rd 0 0 0 0 0 0 0 0 15 Shannon Harbour Rd east of Blue Vale Rd 0 0 0 0 0 0 0 0 16 Kamilaroi Hwy south of Rangari Rd 5 11 4 0 0 -2 0 18 17 Braymont Rd at Namoi River Bridge 3 0 2 0 0 0 0 5 18 Kamilaroi Hwy north of Blue Vale Rd 0 0 0 0 0 -2 0 -2
A Refer to Figure 1; B Not operated by TCPL or TCPL contractors.
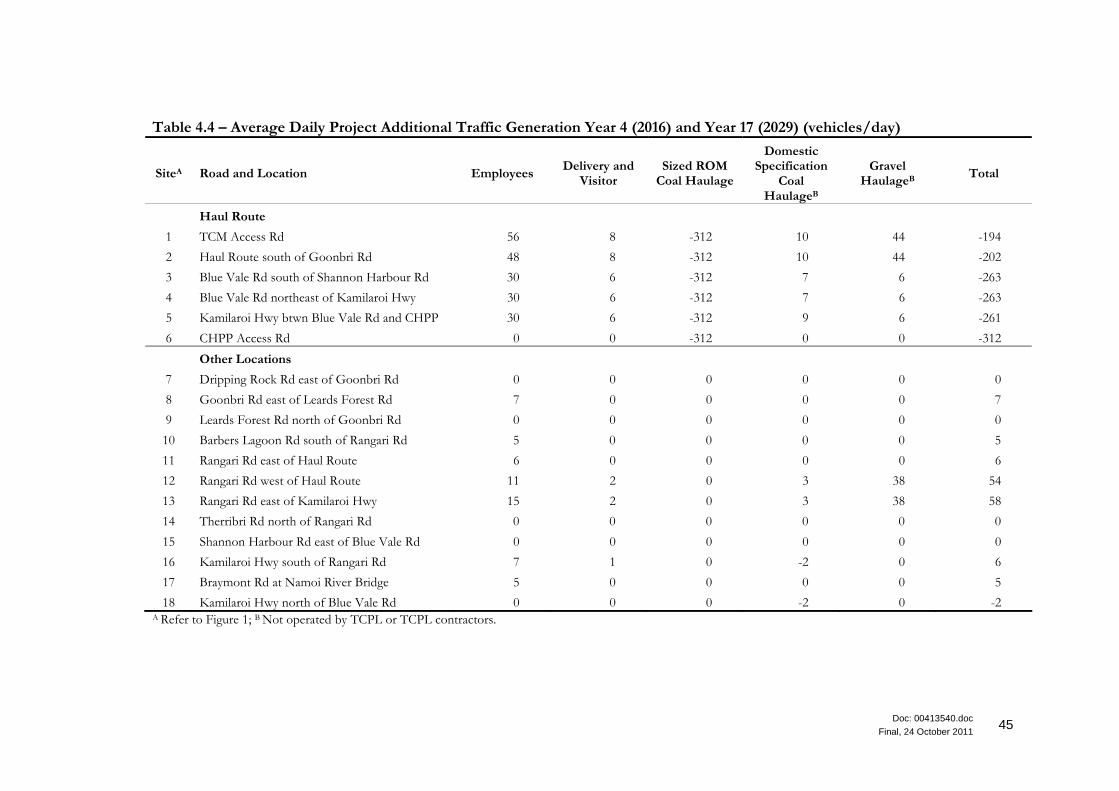
Doc: 00413540.doc
Final, 24 October 2011 45
Table 4.4 – Average Daily Project Additional Traffic Generation Year 4 (2016) and Year 17 (2029) (vehicles/day)
SiteA Road and Location Employees Delivery and Visitor
Sized ROM Coal Haulage
Domestic Specification
Coal HaulageB
Gravel HaulageB Total
Haul Route 1 TCM Access Rd 56 8 -312 10 44 -194 2 Haul Route south of Goonbri Rd 48 8 -312 10 44 -202 3 Blue Vale Rd south of Shannon Harbour Rd 30 6 -312 7 6 -263 4 Blue Vale Rd northeast of Kamilaroi Hwy 30 6 -312 7 6 -263 5 Kamilaroi Hwy btwn Blue Vale Rd and CHPP 30 6 -312 9 6 -261 6 CHPP Access Rd 0 0 -312 0 0 -312 Other Locations 7 Dripping Rock Rd east of Goonbri Rd 0 0 0 0 0 0 8 Goonbri Rd east of Leards Forest Rd 7 0 0 0 0 7 9 Leards Forest Rd north of Goonbri Rd 0 0 0 0 0 0 10 Barbers Lagoon Rd south of Rangari Rd 5 0 0 0 0 5 11 Rangari Rd east of Haul Route 6 0 0 0 0 6 12 Rangari Rd west of Haul Route 11 2 0 3 38 54 13 Rangari Rd east of Kamilaroi Hwy 15 2 0 3 38 58 14 Therribri Rd north of Rangari Rd 0 0 0 0 0 0 15 Shannon Harbour Rd east of Blue Vale Rd 0 0 0 0 0 0 16 Kamilaroi Hwy south of Rangari Rd 7 1 0 -2 0 6 17 Braymont Rd at Namoi River Bridge 5 0 0 0 0 5 18 Kamilaroi Hwy north of Blue Vale Rd 0 0 0 -2 0 -2
A Refer to Figure 1; B Not operated by TCPL or TCPL contractors.

Future Road Transport Conditions
Doc: 00413540.doc
Final, 24 October 2011 46
4.5 Future Traffic Volumes With the Project Table 4.5 summarises the forecast total two way average weekday daily traffic volumes on the surrounding roads with the proposed Project. This assessment includes predicted cumulative traffic from the Maules Creek Project and the Continuation of the Boggabri Coal Mine as described in Section 3.8. Table 4.5 – Average Weekday Daily Traffic With Project (vehicles/day) SiteA Road and Location ExistingB 2013 2016 2029
Haul Route 1 TCM Access Rd 564 746 370 370 2 Haul Route south of Goonbri Rd 540 713 339 339 3 Blue Vale Rd south of Shannon Harbour Rd 480 677 221 221 4 Blue Vale Rd northeast of Kamilaroi Hwy 1,515 1,743 1,318 1,452 5 Kamilaroi Hwy btwn Blue Vale Rd and CHPP 3,188 3,468 3,093 3,445 6 CHPP Access Rd 673 684 383 430 Other Locations 7 Dripping Rock Rd east of Goonbri Rd 21 68 97 78 8 Goonbri Rd east of Leards Forest Rd 57 113 141 123 9 Leards Forest Rd north of Goonbri Rd 311 928 1,080 897 10 Barbers Lagoon Rd south of Rangari Rd 51 128 62 68 11 Rangari Rd east of Haul Route 67 150 227 189 12 Rangari Rd west of Haul Route 637 768 876 908 13 Rangari Rd east of Kamilaroi Hwy 369 847 1,045 929 14 Therribri Rd north of Rangari Rd 62 64 144 152 15 Shannon Harbour Rd east of Blue Vale Rd 217 224 230 258 16 Kamilaroi Hwy south of Rangari Rd 2,028 2,430 2,592 2,740 17 Braymont Rd at Namoi River Bridge 122 131 134 149 18 Kamilaroi Hwy north of Blue Vale Rd 2,488 2,749 3,011 3,223
A Refer to Figure 1; BRefer to Table 3.1. The greatest increase in cumulative forecast total two way average weekday daily traffic volumes would occur on Leards Forest Road (site 9 on Figure 1) which is located off key Project transport routes.

Future Road Transport Conditions
Doc: 00413540.doc
Final, 24 October 2011 47
4.6 Proposed Road Realignments and New Intersections The extent of the Project open cut and mine waste rock emplacements would require the realignment of sections of Goonbri Road and establishment of a new intersection with Dripping Rock Road to provide for continued public road accessibility around the southern and eastern extents of the Project. A plan of the proposed road realignments and new intersections is shown on Figure 2. The road realignments would be undertaken progressively over the life of the Project and involve the construction of: • a 1.4km unsealed two lane road to the south-west of the Project to facilitate
construction of the new mine facilities area, including a new intersection (from the west) with the haul route;
• a 1.2km unsealed two lane road to the south of the Southern Emplacement to facilitate construction of a new internal haul road and water management infrastructure including a new intersection (from the east) with the haul route;
• a 400m unsealed two lane road realignment around the southern extent of the open cut; and
• a 2.8km unsealed two lane road from a new intersection with Dripping Rock Road and Blair Athol Lane, extending to the north and connecting with Goonbri Road to the north-east of the Project.
4.7 Assessment of Future Traffic Conditions 4.7.1 Traffic Volumes
Table 4.3 and Table 4.4 demonstrate that the Project would have only a minor impact on the future traffic volumes on the surveyed roads around the TCM. The greatest impact would be significant reductions in coal haulage trips on the haul route, with these being somewhat offset by its continued use by the various other vehicles accessing the TCM, including employees, deliveries, visitors and gravel haulage trucks.
Future Road Transport Conditions
Doc: 00413540.doc
Final, 24 October 2011 48
It is considered that detailed assessment of peak hour intersection performance is not required, due to the relatively small hourly traffic volumes on the relevant roads and the small changes to traffic volumes expected as a result of the Project. In addition, the slightly staggered morning and afternoon peak hours associated with the Continuation of the Boggabri Coal Mine, the Maules Creek Project and the Project and the different traffic distributions associated with these developments would assist in minimising potential cumulative peak hour impacts.
4.7.2 Road System Efficiency With surveyed peak hourly volumes being typically 8 to 12% of the daily volumes (refer to Table 3.2) it is evident from Table 4.5 that future peak hour volumes on the surveyed roads are likely to remain well below 550 vehicles per hour on Kamilaroi Highway and below 650 vehicles per hour on all other surveyed roads. On this basis, as discussed in Section 3.3.4, the future LOS on all of the surveyed roads would remain A, which is satisfactory. The haul route currently carries an average 312 heavy vehicle movements per haulage day directly associated with transport of up to 2Mtpa of sized ROM coal to the CHPP. The Project would result in the cessation of sized ROM coal transport on the road network i.e., a reduction of 312 heavy vehicle movements per haulage day. Allowing for public holidays and the like, it is estimated that the sized ROM coal trucks use this route six days a week for 50 weeks of the year. The existing annual Vehicle Kilometres Travelled (VKT) of the sized ROM coal trucks is thus 3.6 million vehicle kilometres per year. The internal movement of sized ROM coal to the Boggabri Coal Mine would therefore result in a reduction of 3.6 million heavy vehicle kilometres on the haul route per year.

Future Road Transport Conditions
Doc: 00413540.doc
Final, 24 October 2011 49
It should be noted however, that domestic specification coal would be transported from the Project at a maximum rate of 150,000tpa, or 12 heavy vehicle movements per haulage day. In addition, an additional 22 heavy vehicle movements per haulage day would transport gravel from the Project. As these movements would include direct collection by customers, the VKT associated with these movements would vary according to individual origins and destinations. However, it is unlikely that the increase in VKT associated with the transport of 150,000t of domestic specification coal and 90,000m3 of gravel would outweigh the reduction in VKT associated with the transport of 2Mt of sized ROM coal between the TCM and the CHPP. The reduction in travel by sized ROM coal trucks would improve the efficiency of haul route for the remaining road users, through the removal of the slower-moving trucks from the road system. The reduction in truck-generated VKT would also have some benefits in terms of reducing fuel consumption and exhaust pollution.
4.7.3 Haul Route Intersections with Kamilaroi Highway The haul route intersects with Kamilaroi Highway at two locations, these being at the CHPP access road, and at the intersection with Blue Vale Road. The two intersections are both tee intersections, with Kamilaroi Highway being the main road with priority. The intersections are both constructed to a good standard, with deceleration and acceleration lanes to accommodate the slower moving coal trucks with minimum disruption to other traffic. The limited additional traffic generated by the Project along the haul route would not warrant any upgrading of these intersections.
4.7.4 Road Realignments and New Intersections The proposed realignments of roads to the south and east of the Project would maintain all existing access for through traffic, as well as access for the Project itself.
Future Road Transport Conditions
Doc: 00413540.doc
Final, 24 October 2011 50
The new intersection formed between the haul route and Goonbri Road would be a four-way intersection. Goonbri Road would have priority at the intersection, i.e., traffic on the haul route would have to give way to traffic on the public road. The new intersection of Goonbri Road, Dripping Rock Road and Blair Athol Lane would be a four way intersection. Priority at the intersection would follow standard road rules, with traffic on the minor road being required to give way to traffic on the through road. The new sections of road and intersection would be designed to the same standard as the existing roads, and in accordance with the requirements of Narrabri Shire Council and the RTA’s (1996) Road Design Guide. No RTA Works Authorisation Deed would be required for the proposed works on Goonbri Road as they would be on Narrabri Shire Council roads.
4.7.5 Blasting During mining operations there would be occasions when blasting would be required within 500m of Goonbri Road. Approvals would be sought from the Narrabri Shire Council to temporarily close sections of Goonbri Road to allow blasting to occur, typically for periods of approximately 15 minutes. It is recommended that a Road Closure Management Plan be established in consultation with the Narrabri Shire Council defining: • method of road closure; • signage providing advance warning and at the end of the road closure; • review of traffic volumes; • period of closure and expected queue lengths; • access for emergency services during closure periods; • notification process; and • monitoring and reporting requirements.

Future Road Transport Conditions
Doc: 00413540.doc
Final, 24 October 2011 51
4.7.6 Road Safety Review As the increases in traffic resulting from the Project would be minimal, with significant reductions in heavy vehicle movements on the haul route, and no particular accident pattern or causation factors were identified in the local area, it follows that no significant road safety issues are anticipated as a result of the Project.
4.7.7 School Buses Based upon shift times, the Project’s morning peak would occur between 6.00am and 7.00am and afternoon peak would occur between 5.00pm and 7.00pm. These times are outside the periods that local school buses operate (refer to Section 3.7). The potential for conflict between Project traffic and school buses is therefore minimised. Notwithstanding, some off peak Project traffic would be present on the local road network during the school bus operating hours. In addition, the Project would result in the cessation of sized ROM coal haulage trips on the haul route due to the proposed movement of coal internally to the Boggabri Coal Mine after suitable approvals and upgrades are in place for the transfer of Project ROM coal to the Boggabri Coal Mine Infrastructure Facilities (expected to occur during Year 1 of the Project). The road diversions resulting from the Project would not affect the operation of school buses in the area, as all through access by public vehicles on the public roads would be maintained.
4.7.8 Oversize Vehicles A number of oversize vehicle movements would be generated on an occasional basis during the life of the Project. These oversize vehicle movements would be associated with the transport of mining equipment and infrastructure to and from the Project.

Future Road Transport Conditions
Doc: 00413540.doc
Final, 24 October 2011 52
Although the number of oversize vehicle movements associated with the Project is anticipated to be small, the requirement for each proposed oversize vehicle movement would be reviewed and alternative transport options, such as rail, would be considered prior to the movement. It is expected that oversize vehicles would approach the Project via Kamilaroi Highway and the haul route. Notwithstanding the above, the proposed route would be negotiated with RTA and relevant local councils on a case-by-case basis. Oversize vehicles would be unloaded in the vicinity of the mine facilities area. All oversize loads would be transported with the relevant permits obtained in accordance with Operating Conditions: specific permits for oversize and over-mass vehicles and loads (RTA, 2007), and any other licences and escorts as required by the regulatory authorities.
4.7.9 Car Parking During the construction stage, car parking facilities at the existing mine facilities area and temporary parking in the vicinity of the mine facilities area would be utilised. Car parking for employees and visitors during operational stages would be located in the mine facilities area (refer to Figures 2 and 3).
4.7.10 Potential Road Noise and Dust Impacts Potential road noise and dust impacts have been assessed in the Noise and Blasting Impact Assessment (Appendix C of the Environmental Assessment) and the Air Quality and Greenhouse Gas Assessment (PAE Holmes, 2011) (Appendix D of the Environmental Assessment) respectively.
Doc: 00413540.doc
Final, 24 October 2011 53
5 Conclusions
This study has found that the extension of the life of the TCM and expansion of its production capacity would have only minor impacts on the operation of the surrounding road system. The Project would result in the cessation of sized ROM coal haulage trips from the TCM to the CHPP due to the proposed movement of ROM coal internally to the Boggabri Coal Mine after suitable approvals and upgrades are in place for the transfer of Project ROM coal to the Boggabri Coal Mine Infrastructure Facilities (expected to occur during Year 1). Additional employees, deliveries and the sale of gravel would generate small volumes of traffic which would be more than offset by the reduction in sized ROM coal truck trips. No significant impacts on the performance, capacity, efficiency and safety of the road network are expected to arise as a result of the Project and no specific management or mitigation measures are considered to be warranted.

Doc: 00413540.doc
Final, 24 October 2011 A.1
Attachment A. Traffic Survey Data
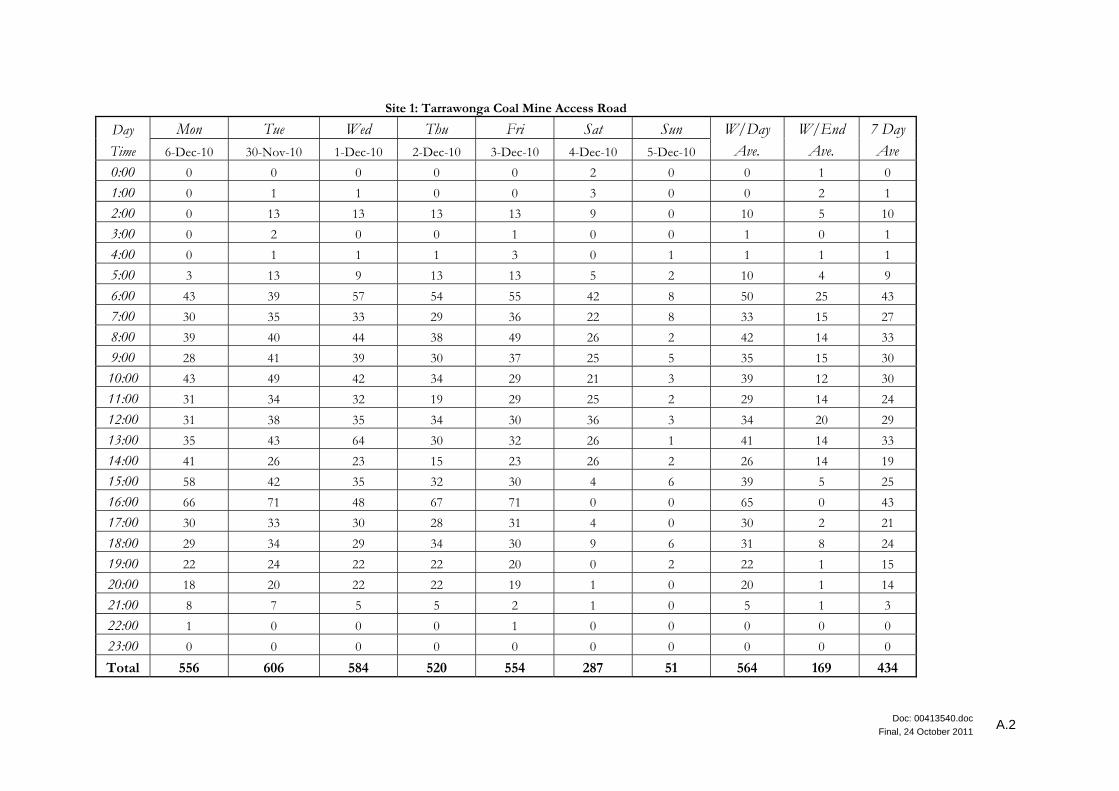
Doc: 00413540.doc
Final, 24 October 2011 A.2
Site 1: Tarrawonga Coal Mine Access Road Day Mon Tue Wed Thu Fri Sat Sun W/Day W/End 7 DayTime 6-Dec-10 30-Nov-10 1-Dec-10 2-Dec-10 3-Dec-10 4-Dec-10 5-Dec-10 Ave. Ave. Ave 0:00 0 0 0 0 0 2 0 0 1 0 1:00 0 1 1 0 0 3 0 0 2 1 2:00 0 13 13 13 13 9 0 10 5 10 3:00 0 2 0 0 1 0 0 1 0 1 4:00 0 1 1 1 3 0 1 1 1 1 5:00 3 13 9 13 13 5 2 10 4 9 6:00 43 39 57 54 55 42 8 50 25 43 7:00 30 35 33 29 36 22 8 33 15 27 8:00 39 40 44 38 49 26 2 42 14 33 9:00 28 41 39 30 37 25 5 35 15 30 10:00 43 49 42 34 29 21 3 39 12 30 11:00 31 34 32 19 29 25 2 29 14 24 12:00 31 38 35 34 30 36 3 34 20 29 13:00 35 43 64 30 32 26 1 41 14 33 14:00 41 26 23 15 23 26 2 26 14 19 15:00 58 42 35 32 30 4 6 39 5 25 16:00 66 71 48 67 71 0 0 65 0 43 17:00 30 33 30 28 31 4 0 30 2 21 18:00 29 34 29 34 30 9 6 31 8 24 19:00 22 24 22 22 20 0 2 22 1 15 20:00 18 20 22 22 19 1 0 20 1 14 21:00 8 7 5 5 2 1 0 5 1 3 22:00 1 0 0 0 1 0 0 0 0 0 23:00 0 0 0 0 0 0 0 0 0 0
Total 556 606 584 520 554 287 51 564 169 434
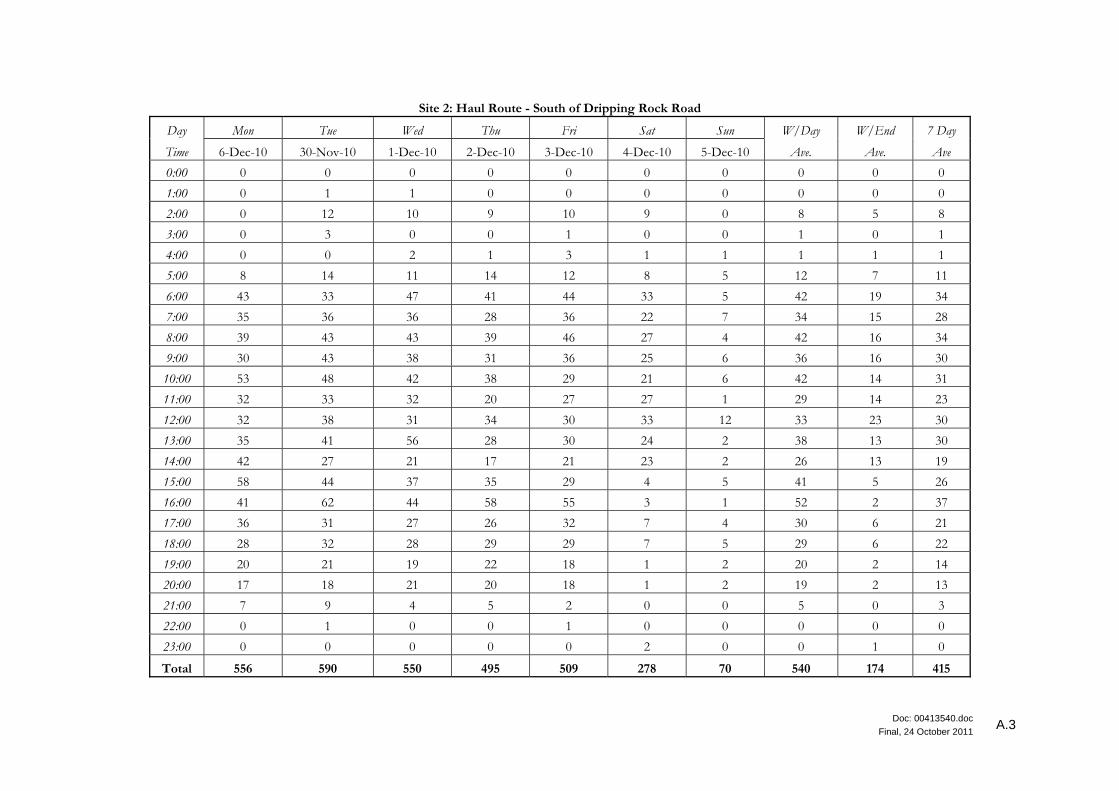
Doc: 00413540.doc
Final, 24 October 2011 A.3
Site 2: Haul Route - South of Dripping Rock Road Day Mon Tue Wed Thu Fri Sat Sun W/Day W/End 7 Day Time 6-Dec-10 30-Nov-10 1-Dec-10 2-Dec-10 3-Dec-10 4-Dec-10 5-Dec-10 Ave. Ave. Ave 0:00 0 0 0 0 0 0 0 0 0 0 1:00 0 1 1 0 0 0 0 0 0 0 2:00 0 12 10 9 10 9 0 8 5 8 3:00 0 3 0 0 1 0 0 1 0 1 4:00 0 0 2 1 3 1 1 1 1 1 5:00 8 14 11 14 12 8 5 12 7 11 6:00 43 33 47 41 44 33 5 42 19 34 7:00 35 36 36 28 36 22 7 34 15 28 8:00 39 43 43 39 46 27 4 42 16 34 9:00 30 43 38 31 36 25 6 36 16 30 10:00 53 48 42 38 29 21 6 42 14 31 11:00 32 33 32 20 27 27 1 29 14 23 12:00 32 38 31 34 30 33 12 33 23 30 13:00 35 41 56 28 30 24 2 38 13 30 14:00 42 27 21 17 21 23 2 26 13 19 15:00 58 44 37 35 29 4 5 41 5 26 16:00 41 62 44 58 55 3 1 52 2 37 17:00 36 31 27 26 32 7 4 30 6 21 18:00 28 32 28 29 29 7 5 29 6 22 19:00 20 21 19 22 18 1 2 20 2 14 20:00 17 18 21 20 18 1 2 19 2 13 21:00 7 9 4 5 2 0 0 5 0 3 22:00 0 1 0 0 1 0 0 0 0 0 23:00 0 0 0 0 0 2 0 0 1 0
Total 556 590 550 495 509 278 70 540 174 415

Doc: 00413540.doc
Final, 24 October 2011 A.4
Site 3: Bluevale Road - South of Shannon Harbour Road Day Mon Tue Wed Thu Fri Sat Sun W/Day W/End 7 Day Time 14-Feb-11 08-Feb-11 9-Feb-11 10-Feb-11 11-Feb-11 12-Feb-11 13-Feb-11 Ave. Ave. Ave 0:00 0 0 0 0 0 1 2 0 2 1 1:00 1 0 0 0 0 1 3 0 2 1 2:00 0 7 7 7 7 6 0 6 3 6 3:00 1 0 0 0 0 0 0 0 0 0 4:00 5 6 4 5 5 2 1 5 2 4 5:00 11 18 25 25 21 19 7 20 13 19 6:00 55 31 37 46 48 22 11 43 17 33 7:00 55 19 24 40 57 25 4 39 15 28 8:00 41 22 12 32 36 8 2 29 5 19 9:00 44 12 12 30 45 10 3 29 7 19 10:00 37 17 24 22 55 36 5 31 21 27 11:00 33 10 18 18 65 22 4 29 13 23 12:00 44 20 11 17 42 5 5 27 5 17 13:00 40 21 17 14 43 10 5 27 8 18 14:00 51 17 13 22 49 12 4 30 8 20 15:00 51 20 26 29 47 12 1 35 7 23 16:00 50 34 40 38 52 6 6 43 6 29 17:00 47 29 35 30 48 9 8 38 9 27 18:00 27 12 11 19 38 12 5 21 9 16 19:00 14 6 6 9 22 3 4 11 4 8 20:00 18 1 2 2 19 3 0 8 2 5 21:00 15 3 2 5 7 4 0 6 2 4 22:00 1 4 1 1 2 2 0 2 1 2 23:00 1 1 0 3 1 0 0 1 0 1
Total 642 310 327 414 709 230 80 480 155 345

Doc: 00413540.doc
Final, 24 October 2011 A.5
Site 4: Bluevale Road - Northeast of Kamilaroi Highway Day Mon Tue Wed Thu Fri Sat Sun W/Day W/End 7 Day Time 8-Nov-10 9-Nov-10 10-Nov-10 4-Nov-10 5-Nov-10 6-Nov-10 7-Nov-10 Ave. Ave. Ave 0:00 0 1 5 2 1 0 1 2 1 1 1:00 0 1 3 1 0 1 0 1 1 1 2:00 0 11 9 10 14 11 0 9 6 9 3:00 1 5 2 4 5 3 0 3 2 3 4:00 5 8 11 3 4 2 0 6 1 2 5:00 40 42 39 38 42 31 3 40 17 29 6:00 33 46 51 54 51 45 7 47 26 39 7:00 70 120 117 89 149 90 8 109 49 84 8:00 86 89 104 133 117 94 7 106 51 88 9:00 78 103 94 95 93 100 5 93 53 73 10:00 99 90 88 98 105 94 10 96 52 77 11:00 87 88 100 99 124 103 5 100 54 83 12:00 107 96 72 115 92 81 14 96 48 76 13:00 85 106 121 106 102 86 5 104 46 75 14:00 98 103 93 122 93 106 8 102 57 82 15:00 102 135 102 115 116 80 17 114 49 82 16:00 105 95 85 105 91 39 15 96 27 63 17:00 104 123 116 96 86 11 11 105 11 51 18:00 56 68 58 82 96 10 17 72 14 51 19:00 76 80 52 73 81 1 9 72 5 41 20:00 84 92 85 57 63 5 1 76 3 32 21:00 43 54 43 53 66 3 1 52 2 31 22:00 11 10 8 12 12 1 1 11 1 7 23:00 4 1 0 3 7 0 0 3 0 3
Total 1374 1567 1458 1565 1610 997 145 1515 571 1079

Doc: 00413540.doc
Final, 24 October 2011 A.6
Site 5: Kamilaroi Highway - between Blue Vale Road & CHPP Day Mon Tue Wed Thu Fri Sat Sun W/Day W/End 7 Day Time 6-Dec-10 7-Dec-10 1-Dec-10 2-Dec-10 3-Dec-10 4-Dec-10 5-Dec-10 Ave. Ave. Ave 0:00 9 9 8 14 6 9 10 9 9 1:00 2 6 8 9 3 5 6 5 6 2:00 3 17 15 15 18 7 13 7 14 3:00 3 11 7 12 7 5 8 5 8 4:00 9 18 26 27 9 10 20 10 18 5:00 70 105 85 89 38 14 87 14 57 6:00 109 106 126 109 46 33 113 33 79 7:00 165 188 234 196 91 46 196 46 142 8:00 218 232 235 248 164 83 233 83 183 9:00 192 203 231 219 191 82 211 82 181 10:00 199 193 262 233 210 258 136 219 136 220 11:00 190 204 207 201 216 187 138 204 138 190 12:00 190 192 212 201 208 174 123 201 123 184 13:00 231 204 217 224 212 154 132 218 132 188 14:00 219 211 274 236 240 181 148 236 148 216 15:00 248 222 252 236 263 164 115 244 115 206 16:00 250 229 231 236 243 125 177 238 177 202 17:00 235 244 208 236 245 140 137 234 137 193 18:00 174 153 155 174 183 106 105 168 105 145 19:00 112 107 105 114 139 60 85 115 85 101 20:00 80 74 93 82 28 45 82 45 62 21:00 76 68 72 68 35 29 71 29 51 22:00 35 28 38 53 25 25 39 25 35 23:00 16 15 28 32 16 13 23 13 22
Total 3035 3039 3098 2322 3332 2226 1702 3188 1702 2709

Doc: 00413540.doc
Final, 24 October 2011 A.7
Site 6: CHPP Access Road Day Mon Tue Wed Thu Fri Sat Sun W/Day W/End 7 Day Time 6-Dec-10 30-Nov-10 1-Dec-10 2-Dec-10 3-Dec-10 4-Dec-10 5-Dec-10 Ave. Ave. Ave 0:00 0 0 0 0 0 0 0 0 0 0 1:00 0 0 0 2 0 0 0 0 0 0 2:00 0 0 0 0 0 0 0 0 0 0 3:00 2 0 0 0 0 0 0 0 0 0 4:00 0 0 0 0 0 0 0 0 0 0 5:00 0 0 2 1 1 0 0 1 0 1 6:00 3 0 11 7 9 2 0 6 1 5 7:00 60 12 72 60 55 21 0 52 11 37 8:00 44 68 55 34 37 25 0 48 13 37 9:00 42 66 62 41 45 24 1 51 13 40 10:00 52 37 64 48 45 23 3 49 13 37 11:00 40 59 47 46 35 18 2 45 10 35 12:00 48 64 72 47 45 22 0 55 11 42 13:00 54 57 57 42 43 24 1 51 13 37 14:00 40 51 51 33 40 22 1 43 12 33 15:00 42 63 52 34 39 12 1 46 7 34 16:00 31 59 47 38 43 0 1 44 1 31 17:00 59 58 56 57 45 0 0 55 0 36 18:00 40 41 32 36 31 0 0 36 0 23 19:00 37 35 28 25 36 0 0 32 0 21 20:00 38 27 27 32 22 0 0 29 0 18 21:00 32 31 26 33 20 0 0 28 0 18 22:00 0 0 1 0 1 0 0 0 0 0 23:00 2 0 0 2 0 0 0 1 0 0
Total 666 728 762 618 592 193 10 673 102 484

Doc: 00413540.doc
Final, 24 October 2011 A.8
Site 7: Dripping Rock Road - East of Goonbri Road Day Mon Tue Wed Thu Fri Sat Sun W/Day W/End 7 Day Time 6-Dec-10 30-Nov-10 1-Dec-10 2-Dec-10 3-Dec-10 4-Dec-10 5-Dec-10 Ave. Ave. Ave 0:00 0 0 0 0 0 0 0 0 0 0 1:00 0 0 0 0 0 0 0 0 0 0 2:00 0 0 0 0 0 0 0 0 0 0 3:00 0 1 0 0 0 0 0 0 0 0 4:00 0 0 0 0 0 0 0 0 0 0 5:00 1 1 0 1 1 0 0 1 0 1 6:00 0 2 2 1 1 2 0 1 1 1 7:00 1 2 1 0 0 0 0 1 0 1 8:00 0 3 2 2 2 0 0 2 0 2 9:00 0 2 1 0 0 0 0 1 0 1 10:00 2 2 1 4 1 0 0 2 0 1 11:00 0 2 2 0 0 0 0 1 0 1 12:00 2 2 2 0 0 1 0 1 1 1 13:00 2 1 0 5 2 0 2 2 1 2 14:00 2 3 0 0 0 0 0 1 0 1 15:00 2 1 0 1 4 0 0 2 0 1 16:00 2 1 2 2 4 0 1 2 1 2 17:00 3 2 2 3 6 1 0 3 1 2 18:00 0 1 0 0 3 0 0 1 0 1 19:00 2 0 0 0 0 0 0 0 0 0 20:00 0 0 0 1 0 0 0 0 0 0 21:00 0 1 0 0 0 0 0 0 0 0 22:00 0 0 1 0 0 0 0 0 0 0 23:00 0 0 0 0 0 0 0 0 0 0
Total 19 27 16 20 24 4 3 21 4 16

Doc: 00413540.doc
Final, 24 October 2011 A.9
Site 8: Goonbri Road - East of Leards Forest Road Day Mon Tue Wed Thu Fri Sat Sun W/Day W/End 7 Day Time 6-Dec-10 30-Nov-10 1-Dec-10 2-Dec-10 3-Dec-10 4-Dec-10 5-Dec-10 Ave. Ave. Ave 0:00 0 0 0 0 0 0 0 0 0 0 1:00 0 0 0 0 0 3 0 0 2 1 2:00 0 3 3 3 3 0 0 2 0 2 3:00 0 2 0 0 0 0 0 0 0 0 4:00 0 1 1 0 0 1 0 0 1 1 5:00 7 7 5 5 7 5 3 6 4 5 6:00 5 6 7 10 7 5 3 7 4 6 7:00 5 4 2 5 1 0 0 3 0 2 8:00 2 4 2 1 4 1 2 3 2 2 9:00 1 3 2 3 0 0 4 2 2 2 10:00 5 7 3 0 1 0 3 3 2 2 11:00 2 2 0 2 2 0 1 2 1 1 12:00 2 0 3 3 0 2 2 2 2 2 13:00 2 3 6 2 1 0 0 3 0 2 14:00 5 3 1 0 1 0 0 2 0 1 15:00 1 2 2 1 3 0 0 2 0 1 16:00 7 9 6 12 8 1 1 8 1 6 17:00 10 5 4 2 9 1 2 6 2 4 18:00 2 2 3 2 8 5 1 3 3 4 19:00 1 0 0 0 0 1 0 0 1 0 20:00 0 1 0 1 0 1 2 0 2 1 21:00 0 1 0 0 3 0 0 1 0 1 22:00 0 1 1 0 0 1 0 0 1 1 23:00 0 0 0 0 0 0 0 0 0 0
Total 57 66 51 52 58 27 24 57 26 46
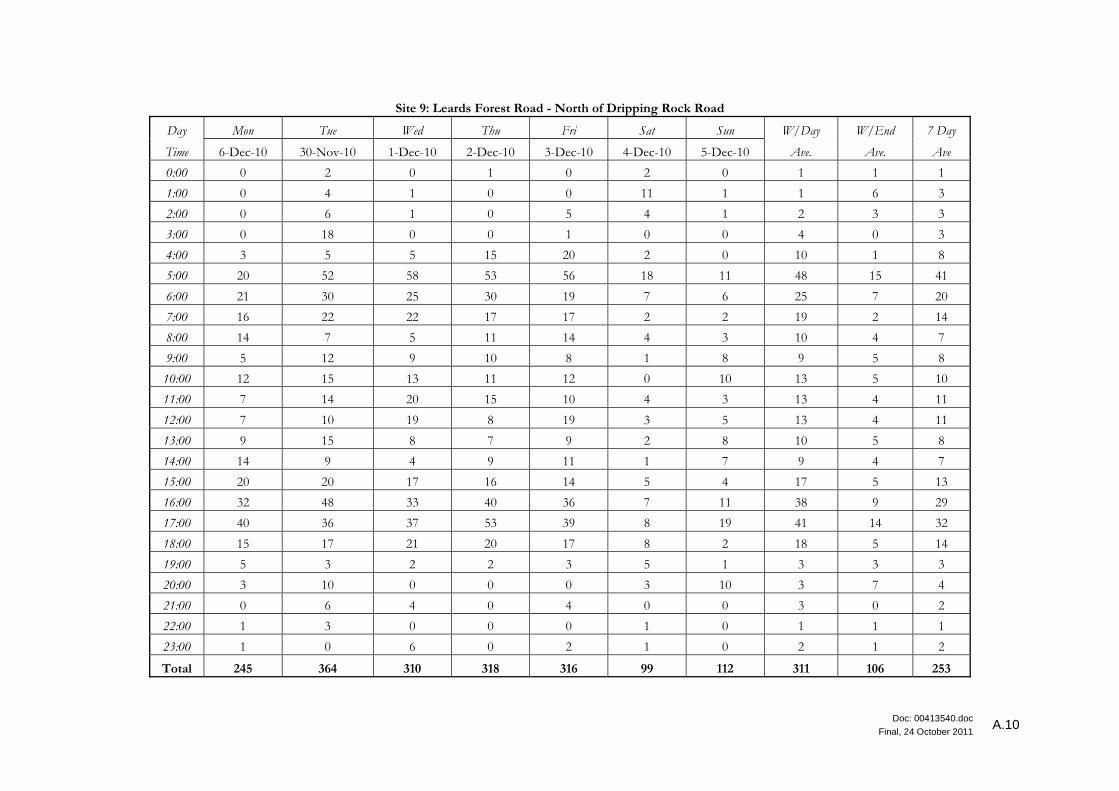
Doc: 00413540.doc
Final, 24 October 2011 A.10
Site 9: Leards Forest Road - North of Dripping Rock Road Day Mon Tue Wed Thu Fri Sat Sun W/Day W/End 7 Day Time 6-Dec-10 30-Nov-10 1-Dec-10 2-Dec-10 3-Dec-10 4-Dec-10 5-Dec-10 Ave. Ave. Ave 0:00 0 2 0 1 0 2 0 1 1 1 1:00 0 4 1 0 0 11 1 1 6 3 2:00 0 6 1 0 5 4 1 2 3 3 3:00 0 18 0 0 1 0 0 4 0 3 4:00 3 5 5 15 20 2 0 10 1 8 5:00 20 52 58 53 56 18 11 48 15 41 6:00 21 30 25 30 19 7 6 25 7 20 7:00 16 22 22 17 17 2 2 19 2 14 8:00 14 7 5 11 14 4 3 10 4 7 9:00 5 12 9 10 8 1 8 9 5 8 10:00 12 15 13 11 12 0 10 13 5 10 11:00 7 14 20 15 10 4 3 13 4 11 12:00 7 10 19 8 19 3 5 13 4 11 13:00 9 15 8 7 9 2 8 10 5 8 14:00 14 9 4 9 11 1 7 9 4 7 15:00 20 20 17 16 14 5 4 17 5 13 16:00 32 48 33 40 36 7 11 38 9 29 17:00 40 36 37 53 39 8 19 41 14 32 18:00 15 17 21 20 17 8 2 18 5 14 19:00 5 3 2 2 3 5 1 3 3 3 20:00 3 10 0 0 0 3 10 3 7 4 21:00 0 6 4 0 4 0 0 3 0 2 22:00 1 3 0 0 0 1 0 1 1 1 23:00 1 0 6 0 2 1 0 2 1 2
Total 245 364 310 318 316 99 112 311 106 253

Doc: 00413540.doc
Final, 24 October 2011 A.11
Site 10: Barbers Lagoon Road - South of Rangari Road Day Mon Tue Wed Thu Fri Sat Sun W/Day W/End 7 Day Time 6-Dec-10 30-Nov-10 1-Dec-10 2-Dec-10 3-Dec-10 4-Dec-10 5-Dec-10 Ave. Ave. Ave 0:00 0 0 0 0 0 0 0 0 0 0 1:00 0 0 0 0 0 0 0 0 0 0 2:00 0 0 0 0 0 0 0 0 0 0 3:00 0 0 0 0 0 0 0 0 0 0 4:00 0 0 0 0 0 0 0 0 0 0 5:00 3 1 3 2 3 0 0 2 0 2 6:00 1 0 2 0 2 3 0 1 2 1 7:00 2 3 3 0 6 2 2 3 2 3 8:00 2 3 4 3 10 6 0 4 3 4 9:00 4 3 4 1 4 6 3 3 5 4 10:00 2 0 0 2 4 2 4 2 3 2 11:00 4 2 4 0 4 3 2 3 3 3 12:00 8 3 2 1 1 0 1 3 1 1 13:00 2 0 3 2 7 0 9 3 5 4 14:00 4 4 4 6 4 2 1 4 2 4 15:00 8 4 8 4 3 1 0 5 1 3 16:00 6 6 2 4 2 4 3 4 4 4 17:00 9 3 1 6 8 1 8 5 5 5 18:00 3 3 2 4 4 2 1 3 2 3 19:00 2 1 1 3 3 3 2 2 3 2 20:00 1 1 1 0 3 0 3 1 2 1 21:00 0 2 1 1 0 1 0 1 1 1 22:00 1 1 0 0 0 0 0 0 0 0 23:00 1 0 0 0 0 1 1 0 1 0
Total 63 40 45 39 68 37 40 51 39 45

Doc: 00413540.doc
Final, 24 October 2011 A.12
Site 11: Rangari Road - East of Haul Route Day Mon Tue Wed Thu Fri Sat Sun W/Day W/End 7 Day Time 6-Dec-10 7-Dec-10 01-Dec-10 2-Dec-10 3-Dec-10 4-Dec-10 5-Dec-10 Ave. Ave. Ave 0:00 0 0 0 0 0 0 0 0 0 0 1:00 0 1 1 0 0 1 1 0 1 1 2:00 0 2 2 2 2 2 0 2 1 2 3:00 0 0 0 1 0 0 0 0 0 0 4:00 1 1 0 0 2 0 0 1 0 0 5:00 1 3 2 3 4 1 0 3 1 2 6:00 7 5 9 8 9 6 0 8 3 6 7:00 4 5 2 5 3 0 1 4 1 2 8:00 4 1 3 5 3 4 0 3 2 3 9:00 3 2 4 5 4 3 3 4 3 4 10:00 3 2 3 2 4 4 2 3 3 3 11:00 4 1 2 4 2 3 3 3 3 3 12:00 3 2 4 2 1 5 5 2 5 3 13:00 3 1 3 4 8 2 1 4 2 4 14:00 1 1 3 3 2 2 1 2 2 2 15:00 9 1 5 9 2 4 5 5 5 5 16:00 6 7 7 8 4 1 2 6 2 4 17:00 8 6 6 6 8 2 7 7 5 6 18:00 7 4 5 8 10 5 1 7 3 6 19:00 2 1 3 2 1 3 2 2 3 2 20:00 1 3 1 2 0 0 2 1 1 1 21:00 0 0 1 0 0 1 0 0 1 0 22:00 0 0 2 0 2 0 0 1 0 1 23:00 0 1 0 0 0 1 1 0 1 0
Total 67 50 68 79 71 50 37 67 44 61

Doc: 00413540.doc
Final, 24 October 2011 A.13
Site 12: Rangari Road - West of Haul Route Day Mon Tue Wed Thu Fri Sat Sun W/Day W/End 7 Day Time 31-Jan-11 1-Feb-11 2-Feb-11 3-Feb-11 28-Jan-11 29-Jan-11 30-Jan-11 Ave. Ave. Ave 0:00 0 1 4 0 0 1 2 1 2 1 1:00 0 0 0 1 1 0 3 0 2 1 2:00 0 10 10 10 13 12 1 9 7 9 3:00 1 0 0 1 2 0 1 1 1 1 4:00 2 6 10 11 7 5 2 7 4 5 5:00 19 17 23 23 14 12 8 19 10 11 6:00 45 45 55 43 46 32 8 47 20 29 7:00 35 52 39 53 34 18 6 43 12 19 8:00 39 36 43 31 31 30 11 36 21 24 9:00 38 44 42 29 22 32 7 35 20 20 10:00 39 38 40 38 30 27 8 37 18 22 11:00 52 34 45 35 40 31 6 41 19 26 12:00 39 48 34 36 37 17 2 39 10 19 13:00 37 34 38 31 35 28 7 35 18 23 14:00 38 33 24 25 40 27 8 32 18 25 15:00 41 41 48 32 39 21 7 40 14 22 16:00 66 61 63 55 56 3 11 60 7 23 17:00 58 61 62 61 44 18 11 57 15 24 18:00 45 43 39 37 34 12 12 40 12 19 19:00 23 28 25 31 27 7 5 27 6 13 20:00 16 25 30 19 20 8 2 22 5 10 21:00 8 9 6 11 6 3 3 8 3 4 22:00 0 1 1 2 0 0 1 1 1 0 23:00 0 0 1 0 0 0 0 0 0 0
Total 641 667 682 615 578 344 132 637 238 351

Doc: 00413540.doc
Final, 24 October 2011 A.14
Site 13: Rangari Road - East of Kamilaroi Highway Day Mon Tue Wed Thu Fri Sat Sun W/Day W/End 7 Day Time 6-Dec-10 30-Nov-10 1-Dec-10 2-Dec-10 3-Dec-10 4-Dec-10 5-Dec-10 Ave. Ave. Ave 0:00 0 1 1 5 0 0 2 1 1 2 1:00 0 5 3 0 0 1 0 2 1 2 2:00 0 10 5 3 9 4 0 5 2 5 3:00 0 14 0 0 1 0 0 3 0 3 4:00 2 8 7 14 17 0 0 10 0 8 5:00 0 52 55 51 58 10 3 43 7 38 6:00 12 33 31 38 36 6 6 30 6 25 7:00 0 19 24 26 26 0 12 19 6 18 8:00 2 19 13 18 28 5 6 16 6 15 9:00 2 30 23 20 20 0 10 19 5 17 10:00 12 16 19 21 18 4 6 17 5 14 11:00 2 30 18 10 21 8 7 16 8 16 12:00 8 21 23 8 27 6 3 17 5 15 13:00 2 27 15 19 24 15 6 17 11 18 14:00 0 13 21 21 19 8 2 15 5 14 15:00 0 30 21 22 34 8 6 21 7 20 16:00 2 52 48 55 44 7 4 40 6 35 17:00 0 39 45 56 53 12 12 39 12 36 18:00 0 25 25 26 26 9 9 20 9 20 19:00 0 10 4 8 12 0 15 7 8 8 20:00 0 6 1 3 5 0 6 3 3 4 21:00 0 11 5 2 1 0 0 4 0 3 22:00 0 4 5 0 3 2 2 2 2 3 23:00 0 0 2 0 2 0 0 1 0 1
Total 44 475 414 426 484 105 117 369 111 337

Doc: 00413540.doc
Final, 24 October 2011 A.15
Site 14: Therribri Road - North of Rangari Road Day Mon Tue Wed Thu Fri Sat Sun W/Day W/End 7 Day Time 6-Dec-10 30-Nov-10 1-Dec-10 2-Dec-10 3-Dec-10 4-Dec-10 5-Dec-10 Ave. Ave. Ave 0:00 0 0 0 0 0 0 0 0 0 0 1:00 0 0 0 0 0 1 0 0 1 0 2:00 0 0 1 0 1 0 0 0 0 0 3:00 0 0 0 1 0 0 0 0 0 0 4:00 0 0 0 1 0 0 0 0 0 0 5:00 3 3 1 0 0 1 0 1 1 1 6:00 4 1 1 0 0 1 0 1 1 1 7:00 2 2 6 4 5 4 0 4 2 4 8:00 2 7 5 5 4 4 6 5 5 5 9:00 1 6 10 4 6 5 7 5 6 6 10:00 4 4 4 5 4 5 5 4 5 5 11:00 4 5 3 0 4 4 3 3 4 3 12:00 2 7 4 2 3 0 4 4 2 3 13:00 5 8 7 0 8 0 4 6 2 5 14:00 1 4 9 1 9 8 9 5 9 7 15:00 2 5 5 7 13 1 4 6 3 6 16:00 1 2 3 7 3 3 7 3 5 4 17:00 5 6 4 4 7 5 1 5 3 5 18:00 6 8 5 5 1 1 5 5 3 4 19:00 1 1 0 1 6 3 1 2 2 2 20:00 0 1 0 0 4 2 3 1 3 2 21:00 0 0 1 2 0 1 0 1 1 1 22:00 0 0 2 0 0 0 0 0 0 0 23:00 0 0 0 0 0 0 0 0 0 0
Total 43 70 71 49 78 49 59 62 54 63

Doc: 00413540.doc
Final, 24 October 2011 A.16
Site 15: Shannon Harbour Road - East of Blue Vale Road Day Mon Tue Wed Thu Fri Sat Sun W/Day W/End 7 Day Time 14-Feb-11 08-Feb-11 9-Feb-11 10-Feb-11 11-Feb-11 12-Feb-11 13-Feb-11 Ave. Ave. Ave 0:00 0 0 0 0 0 0 1 0 1 0 1:00 0 0 1 0 0 0 1 0 1 0 2:00 0 1 1 1 1 1 0 1 1 1 3:00 0 1 1 1 1 1 0 1 1 1 4:00 0 1 0 0 0 0 0 0 0 0 5:00 3 4 6 5 5 1 1 5 1 4 6:00 14 11 11 14 15 7 6 13 7 11 7:00 22 7 7 9 28 4 1 15 3 9 8:00 30 5 6 8 22 2 2 14 2 8 9:00 40 6 8 13 25 4 3 18 4 10 10:00 30 2 9 12 33 13 2 17 8 12 11:00 30 3 5 8 36 17 0 16 9 12 12:00 31 2 4 11 17 4 1 13 3 7 13:00 32 1 5 4 19 3 6 12 5 6 14:00 18 6 1 6 21 5 5 10 5 7 15:00 27 8 6 11 27 3 2 16 3 10 16:00 30 10 5 15 26 3 0 17 2 10 17:00 31 3 3 5 20 0 0 12 0 5 18:00 34 8 6 6 19 4 0 15 2 7 19:00 15 2 1 2 12 1 0 6 1 3 20:00 33 0 1 0 14 0 0 10 0 3 21:00 16 0 0 1 5 1 0 4 1 1 22:00 0 0 0 2 0 0 0 0 0 0 23:00 1 0 0 0 1 0 0 0 0 0
Total 437 81 87 134 347 74 31 217 53 126

Doc: 00413540.doc
Final, 24 October 2011 A.17
Site 16: Kamilaroi Highway - South of Rangari Road Day Mon Tue Wed Thu Fri Sat Sun W/Day W/End 7 Day Time 6-Dec-10 30-Nov-10 1-Dec-10 2-Dec-10 3-Dec-10 4-Dec-10 5-Dec-10 Ave. Ave. Ave 0:00 4 10 13 7 11 7 13 9 10 10 1:00 4 7 4 6 6 4 5 5 5 5 2:00 5 10 5 6 15 6 1 8 4 7 3:00 2 19 7 6 7 7 3 8 5 8 4:00 7 17 18 16 25 3 10 17 7 15 5:00 59 66 72 78 86 28 12 72 20 57 6:00 103 76 98 94 102 49 29 95 39 75 7:00 123 118 117 119 131 75 51 122 63 102 8:00 133 156 132 158 153 93 61 146 77 126 9:00 129 134 137 146 142 102 75 138 89 123 10:00 104 152 159 130 134 125 83 136 104 131 11:00 132 157 125 127 125 101 94 133 98 122 12:00 108 128 127 125 154 108 96 128 102 123 13:00 105 148 118 149 132 120 91 130 106 126 14:00 134 130 154 137 134 99 100 138 100 126 15:00 148 151 121 147 154 82 94 144 88 125 16:00 125 159 158 164 163 89 139 154 114 145 17:00 134 170 145 151 167 121 115 153 118 145 18:00 99 121 104 120 120 75 90 113 83 105 19:00 53 53 62 70 64 32 62 60 47 57 20:00 33 43 36 46 47 26 50 41 38 41 21:00 31 30 44 29 33 14 23 33 19 29 22:00 24 28 26 16 19 19 17 23 18 21 23:00 14 11 22 27 32 6 11 21 9 18
Total 1813 2094 2004 2074 2156 1391 1325 2028 1358 1841

Doc: 00413540.doc
Final, 24 October 2011 A.18
Site 17: Braymont Road - at Namoi River Bridge Day Mon Tue Wed Thu Fri Sat Sun W/Day W/End 7 Day Time 6-Dec-10 30-Nov-10 1-Dec-10 2-Dec-10 3-Dec-10 4-Dec-10 5-Dec-10 Ave. Ave. Ave 0:00 0 0 0 0 0 1:00 0 0 0 0 0 2:00 0 0 0 0 0 3:00 0 0 0 0 0 4:00 0 0 0 0 0 5:00 5 8 3 1 4 6:00 2 2 1 4 2 7:00 3 8 15 5 8 8:00 10 17 16 10 13 9:00 3 7 10 2 6 10:00 6 2 4 5 4 11:00 7 3 3 15 7 12:00 9 4 7 5 6 13:00 2 5 11 1 5 14:00 10 11 10 7 10 15:00 10 19 18 2 12 16:00 14 21 19 6 15 17:00 20 15 13 12 15 18:00 4 8 13 2 7 19:00 0 5 7 5 4 20:00 4 4 3 1 3 21:00 2 2 0 1 1 22:00 0 0 0 0 0 23:00 0 0 0 0 0
Total 111 141 153 84 122

Doc: 00413540.doc
Final, 24 October 2011 A.19
Site 18: Kamilaroi Highway - North of Blue Vale Road Day Mon Tue Wed Thu Fri Sat Sun W/Day W/End 7 Day Time 11-Oct-10 12-Oct-10 13-Oct-10 7-Oct-10 8-Oct-10 9-Oct-10 10-Oct-10 Ave. Ave. Ave 0:00 17 7 12 6 11 12 5 11 9 9 1:00 5 3 8 8 7 10 6 6 8 8 2:00 6 6 6 9 4 13 5 6 9 8 3:00 13 10 17 12 13 8 8 13 8 10 4:00 21 23 25 20 22 19 10 22 15 18 5:00 74 86 98 98 85 43 26 88 35 63 6:00 128 115 118 93 96 53 34 110 44 69 7:00 147 150 168 140 133 107 59 148 83 110 8:00 146 190 185 164 156 132 87 168 110 135 9:00 169 172 167 203 184 167 126 179 147 170 10:00 160 158 162 177 164 146 142 164 144 157 11:00 172 151 186 189 166 166 132 173 149 163 12:00 151 125 157 201 168 157 178 160 168 176 13:00 159 181 171 178 181 171 149 174 160 170 14:00 153 159 161 174 203 126 166 170 146 167 15:00 186 160 216 177 213 143 157 190 150 173 16:00 203 166 217 229 194 122 123 202 123 167 17:00 179 180 195 206 196 110 108 191 109 155 18:00 109 107 118 133 131 87 85 120 86 109 19:00 80 64 55 68 89 55 56 71 56 67 20:00 49 46 35 31 60 45 50 44 48 47 21:00 32 30 41 34 36 23 26 35 25 30 22:00 18 20 24 33 25 24 17 24 21 25 23:00 22 12 18 22 20 7 7 19 7 14
Total 2399 2321 2560 2605 2557 1946 1762 2488 1854 2218

Doc: 00413540.doc
Final, 24 O
ctober 2011 A
.20

Doc: 00413540.doc
Final, 24 October 2011 B.1
Attachment B. Roads and Traffic Authority Crash Data

Rep ID: User ID:REG01 Generated:Office: synottjGrafton 16/05/2011 11:38
Crashid dataset Gunnedah - Boggabri Coal Project Crash Data 1/10/2005 to 30/9/2010
Percentages are percentages of all crashes. Unknown values for each category are not shown on this report.
Page 1 of 1
Car Crash
Light Truck Crash
Rigid Truck Crash
Articulated Truck Crash
'Heavy Truck Crash
Bus Crash
"Heavy Vehicle Crash
Emergency Vehicle Crash
Motorcycle Crash
Pedal Cycle Crash
Pedestrian Crash
34
16
6
16
(21)
0
(21)
0
4
0
0
54.0%
25.4%
9.5%
25.4%
(33.3%)
0.0%
(33.3%)
0.0%
6.3%
0.0%
0.0%
# Crash Type
' Rigid or Artic. Truck " Heavy Truck or Heavy Bus# These categories are NOT mutually exclusive
*Intersection
Non intersection
6
57
9.5%
90.5%
Location Type
* Up to 10 metres from an intersection
~ 07:30-09:30 or 14:30-17:00 on school days
Single Vehicle
Multi Vehicle
46
17
73.0%
27.0%
Collision Type
Freeway/Motorway
State HighwayOther Classified Road
Unclassified Road
0
35
6
22
0.0%
55.6%
9.5%
34.9%
Road Classification
Contributing Factors
Speeding
Fatigue
Alcohol
18
10
4
28.6%
15.9%
6.3%
Weather
FineRainOvercastFog or mistOther
54
2
5
1
0
85.7%
3.2%
7.9%
1.6%
0.0%
Road Surface Condition
Wet
Dry
Snow or ice
5
58
0
7.9%
92.1%
0.0%
Natural Lighting
Dawn
Daylight
Dusk
Darkness
2
36
6
19
3.2%
57.1%
9.5%
30.2%
Speed Limit40 km/h or less
50 km/h zone
60 km/h zone
70 km/h zone
80 km/h zone
90 km/h zone
100 km/h zone
110 km/h zone
1
7
1
0
5
0
49
0
1.6%
11.1%
1.6%
0.0%
7.9%
0.0%
77.8%
0.0%
Monday
Tuesday
Wednesday
Thursday
Friday
Saturday
Sunday
WEEKDAY
WEEKEND
8
10
8
10
9
8
10
45
18
12.7%
15.9%
12.7%
15.9%
14.3%
12.7%
15.9%
71.4%
28.6%
Day of the Week # Holiday Periods
Fatal crash
Injury crash
Non-casualty crash
1
29
33
1.6%
46.0%
52.4%
CRASHES
00:01 - 02:5903:00 - 04:59
05:00 - 05:59
06:00 - 06:5907:00 - 07:59
08:00 - 08:59
09:00 - 09:59
10:00 - 10:5911:00 - 11:59
12:00 - 12:59
13:00 - 13:59
14:00 - 14:5915:00 - 15:59
16:00 - 16:59
17:00 - 17:59
18:00 - 18:5919:00 - 19:59
20:00 - 21:59
22:00 - 24:00
3
2
1
2
2
4
1
1
2
5
4
6
4
6
3
5
4
6
2
4.8%
3.2%
1.6%
3.2%
3.2%
6.3%
1.6%
1.6%
3.2%
7.9%
6.3%
9.5%
6.3%
9.5%
4.8%
7.9%
6.3%
9.5%
3.2%
12.5%
8.3%
4.2%
4.2%
4.2%
4.2%
4.2%
4.2%
4.2%
4.2%
4.2%
4.2%
4.2%
4.2%
4.2%
4.2%
4.2%
8.3%
8.3%
Time Group % of Day
17 19 89.5%in Darkof
Street Lighting Off/Nil % of Dark
New Year
Aust. Day
Easter
Anzac Day
Queen's BD
Labour Day
Christmas
January SH
Easter SH
June/July SH
Sept./Oct. SH
December SH
0
0
0
0
1
1
0
1
3
7
1
0
0.0%
0.0%
0.0%
0.0%
1.6%
1.6%
0.0%
1.6%
4.8%
11.1%
1.6%
0.0%
Killed
Injured
^ Unrestrained
5
33
1
13.2%
86.8%
2.6%
CASUALTIES
7
9
4
11
7
2010
2009
2008
2007
2006
11
17
9
10
16
CasualtiesCrashes
13 20.6%Involvement
~ School Travel Time
A
B
C
DE
F
GH
I
J
8
3
14
3
2
9
9
7
4
4
17.9%
7.1%
17.9%
3.5%
3.6%
10.7%
7.1%
7.1%
12.5%
10.7%
12.7%
4.8%
22.2%
4.8%
3.2%
14.3%
14.3%
11.1%
6.3%
6.3%
McLean Periods % Week
Crash Movement
Intersection, adjacent approaches
Head-on (not overtaking)
Opposing vehicles; turning
U-turn
Rear-end
Lane change
Parallel lanes; turning
Vehicle leaving driveway
Overtaking; same direction
Hit parked vehicle
Hit railway train
Hit pedestrian
Permanent obstruction on road
Hit animal
Off road, on straight
Off road on straight, hit object
Out of control on straight
Off road, on curve
Off road on curve, hit object
Out of control on curve
Other crash type
3
3
1
0
4
0
0
1
1
1
0
0
0
8
7
9
1
8
10
2
4
4.8%
4.8%
1.6%
0.0%
6.3%
0.0%
0.0%
1.6%
1.6%
1.6%
0.0%
0.0%
0.0%
12.7%
11.1%
14.3%
1.6%
12.7%
15.9%
3.2%
6.3%
63
^ Belt fitted but not worn, No restraint fitted to position OR No helmet worn
38
Summary Crash Report
1~ 40km/h or less 7.7%

Generated:Rep ID: BCR01 User ID:Office: 16/05/2011 11:38Grafton synottj
Brief Crash Report
Page 1 of 4
Northern Region
Gunnedah LGA
Boggabri
Emerald Hill
Gunnedah
Kamilaroi Hwy
Kamilaroi Hwy
Blue Vale Rd
Bluevale Rd
Farrar Rd
Kamilaroi Hwy
Old Blue Vale Rd
Quia Rd
Wean Rd
508841
603794
587887
645705
666016
554911
532816
649912
633001
675454
720826
618584
693102
720103
673102
710166
587966
13/02/2006
14/12/2007
16/08/2007
12/11/2008
05/05/2009
27/11/2006
19/08/2006
10/12/2008
15/07/2008
16/07/2009
09/08/2010
03/04/2008
14/12/2009
24/07/2010
14/05/2009
11/05/2010
27/08/2007
00:01
15:00
19:45
05:15
14:20
13:00
02:10
17:05
07:00
18:45
18:25
06:30
14:40
19:00
06:45
18:00
20:30
15 km
15 km
15 km
9.725 k
640 m
2 km
8 km
2 km
50 m
5 km
10 km
2 km
550 m
1.55 km
7 km
BOGGABRI TN
BOGGABRI TN
GOOLHI RD
GUNNEDAH TN
KAMILAROI HWY
VICKERY RD
WHITEHAVEN MIN RD
GUNNEDAH TN
UNNAMED RD
BLUE VALE RD
BLUE VALE RD
GUNNEDAH TN
GUNNEDAH TN
KELVIN RD
KAMILAROI HWY
KELVIN RD
KELVIN RD
2WY
2WY
TJN
2WY
2WY
2WY
2WY
2WY
TJN
2WY
2WY
2WY
2WY
2WY
2WY
2WY
2WY
STR
CRV
CRV
CRV
CRV
CRV
CRV
STR
STR
STR
STR
STR
CRV
STR
STR
CRV
STR
Nil
Nil
Nil
Nil
Nil
Nil
Nil
Nil
Nil
Nil
On
Nil
Nil
Nil
Nil
Nil
Nil
Overcast
Fine
Raining
Fine
Fine
Fine
Fine
Fine
Fog or mis
Fine
Fine
Fine
Fine
Fine
Fine
Overcast
Fine
Dry
Dry
Wet
Dry
Dry
Dry
Dry
Dry
Wet
Dry
Dry
Dry
Dry
Dry
Dry
Dry
Dry
100
100
100
100
100
100
100
100
80
100
60
100
100
100
80
100
100
1
1
1
1
2
1
1
2
2
1
2
1
1
1
1
1
1
CAR
4WD
CAR
BDBL
LOR
SEM
CAR
BDBL
UTE
CAR
CAR
CAR
SEM
TRK
LOR
TRK
CAR
1
1
1
1
1
1
1
1
1
1
1
1
1
1
1
1
1
N
E
S
N
N
S
N
N
W
E
S
S
N
W
W
N
S
Proceeding in lane
Proceeding in lane
Proceeding in lane
Proceeding in lane
Incorrect side
Proceeding in lane
Proceeding in lane
Pull out opposite
Turning right
Proceeding in lane
Proceeding in lane
Proceeding in lane
Proceeding in lane
Proceeding in lane
Proceeding in lane
Proceeding in lane
Proceeding in lane
BDBL
TRT
M/C
LOR
1
1
1
1
S
N
E
N
Proceeding in lane
Turning right
Proceeding in lane
Proceeding in lane
0
0
0
0
0
0
0
0
0
0
0
0
0
0
0
0
0
0
1
0
0
0
0
0
0
1
0
1
0
0
0
1
2
0
S
S
S
S F
Crash No Date Time Dist ID Feature Loc Alg Lgt Wth Sfc SL DCA Tus TU1 S1 D Manoeuvre1 TU2 S2 D Manoeuvre2 K I Fac
S
S
at
N
N
S
N
N
at
N
S
N
N
W
W
N
N
Mon
Fri
Thu
Wed
Tue
Mon
Sat
Wed
Tue
Thu
Mon
Thu
Mon
Sat
Thu
Tue
Mon
Day
609
803
804
801
201
804
804
506
202
703
606
609
803
609
600
804
609
L
L
L
L
R
R
R
FS

Generated:Rep ID: BCR01 User ID:Office: 16/05/2011 11:38Grafton synottj
Brief Crash Report
Page 2 of 4
Western Region
Narrabri LGA
Wean
Baan Baa
Boggabri
Wean Rd
Kamilaroi Hwy
Old Narrabri Rd
Boggabri Rd
Boston St
Braymont Rd
596334
528498
630782
579295
691317
667082
554221
628344
597737
533581
690428
720145
619355
576539
526812
668108
661495
548559
518820
538552
31/10/2007
08/07/2006
10/07/2008
15/06/2007
28/06/2009
04/05/2009
02/02/2007
01/06/2008
16/12/2007
25/08/2006
12/11/2009
27/07/2010
27/03/2008
04/06/2007
10/06/2006
12/05/2009
24/03/2009
21/11/2006
29/04/2006
01/10/2006
20:00
12:25
08:00
19:00
16:10
12:25
10:40
20:20
16:00
23:55
08:45
14:30
12:20
21:45
13:00
08:30
14:45
08:10
15:30
17:10
2 km
25 km
26 km
2 km
2 km
3 km
5 km
5 km
6 km
100 m
500 m
100 m
29 km
30 km
45 km
700 m
100 m
5 km
2 km
3 km
KEPREOTIS RD
GUNNEDAH TN
GUNNEDAH TN
BAAN BAA TN
BAAN BAA TN
BAAN BAA TN
BAAN BAA TN
BAAN BAA TN
BANN BAA TN
BARANBAH ST
BARANBAH ST
HARPARARY RD
NARRABRI TN
NARRABRI TN
NARRABRI TN
OLD NARRABRI RD
WALOWA ST
KAMILAROI HWY
WEAN RACECOURS O
WALTON ST
2WY
2WY
2WY
2WY
2WY
2WY
2WY
2WY
2WY
2WY
2WY
2WY
2WY
2WY
2WY
2WY
2WY
2WY
2WY
2WY
STR
STR
STR
STR
STR
STR
STR
STR
STR
STR
CRV
STR
STR
STR
CRV
CRV
STR
STR
STR
STR
Nil
Nil
Nil
Nil
Nil
Nil
Nil
Nil
Nil
Nil
Nil
Nil
Nil
Nil
Nil
Nil
Off
Nil
Nil
Nil
Fine
Fine
Fine
Fine
Overcast
Fine
Fine
Fine
Fine
Fine
Fine
Fine
Fine
Fine
Raining
Fine
Fine
Fine
Fine
Fine
Dry
Dry
Dry
Dry
Dry
Dry
Dry
Dry
Dry
Dry
Dry
Dry
Dry
Dry
Wet
Dry
Dry
Dry
Dry
Dry
100
100
100
100
100
100
100
100
100
80
100
100
100
100
100
100
40
100
100
100
1
1
1
1
1
1
1
1
2
1
2
1
2
1
2
1
2
2
1
1
TRK
CAR
CAR
CAR
CAR
SEM
TRK
TRK
CAR
CAR
SEM
TRK
4WD
4WD
M/C
SEM
TRK
UTE
CAR
CAR
1
1
1
1
1
1
1
1
1
1
1
1
1
1
1
1
1
1
1
1
N
N
S
W
E
E
N
N
S
S
S
W
N
S
N
N
S
S
W
W
Proceeding in lane
Proceeding in lane
Proceeding in lane
Proceeding in lane
Proceeding in lane
Proceeding in lane
Proceeding in lane
Proceeding in lane
Incorrect side
Proceeding in lane
Proceeding in lane
Proceeding in lane
Proceeding in lane
Proceeding in lane
Proceeding in lane
Proceeding in lane
Proceeding in lane
Proceeding in lane
Proceeding in lane
Proceeding in lane
SEM
UTE
OMV
M/C
SEM
LOR
1
1
1
1
1
1
N
S
S
N
S
S
Proceeding in lane
Proceeding in lane
Proceeding in lane
Proceeding in lane
Stationary
Proceeding in lane
0
0
0
0
0
0
0
0
5
0
0
0
0
0
0
0
0
0
0
0
1
0
1
0
1
1
1
1
1
0
0
0
0
0
3
1
0
1
0
1
S
S
F
F
F
F
Crash No Date Time Dist ID Feature Loc Alg Lgt Wth Sfc SL DCA Tus TU1 S1 D Manoeuvre1 TU2 S2 D Manoeuvre2 K I Fac
N
N
N
E
E
E
N
N
S
N
S
E
S
S
S
S
N
N
W
W
Wed
Sat
Thu
Fri
Sun
Mon
Fri
Sun
Sun
Fri
Thu
Tue
Thu
Mon
Sat
Tue
Tue
Tue
Sat
Sun
Day
609
703
705
609
702
704
701
703
201
701
301
704
610
609
805
801
301
301
702
702
L
FS
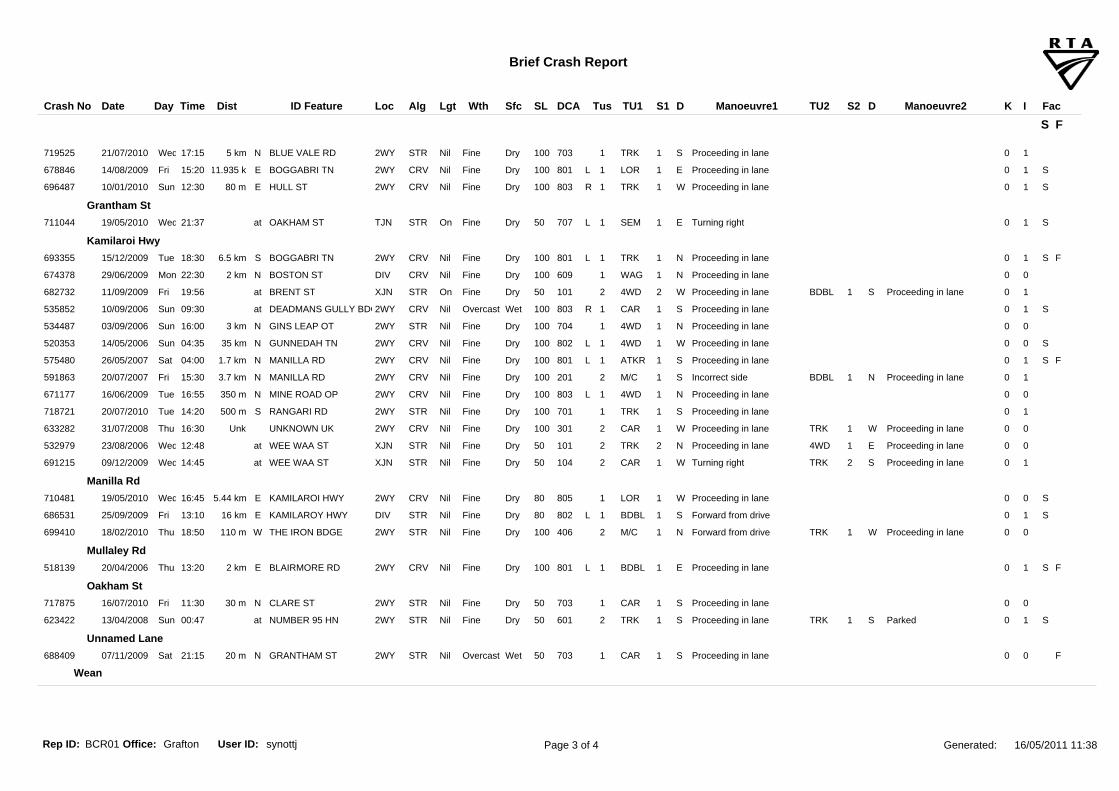
Generated:Rep ID: BCR01 User ID:Office: 16/05/2011 11:38Grafton synottj
Brief Crash Report
Page 3 of 4
Wean
Grantham St
Kamilaroi Hwy
Manilla Rd
Mullaley Rd
Oakham St
Unnamed Lane
719525
678846
696487
711044
693355
674378
682732
535852
534487
520353
575480
591863
671177
718721
633282
532979
691215
710481
686531
699410
518139
717875
623422
688409
21/07/2010
14/08/2009
10/01/2010
19/05/2010
15/12/2009
29/06/2009
11/09/2009
10/09/2006
03/09/2006
14/05/2006
26/05/2007
20/07/2007
16/06/2009
20/07/2010
31/07/2008
23/08/2006
09/12/2009
19/05/2010
25/09/2009
18/02/2010
20/04/2006
16/07/2010
13/04/2008
07/11/2009
17:15
15:20
12:30
21:37
18:30
22:30
19:56
09:30
16:00
04:35
04:00
15:30
16:55
14:20
16:30
12:48
14:45
16:45
13:10
18:50
13:20
11:30
00:47
21:15
5 km
11.935 k
80 m
6.5 km
2 km
3 km
35 km
1.7 km
3.7 km
350 m
500 m
Unk
5.44 km
16 km
110 m
2 km
30 m
20 m
BLUE VALE RD
BOGGABRI TN
HULL ST
OAKHAM ST
BOGGABRI TN
BOSTON ST
BRENT ST
DEADMANS GULLY BDG
GINS LEAP OT
GUNNEDAH TN
MANILLA RD
MANILLA RD
MINE ROAD OP
RANGARI RD
UNKNOWN UK
WEE WAA ST
WEE WAA ST
KAMILAROI HWY
KAMILAROY HWY
THE IRON BDGE
BLAIRMORE RD
CLARE ST
NUMBER 95 HN
GRANTHAM ST
2WY
2WY
2WY
TJN
2WY
DIV
XJN
2WY
2WY
2WY
2WY
2WY
2WY
2WY
2WY
XJN
XJN
2WY
DIV
2WY
2WY
2WY
2WY
2WY
STR
CRV
CRV
STR
CRV
CRV
STR
CRV
STR
CRV
CRV
CRV
CRV
STR
CRV
STR
STR
CRV
STR
STR
CRV
STR
STR
STR
Nil
Nil
Nil
On
Nil
Nil
On
Nil
Nil
Nil
Nil
Nil
Nil
Nil
Nil
Nil
Nil
Nil
Nil
Nil
Nil
Nil
Nil
Nil
Fine
Fine
Fine
Fine
Fine
Fine
Fine
Overcast
Fine
Fine
Fine
Fine
Fine
Fine
Fine
Fine
Fine
Fine
Fine
Fine
Fine
Fine
Fine
Overcast
Dry
Dry
Dry
Dry
Dry
Dry
Dry
Wet
Dry
Dry
Dry
Dry
Dry
Dry
Dry
Dry
Dry
Dry
Dry
Dry
Dry
Dry
Dry
Wet
100
100
100
50
100
100
50
100
100
100
100
100
100
100
100
50
50
80
80
100
100
50
50
50
1
1
1
1
1
1
2
1
1
1
1
2
1
1
2
2
2
1
1
2
1
1
2
1
TRK
LOR
TRK
SEM
TRK
WAG
4WD
CAR
4WD
4WD
ATKR
M/C
4WD
TRK
CAR
TRK
CAR
LOR
BDBL
M/C
BDBL
CAR
TRK
CAR
1
1
1
1
1
1
2
1
1
1
1
1
1
1
1
2
1
1
1
1
1
1
1
1
S
E
W
E
N
N
W
S
N
W
S
S
N
S
W
N
W
W
S
N
E
S
S
S
Proceeding in lane
Proceeding in lane
Proceeding in lane
Turning right
Proceeding in lane
Proceeding in lane
Proceeding in lane
Proceeding in lane
Proceeding in lane
Proceeding in lane
Proceeding in lane
Incorrect side
Proceeding in lane
Proceeding in lane
Proceeding in lane
Proceeding in lane
Turning right
Proceeding in lane
Forward from drive
Forward from drive
Proceeding in lane
Proceeding in lane
Proceeding in lane
Proceeding in lane
BDBL
BDBL
TRK
4WD
TRK
TRK
TRK
1
1
1
1
2
1
1
S
N
W
E
S
W
S
Proceeding in lane
Proceeding in lane
Proceeding in lane
Proceeding in lane
Proceeding in lane
Proceeding in lane
Parked
0
0
0
0
0
0
0
0
0
0
0
0
0
0
0
0
0
0
0
0
0
0
0
0
1
1
1
1
1
0
1
1
0
0
1
1
0
1
0
0
1
0
1
0
1
0
1
0
S
S
S
S
S
S
S
S
S
S
S
F
F
F
F
Crash No Date Time Dist ID Feature Loc Alg Lgt Wth Sfc SL DCA Tus TU1 S1 D Manoeuvre1 TU2 S2 D Manoeuvre2 K I Fac
N
E
E
at
S
N
at
at
N
N
N
N
N
S
at
at
E
E
W
E
N
at
N
Wed
Fri
Sun
Wed
Tue
Mon
Fri
Sun
Sun
Sun
Sat
Fri
Tue
Tue
Thu
Wed
Wed
Wed
Fri
Thu
Thu
Fri
Sun
Sat
Day
703
801
803
707
801
609
101
803
704
802
801
201
803
701
301
101
104
805
802
406
801
703
601
703
L
R
L
L
R
L
L
L
L
L
FS

Generated:Rep ID: BCR01 User ID:Office: 16/05/2011 11:38Grafton synottj
Brief Crash Report
Page 4 of 4
Crashid dataset Gunnedah - Boggabri Coal Project Crash Data 1/10/2005 to 30/9/2010
Manilla Rd
Wean St
528532
528464
09/07/2006
08/07/2006
07:30
11:00
5 km
5.39 km
BLUEVALE RD
BOGGABRI TN
2WY
2WY
STR
CRV
Nil
Nil
Unk
Fine
Dry
Dry
100
100
1
1
CAR
4WD
1
1
E
E
Proceeding in lane
Proceeding in lane
0
0
0
0 S
F
Report Totals: Crashes: Traffic Units: Killed: Injured:63 80 5 33Fatal Crashes: 1 Injury Crashes: 29 33Non-Casualty Crashes:
Crash No Date Time Dist ID Feature Loc Alg Lgt Wth Sfc SL DCA Tus TU1 S1 D Manoeuvre1 TU2 S2 D Manoeuvre2 K I Fac
E
E
Sun
Sat
Day
701
803 R
FS
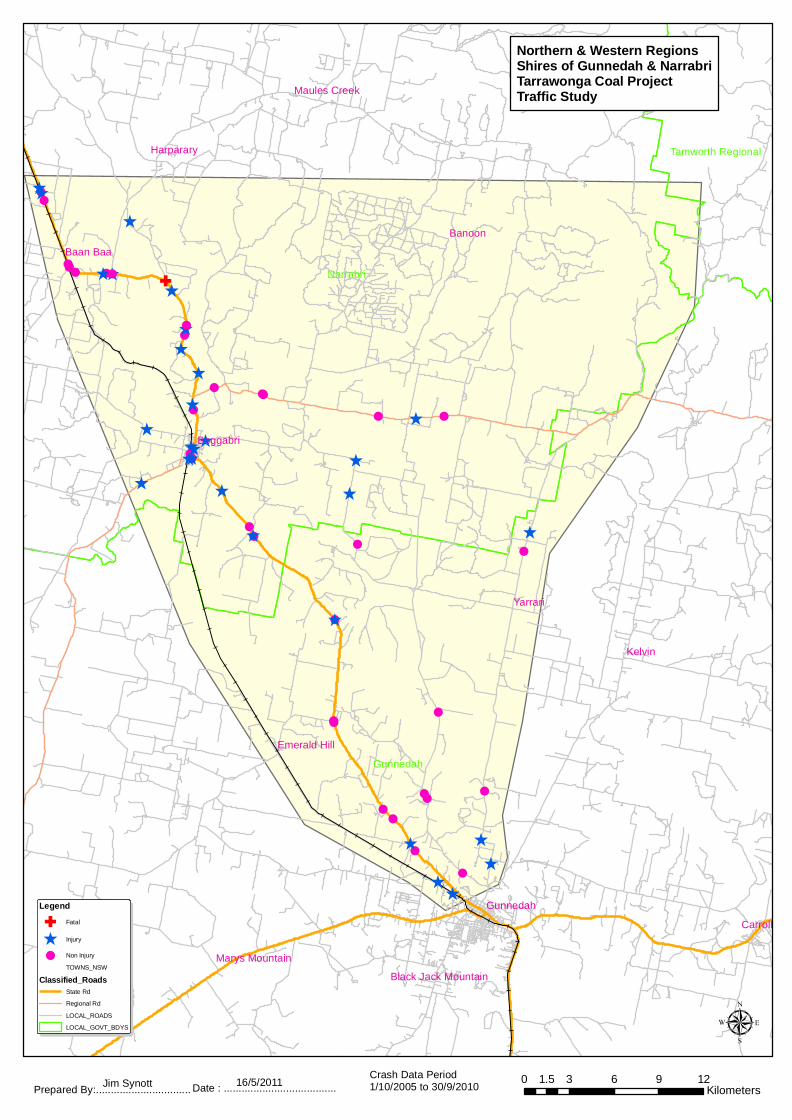
!
^
!
^
^
!
!
G!
!
!
^
!
^
^^
^
^
!
!
^
^
!
!
!
!
^
!
^
!
^
!
!
!
!
^
^
^
!
^
^
!
!
^
^
^
!
^
^
!
!
^
!
!
^
!
!
!
!
^
^
^
!
Gunnedah
Narrabri
Tamworth Regional
Kelvin
Banoon
Yarrari
Carroll
Baan Baa
Boggabri
Gunnedah
Harparary
Maules Creek
Emerald Hill
Marys MountainBlack Jack Mountain
Prepared By:................................Jim Synott Date : ......................................16/5/2011 Crash Data Period1/10/2005 to 30/9/2010
Northern & Western RegionsShires of Gunnedah & NarrabriTarrawonga Coal ProjectTraffic Study
µ0 3 6 9 121.5
Kilometers
LegendG Fatal
^ Injury
! Non InjuryTOWNS_NSW
Classified_RoadsState RdRegional RdLOCAL_ROADSLOCAL_GOVT_BDYS

!
!
!
!
^
^
!
!
G!
!
!
^
!
^
^
!
!
^
^
^
^
^
^
!
^
!
!
!
!
!
^^
!
^
^
!
!
!
^
!
^
^
^
!
^
!
^
^^
! !
^
^
!
!
!
!
^
!
^
!
^718721
717875
710166
699410
667082
666016
623422
526812
538552
508841
633001
576539
554911
532979
532816
678846
675454
673102
535852
518820
628344
575480
528532674378
649912
534487591863
587887
630782
719525
668108
661495
671177
720145
720826
711044
693102
682732
587966
619355
579295 597737
633282
618584
693355
691215
690428
688409
686531
645705
603794
533581
548559
710481
528498
528464
518139
596334
554221
696487
720103
691317
520353
Gunnedah
Narrabri
Tamworth Regional
Kelvin
Banoon
Yarrari
Carroll
Baan Baa
Boggabri
Gunnedah
Harparary
Maules Creek
Emerald Hill
Marys Mountain
Black Jack Mountain
NAMOI RVR
RANGIRA CK
COLLYGRA CK
MOOKI RVR
QUIA CKCOXS CK
MANIL
LA RV
R
JERI
CHO
CK
OAKY CK
NATIVE CAT CK
BLAC
KJAC
K CK
ROCK
WEL
L CK
LANDRY LAGOON
WEAN CK
GULLIGAL LAGOON
WEAN
RANGARI
OXLEY
QUIA
KAMI
LARO
I
GOOLHI
KELV
IN
GRAIN
VALL
EY
BULGA
BLUE VALE
BRAY
MONT
GOONBRI
GLENCOE
HARPARARY
HOAD
CALOOLA
MALL
EE
THERRIBRI
LEAR
DS FO
REST
PRAIRIES
ORANGE GROVE
MCDONALD
SPION KOP
BINAL
ONG
WANDOBA
H
BEESON
QUIA STATION
O'BRIEN
OAKE
Y VAL
LEY
BARWICKS
TUDGEY
REDBANK
VINE
NORMANS
BILLINUDGEL
WIGH
TMAN
SURREY
BRIDGES
HENN
ESSY
BLAIRMORE
TRANTHAM
BAAN BAA
MARYS MOUNT
EAST
ERN
FORE
ST
THUNDERBOLTS
WILLAL
A
CURRACABAH
COLL
YGRA
BARKER
UPPER MAULES CREEK
BLAC
K JAC
K
PULLAMING
LOSS
EDMO
NDS
BOOR
OOMI
N
TRANQUILLE
CLARK
HUNT
S
SISSON
MAULES CREEK
RUVIGNE
ELLERSLIE
GOOD
YERS
BODDINGTON
VIEW
KANA
NGRA
OLD NARRABRI
ROSS
CARS
ON
OLD BLUE VALE
WILLEROI
BARL
OW
MIDD
LE C
REEK
TESTON
KRUS
E
MASMANS
SHANNON HARBOUR
ALL ITES
POWNALL
ASHFORD
BUSHS
JEFFRIESWYNELLA
BLAIR
ATHO
L
FLOO
D HI
LL
JOHN
SON
EMERALD
WARN
ERS
WORBOYSBUCHANAN
CLIFT
ON
LYNF
ORD
HILL
MAYFIELD
BURI
NDI
COLL
IBEE
PINNACLES
HUNTER
LUCAS
FROG
MORE
DIETRICH
STOCK
DRIPPING ROCK
JAEGER
WEE W
AA
BAYL
EY PA
RK
WILK
INSO
NJOHNSTONE
WINDBRI
TYDD
APEX
EAST
VIEW
SHANLEY
GROS
SER
MITCHELL
AERO
DROM
ESH
AWS
O'KEE
FE
ROBERTS
KEPRIOTIS
KAMILAROI
HOAD
KAMILAROI
THERRIBRI
KAMI
LARO
I
CLIFT
ON
HARP
ARAR
Y
OXLEY
TRAN
THAM
GLEN
COE
Prepared By:................................Jim Synott Date : ......................................16/5/2011 Crash Data Period1/10/2005 to 30/9/2010
Northern & Western RegionsShires of Gunnedah & NarrabriTarrawonga Coal ProjectTraffic Study
µ0 3 6 9 121.5 Kilometers
LegendG Fatal
^ Injury! Non Injury
TOWNS_NSWClassified_Roads
State RdRegional RdLOCAL_ROADSLocal_Roads_13072010LOCAL_GOVT_BDYS