Appendix H - Syracuse Regional Airport Authority
97
Appendix H
-
Upload
khangminh22 -
Category
Documents
-
view
0 -
download
0
Transcript of Appendix H - Syracuse Regional Airport Authority

Appendix H


WETLAND & WATERWAY DELINEATION REPORT
SYRACUSE REGIONAL AIRPORT AUTHORITY SYRACUSE HANCOCK INTERNATIONAL AIRPORT
LAND RELEASE FOR FUTURE DEVELOPMENT TOWN OF CICERO, ONONDAGA COUNTY, NEW YORK
May 2019
Prepared for: Syracuse Regional Airport Authority
1000 Colonel Eileen Collins Boulevard Syracuse, New York 13212
Prepared by:
C&S Engineers, Inc. 499 Col. Eileen Collins Blvd.
Syracuse, New York 13212


WETLAND & WATERWAY DELINEATION REPORT SYRACUSE REGIONAL AIRPORT AUTHORITY – LAND RELEASE FOR FUTURE DEVELOPMENT
TOWN OF CICERO, ONONDAGA COUNTY, NEW YORK
MAY 2019 i
TABLE OF CONTENTS Page
1.0 INTRODUCTION .......................................................................................................... 1 1.1 Project Description ................................................................................................. 1 1.2 Project Location ..................................................................................................... 1
2.0 METHODS ................................................................................................................... 1 2.1 Desktop Evaluation ................................................................................................ 1 2.2 Field Surveys .......................................................................................................... 3
2.2.1 Wetlands ............................................................................................................. 3 2.2.2 Wetland Manual Differences ............................................................................. 4 2.2.3 Streams ............................................................................................................... 4 2.2.4 Ditches – Federal Jurisdiction ............................................................................ 5
3.0 RESULTS ..................................................................................................................... 5 3.1 Desktop Evaluation ................................................................................................ 5 3.2 Topography and Drainage ...................................................................................... 5 3.3 New York State Mapped Resources ...................................................................... 6 3.4 National Wetlands Inventory Map ......................................................................... 6 3.5 Soil Survey ............................................................................................................. 6 3.6 FEMA Floodplain Map ........................................................................................ 10 3.7 Field Surveys ........................................................................................................ 10
3.7.1 Wetlands ........................................................................................................... 10 3.7.2 Streams and Open Waters ................................................................................ 14 3.7.3 Ditches.............................................................................................................. 15
4.0 CONCLUSION ............................................................................................................ 15 5.0 LITERATURE CITED ................................................................................................. 17
LIST OF FIGURES
Figure Page Figure 1. Project Location Map ..................................................................................................2
Figure 2. NYSDEC Wetlands & Stream Map ............................................................................7
Figure 3. USFWS NWI Wetlands Map ......................................................................................8
Figure 4. USDA NRCS Soils Map ..............................................................................................9
Figure 5. FEMA 100-Year Flood Map .....................................................................................11
Figure 6. Wetlands & Surface Waters Delineation Map ...........................................................12
APPENDICES
Appendix A: USACE Wetland Data Sheets Appendix B: Web Soil Survey Appendix C: Photographs


WETLAND & WATERWAY DELINEATION REPORT SYRACUSE REGIONAL AIRPORT AUTHORITY – LAND RELEASE FOR FUTURE DEVELOPMENT
TOWN OF CICERO, ONONDAGA COUNTY, NEW YORK
MAY 2019 1
1.0 INTRODUCTION An Environmental Assessment (EA) for the release of airport property at Syracuse Hancock International Airport (SYR) in Syracuse, Onondaga County, New York is being prepared for the Syracuse Regional Airport (SRAA). The EA will evaluate the environmental impacts associated with the proposed project in order to comply with Federal Aviation Administration (FAA) requirements to assess impacts associated with airport development projects. Since the proposed project will involve approvals from federal agencies, National Environmental Policy Act (NEPA) review is necessary. The FAA is the NEPA lead agency for the proposed project. C&S Engineers, Inc. (C&S) has conducted a wetland and waterways delineation as part of the EA. The Area of Interest (AOI) for delineation totals 99.1-acres and is depicted in Figure 1 – Project Location Map. The delineation is prepared consistent with the United States Army Corps of Engineers (USACE) and New York State Department of Environmental Conservation (NYSDEC) guidelines. This report includes the review of published resource materials, existing site conditions, and the results of field investigation.
1.1 Project Description The proposed project involves the release of land currently located on SYR property for future development of a non-aeronautical related business. It is anticipated that future development on the proposed project site may include construction of multiple light manufacturing buildings and parking for approximately 300 employees. The lands proposed for release include portions of the Town of Cicero tax map number 057-02-23.0 and tax map number 057-02-22.1. A portion of the project site was previously occupied by U.S. Air Force housing units and is currently vacant. SYR intends to subdivide the parcels so that they can retain land associated with the Airport’s future airside development.
1.2 Project Location The 99.1-acre AOI is located north of the airfield, along the south side of Taft Road in the Town of Cicero, New York (See Figure 1). The site occurs within the Seneca Watershed (USGS Cataloging Unit: 04140201).
2.0 METHODS
2.1 Desktop Evaluation Prior to field survey, C&S reviewed various maps and other sources of information to determine onsite areas that contain aquatic resources. These include:
• United States Geological Survey (USGS) topographic maps
• National Wetlands Inventory (NWI) Maps prepared by the U.S. Fish and Wildlife Service (USFWS)
• Freshwater Wetland Maps prepared by the NYSDEC
• Stream Classification Maps prepared by the NYSDEC


Copyright:© 2013 National Geographic Society, i-cubed
Figure 1
0 1,000 2,000500FeetDo
cume
nt P
ath: F
:\Pro
ject\O
68 - S
yrac
use R
egion
al Ai
rpor
t Aut
horit
y\O68
0360
01 - L
and R
eleas
e Ser
vices
(201
8)\Pl
annin
g-St
udy\G
IS\P
rojec
ts\W
etlan
ds\Fi
gure
_1_T
opo2
.mxd
General Project LocationSyracuse Hancock International AirportLand Release for Future Development
Town of Cicero, Onondaga County, New York
Project Location


WETLAND & WATERWAY DELINEATION REPORT SYRACUSE REGIONAL AIRPORT AUTHORITY – LAND RELEASE FOR FUTURE DEVELOPMENT
TOWN OF CICERO, ONONDAGA COUNTY, NEW YORK
MAY 2019 3
• Soil Survey Geographic Database (SSURGO) Soils Map prepared using U.S. Department of Agriculture (USDA) Natural Resources Conservation Service (NRCS) Soil Survey Geographic Database
• Federal Emergency Management Agency (FEMA) Floodplain Maps
The above references are used initially to identify areas with potential to contain wetlands and streams.
2.2 Field Surveys
2.2.1 Wetlands C&S completed wetland delineations within the AOI on April 23, May 1, May 9, and May 14, 2019. During field surveys, dominant flora species, hydrologic features, and soil conditions were recorded. Wetlands boundaries are delineated using criteria for vegetation, soils, and hydrology as specified in the 1987 Corps of Engineers Wetland Delineation Manual (USACE 1987) (hereinafter referred to as the USACE Manual) and the 2012 Regional Supplement to the Corps of Engineers Wetland Delineation Manual: Northcentral and Northeast Region, Version 2.0 (Regional Supplement) (USACE 2012). New York State regulated wetlands are mapped within the AOI, therefore the aquatic resource delineation is completed consistent with the 1995 NYSDEC Freshwater Wetlands Delineation Manual (NYSDEC 1995). Locations of wetland delineation flags are mapped in the field using a Trimble Global Positioning System (GPS). Wetland flags/points are placed and coordinates recorded via GPS along the wetland boundaries based on observations of hydrophytic vegetation, hydric soils, and hydrology conditions. These observations are made throughout the hydrologic condition continuum to verify the wetland boundary is sufficiently identified. Each wetland is assigned a letter designation, and each wetland flag is labeled with the letter assigned to the wetland and numbered consecutively. All GPS code phase data captured in the field are post-processed (differential correction) using Trimble’s Pathfinder Office software. Wetland polygons are created in Geographic Information System (GIS) shapefiles and incorporated on Project base maps for the preparation of report figures. Wetland areas are calculated using Environmental Systems Research Institute ARCGIS ARCView. Formal wetland determination data forms are completed in the field to document justification for the wetland boundary as delineated (Appendix A). These forms are prepared consistent with the Regional Supplement, and include information pertaining to hydrology, vegetation, and soils for each wetland within the Project AOI. Vegetation is characterized consistent with the Regional Supplement, and recorded in plots as required by the USACE. Scientific nomenclature for plant species and the indicator status for each plant species occurring within the wetland sampling plot is determined using National Wetland Plant List: 2016 Update of Wetland Ratings (Lichvar et al. 2016). Soil characteristics and hydrology data are observed and collected at test pits within the vegetative plots. The pits are excavated by hand to a depth of 20 inches below grade consistent with the USACE Manual.

WETLAND & WATERWAY DELINEATION REPORT SYRACUSE REGIONAL AIRPORT AUTHORITY – LAND RELEASE FOR FUTURE DEVELOPMENT
TOWN OF CICERO, ONONDAGA COUNTY, NEW YORK
MAY 2019 4
The presence of hydric soil indicators is determined by describing pertinent characteristics of the soil sample. Soil colors are determined using the Munsell® soil color charts (2000 Edition, Gretag Macbeth, Division of Kollmorgen Instruments Corporation, New Windsor, New York). Hydric soil characteristics such as organic soil layers, reducing conditions, gleying, low-chroma mottles, and concretions are noted. Primary and secondary indicators of hydrology are also noted at each sample plot. A wetland determination is made at each sample plot after characterizing vegetation, hydrology, and soil. If the vegetation, hydrology, and hydric soil criteria are met, the area is deemed a wetland. If one or more of the criteria are not met, the area is determined to be non-wetland. Completed wetland determination sheets for each representative soil pit are included in Appendix A. Wetlands identified are further classified consistent with the Classification of Wetlands and Deepwater Habitats of the United States (Cowardin et al. 1979). The jurisdictional status of delineated features consistent with the 2015 Clean Water Rule as described in 40 Code of Federal Regulation Parts 110, 112, 116, et al.
2.2.2 Wetland Manual Differences The NYSDEC manual and the USACE Manual/Regional Supplement are similar with regard to identifying wetland boundaries; however there are a few significant differences. The first difference is that the NYSDEC Manual states that if an area meets certain requirements regarding prevalence of wetland vegetation, the area can be considered a wetland without detailed investigation of hydrology and soils. If the wetland vegetation requirements are not met, but more than 50 percent of the dominant species prefer wetland habitats; then an investigation and verification of hydrology and/or hydric soils is required to locate a wetland boundary. The second difference is that the Regional Supplement has established additional methods for determining the dominance of hydrophytic vegetation, additional indicators of wetland hydrology, and additional hydric soils criteria that exceed those identified in the USACE and NYSDEC Manuals. These additional indicators could result in differences of wetland boundaries. In the instance the two wetland boundaries are not consistent as a result of the differences in manuals; the discrepancy between the two will be described within the results section of this report. This summary will include a discussion of the reason for the different boundaries.
2.2.3 Streams Stream delineations were completed within and immediately adjacent the AOI. The federally regulated Ordinary High Water (OHW) mark of streams within the Project AOI are delineated using the definitional criteria as presented in Title 33, Code of Federal Regulations, Part 328, and the USACE Regulatory Guidance Letter 05-05 – Guidance on Ordinary High Water Mark Identification. Each stream is categorized in regard to its flow regime as perennial, intermittent, or ephemeral, as defined by the USACE. The OHW mark for each stream is mapped using the Trimble GPS. Streams in the State of New York are protected by Article 15 Use and Protection of Waters. Streams are given classifications that designate the level of protection afforded to each

WETLAND & WATERWAY DELINEATION REPORT SYRACUSE REGIONAL AIRPORT AUTHORITY – LAND RELEASE FOR FUTURE DEVELOPMENT
TOWN OF CICERO, ONONDAGA COUNTY, NEW YORK
MAY 2019 5
waterbody. Each waterbody identified within the AOI is classified according to Article 15. The waterbody classification categories are AA, A, B, C or D depending on their designated level of protection. Waters with classifications A, B, and C may also have a standard of (T), indicating that it may support a trout population, or (TS), indicating that it may support trout spawning (TS). Streams with a designation of C (T) or higher are considered “protected” waters of New York State. Stream boundaries are mapped using Trimble GPS units with sub-meter accuracy. Stream lengths are calculated in linear feet using Environmental Systems Research Institute ARCGIS ARCView. The jurisdictional status of delineated features consistent with the 2015 Clean Water Rule.
2.2.4 Ditches – Federal Jurisdiction Ditches were delineated within and immediately adjacent the AOI. For ditches to be protected under the 2015 Clean Water Rule, they must meet the definition of a tributary, having a bed and banks, an ordinary high water mark and contribute flow directly or indirectly through another water to a traditional navigable water. However, the 2015 Clean Water Rule excludes certain ditches if specific criteria are met; the following ditch types are not considered waters of the US:
• Ditches with ephemeral flow that are not a relocated tributary or excavated in a tributary. • Ditches with intermittent flow that are not a relocated tributary, excavated in a tributary,
or drain wetlands. • Ditches that do not flow, either directly or through another water, into a tidal waterway,
interstate water, or territorial seas. The federally regulated OHW mark of ditches within the AOI are delineated using the definitional criteria as presented in Title 33, Code of Federal Regulations, Part 328, 40 CFR Parts 110, 112, 116, et al. Clean Water Rule: Definition of “Waters of the United States” Final Rule and the USACE Regulatory Guidance Letter 05-05 – Guidance on Ordinary High Water Mark Identification. Ditch boundaries are mapped using Trimble GPS units with sub-meter accuracy; lengths are calculated in linear feet using Environmental Systems Research Institute ARCGIS ARCView.
3.0 RESULTS
3.1 Desktop Evaluation Resource mapping used during the desktop review are provided in Figures 1 through 5. Figure 1 depicts the AOI on USGS topographic mapping. Figure 2 provides NYSDEC mapped resources within the AOI. Figure 3 provides NWI mapping, and Figure 4 provides soil survey information. Figure 5 depicts FEMA mapped floodplains within the vicinity of the AOI. A summary of information gathered during the desktop analysis is provided herein.
3.2 Topography and Drainage The Project site appears on both the Cicero and Syracuse East U.S. Geological Survey (USGS) 7.5-minute topographic quadrangle maps (See Figure 1). The AOI is located along Taft Road

WETLAND & WATERWAY DELINEATION REPORT SYRACUSE REGIONAL AIRPORT AUTHORITY – LAND RELEASE FOR FUTURE DEVELOPMENT
TOWN OF CICERO, ONONDAGA COUNTY, NEW YORK
MAY 2019 6
in the Town of Cicero, Onondaga County within the USGS topographic map. Elevations range from 390 to 440 feet (North American Vertical Datum of 1988 [NAVD 88]).
3.3 New York State Mapped Resources Article 24 of the Environmental Conservation Law requires the NYSDEC to map freshwater wetlands subject to jurisdiction of the law. Article 24 Freshwater Wetland Maps show the approximate location of the wetland boundary and the unique alpha numeric wetland identification number assigned to each resource. Due to the scale of the mapping and aerial photography used to produce the wetland boundaries, they are suitable for general planning purposes only. Based on the Freshwater Wetland Maps and the field review, there is a NYSDEC mapped wetland within the AOI (See Figure 2). NYSDEC wetland SYE-2 occurs on site. No NYSDEC classified streams are mapped on site (Figure 2).
3.4 National Wetlands Inventory Map Based on the NWI map there is an NWI mapped resource within the AOI (See Figure 3). Note that NWI maps were derived from aerial photo interpretation and are suitable for general planning purposes only; they typically do not show all the wetland or watercourse resources within any given area. The wetland is labeled PFO1C. PFO1C are palustrine forested, broad-leaved deciduous, seasonally flooded wetlands.
3.5 Soil Survey Eight unique soil series are mapped within the AOI as depicted in Figure 4. Six of the eight soils contain hydric components. Table 1 provides the hydric rating, and acreage of the soils mapped on site. The hydric rating by map unit provided by the USDA NRCS Web Soil Survey is provided as Appendix B.
Table 1. Web Soil Summary in the AOI
Soil map unit Hydric rating
Acres of soil within AOI
Percent of soil within AOI
Cut and Fill Land 10 2.5 2.5% Collamer silt loam 0 3.9 3.9%
Croghan loamy fine sand 0 7.6 7.6% Lamson very fine sandy loam 90 1.8 1.8%
Made land 10 0.5 0.5% Minoa find sandy loam 12 4.4 4.4%
Niagara silt loam 7 66.9 67.1 Palms muck 100 12.2 12.3

Source: Esri, DigitalGlobe, GeoEye, Earthstar Geographics, CNES/Airbus DS,USDA, USGS, AeroGRID, IGN, and the GIS User Community
NYSDEC Freshwater Wetlands &Stream Classification Map
Syracuse Hancock International AirportLand Release for Future Development
Town of Cicero, Onondaga County, New YorkFigure 2
0 150 300Feet
Docu
ment
Path
: F:\P
rojec
t\O68
- Syr
acus
e Reg
ional
Airp
ort A
utho
rity\O
6803
6001
- Lan
d Rele
ase S
ervic
es (2
018)\
Plan
ning-
Stud
y\GIS
\Pro
jects\
Wetl
ands
\Figu
re_2
_NYS
DEC.
mxd
Source: NYSDEC - New York State RegulatoryFreshwater Wetlands
LegendAOINYSDEC Wetlands100-foot NYSDEC Buffer


Source: Esri, DigitalGlobe, GeoEye, Earthstar Geographics, CNES/Airbus DS,USDA, USGS, AeroGRID, IGN, and the GIS User Community
National Wetland Inventory Map (NWI)Syracuse Hancock International AirportLand Release for Future Development
Town of Cicero, Onondaga County, New York Figure 3
Docu
ment
Path
: F:\P
rojec
t\O68
- Syr
acus
e Reg
ional
Airp
ort A
utho
rity\O
6803
6001
- Lan
d Rele
ase S
ervic
es (2
018)\
Plan
ning-
Stud
y\GIS
\Pro
jects\
Wetl
ands
\Figu
re_3
_NW
I.mxd
Source: U.S. Fish & Wildlife Service,National Wetlands Inventory
LegendAOIFederal Wetlands (NWI)
0 150 300Feet


NgA
Pb
Ce
MtA
Cd
ChA
PG
ChA
Lm
Pb
CrB
GaB
ML
ChA
CFL
CFL
CFL
OgB
AlC
WwA
Ub
MtA
HlB
CFL
HlB
ChA
Pb
CFL NgA
WwB
WwA
ChB
Cd
GaB
GaB
WwB
ChA
NgA
WwB
CrB
ChB
Ub
CFL
MtASource: Esri, DigitalGlobe, GeoEye, Earthstar Geographics, CNES/Airbus DS,USDA, USGS, AeroGRID, IGN, and the GIS User Community
SSURGO Soils MapSyracuse Hancock International AirportLand Release for Future Development
Town of Cicero, Onondaga County, New YorkFigure 4
0 150 300FeetDo
cume
nt P
ath: F
:\Pro
ject\O
68 - S
yrac
use R
egion
al Ai
rpor
t Aut
horit
y\O68
0360
01 - L
and R
eleas
e Ser
vices
(201
8)\Pl
annin
g-St
udy\G
IS\P
rojec
ts\W
etlan
ds\Fi
gure
_4_S
OILS
.mxd
LegendUSDA SoilsAOI
NgANiagara silt loam, 0 to 4 percent slopesChACollamer silt loam, 0 to 2 percent slopesPbPalms muckCrBCroghan loamy fine sand, 0 to 6 percent slopesCFLCut and fill landLmLamson very fine sandy loamMtAMinoa fine sandy loam, 0 to 2 percent slopes


WETLAND & WATERWAY DELINEATION REPORT SYRACUSE REGIONAL AIRPORT AUTHORITY – LAND RELEASE FOR FUTURE DEVELOPMENT
TOWN OF CICERO, ONONDAGA COUNTY, NEW YORK
MAY 2019 10
3.6 FEMA Floodplain Map The FEMA floodplain map depicts a 100-year regulated floodplain area within the southeast portion of the AOI (Figure 5).
3.7 Field Surveys
3.7.1 Wetlands C&S delineated eight wetlands within and immediately adjacent the AOI. The boundary of the delineated wetlands are included in Figure 6. Wetlands A, C, D, E, F, G, and H are categorized as palustrine forested (PFO) wetlands consistent with the Classification of Wetlands and Deepwater Habitats of the United States (Cowardin et al. 1979) (hereinafter referred to as Cowardin). Wetland B is categorized as a combination of PFO and palustrine scrub-shrub (PSS) wetland per Cowardin (Cowardin et al. 1979). The boundary of wetlands A-H within the AOI are delineated consistent with the USACE manual; wetlands A, D, E, and H are also delineated consistent with the NYSDEC Manual. Table 2 provides a summary of the wetland identified during the field investigation. Photographs of each wetland identified are provided in Appendix C.
Table 2. Wetland Delineation Summary in the AOI
Wetland Id
Cowardin Community
Type
Agency Jurisdiction
NWI Wetland Acreage in AOI
A PFO USACE N/A 2.25
B PFO USACE N/A 5.30 PSS
C PFO USACE N/A 0.19
D PFO USACE & NYSDEC PFO1C 1.43
E PFO USACE & NYSDEC PFO1C 14.53
F PFO USACE N/A 1.28 G PFO USACE N/A 1.63
H PFO USACE & NYSDEC N/A 0.59
TOTAL: 27.20 The PFO and PSS Cowardin classes are defined below: PFO- This aquatic resource is a palustrine forested wetland. The wetland is characterized by broad-leaved deciduous woody trees and shrubs.


Copyright:© 2013 National Geographic Society, i-cubed
FEMA Floodzone AreasSyracuse Hancock International AirportLand Release for Future Development
Town of Cicero, Onondaga County, New YorkFigure 5
0 500 1,000FeetDo
cume
nt P
ath: F
:\Pro
ject\O
68 - S
yrac
use R
egion
al Ai
rpor
t Aut
horit
y\O68
0360
01 - L
and R
eleas
e Ser
vices
(201
8)\Pl
annin
g-St
udy\G
IS\P
rojec
ts\W
etlan
ds\Fi
gure
_5_F
EMA.
mxd
LegendAOIFEMA 100-year Floodzone


Upland-a
Upland-d
Upland-h
Upland-c
Upland-b
Wetland-g
Wetland-f
Wetland-a
Wetland-d
Wetland-e
Wetland-h
Wetland-c
Wetland-b
Upland-f/g
h-9
h-8h-7h-6
h-5 h-4h-3h-2 h-1
g-7g-6g-5g-4g-3g-2g-1
f-9 f-8f-7
f-6f-5
f-4f-3
f-2f-1
e-9e-8
e-7e-6
e-5e-4
e-3e-2
e-1
d-9d-8d-7d-6d-5
d-3d-2
d-1
c-9
c-8c-7
c-6
c-5c-4
c-3
c-2
c-1
b-9b-8
b-7
b-6b-5
b-4b-3
b-2
b-1
a-9a-8
a-7a-6a-5a-4a-3
a-2a-1
h-14h-13
h-11
f-18f-17f-16
f-15f-14
f-13
f-12f-11
f-10
e-16e-15
e-14
e-13e-12
e-11e-10
d-21
d-20d-19 d-18
d-16d-15d-14 d-13 d-12 d-10
c-27c-26c-25c-24c-23
c-22
c-21c-20c-19
c-18
c-17
c-16
c-14
c-13c-12
c-11
c-10
b-89b-88
b-87b-86
b-84b-83
b-82b-81b-80
b-79b-78
b-77b-76 b-75
b-74b-73 b-72 b-71
b-70
b-69
b-68b-67
b-66
b-65
b-64b-63
b-62
b-61b-60
b-59b-58
b-57b-56
b-55
b-54b-53
b-52b-51b-50
b-48b-47
b-46b-44b-43b-42
b-41b-40
b-39b-37b-36b-35
b-34b-33 b-32b-31
b-30
b-29b-24
b-23b-22
b-21b-20b-19
b-13b-11
a-92
a-91
a-90a-88
a-86
a-85 a-84a-83
a-81a-80a-79
a-78
a-77a-76a-75
a-73
a-74
a-72a-71a-70a-69a-68
a-65a-64a-63
a-60a-59
a-58a-57a-54
a-53a-52
a-50a-49 a-48
a-47a-46
a-45a-44
a-43a-42
a-41a-40
a-39a-38
a-37a-36
a-35a-34
a-33a-32
a-31a-30
a-27a-26
a-25a-24a-23
a-22
a-20a-19
a-18a-14
a-13a-12
a-11
a-10
g-207g-206
g-205g-204g-203
g-202g-201
g-200
g-104g-103
g-102g-101
g-100
a-229a-227 a-226
a-225a-224 a-223
a-222 a-220a-219a-218a-217a-216
a-214a-213a-212
a-211a-210a-209
a-208a-207
a-205a-204a-203
a-202a-201
c-121
c-119
c-118
c-117
c-116
c-115
c-114
c-113c-112
c-107
c-106
c-105c-104
c-103
c-102
c-101c-100
b-122
b-121
b-120
b-119b-118
b-117b-116
b-113
b-106
b-104b-102
b-101
Wetland E
Wetland B
Wetland G
Wetland D
Wetland F
Wetland A Stream C
Wetland H
Ditch C2
Stream A
Ditch B2
Ditch C
Wetland C
Ditch BDitch C4
Wetland A
Ditch A
Wetland A
Ditch C3
Ditch C3
Source: Esri, DigitalGlobe, GeoEye, Earthstar Geographics, CNES/Airbus DS,USDA, USGS, AeroGRID, IGN, and the GIS User Community
Figure 60 100 200
FeetDocu
ment
Path:
F:\Pr
oject\
O68 -
Syrac
use R
egion
al Ai
rpor
t Auth
ority
\O68
0360
01 - L
and R
eleas
e Serv
ices (
2018
)\Plan
ning-S
tudy\G
IS\Pr
ojects
\Wetl
ands
\Figu
re_6_
C&S_
Wetla
nd.m
xd
C&S Delineated WetlandSyracuse Hancock International AirportLand Release for Future Development
Town of Cicero, Onondaga County, New York
Continues Offsite
Continues Offsite
Continues Offsite
Continues Offsite
Stream C
Continues Offsite
Continues Offsite
LegendAOI
C&S Delineated WetlandsDitch; Ditch C4StreamWetlands100-ft BufferSoil Test PitWetland Flag
Wetland AcreageA 2.25B 5.30C 0.19D 1.43E 14.53F 1.28G 1.63H 0.59


WETLAND & WATERWAY DELINEATION REPORT SYRACUSE REGIONAL AIRPORT AUTHORITY – LAND RELEASE FOR FUTURE DEVELOPMENT
TOWN OF CICERO, ONONDAGA COUNTY, NEW YORK
MAY 2019 13
PSS – This aquatic resource is a palustrine scrub-shrub wetland. The wetland is characterized woody vegetation less than 20 feet tall. The species include true shrubs, young trees, and trees or shrubs that are small or stunted because of environmental conditions. Below are a description of wetlands that occur within the AOI: Wetland A (PFO): The wetland tree stratum is dominated by green ash (Fraxinus pennsylvanica). Shrubs noted include silky dogwood (Cornus amomum). Saplings of green ash were also observed in this wetland. The herbaceous stratum is dominated by Canada goldenrod (Solidago canadensis), and tall goldenrod (Solidago gigantea). Jewelweed (Impatiens capansis) is also noted in the herbaceous layer. Primary hydrologic indicators observed include presence of high water table, soil saturation, and oxidized rhizospheres. Secondary hydrologic indicators observed include drainage patterns and a positive FAC-neutral test. The soil hydric indicator F3 was observed and met. Wetland B (PFO/PSS): The wetland tree stratum is dominated by red maple (Acer rubrum), American elm (Ulmus americana), and green ash. The shrub layer consists of Morrow’s honeysuckle (Lonicera morrowii) and buckthorn (Rhamnus cathartica). The herbaceous stratum is dominated by poison ivy (Toxicodendron radicans), sensitive fern (Onoclea sensibilis), and tall goldenrod. Field horsetail (Equisetum arvense) and sedges (Carex spp.) were also noted. Primary hydrologic indicators observed include presence of surface water, high water table, soil saturation, and oxidized rhizospheres. Secondary hydrologic indicators observed include a positive FAC-neutral test. The soil hydric indicator F3 was observed and met. The PSS portion of Wetland B is dominated by green ash saplings, grey dogwood (Cornus racemosa), and silky dogwood shrubs. Herbaceous plants noted include Canada goldenrod, grey dogwood saplings, teasel (Cirsium vulgare), and purple loosestrife (Lythrum salicaria). Primary hydrologic indicators observed include presence of high water table, and soil saturation. Secondary hydrologic indicators observed include a positive FAC-neutral test. The soil hydric indicator F3 was observed and met. Wetland C (PFO): The wetland tree stratum is dominated by green ash, and red oak (Quercus rubra), and green ash. Shrubs noted include gray dogwood and Morrow’s honeysuckle. Red oak saplings were also noted. The herbaceous stratum is dominated by tall goldenrod, and white avens (Geum canadense). Canada goldenrod was also observed. No primary hydrologic indicators were observed; secondary hydrologic indicators observed include drainage patterns and a positive FAC-neutral test. The soil hydric indicator F3 was observed and met. Wetland D (PFO): The wetland tree stratum is dominated by green ash and red maple. Shrubs noted consisted of buckthorn and Morrow’s honeysuckle. The herbaceous stratum is dominated by poison ivy and sedges. No primary hydrologic indicators were observed; secondary hydrologic indicators observed include drainage patterns and a positive FAC-neutral test. The soil hydric indicators F3 and A11 were observed and met.

WETLAND & WATERWAY DELINEATION REPORT SYRACUSE REGIONAL AIRPORT AUTHORITY – LAND RELEASE FOR FUTURE DEVELOPMENT
TOWN OF CICERO, ONONDAGA COUNTY, NEW YORK
MAY 2019 14
Wetland E (PFO): The wetland tree stratum is dominated by red maple, American elm, and green ash. Green ash saplings were also observed. No herbaceous plants were observed, this is assumed to be a result of the standing water noted throughout this wetland. Primary hydrologic indicators observed include presence of surface water, high water table, soil saturation, inundation visible on aerial imagery, and water marks. Secondary hydrologic indicators observed include a positive FAC-neutral test. The soil hydric indicator F1 was observed and met. Wetland F (PFO): The wetland tree stratum is dominated by red maple and green ash. Shrubs noted include buckthorn, gray dogwood and Morrow’s honeysuckle. The herbaceous stratum is dominated by soft rush (Juncus effuses), and green bulrush (Scirpus atrovirens). American elm saplings were also noted. High water table, saturation, and presence of oxidized rhizospheres are the primary hydrology indicators observed. Secondary hydrologic indicators observed include drainage patterns and a positive FAC-neutral test. The soil hydric indicator F3 was observed and met. Wetland G (PFO): The wetland tree stratum is dominated by red maple, green ash, and cottonwood (Populus deltoides). Shrubs noted include silky dogwood and Morrow’s honeysuckle. Green ash saplings were also noted. The herbaceous stratum is dominated by jewelweed, and Allegheny blackberry (Rubus allegheniensis). Surface water, high water table, saturation, and presence of oxidized rhizospheres are the primary hydrology indicators observed. Secondary hydrologic indicators observed include a positive FAC-neutral test. The soil hydric indicator F3 was observed and met. Wetland G (PFO): The wetland tree stratum is dominated by green ash. Shrubs noted include buckthorn and Morrow’s honeysuckle. The herbaceous stratum is dominated by jewelweed; spotted lady’s thumb (Persicaria maculosa), and tall goldenrod were also present. Surface water, high water table, and saturation are the primary hydrology indicators observed. Secondary hydrologic indicators observed include a positive FAC-neutral test and microtopographic relief. The soil hydric indicator F1 was observed and met.
3.7.2 Streams and Open Waters Desktop review of available materials revealed a tributary to the North Branch of Ley Creek within the AOI. The field survey resulted in two streams, stream A (unnamed tributary to the North Branch of Ley Creek) and stream C (unnamed tributary to the North Branch of Ley Creek) being located within the AOI. Table 3 provides a summary of the stream identified during the field investigation. Photographs of the streams identified are provided in Appendix C. The boundaries of the delineated streams is included in Figure 6.
Table 3. Stream Delineation Summary in the AOI
Stream Id Stream Classification
Agency Jurisdiction
NYSDEC Stream Class.
Length and Width in AOI
Acreage in AOI
A Perennial USACE D Length – 999 ft. OHWM – 15 ft.
(avg.) 0.34

WETLAND & WATERWAY DELINEATION REPORT SYRACUSE REGIONAL AIRPORT AUTHORITY – LAND RELEASE FOR FUTURE DEVELOPMENT
TOWN OF CICERO, ONONDAGA COUNTY, NEW YORK
MAY 2019 15
Stream Id Stream Classification
Agency Jurisdiction
NYSDEC Stream Class.
Length and Width in AOI
Acreage in AOI
C Perennial USACE C Length – 3,639 ft. OHWM – 17.6 ft.
(avg.) 1.47
TOTAL 4,638 1.81 No open water areas were delineated during the field surveys.
3.7.3 Ditches The field survey resulted in seven ditches located within the AOI. Table 4 provides a summary of each. Photographs of the ditches identified are provided in Appendix C. The boundaries of the delineated ditches are included in Figure 6.
Table 4. Ditch Delineation Summary in the AOI
Ditch Id Waters of the
US Classification
Agency Jurisdiction
Average Width in AOI
(ft)
Length in AOI (ft)
Acreage in AOI
A b(3) None
7.8 389
0.09 a(6) USACE 136
B b(3) None
17.3 235
0.13 a(6) USACE 106
B2 b(3) None 12.3 784 0.22 C b(3) None 5.8 1,139 0.15 C2 b(3) None 8.4 1,505 0.29 C3 b(3) None 3.8 626 0.05 C4 b(3) None 14.97 259 0.09
TOTAL 5,179 1.02
4.0 CONCLUSION C&S was retained by the Syracuse Regional Airport Authority to complete a wetland and waterway survey for the proposed Land Release for a future development project. Wetlands were assessed as waters of the U.S. subject to USACE jurisdiction, and as freshwater wetlands subject to NYSDEC regulation. These features are also classified consistent with the Classification of Wetlands and Deepwater Habitats of the United States (Cowardin et al. 1979). Eight wetlands within the Seneca Watershed (USGS Cataloging Unit: 04140201) were delineated by C&S within and immediately adjacent the AOI. The wetlands include a PFO/PSS wetland totaling 5.3 acres, and seven PFO wetlands totaling 21.9 acres. These wetlands are potentially regulated waters of the United States afforded protection under Section 404 of the Clean Water Act. The wetlands described herein satisfy the criteria to be a wetland pursuant to the Army Corps of Engineers' 1987 Manual (and Regional Supplement) with subsequent clarification memoranda and pursuant to confirmation by the USACE. Wetlands D, E, and H

WETLAND & WATERWAY DELINEATION REPORT SYRACUSE REGIONAL AIRPORT AUTHORITY – LAND RELEASE FOR FUTURE DEVELOPMENT
TOWN OF CICERO, ONONDAGA COUNTY, NEW YORK
MAY 2019 16
are also subject to jurisdiction by the NYSDEC under Article 24 of the Freshwater Wetlands Act. The determination of regulatory status is dependent upon confirmation by both the USACE and NYSDEC. Two streams were delineated within the AOI; Stream C is a perennial stream whereas Stream A is intermittent. The streams total 4,638 linear feet, and are subject to jurisdiction by the USACE under Section 404 of the Clean Water Act. Stream A is classified by NYSDEC as a Class D stream; Stream C is designated as a Class C with Class C water quality standards. Neither stream is considered protected under Article 15 Use and Protection of Waters. Seven ditches were delineated within the AOI. The ditches total 5,179 linear feet and are subject to jurisdiction by the USACE under Section 404 of the Clean Water Act. In our opinion, on site ditches are not considered waters of the United States consistent with the 2015 Clean Water Rule and pursuant to confirmation by the USACE. The ditches are not protected under Article 15 Use and Protection of Waters. No open waters were identified during the field surveys.

WETLAND & WATERWAY DELINEATION REPORT SYRACUSE REGIONAL AIRPORT AUTHORITY – LAND RELEASE FOR FUTURE DEVELOPMENT
TOWN OF CICERO, ONONDAGA COUNTY, NEW YORK
MAY 2019 17
5.0 LITERATURE CITED Cowardin, L. M., V. Carter, F. C. Golet, and E. T. LaRoe. 1979. Classification of wetlands and
deepwater habitats of the United States. U. S. Department of the Interior, Fish and Wildlife Service, Washington, D.C. (available at: Northern Prairie Wildlife Research Center, Jamestown, North Dakota website http://www.npwrc.usgs.gov/resource/1998/classwet/classwet.htm).
NYSDEC. 1995. Freshwater wetlands delineation manual. New York State Department of Environmental Conservation.
USACE. 1987. Corps of Engineers Wetlands Delineation Manual. Final Report. Wetlands Research Program Technical Report Y-87-1 (on-line edition), Waterways Experiment Station, Environmental Laboratory, Vicksburg, Mississippi. 143 pp.
USACE. 2012. Regional Supplement to the Corps of Engineers Wetland Delineation Manual: Northcentral and Northeast Region, ERDC/EL TR-12-1 (Version 2.0). U.S. Army Engineer Research and Development Center, Vicksburg, Mississippi.

APPENDIX A USACE WETLAND DATA FORMS


US Army Corps of Engineers Northcentral and Northeast Region – Version 2.0
Project/Site:
Applicant/Owner: State:
Investigator(s):
Lat:
Soil Map Unit Name: NWI classification:
X
Are Vegetation , Soil , or Hydrology Yes X
Are Vegetation , Soil , or Hydrology
SUMMARY OF FINDINGS – Attach site map showing sampling point locations, transects, important features, etc.
No XNo X XNo X
XXX Yes X
WETLAND DETERMINATION DATA FORM – Northcentral and Northeast Region
Land Release for Future Development City/County: Cicero/Onondaga Sampling Date: May 9, 2019
Landform (hillside, terrace, etc.): Terrace Local relief (concave, convex, none): None Slope %: 1-3
Syracuse Regional Airport Authority NY Sampling Point: A-U
Bayer, Bryan Section, Township, Range:
WGS 84
Croghan fine sandy loam
Are climatic / hydrologic conditions on the site typical for this time of year? Yes No (If no, explain in Remarks.)
Subregion (LRR or MLRA): LRR L 43° 7' 18.06" Long: 76° 5' 3.77" Datum:
significantly disturbed? Are “Normal Circumstances” present? No
naturally problematic? (If needed, explain any answers in Remarks.)
Hydrophytic Vegetation Present? Yes
Wetland Hydrology Present? Yes If yes, optional Wetland Site ID:
Is the Sampled AreaHydric Soil Present? Yes within a Wetland? Yes No
Remarks: (Explain alternative procedures here or in a separate report.)
HYDROLOGYWetland Hydrology Indicators: Secondary Indicators (minimum of two required)Primary Indicators (minimum of one is required; check all that apply) Surface Soil Cracks (B6)
Surface Water (A1)
Water Marks (B1) Hydrogen Sulfide Odor (C1) Crayfish Burrows (C8)Sediment Deposits (B2) Oxidized Rhizospheres on Living Roots (C3) Saturation Visible on Aerial Imagery (C9)
Water-Stained Leaves (B9) Drainage Patterns (B10)High Water Table (A2) Aquatic Fauna (B13) Moss Trim Lines (B16)Saturation (A3) Marl Deposits (B15) Dry-Season Water Table (C2)
Iron Deposits (B5) Thin Muck Surface (C7) Shallow Aquitard (D3)Inundation Visible on Aerial Imagery (B7) Other (Explain in Remarks) Microtopographic Relief (D4)
Drift Deposits (B3) Presence of Reduced Iron (C4) Stunted or Stressed Plants (D1)Algal Mat or Crust (B4) Recent Iron Reduction in Tilled Soils (C6) Geomorphic Position (D2)
Water Table Present? Yes No Depth (inches):
Sparsely Vegetated Concave Surface (B8) FAC-Neutral Test (D5)
Field Observations:Surface Water Present? Yes No Depth (inches):
Remarks:
No(includes capillary fringe)Describe Recorded Data (stream gauge, monitoring well, aerial photos, previous inspections), if available:
Saturation Present? Yes No Depth (inches): Wetland Hydrology Present?

US Army Corps of Engineers Northcentral and Northeast Region – Version 2.0
Sampling Point:
(Plot size:
1.
2.
3.
4.
5.
6. (A/B)
7.
Sapling/Shrub Stratum (Plot size: x 1 =
1. x 2 =
2. x 3 =
3. x 4 =
4. x 5 =
5. Column Totals: (B)
6.
7.
Herb Stratum (Plot size:
1.
2. 4 - Morphological Adaptations1 (Provide supporting
3.
4.
5.
6.
7.
8.
9.
10.
11.
12.
(Plot size:
1.
2.
3.
4. X
VEGETATION – Use scientific names of plants. A-U
Tree Stratum 30 )Absolute % Cover
Dominant Species?
Indicator Status Dominance Test worksheet:
Number of Dominant Species That Are OBL, FACW, or FAC: 2 (A)
Total Number of Dominant Species Across All Strata: 4 (B)
Percent of Dominant Species That Are OBL, FACW, or FAC: 50.0%
Quercus rubra 5 No FACU
Prevalence Index worksheet:
15 Yes FACW FAC species 15 45
0 0
Total % Cover of:
30
Fraxinus pennsylvanica
UPL species 0 0
Rhamnus cathartica 15 Yes FAC FACU species 95
=Total Cover
455
Prevalence Index = B/A = 3.64
125 (A)
15 ) OBL species
Multiply by:
FACW species 15
380
35 =Total Cover 1 - Rapid Test for Hydrophytic Vegetation
5 ) 2 - Dominance Test is >50%
Hydrophytic Vegetation Indicators:
Rubus allegheniensis 30 Yes FACU 3 - Prevalence Index is ≤3.01
Solidago canadensis 10 No FACU
Problematic Hydrophytic Vegetation1 (Explain)
1Indicators of hydric soil and wetland hydrology must be present, unless disturbed or problematic.
Poa pratensis 50 Yes FACU data in Remarks or on a separate sheet)
Sapling/shrub – Woody plants less than 3 in. DBH and greater than or equal to 3.28 ft (1 m) tall.
Definitions of Vegetation Strata:
Tree – Woody plants 3 in. (7.6 cm) or more in diameter at breast height (DBH), regardless of height.
Woody Vine Stratum ) Woody vines – All woody vines greater than 3.28 ft in height.
Herb – All herbaceous (non-woody) plants, regardless of size, and woody plants less than 3.28 ft tall.90 =Total Cover
Hydrophytic Vegetation Present? Yes No
Remarks: (Include photo numbers here or on a separate sheet.)
=Total Cover

US Army Corps of Engineers Northcentral and Northeast Region – Version 2.0
Sampling Point
X
SOIL A-U
Profile Description: (Describe to the depth needed to document the indicator or confirm the absence of indicators.)Depth Matrix Redox Features(inches) Color (moist) % Color (moist) % Type1
Loamy/Clayey
Loc2 Texture Remarks
Hydric Soil Indicators: Indicators for Problematic Hydric Soils3:Histosol (A1) Polyvalue Below Surface (S8) (LRR R, 2 cm Muck (A10) (LRR K, L, MLRA 149B)Histic Epipedon (A2) MLRA 149B) Coast Prairie Redox (A16) (LRR K, L, R)Black Histic (A3) Thin Dark Surface (S9) (LRR R, MLRA 149B) 5 cm Mucky Peat or Peat (S3) (LRR K, L, R)Hydrogen Sulfide (A4) High Chroma Sands (S11) (LRR K, L) Polyvalue Below Surface (S8) (LRR K, L)
1Type: C=Concentration, D=Depletion, RM=Reduced Matrix, MS=Masked Sand Grains. 2Location: PL=Pore Lining, M=Matrix.
Thick Dark Surface (A12) Depleted Matrix (F3) Piedmont Floodplain Soils (F19) (MLRA 149B)Sandy Mucky Mineral (S1) Redox Dark Surface (F6) Mesic Spodic (TA6) (MLRA 144A, 145, 149B)
Stratified Layers (A5) Loamy Mucky Mineral (F1) (LRR K, L) Thin Dark Surface (S9) (LRR K, L)Depleted Below Dark Surface (A11) Loamy Gleyed Matrix (F2) Iron-Manganese Masses (F12) (LRR K, L, R)
0-18 10YR 3/2 100
Stripped Matrix (S6) Marl (F10) (LRR K, L) Other (Explain in Remarks)Dark Surface (S7)
3Indicators of hydrophytic vegetation and wetland hydrology must be present, unless disturbed or problematic.
Sandy Gleyed Matrix (S4) Depleted Dark Surface (F7) Red Parent Material (F21)Sandy Redox (S5) Redox Depressions (F8) Very Shallow Dark Surface (F22)
Yes No
Remarks:This data form is revised from Northcentral and Northeast Regional Supplement Version 2.0 to include the NRCS Field Indicators of Hydric Soils, Version 7.0, 2015 Errata. (http://www.nrcs.usda.gov/Internet/FSE_DOCUMENTS/nrcs142p2_051293.docx)
Restrictive Layer (if observed):Type:
Depth (inches): Hydric Soil Present?

US Army Corps of Engineers Northcentral and Northeast Region – Version 2.0
Project/Site:
Applicant/Owner: State:
Investigator(s):
Lat:
Soil Map Unit Name: NWI classification:
X
Are Vegetation , Soil , or Hydrology Yes X
Are Vegetation , Soil , or Hydrology
SUMMARY OF FINDINGS – Attach site map showing sampling point locations, transects, important features, etc.
X NoX No XX No
XXX
X
X
XXX Yes X
WETLAND DETERMINATION DATA FORM – Northcentral and Northeast Region
Land Release for Future Development City/County: Cicero/Onondaga Sampling Date: May 9, 2019
Landform (hillside, terrace, etc.): Depression Local relief (concave, convex, none): Concave Slope %: 1-3
Syracuse Regional Airport Authority NY Sampling Point: A-W
Bayer, Bryan Section, Township, Range:
WGS 84
Croghan loamy fine sand
Are climatic / hydrologic conditions on the site typical for this time of year? Yes No (If no, explain in Remarks.)
Subregion (LRR or MLRA): LRR L 43° 7' 17.79" Long: 76° 5' 3.96" Datum:
significantly disturbed? Are “Normal Circumstances” present? No
naturally problematic? (If needed, explain any answers in Remarks.)
Hydrophytic Vegetation Present? Yes
Wetland Hydrology Present? Yes If yes, optional Wetland Site ID:
Is the Sampled AreaHydric Soil Present? Yes within a Wetland? Yes No
Remarks: (Explain alternative procedures here or in a separate report.)
HYDROLOGYWetland Hydrology Indicators: Secondary Indicators (minimum of two required)Primary Indicators (minimum of one is required; check all that apply) Surface Soil Cracks (B6)
Surface Water (A1)
Water Marks (B1) Hydrogen Sulfide Odor (C1) Crayfish Burrows (C8)Sediment Deposits (B2) Oxidized Rhizospheres on Living Roots (C3) Saturation Visible on Aerial Imagery (C9)
Water-Stained Leaves (B9) Drainage Patterns (B10)High Water Table (A2) Aquatic Fauna (B13) Moss Trim Lines (B16)Saturation (A3) Marl Deposits (B15) Dry-Season Water Table (C2)
Iron Deposits (B5) Thin Muck Surface (C7) Shallow Aquitard (D3)Inundation Visible on Aerial Imagery (B7) Other (Explain in Remarks) Microtopographic Relief (D4)
Drift Deposits (B3) Presence of Reduced Iron (C4) Stunted or Stressed Plants (D1)Algal Mat or Crust (B4) Recent Iron Reduction in Tilled Soils (C6) Geomorphic Position (D2)
0Water Table Present? Yes No Depth (inches): 10
Sparsely Vegetated Concave Surface (B8) FAC-Neutral Test (D5)
Field Observations:Surface Water Present? Yes No Depth (inches):
Remarks:
No(includes capillary fringe)Describe Recorded Data (stream gauge, monitoring well, aerial photos, previous inspections), if available:
Saturation Present? Yes No Depth (inches): 8 Wetland Hydrology Present?

US Army Corps of Engineers Northcentral and Northeast Region – Version 2.0
Sampling Point:
(Plot size:
1.
2.
3.
4.
5.
6. (A/B)
7.
Sapling/Shrub Stratum (Plot size: x 1 =
1. x 2 =
2. x 3 =
3. x 4 =
4. x 5 =
5. Column Totals: (B)
6.
7.
Herb Stratum (Plot size: X
1. X
2. 4 - Morphological Adaptations1 (Provide supporting
3.
4.
5.
6.
7.
8.
9.
10.
11.
12.
(Plot size:
1.
2.
3.
4. X
VEGETATION – Use scientific names of plants. A-W
Tree Stratum 30 )Absolute % Cover
Dominant Species?
Indicator Status Dominance Test worksheet:
Fraxinus pennsylvanica 25 Yes FACW Number of Dominant Species That Are OBL, FACW, or FAC: 4 (A)
Total Number of Dominant Species Across All Strata: 5 (B)
Percent of Dominant Species That Are OBL, FACW, or FAC: 80.0%
Fraxinus pennsylvanica 30 Yes FACW
Prevalence Index worksheet:
30 Yes FACW FAC species 0 0
20 20
Total % Cover of:
174
Cornus amomum
UPL species 0 0
FACU species 20
25 =Total Cover
274
Prevalence Index = B/A = 2.16
127 (A)
15 ) OBL species
Multiply by:
FACW species 87
80
60 =Total Cover 1 - Rapid Test for Hydrophytic Vegetation
5 ) 2 - Dominance Test is >50%
Hydrophytic Vegetation Indicators:
Solidago canadensis 20 Yes FACU 3 - Prevalence Index is ≤3.01
Solidago gigantea 20 Yes OBL
Problematic Hydrophytic Vegetation1 (Explain)
1Indicators of hydric soil and wetland hydrology must be present, unless disturbed or problematic.
Impatiens capensis 2 No FACW data in Remarks or on a separate sheet)
Sapling/shrub – Woody plants less than 3 in. DBH and greater than or equal to 3.28 ft (1 m) tall.
Definitions of Vegetation Strata:
Tree – Woody plants 3 in. (7.6 cm) or more in diameter at breast height (DBH), regardless of height.
Woody Vine Stratum ) Woody vines – All woody vines greater than 3.28 ft in height.
Herb – All herbaceous (non-woody) plants, regardless of size, and woody plants less than 3.28 ft tall.42 =Total Cover
Hydrophytic Vegetation Present? Yes No
Remarks: (Include photo numbers here or on a separate sheet.)
=Total Cover

US Army Corps of Engineers Northcentral and Northeast Region – Version 2.0
Sampling Point
X
X
SOIL A-W
Profile Description: (Describe to the depth needed to document the indicator or confirm the absence of indicators.)Depth Matrix Redox Features
Prominent redox concentrations
(inches) Color (moist) % Color (moist) % Type1
8-18 10YR 4/2
Loamy/Clayey Prominent redox concentrations
Loc2 Texture Remarks
M Loamy/Clayey90 7.5YR 4/6 10 C
Hydric Soil Indicators: Indicators for Problematic Hydric Soils3:Histosol (A1) Polyvalue Below Surface (S8) (LRR R, 2 cm Muck (A10) (LRR K, L, MLRA 149B)Histic Epipedon (A2) MLRA 149B) Coast Prairie Redox (A16) (LRR K, L, R)Black Histic (A3) Thin Dark Surface (S9) (LRR R, MLRA 149B) 5 cm Mucky Peat or Peat (S3) (LRR K, L, R)Hydrogen Sulfide (A4) High Chroma Sands (S11) (LRR K, L) Polyvalue Below Surface (S8) (LRR K, L)
1Type: C=Concentration, D=Depletion, RM=Reduced Matrix, MS=Masked Sand Grains. 2Location: PL=Pore Lining, M=Matrix.
Thick Dark Surface (A12) Depleted Matrix (F3) Piedmont Floodplain Soils (F19) (MLRA 149B)Sandy Mucky Mineral (S1) Redox Dark Surface (F6) Mesic Spodic (TA6) (MLRA 144A, 145, 149B)
Stratified Layers (A5) Loamy Mucky Mineral (F1) (LRR K, L) Thin Dark Surface (S9) (LRR K, L)Depleted Below Dark Surface (A11) Loamy Gleyed Matrix (F2) Iron-Manganese Masses (F12) (LRR K, L, R)
0-8 10YR 4/2 95 7.5YR 4/6 5 C PL
Stripped Matrix (S6) Marl (F10) (LRR K, L) Other (Explain in Remarks)Dark Surface (S7)
3Indicators of hydrophytic vegetation and wetland hydrology must be present, unless disturbed or problematic.
Sandy Gleyed Matrix (S4) Depleted Dark Surface (F7) Red Parent Material (F21)Sandy Redox (S5) Redox Depressions (F8) Very Shallow Dark Surface (F22)
Yes No
Remarks:This data form is revised from Northcentral and Northeast Regional Supplement Version 2.0 to include the NRCS Field Indicators of Hydric Soils, Version 7.0, 2015 Errata. (http://www.nrcs.usda.gov/Internet/FSE_DOCUMENTS/nrcs142p2_051293.docx)
Restrictive Layer (if observed):Type:
Depth (inches): Hydric Soil Present?

US Army Corps of Engineers Northcentral and Northeast Region – Version 2.0
Project/Site:
Applicant/Owner: State:
Investigator(s):
Lat:
Soil Map Unit Name: NWI classification:
X
Are Vegetation , Soil , or Hydrology Yes X
Are Vegetation , Soil , or Hydrology
SUMMARY OF FINDINGS – Attach site map showing sampling point locations, transects, important features, etc.
No XNo X XNo X
XXX Yes X
WETLAND DETERMINATION DATA FORM – Northcentral and Northeast Region
Land Release for Future Development City/County: Cicero/Onondaga Sampling Date: May 9, 2019
Landform (hillside, terrace, etc.): Terrace Local relief (concave, convex, none): None Slope %: 1-3
Syracuse Regional Airport Authority NY Sampling Point: B-U
Bayer, Bryan Section, Township, Range:
WGS 84
Niagara silt loam
Are climatic / hydrologic conditions on the site typical for this time of year? Yes No (If no, explain in Remarks.)
Subregion (LRR or MLRA): LRR L 43° 7' 32.39" Long: 76° 5' 16.85" Datum:
significantly disturbed? Are “Normal Circumstances” present? No
naturally problematic? (If needed, explain any answers in Remarks.)
Hydrophytic Vegetation Present? Yes
Wetland Hydrology Present? Yes If yes, optional Wetland Site ID:
Is the Sampled AreaHydric Soil Present? Yes within a Wetland? Yes No
Remarks: (Explain alternative procedures here or in a separate report.)
HYDROLOGYWetland Hydrology Indicators: Secondary Indicators (minimum of two required)Primary Indicators (minimum of one is required; check all that apply) Surface Soil Cracks (B6)
Surface Water (A1)
Water Marks (B1) Hydrogen Sulfide Odor (C1) Crayfish Burrows (C8)Sediment Deposits (B2) Oxidized Rhizospheres on Living Roots (C3) Saturation Visible on Aerial Imagery (C9)
Water-Stained Leaves (B9) Drainage Patterns (B10)High Water Table (A2) Aquatic Fauna (B13) Moss Trim Lines (B16)Saturation (A3) Marl Deposits (B15) Dry-Season Water Table (C2)
Iron Deposits (B5) Thin Muck Surface (C7) Shallow Aquitard (D3)Inundation Visible on Aerial Imagery (B7) Other (Explain in Remarks) Microtopographic Relief (D4)
Drift Deposits (B3) Presence of Reduced Iron (C4) Stunted or Stressed Plants (D1)Algal Mat or Crust (B4) Recent Iron Reduction in Tilled Soils (C6) Geomorphic Position (D2)
Water Table Present? Yes No Depth (inches):
Sparsely Vegetated Concave Surface (B8) FAC-Neutral Test (D5)
Field Observations:Surface Water Present? Yes No Depth (inches):
Remarks:
No(includes capillary fringe)Describe Recorded Data (stream gauge, monitoring well, aerial photos, previous inspections), if available:
Saturation Present? Yes No Depth (inches): Wetland Hydrology Present?

US Army Corps of Engineers Northcentral and Northeast Region – Version 2.0
Sampling Point:
(Plot size:
1.
2.
3.
4.
5.
6. (A/B)
7.
Sapling/Shrub Stratum (Plot size: x 1 =
1. x 2 =
2. x 3 =
3. x 4 =
4. x 5 =
5. Column Totals: (B)
6.
7.
Herb Stratum (Plot size:
1.
2. 4 - Morphological Adaptations1 (Provide supporting
3.
4.
5.
6.
7.
8.
9.
10.
11.
12.
(Plot size:
1.
2.
3.
4. X
VEGETATION – Use scientific names of plants. B-U
Tree Stratum 30 )Absolute % Cover
Dominant Species?
Indicator Status Dominance Test worksheet:
Number of Dominant Species That Are OBL, FACW, or FAC: 0 (A)
Total Number of Dominant Species Across All Strata: 1 (B)
Percent of Dominant Species That Are OBL, FACW, or FAC: 0.0%
Prevalence Index worksheet:
FAC species 0 0
0 0
Total % Cover of:
0
UPL species 0 0
FACU species 90
=Total Cover
360
Prevalence Index = B/A = 4.00
90 (A)
15 ) OBL species
Multiply by:
FACW species 0
360
=Total Cover 1 - Rapid Test for Hydrophytic Vegetation
5 ) 2 - Dominance Test is >50%
Hydrophytic Vegetation Indicators:
Solidago canadensis 90 Yes FACU 3 - Prevalence Index is ≤3.01
Problematic Hydrophytic Vegetation1 (Explain)
1Indicators of hydric soil and wetland hydrology must be present, unless disturbed or problematic.
data in Remarks or on a separate sheet)
Sapling/shrub – Woody plants less than 3 in. DBH and greater than or equal to 3.28 ft (1 m) tall.
Definitions of Vegetation Strata:
Tree – Woody plants 3 in. (7.6 cm) or more in diameter at breast height (DBH), regardless of height.
Woody Vine Stratum ) Woody vines – All woody vines greater than 3.28 ft in height.
Herb – All herbaceous (non-woody) plants, regardless of size, and woody plants less than 3.28 ft tall.90 =Total Cover
Hydrophytic Vegetation Present? Yes No
Remarks: (Include photo numbers here or on a separate sheet.)
=Total Cover

US Army Corps of Engineers Northcentral and Northeast Region – Version 2.0
Sampling Point
X
SOIL B-U
Profile Description: (Describe to the depth needed to document the indicator or confirm the absence of indicators.)Depth Matrix Redox Features
Prominent redox concentrations
(inches) Color (moist) % Color (moist) % Type1
14-18 10YR 5/3
Loamy/Clayey
Loc2 Texture Remarks
M Loamy/Clayey90 10YR 5/8 10 C
Hydric Soil Indicators: Indicators for Problematic Hydric Soils3:Histosol (A1) Polyvalue Below Surface (S8) (LRR R, 2 cm Muck (A10) (LRR K, L, MLRA 149B)Histic Epipedon (A2) MLRA 149B) Coast Prairie Redox (A16) (LRR K, L, R)Black Histic (A3) Thin Dark Surface (S9) (LRR R, MLRA 149B) 5 cm Mucky Peat or Peat (S3) (LRR K, L, R)Hydrogen Sulfide (A4) High Chroma Sands (S11) (LRR K, L) Polyvalue Below Surface (S8) (LRR K, L)
1Type: C=Concentration, D=Depletion, RM=Reduced Matrix, MS=Masked Sand Grains. 2Location: PL=Pore Lining, M=Matrix.
Thick Dark Surface (A12) Depleted Matrix (F3) Piedmont Floodplain Soils (F19) (MLRA 149B)Sandy Mucky Mineral (S1) Redox Dark Surface (F6) Mesic Spodic (TA6) (MLRA 144A, 145, 149B)
Stratified Layers (A5) Loamy Mucky Mineral (F1) (LRR K, L) Thin Dark Surface (S9) (LRR K, L)Depleted Below Dark Surface (A11) Loamy Gleyed Matrix (F2) Iron-Manganese Masses (F12) (LRR K, L, R)
0-14 10YR 3/3 100
Stripped Matrix (S6) Marl (F10) (LRR K, L) Other (Explain in Remarks)Dark Surface (S7)
3Indicators of hydrophytic vegetation and wetland hydrology must be present, unless disturbed or problematic.
Sandy Gleyed Matrix (S4) Depleted Dark Surface (F7) Red Parent Material (F21)Sandy Redox (S5) Redox Depressions (F8) Very Shallow Dark Surface (F22)
Yes No
Remarks:This data form is revised from Northcentral and Northeast Regional Supplement Version 2.0 to include the NRCS Field Indicators of Hydric Soils, Version 7.0, 2015 Errata. (http://www.nrcs.usda.gov/Internet/FSE_DOCUMENTS/nrcs142p2_051293.docx)
Restrictive Layer (if observed):Type:
Depth (inches): Hydric Soil Present?

US Army Corps of Engineers Northcentral and Northeast Region – Version 2.0
Project/Site:
Applicant/Owner: State:
Investigator(s):
Lat:
Soil Map Unit Name: NWI classification:
X
Are Vegetation , Soil , or Hydrology Yes X
Are Vegetation , Soil , or Hydrology
SUMMARY OF FINDINGS – Attach site map showing sampling point locations, transects, important features, etc.
X NoX No XX No
XXX
X
X
XXX Yes X
WETLAND DETERMINATION DATA FORM – Northcentral and Northeast Region
Land Release for Future Development City/County: Cicero/Onondaga Sampling Date: May 9, 2019
Landform (hillside, terrace, etc.): Depression Local relief (concave, convex, none): Concave Slope %: 1-3
Syracuse Regional Airport Authority NY Sampling Point: B-W
Bayer, Bryan Section, Township, Range:
WGS 84
Niagara silt loam
Are climatic / hydrologic conditions on the site typical for this time of year? Yes No (If no, explain in Remarks.)
Subregion (LRR or MLRA): LRR L 43° 7' 31.41" Long: 76° 5' 17" Datum:
significantly disturbed? Are “Normal Circumstances” present? No
naturally problematic? (If needed, explain any answers in Remarks.)
Hydrophytic Vegetation Present? Yes
Wetland Hydrology Present? Yes If yes, optional Wetland Site ID:
Is the Sampled AreaHydric Soil Present? Yes within a Wetland? Yes No
Remarks: (Explain alternative procedures here or in a separate report.)
HYDROLOGYWetland Hydrology Indicators: Secondary Indicators (minimum of two required)Primary Indicators (minimum of one is required; check all that apply) Surface Soil Cracks (B6)
Surface Water (A1)
Water Marks (B1) Hydrogen Sulfide Odor (C1) Crayfish Burrows (C8)Sediment Deposits (B2) Oxidized Rhizospheres on Living Roots (C3) Saturation Visible on Aerial Imagery (C9)
Water-Stained Leaves (B9) Drainage Patterns (B10)High Water Table (A2) Aquatic Fauna (B13) Moss Trim Lines (B16)Saturation (A3) Marl Deposits (B15) Dry-Season Water Table (C2)
Iron Deposits (B5) Thin Muck Surface (C7) Shallow Aquitard (D3)Inundation Visible on Aerial Imagery (B7) Other (Explain in Remarks) Microtopographic Relief (D4)
Drift Deposits (B3) Presence of Reduced Iron (C4) Stunted or Stressed Plants (D1)Algal Mat or Crust (B4) Recent Iron Reduction in Tilled Soils (C6) Geomorphic Position (D2)
4Water Table Present? Yes No Depth (inches): 0
Sparsely Vegetated Concave Surface (B8) FAC-Neutral Test (D5)
Field Observations:Surface Water Present? Yes No Depth (inches):
Remarks:
No(includes capillary fringe)Describe Recorded Data (stream gauge, monitoring well, aerial photos, previous inspections), if available:
Saturation Present? Yes No Depth (inches): 0 Wetland Hydrology Present?

US Army Corps of Engineers Northcentral and Northeast Region – Version 2.0
Sampling Point:
(Plot size:
1.
2.
3.
4.
5.
6. (A/B)
7.
Sapling/Shrub Stratum (Plot size: x 1 =
1. x 2 =
2. x 3 =
3. x 4 =
4. x 5 =
5. Column Totals: (B)
6.
7.
Herb Stratum (Plot size: X
1. X
2. 4 - Morphological Adaptations1 (Provide supporting
3.
4.
5.
6.
7.
8.
9.
10.
11.
12.
(Plot size:
1.
2.
3.
4. X
VEGETATION – Use scientific names of plants. B-W
Tree Stratum 30 )Absolute % Cover
Dominant Species?
Indicator Status Dominance Test worksheet:
Acer rubrum 25 Yes FAC Number of Dominant Species That Are OBL, FACW, or FAC:Ulmus americana 20 Yes FACW 7 (A)
Fraxinus pennsylvanica 15 Yes FACW Total Number of Dominant Species Across All Strata: 8 (B)
Percent of Dominant Species That Are OBL, FACW, or FAC: 87.5%
Lonicera morrowii 30 Yes FACU
Prevalence Index worksheet:
30 Yes FAC FAC species 90 270
5 5
Total % Cover of:
190
Rhamnus cathartica
UPL species 0 0
FACU species 30
60 =Total Cover
585
Prevalence Index = B/A = 2.66
220 (A)
15 ) OBL species
Multiply by:
FACW species 95
120
60 =Total Cover 1 - Rapid Test for Hydrophytic Vegetation
5 ) 2 - Dominance Test is >50%
Hydrophytic Vegetation Indicators:
Toxicodendron radicans 30 Yes FAC 3 - Prevalence Index is ≤3.01
Onoclea sensibilis 30 Yes FACW
Problematic Hydrophytic Vegetation1 (Explain)
Carex sp. 5 No OBL 1Indicators of hydric soil and wetland hydrology must be present, unless disturbed or problematic.
Equisetum arvense 5 No FAC data in Remarks or on a separate sheet)
Solidago gigantea 30 Yes FACW
Sapling/shrub – Woody plants less than 3 in. DBH and greater than or equal to 3.28 ft (1 m) tall.
Definitions of Vegetation Strata:
Tree – Woody plants 3 in. (7.6 cm) or more in diameter at breast height (DBH), regardless of height.
Woody Vine Stratum ) Woody vines – All woody vines greater than 3.28 ft in height.
Herb – All herbaceous (non-woody) plants, regardless of size, and woody plants less than 3.28 ft tall.100 =Total Cover
Hydrophytic Vegetation Present? Yes No
Remarks: (Include photo numbers here or on a separate sheet.)
=Total Cover

US Army Corps of Engineers Northcentral and Northeast Region – Version 2.0
Sampling Point
X
SOIL B-W
Profile Description: (Describe to the depth needed to document the indicator or confirm the absence of indicators.)Depth Matrix Redox Features(inches) Color (moist) % Color (moist) % Type1
Loamy/Clayey Prominent redox concentrations
Loc2 Texture Remarks
Hydric Soil Indicators: Indicators for Problematic Hydric Soils3:Histosol (A1) Polyvalue Below Surface (S8) (LRR R, 2 cm Muck (A10) (LRR K, L, MLRA 149B)Histic Epipedon (A2) MLRA 149B) Coast Prairie Redox (A16) (LRR K, L, R)Black Histic (A3) Thin Dark Surface (S9) (LRR R, MLRA 149B) 5 cm Mucky Peat or Peat (S3) (LRR K, L, R)Hydrogen Sulfide (A4) High Chroma Sands (S11) (LRR K, L) Polyvalue Below Surface (S8) (LRR K, L)
1Type: C=Concentration, D=Depletion, RM=Reduced Matrix, MS=Masked Sand Grains. 2Location: PL=Pore Lining, M=Matrix.
Thick Dark Surface (A12) Depleted Matrix (F3) Piedmont Floodplain Soils (F19) (MLRA 149B)Sandy Mucky Mineral (S1) Redox Dark Surface (F6) Mesic Spodic (TA6) (MLRA 144A, 145, 149B)
Stratified Layers (A5) Loamy Mucky Mineral (F1) (LRR K, L) Thin Dark Surface (S9) (LRR K, L)Depleted Below Dark Surface (A11) Loamy Gleyed Matrix (F2) Iron-Manganese Masses (F12) (LRR K, L, R)
0-18 10YR 4/2 95 7.5YR 4/6 5 C PL
Stripped Matrix (S6) Marl (F10) (LRR K, L) Other (Explain in Remarks)Dark Surface (S7)
3Indicators of hydrophytic vegetation and wetland hydrology must be present, unless disturbed or problematic.
Sandy Gleyed Matrix (S4) Depleted Dark Surface (F7) Red Parent Material (F21)Sandy Redox (S5) Redox Depressions (F8) Very Shallow Dark Surface (F22)
Yes No
Remarks:This data form is revised from Northcentral and Northeast Regional Supplement Version 2.0 to include the NRCS Field Indicators of Hydric Soils, Version 7.0, 2015 Errata. (http://www.nrcs.usda.gov/Internet/FSE_DOCUMENTS/nrcs142p2_051293.docx)
Restrictive Layer (if observed):Type:
Depth (inches): Hydric Soil Present?

US Army Corps of Engineers Northcentral and Northeast Region – Version 2.0
Project/Site:
Applicant/Owner: State:
Investigator(s):
Lat:
Soil Map Unit Name: NWI classification:
X
Are Vegetation , Soil , or Hydrology Yes X
Are Vegetation , Soil , or Hydrology
SUMMARY OF FINDINGS – Attach site map showing sampling point locations, transects, important features, etc.
X NoX No XX No
XX
X
XXX Yes X
WETLAND DETERMINATION DATA FORM – Northcentral and Northeast Region
Land Release for Future Development City/County: Cicero/Onondaga Sampling Date: May 9, 2019
Landform (hillside, terrace, etc.): Depression Local relief (concave, convex, none): Concave Slope %: 1-3
Syracuse Regional Airport Authority NY Sampling Point: B-W2
Bayer, Bryan Section, Township, Range:
WGS 84
Niagara silt loam
Are climatic / hydrologic conditions on the site typical for this time of year? Yes No (If no, explain in Remarks.)
Subregion (LRR or MLRA): LRR L 43° 7' 28.97" Long: 76° 5' 13.29" Datum:
significantly disturbed? Are “Normal Circumstances” present? No
naturally problematic? (If needed, explain any answers in Remarks.)
Hydrophytic Vegetation Present? Yes
Wetland Hydrology Present? Yes If yes, optional Wetland Site ID:
Is the Sampled AreaHydric Soil Present? Yes within a Wetland? Yes No
Remarks: (Explain alternative procedures here or in a separate report.)
HYDROLOGYWetland Hydrology Indicators: Secondary Indicators (minimum of two required)Primary Indicators (minimum of one is required; check all that apply) Surface Soil Cracks (B6)
Surface Water (A1)
Water Marks (B1) Hydrogen Sulfide Odor (C1) Crayfish Burrows (C8)Sediment Deposits (B2) Oxidized Rhizospheres on Living Roots (C3) Saturation Visible on Aerial Imagery (C9)
Water-Stained Leaves (B9) Drainage Patterns (B10)High Water Table (A2) Aquatic Fauna (B13) Moss Trim Lines (B16)Saturation (A3) Marl Deposits (B15) Dry-Season Water Table (C2)
Iron Deposits (B5) Thin Muck Surface (C7) Shallow Aquitard (D3)Inundation Visible on Aerial Imagery (B7) Other (Explain in Remarks) Microtopographic Relief (D4)
Drift Deposits (B3) Presence of Reduced Iron (C4) Stunted or Stressed Plants (D1)Algal Mat or Crust (B4) Recent Iron Reduction in Tilled Soils (C6) Geomorphic Position (D2)
0Water Table Present? Yes No Depth (inches): 5
Sparsely Vegetated Concave Surface (B8) FAC-Neutral Test (D5)
Field Observations:Surface Water Present? Yes No Depth (inches):
Remarks:
No(includes capillary fringe)Describe Recorded Data (stream gauge, monitoring well, aerial photos, previous inspections), if available:
Saturation Present? Yes No Depth (inches): 3 Wetland Hydrology Present?

US Army Corps of Engineers Northcentral and Northeast Region – Version 2.0
Sampling Point:
(Plot size:
1.
2.
3.
4.
5.
6. (A/B)
7.
Sapling/Shrub Stratum (Plot size: x 1 =
1. x 2 =
2. x 3 =
3. x 4 =
4. x 5 =
5. Column Totals: (B)
6.
7.
Herb Stratum (Plot size: X
1. X
2. 4 - Morphological Adaptations1 (Provide supporting
3.
4.
5.
6.
7.
8.
9.
10.
11.
12.
(Plot size:
1.
2.
3.
4. X
VEGETATION – Use scientific names of plants. B-W2
Tree Stratum 30 )Absolute % Cover
Dominant Species?
Indicator Status Dominance Test worksheet:
Number of Dominant Species That Are OBL, FACW, or FAC: 2 (A)
Total Number of Dominant Species Across All Strata: 3 (B)
Percent of Dominant Species That Are OBL, FACW, or FAC: 66.7%
Fraxinus pennsylvanica 40 Yes FACW
Prevalence Index worksheet:
50 Yes FAC FAC species 55 165
5 5
Total % Cover of:
90
Cornus racemosa
UPL species 0 0
Cornus amomum 5 No FACW FACU species 25
=Total Cover
360
Prevalence Index = B/A = 2.77
130 (A)
15 ) OBL species
Multiply by:
FACW species 45
100
95 =Total Cover 1 - Rapid Test for Hydrophytic Vegetation
5 ) 2 - Dominance Test is >50%
Hydrophytic Vegetation Indicators:
Solidago canadensis 20 Yes FACU 3 - Prevalence Index is ≤3.01
Cornus racemosa 5 No FAC
Problematic Hydrophytic Vegetation1 (Explain)
1Indicators of hydric soil and wetland hydrology must be present, unless disturbed or problematic.
Cirsium vulgare 5 No FACU data in Remarks or on a separate sheet)
Lythrum salicaria 5 No OBL
Sapling/shrub – Woody plants less than 3 in. DBH and greater than or equal to 3.28 ft (1 m) tall.
Definitions of Vegetation Strata:
Tree – Woody plants 3 in. (7.6 cm) or more in diameter at breast height (DBH), regardless of height.
Woody Vine Stratum ) Woody vines – All woody vines greater than 3.28 ft in height.
Herb – All herbaceous (non-woody) plants, regardless of size, and woody plants less than 3.28 ft tall.35 =Total Cover
Hydrophytic Vegetation Present? Yes No
Remarks: (Include photo numbers here or on a separate sheet.)
=Total Cover

US Army Corps of Engineers Northcentral and Northeast Region – Version 2.0
Sampling Point
X
X
SOIL B-W2
Profile Description: (Describe to the depth needed to document the indicator or confirm the absence of indicators.)Depth Matrix Redox Features
Prominent redox concentrations
(inches) Color (moist) % Color (moist) % Type1
6-18 10YR 5/2
Loamy/Clayey
Loc2 Texture Remarks
M Loamy/Clayey90 10YR 5/8 10 C
Hydric Soil Indicators: Indicators for Problematic Hydric Soils3:Histosol (A1) Polyvalue Below Surface (S8) (LRR R, 2 cm Muck (A10) (LRR K, L, MLRA 149B)Histic Epipedon (A2) MLRA 149B) Coast Prairie Redox (A16) (LRR K, L, R)Black Histic (A3) Thin Dark Surface (S9) (LRR R, MLRA 149B) 5 cm Mucky Peat or Peat (S3) (LRR K, L, R)Hydrogen Sulfide (A4) High Chroma Sands (S11) (LRR K, L) Polyvalue Below Surface (S8) (LRR K, L)
1Type: C=Concentration, D=Depletion, RM=Reduced Matrix, MS=Masked Sand Grains. 2Location: PL=Pore Lining, M=Matrix.
Thick Dark Surface (A12) Depleted Matrix (F3) Piedmont Floodplain Soils (F19) (MLRA 149B)Sandy Mucky Mineral (S1) Redox Dark Surface (F6) Mesic Spodic (TA6) (MLRA 144A, 145, 149B)
Stratified Layers (A5) Loamy Mucky Mineral (F1) (LRR K, L) Thin Dark Surface (S9) (LRR K, L)Depleted Below Dark Surface (A11) Loamy Gleyed Matrix (F2) Iron-Manganese Masses (F12) (LRR K, L, R)
0-6 10YR 4/2 100
Stripped Matrix (S6) Marl (F10) (LRR K, L) Other (Explain in Remarks)Dark Surface (S7)
3Indicators of hydrophytic vegetation and wetland hydrology must be present, unless disturbed or problematic.
Sandy Gleyed Matrix (S4) Depleted Dark Surface (F7) Red Parent Material (F21)Sandy Redox (S5) Redox Depressions (F8) Very Shallow Dark Surface (F22)
Yes No
Remarks:This data form is revised from Northcentral and Northeast Regional Supplement Version 2.0 to include the NRCS Field Indicators of Hydric Soils, Version 7.0, 2015 Errata. (http://www.nrcs.usda.gov/Internet/FSE_DOCUMENTS/nrcs142p2_051293.docx)
Restrictive Layer (if observed):Type:
Depth (inches): Hydric Soil Present?

US Army Corps of Engineers Northcentral and Northeast Region – Version 2.0
Project/Site:
Applicant/Owner: State:
Investigator(s):
Lat:
Soil Map Unit Name: NWI classification:
X
Are Vegetation , Soil , or Hydrology Yes X
Are Vegetation , Soil , or Hydrology
SUMMARY OF FINDINGS – Attach site map showing sampling point locations, transects, important features, etc.
X NoNo X XNo X
XXX Yes X
Remarks:
No(includes capillary fringe)Describe Recorded Data (stream gauge, monitoring well, aerial photos, previous inspections), if available:
Saturation Present? Yes No Depth (inches): Wetland Hydrology Present?Water Table Present? Yes No Depth (inches):
Sparsely Vegetated Concave Surface (B8) FAC-Neutral Test (D5)
Field Observations:Surface Water Present? Yes No Depth (inches):
Iron Deposits (B5) Thin Muck Surface (C7) Shallow Aquitard (D3)Inundation Visible on Aerial Imagery (B7) Other (Explain in Remarks) Microtopographic Relief (D4)
Drift Deposits (B3) Presence of Reduced Iron (C4) Stunted or Stressed Plants (D1)Algal Mat or Crust (B4) Recent Iron Reduction in Tilled Soils (C6) Geomorphic Position (D2)
Remarks: (Explain alternative procedures here or in a separate report.)
HYDROLOGYWetland Hydrology Indicators: Secondary Indicators (minimum of two required)Primary Indicators (minimum of one is required; check all that apply) Surface Soil Cracks (B6)
Surface Water (A1)
Water Marks (B1) Hydrogen Sulfide Odor (C1) Crayfish Burrows (C8)Sediment Deposits (B2) Oxidized Rhizospheres on Living Roots (C3) Saturation Visible on Aerial Imagery (C9)
Water-Stained Leaves (B9) Drainage Patterns (B10)High Water Table (A2) Aquatic Fauna (B13) Moss Trim Lines (B16)Saturation (A3) Marl Deposits (B15) Dry-Season Water Table (C2)
Is the Sampled AreaHydric Soil Present? Yes within a Wetland? Yes No
significantly disturbed? Are “Normal Circumstances” present? No
naturally problematic? (If needed, explain any answers in Remarks.)
Hydrophytic Vegetation Present? Yes
Wetland Hydrology Present? Yes If yes, optional Wetland Site ID:
WGS 84
Niagara silt loam
Are climatic / hydrologic conditions on the site typical for this time of year? Yes No (If no, explain in Remarks.)
Subregion (LRR or MLRA): LRR L 43° 7' 36.39" Long: 76° 5' 14.02" Datum:
WETLAND DETERMINATION DATA FORM – Northcentral and Northeast Region
Land Release for Future Development City/County: Cicero/Onondaga Sampling Date: May 9, 2019
Landform (hillside, terrace, etc.): Terrace Local relief (concave, convex, none): None Slope %: 1-3
Syracuse Regional Airport Authority NY Sampling Point: C-U
Bayer, Bryan Section, Township, Range:

US Army Corps of Engineers Northcentral and Northeast Region – Version 2.0
Sampling Point:
(Plot size:
1.
2.
3.
4.
5.
6. (A/B)
7.
Sapling/Shrub Stratum (Plot size: x 1 =
1. x 2 =
2. x 3 =
3. x 4 =
4. x 5 =
5. Column Totals: (B)
6.
7.
Herb Stratum (Plot size: X
1.
2. 4 - Morphological Adaptations1 (Provide supporting
3.
4.
5.
6.
7.
8.
9.
10.
11.
12.
(Plot size:
1.
2.
3.
4. X
Remarks: (Include photo numbers here or on a separate sheet.)
=Total Cover
Hydrophytic Vegetation Present? Yes No
Herb – All herbaceous (non-woody) plants, regardless of size, and woody plants less than 3.28 ft tall.2 =Total Cover
Sapling/shrub – Woody plants less than 3 in. DBH and greater than or equal to 3.28 ft (1 m) tall.
Definitions of Vegetation Strata:
Tree – Woody plants 3 in. (7.6 cm) or more in diameter at breast height (DBH), regardless of height.
Woody Vine Stratum ) Woody vines – All woody vines greater than 3.28 ft in height.
Problematic Hydrophytic Vegetation1 (Explain)
1Indicators of hydric soil and wetland hydrology must be present, unless disturbed or problematic.
data in Remarks or on a separate sheet)
80 =Total Cover 1 - Rapid Test for Hydrophytic Vegetation
5 ) 2 - Dominance Test is >50%
Hydrophytic Vegetation Indicators:
Rhamnus cathartica 2 No FAC 3 - Prevalence Index is ≤3.01
=Total Cover
246
Prevalence Index = B/A = 3.00
82 (A)
15 ) OBL species
Multiply by:
FACW species 10
40
Fraxinus pennsylvanica
UPL species 0 0
Lonicera morrowii 10 No FACU FACU species 10
FAC
Prevalence Index worksheet:
10 No FACW FAC species 62 186
0 0
Total % Cover of:
20
1 (B)
Percent of Dominant Species That Are OBL, FACW, or FAC: 100.0%
Rhamnus cathartica 60 Yes
1 (A)
Total Number of Dominant Species Across All Strata:
VEGETATION – Use scientific names of plants. C-U
Tree Stratum 30 )Absolute % Cover
Dominant Species?
Indicator Status Dominance Test worksheet:
Number of Dominant Species That Are OBL, FACW, or FAC:

US Army Corps of Engineers Northcentral and Northeast Region – Version 2.0
Sampling Point
XYes No
Remarks:This data form is revised from Northcentral and Northeast Regional Supplement Version 2.0 to include the NRCS Field Indicators of Hydric Soils, Version 7.0, 2015 Errata. (http://www.nrcs.usda.gov/Internet/FSE_DOCUMENTS/nrcs142p2_051293.docx)
Restrictive Layer (if observed):Type:
Depth (inches): Hydric Soil Present?
Stripped Matrix (S6) Marl (F10) (LRR K, L) Other (Explain in Remarks)Dark Surface (S7)
3Indicators of hydrophytic vegetation and wetland hydrology must be present, unless disturbed or problematic.
Sandy Gleyed Matrix (S4) Depleted Dark Surface (F7) Red Parent Material (F21)Sandy Redox (S5) Redox Depressions (F8) Very Shallow Dark Surface (F22)
Polyvalue Below Surface (S8) (LRR K, L)
1Type: C=Concentration, D=Depletion, RM=Reduced Matrix, MS=Masked Sand Grains. 2Location: PL=Pore Lining, M=Matrix.
Thick Dark Surface (A12) Depleted Matrix (F3) Piedmont Floodplain Soils (F19) (MLRA 149B)Sandy Mucky Mineral (S1) Redox Dark Surface (F6) Mesic Spodic (TA6) (MLRA 144A, 145, 149B)
Stratified Layers (A5) Loamy Mucky Mineral (F1) (LRR K, L) Thin Dark Surface (S9) (LRR K, L)Depleted Below Dark Surface (A11) Loamy Gleyed Matrix (F2) Iron-Manganese Masses (F12) (LRR K, L, R)
0-12 10YR 3/3 100
Hydric Soil Indicators: Indicators for Problematic Hydric Soils3:Histosol (A1) Polyvalue Below Surface (S8) (LRR R, 2 cm Muck (A10) (LRR K, L, MLRA 149B)Histic Epipedon (A2) MLRA 149B) Coast Prairie Redox (A16) (LRR K, L, R)Black Histic (A3) Thin Dark Surface (S9) (LRR R, MLRA 149B) 5 cm Mucky Peat or Peat (S3) (LRR K, L, R)Hydrogen Sulfide (A4) High Chroma Sands (S11) (LRR K, L)
90 10YR 5/8 10 C
Loamy/Clayey
Loc2 Texture Remarks
M Loamy/Clayey
SOIL C-U
Profile Description: (Describe to the depth needed to document the indicator or confirm the absence of indicators.)Depth Matrix Redox Features
Prominent redox concentrations
(inches) Color (moist) % Color (moist) % Type1
12-18 10YR 5/3

US Army Corps of Engineers Northcentral and Northeast Region – Version 2.0
Project/Site:
Applicant/Owner: State:
Investigator(s):
Lat:
Soil Map Unit Name: NWI classification:
X
Are Vegetation , Soil , or Hydrology Yes X
Are Vegetation , Soil , or Hydrology
SUMMARY OF FINDINGS – Attach site map showing sampling point locations, transects, important features, etc.
X NoX No XX No
X
X
XXX Yes X
Remarks:
No(includes capillary fringe)Describe Recorded Data (stream gauge, monitoring well, aerial photos, previous inspections), if available:
Saturation Present? Yes No Depth (inches): 14 Wetland Hydrology Present?
0Water Table Present? Yes No Depth (inches): 12
Sparsely Vegetated Concave Surface (B8) FAC-Neutral Test (D5)
Field Observations:Surface Water Present? Yes No Depth (inches):
Iron Deposits (B5) Thin Muck Surface (C7) Shallow Aquitard (D3)Inundation Visible on Aerial Imagery (B7) Other (Explain in Remarks) Microtopographic Relief (D4)
Drift Deposits (B3) Presence of Reduced Iron (C4) Stunted or Stressed Plants (D1)Algal Mat or Crust (B4) Recent Iron Reduction in Tilled Soils (C6) Geomorphic Position (D2)
Remarks: (Explain alternative procedures here or in a separate report.)
HYDROLOGYWetland Hydrology Indicators: Secondary Indicators (minimum of two required)Primary Indicators (minimum of one is required; check all that apply) Surface Soil Cracks (B6)
Surface Water (A1)
Water Marks (B1) Hydrogen Sulfide Odor (C1) Crayfish Burrows (C8)Sediment Deposits (B2) Oxidized Rhizospheres on Living Roots (C3) Saturation Visible on Aerial Imagery (C9)
Water-Stained Leaves (B9) Drainage Patterns (B10)High Water Table (A2) Aquatic Fauna (B13) Moss Trim Lines (B16)Saturation (A3) Marl Deposits (B15) Dry-Season Water Table (C2)
Is the Sampled AreaHydric Soil Present? Yes within a Wetland? Yes No
significantly disturbed? Are “Normal Circumstances” present? No
naturally problematic? (If needed, explain any answers in Remarks.)
Hydrophytic Vegetation Present? Yes
Wetland Hydrology Present? Yes If yes, optional Wetland Site ID:
WGS 84
Niagara silt loam
Are climatic / hydrologic conditions on the site typical for this time of year? Yes No (If no, explain in Remarks.)
Subregion (LRR or MLRA): LRR L 43° 7' 36.36" Long: 76° 5' 14.02" Datum:
WETLAND DETERMINATION DATA FORM – Northcentral and Northeast Region
Land Release for Future Development City/County: Cicero/Onondaga Sampling Date: May 9, 2019
Landform (hillside, terrace, etc.): Depression Local relief (concave, convex, none): Concave Slope %: 1-3
Syracuse Regional Airport Authority NY Sampling Point: C-W
Bayer, Bryan Section, Township, Range:

US Army Corps of Engineers Northcentral and Northeast Region – Version 2.0
Sampling Point:
(Plot size:
1.
2.
3.
4.
5.
6. (A/B)
7.
Sapling/Shrub Stratum (Plot size: x 1 =
1. x 2 =
2. x 3 =
3. x 4 =
4. x 5 =
5. Column Totals: (B)
6.
7.
Herb Stratum (Plot size: X
1. X
2. 4 - Morphological Adaptations1 (Provide supporting
3.
4.
5.
6.
7.
8.
9.
10.
11.
12.
(Plot size:
1.
2.
3.
4. X
Remarks: (Include photo numbers here or on a separate sheet.)
=Total Cover
Hydrophytic Vegetation Present? Yes No
Herb – All herbaceous (non-woody) plants, regardless of size, and woody plants less than 3.28 ft tall.12 =Total Cover
Sapling/shrub – Woody plants less than 3 in. DBH and greater than or equal to 3.28 ft (1 m) tall.
Definitions of Vegetation Strata:
Tree – Woody plants 3 in. (7.6 cm) or more in diameter at breast height (DBH), regardless of height.
Woody Vine Stratum ) Woody vines – All woody vines greater than 3.28 ft in height.
FACU
Problematic Hydrophytic Vegetation1 (Explain)
1Indicators of hydric soil and wetland hydrology must be present, unless disturbed or problematic.
Solidago gigantea 5 Yes FACW data in Remarks or on a separate sheet)
20 =Total Cover 1 - Rapid Test for Hydrophytic Vegetation
5 ) 2 - Dominance Test is >50%
Hydrophytic Vegetation Indicators:
Geum canadense 5 Yes FAC 3 - Prevalence Index is ≤3.01
Solidago canadensis 2 No
55 =Total Cover
253
Prevalence Index = B/A = 2.91
87 (A)
15 ) OBL species
Multiply by:
FACW species 40
128
Lonicera morrowii
UPL species 0 0
Cornus racemosa 10 Yes FAC FACU species 32
FACU
Prevalence Index worksheet:
5 Yes FACU FAC species 15 45
0 0
Total % Cover of:
80
7 (B)
Percent of Dominant Species That Are OBL, FACW, or FAC: 57.1%
Quercus rubra 5 Yes
20 Yes FACU 4 (A)
Total Number of Dominant Species Across All Strata:
VEGETATION – Use scientific names of plants. C-W
Tree Stratum 30 )Absolute % Cover
Dominant Species?
Indicator Status Dominance Test worksheet:
Fraxinus pennsylvanica 35 Yes FACW Number of Dominant Species That Are OBL, FACW, or FAC:Quercus rubra

US Army Corps of Engineers Northcentral and Northeast Region – Version 2.0
Sampling Point
X
XYes No
Remarks:This data form is revised from Northcentral and Northeast Regional Supplement Version 2.0 to include the NRCS Field Indicators of Hydric Soils, Version 7.0, 2015 Errata. (http://www.nrcs.usda.gov/Internet/FSE_DOCUMENTS/nrcs142p2_051293.docx)
Restrictive Layer (if observed):Type:
Depth (inches): Hydric Soil Present?
Stripped Matrix (S6) Marl (F10) (LRR K, L) Other (Explain in Remarks)Dark Surface (S7)
3Indicators of hydrophytic vegetation and wetland hydrology must be present, unless disturbed or problematic.
Sandy Gleyed Matrix (S4) Depleted Dark Surface (F7) Red Parent Material (F21)Sandy Redox (S5) Redox Depressions (F8) Very Shallow Dark Surface (F22)
Polyvalue Below Surface (S8) (LRR K, L)
1Type: C=Concentration, D=Depletion, RM=Reduced Matrix, MS=Masked Sand Grains. 2Location: PL=Pore Lining, M=Matrix.
Thick Dark Surface (A12) Depleted Matrix (F3) Piedmont Floodplain Soils (F19) (MLRA 149B)Sandy Mucky Mineral (S1) Redox Dark Surface (F6) Mesic Spodic (TA6) (MLRA 144A, 145, 149B)
Stratified Layers (A5) Loamy Mucky Mineral (F1) (LRR K, L) Thin Dark Surface (S9) (LRR K, L)Depleted Below Dark Surface (A11) Loamy Gleyed Matrix (F2) Iron-Manganese Masses (F12) (LRR K, L, R)
0-6 10YR 4/2 100
Hydric Soil Indicators: Indicators for Problematic Hydric Soils3:Histosol (A1) Polyvalue Below Surface (S8) (LRR R, 2 cm Muck (A10) (LRR K, L, MLRA 149B)Histic Epipedon (A2) MLRA 149B) Coast Prairie Redox (A16) (LRR K, L, R)Black Histic (A3) Thin Dark Surface (S9) (LRR R, MLRA 149B) 5 cm Mucky Peat or Peat (S3) (LRR K, L, R)Hydrogen Sulfide (A4) High Chroma Sands (S11) (LRR K, L)
90 10YR 5/8 10 C
Loamy/Clayey
Loc2 Texture Remarks
M Loamy/Clayey
SOIL C-W
Profile Description: (Describe to the depth needed to document the indicator or confirm the absence of indicators.)Depth Matrix Redox Features
Prominent redox concentrations
(inches) Color (moist) % Color (moist) % Type1
6-18 10YR 5/2

US Army Corps of Engineers Northcentral and Northeast Region – Version 2.0
Project/Site:
Applicant/Owner: State:
Investigator(s):
Lat:
Soil Map Unit Name: NWI classification:
X
Are Vegetation , Soil , or Hydrology Yes X
Are Vegetation , Soil , or Hydrology
SUMMARY OF FINDINGS – Attach site map showing sampling point locations, transects, important features, etc.
No XNo X XNo X
XXX Yes X
WETLAND DETERMINATION DATA FORM – Northcentral and Northeast Region
Land Release for Future Development City/County: Cicero/Onondaga Sampling Date: May 9, 2019
Landform (hillside, terrace, etc.): Terrace Local relief (concave, convex, none): None Slope %: 1-3
Syracuse Regional Airport Authority NY Sampling Point: D-U
Bayer, Bryan Section, Township, Range:
WGS 84
Croghan fine sandy loam
Are climatic / hydrologic conditions on the site typical for this time of year? Yes No (If no, explain in Remarks.)
Subregion (LRR or MLRA): LRR L 43° 7' 16.74" Long: 76° 5' 3.65" Datum:
significantly disturbed? Are “Normal Circumstances” present? No
naturally problematic? (If needed, explain any answers in Remarks.)
Hydrophytic Vegetation Present? Yes
Wetland Hydrology Present? Yes If yes, optional Wetland Site ID:
Is the Sampled AreaHydric Soil Present? Yes within a Wetland? Yes No
Remarks: (Explain alternative procedures here or in a separate report.)
HYDROLOGYWetland Hydrology Indicators: Secondary Indicators (minimum of two required)Primary Indicators (minimum of one is required; check all that apply) Surface Soil Cracks (B6)
Surface Water (A1)
Water Marks (B1) Hydrogen Sulfide Odor (C1) Crayfish Burrows (C8)Sediment Deposits (B2) Oxidized Rhizospheres on Living Roots (C3) Saturation Visible on Aerial Imagery (C9)
Water-Stained Leaves (B9) Drainage Patterns (B10)High Water Table (A2) Aquatic Fauna (B13) Moss Trim Lines (B16)Saturation (A3) Marl Deposits (B15) Dry-Season Water Table (C2)
Iron Deposits (B5) Thin Muck Surface (C7) Shallow Aquitard (D3)Inundation Visible on Aerial Imagery (B7) Other (Explain in Remarks) Microtopographic Relief (D4)
Drift Deposits (B3) Presence of Reduced Iron (C4) Stunted or Stressed Plants (D1)Algal Mat or Crust (B4) Recent Iron Reduction in Tilled Soils (C6) Geomorphic Position (D2)
Water Table Present? Yes No Depth (inches):
Sparsely Vegetated Concave Surface (B8) FAC-Neutral Test (D5)
Field Observations:Surface Water Present? Yes No Depth (inches):
Remarks:
No(includes capillary fringe)Describe Recorded Data (stream gauge, monitoring well, aerial photos, previous inspections), if available:
Saturation Present? Yes No Depth (inches): Wetland Hydrology Present?

US Army Corps of Engineers Northcentral and Northeast Region – Version 2.0
Sampling Point:
(Plot size:
1.
2.
3.
4.
5.
6. (A/B)
7.
Sapling/Shrub Stratum (Plot size: x 1 =
1. x 2 =
2. x 3 =
3. x 4 =
4. x 5 =
5. Column Totals: (B)
6.
7.
Herb Stratum (Plot size:
1.
2. 4 - Morphological Adaptations1 (Provide supporting
3.
4.
5.
6.
7.
8.
9.
10.
11.
12.
(Plot size:
1.
2.
3.
4. X
VEGETATION – Use scientific names of plants. D-U
Tree Stratum 30 )Absolute % Cover
Dominant Species?
Indicator Status Dominance Test worksheet:
Carya ovata 70 Yes FACU Number of Dominant Species That Are OBL, FACW, or FAC:Fraxinus pennsylvanica 20 Yes FACW 2 (A)
Total Number of Dominant Species Across All Strata: 5 (B)
Percent of Dominant Species That Are OBL, FACW, or FAC: 40.0%
Carya ovata 5 Yes FACU
Prevalence Index worksheet:
2 Yes FACU FAC species 15 45
0 0
Total % Cover of:
40
Lonicera morrowii
UPL species 0 0
FACU species 77
90 =Total Cover
393
Prevalence Index = B/A = 3.51
112 (A)
15 ) OBL species
Multiply by:
FACW species 20
308
7 =Total Cover 1 - Rapid Test for Hydrophytic Vegetation
5 ) 2 - Dominance Test is >50%
Hydrophytic Vegetation Indicators:
Toxicodendron radicans 15 Yes FAC 3 - Prevalence Index is ≤3.01
Problematic Hydrophytic Vegetation1 (Explain)
1Indicators of hydric soil and wetland hydrology must be present, unless disturbed or problematic.
data in Remarks or on a separate sheet)
Sapling/shrub – Woody plants less than 3 in. DBH and greater than or equal to 3.28 ft (1 m) tall.
Definitions of Vegetation Strata:
Tree – Woody plants 3 in. (7.6 cm) or more in diameter at breast height (DBH), regardless of height.
Woody Vine Stratum ) Woody vines – All woody vines greater than 3.28 ft in height.
Herb – All herbaceous (non-woody) plants, regardless of size, and woody plants less than 3.28 ft tall.15 =Total Cover
Hydrophytic Vegetation Present? Yes No
Remarks: (Include photo numbers here or on a separate sheet.)
=Total Cover

US Army Corps of Engineers Northcentral and Northeast Region – Version 2.0
Sampling Point
X
SOIL D-U
Profile Description: (Describe to the depth needed to document the indicator or confirm the absence of indicators.)Depth Matrix Redox Features(inches) Color (moist) % Color (moist) % Type1
Loamy/Clayey
Loc2 Texture Remarks
Hydric Soil Indicators: Indicators for Problematic Hydric Soils3:Histosol (A1) Polyvalue Below Surface (S8) (LRR R, 2 cm Muck (A10) (LRR K, L, MLRA 149B)Histic Epipedon (A2) MLRA 149B) Coast Prairie Redox (A16) (LRR K, L, R)Black Histic (A3) Thin Dark Surface (S9) (LRR R, MLRA 149B) 5 cm Mucky Peat or Peat (S3) (LRR K, L, R)Hydrogen Sulfide (A4) High Chroma Sands (S11) (LRR K, L) Polyvalue Below Surface (S8) (LRR K, L)
1Type: C=Concentration, D=Depletion, RM=Reduced Matrix, MS=Masked Sand Grains. 2Location: PL=Pore Lining, M=Matrix.
Thick Dark Surface (A12) Depleted Matrix (F3) Piedmont Floodplain Soils (F19) (MLRA 149B)Sandy Mucky Mineral (S1) Redox Dark Surface (F6) Mesic Spodic (TA6) (MLRA 144A, 145, 149B)
Stratified Layers (A5) Loamy Mucky Mineral (F1) (LRR K, L) Thin Dark Surface (S9) (LRR K, L)Depleted Below Dark Surface (A11) Loamy Gleyed Matrix (F2) Iron-Manganese Masses (F12) (LRR K, L, R)
0-18 10YR 2/1 100
Stripped Matrix (S6) Marl (F10) (LRR K, L) Other (Explain in Remarks)Dark Surface (S7)
3Indicators of hydrophytic vegetation and wetland hydrology must be present, unless disturbed or problematic.
Sandy Gleyed Matrix (S4) Depleted Dark Surface (F7) Red Parent Material (F21)Sandy Redox (S5) Redox Depressions (F8) Very Shallow Dark Surface (F22)
Yes No
Remarks:This data form is revised from Northcentral and Northeast Regional Supplement Version 2.0 to include the NRCS Field Indicators of Hydric Soils, Version 7.0, 2015 Errata. (http://www.nrcs.usda.gov/Internet/FSE_DOCUMENTS/nrcs142p2_051293.docx)
Restrictive Layer (if observed):Type:
Depth (inches): Hydric Soil Present?

US Army Corps of Engineers Northcentral and Northeast Region – Version 2.0
Project/Site:
Applicant/Owner: State:
Investigator(s):
Lat:
Soil Map Unit Name: NWI classification:
X
Are Vegetation , Soil , or Hydrology Yes X
Are Vegetation , Soil , or Hydrology
SUMMARY OF FINDINGS – Attach site map showing sampling point locations, transects, important features, etc.
X NoX No XX No
X
X
XXX Yes X
Remarks:
No(includes capillary fringe)Describe Recorded Data (stream gauge, monitoring well, aerial photos, previous inspections), if available:
Saturation Present? Yes No Depth (inches): 0 Wetland Hydrology Present?
0Water Table Present? Yes No Depth (inches): 0
Sparsely Vegetated Concave Surface (B8) FAC-Neutral Test (D5)
Field Observations:Surface Water Present? Yes No Depth (inches):
Iron Deposits (B5) Thin Muck Surface (C7) Shallow Aquitard (D3)Inundation Visible on Aerial Imagery (B7) Other (Explain in Remarks) Microtopographic Relief (D4)
Drift Deposits (B3) Presence of Reduced Iron (C4) Stunted or Stressed Plants (D1)Algal Mat or Crust (B4) Recent Iron Reduction in Tilled Soils (C6) Geomorphic Position (D2)
Remarks: (Explain alternative procedures here or in a separate report.)
HYDROLOGYWetland Hydrology Indicators: Secondary Indicators (minimum of two required)Primary Indicators (minimum of one is required; check all that apply) Surface Soil Cracks (B6)
Surface Water (A1)
Water Marks (B1) Hydrogen Sulfide Odor (C1) Crayfish Burrows (C8)Sediment Deposits (B2) Oxidized Rhizospheres on Living Roots (C3) Saturation Visible on Aerial Imagery (C9)
Water-Stained Leaves (B9) Drainage Patterns (B10)High Water Table (A2) Aquatic Fauna (B13) Moss Trim Lines (B16)Saturation (A3) Marl Deposits (B15) Dry-Season Water Table (C2)
Is the Sampled AreaHydric Soil Present? Yes within a Wetland? Yes No
significantly disturbed? Are “Normal Circumstances” present? No
naturally problematic? (If needed, explain any answers in Remarks.)
Hydrophytic Vegetation Present? Yes
Wetland Hydrology Present? Yes If yes, optional Wetland Site ID:
WGS 84
Minoa fine sandy loam PFO1C
Are climatic / hydrologic conditions on the site typical for this time of year? Yes No (If no, explain in Remarks.)
Subregion (LRR or MLRA): LRR L 43° 7' 14.45" Long: 76° 5' 4.15" Datum:
WETLAND DETERMINATION DATA FORM – Northcentral and Northeast Region
Land Release for Future Development City/County: Cicero/Onondaga Sampling Date: May 9, 2019
Landform (hillside, terrace, etc.): Depression Local relief (concave, convex, none): Concave Slope %: 1-3
Syracuse Regional Airport Authority NY Sampling Point: D-W
Bayer, Bryan Section, Township, Range:

US Army Corps of Engineers Northcentral and Northeast Region – Version 2.0
Sampling Point:
(Plot size:
1.
2.
3.
4.
5.
6. (A/B)
7.
Sapling/Shrub Stratum (Plot size: x 1 =
1. x 2 =
2. x 3 =
3. x 4 =
4. x 5 =
5. Column Totals: (B)
6.
7.
Herb Stratum (Plot size: X
1. X
2. 4 - Morphological Adaptations1 (Provide supporting
3.
4.
5.
6.
7.
8.
9.
10.
11.
12.
(Plot size:
1.
2.
3.
4. X
Remarks: (Include photo numbers here or on a separate sheet.)
=Total Cover
Hydrophytic Vegetation Present? Yes No
Herb – All herbaceous (non-woody) plants, regardless of size, and woody plants less than 3.28 ft tall.20 =Total Cover
Sapling/shrub – Woody plants less than 3 in. DBH and greater than or equal to 3.28 ft (1 m) tall.
Definitions of Vegetation Strata:
Tree – Woody plants 3 in. (7.6 cm) or more in diameter at breast height (DBH), regardless of height.
Woody Vine Stratum ) Woody vines – All woody vines greater than 3.28 ft in height.
OBL
Problematic Hydrophytic Vegetation1 (Explain)
1Indicators of hydric soil and wetland hydrology must be present, unless disturbed or problematic.
data in Remarks or on a separate sheet)
20 =Total Cover 1 - Rapid Test for Hydrophytic Vegetation
5 ) 2 - Dominance Test is >50%
Hydrophytic Vegetation Indicators:
Toxicodendron radicans 15 Yes FAC 3 - Prevalence Index is ≤3.01
Carex sp. 5 Yes
80 =Total Cover
315
Prevalence Index = B/A = 2.63
120 (A)
15 ) OBL species
Multiply by:
FACW species 40
20
Lonicera morrowii
UPL species 0 0
FACU species 5
FAC
Prevalence Index worksheet:
5 Yes FACU FAC species 70 210
5 5
Total % Cover of:
80
6 (B)
Percent of Dominant Species That Are OBL, FACW, or FAC: 83.3%
Rhamnus cathartica 15 Yes
40 Yes FAC 5 (A)
Total Number of Dominant Species Across All Strata:
VEGETATION – Use scientific names of plants. D-W
Tree Stratum 30 )Absolute % Cover
Dominant Species?
Indicator Status Dominance Test worksheet:
Fraxinus pennsylvanica 40 Yes FACW Number of Dominant Species That Are OBL, FACW, or FAC:Acer rubrum

US Army Corps of Engineers Northcentral and Northeast Region – Version 2.0
Sampling Point
XX
XYes No
Remarks:This data form is revised from Northcentral and Northeast Regional Supplement Version 2.0 to include the NRCS Field Indicators of Hydric Soils, Version 7.0, 2015 Errata. (http://www.nrcs.usda.gov/Internet/FSE_DOCUMENTS/nrcs142p2_051293.docx)
Restrictive Layer (if observed):Type:
Depth (inches): Hydric Soil Present?
Stripped Matrix (S6) Marl (F10) (LRR K, L) Other (Explain in Remarks)Dark Surface (S7)
3Indicators of hydrophytic vegetation and wetland hydrology must be present, unless disturbed or problematic.
Sandy Gleyed Matrix (S4) Depleted Dark Surface (F7) Red Parent Material (F21)Sandy Redox (S5) Redox Depressions (F8) Very Shallow Dark Surface (F22)
Polyvalue Below Surface (S8) (LRR K, L)
1Type: C=Concentration, D=Depletion, RM=Reduced Matrix, MS=Masked Sand Grains. 2Location: PL=Pore Lining, M=Matrix.
Thick Dark Surface (A12) Depleted Matrix (F3) Piedmont Floodplain Soils (F19) (MLRA 149B)Sandy Mucky Mineral (S1) Redox Dark Surface (F6) Mesic Spodic (TA6) (MLRA 144A, 145, 149B)
Stratified Layers (A5) Loamy Mucky Mineral (F1) (LRR K, L) Thin Dark Surface (S9) (LRR K, L)Depleted Below Dark Surface (A11) Loamy Gleyed Matrix (F2) Iron-Manganese Masses (F12) (LRR K, L, R)
0-7 10YR 2/1 100
Hydric Soil Indicators: Indicators for Problematic Hydric Soils3:Histosol (A1) Polyvalue Below Surface (S8) (LRR R, 2 cm Muck (A10) (LRR K, L, MLRA 149B)Histic Epipedon (A2) MLRA 149B) Coast Prairie Redox (A16) (LRR K, L, R)Black Histic (A3) Thin Dark Surface (S9) (LRR R, MLRA 149B) 5 cm Mucky Peat or Peat (S3) (LRR K, L, R)Hydrogen Sulfide (A4) High Chroma Sands (S11) (LRR K, L)
95 7.5YR 4/6 5 C
Loamy/Clayey
Loc2 Texture Remarks
M Loamy/Clayey
SOIL D-W
Profile Description: (Describe to the depth needed to document the indicator or confirm the absence of indicators.)Depth Matrix Redox Features
Prominent redox concentrations
(inches) Color (moist) % Color (moist) % Type1
7-18 7.5YR 4/2

US Army Corps of Engineers Northcentral and Northeast Region – Version 2.0
Project/Site:
Applicant/Owner: State:
Investigator(s):
Lat:
Soil Map Unit Name: NWI classification:
X
Are Vegetation , Soil , or Hydrology Yes X
Are Vegetation , Soil , or Hydrology
SUMMARY OF FINDINGS – Attach site map showing sampling point locations, transects, important features, etc.
X NoX No XX No
XXXX
XX
XXX Yes X
WETLAND DETERMINATION DATA FORM – Northcentral and Northeast Region
Land Release for Future Development City/County: Cicero/Onondaga Sampling Date: May 9, 2019
Landform (hillside, terrace, etc.): Depression Local relief (concave, convex, none): Concave Slope %: 1-3
Syracuse Regional Airport Authority NY Sampling Point: E-W
Bayer, Bryan Section, Township, Range:
WGS 84
Palms muck PFO1C
Are climatic / hydrologic conditions on the site typical for this time of year? Yes No (If no, explain in Remarks.)
Subregion (LRR or MLRA): LRR L 43° 7' 50.75" Long: 76° 4' 36.94" Datum:
significantly disturbed? Are “Normal Circumstances” present? No
naturally problematic? (If needed, explain any answers in Remarks.)
Hydrophytic Vegetation Present? Yes
Wetland Hydrology Present? Yes If yes, optional Wetland Site ID:
Is the Sampled AreaHydric Soil Present? Yes within a Wetland? Yes No
Remarks: (Explain alternative procedures here or in a separate report.)
HYDROLOGYWetland Hydrology Indicators: Secondary Indicators (minimum of two required)Primary Indicators (minimum of one is required; check all that apply) Surface Soil Cracks (B6)
Surface Water (A1)
Water Marks (B1) Hydrogen Sulfide Odor (C1) Crayfish Burrows (C8)Sediment Deposits (B2) Oxidized Rhizospheres on Living Roots (C3) Saturation Visible on Aerial Imagery (C9)
Water-Stained Leaves (B9) Drainage Patterns (B10)High Water Table (A2) Aquatic Fauna (B13) Moss Trim Lines (B16)Saturation (A3) Marl Deposits (B15) Dry-Season Water Table (C2)
Iron Deposits (B5) Thin Muck Surface (C7) Shallow Aquitard (D3)Inundation Visible on Aerial Imagery (B7) Other (Explain in Remarks) Microtopographic Relief (D4)
Drift Deposits (B3) Presence of Reduced Iron (C4) Stunted or Stressed Plants (D1)Algal Mat or Crust (B4) Recent Iron Reduction in Tilled Soils (C6) Geomorphic Position (D2)
4Water Table Present? Yes No Depth (inches): 0
Sparsely Vegetated Concave Surface (B8) FAC-Neutral Test (D5)
Field Observations:Surface Water Present? Yes No Depth (inches):
Remarks:
No(includes capillary fringe)Describe Recorded Data (stream gauge, monitoring well, aerial photos, previous inspections), if available:
Saturation Present? Yes No Depth (inches): 0 Wetland Hydrology Present?

US Army Corps of Engineers Northcentral and Northeast Region – Version 2.0
Sampling Point:
(Plot size:
1.
2.
3.
4.
5.
6. (A/B)
7.
Sapling/Shrub Stratum (Plot size: x 1 =
1. x 2 =
2. x 3 =
3. x 4 =
4. x 5 =
5. Column Totals: (B)
6.
7.
Herb Stratum (Plot size: X
1. X
2. 4 - Morphological Adaptations1 (Provide supporting
3.
4.
5.
6.
7.
8.
9.
10.
11.
12.
(Plot size:
1.
2.
3.
4. X
VEGETATION – Use scientific names of plants. E-W
Tree Stratum 30 )Absolute % Cover
Dominant Species?
Indicator Status Dominance Test worksheet:
Acer rubrum 60 Yes FAC Number of Dominant Species That Are OBL, FACW, or FAC:Fraxinus pennsylvanica 20 Yes FACW 3 (A)
Ulmus americana 10 No FACW Total Number of Dominant Species Across All Strata: 3 (B)
Percent of Dominant Species That Are OBL, FACW, or FAC: 100.0%
Fraxinus pennsylvanica 5 Yes FACW
Prevalence Index worksheet:
FAC species 60 180
0 0
Total % Cover of:
70
UPL species 0 0
FACU species 0
90 =Total Cover
250
Prevalence Index = B/A = 2.63
95 (A)
15 ) OBL species
Multiply by:
FACW species 35
0
5 =Total Cover 1 - Rapid Test for Hydrophytic Vegetation
5 ) 2 - Dominance Test is >50%
Hydrophytic Vegetation Indicators:
3 - Prevalence Index is ≤3.01
Problematic Hydrophytic Vegetation1 (Explain)
1Indicators of hydric soil and wetland hydrology must be present, unless disturbed or problematic.
data in Remarks or on a separate sheet)
Sapling/shrub – Woody plants less than 3 in. DBH and greater than or equal to 3.28 ft (1 m) tall.
Definitions of Vegetation Strata:
Tree – Woody plants 3 in. (7.6 cm) or more in diameter at breast height (DBH), regardless of height.
Woody Vine Stratum ) Woody vines – All woody vines greater than 3.28 ft in height.
Herb – All herbaceous (non-woody) plants, regardless of size, and woody plants less than 3.28 ft tall.=Total Cover
Hydrophytic Vegetation Present? Yes No
Remarks: (Include photo numbers here or on a separate sheet.)
=Total Cover

US Army Corps of Engineers Northcentral and Northeast Region – Version 2.0
Sampling Point
X
X
SOIL E-W
Profile Description: (Describe to the depth needed to document the indicator or confirm the absence of indicators.)Depth Matrix Redox Features(inches) Color (moist) % Color (moist) % Type1
Mucky Loam/Clay
Loc2 Texture Remarks
Hydric Soil Indicators: Indicators for Problematic Hydric Soils3:Histosol (A1) Polyvalue Below Surface (S8) (LRR R, 2 cm Muck (A10) (LRR K, L, MLRA 149B)Histic Epipedon (A2) MLRA 149B) Coast Prairie Redox (A16) (LRR K, L, R)Black Histic (A3) Thin Dark Surface (S9) (LRR R, MLRA 149B) 5 cm Mucky Peat or Peat (S3) (LRR K, L, R)Hydrogen Sulfide (A4) High Chroma Sands (S11) (LRR K, L) Polyvalue Below Surface (S8) (LRR K, L)
1Type: C=Concentration, D=Depletion, RM=Reduced Matrix, MS=Masked Sand Grains. 2Location: PL=Pore Lining, M=Matrix.
Thick Dark Surface (A12) Depleted Matrix (F3) Piedmont Floodplain Soils (F19) (MLRA 149B)Sandy Mucky Mineral (S1) Redox Dark Surface (F6) Mesic Spodic (TA6) (MLRA 144A, 145, 149B)
Stratified Layers (A5) Loamy Mucky Mineral (F1) (LRR K, L) Thin Dark Surface (S9) (LRR K, L)Depleted Below Dark Surface (A11) Loamy Gleyed Matrix (F2) Iron-Manganese Masses (F12) (LRR K, L, R)
0-18 10YR 2/1 100
Stripped Matrix (S6) Marl (F10) (LRR K, L) Other (Explain in Remarks)Dark Surface (S7)
3Indicators of hydrophytic vegetation and wetland hydrology must be present, unless disturbed or problematic.
Sandy Gleyed Matrix (S4) Depleted Dark Surface (F7) Red Parent Material (F21)Sandy Redox (S5) Redox Depressions (F8) Very Shallow Dark Surface (F22)
Yes No
Remarks:This data form is revised from Northcentral and Northeast Regional Supplement Version 2.0 to include the NRCS Field Indicators of Hydric Soils, Version 7.0, 2015 Errata. (http://www.nrcs.usda.gov/Internet/FSE_DOCUMENTS/nrcs142p2_051293.docx)
Restrictive Layer (if observed):Type:
Depth (inches): Hydric Soil Present?

US Army Corps of Engineers Northcentral and Northeast Region – Version 2.0
Project/Site:
Applicant/Owner: State:
Investigator(s):
Lat:
Soil Map Unit Name: NWI classification:
X
Are Vegetation , Soil , or Hydrology Yes X
Are Vegetation , Soil , or Hydrology
SUMMARY OF FINDINGS – Attach site map showing sampling point locations, transects, important features, etc.
No XNo X XNo X
XXX Yes X
WETLAND DETERMINATION DATA FORM – Northcentral and Northeast Region
Land Release for Future Development City/County: Cicero/Onondaga Sampling Date: May 9, 2019
Landform (hillside, terrace, etc.): Terrace Local relief (concave, convex, none): None Slope %: 1-3
Syracuse Regional Airport Authority NY Sampling Point: F/G-U
Bayer, Bryan Section, Township, Range:
WGS 84
Niagara silt loam
Are climatic / hydrologic conditions on the site typical for this time of year? Yes No (If no, explain in Remarks.)
Subregion (LRR or MLRA): LRR L 43° 7' 33.57" Long: 76° 4' 54.75" Datum:
significantly disturbed? Are “Normal Circumstances” present? No
naturally problematic? (If needed, explain any answers in Remarks.)
Hydrophytic Vegetation Present? Yes
Wetland Hydrology Present? Yes If yes, optional Wetland Site ID:
Is the Sampled AreaHydric Soil Present? Yes within a Wetland? Yes No
Remarks: (Explain alternative procedures here or in a separate report.)
HYDROLOGYWetland Hydrology Indicators: Secondary Indicators (minimum of two required)Primary Indicators (minimum of one is required; check all that apply) Surface Soil Cracks (B6)
Surface Water (A1)
Water Marks (B1) Hydrogen Sulfide Odor (C1) Crayfish Burrows (C8)Sediment Deposits (B2) Oxidized Rhizospheres on Living Roots (C3) Saturation Visible on Aerial Imagery (C9)
Water-Stained Leaves (B9) Drainage Patterns (B10)High Water Table (A2) Aquatic Fauna (B13) Moss Trim Lines (B16)Saturation (A3) Marl Deposits (B15) Dry-Season Water Table (C2)
Iron Deposits (B5) Thin Muck Surface (C7) Shallow Aquitard (D3)Inundation Visible on Aerial Imagery (B7) Other (Explain in Remarks) Microtopographic Relief (D4)
Drift Deposits (B3) Presence of Reduced Iron (C4) Stunted or Stressed Plants (D1)Algal Mat or Crust (B4) Recent Iron Reduction in Tilled Soils (C6) Geomorphic Position (D2)
Water Table Present? Yes No Depth (inches):
Sparsely Vegetated Concave Surface (B8) FAC-Neutral Test (D5)
Field Observations:Surface Water Present? Yes No Depth (inches):
Remarks:
No(includes capillary fringe)Describe Recorded Data (stream gauge, monitoring well, aerial photos, previous inspections), if available:
Saturation Present? Yes No Depth (inches): Wetland Hydrology Present?

US Army Corps of Engineers Northcentral and Northeast Region – Version 2.0
Sampling Point:
(Plot size:
1.
2.
3.
4.
5.
6. (A/B)
7.
Sapling/Shrub Stratum (Plot size: x 1 =
1. x 2 =
2. x 3 =
3. x 4 =
4. x 5 =
5. Column Totals: (B)
6.
7.
Herb Stratum (Plot size:
1.
2. 4 - Morphological Adaptations1 (Provide supporting
3.
4.
5.
6.
7.
8.
9.
10.
11.
12.
(Plot size:
1.
2.
3.
4. X
VEGETATION – Use scientific names of plants. F/G-U
Tree Stratum 30 )Absolute % Cover
Dominant Species?
Indicator Status Dominance Test worksheet:
Picea abies 50 Yes UPL Number of Dominant Species That Are OBL, FACW, or FAC:Acer saccharum 25 Yes FACU 0 (A)
Populus tremula 15 No FAC Total Number of Dominant Species Across All Strata: 3 (B)
Percent of Dominant Species That Are OBL, FACW, or FAC: 0.0%
Lonicera morrowii 5 Yes FACU
Prevalence Index worksheet:
FAC species 15 45
0 0
Total % Cover of:
0
UPL species 50 250
FACU species 30
90 =Total Cover
415
Prevalence Index = B/A = 4.37
95 (A)
15 ) OBL species
Multiply by:
FACW species 0
120
5 =Total Cover 1 - Rapid Test for Hydrophytic Vegetation
5 ) 2 - Dominance Test is >50%
Hydrophytic Vegetation Indicators:
3 - Prevalence Index is ≤3.01
Problematic Hydrophytic Vegetation1 (Explain)
1Indicators of hydric soil and wetland hydrology must be present, unless disturbed or problematic.
data in Remarks or on a separate sheet)
Sapling/shrub – Woody plants less than 3 in. DBH and greater than or equal to 3.28 ft (1 m) tall.
Definitions of Vegetation Strata:
Tree – Woody plants 3 in. (7.6 cm) or more in diameter at breast height (DBH), regardless of height.
Woody Vine Stratum ) Woody vines – All woody vines greater than 3.28 ft in height.
Herb – All herbaceous (non-woody) plants, regardless of size, and woody plants less than 3.28 ft tall.=Total Cover
Hydrophytic Vegetation Present? Yes No
Remarks: (Include photo numbers here or on a separate sheet.)
=Total Cover

US Army Corps of Engineers Northcentral and Northeast Region – Version 2.0
Sampling Point
X
SOIL F/G-U
Profile Description: (Describe to the depth needed to document the indicator or confirm the absence of indicators.)Depth Matrix Redox Features(inches) Color (moist) % Color (moist) % Type1
Loamy/Clayey
Loc2 Texture Remarks
Hydric Soil Indicators: Indicators for Problematic Hydric Soils3:Histosol (A1) Polyvalue Below Surface (S8) (LRR R, 2 cm Muck (A10) (LRR K, L, MLRA 149B)Histic Epipedon (A2) MLRA 149B) Coast Prairie Redox (A16) (LRR K, L, R)Black Histic (A3) Thin Dark Surface (S9) (LRR R, MLRA 149B) 5 cm Mucky Peat or Peat (S3) (LRR K, L, R)Hydrogen Sulfide (A4) High Chroma Sands (S11) (LRR K, L) Polyvalue Below Surface (S8) (LRR K, L)
1Type: C=Concentration, D=Depletion, RM=Reduced Matrix, MS=Masked Sand Grains. 2Location: PL=Pore Lining, M=Matrix.
Thick Dark Surface (A12) Depleted Matrix (F3) Piedmont Floodplain Soils (F19) (MLRA 149B)Sandy Mucky Mineral (S1) Redox Dark Surface (F6) Mesic Spodic (TA6) (MLRA 144A, 145, 149B)
Stratified Layers (A5) Loamy Mucky Mineral (F1) (LRR K, L) Thin Dark Surface (S9) (LRR K, L)Depleted Below Dark Surface (A11) Loamy Gleyed Matrix (F2) Iron-Manganese Masses (F12) (LRR K, L, R)
0-18 10YR 3/3 100
Stripped Matrix (S6) Marl (F10) (LRR K, L) Other (Explain in Remarks)Dark Surface (S7)
3Indicators of hydrophytic vegetation and wetland hydrology must be present, unless disturbed or problematic.
Sandy Gleyed Matrix (S4) Depleted Dark Surface (F7) Red Parent Material (F21)Sandy Redox (S5) Redox Depressions (F8) Very Shallow Dark Surface (F22)
Yes No
Remarks:This data form is revised from Northcentral and Northeast Regional Supplement Version 2.0 to include the NRCS Field Indicators of Hydric Soils, Version 7.0, 2015 Errata. (http://www.nrcs.usda.gov/Internet/FSE_DOCUMENTS/nrcs142p2_051293.docx)
Restrictive Layer (if observed):Type:
Depth (inches): Hydric Soil Present?
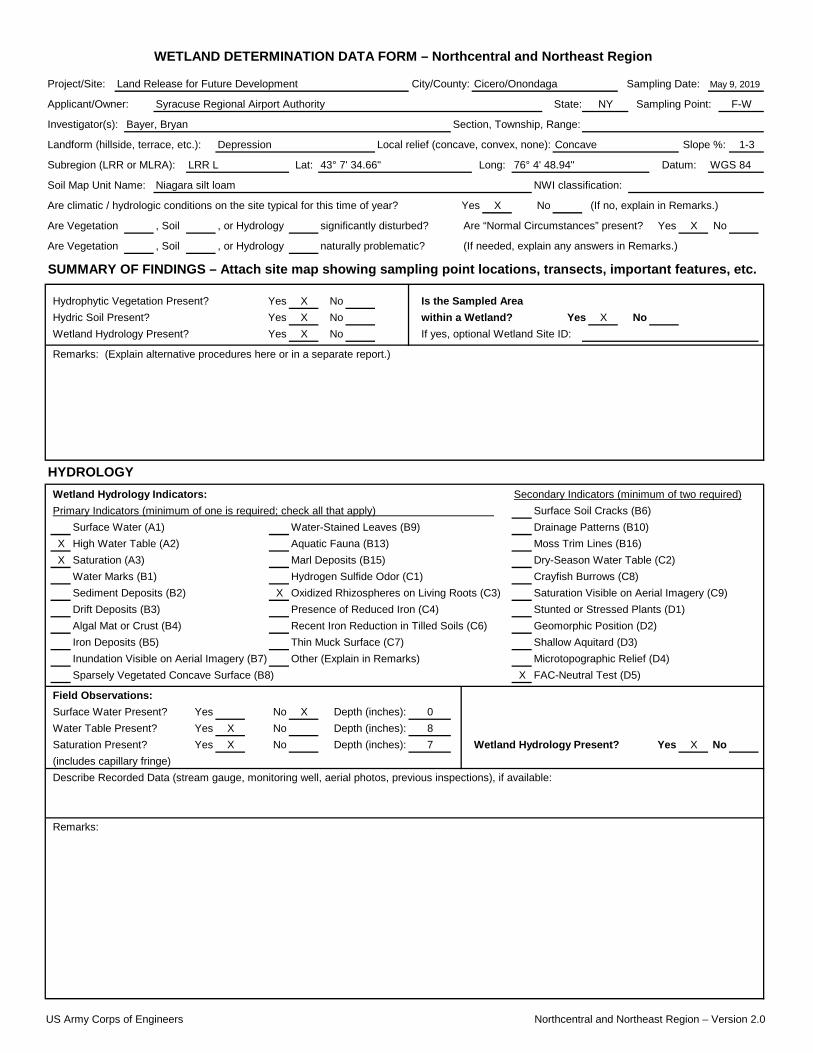
US Army Corps of Engineers Northcentral and Northeast Region – Version 2.0
Project/Site:
Applicant/Owner: State:
Investigator(s):
Lat:
Soil Map Unit Name: NWI classification:
X
Are Vegetation , Soil , or Hydrology Yes X
Are Vegetation , Soil , or Hydrology
SUMMARY OF FINDINGS – Attach site map showing sampling point locations, transects, important features, etc.
X NoX No XX No
XX
X
X
XXX Yes X
WETLAND DETERMINATION DATA FORM – Northcentral and Northeast Region
Land Release for Future Development City/County: Cicero/Onondaga Sampling Date: May 9, 2019
Landform (hillside, terrace, etc.): Depression Local relief (concave, convex, none): Concave Slope %: 1-3
Syracuse Regional Airport Authority NY Sampling Point: F-W
Bayer, Bryan Section, Township, Range:
WGS 84
Niagara silt loam
Are climatic / hydrologic conditions on the site typical for this time of year? Yes No (If no, explain in Remarks.)
Subregion (LRR or MLRA): LRR L 43° 7' 34.66" Long: 76° 4' 48.94" Datum:
significantly disturbed? Are “Normal Circumstances” present? No
naturally problematic? (If needed, explain any answers in Remarks.)
Hydrophytic Vegetation Present? Yes
Wetland Hydrology Present? Yes If yes, optional Wetland Site ID:
Is the Sampled AreaHydric Soil Present? Yes within a Wetland? Yes No
Remarks: (Explain alternative procedures here or in a separate report.)
HYDROLOGYWetland Hydrology Indicators: Secondary Indicators (minimum of two required)Primary Indicators (minimum of one is required; check all that apply) Surface Soil Cracks (B6)
Surface Water (A1)
Water Marks (B1) Hydrogen Sulfide Odor (C1) Crayfish Burrows (C8)Sediment Deposits (B2) Oxidized Rhizospheres on Living Roots (C3) Saturation Visible on Aerial Imagery (C9)
Water-Stained Leaves (B9) Drainage Patterns (B10)High Water Table (A2) Aquatic Fauna (B13) Moss Trim Lines (B16)Saturation (A3) Marl Deposits (B15) Dry-Season Water Table (C2)
Iron Deposits (B5) Thin Muck Surface (C7) Shallow Aquitard (D3)Inundation Visible on Aerial Imagery (B7) Other (Explain in Remarks) Microtopographic Relief (D4)
Drift Deposits (B3) Presence of Reduced Iron (C4) Stunted or Stressed Plants (D1)Algal Mat or Crust (B4) Recent Iron Reduction in Tilled Soils (C6) Geomorphic Position (D2)
0Water Table Present? Yes No Depth (inches): 8
Sparsely Vegetated Concave Surface (B8) FAC-Neutral Test (D5)
Field Observations:Surface Water Present? Yes No Depth (inches):
Remarks:
No(includes capillary fringe)Describe Recorded Data (stream gauge, monitoring well, aerial photos, previous inspections), if available:
Saturation Present? Yes No Depth (inches): 7 Wetland Hydrology Present?

US Army Corps of Engineers Northcentral and Northeast Region – Version 2.0
Sampling Point:
(Plot size:
1.
2.
3.
4.
5.
6. (A/B)
7.
Sapling/Shrub Stratum (Plot size: x 1 =
1. x 2 =
2. x 3 =
3. x 4 =
4. x 5 =
5. Column Totals: (B)
6.
7.
Herb Stratum (Plot size: X
1. X
2. 4 - Morphological Adaptations1 (Provide supporting
3.
4.
5.
6.
7.
8.
9.
10.
11.
12.
(Plot size:
1.
2.
3.
4. X
VEGETATION – Use scientific names of plants. F-W
Tree Stratum 30 )Absolute % Cover
Dominant Species?
Indicator Status Dominance Test worksheet:
Acer rubrum 60 Yes FAC Number of Dominant Species That Are OBL, FACW, or FAC:Fraxinus pennsylvanica 10 No FACW 5 (A)
Total Number of Dominant Species Across All Strata: 6 (B)
Percent of Dominant Species That Are OBL, FACW, or FAC: 83.3%
Rhamnus cathartica 5 Yes FAC
Prevalence Index worksheet:
5 Yes FAC FAC species 70 210
10 10
Total % Cover of:
24
Cornus racemosa
UPL species 0 0
Lonicera morrowii 5 Yes FACU FACU species 5
70 =Total Cover
264
Prevalence Index = B/A = 2.72
97 (A)
15 ) OBL species
Multiply by:
FACW species 12
20
15 =Total Cover 1 - Rapid Test for Hydrophytic Vegetation
5 ) 2 - Dominance Test is >50%
Hydrophytic Vegetation Indicators:
Juncus effusus 5 Yes OBL 3 - Prevalence Index is ≤3.01
Scirpus atrovirens 5 Yes OBL
Problematic Hydrophytic Vegetation1 (Explain)
1Indicators of hydric soil and wetland hydrology must be present, unless disturbed or problematic.
Ulmus americana 2 No FACW data in Remarks or on a separate sheet)
Sapling/shrub – Woody plants less than 3 in. DBH and greater than or equal to 3.28 ft (1 m) tall.
Definitions of Vegetation Strata:
Tree – Woody plants 3 in. (7.6 cm) or more in diameter at breast height (DBH), regardless of height.
Woody Vine Stratum ) Woody vines – All woody vines greater than 3.28 ft in height.
Herb – All herbaceous (non-woody) plants, regardless of size, and woody plants less than 3.28 ft tall.12 =Total Cover
Hydrophytic Vegetation Present? Yes No
Remarks: (Include photo numbers here or on a separate sheet.)
=Total Cover

US Army Corps of Engineers Northcentral and Northeast Region – Version 2.0
Sampling Point
X
X
SOIL F-W
Profile Description: (Describe to the depth needed to document the indicator or confirm the absence of indicators.)Depth Matrix Redox Features
Faint redox concentrations
(inches) Color (moist) % Color (moist) % Type1
6-18 10YR 5/2
Loamy/Clayey Prominent redox concentrations
Loc2 Texture Remarks
M Loamy/Clayey90 10YR 6/3 10 C
Hydric Soil Indicators: Indicators for Problematic Hydric Soils3:Histosol (A1) Polyvalue Below Surface (S8) (LRR R, 2 cm Muck (A10) (LRR K, L, MLRA 149B)Histic Epipedon (A2) MLRA 149B) Coast Prairie Redox (A16) (LRR K, L, R)Black Histic (A3) Thin Dark Surface (S9) (LRR R, MLRA 149B) 5 cm Mucky Peat or Peat (S3) (LRR K, L, R)Hydrogen Sulfide (A4) High Chroma Sands (S11) (LRR K, L) Polyvalue Below Surface (S8) (LRR K, L)
1Type: C=Concentration, D=Depletion, RM=Reduced Matrix, MS=Masked Sand Grains. 2Location: PL=Pore Lining, M=Matrix.
Thick Dark Surface (A12) Depleted Matrix (F3) Piedmont Floodplain Soils (F19) (MLRA 149B)Sandy Mucky Mineral (S1) Redox Dark Surface (F6) Mesic Spodic (TA6) (MLRA 144A, 145, 149B)
Stratified Layers (A5) Loamy Mucky Mineral (F1) (LRR K, L) Thin Dark Surface (S9) (LRR K, L)Depleted Below Dark Surface (A11) Loamy Gleyed Matrix (F2) Iron-Manganese Masses (F12) (LRR K, L, R)
0-6 10YR 4/2 90 7.5YR 4/6 10 C PL
Stripped Matrix (S6) Marl (F10) (LRR K, L) Other (Explain in Remarks)Dark Surface (S7)
3Indicators of hydrophytic vegetation and wetland hydrology must be present, unless disturbed or problematic.
Sandy Gleyed Matrix (S4) Depleted Dark Surface (F7) Red Parent Material (F21)Sandy Redox (S5) Redox Depressions (F8) Very Shallow Dark Surface (F22)
Yes No
Remarks:This data form is revised from Northcentral and Northeast Regional Supplement Version 2.0 to include the NRCS Field Indicators of Hydric Soils, Version 7.0, 2015 Errata. (http://www.nrcs.usda.gov/Internet/FSE_DOCUMENTS/nrcs142p2_051293.docx)
Restrictive Layer (if observed):Type:
Depth (inches): Hydric Soil Present?

US Army Corps of Engineers Northcentral and Northeast Region – Version 2.0
Project/Site:
Applicant/Owner: State:
Investigator(s):
Lat:
Soil Map Unit Name: NWI classification:
X
Are Vegetation , Soil , or Hydrology Yes X
Are Vegetation , Soil , or Hydrology
SUMMARY OF FINDINGS – Attach site map showing sampling point locations, transects, important features, etc.
X NoX No XX No
XXX
X
X
XXX Yes X
Remarks:
No(includes capillary fringe)Describe Recorded Data (stream gauge, monitoring well, aerial photos, previous inspections), if available:
Saturation Present? Yes No Depth (inches): 0 Wetland Hydrology Present?
2Water Table Present? Yes No Depth (inches): 0
Sparsely Vegetated Concave Surface (B8) FAC-Neutral Test (D5)
Field Observations:Surface Water Present? Yes No Depth (inches):
Iron Deposits (B5) Thin Muck Surface (C7) Shallow Aquitard (D3)Inundation Visible on Aerial Imagery (B7) Other (Explain in Remarks) Microtopographic Relief (D4)
Drift Deposits (B3) Presence of Reduced Iron (C4) Stunted or Stressed Plants (D1)Algal Mat or Crust (B4) Recent Iron Reduction in Tilled Soils (C6) Geomorphic Position (D2)
Remarks: (Explain alternative procedures here or in a separate report.)
HYDROLOGYWetland Hydrology Indicators: Secondary Indicators (minimum of two required)Primary Indicators (minimum of one is required; check all that apply) Surface Soil Cracks (B6)
Surface Water (A1)
Water Marks (B1) Hydrogen Sulfide Odor (C1) Crayfish Burrows (C8)Sediment Deposits (B2) Oxidized Rhizospheres on Living Roots (C3) Saturation Visible on Aerial Imagery (C9)
Water-Stained Leaves (B9) Drainage Patterns (B10)High Water Table (A2) Aquatic Fauna (B13) Moss Trim Lines (B16)Saturation (A3) Marl Deposits (B15) Dry-Season Water Table (C2)
Is the Sampled AreaHydric Soil Present? Yes within a Wetland? Yes No
significantly disturbed? Are “Normal Circumstances” present? No
naturally problematic? (If needed, explain any answers in Remarks.)
Hydrophytic Vegetation Present? Yes
Wetland Hydrology Present? Yes If yes, optional Wetland Site ID:
WGS 84
Niagara silt loam
Are climatic / hydrologic conditions on the site typical for this time of year? Yes No (If no, explain in Remarks.)
Subregion (LRR or MLRA): LRR L 43° 7' 35.95" Long: 76° 4' 55.86" Datum:
WETLAND DETERMINATION DATA FORM – Northcentral and Northeast Region
Land Release for Future Development City/County: Cicero/Onondaga Sampling Date: May 9, 2019
Landform (hillside, terrace, etc.): Depression Local relief (concave, convex, none): Concave Slope %: 1-3
Syracuse Regional Airport Authority NY Sampling Point: G-W
Bayer, Bryan Section, Township, Range:
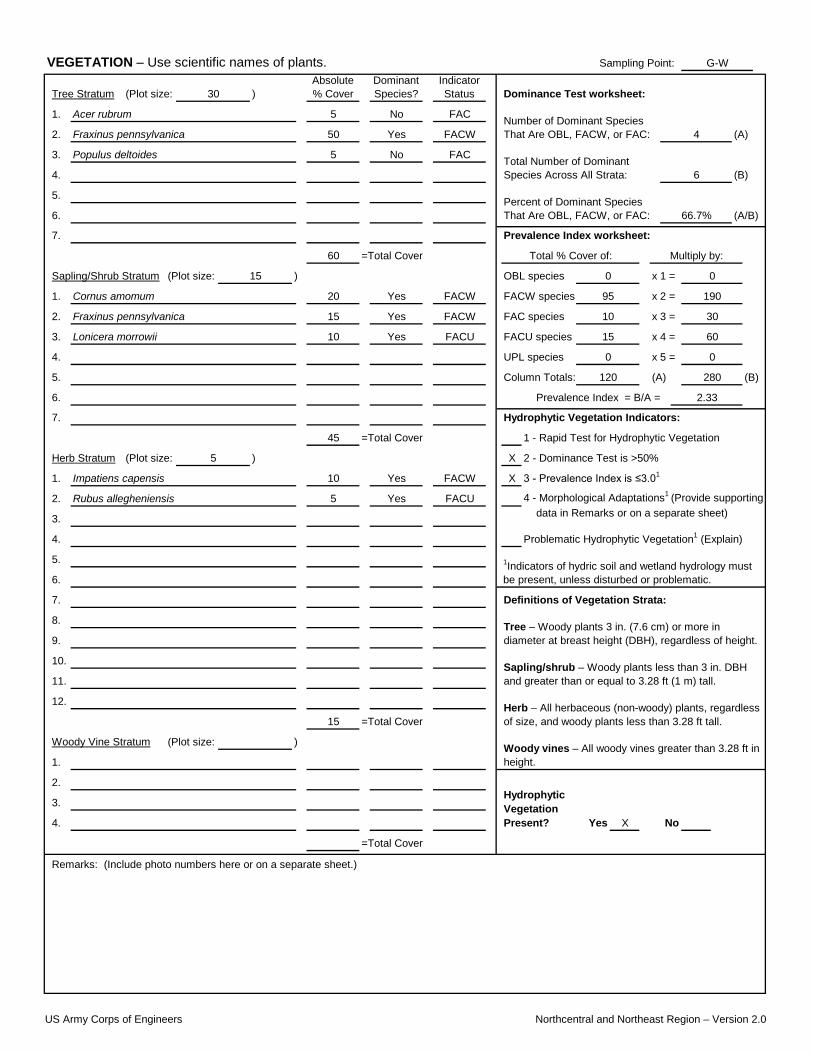
US Army Corps of Engineers Northcentral and Northeast Region – Version 2.0
Sampling Point:
(Plot size:
1.
2.
3.
4.
5.
6. (A/B)
7.
Sapling/Shrub Stratum (Plot size: x 1 =
1. x 2 =
2. x 3 =
3. x 4 =
4. x 5 =
5. Column Totals: (B)
6.
7.
Herb Stratum (Plot size: X
1. X
2. 4 - Morphological Adaptations1 (Provide supporting
3.
4.
5.
6.
7.
8.
9.
10.
11.
12.
(Plot size:
1.
2.
3.
4. X
Remarks: (Include photo numbers here or on a separate sheet.)
=Total Cover
Hydrophytic Vegetation Present? Yes No
Herb – All herbaceous (non-woody) plants, regardless of size, and woody plants less than 3.28 ft tall.15 =Total Cover
Sapling/shrub – Woody plants less than 3 in. DBH and greater than or equal to 3.28 ft (1 m) tall.
Definitions of Vegetation Strata:
Tree – Woody plants 3 in. (7.6 cm) or more in diameter at breast height (DBH), regardless of height.
Woody Vine Stratum ) Woody vines – All woody vines greater than 3.28 ft in height.
FACU
Problematic Hydrophytic Vegetation1 (Explain)
1Indicators of hydric soil and wetland hydrology must be present, unless disturbed or problematic.
data in Remarks or on a separate sheet)
45 =Total Cover 1 - Rapid Test for Hydrophytic Vegetation
5 ) 2 - Dominance Test is >50%
Hydrophytic Vegetation Indicators:
Impatiens capensis 10 Yes FACW 3 - Prevalence Index is ≤3.01
Rubus allegheniensis 5 Yes
60 =Total Cover
280
Prevalence Index = B/A = 2.33
120 (A)
15 ) OBL species
Multiply by:
FACW species 95
60
Fraxinus pennsylvanica
UPL species 0 0
Lonicera morrowii 10 Yes FACU FACU species 15
FACW
Prevalence Index worksheet:
15 Yes FACW FAC species 10 30
0 0
Total % Cover of:
190
6 (B)
Percent of Dominant Species That Are OBL, FACW, or FAC: 66.7%
Cornus amomum 20 Yes
50 Yes FACW 4 (A)
Populus deltoides 5 No FAC Total Number of Dominant Species Across All Strata:
VEGETATION – Use scientific names of plants. G-W
Tree Stratum 30 )Absolute % Cover
Dominant Species?
Indicator Status Dominance Test worksheet:
Acer rubrum 5 No FAC Number of Dominant Species That Are OBL, FACW, or FAC:Fraxinus pennsylvanica

US Army Corps of Engineers Northcentral and Northeast Region – Version 2.0
Sampling Point
X
XYes No
Remarks:This data form is revised from Northcentral and Northeast Regional Supplement Version 2.0 to include the NRCS Field Indicators of Hydric Soils, Version 7.0, 2015 Errata. (http://www.nrcs.usda.gov/Internet/FSE_DOCUMENTS/nrcs142p2_051293.docx)
Restrictive Layer (if observed):Type:
Depth (inches): Hydric Soil Present?
Stripped Matrix (S6) Marl (F10) (LRR K, L) Other (Explain in Remarks)Dark Surface (S7)
3Indicators of hydrophytic vegetation and wetland hydrology must be present, unless disturbed or problematic.
Sandy Gleyed Matrix (S4) Depleted Dark Surface (F7) Red Parent Material (F21)Sandy Redox (S5) Redox Depressions (F8) Very Shallow Dark Surface (F22)
Polyvalue Below Surface (S8) (LRR K, L)
1Type: C=Concentration, D=Depletion, RM=Reduced Matrix, MS=Masked Sand Grains. 2Location: PL=Pore Lining, M=Matrix.
Thick Dark Surface (A12) Depleted Matrix (F3) Piedmont Floodplain Soils (F19) (MLRA 149B)Sandy Mucky Mineral (S1) Redox Dark Surface (F6) Mesic Spodic (TA6) (MLRA 144A, 145, 149B)
Stratified Layers (A5) Loamy Mucky Mineral (F1) (LRR K, L) Thin Dark Surface (S9) (LRR K, L)Depleted Below Dark Surface (A11) Loamy Gleyed Matrix (F2) Iron-Manganese Masses (F12) (LRR K, L, R)
0-6 10YR 4/2 90 7.5YR 4/6 10 C PL
Hydric Soil Indicators: Indicators for Problematic Hydric Soils3:Histosol (A1) Polyvalue Below Surface (S8) (LRR R, 2 cm Muck (A10) (LRR K, L, MLRA 149B)Histic Epipedon (A2) MLRA 149B) Coast Prairie Redox (A16) (LRR K, L, R)Black Histic (A3) Thin Dark Surface (S9) (LRR R, MLRA 149B) 5 cm Mucky Peat or Peat (S3) (LRR K, L, R)Hydrogen Sulfide (A4) High Chroma Sands (S11) (LRR K, L)
90 10YR 6/3 10 C
Loamy/Clayey Prominent redox concentrations
Loc2 Texture Remarks
M Loamy/Clayey
SOIL G-W
Profile Description: (Describe to the depth needed to document the indicator or confirm the absence of indicators.)Depth Matrix Redox Features
Faint redox concentrations
(inches) Color (moist) % Color (moist) % Type1
6-18 10YR 5/2

US Army Corps of Engineers Northcentral and Northeast Region – Version 2.0
Project/Site:
Applicant/Owner: State:
Investigator(s):
Lat:
Soil Map Unit Name: NWI classification:
X
Are Vegetation , Soil , or Hydrology Yes X
Are Vegetation , Soil , or Hydrology
SUMMARY OF FINDINGS – Attach site map showing sampling point locations, transects, important features, etc.
X NoNo X XNo X
XXX Yes X
WETLAND DETERMINATION DATA FORM – Northcentral and Northeast Region
Land Release for Future Development City/County: Cicero/Onondaga Sampling Date: May 9, 2019
Landform (hillside, terrace, etc.): Terrace Local relief (concave, convex, none): None Slope %: 1-3
Syracuse Regional Airport Authority NY Sampling Point: H-U
Bayer, Bryan Section, Township, Range:
WGS 84
Niagara silt loam
Are climatic / hydrologic conditions on the site typical for this time of year? Yes No (If no, explain in Remarks.)
Subregion (LRR or MLRA): LRR L 43° 7' 21.48" Long: 76° 4' 56.54" Datum:
significantly disturbed? Are “Normal Circumstances” present? No
naturally problematic? (If needed, explain any answers in Remarks.)
Hydrophytic Vegetation Present? Yes
Wetland Hydrology Present? Yes If yes, optional Wetland Site ID:
Is the Sampled AreaHydric Soil Present? Yes within a Wetland? Yes No
Remarks: (Explain alternative procedures here or in a separate report.)
HYDROLOGYWetland Hydrology Indicators: Secondary Indicators (minimum of two required)Primary Indicators (minimum of one is required; check all that apply) Surface Soil Cracks (B6)
Surface Water (A1)
Water Marks (B1) Hydrogen Sulfide Odor (C1) Crayfish Burrows (C8)Sediment Deposits (B2) Oxidized Rhizospheres on Living Roots (C3) Saturation Visible on Aerial Imagery (C9)
Water-Stained Leaves (B9) Drainage Patterns (B10)High Water Table (A2) Aquatic Fauna (B13) Moss Trim Lines (B16)Saturation (A3) Marl Deposits (B15) Dry-Season Water Table (C2)
Iron Deposits (B5) Thin Muck Surface (C7) Shallow Aquitard (D3)Inundation Visible on Aerial Imagery (B7) Other (Explain in Remarks) Microtopographic Relief (D4)
Drift Deposits (B3) Presence of Reduced Iron (C4) Stunted or Stressed Plants (D1)Algal Mat or Crust (B4) Recent Iron Reduction in Tilled Soils (C6) Geomorphic Position (D2)
Water Table Present? Yes No Depth (inches):
Sparsely Vegetated Concave Surface (B8) FAC-Neutral Test (D5)
Field Observations:Surface Water Present? Yes No Depth (inches):
Remarks:
No(includes capillary fringe)Describe Recorded Data (stream gauge, monitoring well, aerial photos, previous inspections), if available:
Saturation Present? Yes No Depth (inches): Wetland Hydrology Present?

US Army Corps of Engineers Northcentral and Northeast Region – Version 2.0
Sampling Point:
(Plot size:
1.
2.
3.
4.
5.
6. (A/B)
7.
Sapling/Shrub Stratum (Plot size: x 1 =
1. x 2 =
2. x 3 =
3. x 4 =
4. x 5 =
5. Column Totals: (B)
6.
7.
Herb Stratum (Plot size: X
1.
2. 4 - Morphological Adaptations1 (Provide supporting
3.
4.
5.
6.
7.
8.
9.
10.
11.
12.
(Plot size:
1.
2.
3.
4. X
VEGETATION – Use scientific names of plants. H-U
Tree Stratum 30 )Absolute % Cover
Dominant Species?
Indicator Status Dominance Test worksheet:
Rhamnus cathartica 60 Yes FAC Number of Dominant Species That Are OBL, FACW, or FAC:Fraxinus pennsylvanica 10 No FACW 3 (A)
Total Number of Dominant Species Across All Strata: 4 (B)
Percent of Dominant Species That Are OBL, FACW, or FAC: 75.0%
Lonicera morrowii 5 Yes FACU
Prevalence Index worksheet:
2 Yes FAC FAC species 122 366
0 0
Total % Cover of:
20
Cornus racemosa
UPL species 0 0
FACU species 5
70 =Total Cover
406
Prevalence Index = B/A = 2.96
137 (A)
15 ) OBL species
Multiply by:
FACW species 10
20
7 =Total Cover 1 - Rapid Test for Hydrophytic Vegetation
5 ) 2 - Dominance Test is >50%
Hydrophytic Vegetation Indicators:
Persicaria maculosa 60 Yes FAC 3 - Prevalence Index is ≤3.01
Problematic Hydrophytic Vegetation1 (Explain)
1Indicators of hydric soil and wetland hydrology must be present, unless disturbed or problematic.
data in Remarks or on a separate sheet)
Sapling/shrub – Woody plants less than 3 in. DBH and greater than or equal to 3.28 ft (1 m) tall.
Definitions of Vegetation Strata:
Tree – Woody plants 3 in. (7.6 cm) or more in diameter at breast height (DBH), regardless of height.
Woody Vine Stratum ) Woody vines – All woody vines greater than 3.28 ft in height.
Herb – All herbaceous (non-woody) plants, regardless of size, and woody plants less than 3.28 ft tall.60 =Total Cover
Hydrophytic Vegetation Present? Yes No
Remarks: (Include photo numbers here or on a separate sheet.)
=Total Cover

US Army Corps of Engineers Northcentral and Northeast Region – Version 2.0
Sampling Point
X
SOIL H-U
Profile Description: (Describe to the depth needed to document the indicator or confirm the absence of indicators.)Depth Matrix Redox Features
Distinct redox concentrations
(inches) Color (moist) % Color (moist) % Type1
10-18 10YR 4/3
Loamy/Clayey
Loc2 Texture Remarks
M Loamy/Clayey90 10YR 5/6 10 C
Hydric Soil Indicators: Indicators for Problematic Hydric Soils3:Histosol (A1) Polyvalue Below Surface (S8) (LRR R, 2 cm Muck (A10) (LRR K, L, MLRA 149B)Histic Epipedon (A2) MLRA 149B) Coast Prairie Redox (A16) (LRR K, L, R)Black Histic (A3) Thin Dark Surface (S9) (LRR R, MLRA 149B) 5 cm Mucky Peat or Peat (S3) (LRR K, L, R)Hydrogen Sulfide (A4) High Chroma Sands (S11) (LRR K, L) Polyvalue Below Surface (S8) (LRR K, L)
1Type: C=Concentration, D=Depletion, RM=Reduced Matrix, MS=Masked Sand Grains. 2Location: PL=Pore Lining, M=Matrix.
Thick Dark Surface (A12) Depleted Matrix (F3) Piedmont Floodplain Soils (F19) (MLRA 149B)Sandy Mucky Mineral (S1) Redox Dark Surface (F6) Mesic Spodic (TA6) (MLRA 144A, 145, 149B)
Stratified Layers (A5) Loamy Mucky Mineral (F1) (LRR K, L) Thin Dark Surface (S9) (LRR K, L)Depleted Below Dark Surface (A11) Loamy Gleyed Matrix (F2) Iron-Manganese Masses (F12) (LRR K, L, R)
0-10 10YR 2/1 100
Stripped Matrix (S6) Marl (F10) (LRR K, L) Other (Explain in Remarks)Dark Surface (S7)
3Indicators of hydrophytic vegetation and wetland hydrology must be present, unless disturbed or problematic.
Sandy Gleyed Matrix (S4) Depleted Dark Surface (F7) Red Parent Material (F21)Sandy Redox (S5) Redox Depressions (F8) Very Shallow Dark Surface (F22)
Yes No
Remarks:This data form is revised from Northcentral and Northeast Regional Supplement Version 2.0 to include the NRCS Field Indicators of Hydric Soils, Version 7.0, 2015 Errata. (http://www.nrcs.usda.gov/Internet/FSE_DOCUMENTS/nrcs142p2_051293.docx)
Restrictive Layer (if observed):Type:
Depth (inches): Hydric Soil Present?

US Army Corps of Engineers Northcentral and Northeast Region – Version 2.0
Project/Site:
Applicant/Owner: State:
Investigator(s):
Lat:
Soil Map Unit Name: NWI classification:
X
Are Vegetation , Soil , or Hydrology Yes X
Are Vegetation , Soil , or Hydrology
SUMMARY OF FINDINGS – Attach site map showing sampling point locations, transects, important features, etc.
X NoX No XX No
XXX
XX
XXX Yes X
WETLAND DETERMINATION DATA FORM – Northcentral and Northeast Region
Land Release for Future Development City/County: Cicero/Onondaga Sampling Date: May 9, 2019
Landform (hillside, terrace, etc.): Depression Local relief (concave, convex, none): Concave Slope %: 1-3
Syracuse Regional Airport Authority NY Sampling Point: H-W
Bayer, Bryan Section, Township, Range:
WGS 84
Niagara silt loam
Are climatic / hydrologic conditions on the site typical for this time of year? Yes No (If no, explain in Remarks.)
Subregion (LRR or MLRA): LRR L 43° 7' 46.48" Long: 76° 4' 42.95" Datum:
significantly disturbed? Are “Normal Circumstances” present? No
naturally problematic? (If needed, explain any answers in Remarks.)
Hydrophytic Vegetation Present? Yes
Wetland Hydrology Present? Yes If yes, optional Wetland Site ID:
Is the Sampled AreaHydric Soil Present? Yes within a Wetland? Yes No
Remarks: (Explain alternative procedures here or in a separate report.)
HYDROLOGYWetland Hydrology Indicators: Secondary Indicators (minimum of two required)Primary Indicators (minimum of one is required; check all that apply) Surface Soil Cracks (B6)
Surface Water (A1)
Water Marks (B1) Hydrogen Sulfide Odor (C1) Crayfish Burrows (C8)Sediment Deposits (B2) Oxidized Rhizospheres on Living Roots (C3) Saturation Visible on Aerial Imagery (C9)
Water-Stained Leaves (B9) Drainage Patterns (B10)High Water Table (A2) Aquatic Fauna (B13) Moss Trim Lines (B16)Saturation (A3) Marl Deposits (B15) Dry-Season Water Table (C2)
Iron Deposits (B5) Thin Muck Surface (C7) Shallow Aquitard (D3)Inundation Visible on Aerial Imagery (B7) Other (Explain in Remarks) Microtopographic Relief (D4)
Drift Deposits (B3) Presence of Reduced Iron (C4) Stunted or Stressed Plants (D1)Algal Mat or Crust (B4) Recent Iron Reduction in Tilled Soils (C6) Geomorphic Position (D2)
2Water Table Present? Yes No Depth (inches): 0
Sparsely Vegetated Concave Surface (B8) FAC-Neutral Test (D5)
Field Observations:Surface Water Present? Yes No Depth (inches):
Remarks:
No(includes capillary fringe)Describe Recorded Data (stream gauge, monitoring well, aerial photos, previous inspections), if available:
Saturation Present? Yes No Depth (inches): 0 Wetland Hydrology Present?

US Army Corps of Engineers Northcentral and Northeast Region – Version 2.0
Sampling Point:
(Plot size:
1.
2.
3.
4.
5.
6. (A/B)
7.
Sapling/Shrub Stratum (Plot size: x 1 =
1. x 2 =
2. x 3 =
3. x 4 =
4. x 5 =
5. Column Totals: (B)
6.
7.
Herb Stratum (Plot size: X
1. X
2. 4 - Morphological Adaptations1 (Provide supporting
3.
4.
5.
6.
7.
8.
9.
10.
11.
12.
(Plot size:
1.
2.
3.
4. X
VEGETATION – Use scientific names of plants. H-W
Tree Stratum 30 )Absolute % Cover
Dominant Species?
Indicator Status Dominance Test worksheet:
Fraxinus pennsylvanica 60 Yes FACW Number of Dominant Species That Are OBL, FACW, or FAC: 3 (A)
Total Number of Dominant Species Across All Strata: 3 (B)
Percent of Dominant Species That Are OBL, FACW, or FAC: 100.0%
Rhamnus cathartica 30 Yes FAC
Prevalence Index worksheet:
5 No FACU FAC species 40 120
0 0
Total % Cover of:
210
Lonicera morrowii
UPL species 0 0
FACU species 5
60 =Total Cover
350
Prevalence Index = B/A = 2.33
150 (A)
15 ) OBL species
Multiply by:
FACW species 105
20
35 =Total Cover 1 - Rapid Test for Hydrophytic Vegetation
5 ) 2 - Dominance Test is >50%
Hydrophytic Vegetation Indicators:
Impatiens capensis 35 Yes FACW 3 - Prevalence Index is ≤3.01
Persicaria maculosa 10 No FAC
Problematic Hydrophytic Vegetation1 (Explain)
1Indicators of hydric soil and wetland hydrology must be present, unless disturbed or problematic.
Solidago gigantea 10 No FACW data in Remarks or on a separate sheet)
Sapling/shrub – Woody plants less than 3 in. DBH and greater than or equal to 3.28 ft (1 m) tall.
Definitions of Vegetation Strata:
Tree – Woody plants 3 in. (7.6 cm) or more in diameter at breast height (DBH), regardless of height.
Woody Vine Stratum ) Woody vines – All woody vines greater than 3.28 ft in height.
Herb – All herbaceous (non-woody) plants, regardless of size, and woody plants less than 3.28 ft tall.55 =Total Cover
Hydrophytic Vegetation Present? Yes No
Remarks: (Include photo numbers here or on a separate sheet.)
=Total Cover

US Army Corps of Engineers Northcentral and Northeast Region – Version 2.0
Sampling Point
X
X
SOIL H-W
Profile Description: (Describe to the depth needed to document the indicator or confirm the absence of indicators.)Depth Matrix Redox Features(inches) Color (moist) % Color (moist) % Type1
Mucky Loam/Clay
Loc2 Texture Remarks
Hydric Soil Indicators: Indicators for Problematic Hydric Soils3:Histosol (A1) Polyvalue Below Surface (S8) (LRR R, 2 cm Muck (A10) (LRR K, L, MLRA 149B)Histic Epipedon (A2) MLRA 149B) Coast Prairie Redox (A16) (LRR K, L, R)Black Histic (A3) Thin Dark Surface (S9) (LRR R, MLRA 149B) 5 cm Mucky Peat or Peat (S3) (LRR K, L, R)Hydrogen Sulfide (A4) High Chroma Sands (S11) (LRR K, L) Polyvalue Below Surface (S8) (LRR K, L)
1Type: C=Concentration, D=Depletion, RM=Reduced Matrix, MS=Masked Sand Grains. 2Location: PL=Pore Lining, M=Matrix.
Thick Dark Surface (A12) Depleted Matrix (F3) Piedmont Floodplain Soils (F19) (MLRA 149B)Sandy Mucky Mineral (S1) Redox Dark Surface (F6) Mesic Spodic (TA6) (MLRA 144A, 145, 149B)
Stratified Layers (A5) Loamy Mucky Mineral (F1) (LRR K, L) Thin Dark Surface (S9) (LRR K, L)Depleted Below Dark Surface (A11) Loamy Gleyed Matrix (F2) Iron-Manganese Masses (F12) (LRR K, L, R)
0-18 10YR 2/1 100
Stripped Matrix (S6) Marl (F10) (LRR K, L) Other (Explain in Remarks)Dark Surface (S7)
3Indicators of hydrophytic vegetation and wetland hydrology must be present, unless disturbed or problematic.
Sandy Gleyed Matrix (S4) Depleted Dark Surface (F7) Red Parent Material (F21)Sandy Redox (S5) Redox Depressions (F8) Very Shallow Dark Surface (F22)
Yes No
Remarks:This data form is revised from Northcentral and Northeast Regional Supplement Version 2.0 to include the NRCS Field Indicators of Hydric Soils, Version 7.0, 2015 Errata. (http://www.nrcs.usda.gov/Internet/FSE_DOCUMENTS/nrcs142p2_051293.docx)
Restrictive Layer (if observed):Type:
Depth (inches): Hydric Soil Present?


APPENDIX B WEB SOIL SURVEY


Hydric Rating by Map Unit—Onondaga County, New York(Land Release - SRAA)
Natural ResourcesConservation Service
Web Soil SurveyNational Cooperative Soil Survey
5/15/2019Page 1 of 5
4774
700
4774
800
4774
900
4775
000
4775
100
4775
200
4775
300
4775
400
4775
500
4775
600
4774
700
4774
800
4774
900
4775
000
4775
100
4775
200
4775
300
4775
400
4775
500
4775
600
411400 411500 411600 411700 411800 411900 412000 412100
411400 411500 411600 411700 411800 411900 412000 412100
43° 7' 42'' N76
° 5
' 21'
' W43° 7' 42'' N
76° 4
' 47'
' W
43° 7' 9'' N
76° 5
' 21'
' W
43° 7' 9'' N
76° 4
' 47'
' W
N
Map projection: Web Mercator Corner coordinates: WGS84 Edge tics: UTM Zone 18N WGS840 200 400 800 1200
Feet0 50 100 200 300
MetersMap Scale: 1:4,910 if printed on A portrait (8.5" x 11") sheet.
Soil Map may not be valid at this scale.

MA
P LE
GEN
DM
AP
INFO
RM
ATIO
N
Are
a of
Inte
rest
(AO
I)Ar
ea o
f Int
eres
t (AO
I)
Soils So
il R
atin
g Po
lygo
nsH
ydric
(100
%)
Hyd
ric (6
6 to
99%
)
Hyd
ric (3
3 to
65%
)
Hyd
ric (1
to 3
2%)
Not
Hyd
ric (0
%)
Not
rate
d or
not
ava
ilabl
e
Soil
Rat
ing
Line
sH
ydric
(100
%)
Hyd
ric (6
6 to
99%
)
Hyd
ric (3
3 to
65%
)
Hyd
ric (1
to 3
2%)
Not
Hyd
ric (0
%)
Not
rate
d or
not
ava
ilabl
e
Soil
Rat
ing
Poin
tsH
ydric
(100
%)
Hyd
ric (6
6 to
99%
)
Hyd
ric (3
3 to
65%
)
Hyd
ric (1
to 3
2%)
Not
Hyd
ric (0
%)
Not
rate
d or
not
ava
ilabl
e
Wat
er F
eatu
res
Stre
ams
and
Can
als
Tran
spor
tatio
nR
ails
Inte
rsta
te H
ighw
ays
US
Rou
tes
Maj
or R
oads
Loca
l Roa
ds
Bac
kgro
und Ae
rial P
hoto
grap
hy
The
soil
surv
eys
that
com
pris
e yo
ur A
OI w
ere
map
ped
at
1:20
,000
.
War
ning
: Soi
l Map
may
not
be
valid
at t
his
scal
e.
Enla
rgem
ent o
f map
s be
yond
the
scal
e of
map
ping
can
cau
se
mis
unde
rsta
ndin
g of
the
deta
il of
map
ping
and
acc
urac
y of
soi
l lin
e pl
acem
ent.
The
map
s do
not
sho
w th
e sm
all a
reas
of
cont
rast
ing
soils
that
cou
ld h
ave
been
sho
wn
at a
mor
e de
taile
d sc
ale.
Plea
se re
ly o
n th
e ba
r sca
le o
n ea
ch m
ap s
heet
for m
ap
mea
sure
men
ts.
Sour
ce o
f Map
: N
atur
al R
esou
rces
Con
serv
atio
n Se
rvic
eW
eb S
oil S
urve
y U
RL:
C
oord
inat
e Sy
stem
: W
eb M
erca
tor (
EPSG
:385
7)
Map
s fro
m th
e W
eb S
oil S
urve
y ar
e ba
sed
on th
e W
eb M
erca
tor
proj
ectio
n, w
hich
pre
serv
es d
irect
ion
and
shap
e bu
t dis
torts
di
stan
ce a
nd a
rea.
A p
roje
ctio
n th
at p
rese
rves
are
a, s
uch
as th
e Al
bers
equ
al-a
rea
coni
c pr
ojec
tion,
sho
uld
be u
sed
if m
ore
accu
rate
cal
cula
tions
of d
ista
nce
or a
rea
are
requ
ired.
This
pro
duct
is g
ener
ated
from
the
USD
A-N
RC
S ce
rtifie
d da
ta a
s of
the
vers
ion
date
(s) l
iste
d be
low.
Soil
Surv
ey A
rea:
O
nond
aga
Cou
nty,
New
Yor
kSu
rvey
Are
a D
ata:
Ve
rsio
n 13
, Sep
3, 2
018
Soil
map
uni
ts a
re la
bele
d (a
s sp
ace
allo
ws)
for m
ap s
cale
s 1:
50,0
00 o
r lar
ger.
Dat
e(s)
aer
ial i
mag
es w
ere
phot
ogra
phed
: D
ec 3
1, 2
009—
Oct
10
, 201
6
The
orth
opho
to o
r oth
er b
ase
map
on
whi
ch th
e so
il lin
es w
ere
com
pile
d an
d di
gitiz
ed p
roba
bly
diffe
rs fr
om th
e ba
ckgr
ound
im
ager
y di
spla
yed
on th
ese
map
s. A
s a
resu
lt, s
ome
min
or
shift
ing
of m
ap u
nit b
ound
arie
s m
ay b
e ev
iden
t.
Hyd
ric R
atin
g by
Map
Uni
t—O
nond
aga
Cou
nty,
New
Yor
k(L
and
Rel
ease
- SR
AA)
Nat
ural
Res
ourc
esC
onse
rvat
ion
Serv
ice
Web
Soi
l Sur
vey
Nat
iona
l Coo
pera
tive
Soil
Surv
ey5/
15/2
019
Page
2 o
f 5

Hydric Rating by Map Unit
Map unit symbol Map unit name Rating Acres in AOI Percent of AOI
CFL Cut and fill land 10 2.5 2.5%
ChA Collamer silt loam, 0 to 2 percent slopes
0 3.9 3.9%
CrB Croghan loamy fine sand, 0 to 6 percent slopes
0 7.6 7.6%
Lm Lamson very fine sandy loam
90 1.8 1.8%
ML Made land 10 0.5 0.5%
MtA Minoa fine sandy loam, 0 to 2 percent slopes
12 4.4 4.4%
NgA Niagara silt loam, 0 to 4 percent slopes
7 66.9 67.1%
Pb Palms muck 100 12.2 12.3%
Totals for Area of Interest 99.8 100.0%
Hydric Rating by Map Unit—Onondaga County, New York Land Release - SRAA
Natural ResourcesConservation Service
Web Soil SurveyNational Cooperative Soil Survey
5/15/2019Page 3 of 5

Description
This rating indicates the percentage of map units that meets the criteria for hydric soils. Map units are composed of one or more map unit components or soil types, each of which is rated as hydric soil or not hydric. Map units that are made up dominantly of hydric soils may have small areas of minor nonhydric components in the higher positions on the landform, and map units that are made up dominantly of nonhydric soils may have small areas of minor hydric components in the lower positions on the landform. Each map unit is rated based on its respective components and the percentage of each component within the map unit.
The thematic map is color coded based on the composition of hydric components. The five color classes are separated as 100 percent hydric components, 66 to 99 percent hydric components, 33 to 65 percent hydric components, 1 to 32 percent hydric components, and less than one percent hydric components.
In Web Soil Survey, the Summary by Map Unit table that is displayed below the map pane contains a column named 'Rating'. In this column the percentage of each map unit that is classified as hydric is displayed.
Hydric soils are defined by the National Technical Committee for Hydric Soils (NTCHS) as soils that formed under conditions of saturation, flooding, or ponding long enough during the growing season to develop anaerobic conditions in the upper part (Federal Register, 1994). Under natural conditions, these soils are either saturated or inundated long enough during the growing season to support the growth and reproduction of hydrophytic vegetation.
The NTCHS definition identifies general soil properties that are associated with wetness. In order to determine whether a specific soil is a hydric soil or nonhydric soil, however, more specific information, such as information about the depth and duration of the water table, is needed. Thus, criteria that identify those estimated soil properties unique to hydric soils have been established (Federal Register, 2002). These criteria are used to identify map unit components that normally are associated with wetlands. The criteria used are selected estimated soil properties that are described in "Soil Taxonomy" (Soil Survey Staff, 1999) and "Keys to Soil Taxonomy" (Soil Survey Staff, 2006) and in the "Soil Survey Manual" (Soil Survey Division Staff, 1993).
If soils are wet enough for a long enough period of time to be considered hydric, they should exhibit certain properties that can be easily observed in the field. These visible properties are indicators of hydric soils. The indicators used to make onsite determinations of hydric soils are specified in "Field Indicators of Hydric Soils in the United States" (Hurt and Vasilas, 2006).
References:
Federal Register. July 13, 1994. Changes in hydric soils of the United States.
Federal Register. September 18, 2002. Hydric soils of the United States.
Hydric Rating by Map Unit—Onondaga County, New York Land Release - SRAA
Natural ResourcesConservation Service
Web Soil SurveyNational Cooperative Soil Survey
5/15/2019Page 4 of 5

Hurt, G.W., and L.M. Vasilas, editors. Version 6.0, 2006. Field indicators of hydric soils in the United States.
Soil Survey Division Staff. 1993. Soil survey manual. Soil Conservation Service. U.S. Department of Agriculture Handbook 18.
Soil Survey Staff. 1999. Soil taxonomy: A basic system of soil classification for making and interpreting soil surveys. 2nd edition. Natural Resources Conservation Service. U.S. Department of Agriculture Handbook 436.
Soil Survey Staff. 2006. Keys to soil taxonomy. 10th edition. U.S. Department of Agriculture, Natural Resources Conservation Service.
Rating Options
Aggregation Method: Percent Present
Component Percent Cutoff: None Specified
Tie-break Rule: Lower
Hydric Rating by Map Unit—Onondaga County, New York Land Release - SRAA
Natural ResourcesConservation Service
Web Soil SurveyNational Cooperative Soil Survey
5/15/2019Page 5 of 5

APPENDIX C PHOTOGRAPHS


Project: Syracuse Regional Airport AuthorityLand Release for Future DevelopmentTown of Cicero, Onondaga County, New York
Photo 1 – Photo of Wetland A vegetation at A-W data point (PFO)
Photo 2 – Photo of Wetland B at B-W data point (PFO) 1
Photo Documentation

Project: Syracuse Regional Airport AuthorityLand Release for Future DevelopmentTown of Cicero, Onondaga County, New York
Photo 3 – Photo of Wetland B vegetation at B-W2 data point (PSS)
Photo 4 – Photo of Wetland C at C-W data point (PFO) 2
Photo Documentation

Project: Syracuse Regional Airport AuthorityLand Release for Future DevelopmentTown of Cicero, Onondaga County, New York
Photo 5 – Photo of Wetland D vegetation at D-W (PFO) data point
Photo 6 – Photo of Wetland E at E-W data point (PFO) 3
Photo Documentation

Project: Syracuse Regional Airport AuthorityLand Release for Future DevelopmentTown of Cicero, Onondaga County, New York
Photo 7 – Photo of Wetland F at F-W (PFO) data point
Photo 8 – Photo of Wetland G at G-W data point (PFO) 4
Photo Documentation

Project: Syracuse Regional Airport AuthorityLand Release for Future DevelopmentTown of Cicero, Onondaga County, New York
Photo 9 – Photo of Wetland H at H-W (PFO) data point
Photo 10 – Photo of Stream A 5
Photo Documentation

Project: Syracuse Regional Airport AuthorityLand Release for Future DevelopmentTown of Cicero, Onondaga County, New York
Photo 11 – Photo of Stream C
Photo 12 – Photo of Ditch A 6
Photo Documentation

Project: Syracuse Regional Airport AuthorityLand Release for Future DevelopmentTown of Cicero, Onondaga County, New York
Photo 13 – Photo of Ditch B
Photo 14 – Photo of Ditch B2 7
Photo Documentation

Project: Syracuse Regional Airport AuthorityLand Release for Future DevelopmentTown of Cicero, Onondaga County, New York
Photo 15 – Photo of Ditch C
Photo 16 – Photo of Ditch C2 8
Photo Documentation

Project: Syracuse Regional Airport AuthorityLand Release for Future DevelopmentTown of Cicero, Onondaga County, New York
Photo 17 – Photo of Ditch C3
Photo 18 – Photo of Ditch C4 9
Photo Documentation