APPENDIX – A123.2
131
APPENDIX – A123.2 Methodology of Preliminary Design for Distribution Network Mains
-
Upload
khangminh22 -
Category
Documents
-
view
0 -
download
0
Transcript of APPENDIX – A123.2

APPENDIX – A123.2
Methodology of Preliminary Design for
Distribution Network Mains
A123 - 11
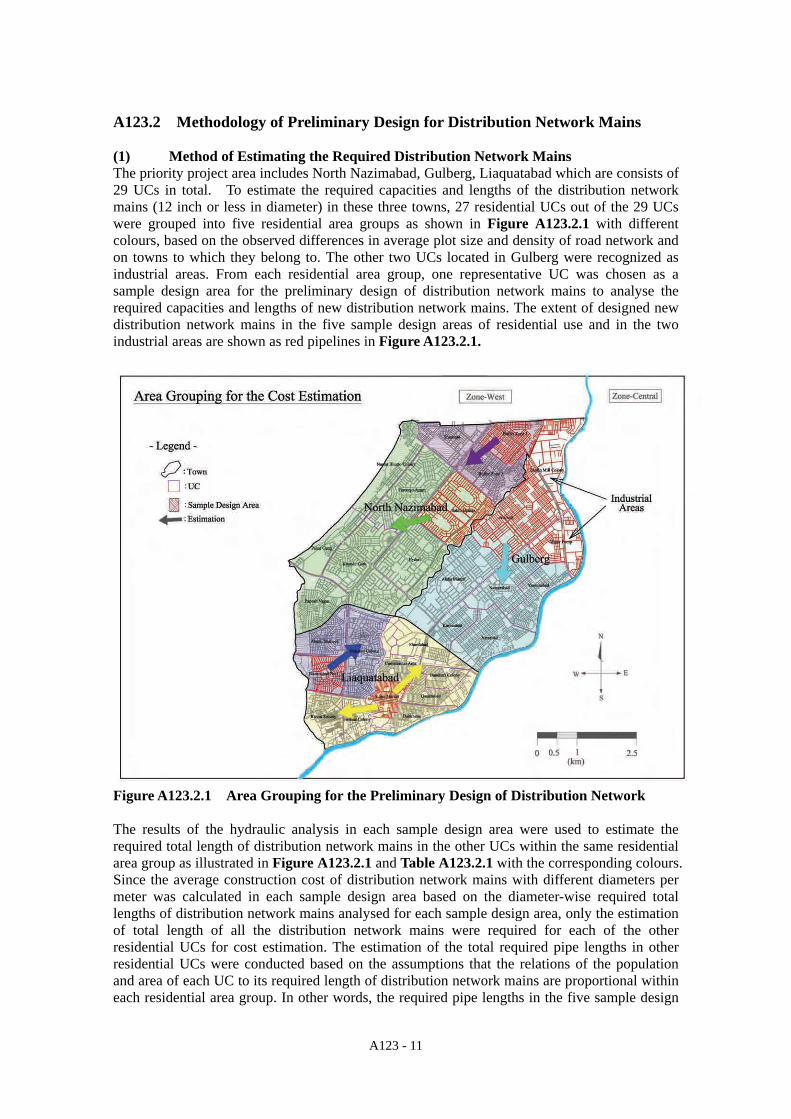
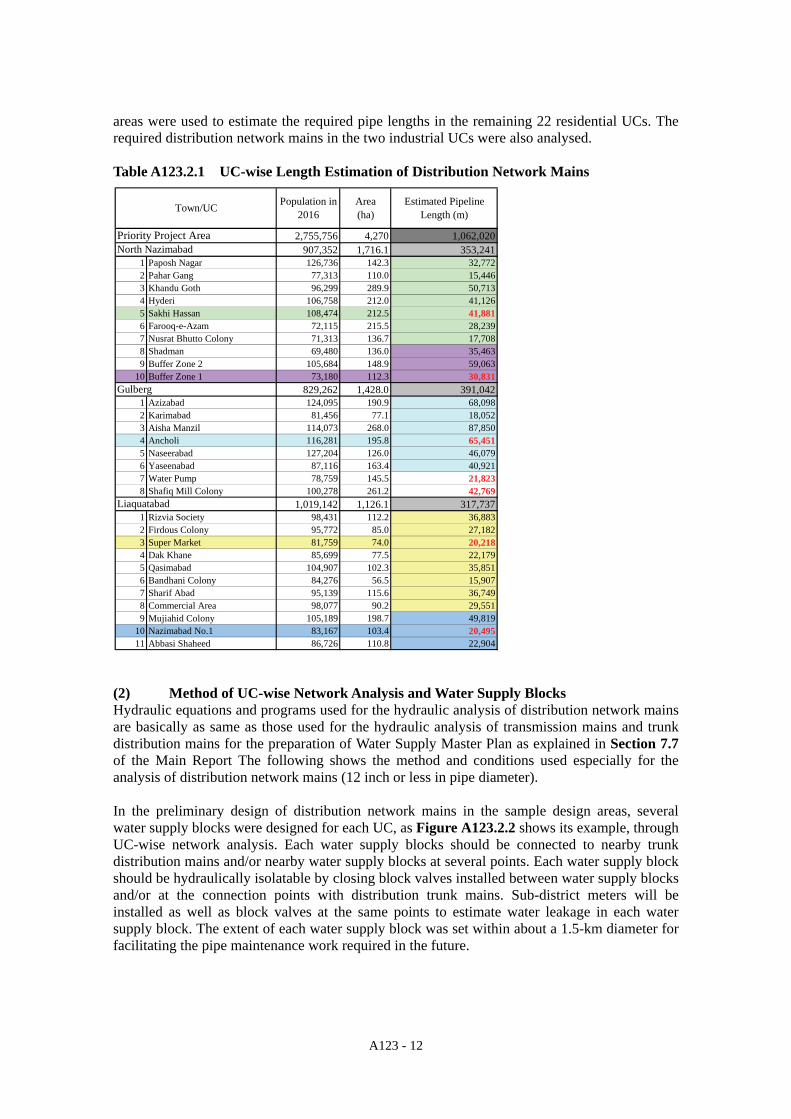
A123.2 Methodology of Preliminary Design for Distribution Network Mains (1) Method of Estimating the Required Distribution Network Mains The priority project area includes North Nazimabad, Gulberg, Liaquatabad which are consists of 29 UCs in total. To estimate the required capacities and lengths of the distribution network mains (12 inch or less in diameter) in these three towns, 27 residential UCs out of the 29 UCs were grouped into five residential area groups as shown in Figure A123.2.1 with different colours, based on the observed differences in average plot size and density of road network and on towns to which they belong to. The other two UCs located in Gulberg were recognized as industrial areas. From each residential area group, one representative UC was chosen as a sample design area for the preliminary design of distribution network mains to analyse the required capacities and lengths of new distribution network mains. The extent of designed new distribution network mains in the five sample design areas of residential use and in the two industrial areas are shown as red pipelines in Figure A123.2.1. Figure A123.2.1 Area Grouping for the Preliminary Design of Distribution Network The results of the hydraulic analysis in each sample design area were used to estimate the required total length of distribution network mains in the other UCs within the same residential area group as illustrated in Figure A123.2.1 and Table A123.2.1 with the corresponding colours. Since the average construction cost of distribution network mains with different diameters per meter was calculated in each sample design area based on the diameter-wise required total lengths of distribution network mains analysed for each sample design area, only the estimation of total length of all the distribution network mains were required for each of the other residential UCs for cost estimation. The estimation of the total required pipe lengths in other residential UCs were conducted based on the assumptions that the relations of the population and area of each UC to its required length of distribution network mains are proportional within each residential area group. In other words, the required pipe lengths in the five sample design
A123 - 12
2,755,756 4,270 1,062,020907,352 1,716.1 353,241
1 Paposh Nagar 126,736 142.3 32,7722 Pahar Gang 77,313 110.0 15,4463 Khandu Goth 96,299 289.9 50,7134 Hyderi 106,758 212.0 41,1265 Sakhi Hassan 108,474 212.5 41,8816 Farooq-e-Azam 72,115 215.5 28,2397 Nusrat Bhutto Colony 71,313 136.7 17,7088 Shadman 69,480 136.0 35,4639 Buffer Zone 2 105,684 148.9 59,063
10 Buffer Zone 1 73,180 112.3 30,831829,262 1,428.0 391,042
1 Azizabad 124,095 190.9 68,0982 Karimabad 81,456 77.1 18,0523 Aisha Manzil 114,073 268.0 87,8504 Ancholi 116,281 195.8 65,4515 Naseerabad 127,204 126.0 46,0796 Yaseenabad 87,116 163.4 40,9217 Water Pump 78,759 145.5 21,8238 Shafiq Mill Colony 100,278 261.2 42,769
1,019,142 1,126.1 317,7371 Rizvia Society 98,431 112.2 36,8832 Firdous Colony 95,772 85.0 27,1823 Super Market 81,759 74.0 20,2184 Dak Khane 85,699 77.5 22,1795 Qasimabad 104,907 102.3 35,8516 Bandhani Colony 84,276 56.5 15,9077 Sharif Abad 95,139 115.6 36,7498 Commercial Area 98,077 90.2 29,5519 Mujiahid Colony 105,189 198.7 49,819
10 Nazimabad No.1 83,167 103.4 20,49511 Abbasi Shaheed 86,726 110.8 22,904
Estimated PipelineLength (m)
Area(ha)
Population in2016
Liaquatabad
North Nazimabad
Gulberg
Town/UC
Priority Project Area
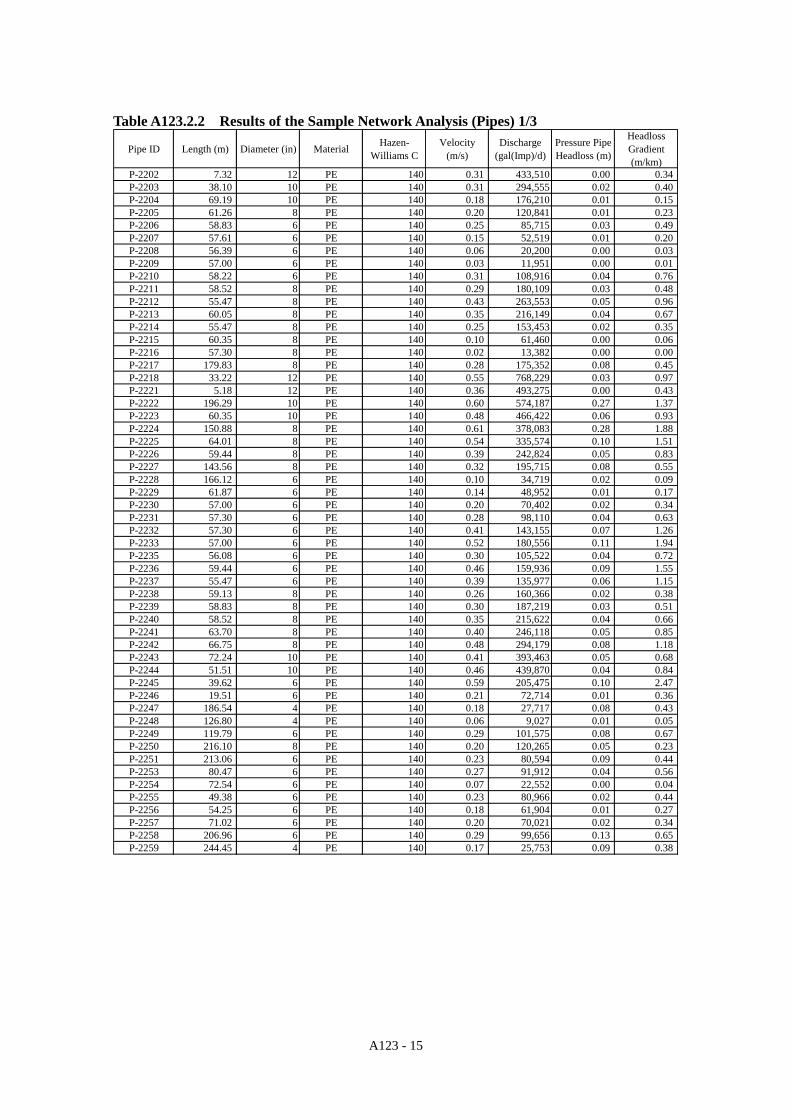
areas were used to estimate the required pipe lengths in the remaining 22 residential UCs. The required distribution network mains in the two industrial UCs were also analysed. Table A123.2.1 UC-wise Length Estimation of Distribution Network Mains (2) Method of UC-wise Network Analysis and Water Supply Blocks Hydraulic equations and programs used for the hydraulic analysis of distribution network mains are basically as same as those used for the hydraulic analysis of transmission mains and trunk distribution mains for the preparation of Water Supply Master Plan as explained in Section 7.7 of the Main Report The following shows the method and conditions used especially for the analysis of distribution network mains (12 inch or less in pipe diameter). In the preliminary design of distribution network mains in the sample design areas, several water supply blocks were designed for each UC, as Figure A123.2.2 shows its example, through UC-wise network analysis. Each water supply blocks should be connected to nearby trunk distribution mains and/or nearby water supply blocks at several points. Each water supply block should be hydraulically isolatable by closing block valves installed between water supply blocks and/or at the connection points with distribution trunk mains. Sub-district meters will be installed as well as block valves at the same points to estimate water leakage in each water supply block. The extent of each water supply block was set within about a 1.5-km diameter for facilitating the pipe maintenance work required in the future.

A123 - 13
Figure A123.2.2 Water Supply Blocks in Each UC All the households within the area should be geographically accessible to the network without significant difficulty. The pipe aliment was designed, based on the width of the road under which the pipe will be installed, by visually recognizing it on the satellite imagery as shown in Figure A123.2.3 as a sample hydraulic network model. As principle, pipes will be installed in the centre of road if the road is relatively narrow while they will be installed at the side if the road is wide. Tables A123.2.2 and A123.2.3 shows the results of the sample hydraulic analysis that correspond the network model for the water supply block shown in Figure A123.2.3. Prior to the hydraulic analysis of distribution network mains, the trunk distribution mains required for the priority project was planned and analysed hydraulically. The analysis results of trunk distribution mains showed that water can be delivered to most of the UCs within the priority project area at a remaining pressure of more than 15 m in water head (the pressure before entering the distribution network mains of 12 inch or less). Therefore, in the analysis of distribution network mains, the pressure of all the connection points with trunk distribution mains were set at a assumed value of 15m for the simplification of the network analysis. Through the hydraulic analysis of distribution network, all the required distribution mains were designed to have a residual pressure of more than 10m. As shown in Table A123.2.2, the C-value (Hazen-Williams Coefficient) of the PE pipe recommended as distribution network mains was set at 140. Since the difference in height within each UC in the priority project area is only few meter in most of the UCs, it was assumed for the simplification of model analysis that the height of each junction of distribution network mains within a UC is the same as shown in Table 123.2.3. In the modelling, the water demand in 2016 in each UC was allocated to each pipe junction equally as seen in Table 123.2.3 after being multiplied by an hourly peak factor of 1.5.

A123 - 14
Figu
re A
123.
2.3
Exa
mpl
e of
Dis
trib
utio
n N
etw
ork
Ana
lysi
s for
Eac
h W
ater
Sup
ply
Blo
ck
A123 - 15
Table A123.2.2 Results of the Sample Network Analysis (Pipes) 1/3
Pipe ID Length (m) Diameter (in) Material Hazen-Williams C
Velocity(m/s)
Discharge(gal(Imp)/d)
Pressure PipeHeadloss (m)
HeadlossGradient(m/km)
P-2202 7.32 12 PE 140 0.31 433,510 0.00 0.34P-2203 38.10 10 PE 140 0.31 294,555 0.02 0.40P-2204 69.19 10 PE 140 0.18 176,210 0.01 0.15P-2205 61.26 8 PE 140 0.20 120,841 0.01 0.23P-2206 58.83 6 PE 140 0.25 85,715 0.03 0.49P-2207 57.61 6 PE 140 0.15 52,519 0.01 0.20P-2208 56.39 6 PE 140 0.06 20,200 0.00 0.03P-2209 57.00 6 PE 140 0.03 11,951 0.00 0.01P-2210 58.22 6 PE 140 0.31 108,916 0.04 0.76P-2211 58.52 8 PE 140 0.29 180,109 0.03 0.48P-2212 55.47 8 PE 140 0.43 263,553 0.05 0.96P-2213 60.05 8 PE 140 0.35 216,149 0.04 0.67P-2214 55.47 8 PE 140 0.25 153,453 0.02 0.35P-2215 60.35 8 PE 140 0.10 61,460 0.00 0.06P-2216 57.30 8 PE 140 0.02 13,382 0.00 0.00P-2217 179.83 8 PE 140 0.28 175,352 0.08 0.45P-2218 33.22 12 PE 140 0.55 768,229 0.03 0.97P-2221 5.18 12 PE 140 0.36 493,275 0.00 0.43P-2222 196.29 10 PE 140 0.60 574,187 0.27 1.37P-2223 60.35 10 PE 140 0.48 466,422 0.06 0.93P-2224 150.88 8 PE 140 0.61 378,083 0.28 1.88P-2225 64.01 8 PE 140 0.54 335,574 0.10 1.51P-2226 59.44 8 PE 140 0.39 242,824 0.05 0.83P-2227 143.56 8 PE 140 0.32 195,715 0.08 0.55P-2228 166.12 6 PE 140 0.10 34,719 0.02 0.09P-2229 61.87 6 PE 140 0.14 48,952 0.01 0.17P-2230 57.00 6 PE 140 0.20 70,402 0.02 0.34P-2231 57.30 6 PE 140 0.28 98,110 0.04 0.63P-2232 57.30 6 PE 140 0.41 143,155 0.07 1.26P-2233 57.00 6 PE 140 0.52 180,556 0.11 1.94P-2235 56.08 6 PE 140 0.30 105,522 0.04 0.72P-2236 59.44 6 PE 140 0.46 159,936 0.09 1.55P-2237 55.47 6 PE 140 0.39 135,977 0.06 1.15P-2238 59.13 8 PE 140 0.26 160,366 0.02 0.38P-2239 58.83 8 PE 140 0.30 187,219 0.03 0.51P-2240 58.52 8 PE 140 0.35 215,622 0.04 0.66P-2241 63.70 8 PE 140 0.40 246,118 0.05 0.85P-2242 66.75 8 PE 140 0.48 294,179 0.08 1.18P-2243 72.24 10 PE 140 0.41 393,463 0.05 0.68P-2244 51.51 10 PE 140 0.46 439,870 0.04 0.84P-2245 39.62 6 PE 140 0.59 205,475 0.10 2.47P-2246 19.51 6 PE 140 0.21 72,714 0.01 0.36P-2247 186.54 4 PE 140 0.18 27,717 0.08 0.43P-2248 126.80 4 PE 140 0.06 9,027 0.01 0.05P-2249 119.79 6 PE 140 0.29 101,575 0.08 0.67P-2250 216.10 8 PE 140 0.20 120,265 0.05 0.23P-2251 213.06 6 PE 140 0.23 80,594 0.09 0.44P-2253 80.47 6 PE 140 0.27 91,912 0.04 0.56P-2254 72.54 6 PE 140 0.07 22,552 0.00 0.04P-2255 49.38 6 PE 140 0.23 80,966 0.02 0.44P-2256 54.25 6 PE 140 0.18 61,904 0.01 0.27P-2257 71.02 6 PE 140 0.20 70,021 0.02 0.34P-2258 206.96 6 PE 140 0.29 99,656 0.13 0.65P-2259 244.45 4 PE 140 0.17 25,753 0.09 0.38

A123 - 16
Table A123.2.2 Results of the Sample Network Analysis (Pipes) 2/3
Pipe ID Length (m) Diameter (in) Material Hazen-Williams C
Velocity(m/s)
Discharge(gal(Imp)/d)
Pressure PipeHeadloss (m)
HeadlossGradient(m/km)
P-2260 116.43 3 PE 140 0.22 18,690 0.10 0.85P-2261 96.93 6 PE 140 0.49 170,043 0.17 1.74P-2262 78.94 6 PE 140 0.41 142,050 0.10 1.24P-2264 92.05 4 PE 140 0.48 73,303 0.24 2.63P-2265 58.22 3 PE 140 0.23 20,002 0.06 0.96P-2266 59.13 3 PE 140 0.11 9,304 0.01 0.23P-2267 92.66 3 PE 140 0.34 29,388 0.18 1.97P-2268 58.83 4 PE 140 0.48 74,615 0.16 2.72P-2269 60.35 4 PE 140 0.30 46,636 0.07 1.14P-2271 62.48 6 PE 140 0.40 137,817 0.07 1.18P-2272 60.35 6 PE 140 0.56 193,745 0.13 2.21P-2274 96.32 4 PE 140 0.18 27,836 0.04 0.44P-2275 60.35 4 PE 140 0.20 31,149 0.03 0.54P-2276 68.88 4 PE 140 0.45 69,649 0.17 2.40P-2277 153.62 4 PE 140 0.26 40,295 0.13 0.87P-2278 60.66 4 PE 140 0.16 24,939 0.02 0.36P-2279 79.55 4 PE 140 0.15 23,819 0.03 0.33P-2280 152.40 3 PE 140 0.23 19,810 0.14 0.95P-2283 61.87 4 PE 140 0.21 32,108 0.04 0.57P-2284 61.26 6 PE 140 0.03 10,377 0.00 0.01P-2285 61.26 6 PE 140 0.03 9,572 0.00 0.01P-2286 66.45 6 PE 140 0.28 97,629 0.04 0.62P-2287 104.85 6 PE 140 0.34 116,319 0.09 0.86P-2288 67.67 6 PE 140 0.39 135,009 0.08 1.13P-2289 86.26 4 PE 140 0.06 9,289 0.00 0.06P-2290 57.91 4 PE 140 0.06 9,401 0.00 0.06P-2291 62.18 6 PE 140 0.10 34,572 0.01 0.09P-2292 29.26 6 PE 140 0.05 15,882 0.00 0.02P-2293 70.41 6 PE 140 0.20 70,385 0.02 0.34P-2294 103.94 6 PE 140 0.26 89,075 0.05 0.52P-2295 118.26 6 PE 140 0.21 74,060 0.04 0.37P-2296 65.53 6 PE 140 0.16 55,370 0.01 0.22P-2297 93.57 4 PE 140 0.30 46,544 0.11 1.14P-2298 38.71 6 PE 140 0.20 69,367 0.01 0.33P-2299 58.83 6 PE 140 0.15 50,677 0.01 0.18P-2300 61.57 4 PE 140 0.18 27,049 0.03 0.42P-2301 83.21 4 PE 140 0.05 8,359 0.00 0.05P-2302 83.52 3 PE 140 0.17 14,949 0.05 0.56P-2303 55.78 3 PE 140 0.01 981 0.00 0.00P-2304 58.22 3 PE 140 0.12 10,653 0.02 0.30P-2305 97.54 3 PE 140 0.03 2,760 0.00 0.02P-2306 97.54 3 PE 140 0.10 9,018 0.02 0.22P-2307 100.89 4 PE 140 0.17 26,355 0.04 0.40P-2308 54.86 4 PE 140 0.02 2,988 0.00 0.01P-2309 57.30 4 PE 140 0.09 13,319 0.01 0.11P-2310 181.97 3 PE 140 0.22 18,712 0.16 0.85P-2311 29.87 3 PE 140 0.00 22 0.00 0.00P-2312 58.52 3 PE 140 0.22 18,668 0.05 0.85P-2317 195.68 3 PE 140 0.16 14,118 0.10 0.51P-2320 57.91 4 PE 140 0.07 11,325 0.00 0.08P-2321 59.74 4 PE 140 0.14 21,851 0.02 0.28P-2322 57.91 4 PE 140 0.15 22,383 0.02 0.29

A123 - 17
Table A123.2.2 Results of the Sample Network Analysis (Pipes) 3/3
Pipe ID Length (m) Diameter (in) Material Hazen-Williams C
Velocity(m/s)
Discharge(gal(Imp)/d)
Pressure PipeHeadloss (m)
HeadlossGradient(m/km)
P-2323 61.57 4 PE 140 0.19 29,267 0.03 0.48P-2324 67.67 4 PE 140 0.12 18,586 0.01 0.21P-2325 66.14 6 PE 140 0.33 113,236 0.05 0.82P-2326 121.31 6 PE 140 0.22 75,959 0.05 0.39P-2327 56.08 6 PE 140 0.14 48,824 0.01 0.17P-2328 90.83 6 PE 140 0.18 63,006 0.03 0.28P-2329 70.71 4 PE 140 0.21 32,871 0.04 0.60P-2330 202.39 3 PE 140 0.07 5,698 0.02 0.09P-2331 201.47 3 PE 140 0.09 8,164 0.04 0.18P-2332 198.73 3 PE 140 0.11 9,713 0.05 0.25P-2333 198.73 3 PE 140 0.14 11,806 0.07 0.36P-2334 199.64 4 PE 140 0.19 29,371 0.10 0.48P-2335 68.28 6 PE 140 0.11 39,723 0.01 0.12P-2336 119.48 6 PE 140 0.09 32,514 0.01 0.08P-2337 57.91 6 PE 140 0.04 13,824 0.00 0.02P-2338 73.76 4 PE 140 0.29 44,499 0.08 1.04P-2339 53.64 4 PE 140 0.07 11,481 0.00 0.08P-2340 202.69 4 PE 140 0.24 36,678 0.15 0.73P-2341 60.96 4 PE 140 0.04 6,508 0.00 0.03P-2342 59.13 4 PE 140 0.03 4,254 0.00 0.01P-2343 58.52 4 PE 140 0.00 70 0.00 0.00P-2344 55.17 4 PE 140 0.03 4,991 0.00 0.02P-2345 77.42 6 PE 140 0.14 49,365 0.01 0.18P-2346 78.03 6 PE 140 0.17 59,585 0.02 0.25P-2347 181.97 6 PE 140 0.23 78,275 0.08 0.41P-2348 202.39 3 PE 140 0.16 13,461 0.09 0.46P-2349 203.91 3 PE 140 0.16 13,629 0.10 0.47P-2350 203.00 3 PE 140 0.17 14,506 0.11 0.53P-2351 202.69 3 PE 140 0.19 16,436 0.14 0.67P-2352 77.42 4 PE 140 0.34 52,503 0.11 1.42P-2353 106.68 4 PE 140 0.22 33,813 0.07 0.63P-2358 103.02 3 PE 140 0.12 10,025 0.03 0.27P-2359 78.64 3 PE 140 0.33 28,715 0.15 1.89P-2360 184.40 6 PE 140 0.12 42,649 0.02 0.13P-2363 181.66 4 PE 140 0.23 35,724 0.13 0.70P-2364 185.93 3 PE 140 0.07 6,228 0.02 0.11P-2368 106.98 3 PE 140 0.29 25,316 0.16 1.49P-2369 77.11 3 PE 140 0.51 44,006 0.32 4.16P-2370 119.79 3 PE 140 0.14 12,233 0.05 0.39P-2371 77.72 3 PE 140 0.36 30,923 0.17 2.16P-2372 31.39 10 PE 140 0.36 346,463 0.02 0.54P-2375 15.85 6 PE 140 0.39 134,719 0.02 1.13P-2402 14.94 6 PE 140 0.44 151,450 0.02 1.40P-2405 60.96 4 PE 140 0.15 23,147 0.02 0.31P-2406 67.36 4 PE 140 0.03 4,457 0.00 0.01P-2407 91.74 4 PE 140 0.18 28,419 0.04 0.46P-2408 42.67 4 PE 140 0.06 9,729 0.00 0.06P-2508 65.53 3 PE 140 0.14 12,462 0.03 0.40P-2509 73.15 4 PE 140 0.11 17,034 0.01 0.18P-2510 75.59 6 PE 140 0.18 61,339 0.02 0.26P-2511 69.19 4 PE 140 0.10 15,123 0.01 0.14P-2512 71.93 3 PE 140 0.10 8,665 0.01 0.20P-2513 85.95 3 PE 140 0.08 6,626 0.01 0.12

A123 - 18
Table A123.2.3 Results of the Sample Network Analysis (Junctions)
Junctioin ID RelativeElevation (m)
Flow (Demand *1.5) (gal(Imp)/d)
Pressure (m H2O)
J-1516 0 18,690 14.37J-1517 0 18,690 14.44J-1518 0 18,690 14.40J-1519 0 18,690 14.43J-1520 0 18,690 14.27J-1521 0 18,690 14.29J-1522 0 18,690 14.13J-1523 0 18,690 14.16J-1524 0 18,690 14.16J-1525 0 18,690 14.16J-1526 0 18,690 14.20J-1527 0 18,690 14.29J-1528 0 18,690 14.44J-1529 0 18,690 14.37J-1530 0 18,690 14.60J-1531 0 18,690 14.17J-1532 0 18,690 14.15J-1533 0 18,690 14.14J-1534 0 18,690 14.14J-1535 0 18,690 14.13J-1536 0 18,690 14.11J-1537 0 18,690 14.11J-1538 0 18,690 14.13J-1539 0 18,690 14.09J-1540 0 18,690 14.09J-1542 0 18,690 14.36J-1545 0 18,690 14.64J-1546 0 18,690 14.64J-1547 0 18,690 14.66J-1548 0 18,690 14.67J-1549 0 18,690 14.70J-1550 0 18,690 14.72J-1551 0 18,690 14.67J-1552 0 18,690 14.66J-1553 0 18,690 14.79J-1554 0 18,690 14.78J-1555 0 18,690 14.78J-1556 0 18,690 14.79J-1557 0 18,690 14.79J-1558 0 18,690 14.79J-1559 0 18,690 14.79J-1560 0 18,690 14.79J-1561 0 18,690 14.81J-1562 0 18,690 14.82J-1563 0 18,690 14.75J-1565 0 18,690 14.74J-1567 0 18,690 14.73J-1568 0 18,690 14.76J-1569 0 18,690 14.62J-1570 0 18,690 14.37J-1571 0 18,690 14.33J-1573 0 18,690 14.39J-1574 0 18,690 14.55J-1575 0 18,690 14.79J-1599 0 18,690 14.11J-1600 0 18,690 14.13
Junctioin ID RelativeElevation (m)
Flow (Demand *1.5) (gal(Imp)/d)
Pressure(m H2O)
J-1460 0 18,690 14.97J-1461 0 18,690 14.95J-1462 0 18,690 14.94J-1463 0 18,690 14.93J-1464 0 18,690 14.90J-1465 0 18,690 14.89J-1466 0 18,690 14.89J-1467 0 18,690 14.89J-1468 0 18,690 14.93J-1469 0 18,690 14.96J-1470 0 18,690 14.91J-1471 0 18,690 14.87J-1472 0 18,690 14.85J-1473 0 18,690 14.84J-1474 0 18,690 14.84J-1475 0 18,690 14.92J-1477 0 18,690 14.65J-1478 0 18,690 14.60J-1479 0 18,690 14.32J-1480 0 18,690 14.22J-1481 0 18,690 14.17J-1482 0 18,690 14.09J-1483 0 18,690 14.11J-1484 0 18,690 14.12J-1485 0 18,690 14.14J-1486 0 18,690 14.17J-1487 0 18,690 14.24J-1488 0 18,690 14.35J-1489 0 18,690 14.46J-1490 0 18,690 14.50J-1491 0 18,690 14.59J-1492 0 18,690 14.65J-1493 0 18,690 14.68J-1494 0 18,690 14.71J-1495 0 18,690 14.75J-1496 0 18,690 14.80J-1497 0 18,690 14.88J-1498 0 18,690 14.93J-1499 0 18,690 14.45J-1500 0 18,690 14.85J-1501 0 18,690 14.84J-1502 0 18,690 14.92J-1503 0 18,690 14.79J-1504 0 18,690 14.79J-1505 0 18,690 14.80J-1506 0 18,690 14.82J-1507 0 18,690 14.77J-1508 0 18,690 14.70J-1509 0 18,690 14.60J-1510 0 18,690 14.67J-1511 0 18,690 14.58J-1512 0 18,690 14.60J-1513 0 18,690 14.66J-1514 0 18,690 14.44J-1515 0 18,690 14.38

APPENDIX – A124.1
Details of Preliminary Design of Pipes

A124 - 1
A124.1 Details of Preliminary Design of Pipes A. Condition of Preliminary Design Criteria adopted for design of branch and trunk sewers at the feasibility study stage are shown in Table A124.1.1. Minimum covering for branch sewer, sub-main sewer and trunk sewer, and minimum clearance between bed of nallah and pipe of culvert structure are included in the table. Table A124.1.1 Design Criteria for Branch Sewer, Sub-main Sewer and Trunk Sewer
Item Criteria
(1) Design flow Peak flow (Maximum hourly sewage flow) Peak factor: 1.5
(2) Flow formula Gravity flow
Manning’s formula Q = A×V V = (1/n)×R(2/3)×I(1/2) Where Q: Flow rate (m3/s) A: Flow section (m2) V: Flow velocity (m/s) n: Roughness coefficient (Manning’s n) Manning’s n=0.015, for concrete pipe and box culvert R: Hydraulic radius (m) I: Gradient
(3) Depth of flow Full depth for pipe 90% depth for box culvert
(4) Minimum Velocity 0.8 m/s (5) Maximum Velocity 3.0 m/s (6) Diameter of Sewer Branch Sewer: 10” (254 mm)
Sub-main Sewer: 12” to 36” (305 mm to 914 mm) Trunk Sewer: 42” (1000mm) or larger
(7) Pipe materials Ready-made concrete pipe for gravity sewer Cast iron pipe for pressure main
(8) Diameter of ready-made concrete pipe For branch sewer 10” (254 mm) For sub-main sewer 12”, 15”, 18”, 24”, 27”, 33”, 36” (305, 381, 457, 610, 686, 838 and 914 mm, respectively) For trunk sewer 42”, 48”’, 54”, 66”, 72’ and 84” (1070, 1220, 1370, 1680, 1830 and 2130 mm, respectively) Concrete pipes of these diameters are produced at a factory in Karachi. Box culvert will be adopted when large diameter of more than 84’ is required
(9) Minimum Covering Branch Sewer: 1.0m for local streets, 1.5m for main streets Sub-main Sewer: 2.0m Trunk Sewer: 4.0m
(10) Minimum clearance between bed of nallah and pipe, or culvert structure
1.0 m
A124 - 2
B. Sewer District Allocation and Trunk Sewer Allignment The preliminary design at the feasibility study stage was done using the results of leveling survey and detailed street map developed in GIS study. In Master Plan Target Year, 2025 Three sewer districts of TP-1, TP-2 and TP-3 exist in the priority project area. TP-2 District is a small strip along Lyari River in Gulberg Town. Sewage generated in the strip will flow into sewage treatment plant TP-3 at feasibility study stage and will be diverted to TP-2 crossing Lyari River after 2021. Other small strips along Lyari River in Liaquatabad Town and along Gujjar Nallah belong to TP-3 District. Sewage generated in this area flows into TP-3 through Gujjar Nallah and existing Lyari interceptor. As a result, the remaining area belong to TP-1 District and the sewage reaches TP-1 through new trunk sewers. Figure A142.1.1 shows alignment of trunk sewers and sub-main sewers in 2025. In Priority Project Target Year, 2016 Treatment capacity of rehabilitated TP-1 is limited to 24.2 mgd or 110,000 m3/d in 2016. This capacity is not enough for sewage generation of whole TP-1 District; therefore, sewage in some part of TP-1 District will be diverted to rehabilitated TP-3 which has enough treatment capacity, 53.9 mgd or 245,000 m3/d in 2016. Figure A142.1.2 shows alignment of trunk sewers and sub-main sewers in 2016. Catchment area of node 15, 16, 17, 25 (part) and 26 (part) will be temporally shifted to TP-3 District. At the same time, existing trunk sewer connecting to TP-1 has enough flow capacity; therefore, the downstream end of proposed trunk sewers is to be connected to the existing trunk sewer in Liaquatabad Town. Sewer district allocation in 2016 and 2025 are shown in Figure A142.1.3.

A124 - 3
Figu
re A
124.
1.1
Gen
eral
Pla
n of
Pri
ority
Pro
ject
Are
a (2
025)

A124 - 4
Figu
re A
124.
1.2
Gen
eral
Pla
n of
Pri
ority
Pro
ect A
rea
(201
6)

A124 - 5
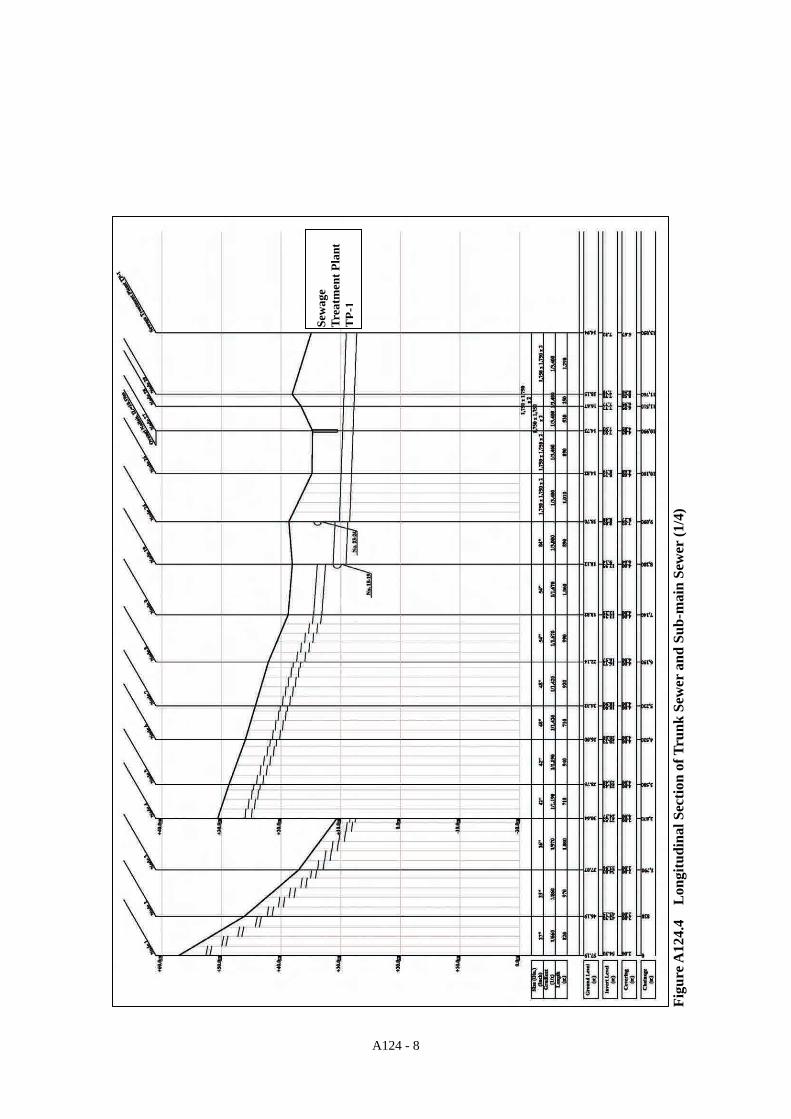
Figure A124.1.3 Sewer Districts Allocation in 2016 and 2025 C. Flow Calculation Flow calculation sheets for trunk sewers and some sub-main sewers for 2025 and 2016 are shown in Table A124.1.1 and Table A1241.1.2 respectively. Design flow is calculated based on population of each contribution area and per-capita sewage generation. Manning formula is adopted to calculate flow velocity in conduit and culvert. D. Longitudinal Section of Trunk Sewer and Sub-main Sewer Longitudinal Section of Trunk Sewer and Sub-main Sewer are shown in Figure A124.1.4 to Figure A124.1.7.

A124 - 6
Ta
ble A
124.
1.2
Flo
w C
alcu
latio
n Sh
eet (
2025
)
From
ToIn
crem
ent
Cum
ulat
ive
Incr
emen
tC
umul
ativ
eIn
crem
ent
Cum
ulat
ive
Up
Stre
amD
own
Stre
amU
pSt
ream
Dow
nSt
ream
Up
Stre
amD
own
Stre
am
0.15
3Fr
om G
adap
Tow
n1
28.
48.
46,
293
6,29
30.
006
0.15
90.
239
2768
682
066
057
.19
46.1
954
.30
43.3
02.
002.
000.
800.
296
23
55.5
63.9
41,5
7947
,873
0.04
10.
200
0.30
133
838
970
860
46.1
937
.07
43.1
534
.03
2.00
2.00
0.80
0.44
33
414
0.6
204.
510
5,33
515
3,20
70.
104
0.30
50.
457
3691
41,
080
970
37.0
730
.64
33.9
627
.53
2.00
2.00
0.80
0.52
54
512
4.3
328.
893
,123
246,
330
0.09
20.
397
0.59
542
1,06
771
01,
190
30.6
428
.75
25.3
723
.48
4.00
4.00
0.80
0.71
75
698
.942
7.7
74,0
9432
0,42
40.
073
0.47
00.
705
421,
067
940
1,19
028
.75
26.0
023
.48
20.7
34.
004.
000.
800.
717
67
83.4
511.
162
,482
382,
905
0.06
20.
532
0.79
848
1,21
971
01,
420
26.0
024
.32
20.5
818
.90
4.00
4.00
0.80
0.93
67
886
.759
7.8
64,9
5444
7,85
90.
064
0.59
60.
894
481,
219
920
1,42
024
.32
22.1
418
.90
16.7
24.
004.
000.
800.
936
89
121.
971
9.7
91,3
2553
9,18
40.
090
0.68
61.
030
541,
372
990
1,67
022
.14
18.8
216
.57
13.2
54.
004.
000.
801.
183
919
132.
885
2.5
99,4
9163
8,67
50.
098
0.78
51.
177
541,
372
1,06
01,
670
18.8
218
.12
13.2
512
.55
4.00
4.00
0.80
1.18
3
1011
112.
311
2.3
84,1
3384
,133
0.08
30.
083
0.12
518
457
1,35
038
033
.00
31.0
230
.34
26.7
92.
003.
570.
810.
132
1112
81.9
194.
261
,358
145,
491
0.06
10.
144
0.21
624
610
1,16
056
031
.02
28.8
926
.64
24.5
73.
573.
510.
810.
235
1213
104.
429
8.6
78,2
1422
3,70
50.
077
0.22
10.
332
3076
21,
600
760
28.8
925
.30
24.4
122
.31
3.51
2.03
0.80
0.36
613
1491
.539
0.1
68,5
5029
2,25
50.
068
0.28
90.
434
3383
81,
480
860
25.3
021
.66
22.2
618
.62
2.00
2.00
0.80
0.44
314
1877
.946
8.0
58,3
6135
0,61
60.
058
0.34
70.
520
3691
41,
130
970
21.6
617
.48
18.5
514
.37
2.00
2.00
0.80
0.52
5
1516
219.
021
9.0
164,
070
164,
070
0.16
20.
162
0.24
327
686
1,48
066
027
.00
24.3
024
.11
21.4
12.
002.
000.
800.
296
1617
161.
438
0.4
120,
917
284,
988
0.12
00.
282
0.42
333
838
1,61
086
024
.30
18.3
021
.26
15.2
62.
002.
000.
800.
443
1718
138.
251
8.6
103,
537
388,
524
0.10
20.
384
0.57
742
1,06
71,
470
1,19
018
.30
17.4
813
.03
11.8
04.
004.
420.
800.
717
1819
61.7
1,04
8.3
46,2
2478
5,36
40.
046
0.77
71.
166
541,
372
980
1,67
017
.48
18.1
210
.49
9.90
5.42
6.64
0.80
1.18
319
2417
.91,
918.
713
,410
1,43
7,45
00.
013
1.57
52.
363
842,
134
890
3,00
018
.12
18.7
09.
148.
846.
647.
520.
802.
865
2021
76.6
76.6
57,3
8757
,387
0.05
70.
057
0.08
515
381
940
300
33.4
328
.69
30.8
526
.11
2.00
2.00
0.80
0.09
221
2223
6.7
313.
317
7,33
123
4,71
80.
175
0.23
20.
348
3076
21,
630
760
28.6
923
.84
25.7
320
.88
2.00
2.00
0.80
0.36
622
2320
8.5
521.
815
6,20
439
0,92
20.
155
0.38
70.
580
421,
067
810
1,19
023
.84
25.6
718
.57
17.8
94.
006.
510.
800.
717
2324
127.
964
9.7
95,8
2048
6,74
20.
095
0.48
20.
722
481,
219
1,61
01,
420
25.6
718
.70
17.7
413
.28
6.51
4.00
0.80
0.93
624
2624
6.3
2,81
4.7
184,
523
2,10
8,71
40.
183
2.23
93.
359
1,75
01,
750
21,
010
3,40
018
.70
14.8
28.
488.
198.
274.
680.
804.
272
2526
118.
011
8.0
88,4
0388
,403
0.08
70.
087
0.13
118
457
480
380
14.4
114
.82
10.7
59.
493.
004.
670.
810.
132
2627
153.
83,
086.
511
5,22
42,
312,
341
0.11
42.
441
3.66
11,
750
1,75
02
890
3,40
014
.82
14.7
38.
197.
934.
684.
850.
804.
272
2728
3,08
6.5
2,31
2,34
10.
182
2.62
33.
934
1,75
01,
750
252
03,
400
14.7
316
.67
7.93
7.77
4.85
6.95
0.80
4.27
2SI
TE T
own
2829
3,08
6.5
2,31
2,34
12.
623
3.93
41,
750
1,75
02
250
3,40
016
.67
18.1
57.
777.
706.
958.
500.
804.
272
SITE
Tow
n29
TP-1
3,08
6.5
2,31
2,34
12.
623
3.93
41,
750
1,75
02
1,29
03,
400
18.1
514
.94
7.70
7.32
8.50
5.67
0.80
4.27
2SI
TE T
own
3031
125.
812
5.8
94,2
4794
,247
0.09
30.
093
0.14
024
610
1,56
056
029
.77
26.6
526
.96
23.8
42.
002.
000.
810.
235
3132
62.6
188.
446
,899
141,
145
0.04
60.
140
0.20
924
610
1,69
056
026
.65
21.9
023
.84
19.0
92.
002.
000.
810.
235
32G
ujja
rN
alla
h31
.622
0.0
23,6
7416
4,81
90.
023
0.16
30.
245
2768
681
066
021
.90
21.9
019
.01
17.7
92.
003.
230.
800.
296
3334
126.
912
6.9
95,0
7195
,071
0.09
40.
094
0.14
124
610
860
560
17.4
813
.89
14.6
711
.08
2.00
2.00
0.81
0.23
5
34Ly
ari
Iterc
epto
r12
9.4
256.
396
,944
192,
015
0.09
60.
190
0.28
527
686
870
660
13.8
99.
8911
.00
7.00
2.00
2.00
0.80
0.29
6
180.
013
4,85
20.
133
41.6
221.
631
,166
166,
018
0.03
10.
164
210.
315
7,55
20.
156
145.
435
5.7
108,
931
266,
483
0.10
80.
264
Leng
th(m
)R
emar
ksH
ight
(mm
)N
umbe
r of
Stre
amV
eloc
ity(m
/s)
Gra
dien
t(1
/x)
Gro
und
leve
l (m
)In
vert
leve
l (m
)Fl
owC
apac
ity(m
3 /s)
Cov
erin
g (m
)D
iam
eter
(inch
)
Dia
met
eror
Wid
th(m
m)
Cat
chm
ent
Are
a (h
a)Po
pula
tion
(In c
over
d ar
ea)
(2) L
eft B
ank
Side
To
TP-
1
Nod
eA
vera
ge F
low
(m3 /s
)(F
low
to S
TP)
Peak
Flow
(m3 /s
)
To
Lya
ri In
terc
epto
r(1
) Gul
berg
Tow
n(2
) Lia
quat
abad
Tow
n
To
TP-
3
To
Guj
jar
Nal
lah
(1) R
ight
Ban
k Si
de

A124 - 7
Ta
ble A
124.
1.3
Flo
w C
alcu
latio
n Sh
eet (
2016
)
From
ToIn
crem
ent
Cum
ulat
ive
Incr
emen
tC
umul
ativ
eIn
crem
ent
Cum
ulat
ive
Up
Stre
amD
own
Stre
amU
pSt
ream
Dow
nSt
ream
Up
Stre
amD
own
Stre
am
0.00
0Fr
om G
adap
Tow
n1
28.
48.
45,
591
5,59
10.
005
0.00
50.
007
2768
682
066
057
.19
46.1
954
.30
43.3
02.
002.
000.
800.
296
23
55.5
63.9
36,9
4342
,534
0.03
00.
035
0.05
233
838
970
860
46.1
937
.07
43.1
534
.03
2.00
2.00
0.80
0.44
33
414
0.6
204.
593
,589
136,
124
0.07
60.
111
0.16
636
914
1,08
097
037
.07
30.6
433
.96
27.5
32.
002.
000.
800.
525
45
124.
332
8.8
82,7
3921
8,86
30.
067
0.17
80.
267
421,
067
710
1,19
030
.64
28.7
525
.37
23.4
84.
004.
000.
800.
717
56
98.9
427.
765
,832
284,
695
0.05
40.
232
0.34
742
1,06
794
01,
190
28.7
526
.00
23.4
820
.73
4.00
4.00
0.80
0.71
76
783
.451
1.1
55,5
1434
0,20
90.
045
0.27
70.
415
481,
219
710
1,42
026
.00
24.3
220
.58
18.9
04.
004.
000.
800.
936
78
86.7
597.
857
,711
397,
920
0.04
70.
324
0.48
648
1,21
992
01,
420
24.3
222
.14
18.9
016
.72
4.00
4.00
0.80
0.93
68
912
1.9
719.
781
,142
479,
062
0.06
60.
390
0.58
554
1,37
299
01,
670
22.1
418
.82
16.5
713
.25
4.00
4.00
0.80
1.18
39
1913
2.8
852.
588
,397
567,
459
0.07
20.
462
0.69
254
1,37
21,
060
1,67
018
.82
18.1
213
.25
12.5
54.
004.
000.
801.
183
1011
112.
311
2.3
74,7
5174
,751
0.06
10.
061
0.09
118
457
1,35
038
033
.00
31.0
230
.34
26.7
92.
003.
570.
810.
132
1112
81.9
194.
254
,516
129,
267
0.04
40.
105
0.15
824
610
1,16
056
031
.02
28.8
926
.64
24.5
73.
573.
510.
810.
235
1213
104.
429
8.6
69,4
9319
8,76
00.
057
0.16
20.
243
3076
21,
600
760
28.8
925
.30
24.4
122
.31
3.51
2.03
0.80
0.36
613
1491
.539
0.1
60,9
0625
9,66
70.
050
0.21
10.
317
3383
81,
480
860
25.3
021
.66
22.2
618
.62
2.00
2.00
0.80
0.44
314
1877
.946
8.0
51,8
5331
1,52
00.
042
0.25
30.
380
3691
41,
130
970
21.6
617
.48
18.5
514
.37
2.00
2.00
0.80
0.52
5
1516
0.0
0.0
00
0.00
00.
000
0.00
027
686
1,48
066
027
.00
24.3
024
.11
21.4
12.
002.
000.
800.
296
1617
0.0
0.0
00
0.00
00.
000
0.00
033
838
1,61
086
024
.30
18.3
021
.26
15.2
62.
002.
000.
800.
443
1718
0.0
0.0
00
0.00
00.
000
0.00
042
1,06
71,
470
1,19
018
.30
17.4
813
.03
11.8
04.
004.
420.
800.
717
1819
61.7
529.
741
,070
352,
590
0.03
30.
287
0.43
054
1,37
298
01,
670
17.4
818
.12
10.4
99.
905.
426.
640.
801.
183
1924
17.9
1,40
0.1
11,9
1593
1,96
40.
010
0.75
81.
137
842,
134
890
3,00
018
.12
18.7
09.
148.
846.
647.
520.
802.
865
2021
76.6
76.6
50,9
8850
,988
0.04
10.
041
0.06
215
381
940
300
33.4
328
.69
30.8
526
.11
2.00
2.00
0.80
0.09
221
2223
6.7
313.
315
7,55
720
8,54
50.
128
0.17
00.
254
3076
21,
630
760
28.6
923
.84
25.7
320
.88
2.00
2.00
0.80
0.36
622
2320
8.5
521.
813
8,78
634
7,33
20.
113
0.28
30.
424
421,
067
810
1,19
023
.84
25.6
718
.57
17.8
94.
006.
510.
800.
717
2324
127.
964
9.7
85,1
3543
2,46
70.
069
0.35
20.
528
481,
219
1,61
01,
420
25.6
718
.70
17.7
413
.28
6.51
4.00
0.80
0.93
624
2624
6.3
2,29
6.1
163,
947
1,52
8,37
80.
133
1.24
31.
865
1,75
01,
750
21,
010
3,40
018
.70
14.8
20.
300.
0016
.45
12.8
70.
804.
272
2526
76.6
76.6
50,9
8850
,988
0.04
10.
041
0.06
218
457
480
380
14.4
114
.82
10.7
59.
493.
004.
670.
810.
132
2627
60.9
2,43
3.6
40,5
381,
619,
904
0.03
31.
318
1.97
756
, 66
Exis
ting
2728
2,43
3.6
1,61
9,90
40.
102
1.42
02.
130
56, 6
6 Ex
istin
g28
292,
433.
61,
619,
904
1.42
02.
130
56, 6
6 Ex
istin
g29
TP-1
2,43
3.6
1,61
9,90
41.
420
2.13
056
, 66
Exis
ting
3031
125.
812
5.8
83,7
3883
,738
0.06
80.
068
0.10
224
610
1,56
056
029
.77
26.6
526
.96
23.8
42.
002.
000.
810.
235
3132
62.6
188.
441
,669
125,
407
0.03
40.
102
0.15
324
610
1,69
056
026
.65
21.9
023
.84
19.0
92.
002.
000.
810.
235
32G
ujja
rN
alla
h31
.622
0.0
21,0
3414
6,44
10.
017
0.11
90.
179
2768
681
066
021
.90
21.9
019
.01
17.7
92.
003.
230.
800.
296
3334
126.
912
6.9
84,4
7084
,470
0.06
90.
069
0.10
324
610
860
560
17.4
813
.89
14.6
711
.08
2.00
2.00
0.81
0.23
5
34Ly
ari
Iterc
epto
r12
9.4
256.
386
,134
170,
604
0.07
00.
139
0.20
827
686
870
660
13.8
99.
8911
.00
7.00
2.00
2.00
0.80
0.29
6
180.
011
9,81
50.
097
41.6
221.
627
,691
147,
506
0.02
30.
120
863.
257
4,58
10.
467
145.
41,
008.
696
,784
671,
366
0.07
90.
546
To
TP-
1
Nod
eC
atch
men
tA
rea
(ha)
Popu
latio
n(In
cov
erd
area
)A
vera
ge F
low
(m3 /s
)(F
low
to S
TP)
Dia
met
eror
Wid
th(m
m)
Hig
ht(m
m)
Num
ber o
fSt
ream
Leng
th(m
)V
eloc
ity(m
/s)
Gra
dien
t(1
/x)
Rem
arks
To
TP-
3
Flow
Cap
acity
(m3 /s
)
Cov
erin
g (m
)G
roun
d le
vel (
m)
Inve
rt le
vel (
m)
Peak
Flow
(m3 /s
)
Dia
met
er(in
ch)
To
Guj
jar
Nal
lah
(2) L
iaqu
atab
ad T
own
(1) R
ight
Ban
k Si
de(2
) Lef
t Ban
k Si
de
To
Lya
ri In
terc
epto
r(1
) Gul
berg
Tow
n
A124 - 8
Figu
re A
124.
4 L
ongi
tudi
nal S
ectio
n of
Tru
nk S
ewer
and
Sub
-mai
n Se
wer
(1/4
)
Sew
age
Trea
tmen
t Pla
nt
TP-
1

A124 - 9
Figu
re A
124.
5 L
ongi
tudi
nal S
ectio
n of
Tru
nk S
ewer
and
Sub
-mai
n Se
wer
(2/4
)

A124 - 10
Figu
re A
124.
6 L
ongi
tudi
nal S
ectio
n of
Tru
nk S
ewer
and
Sub
-mai
n Se
wer
(3/4
)

A124 - 11
Figu
re A
124.
7 L
ongi
tudi
nal S
ectio
n of
Tru
nk S
ewer
and
Sub
-mai
n Se
wer
(4/4
)

APPENDIX – A124.2
Rehabilitation of Sewage Treatment Plants

A124 - 12
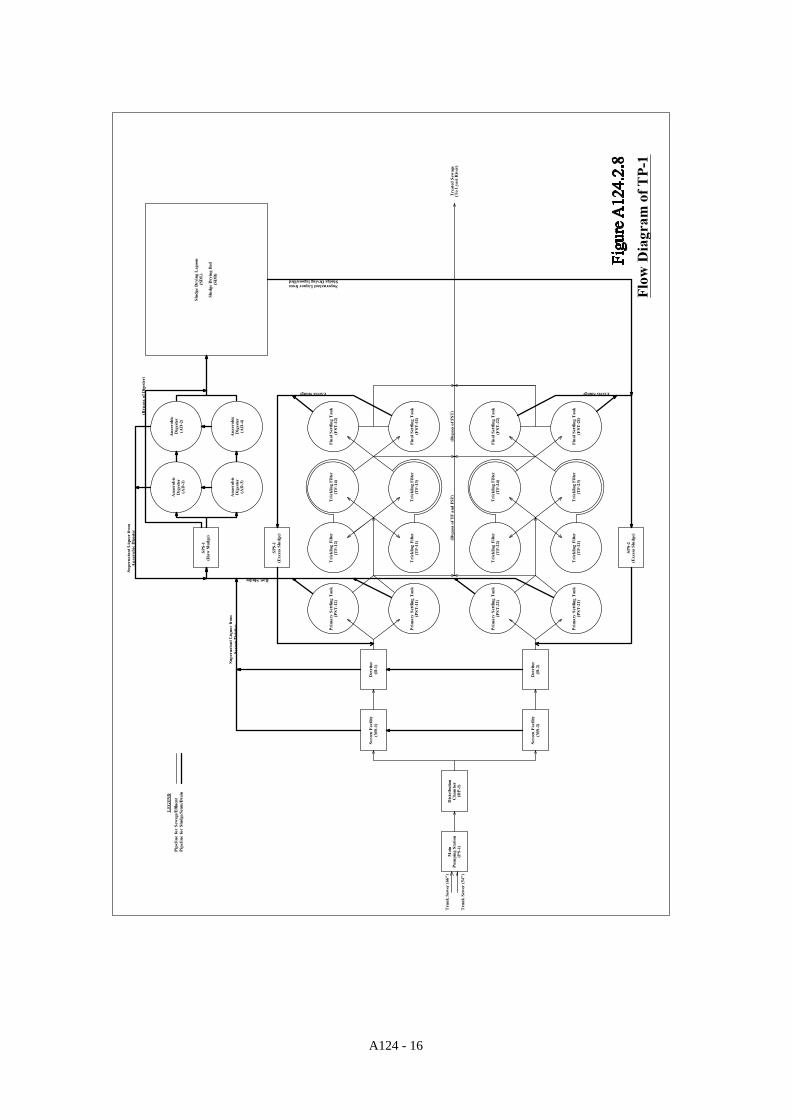
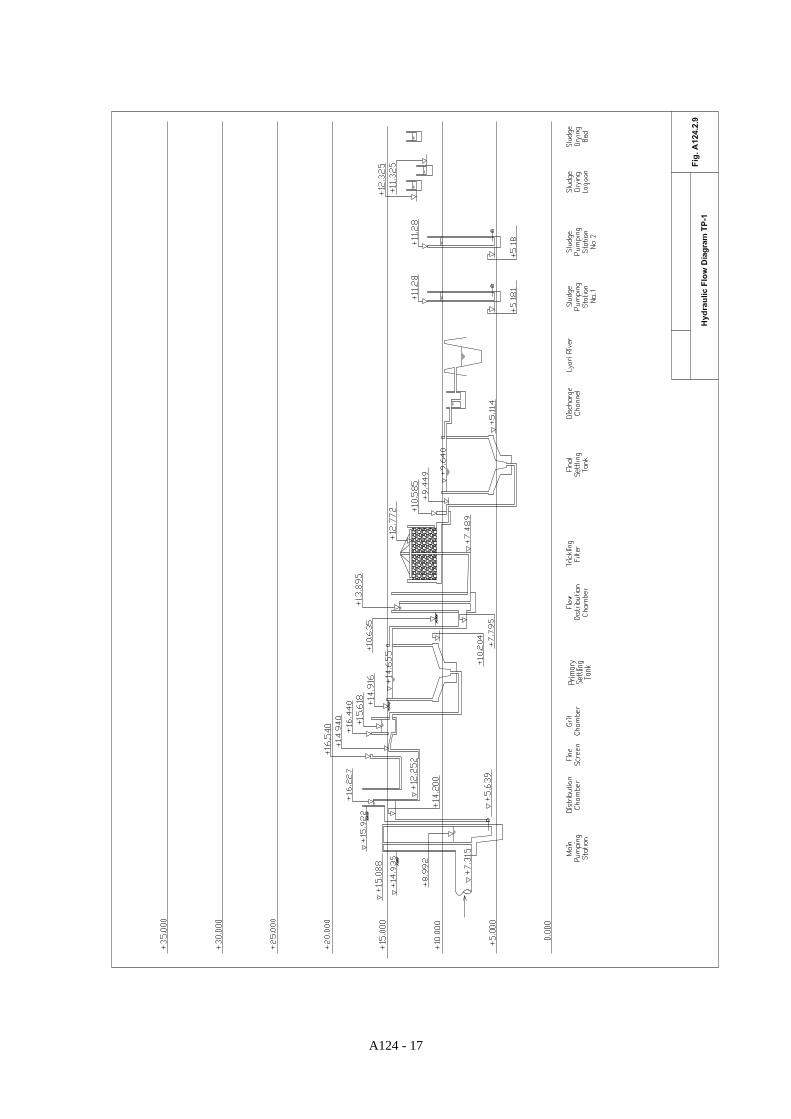
A124.2 Rehabilitation of Sewage Treatment Plants (1) TP-1 a) Main Pumping Station Figure A124.2.1 shows the flow diagram of pumping station. This pumping station equipment consists of main pump, bar screen, ventilation fan, sump pump, control panel and level meter etc. This pumping station is barely functioning with the effort of good maintenance but damaged by stain, rust, corrosion. Moreover level meters are not working at all. In order to recover its function, almost all the equipment needs rehabilitation. Figure A124.2.1 Flow Diagram of Pumping Station at TP-1 b) Screen, Grit Chamber, Partial Flume Figure A124.2.2 shows the flow diagram of inlet works. The motors of screen, detritor, grit collector and control panels are in bad condition. Therefore, those motors and panels shall be replaced with new ones. Figure A124.2.2 Flow Diagram of Inlet Works at TP-1 c) Primary Settling Tank Sludge collectors for PST are in bad condition. They need to be replaced. d) Trickling Filter Trickling filters are in bad condition. They need to be replaced. e) Final Settling Tank Sludge collectors for FST are in bad condition. They need to be replaced. f) Sludge Pumping Station No.1 at Train 1 Figure A124.2. 3 shows the flow diagram of sludge pumping station No.1. All the equipments are not working. They shall be replaced. Figure A124.2.3 Flow Diagram of Sludge Pumping Station No.1 at TP-1
NOTE 1
NOTE 2 NOTE 1) Before Rehabilitation : Digester Feed Pump After Rehabilitation : Lagoon Feed Pump
NOTE 2) Before Rehabilitation : to Digester After Rehabilitation : to Lagoon

A124 - 13
g) Sludge Pumping Station No.2 at Train 2 Figure A124.2.4 shows the flow diagram of sludge pumping station No.2. All the equipments are not working. They shall be replaced. Figure A124.2.4 Flow Diagram of Sludge Pumping Station No.2 at TP-1 h) Sludge Digester Sludge digesters are not working. They shall be abandoned. i) Sludge Drying Lagoon Some pipes are damaged. Therefore some piping works are required. j) Generator Generators are not working. They shall be replaced.
A124 - 14
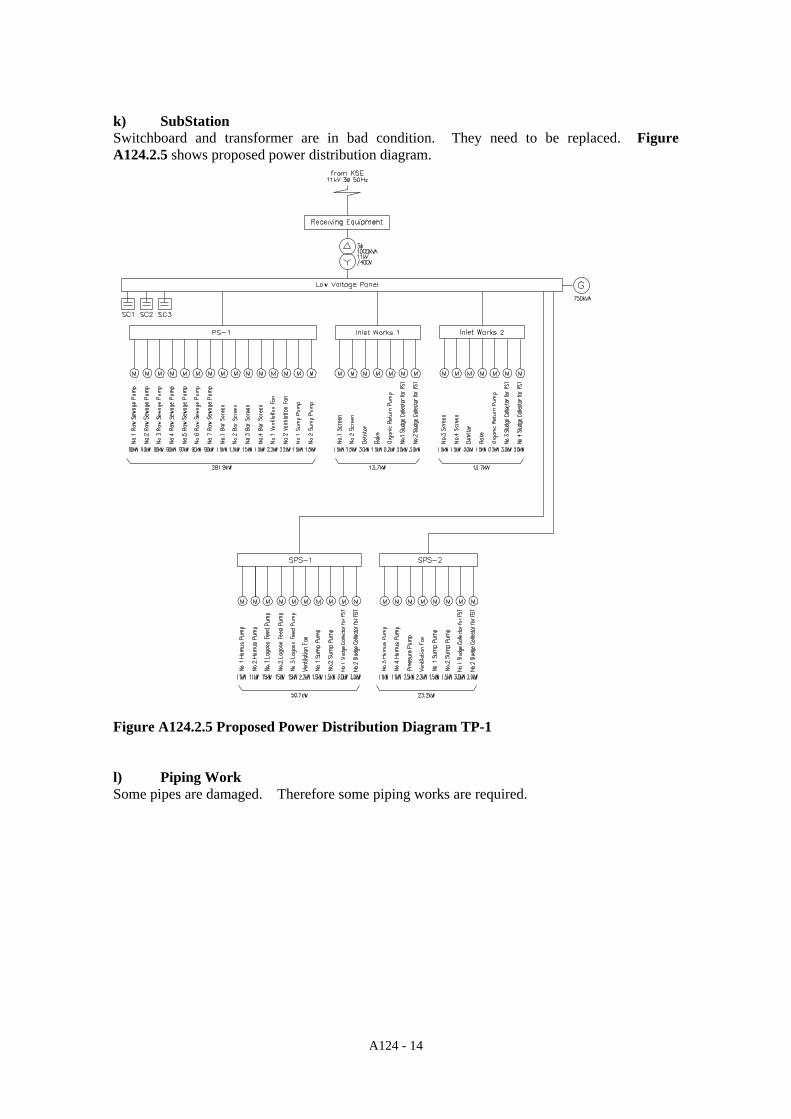
k) SubStation Switchboard and transformer are in bad condition. They need to be replaced. Figure A124.2.5 shows proposed power distribution diagram. Figure A124.2.5 Proposed Power Distribution Diagram TP-1 l) Piping Work Some pipes are damaged. Therefore some piping works are required.
A124 - 15
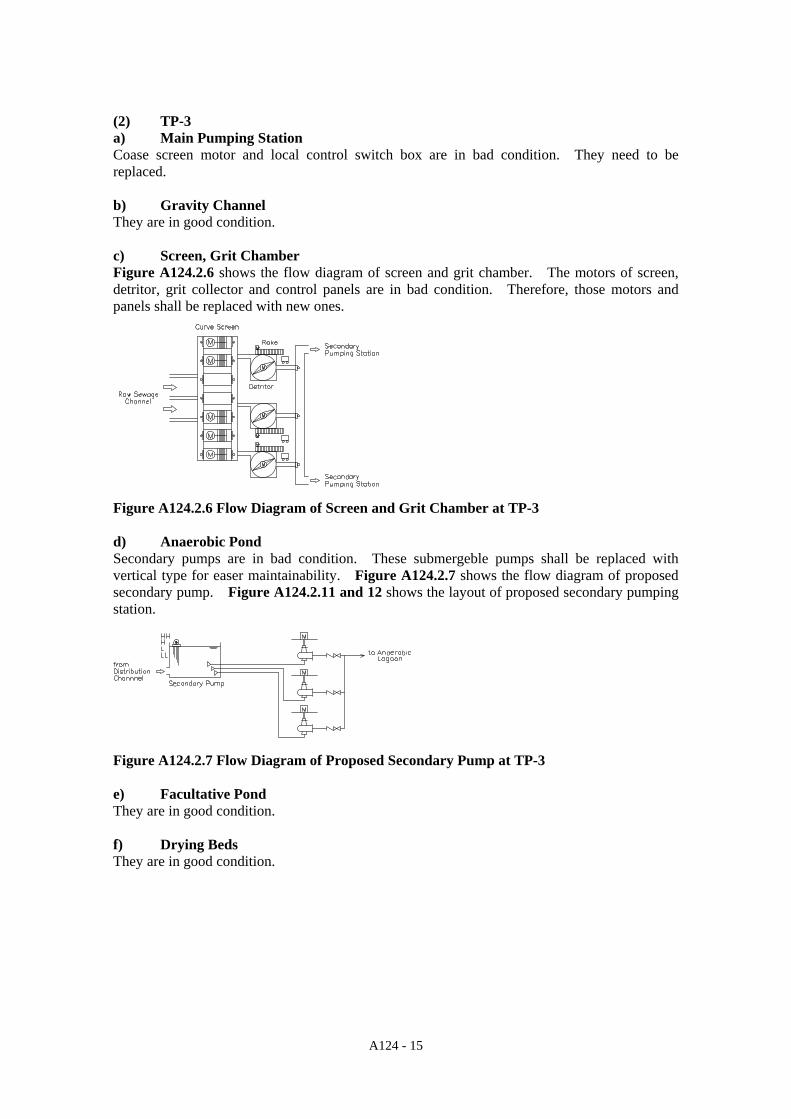
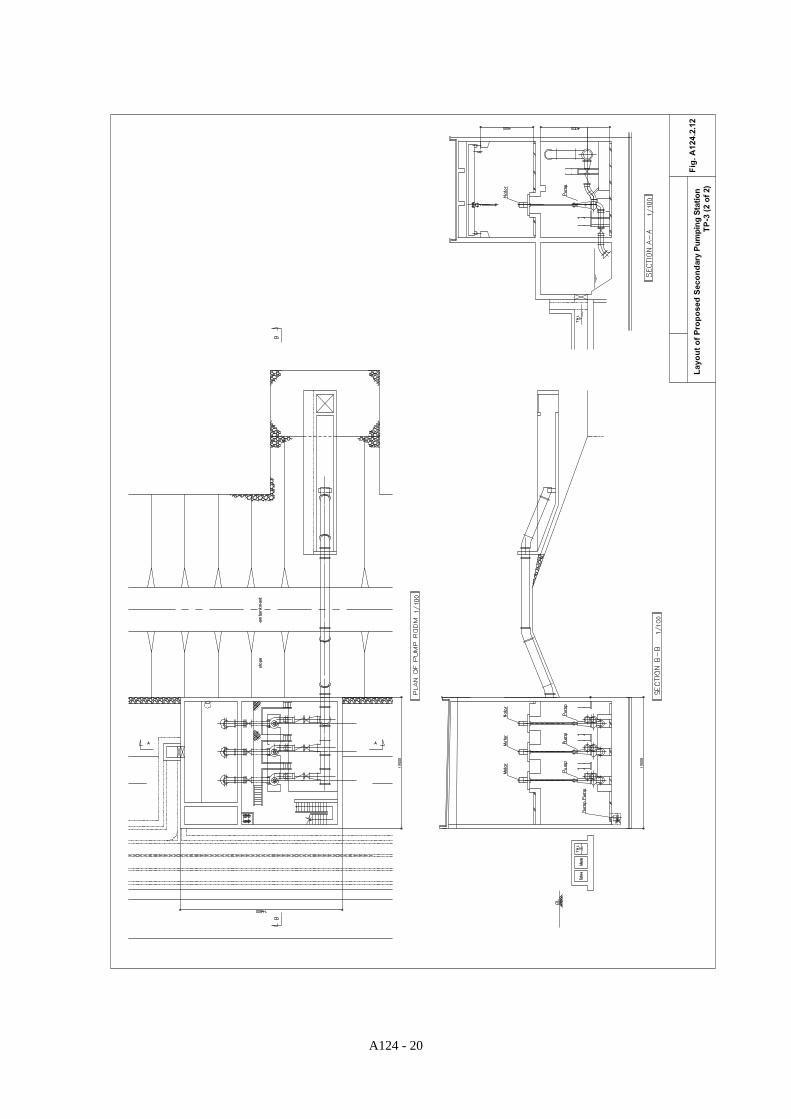
(2) TP-3 a) Main Pumping Station Coase screen motor and local control switch box are in bad condition. They need to be replaced. b) Gravity Channel They are in good condition. c) Screen, Grit Chamber Figure A124.2.6 shows the flow diagram of screen and grit chamber. The motors of screen, detritor, grit collector and control panels are in bad condition. Therefore, those motors and panels shall be replaced with new ones. Figure A124.2.6 Flow Diagram of Screen and Grit Chamber at TP-3 d) Anaerobic Pond Secondary pumps are in bad condition. These submergeble pumps shall be replaced with vertical type for easer maintainability. Figure A124.2.7 shows the flow diagram of proposed secondary pump. Figure A124.2.11 and 12 shows the layout of proposed secondary pumping station. Figure A124.2.7 Flow Diagram of Proposed Secondary Pump at TP-3 e) Facultative Pond They are in good condition. f) Drying Beds They are in good condition.
A124 - 16
A124 - 17

A124 - 18

A124 - 19
A124 - 20

APPENDIX – A124.3
Sewerage Facilities Improvement Plan

A124 - 21
A124.3 Sewerage Facilities Improvement Plan
NO DESCRIPTION COMMENT
1 Improve safety standards Introduce safe systems of work for plant isolation (lock-off/tag-out procedures when working on moving or electrical equipment) Improve plant safety such as railing of open channels, testing of lifting tackle, guarding of moving equipment/shafts etc. Improve safety awareness, staff training and issue PPE Provide appropriate spark proof tools and flame proof equipment for working in potentially explosive atmospheres at TPs, PSs and in sewers Provide gas detection equipment and forced air ventilation where necessary such as in PSs and before entering sewers, wet wells etc. Upgrade all facilities to ensure compliance with relevant regulations in force for electrical installations in potentially explosive atmospheres Provide basic tools for safe working in the highways such as reflective jackets, signage, safety lighting and manhole cover keys
2 Install meters at the inlet to TPs Use good quality electromagnetic or ultrasonic flow meters that comply with international standards
3 Develop and implement Best Practice Operating Manuals for plants, pumping stations and sewers
These will be used for training purposes and to ensure that standard operating procedures are followed
4 Provide appropriate tools for cleaning and unblocking sewers
These can be hand tools as well as power tools such as cleaning rods, swabs, gully suckers etc. Implement program of regular cleaning and maintenance or contract out these services
5 Develop plant criticality assessment model Assign criticality levels to key plant and equipment 6 Develop and implement planned maintenance
schedules Carry out tasks accordingly including lubrication schedules
7 Replace all defective or missing manhole covers Ensure manholes covers meet the required standards and are inspected regularly
8 Prepare Strategic sewer plans
Digitise all sewer networks starting with the strategic sewers and consider systematic rehabiltation of inadequate or defective sewers
9 Introduce a system of key performance measures
Monitor performance against agreed targets for each team/division/region
10 Ensure that all Contractors are ‘qualified’ (certified) to work on sewers both existing and new
Introduce a system of contractor certification or accreditation, set appropriate standards of repair and enforce standards
11 Ensure trade effluent compliance Set up a system for regular visits to all trade effluent companies discharging to sewers. Ensure compliance with effluent standards, installation/cleaning of fat traps etc.
12 Implement systems for recording asset and maintenance data
Computerise the capture of asset and maintenance data and implement system of planned preventative maintenance (CMMS)
13 Introduce system of performance management and key Performance Indicators (PI) in accordance with ‘balanced scorecard’
Measure performance against standards
14 Develop staff competencies to meet current and future technological improvements such as
Buy in skills where development is not possible

A124 - 22
NO DESCRIPTION COMMENT
computer, instrumentation, PLC, telemetry skills
15 Introduce a system for continuous process reviews to ensure that all treatment processes conform to agreed quality standards at least cost.
Will require some process re-engineering
16 Introduce a system to capture spatial information.
Use of Geographical Information System (GIS) as well as other systems for asset management such as a computerised maintenance management system (CMMS)

APPENDIX – A125.1
Preliminary Cost Estimates

A125 - 1
A125.1 Preliminary Cost Estimates Table A125.1.1 Construction Cost of Water Supply System
(unit: Rs.thousand)No. Components Description Quantity Unit Amount Foreign C. Local C.
80% 20%
1 Reservoir 30Mg 1 l.s. 490,860 392,688 98,1722 Trunk Distribution Main
70% 30%
a) New Installation DN16 - DN100inch L=25,990 m 1 l.s. 2,214,780 1,550,346 664,43470% 30%
b) Rehabilitation/Replacement DN14 - DN64inch L=49,490 m 1 l.s. 2,391,200 1,673,840 717,36070% 30%
Total (2) L=75,480m 4,605,980 3,224,186 1,381,794100% 0%
3 Flow Meter Electromagnetic Type DN18 - DN100inch N=17nos. 1 l.s. 46,125 46,125 04 Distribution Network Main
70% 30%
a) North Nazimabad L=336,600m 1 l.s. 1,009,800 706,860 302,94070% 30%
b) Gulberg L=374,900m 1 l.s. 1,124,700 787,290 337,41070% 30%
c) Liaquatabad L=284,600m 1 l.s. 853,800 597,660 256,14070% 30%
Total (4) L=996,100m 2,988,300 2,091,810 896,4905 House Connection
5.1 Water Meter only100% 0%
a) North Nazimabad N=8,880nos. 1 l.s. 15,840 15,840 0100% 0%
b) Gulberg N=9,200nos. 1 l.s. 16,560 16,560 0100% 0%
d) Liaquatabad N=2,100nos 1 l.s. 3,780 3,780 0100% 0%
Total (5.1) N=20,100nos. 36,180 36,1805.2 Water Meter and Service Pipes
81% 19%
a) North Nazimabad N=68,600nos. 1 l.s. 329,280 266,717 62,56381% 19%
b) Gulberg N=71,500nos. 1 l.s. 343,200 277,992 65,20881% 19%
c) Liaquatabad N=68,100nos. 1 l.s. 326,880 264,773 62,10781% 19%
Total (5.2) N=208,200nos. 999,360 809,482 189,87882% 18%
Total (5) N=228,300nos. 1,035,540 845,662 189,87872% 28%
Total (1-5) 9,166,805 6,600,471 2,566,33470% 30%
6 Engineering Fee F/C Total(1-5)×7.5%, L/C Total(1-5)×7.5% 1 l.s. 687,510 481,257 206,2530% 100%
7 Land Acquisition 1 l.s. 3,680 0 3,68072% 28%
8 Physical Contingency F/C Total(1-7)×5.0%, L/C Total(1-7)×5.0% 1 l.s. 492,899 354,086 138,81336% 64%
9 Price Contingency F/C Total(1-8)×1.5%, L/C Total(1-8)×6.0% 1 l.s. 1,916,802 694,906 1,221,8960% 100%
10 Project Administration F/C Total(1-9)×1.5%, L/C Total(1-9)×1.5% 1 l.s. 184,015 0 184,01547% 53%
Total (6-10) 3,284,906 1,530,249 1,754,65765% 35%
Total (1-10) 12,451,711 8,130,720 4,320,991

A125 - 2
Table A125.1.2 Construction Cost of Sewerage System
(Unit: Rs.thousand)No. Components Description Quantity Unit Amount Foreign C. Local C.
1 TP-1 Sewage Treatment Plant1.1 Mechanical Equipment
90% 10%
a) Main Pumping Station Vertical1 Centrifugal, 31.2m3/min 10.0m 90kw 1 l.s. 40,866 36,780 4,08690% 10%
b) Screen Chamber Drive Equipment for Mechanical Rake 1.5kw 1 l.s. 110 99 1190% 10%
c) Detritor Drive Equipment for Grit Collector Rake 3.0kw 1 l.s. 188 170 1890% 10%
d) Primary Settling Tank Equipment of Sludge Collector Rake Diameter 42.0m 1 l.s. 25,300 22,770 2,53090% 10%
e) Trickling Filter Water Spray Bar Diameter 41.4m 1 l.s. 50,600 45,540 5,06090% 10%
f) Final Settling Tank Equipment of Sludge Collector Rake Diameter 42.0m 1 l.s. 25,300 22,770 2,53090% 10%
g) Sludge Pump Station No.1 Humus Sludge Pump, Lagoon Feed Pump 1 l.s. 15,100 13,590 1,51090% 10%
h) Sludge Pump Station No.2 Humus Sludge Pump, Pressure Pump 1 l.s. 7,970 7,173 79790% 10%
Total (1.1) 165,434 148,892 16,54290% 10%
1.2 Electrical Equipment Transformer, Panel, Instrumentation, Generator 1 l.s. 42,010 37,811 4,19920% 80%
1.3 Removal and Installation Mechanical and Electrical Equipment 1 l.s. 81,174 16,235 64,93970% 30%
1.4 Internal pipe of Sewage Treatment Plant DN100 - DN300mm DN1,050mm L=4,870m 1 l.s. 48,661 34,063 14,59870% 30%
Total (1) 337,279 237,001 100,2782 TP-3 Sewage Treatment Plant
2.1 Mechanical Equipment90% 10%
a) Main Pumping Station Motor for Bar Screen 1.5kw 1 l.s. 3,905 3,515 39090% 10%
b) Screen Chamber Drive Equipment for Mechanical Rake 1.5kw 1 l.s. 138 124 1490% 10%
c) Detritor Drive Equipment for Grit Collector Rake 3.0kw 1 l.s. 3,066 2,760 30690% 10%
d) Anaerobic Pond Secondary Pump, Vertical Pump 50m3/min 7m 75kw 1 l.s. 93,357 84,021 9,33690% 10%
Total (2.1) 100,466 90,420 10,04690% 10%
2.2 Electrical Equipment Panel, Instrumentation 1 l.s. 23,651 21,286 2,36520% 80%
2.3 Removal and Installation Mechanical and Electrical Equipment 1 l.s. 48,568 9,714 38,85425% 75%
2.4 Pump House for Secondary Pump W=10.0m L=15.0m H=5.0m 1 l.s. 26,000 6,500 19,50064% 36%
Total (2) 198,685 127,920 70,7653 Sewer and Box Culvert
3.1 Branch Sewer20% 80%
a) North Nazimabad Town DN10 inch L=100,100m 1 l.s. 350,350 70,070 280,28020% 80%
b) Gulberg Town DN10 inch L=86,700m 1 l.s. 303,450 60,690 242,76020% 80%
c) Liaquatabad Town DN10 inch L=82,500m 1 l.s. 288,750 57,750 231,00020% 80%
Total (3.1) L=269,300m 942,550 188,510 754,0403.2 Trunk Sewer
20% 80%a) North Nazimabad Town DN12 - DN54inch L=20,620m 1 l.s. 401,026 80,206 320,820
20% 80%b) Gulberg Town DN12 - DN33inch L=15,930m 1 l.s. 247,322 49,464 197,858
20% 80%c) North Nazimabad Town DN12 - DN84inch, 1,750×1,750 Box Culvert L=17,440m 1 l.s. 522,732 104,547 418,185
20% 80%Total (3.2) L=53,990m 1,171,080 234,217 936,863
20% 80%Total (3) L=323,290m 2,113,630 422,727 1,690,903
30% 70%Total (1-3) 2,649,594 787,648 1,861,946
70% 30%4 Engineering Fee F/C Total(1-3)×7.5%, L/C Total(1-3)×7.5% 1 l.s. 198,720 139,104 59,616
33% 67%5 Physical Contingency F/C Total(1-4)×5.0%, L/C Total(1-4)×5.0% 1 l.s. 142,416 46,338 96,078
10% 90%6 Price Contingency F/C Total(1-5)×1.5%, L/C Total(1-5)×6.0% 1 l.s. 927,044 90,026 837,018
0% 100%7 Project Administration F/C Total(1-6)×1.5%, L/C Total(1-6)×1.5% 1 l.s. 58,767 0 58,767
21% 79%Total (4-7) 1,326,947 275,468 1,051,479
27% 73%Total (1-7) 3,976,541 1,063,116 2,913,425

A125 - 3
Table A125.1.3 Annual Construction Cost of Water Supply System (1/2) No. Components Description Curr- Ratio Cost Year
ency Rs.thousand 2012 2013 2014 2015 2016
25% 50% 25%1 Reservoir Capcity 30MG - 100% 490,860 122,715 245,430 122,715
F/C 80% 392,688 98,172 196,344 98,172L/C 20% 98,172 24,543 49,086 24,543
2 Trunk Distribution Main2.1 New Installation
25% 50% 25%DN 100 inch L=9,620 m - 100% 1,250,600 312,650 625,300 312,650
F/C 70% 875,420 218,855 437,710 218,855L/C 30% 375,180 93,795 187,590 93,795
25% 50% 25%DN 88 inch L=2,320 m - 100% 245,920 61,480 122,960 61,480
F/C 70% 172,144 43,036 86,072 43,036L/C 30% 73,776 18,444 36,888 18,444
50% 50%DN 72 inch L=1,210 m - 100% 99,220 49,610 49,610
F/C 70% 69,454 34,727 34,727L/C 30% 29,766 14,883 14,883
50% 50%DN 64 inch L=30 m - 100% 2,130 1,065 1,065
F/C 70% 1,491 746 746L/C 30% 639 320 320
25% 50% 25%DN 56 inch L=3,830 m - 100% 237,460 59,366 118,730 59,364
F/C 70% 166,222 41,556 83,111 41,555L/C 30% 71,238 17,810 35,619 17,809
25% 50% 25%DN 48 inch L=1,820 m - 100% 100,100 25,026 50,050 25,024
F/C 70% 70,070 17,518 35,035 17,517L/C 30% 30,030 7,508 15,015 7,507
25% 50% 25%DN 36 inch L=3,120 m - 100% 140,400 35,100 70,200 35,100
F/C 70% 98,280 24,570 49,140 24,570L/C 30% 42,120 10,530 21,060 10,530
50% 50%DN 32 inch L=10 m - 100% 420 210 210
F/C 70% 294 147 147L/C 30% 126 63 63
50% 50%DN 28 inch L=90 m - 100% 3,510 1,756 1,754
F/C 70% 2,457 1,229 1,228L/C 30% 1,053 527 526
50% 50%DN 24 inch L=1,360 m - 100% 50,320 25,160 25,160
F/C 70% 35,224 17,612 17,612L/C 30% 15,096 7,548 7,548
50% 50%DN 18 inch L=2,140 m - 100% 70,620 35,310 35,310
F/C 70% 49,434 24,717 24,717L/C 30% 21,186 10,593 10,593
50% 50%DN 16 inch L=440 m - 100% 14,080 7,040 7,040
F/C 70% 9,856 4,928 4,928L/C 30% 4,224 2,112 2,112
25% 50% 25%Total (2.1) L=25,990 m - 100% 2,214,780 545,198 1,107,389 562,193
F/C 70% 1,550,346 381,638 775,173 393,536L/C 30% 664,434 163,560 332,217 168,658
2.2 Rehabilitation/Replacement25% 50% 25%
DN 64 inch L=4,180 m - 100% 296,780 74,196 148,390 74,194F/C 70% 207,746 51,937 103,873 51,936L/C 30% 89,034 22,259 44,517 22,258
25% 50% 25%DN 56 inch L=4,660 m - 100% 288,920 72,230 144,460 72,230
F/C 70% 202,244 50,561 101,122 50,561L/C 30% 86,676 21,669 43,338 21,669
25% 50% 25%DN 48 inch L=19,160 m - 100% 1,053,800 263,450 526,900 263,450
F/C 70% 737,660 184,415 368,830 184,415L/C 30% 316,140 79,035 158,070 79,035
50% 50%DN 32 inch L=1,030 m - 100% 43,260 21,630 21,630
F/C 70% 30,282 15,141 15,141L/C 30% 12,978 6,489 6,489
25% 50% 25%DN 24 inch L=10,550 m - 100% 390,350 97,587 195,176 97,587
F/C 70% 273,245 68,311 136,623 68,311L/C 30% 117,105 29,276 58,553 29,276
25% 50% 25%DN 18 inch L=4,210 m - 100% 138,930 34,733 69,466 34,731
F/C 70% 97,251 24,313 48,626 24,312L/C 30% 41,679 10,420 20,840 10,419
50% 50%DN 16 inch L=2,460 m - 100% 78,720 39,360 39,360
F/C 70% 55,104 27,552 27,552L/C 30% 23,616 11,808 11,808
50% 100%DN 14 inch L=3,240 m - 100% 100,440 50,220 50,220
F/C 70% 70,308 35,154 35,154L/C 30% 30,132 15,066 15,066
24% 50% 26%Total (2.2) L=49,490 m - 100% 2,391,200 563,826 1,195,602 631,772
F/C 70% 1,673,840 394,678 836,921 442,241L/C 30% 717,360 169,148 358,681 189,531
24% 50% 26%Total (2) L=75,480 m - 100% 4,605,980 1,109,024 2,302,991 1,193,965
F/C 70% 3,224,186 776,316 1,612,094 835,777L/C 30% 1,381,794 332,708 690,898 358,189

A125 - 4
Table A125.1.3 Annual Construction Cost of Water Supply System (2/2)
3 Flow Meter50% 50%
DN 100 inch N=3 nos. - 100% 15,414 7,707 7,707F/C 100% 15,414 7,707 7,707L/C 0% 0 0 0
50% 50%DN 72 inch N=2 nos. - 100% 6,482 3,241 3,241
F/C 100% 6,482 3,241 3,241L/C 0% 0 0 0
50% 50%DN 64 inch N=1 no. - 100% 2,806 1,403 1,403
F/C 100% 2,806 1,403 1,403L/C 0% 0 0 0
50% 50%DN 56 inch N=1 no. - 100% 2,451 1,226 1,226
F/C 100% 2,451 1,226 1,226L/C 0% 0 0 0
50% 50%DN 54 inch N=2 nos. - 100% 4,744 2,372 2,372
F/C 100% 4,744 2,372 2,372L/C 0% 0 0 0
50% 50%DN 48 inch N=4 nos. - 100% 8,696 4,348 4,348
F/C 100% 8,696 4,348 4,348L/C 0% 0 0 0
50% 50%DN 24 inch N=2 nos. - 100% 2,924 1,462 1,462
F/C 100% 2,924 1,462 1,462L/C 0% 0 0 0
50% 50%DN 18 inch 2 nos. - 100% 2,608 1,304 1,304
F/C 100% 2,608 1,304 1,304L/C 0% 0 0 0
7% 50% 43%Total (3) N=17 nos. - 100% 46,125 3,241 23,063 19,822
F/C 100% 46,125 3,241 23,063 19,822L/C 0% 0 0 0 0
4 Distribution Network Main25% 50% 25%
North Nazimabad Town L=336,600 m - 100% 1,009,800 252,450 504,900 252,450F/C 70% 706,860 176,715 353,430 176,715L/C 30% 302,940 75,735 151,470 75,735
25% 50% 25%Gulberg Town L=374,900 m - 100% 1,124,700 281,176 562,350 281,174
F/C 70% 787,290 196,823 393,645 196,822L/C 30% 337,410 84,353 168,705 84,352
25% 50% 25%Liaquatabad Town L=284,600 m - 100% 853,800 213,450 426,900 213,450
F/C 70% 597,660 149,415 298,830 149,415L/C 30% 256,140 64,035 128,070 64,035
25% 50% 25%Total (4) L=996,100 m - 100% 2,988,300 747,076 1,494,150 747,074
F/C 70% 2,091,810 522,953 1,045,905 522,952L/C 30% 896,490 224,123 448,245 224,122
5 House Connection5.1 Water Meter Only
25% 50% 25%North Nazimabad Town N=8,800 nos. - 100% 15,840 3,960 7,920 3,960
F/C 100% 15,840 3,960 7,920 3,960L/C 0% 0 0 0 0
25% 50% 25%Gulberg Town N=9,200 nos. - 100% 16,560 4,140 8,280 4,140
F/C 100% 16,560 4,140 8,280 4,140L/C 0% 0 0 0 0
50% 50%Liaquatabad Town N=2,100 nos. - 100% 3,780 1,890 1,890 0
F/C 100% 3,780 1,890 1,890 0L/C 0% 0 0 0 0
28% 50% 22%Total (5.1) N=20,100 nos. - 100% 36,180 9,990 18,090 8,100
F/C 100% 36,180 9,990 18,090 8,100L/C 0% 0 0 0 0
5.2 Water Meter and Service Pipe25% 50% 25%
North Nazimabad Town N=68,600 nos. - 100% 329,280 82,320 164,641 82,319F/C 81% 266,717 66,679 133,359 66,679L/C 19% 62,563 15,641 31,282 15,640
25% 50% 25%Gulberg Town N=71,500 nos. - 100% 343,200 85,800 171,600 85,800
F/C 81% 277,992 69,498 138,996 69,498L/C 19% 65,208 16,302 32,604 16,302
25% 50% 25%Liaquatabad Town N=68,100 nos. - 100% 326,880 81,720 163,441 81,719
F/C 81% 264,773 66,193 132,387 66,193L/C 19% 62,107 15,527 31,054 15,526
25% 50% 25%Total (5.2) N=208,200 nos. - 100% 999,360 249,840 499,682 249,838
F/C 81% 809,482 202,370 404,742 202,370L/C 19% 189,878 47,470 94,940 47,468
25% 50% 25%Total (5) N=228,300 nos. - 100% 1,035,540 259,830 517,772 257,938
F/C 82% 845,662 212,360 422,832 210,470L/C 18% 189,878 47,470 94,940 47,468
24% 50% 26%Total (1-5) - 100% 9,166,805 2,241,886 4,583,406 2,341,514
F/C 72% 6,600,471 1,613,042 3,300,237 1,687,192L/C 28% 2,566,334 628,844 1,283,169 654,322
40% 40% 20%6 Engineering Fee - 100% 687,510 275,004 275,004 137,502
F/C Total(1-5)x7.5% F/C 70% 481,257 192,503 192,503 96,251L/C Total(1-5)x7.5% L/C 30% 206,253 82,501 82,501 41,251
7 Land Acquisition - 100% 3,680 3,680F/C 0% 0 0L/C 100% 3,680 3,680
8 Physical Contingency - 100% 492,899 126,028 242,920 123,951F/C Total(1-7)x5.0% F/C 72% 354,086 90,277 174,637 89,172L/C Total(1-7)x5.0% L/C 28% 138,813 35,751 68,283 34,779
9 Price Contingency - 100% 1,916,802 400,449 942,829 573,524F/C Total(1-8)x1.5% F/C 36% 694,906 146,517 342,692 205,697L/C Total(1-8)x6.0% L/C 64% 1,221,896 253,932 600,137 367,827
10 Project Administration - 100% 184,015 45,706 90,662 47,647F/C Total(1-9)x1.5% F/C 0% 0L/C Total(1-9)x1.5% L/C 100% 184,015 45,706 90,662 47,647
25% 47% 27%Total (6-10) - 100% 3,284,906 850,867 1,551,415 882,624
F/C 47% 1,530,249 429,297 709,832 391,120L/C 53% 1,754,657 421,570 841,583 491,504
25% 49% 26%Total (1-10) - 100% 12,451,711 3,092,753 6,134,821 3,224,138
F/C 65% 8,130,720 2,042,339 4,010,069 2,078,312L/C 35% 4,320,991 1,050,414 2,124,752 1,145,826
A125 - 5
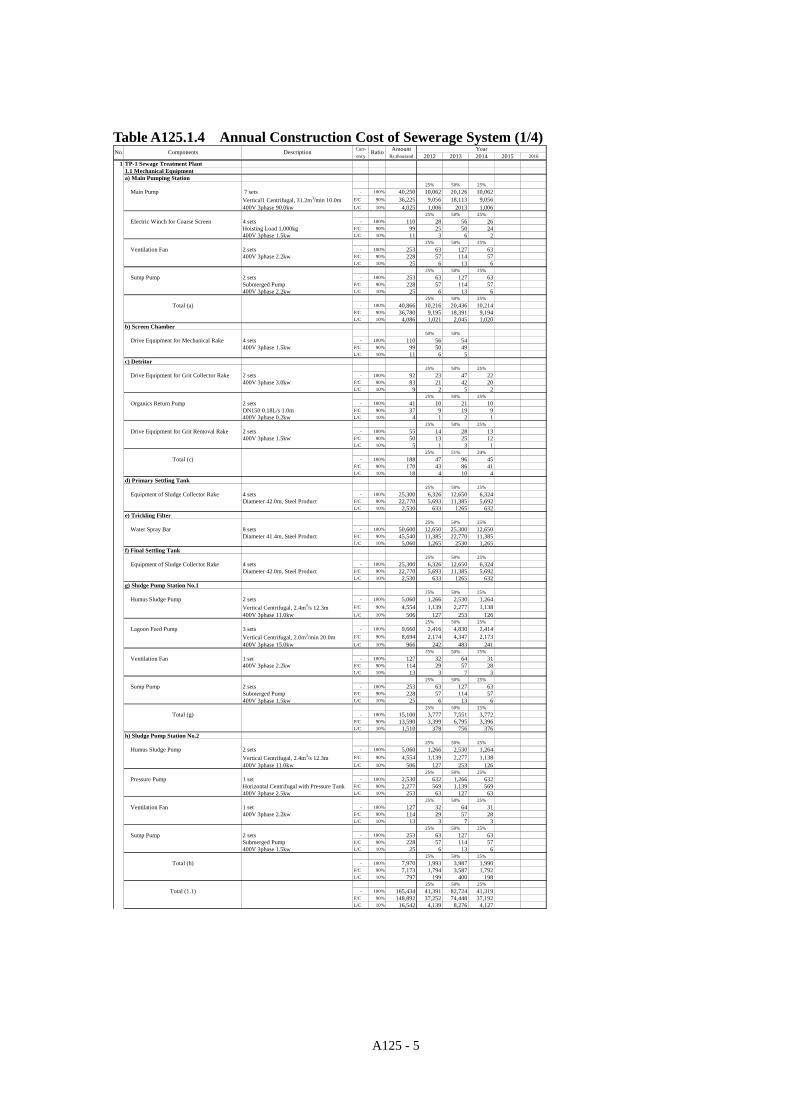
Table A125.1.4 Annual Construction Cost of Sewerage System (1/4)
Curr- Amount Yearency Rs.thousand 2012 2013 2014 2015 2016
1 TP-1 Sewage Treatment Plant1.1 Mechanical Equipmenta) Main Pumping Station
25% 50% 25%Main Pump 7 sets - 100% 40,250 10,062 20,126 10,062
Vertical1 Centrifugal, 31.2m3/min 10.0m F/C 90% 36,225 9,056 18,113 9,056400V 3phase 90.0kw L/C 10% 4,025 1,006 2013 1,006
25% 50% 25%Electric Winch for Coarse Screen 4 sets - 100% 110 28 56 26
Hoisting Load 1,000kg F/C 90% 99 25 50 24400V 3phase 1.5kw L/C 10% 11 3 6 2
25% 50% 25%Ventilation Fan 2 sets - 100% 253 63 127 63
400V 3phase 2.2kw F/C 90% 228 57 114 57L/C 10% 25 6 13 6
25% 50% 25%Sump Pump 2 sets - 100% 253 63 127 63
Submerged Pump F/C 90% 228 57 114 57400V 3phase 2.2kw L/C 10% 25 6 13 6
25% 50% 25%Total (a) - 100% 40,866 10,216 20,436 10,214
F/C 90% 36,780 9,195 18,391 9,194L/C 10% 4,086 1,021 2,045 1,020
b) Screen Chamber50% 50%
Drive Equipment for Mechanical Rake 4 sets - 100% 110 56 54400V 3phase 1.5kw F/C 90% 99 50 49
L/C 10% 11 6 5c) Detritor
25% 50% 25%Drive Equipment for Grit Collector Rake 2 sets - 100% 92 23 47 22
400V 3phase 3.0kw F/C 90% 83 21 42 20L/C 10% 9 2 5 2
25% 50% 25%Organics Return Pump 2 sets - 100% 41 10 21 10
DN150 0.18L/s 1.0m F/C 90% 37 9 19 9400V 3phase 0.2kw L/C 10% 4 1 2 1
25% 50% 25%Drive Equipment for Grit Removal Rake 2 sets - 100% 55 14 28 13
400V 3phase 1.5kw F/C 90% 50 13 25 12L/C 10% 5 1 3 1
25% 51% 24%Total (c) - 100% 188 47 96 45
F/C 90% 170 43 86 41L/C 10% 18 4 10 4
d) Primary Settling Tank25% 50% 25%
Equipment of Sludge Collector Rake 4 sets - 100% 25,300 6,326 12,650 6,324Diameter 42.0m, Steel Product F/C 90% 22,770 5,693 11,385 5,692
L/C 10% 2,530 633 1265 632e) Trickling Filter
25% 50% 25%Water Spray Bar 8 sets - 100% 50,600 12,650 25,300 12,650
Diameter 41.4m, Steel Product F/C 90% 45,540 11,385 22,770 11,385L/C 10% 5,060 1,265 2530 1,265
f) Final Settling Tank25% 50% 25%
Equipment of Sludge Collector Rake 4 sets - 100% 25,300 6,326 12,650 6,324Diameter 42.0m, Steel Product F/C 90% 22,770 5,693 11,385 5,692
L/C 10% 2,530 633 1265 632g) Sludge Pump Station No.1
25% 50% 25%Humus Sludge Pump 2 sets - 100% 5,060 1,266 2,530 1,264
Vertical Centrifugal, 2.4m3/s 12.3m F/C 90% 4,554 1,139 2,277 1,138400V 3phase 11.0kw L/C 10% 506 127 253 126
25% 50% 25%Lagoon Feed Pump 3 sets - 100% 9,660 2,416 4,830 2,414
Vertical Centrifugal, 2.0m3/min 20.0m F/C 90% 8,694 2,174 4,347 2,173400V 3phase 15.0kw L/C 10% 966 242 483 241
25% 50% 25%Ventilation Fan 1 set - 100% 127 32 64 31
400V 3phase 2.2kw F/C 90% 114 29 57 28L/C 10% 13 3 7 3
25% 50% 25%Sump Pump 2 sets - 100% 253 63 127 63
Submerged Pump F/C 90% 228 57 114 57400V 3phase 1.5kw L/C 10% 25 6 13 6
25% 50% 25%Total (g) - 100% 15,100 3,777 7,551 3,772
F/C 90% 13,590 3,399 6,795 3,396L/C 10% 1,510 378 756 376
h) Sludge Pump Station No.225% 50% 25%
Humus Sludge Pump 2 sets - 100% 5,060 1,266 2,530 1,264Vertical Centrifugal, 2.4m3/s 12.3m F/C 90% 4,554 1,139 2,277 1,138400V 3phase 11.0kw L/C 10% 506 127 253 126
25% 50% 25%Pressure Pump 1 set - 100% 2,530 632 1,266 632
Horizontal Centrifugal with Pressure Tank F/C 90% 2,277 569 1,139 569400V 3phase 2.5kw L/C 10% 253 63 127 63
25% 50% 25%Ventilation Fan 1 set - 100% 127 32 64 31
400V 3phase 2.2kw F/C 90% 114 29 57 28L/C 10% 13 3 7 3
25% 50% 25%Sump Pump 2 sets - 100% 253 63 127 63
Submerged Pump F/C 90% 228 57 114 57400V 3phase 1.5kw L/C 10% 25 6 13 6
25% 50% 25%Total (h) - 100% 7,970 1,993 3,987 1,990
F/C 90% 7,173 1,794 3,587 1,792L/C 10% 797 199 400 198
25% 50% 25%Total (1.1) - 100% 165,434 41,391 82,724 41,319
F/C 90% 148,892 37,252 74,448 37,192L/C 10% 16,542 4,139 8,276 4,127
No. Components Description Ratio

A125 - 6
Table A125.1.4 Annual Construction Cost of Sewerage System (2/4) 1.2 Electrical Equipment
25% 50% 25%a) Incoming Panel 2 sets - 100% 3,910 978 1,956 976
Indoor Installation F/C 90% 3,519 880 1,760 879L/C 10% 391 98 196 97
25% 50% 25%- 100% 6,325 1,581 3,163 1,581
b) Electrical Transformer 1 set F/C 90% 5,693 1,423 2,847 1,4231,000kVA Indoor Installation L/C 10% 632 158 316 158
25% 50% 25%c) Main Low Voltage Panel 1 set - 100% 2,070 518 1,036 516
Indoor Installation F/C 90% 1,863 466 932 465L/C 10% 207 52 104 51
25% 50% 25%d) PF Improvement Panel 2 sets - 100% 1,150 288 576 286
SC 100kVarx1 F/C 90% 1,035 259 518 258Indoor Installation L/C 10% 115 29 58 28
25% 50% 25%e) PF Improvement Panel 1 set - 100% 690 172 346 172
SC 125kVarx1 F/C 90% 621 155 311 155Indoor Installation L/C 10% 69 17 35 17
25% 50% 25%f) Motor Control Center 1 set - 100% 2,645 661 1,323 661
PS-1 F/C 90% 2,381 595 1,191 595Indoor Installation L/C 10% 264 66 132 66
25% 50% 25%g) Motor Control Center 1 set - 100% 230 58 116 56
Inlet Works -1 F/C 90% 207 52 104 51Outdoor Installation L/C 10% 23 6 12 5
25% 50% 25%h) Motor Control Center 1 set - 100% 230 58 116 56
Inlet Works -2 F/C 90% 207 52 104 51Outdoor Installation L/C 10% 23 6 12 5
25% 50% 25%i) Motor Control Center 1 set - 100% 690 172 346 172
SPS-1 F/C 90% 621 155 311 155Indoor Installation L/C 10% 69 17 35 17
25% 50% 25%j) Motor Control Center 1 set - 100% 345 87 173 85
SPS-2 F/C 90% 311 78 156 77Indoor Installation L/C 10% 34 9 17 8
25% 50% 25%k) Local Control Switch 55 sets - 100% 380 96 190 94
Indoor Installation F/C 90% 342 86 171 85L/C 10% 38 10 19 9
25% 50% 25%l) Generator Set 1 set - 100% 16,905 4,227 8,453 4,225
Diesel Type 750kVA 4,500 litter Fuel Tank F/C 90% 15,215 3,804 7,608 3,803Indoor Installation L/C 10% 1,690 423 845 422
25% 50% 25%m) Level Meter 7 sets - 100% 4,830 1,208 2,416 1,206
Ultrasonic Type 0 to 5m F/C 90% 4,347 1,087 2,174 1,086Outdoor Installation L/C 10% 483 121 242 120
25% 50% 25%n) Flow Meter 2 sets - 100% 1,610 402 806 402
Ultrasonic Open Channel Type F/C 90% 1,449 362 725 3620 to 3,500m3/h Outdoor Installation L/C 10% 161 40 81 40
25% 50% 25%Total (1.2) - 100% 42,010 10,506 21,016 10,488
F/C 90% 37,811 9,454 18,912 9,445L/C 10% 4,199 1,052 2,104 1,043
1.3 Removal and Installation25% 50% 25%
Mechanical and Electrical Equipment - 100% 81,174 20,294 40,588 20,292F/C 20% 16,235 4,059 8,118 4,058L/C 80% 64,939 16,235 32470 16,234
1.4 Internal pipe of Sewage Treatment Plant25% 50% 25%
Chamber of JP5 and JP6 DN1,050 L=70m - 100% 1,804 451 903 450to Final Settling Tank F/C 70% 1,263 316 632 315
L/C 30% 541 135 271 13525% 50% 25%
Sludge, Scum and Drain Pipe Line DN100 - DN300 L=4,800m - 100% 46,857 11,714 23,429 11,714F/C 70% 32,800 8,200 16,400 8,200L/C 30% 14,057 3,514 7029 3,514
25% 50% 25%Total (1.4) - 100% 48,661 12,165 24,332 12,164
F/C 70% 34,063 8,516 17,032 8,515L/C 30% 14,598 3,649 7,300 3,649
25% 50% 25%Total (1) - 100% 337,279 84,356 168,660 84,263
F/C 70% 237,001 59,281 118,510 59,210L/C 30% 100,278 25,075 50,150 25,053
2 TP-3 Sewage Treatment Plant2.1 Mechanical Equipmenta) Main Pumping Station
50% 50%Motor for Bar Screen 4 sets - 100% 110 56 54
400V 3phase 1.5kW F/C 90% 99 50 49L/C 10% 11 6 5
50% 50%Potable Water Pump 3 sets - 100% 3,795 1898 1897
Centrifugal Pump F/C 90% 3,416 1708 1,708L/C 10% 379 190 189
50% 50% 0%Total (a) - 100% 3,905 1,954 1,951 0
F/C 90% 3,515 1,758 1,757 0L/C 10% 390 196 194 0
b) Screen Chamber50% 50%
Drive Equipment for Mechanical Rake 5sets - 100% 138 69 69400V 3phase 1.50kW F/C 90% 124 62 62
L/C 10% 14 7 7c) Detritor
50% 50%Drive Equipment for Grit Collector Rake 3sets - 100% 138 69 69
400V 3phase 3.00kW F/C 90% 124 62 62L/C 10% 14 7 7
50% 50%Organics Return Pump 3sets - 100% 62 31 31
400V 3phase 0.20kW F/C 90% 56 28 28L/C 10% 6 3 3
50% 50%Drive Equipment for Grit Removal Rake 3sets - 100% 83 42 41
400V 3phase 1.50kW F/C 90% 75 38 37L/C 10% 8 4 4
50% 50%Potable Water Pump 2 sets - 100% 2,530 1,266 1,264
Centrifugal Pump F/C 90% 2,277 1,139 1,138L/C 10% 253 127 126
50% 50%Drainage Pump 2 sets - 100% 253 127 126
Submersible Sewage Pump F/C 90% 228 114 114L/C 10% 25 13 12
50% 50% 0%Total (c) - 100% 3,066 1,535 1,531 0
F/C 90% 2,760 1,381 1,379 0L/C 10% 306 154 152 0

A125 - 7
Table A125.1.4 Annual Construction Cost of Sewerage System (3/4) d) Anaerobic Pond
25% 50% 25%Secondary Pump 18 sets - 100% 91,080 22,770 45,540 22,770
Vertical Sewage Pump 50m3/min x 7mH F/C 90% 81,972 20,493 40,986 20,493400V 3phase 75.00kW L/C 10% 9,108 2,277 4554 2,277
25% 50% 25%Ventilation Fan 6 sets - 100% 759 190 380 189
400V 3phase 2.20kW F/C 90% 683 171 342 170L/C 10% 76 19 38 19
25% 50% 25%Sump Pump 12 sets - 100% 1,518 380 759 379
400V 3phase 1.50kW F/C 90% 1,366 342 683 341L/C 10% 152 38 76 38
25% 50% 25%Total (d) - 100% 93,357 23,340 46,679 23,338
F/C 90% 84,021 21,006 42,011 21,004L/C 10% 9,336 2,334 4,668 2,334
27% 50% 23%Total (2.1) - 100% 100,466 26,898 50,230 23,338
F/C 90% 90,420 24,207 45,209 21,004L/C 10% 10,046 2,691 5,021 2,334
2.2 Electrical Equipment25% 50% 25%
a) Motor Control Center 1 set - 100% 460 116 230 114Inlet Works F/C 90% 414 104 207 103Indoor Installation L/C 10% 46 12 23 11
25% 50% 25%b) Motor Control Center 6 sets - 100% 13,800 3,450 6,900 3,450
SPS F/C 90% 12,420 3,105 6,210 3,105Indoor Installation L/C 10% 1,380 345 690 345
25% 50% 25%
c) Local Control Switch 61 sets - 100% 421 106 211 104F/C 90% 379 95 190 94L/C 10% 42 11 21 10
25% 50% 25%d) Level Meter 6 sets - 100% 4,140 1,036 2,070 1,034
Ultrasonic Type 0 to 5m F/C 90% 3,726 932 1,863 931Outdoor Installation L/C 10% 414 104 207 103
25% 50% 25%e) Flow Meter 6 sets - 100% 4,830 1,208 2,416 1,206
Ultrasonic Open Channel Type F/C 90% 4,347 1,087 2,174 1,086Outdoor Installation L/C 10% 483 121 242 120
25% 50% 25%Total (2.2) - 100% 23,651 5,916 11,827 5,908
F/C 90% 21,286 5,323 10,644 5,319L/C 10% 2,365 593 1,183 589
2.3 Removal and Installation25% 50% 25%
Mechanical and Electrical Equipment - 100% 48,568 12,143 24,284 12,141F/C 20% 9,714 2,429 4,857 2,428L/C 80% 38,854 9,714 19427 9,713
2.4Pump House for Secondary Pump25% 50% 25%
Pump House 6 Houses - 100% 26,000 6,500 13,000 6,500W=10.0m L=15.0m H=5.0m F/C 25% 6,500 1,625 3,250 1,625
L/C 75% 19,500 4,875 9750 4,87526% 50% 24%
Total (2) - 100% 198,685 51,457 99,341 47,887F/C 64% 127,920 33,584 63,960 30,376L/C 36% 70,765 17,873 35,381 17,511
3 Sewer and Box Culverta) Branch Sewer
25% 50% 25%North Nazimabad Town DN10 inch L=100,100m - 100% 350,350 87,588 175,175 87,587
F/C 20% 70,070 17,518 35,035 17,517L/C 80% 280,280 70,070 140,140 70,070
25% 50% 25%Gulberg Town DN10 inch L=86,700m - 100% 303,450 75,863 151,725 75,862
F/C 20% 60,690 15,173 30,345 15,172L/C 80% 242,760 60,690 121,380 60,690
25% 50% 25%Liaquatabad Town DN10 inch L=82,500m - 100% 288,750 72,188 144,375 72,187
F/C 20% 57,750 14,438 28,875 14,437L/C 80% 231,000 57,750 115,500 57,750
25% 50% 25%Total (a) L=269,300m - 100% 942,550 235,639 471,275 235,636
F/C 20% 188,510 47,129 94,255 47,126L/C 80% 754,040 188,510 377,020 188,510
b) Trunk Sewer25% 50% 25%
North Nazimabad Town DN12 inch L=3,680m - 100% 33,120 8,280 16,560 8,280F/C 20% 6,624 1,656 3,312 1,656L/C 80% 26,496 6,624 13,248 6,624
25% 50% 25%DN15 inch L=4,570m - 100% 48,442 12,111 24,221 12,110
F/C 20% 9,688 2,422 4,844 2,422L/C 80% 38,754 9,689 19,377 9,688
25% 50% 25%DN18 inch L=2,790m - 100% 35,433 8,859 17,717 8,857
F/C 20% 7,087 1,772 3,544 1,771L/C 80% 28,346 7,087 14,173 7,086
50% 50%DN27 inch L=820m - 100% 14,186 7,094 7,092
F/C 20% 2,837 1,419 1,418L/C 80% 11,349 5,675 5,674
50% 50%DN30 inch L=1,630m - 100% 29,829 14,915 14,914
F/C 20% 5,966 2,983 2,983L/C 80% 23,863 11,932 11,931
50% 50%DN33 inch L=970m - 100% 17,945 8,973 8,972
F/C 20% 3,589 1,795 1,794L/C 80% 14,356 7,178 7,178
50% 50%DN36 inch L=1,080m - 100% 21,168 10,584 10,584
F/C 20% 4,234 2,117 2,117L/C 80% 16,934 8,467 8,467
25% 50% 25%DN42 inch L=2,460m - 100% 88,068 22,018 44,034 22,016
F/C 20% 17,614 4,404 8,807 4,403L/C 80% 70,454 17,614 35,227 17,613
50% 50%DN48 inch L=1,630m - 100% 69,275 34,638 34,637
F/C 20% 13,855 6,928 6,927L/C 80% 55,420 27,710 27,710
50% 50%DN54 inch L=990m - 100% 43,560 21,780 21,780
F/C 20% 8,712 4,356 4,356L/C 80% 34,848 17,424 17,424
35% 50% 15%Total L=20,620m - 100% 401,026 142,158 200,513 58,355
F/C 20% 80,206 28,433 40,103 11,670L/C 80% 320,820 113,725 160,410 46,685
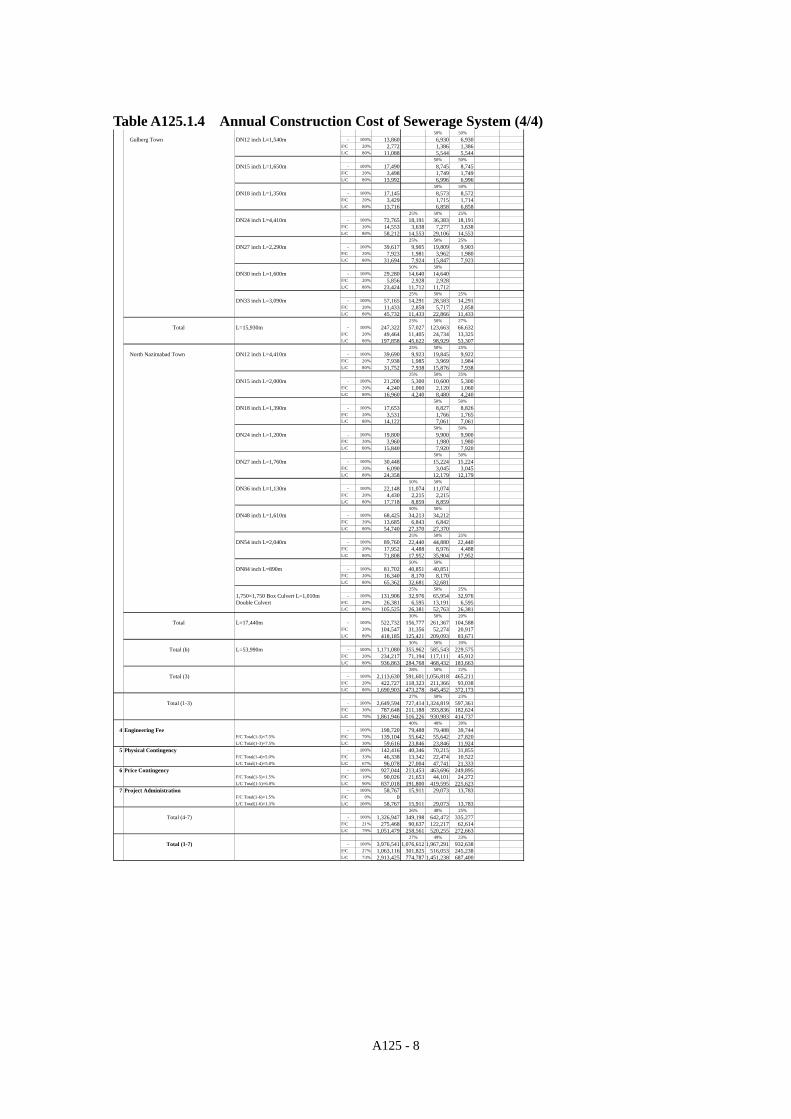
A125 - 8
Table A125.1.4 Annual Construction Cost of Sewerage System (4/4) 50% 50%
Gulberg Town DN12 inch L=1,540m - 100% 13,860 6,930 6,930F/C 20% 2,772 1,386 1,386L/C 80% 11,088 5,544 5,544
50% 50%DN15 inch L=1,650m - 100% 17,490 8,745 8,745
F/C 20% 3,498 1,749 1,749L/C 80% 13,992 6,996 6,996
50% 50%DN18 inch L=1,350m - 100% 17,145 8,573 8,572
F/C 20% 3,429 1,715 1,714L/C 80% 13,716 6,858 6,858
25% 50% 25%DN24 inch L=4,410m - 100% 72,765 18,191 36,383 18,191
F/C 20% 14,553 3,638 7,277 3,638L/C 80% 58,212 14,553 29,106 14,553
25% 50% 25%DN27 inch L=2,290m - 100% 39,617 9,905 19,809 9,903
F/C 20% 7,923 1,981 3,962 1,980L/C 80% 31,694 7,924 15,847 7,923
50% 50%DN30 inch L=1,600m - 100% 29,280 14,640 14,640
F/C 20% 5,856 2,928 2,928L/C 80% 23,424 11,712 11,712
25% 50% 25%DN33 inch L=3,090m - 100% 57,165 14,291 28,583 14,291
F/C 20% 11,433 2,858 5,717 2,858L/C 80% 45,732 11,433 22,866 11,433
23% 50% 27%Total L=15,930m - 100% 247,322 57,027 123,663 66,632
F/C 20% 49,464 11,405 24,734 13,325L/C 80% 197,858 45,622 98,929 53,307
25% 50% 25%North Nazimabad Town DN12 inch L=4,410m - 100% 39,690 9,923 19,845 9,922
F/C 20% 7,938 1,985 3,969 1,984L/C 80% 31,752 7,938 15,876 7,938
25% 50% 25%DN15 inch L=2,000m - 100% 21,200 5,300 10,600 5,300
F/C 20% 4,240 1,060 2,120 1,060L/C 80% 16,960 4,240 8,480 4,240
50% 50%DN18 inch L=1,390m - 100% 17,653 8,827 8,826
F/C 20% 3,531 1,766 1,765L/C 80% 14,122 7,061 7,061
50% 50%DN24 inch L=1,200m - 100% 19,800 9,900 9,900
F/C 20% 3,960 1,980 1,980L/C 80% 15,840 7,920 7,920
50% 50%DN27 inch L=1,760m - 100% 30,448 15,224 15,224
F/C 20% 6,090 3,045 3,045L/C 80% 24,358 12,179 12,179
50% 50%DN36 inch L=1,130m - 100% 22,148 11,074 11,074
F/C 20% 4,430 2,215 2,215L/C 80% 17,718 8,859 8,859
50% 50%DN48 inch L=1,610m - 100% 68,425 34,213 34,212
F/C 20% 13,685 6,843 6,842L/C 80% 54,740 27,370 27,370
25% 50% 25%DN54 inch L=2,040m - 100% 89,760 22,440 44,880 22,440
F/C 20% 17,952 4,488 8,976 4,488L/C 80% 71,808 17,952 35,904 17,952
50% 50%DN84 inch L=890m - 100% 81,702 40,851 40,851
F/C 20% 16,340 8,170 8,170L/C 80% 65,362 32,681 32,681
25% 50% 25%1,750×1,750 Box Culvert L=1,010m - 100% 131,906 32,976 65,954 32,976Double Culvert F/C 20% 26,381 6,595 13,191 6,595
L/C 80% 105,525 26,381 52,763 26,38130% 50% 20%
Total L=17,440m - 100% 522,732 156,777 261,367 104,588F/C 20% 104,547 31,356 52,274 20,917L/C 80% 418,185 125,421 209,093 83,671
30% 50% 20%Total (b) L=53,990m - 100% 1,171,080 355,962 585,543 229,575
F/C 20% 234,217 71,194 117,111 45,912L/C 80% 936,863 284,768 468,432 183,663
28% 50% 22%Total (3) - 100% 2,113,630 591,601 1,056,818 465,211
F/C 20% 422,727 118,323 211,366 93,038L/C 80% 1,690,903 473,278 845,452 372,173
27% 50% 23%Total (1-3) - 100% 2,649,594 727,414 1,324,819 597,361
F/C 30% 787,648 211,188 393,836 182,624L/C 70% 1,861,946 516,226 930,983 414,737
40% 40% 20%4 Engineering Fee - 100% 198,720 79,488 79,488 39,744
F/C Total(1-3)×7.5% F/C 70% 139,104 55,642 55,642 27,820L/C Total(1-3)×7.5% L/C 30% 59,616 23,846 23,846 11,924
5 Physical Contingency - 100% 142,416 40,346 70,215 31,855F/C Total(1-4)×5.0% F/C 33% 46,338 13,342 22,474 10,522L/C Total(1-4)×5.0% L/C 67% 96,078 27,004 47,741 21,333
6 Price Contingency - 100% 927,044 213,453 463,696 249,895F/C Total(1-5)×1.5% F/C 10% 90,026 21,653 44,101 24,272L/C Total(1-5)×6.0% L/C 90% 837,018 191,800 419,595 225,623
7 Project Administration - 100% 58,767 15,911 29,073 13,783F/C Total(1-6)×1.5% F/C 0% 0L/C Total(1-6)×1.5% L/C 100% 58,767 15,911 29,073 13,783
26% 48% 25%Total (4-7) - 100% 1,326,947 349,198 642,472 335,277
F/C 21% 275,468 90,637 122,217 62,614L/C 79% 1,051,479 258,561 520,255 272,663
27% 49% 23%Total (1-7) - 100% 3,976,541 1,076,612 1,967,291 932,638
F/C 27% 1,063,116 301,825 516,053 245,238L/C 73% 2,913,425 774,787 1,451,238 687,400
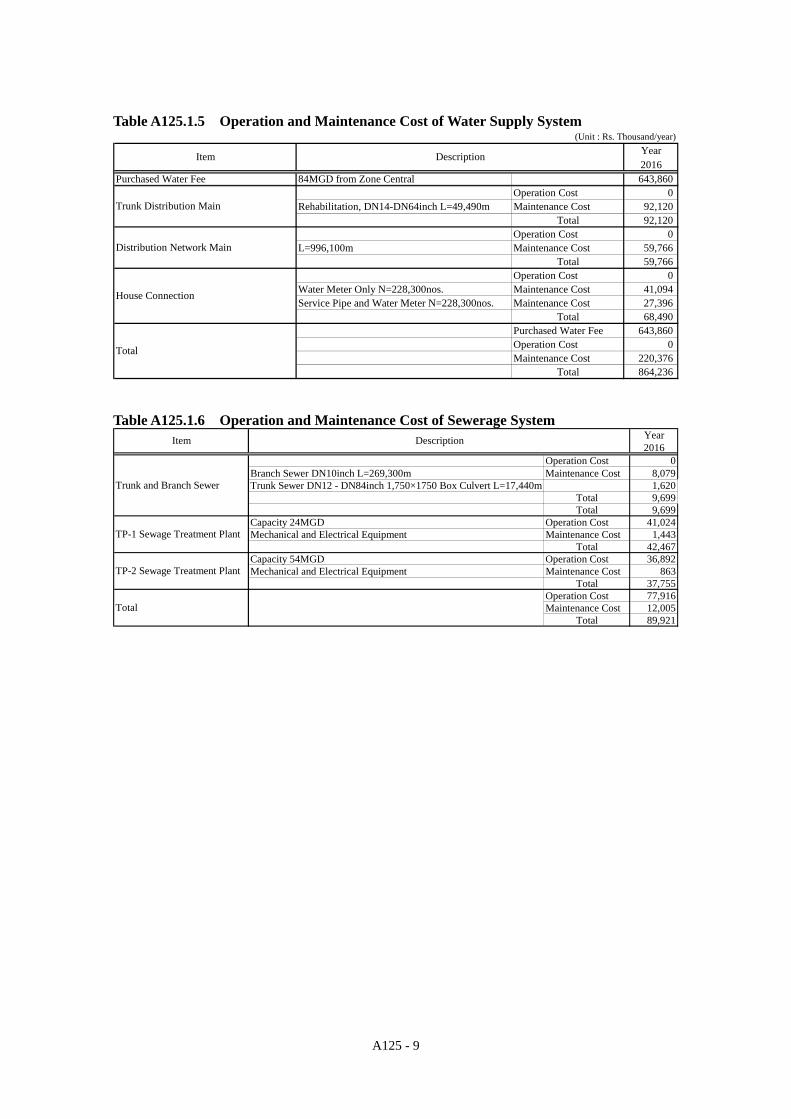
A125 - 9
Table A125.1.5 Operation and Maintenance Cost of Water Supply System (Unit : Rs. Thousand/year)
Year2016
Purchased Water Fee 84MGD from Zone Central 643,860Operation Cost 0
Rehabilitation, DN14-DN64inch L=49,490m Maintenance Cost 92,120Total 92,120
Operation Cost 0L=996,100m Maintenance Cost 59,766
Total 59,766Operation Cost 0
Water Meter Only N=228,300nos. Maintenance Cost 41,094Service Pipe and Water Meter N=228,300nos. Maintenance Cost 27,396
Total 68,490Purchased Water Fee 643,860Operation Cost 0Maintenance Cost 220,376
Total 864,236
House Connection
Total
DescriptionItem
Trunk Distribution Main
Distribution Network Main
Table A125.1.6 Operation and Maintenance Cost of Sewerage System
Year2016
Operation Cost 0Branch Sewer DN10inch L=269,300m Maintenance Cost 8,079Trunk Sewer DN12 - DN84inch 1,750×1750 Box Culvert L=17,440m 1,620
Total 9,699Total 9,699
Capacity 24MGD Operation Cost 41,024Mechanical and Electrical Equipment Maintenance Cost 1,443
Total 42,467Capacity 54MGD Operation Cost 36,892Mechanical and Electrical Equipment Maintenance Cost 863
Total 37,755Operation Cost 77,916Maintenance Cost 12,005
Total 89,921Total
Trunk and Branch Sewer
Item Description
TP-1 Sewage Treatment Plant
TP-2 Sewage Treatment Plant

APPENDIX – A125.2
Sewer Cleaning Cost

A125 - 10
A125.2 Sewer Cleaning Cost Total sewer length 1000 kmPercentage of sewer to mechanically clean 20 %Length of sewer to mechanically clean 200 kmPercentage of sewer to manually clean 80 %Length of sewer to manually clean 800 km
(1) Length of sewer to mechanically clean 200 km Frequency of cleaning 0.2 time/yearLength to clean every year 40 km/yearLength to clean per machine per day 100 m/machine/dayWorking days per week 5 daysWorking days per year 260 daysRequired machine on duty 2 unitsStandby machine 1.0 unitTotal 3 unitsNumber of personnel for each machine 6 persons/unitNumber of personnel required 18 personsUnit salary per person 392,000 Rs./person/year
(weighted average of one Rank-2 and two Rank-3)Personnel cost per year 7,056,000 Rs./yearTotal cost per year 10,080,000 Rs./year
(personnel cost accounts for 70% of the total)
(2) Length of sewer to manually clean 800 km Frequency of cleaning 0.2 time/yearLength to clean every year 160 km/yearWorking days per week 5 daysWorking days per year 260 daysCleaned sewer by one party per day 70 m/party/dayNumber of personnel per party 5 persons-partyNumber of party required 9 partiesNumber of personnel required 45 personsUnit salary per person 392,000 Rs./person/year
(weighted average of one Rank-2 and two Rank-3)Personnel cost per year 17,640,000 Rs./yearTotal cost per year 19,600,000 Rs./year
(personnel cost accounts for 90% of the total)
(3) Total cost for cleaning of trunk/branch sewers in a year29,680,000 Rs/year
(4) Unit cost for cleaning sewers per km per year30 Rs./m/year
Conclusion 30 Rs./m/year
APPENDIX – A126.1
Environmental Impact Assessment
Report (Draft) for the Priority Project of the Study on Water Supply and Sewerage System
in Karachi in the Islamic Republic of Pakistan

A126 - 1
A126.1 Environmental Impact Assessment Report (Draft) for the Priority Project of the Study on Water Supply and Sewerage System in Karachi in the Islamic Republic of Pakistan
Table of Contents CHAPTER 1 INTRODUCTION 1.1 Objective of the Environmental Impact Assessment Study 1.2 Background CHAPTER 2 LEGAL AND ADMINISTRATIVE FRAMEWORK 2.1 Legal and Administrative Framework 2.2 Environmental Protection Standards CHAPTER 3 PROJECT DESCRIPTION 3.1 Components of the Master Plan 3.2 Components of the Priority Project 3.3 Justification of the Priority Project CHAPTER 4 BASELINE OF ENVIRONMENTAL DATA 4.1 Physical Environment 4.2 Biological Environment 4.3 Socio-cultural Environmental CHAPTER 5 IMPACT IDENTIFICATION AND MITIGATION MEASURES 5.1 Overall Impact Identification 5.2 Impact Identification and Mitigation Measures CHAPTER 6 ENVIRONMENTAL MANAGEMENT PLAN 6.1 Risk Analysis and Mitigation Plan 6.2 Monitoring Plan CHAPTER 7 PUBLIC CONSULTATION CHAPTER 8 CONCLUSION

A126 - 2
Chapter 1 Introduction 1.1 OBJECTIVE OF THE ENVIRONMENTAL IMPACT ASSESSMENT
STUDY The purpose of the Environmental Impact Assessment (EIA) is to ensure that development options under consideration are environmentally and socially sound and sustainable and that the environmental consequences of the project are recognized early and taken into account in the project design. The procedure should follow the Pakistan Laws, and JICA’s Guidelines for Environmental and Social Considerations are also taken into account. The major objective of this study is to establish present environmental and social conditions of the project area through available data / information to predict the impacts on relevant environmental and social attributes due to the construction and operation of the proposed water supply system and sewerage system, to suggest appropriate and adequate mitigation measures to minimise / reduce adverse impacts and to prepare an environmental impact assessment report. This study has been carried out on the priority project in Karachi city. 1.2 BACKGROUND The JICA Study Team is assisting the KW&SB to consider the environmental and social aspects of this study. The role of the JICA Study Team is to: Help the KW&SB implement the proper environmental and social considerations, Prepare an effective Master Plan and select priority project which will not cause significant negative environmental or social impacts. Assist the KW&SB to consult with stakeholders when preparing the Master Plan and conducting the Feasibility Study to foster support for the projects. Ensure the positive information disclosure for accountability and promotion of participation of various stakeholders. From the above situation, the EIA Study concerning the priority project shall be carried out in this Study. However, EIA Study done in this study is taken as EIA Study (Draft) for the following reasons. Stakeholder Meetings In this JICA Study, three stakeholder meetings (in the early Study stage, the Master Plan stage and the Feasibility stage) were planned in consideration of implementation of EIA Study. If it is under ordinary circumstances, the broad opinion acquired in stakeholder meetings is reflected into the priority project plan. Consequently, the priority project can be formulated with more residents’ involvement. The first stakeholder meeting was held in September 2006. The second stakeholder meeting was proposed to be held at the end of the Master Plan stage to inform of contents of the Master Plan and result of environmental and social considerations in the Master Plan to the stakeholders. JICA discussed the holding of second stakeholder meeting with KW&SB as the KW&SB should take necessary steps to organise the meeting. As the K-IV project and S-3 Project, the former is under PC-1 process and the latter is under pre-qualification stage of consultants, are included in the M/P, KW&SB was reluctant to disclose the information to the public at this stage. Therefore, the stakeholder meeting to inform of the contents of the Master Plan and results of environmental and social considerations was not held. By postponing the 2nd stakeholder meeting, 3rd meeting is not held yet. Land Acquisition There are some components with land acquisition in the priority project. However, actual location of land to acquire is not determined yet.

A126 - 3
The above-mentioned two items are very important when implementing the priority project. Since these items are not determined at present, the EIA Study in this study may not include all the required items. As mentioned above, EIA has to carry out by the time of project implementation. Prior to EIA report preparation, necessary land has to be acquired and stakeholder meetings have to be held. Chapter 2 Legal and Administrative Framework 2.1 LEGAL AND ADMINISTRATIVE FRAMEWORK (1) Laws and Regulations The major laws and regulations relative to the environmental and social consideration are as listed below: a. Pakistan Environmental Protection Ordinance, 1983 The Ordinance for the first time established the Pakistan Environmental Protection Council and the Federal and Provincial Environmental Protection agencies. It also pioneered in the Pakistan, the requirement of preparing Environmental Impact Assessment (EIA) reports. b. Pakistan Environmental Protection Act (PEPA) 1997 The Pakistan Environmental Protection Act 1997 is the most important environmental legislative instrument in Pakistan. This Act aims to provide for the protection, conservation, rehabilitation and improvement of the environment, for the prevention and control of pollution and promotion of sustainable development. (2) Administrative Framework a. Pakistan Environmental Protection Council (PEPC) PEPC was established in 1984 by Pakistan Environmental Protection Ordinance, 1983, headed by Prime Minister and one of the members is Minister of Environment. Its main roles are: Co-ordinate and supervise enforcement of the provision of Pakistan Environmental Protection
act, Approve comprehensive national environmental policies and ensure their implementation, Approve the National Environmental Quality Standards. b. Pakistan Environmental Protection Agency (PEPA) PEPA exist under the PEPC. PEPA is the regulatory institution entrusted with the functions of administering and enforcing the Act and its rules and regulations. These include: Take all necessary measures for the implementation of the national environmental policies, Ensure the enforcement of the National Environmental Quality Standards, Establish standards for the quality of environment, Establish systems and procedures for survey, surveillance, monitoring, measurement,
examination, investigation, research, inspection and audit to prevent and control pollution. c. Environmental Protection Agency of Government Sindh (SEPA) In each province, Provincial Environmental Protection Agency (Provincial-EPA) is established, and Provincial-EPA is independent agency from Ministry of Environment and PEPA. Many of the federal agency’s functions and powers have already been delegated to the Provincial-EPAs. The main functions are advising & coordinating with government, semi-government organizations, industries, NGOs, and various development agencies on preventive measures for abatement of pollution.
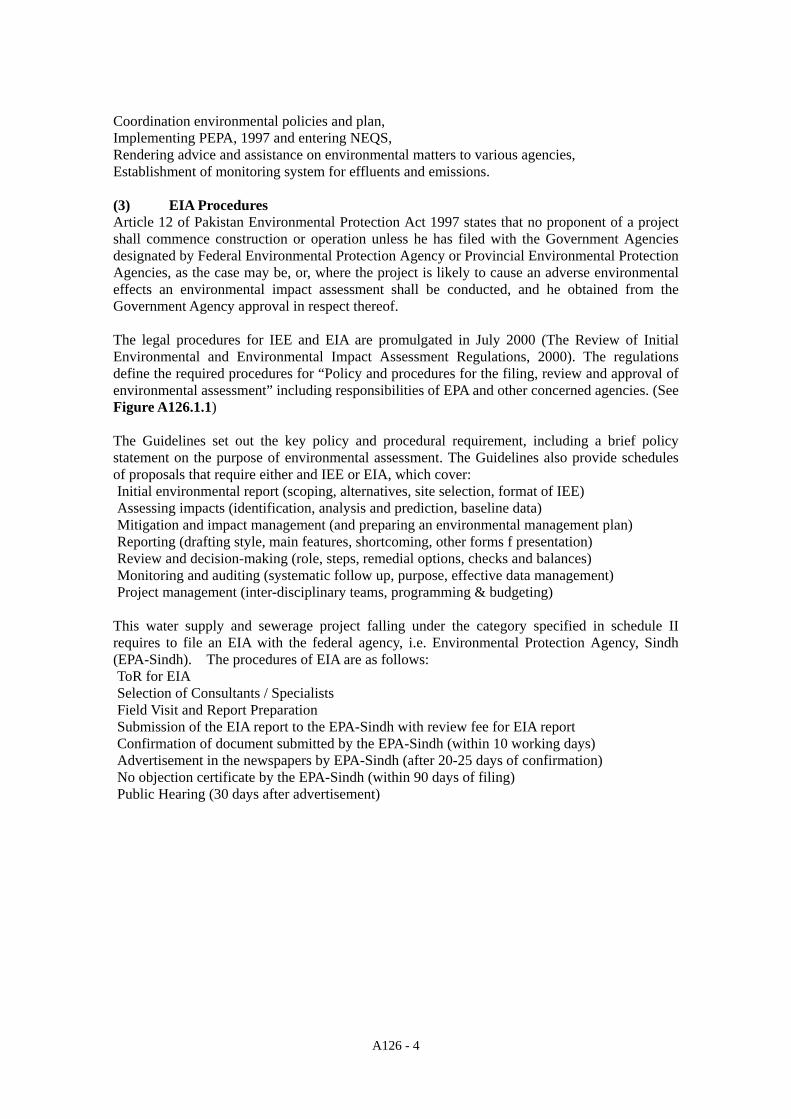
A126 - 4
Coordination environmental policies and plan, Implementing PEPA, 1997 and entering NEQS, Rendering advice and assistance on environmental matters to various agencies, Establishment of monitoring system for effluents and emissions. (3) EIA Procedures Article 12 of Pakistan Environmental Protection Act 1997 states that no proponent of a project shall commence construction or operation unless he has filed with the Government Agencies designated by Federal Environmental Protection Agency or Provincial Environmental Protection Agencies, as the case may be, or, where the project is likely to cause an adverse environmental effects an environmental impact assessment shall be conducted, and he obtained from the Government Agency approval in respect thereof. The legal procedures for IEE and EIA are promulgated in July 2000 (The Review of Initial Environmental and Environmental Impact Assessment Regulations, 2000). The regulations define the required procedures for “Policy and procedures for the filing, review and approval of environmental assessment” including responsibilities of EPA and other concerned agencies. (See Figure A126.1.1) The Guidelines set out the key policy and procedural requirement, including a brief policy statement on the purpose of environmental assessment. The Guidelines also provide schedules of proposals that require either and IEE or EIA, which cover: Initial environmental report (scoping, alternatives, site selection, format of IEE) Assessing impacts (identification, analysis and prediction, baseline data) Mitigation and impact management (and preparing an environmental management plan) Reporting (drafting style, main features, shortcoming, other forms f presentation) Review and decision-making (role, steps, remedial options, checks and balances) Monitoring and auditing (systematic follow up, purpose, effective data management) Project management (inter-disciplinary teams, programming & budgeting)
This water supply and sewerage project falling under the category specified in schedule II requires to file an EIA with the federal agency, i.e. Environmental Protection Agency, Sindh (EPA-Sindh). The procedures of EIA are as follows: ToR for EIA Selection of Consultants / Specialists Field Visit and Report Preparation Submission of the EIA report to the EPA-Sindh with review fee for EIA report Confirmation of document submitted by the EPA-Sindh (within 10 working days) Advertisement in the newspapers by EPA-Sindh (after 20-25 days of confirmation) No objection certificate by the EPA-Sindh (within 90 days of filing) Public Hearing (30 days after advertisement)
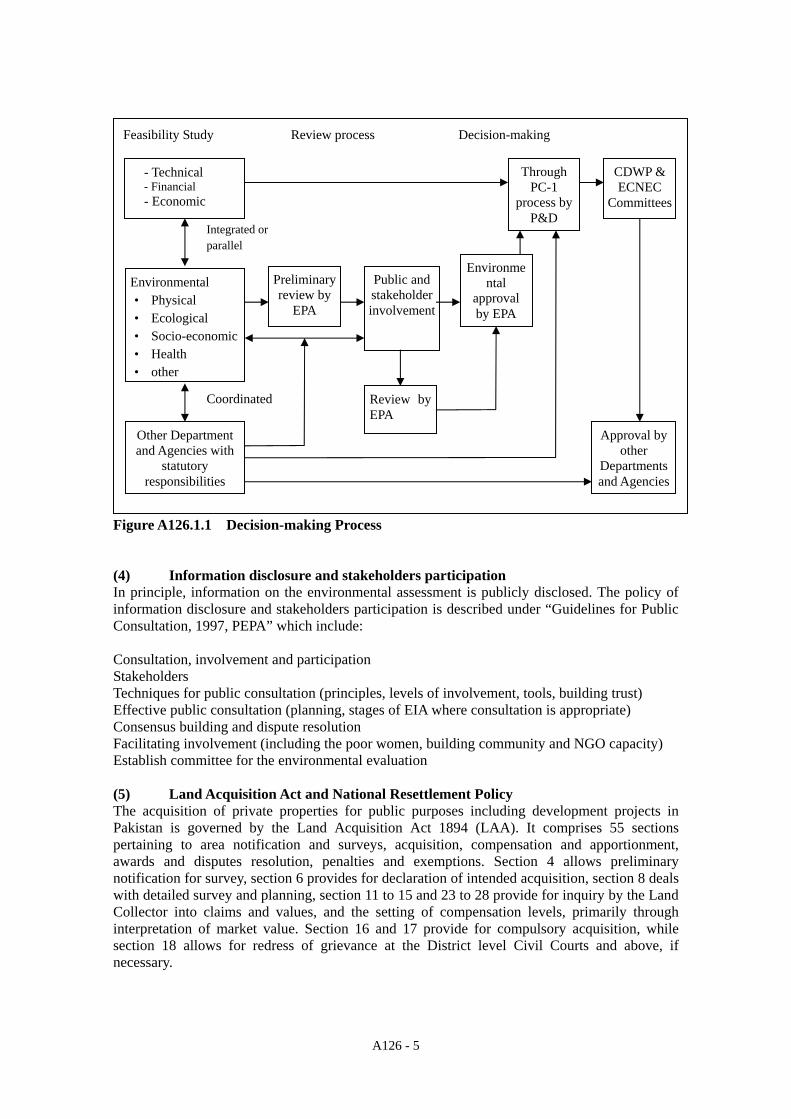
A126 - 5
Figure A126.1.1 Decision-making Process (4) Information disclosure and stakeholders participation In principle, information on the environmental assessment is publicly disclosed. The policy of information disclosure and stakeholders participation is described under “Guidelines for Public Consultation, 1997, PEPA” which include: Consultation, involvement and participation Stakeholders Techniques for public consultation (principles, levels of involvement, tools, building trust) Effective public consultation (planning, stages of EIA where consultation is appropriate) Consensus building and dispute resolution Facilitating involvement (including the poor women, building community and NGO capacity) Establish committee for the environmental evaluation (5) Land Acquisition Act and National Resettlement Policy The acquisition of private properties for public purposes including development projects in Pakistan is governed by the Land Acquisition Act 1894 (LAA). It comprises 55 sections pertaining to area notification and surveys, acquisition, compensation and apportionment, awards and disputes resolution, penalties and exemptions. Section 4 allows preliminary notification for survey, section 6 provides for declaration of intended acquisition, section 8 deals with detailed survey and planning, section 11 to 15 and 23 to 28 provide for inquiry by the Land Collector into claims and values, and the setting of compensation levels, primarily through interpretation of market value. Section 16 and 17 provide for compulsory acquisition, while section 18 allows for redress of grievance at the District level Civil Courts and above, if necessary.
Feasibility Study Review process Decision-making
Environmental • Physical • Ecological • Socio-economic• Health • other
Other Department and Agencies with
statutory responsibilities
Integrated or parallel
Coordinated
Public and stakeholder involvement
Environmental
approval by EPA
Preliminary review by
EPA
CDWP & ECNEC
Committees
Through PC-1
process by P&D
Approval by other
Departments and Agencies
Review by EPA
- Technical - Financial - Economic

A126 - 6
In determining the amount of compensation shall take into consideration (i) the market value of the land at the date of the publication of the notification, (ii) the damage sustained by the taking of any standing crops or trees, (iii) the damage sustained by severing the land from his other land, (iv) the damage sustained by reason of the acquisition injuriously affecting his other property, moveable or immoveable in any other manner, or his earning, (v) if the person is compelled to change his residence or place of business in consequence of the acquisition of the land, the reasonable expenses incidental to such change, (vi) the damage resulting from diminution of the profits of the land between the time of the publication of the declaration and the time of the possession of the land. In addition to the market value of the land as above provided, the sum of fifteen percent on market value shall be awarded in consideration of the compulsory nature of the acquisition. LAA has been the most commonly used law for acquisition of land and other properties for development projects. Although it lays down detailed procedures for the acquisition of private properties for public purposes and their compensation, the LAA dose not cover resettlement and rehabilitation of persons. Therefore, National Resettlement Policy has formulated in 2002 to ensure an equitable and uniform treatment of resettlement issues all over Pakistan. This Policy is applied to all development projects involving adverse social impacts, including land acquisition, loss of assets, income, business etc. The Policy also aims to compensate for the loss of income to those who suffer due to loss of communal property including common assets, productive assets, structures, other fixed assets, income and employment, loss of community networks and services, pasture, water rights, public infrastructure like mosques, shrines, schools, graveyards etc. The objectives of the Policy are: Avoid or minimize adverse social impacts in a project wherever possible and where adverse
impacts cannot be avoided, the mitigation measures and resettlement activities should be conceived and executed as development programs and the affected persons be provided opportunity to share the project benefits,
Project affected persons be provided with sufficient compensation and assistance for lost assets, that will assist them to improve or at least restore their living standards, income earning or production capacity to the pre-project levels,
Provide a development opportunity to all vulnerable groups. The vulnerable population should receive special assistance to bring them at least to a minimum living standard at per with the pre-project level,
All population adversely affected by the project should be eligible for sharing the social and economic benefits, envisaged after completion of the project.
(6) Others Other laws and regulations which may be related to the environment are: Air Quality: Statutory Notification S.R.R.742 (1993) Noise: The Motor Vehicle Ordinance (1965) and Rules (1965) Toxic or Hazardous Substances: The Agricultural Pesticides Ordinance (1971) and Rules (1973) 2.2 ENVIRONMENTAL PROTECTION STANDARDS (1) Drinking Water Quality Standards The Pakistan Council for Research in Water Resource (PCRWR) and Pakistan Standard Institution (PSI) have already drafted Drinking Water Quality Standards at national level. However, the enforcement of these standards is still pending and not approved yet. At present, KW&SB does not have its own water quality standards for drinking water. WHO guidelines for drinking water are adopted as desired value of water filtration processes. (See Table A126.1)

A126 - 7
Table A126.1.1 WHO Guidelines
A. Bacteriological Qualities Source/Organisms Guideline Value
a. All water intended for drinking (E. Coli or thermo tolerant coliform bacteria)
Must not be detectable in any 100 ml sample
b. treated water entering the distribution system (E. coli or thermo tolerant coliform and total coliform bacteria)
Must not be detectable in any 100 ml sample
c. Treated water in the distribution system (E. Coli or thermo tolerant coliform and total coliform bacteria)
In the case of large supplies, where sufficient samples are examined, must not be present in 95 % of samples taken throughout any 12-month period.
B. Chemicals of Health Significance Inorganic mg/l Inorganic mg/l Inorganic mg/l Antimony 0.005 Copper 2.000 Molybdenum 0.070 Arsenic 0.010 Cyanide 0.070 Nickel 0.020 Barium 0.7000 Fluoride 1.500 Nitrate (NO3) 50.00 Boron 0.300 Lead 0.010 Nitrite (NO2) 3.00 Cadmium 0.003 Manganese 0.500 Selenium 0.010 Chromium 0.050 Mercury 0.001 C. Other Parameters Colour 15 TCU 1,2 dichlorobenzene 1-10 Hardness, pH - Taste, odour - 1,4-dichlorobenzen 0.3-30 DO 0.05Turbidity 5 NTU Dichlorobenzen 5-50 Hydrogen 0.3 Toluene 24-170 Synthetic - Sulfide 0.1 Xylenes 20-1800 Detergents 0.2 Hydrogen 0.3 Ethyl-benzene 2.4-200 Aluminum 1.5 Manganese 250 Styrene 4-2600 Ammonia 250 Sodium 1000 Monochrolobenzen 10-120 Chloride
Copper 1 Sulfate
TDS Zinc
3
D. Disinfectants and Disinfectant by-Products Chlorine chlorophenol 600-1000 2,4,6-trichlorophenol 2-300 2,4-dichlorophenol 0.3-40 2-chlorophenol 0.1-10
(2) Effluent Standards National Environmental Quality Standards for Municipal and Liquid Industrial Effluent is as below. (See Table 126.1.2)

A126 - 8
Table A126.1.2 Naional Environmental Quality Standards for Municipal and Liquid Industrial Effluent
S. No. Parameter Into inland water Into sewage
treatment1 Into sea2
1. Temperature =< 3� =< 3� =< 3� 2. PH value 6-9 pH 6-9 pH 6-9 pH 3. 5-days BOD1 at 20� 80 mg/l 250 mg/l 80 mg/l 4. COD 150 mg/l 400 mg/l 400 mg/l 5. Total suspended solids 200 mg/l 400 mg/l 200 mg/l 6. Total dissolved solids 3500 mg/l 3500 mg/l 3500 mg/l 7. Grease and oil 10 mg/l 10 mg/l 10 mg/l 8. Phenolic compounds 0.1 mg/l 0.3 mg/l 0.3 mg/l 9. Chroride (as Cl) 1000 mg/l 1000 mg/l SC 10. Fluoride (as F) 10 mg/l 10 mg/l 10 mg/l 11. Cynide (as CN) total 1.0 mg/l 1.0 mg/l 1.0 mg/l 12. An-ionic detergents(as MBAS) 20 mg/l 20 mg/l 20 mg/l 13. Sulphate (SO4) 600 mg/l 1000 mg/l SC 14. Sulphide (S) 1.0 mg/l 1.0 mg/l 1.0 mg/l 15. Ammonia (NH3) 40 mg/l 40 mg/l 40 mg/l 16. Pesticides, herbicides, fungicides and
insecticides 0.15 mg/l 0.15 mg/l 0.15 mg/l
17. Cadmium 0.1 mg/l 0.1 mg/l 0.1 mg/l 18. Chromium (trivalent and hexavalent) 1.0 mg/l 1.0 mg/l 1.0 mg/l 19. Copper 1.0 mg/l 1.0 mg/l 1.0 mg/l 20. Lead 0.5 mg/l 0.5 mg/l 0.5 mg/l 21. Mercury 0.01 mg/l 0.01 mg/l 0.01 mg/l 22. Selenium 0.5 mg/l 0.5 mg/l 0.5 mg/l 23. Nickel 1.0 mg/l 1.0 mg/l 1.0 mg/l 24. Silver 1.0 mg/l 1.0 mg/l 1.0 mg/l 25. Total toxic metals 2.0 mg/l 2.0 mg/l 2.0 mg/l 26. Zinc 5.0 mg/l 5.0 mg/l 5.0 mg/l 27. Arsenic 1.0 mg/l 1.0 mg/l 1.0 mg/l 28. Barium 1.5 mg/l 1.5 mg/l 1.5 mg/l 29. Iron 8.0 mg/l 8.0 mg/l 8.0 mg/l 30. Manganese 1.5 mg/l 1.5 mg/l 1.5 mg/l 31. Boron 6.0 mg/l 6.0 mg/l 6.0 mg/l 32. Chlorine 1.0 mg/l 1.0 mg/l 1.0 mg/l
1: Applicable only when and where sewage treatment is operational and BOD=80 mg/l is achieved by the sewage treatment
system. 2: Provided discharge is not at shore and not within 10 miles of mangrove or other important estuaries

A126 - 9
Chapter 3 Project Description 3.1 COMPONENTS OF THE MASTER PLAN (1) Water Supply System The following tables show the components of the Master Plan for the Karachi water supply system. (See Table 162.1.3 and Table 162.1.4) The proposed facilities of upper 3 lines of the Table 162.1.3 (bulk water canal/conduit, bulk pumping station, filtration plant) are proposed by KW&SB as K-IV project, Greater Karachi Water Supply Scheme (Executive Summary, May 2007). Table 162.1.3 Components of Bulk Water Supply System
Facility Proposed Rehabilitation/ Replacement
Bulk Water Canal/Conduit 780 mgd 620 mgd Bulk Pumping Station 6 P/Ss 15 P/Ss Filtration Plant 5 F/Ps : 835 mgd 6 F/Ps: 435mgd Transmission Pumping Station 7 P/Ss 2 P/Ss Transmission Main 129 km 17 km
Distribution Reservoir 8 nos. 6 nos. (8 nos.)
Distribution Pumping Station 3 P/Ss - Note: The proposed facilities in upper 3 lines are proposed by KW&SB as K-IV project, Greater Karachi Water Supply
Scheme (Executive Summary, May 2007) Number in parenthesis is expansion of capacity
Table 162.1.4 Components of Retail Water Supply System
Proposed Rehabilitation/ Replacement Facility Zone West Central East Total West Central East Total Trunk Distribution Main (km) 406 364 152 922 273 259 153 685
Distribution Network Main (km) 2,539 3,152 2,349 8,041 3,751 4,208 1,220 9,179
by DNI - - - - 2,578 3,069 681 6,329 by other than DNI - - - - 1,173 1,139 539 2,850
House Connection (×1,000) 454 564 420 1,438 1,119 900 378 2,398
by DNI - - - 553 784 283 1,620 by other than DNI - - - 566 116 95 778
(2) Sewerage System The proposed sewerage system in 2025 is shown in the table below. (See Table 162.1.5)

A126 - 10
Table 162.1.5 Proposed Sewerage System in 2025
TP-1
(extension) TP-3
(existing) TP-2
(extension) TP-4 (new)
District area (km2) 145.3 100.4 340.2
Population 8,849,000 5,013,000 11,720,000 Branch Sewer Length (km) 3,300 2,120 5,230
Trunk Sewer Length (km) 46 48 121
Number of main Pumping Station 2 (Jamila, Chakiwara) 2 (Gulberg, Clifton) 3 (Korangi, Bin
Qasim, Karachi Port)
Location of TP SITE Ttown Keamari Town Jamshed Town Korangi Creek Cantonment
TP Site area (ha) 49 221 49 168 Capacity
(m3/d) (mgd)
500,000 (110)
245,000 (54)
490,000 (108)
1,290,000 (284)
Influent BOD (mg/l) 600 600 600 600
Effulent BOD (mg/l) 80 80 80 80
Sewage Treatment
Process UASB + HRTF Wastewater
stabilization pond UASB + HRTF UASB + HRTF
Sludge Treatment Facilities GT + MD DB GT + MD GT + DB /+ MD
Treated Sewage Discharge Point Lyari River Arabian sea (swamp
area of Karachi Bay) Malir River Malir River
Note: UASB for upflow anaerobic sludge blanket, HRTF for high rate trickling filter, GT for gravity thickening, DB for drying bed, MD for Mechanical dewatering,
3.2 COMPONENTS OF THE PRIORITY PROJECT The priority project selected three towns of North Nazimabad, Gulberg and Liaquatabad Towns in western zone of Karachi City to improve water supply and sewerage system from the Master Plan, and the priority project consists of water supply and sewerage systems. Components of the priority project for water supply system are expansion of reservoir and improvement of distribution network. Components of sewerage system consist of collection / conveyance network implementation and replacement of equipment in the two associated sewage treatment plants. Components of the priority project are shown in Table 126.1.5.

A126 - 11
Table 126.1.6 Components of the Priority Project Components Quantity
Expansion of reservoir (NEK old reservoir)
Capacity (million gallons)
30
Rehabilitation of Trunk Distribution Mains Pipe length (m): Diameter (inch):
25,990 16 - 100
Installation of Trunk Distribution Mains Pipe length (m): Diameter (inch):
49,490 14 - 64
Installation of Flow Mete Flow mete (nos) 17 Rehabilitation of Distribution Network Mains
Pipe length (m) North Nazimabad Town: Gulberg Town: Liaquatabad Town: Total
336,600 374,900 284,600 996,100
Wat
er S
uppl
y Sy
stem
Improvements to House Connections Water meter only North Nazimabad Town: Gulberg Town: Liaquatabad Town: Total Water meter and service pipe
North Nazimabad Town: Gulberg Town: Liaquatabad Town: Total
8,800 9,200 2,100
20,100
68,600 71,500 68,100
208,200 Rehabilitation of Collection & Trunk Sewers Pipe length (m):
Pipe diameter (inch): Box culvert (mm)
36,570 15 – 84
1,750 × 1,750 Rehabilitation of Sewage Treatment Plant (TP-1)
Pumps and other equipment
-
Sew
erag
e Sy
stem
Rehabilitation of Sewage Treatment Plant (TP-3)
Pumps and other equipment -
3.3 JUSTIFICATION OF THE PRIORITY PROJECT Since the priority project is a part of the Master Plan, there is no alternative study about the priority project itself. The alternative study of the Master Plan is summarized below. (1) Analysis of Alternatives (Master Plan, Water Supply System) a. Project Benefits and Positive Impacts The main objectives of the water supply project are to improve the living condition, public health, standards of living and to encourage economic growth. Therefore, the project is expected to have the following benefits and positive impacts. Expanded water supply service areas, Increased amount of water distribution and continuous water supply, Improvement of water quality supplied, Reduced non-revenue water including water leakage, Increased economic activities (such as commercial and industrial), improved employment
opportunities, and economic growth, Improvements to public health which will then result in higher economic activity and
productivity, Increased local employment opportunities during the construction phase of the project, either as
direct labor for construction or as provide services at the construction sites. b. With/Without Project With the project, the benefits and positive impacts mentioned above will be expected. If the project is not implemented, the situation could be as follows.

A126 - 12
Severe water shortage will be happen as the population in Karachi City is increasing in future, The leakage rate will remain high and the big amount of water will be wasted, The public health condition will become worse due to water shortage. c. Alternative of Water Source The alternatives of water sources are rivers, groundwater, desalination and reuse of treated effluent. There is very little and irregular precipitation in Karachi, it is therefore very difficult to use local surface water as a source of water supply in Karachi. The Karachi District area comprises four basin areas, namely Malir River Basin, Gadap Basin, Lyari River Basin, and Hub River Basin. The groundwater exists in these basins and the aquifer is available in different depths of different strata. The groundwater is recharged manly by precipitation which falls in the watershed area of the basins. Since the major streams and nallahs are ephemeral in natures, most of the precipitation is lost through surface runoff. The request for additional 1,200 cuses intake from the Indus River is already made by CDGK and KW&SB to Federal government and this will be most possible new water sources for Karachi water supply. Desalination can be an option to obtain another water source, but its cost is huge. One desalination plant (3 mgd = 13,500 m3/d) is under construction by DHA. The conclusion still remains effective even at present and most likely it will continue to remain valid in foreseeable future. The treated effluent from TP-3 and Pakistan Still Mill treatment plant is used as plant watering and sprinkle water to golf course. The effluent with BOD5 80 mg/l, which is the effluent standards of Pakistan, is not appropriate to use as water sources. d. Alternative for Water Transmission System In M/P, it is proposed to divide Karachi into three hydraulic zones each separated from the others by two major rivers i.e. Malir and Lyari Rivers. Within each zone, the alternatives for water transmission system are discussed. In each zone, three alternatives of distribution system are compared in terms of cost and difficulty in operation. (2) Analysis of Alternatives (Master Plan, Sewerage System) a. Project Benefits and Positive Impacts The main objectives of the sewerage project are to improve the living environment, public health and hygiene, standards of living and to encourage economic growth. Therefore, the project is expected to have the following benefits and positive impacts. Improvement of the water quality of the rivers/sea by collection and treatment of sewage prior
to its discharge to river/sea and improvement of the river/coastal water environment, Reduced risks of diseases by a proper collection, treatment and disposal of sewage, and
enhancement of the human health, Improvement of sanitation conditions in the cities, Increased economic activities (such as commercial and industrial), improved employment
opportunities, and economic growth, Improvements to public health which will then result in higher economic activity and
productivity, Increased local employment opportunities during the construction and O/M phases of the
project, either as direct labor for construction and O/M stages or as provided services at the sites.

A126 - 13
b. With/Without Project With the project, the benefits and positive impacts mentioned above will be expected. If the project is not implemented, the situation could be as follows. Untreated sewage will continuously contaminate receiving bodies such as nallah, rivers and sea, The public health condition will become worse due to continuous drain and river water
contamination and the health risk will be increased, The sea/coastal water environment will get worse. c. Alternative Study for Sewerage System The three alternatives for sewerage system are studied from technical, economic, environmental and social viewpoints. Alternative 1 has technical advantage of adoption of energy saving process but the river crossing of the trunk sewer is necessary. Alternative 2 has the advantage that no river crossing of the sewer is necessary but more efficient process which requires higher energy consumption and sophisticated operation skills should be adopted and cost for construction and O&M becomes higher. Alternative 3 requires additional land acquisition for TP-5 (75 ha). Comparing 3 alternatives, it is concluded that alternative 1 is recommended from technical, economical, environmental and social viewpoints. (3) Justification of the Priority Project If the priority project is not implemented, the current problems will remain unsolved will be further deteriorated with an increase of population in the future. If the priority project is implemented, the existing problems will be solved. The existing problems in the project area, and benefits of the implementation of the priority project are shown in Table126.1.7.

A126 - 14
Table 126.1.7 The Problems and Benefits without/with the Priority Project The Existing Problems (without Project) Benefits with the Priority Project
Water Supply System Water supply service level is low. Actual service hour (the majority of the population
only receives water for a few hours supply every 3 to 4 days.)
Since water supply water pressure is low, private storage tank and suction pump are required.
Since water pressure is low, ingress of polluted water to the distribution pipe is expected.
In order to compensate the amount of insufficient water supply, water supply by a tanker is performed.
House connection has many unsuitable facilities because of private responsibility.
All households receive water supply service. Service hour is 24 hours a day and seven days a
week.
Sufficient water pressure is maintained. Therefore, the private storage tank and the suction pump will be unnecessary. The ingress of polluted water to the distribution pipe is not expected.
All households receive the appropriate water supply service. Consequently, water supply by tanker will be unnecessary.
All of house connection facilities are reconstructed by the priority project.
The capacity of distribution line is insufficient. There is very high ratio of leakage and non-revenue
water. (Average ratio of leakage: 30 – 35 % as the study area)
It is possible that without the implementation of the DNI leakage could increase to 60 to 70%.
All households receive water supply service. Improvement is expected.
Many residents of Karachi have a very negative impression of KW&SBB and the service it provides and are therefore reluctant to pay water charges.
While the basic cost of piped water in Karachi may be cheap, the indirect costs associated with its use are unreasonable high.
With increase in population, the existing problems are aggravated further.
Water meter installation and introduction of a meter-charge system
Improvement in the rate of charge collection A financial improvement is prospective. Improvement in water-saving consciousness Improvement is expected.
Sewerage System The existing sewage collection ratio: 90 % The capacity of collection and conveyance sewer is
insufficient.
The whole quantity of sewage will be collected and the sewage can be conveyed to the sewage treatment plant.
The existing treatment plants are not functional.
The treated effluent will meet the effluent water quality standards.
Chapter 4 Baseline of Environmental Data 4.1 PHYSICAL ENVIRONMENT (1) Topography Karachi City represents quite a variety of habitats such as the sea coast, islands, sand dunes, swamps, semi-arid regions, cultivated fields, dry stream beds, sandy plains and hillocks. Classified according to physiographic features, Karachi City District can be divided into three broad categories: Hilly region Alluvial plain Coastal areas The metropolitan area is divided into two river streams namely Lyari and Malir Rivers. Gujjar and Orangi are the main tributaries of the Lyari River while Thaddo and Chakalo are the main
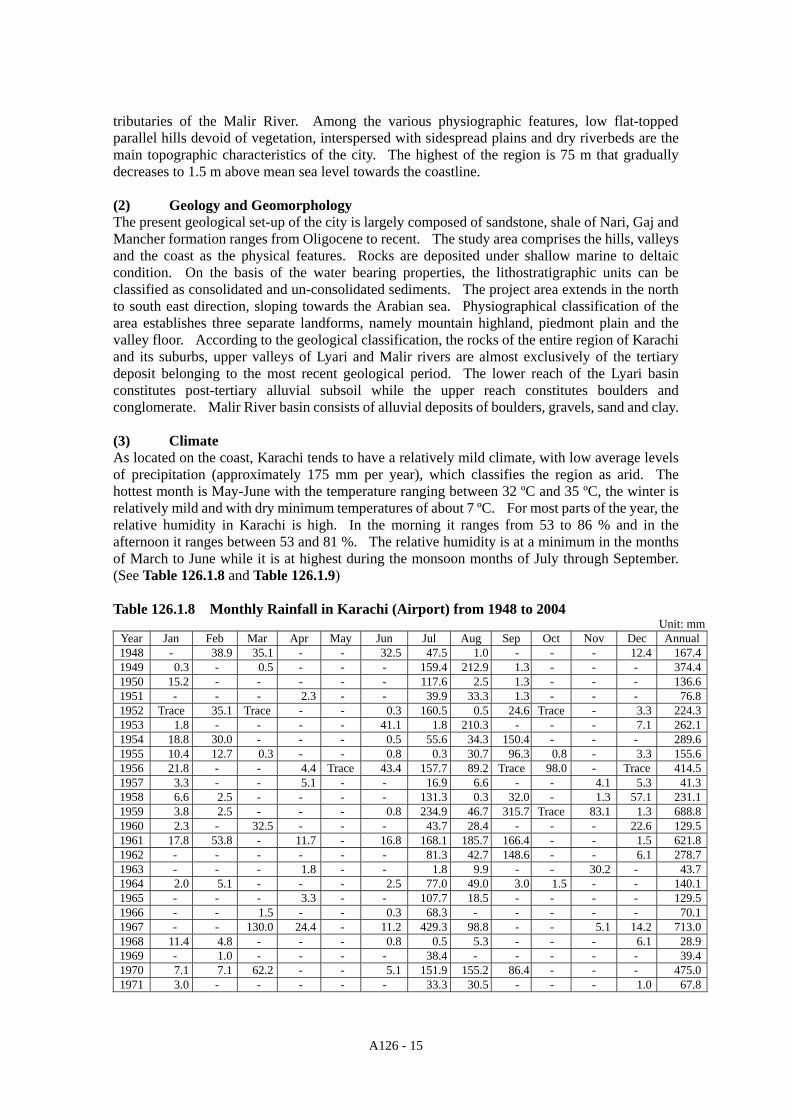
A126 - 15
tributaries of the Malir River. Among the various physiographic features, low flat-topped parallel hills devoid of vegetation, interspersed with sidespread plains and dry riverbeds are the main topographic characteristics of the city. The highest of the region is 75 m that gradually decreases to 1.5 m above mean sea level towards the coastline. (2) Geology and Geomorphology The present geological set-up of the city is largely composed of sandstone, shale of Nari, Gaj and Mancher formation ranges from Oligocene to recent. The study area comprises the hills, valleys and the coast as the physical features. Rocks are deposited under shallow marine to deltaic condition. On the basis of the water bearing properties, the lithostratigraphic units can be classified as consolidated and un-consolidated sediments. The project area extends in the north to south east direction, sloping towards the Arabian sea. Physiographical classification of the area establishes three separate landforms, namely mountain highland, piedmont plain and the valley floor. According to the geological classification, the rocks of the entire region of Karachi and its suburbs, upper valleys of Lyari and Malir rivers are almost exclusively of the tertiary deposit belonging to the most recent geological period. The lower reach of the Lyari basin constitutes post-tertiary alluvial subsoil while the upper reach constitutes boulders and conglomerate. Malir River basin consists of alluvial deposits of boulders, gravels, sand and clay. (3) Climate As located on the coast, Karachi tends to have a relatively mild climate, with low average levels of precipitation (approximately 175 mm per year), which classifies the region as arid. The hottest month is May-June with the temperature ranging between 32 ºC and 35 ºC, the winter is relatively mild and with dry minimum temperatures of about 7 ºC. For most parts of the year, the relative humidity in Karachi is high. In the morning it ranges from 53 to 86 % and in the afternoon it ranges between 53 and 81 %. The relative humidity is at a minimum in the months of March to June while it is at highest during the monsoon months of July through September. (See Table 126.1.8 and Table 126.1.9) Table 126.1.8 Monthly Rainfall in Karachi (Airport) from 1948 to 2004
Unit: mm Year Jan Feb Mar Apr May Jun Jul Aug Sep Oct Nov Dec Annual1948 - 38.9 35.1 - - 32.5 47.5 1.0 - - - 12.4 167.41949 0.3 - 0.5 - - - 159.4 212.9 1.3 - - - 374.41950 15.2 - - - - - 117.6 2.5 1.3 - - - 136.61951 - - - 2.3 - - 39.9 33.3 1.3 - - - 76.81952 Trace 35.1 Trace - - 0.3 160.5 0.5 24.6 Trace - 3.3 224.31953 1.8 - - - - 41.1 1.8 210.3 - - - 7.1 262.11954 18.8 30.0 - - - 0.5 55.6 34.3 150.4 - - - 289.61955 10.4 12.7 0.3 - - 0.8 0.3 30.7 96.3 0.8 - 3.3 155.61956 21.8 - - 4.4 Trace 43.4 157.7 89.2 Trace 98.0 - Trace 414.51957 3.3 - - 5.1 - - 16.9 6.6 - - 4.1 5.3 41.31958 6.6 2.5 - - - - 131.3 0.3 32.0 - 1.3 57.1 231.11959 3.8 2.5 - - - 0.8 234.9 46.7 315.7 Trace 83.1 1.3 688.81960 2.3 - 32.5 - - - 43.7 28.4 - - - 22.6 129.51961 17.8 53.8 - 11.7 - 16.8 168.1 185.7 166.4 - - 1.5 621.81962 - - - - - - 81.3 42.7 148.6 - - 6.1 278.71963 - - - 1.8 - - 1.8 9.9 - - 30.2 - 43.71964 2.0 5.1 - - - 2.5 77.0 49.0 3.0 1.5 - - 140.11965 - - - 3.3 - - 107.7 18.5 - - - - 129.51966 - - 1.5 - - 0.3 68.3 - - - - - 70.11967 - - 130.0 24.4 - 11.2 429.3 98.8 - - 5.1 14.2 713.01968 11.4 4.8 - - - 0.8 0.5 5.3 - - - 6.1 28.91969 - 1.0 - - - - 38.4 - - - - - 39.41970 7.1 7.1 62.2 - - 5.1 151.9 155.2 86.4 - - - 475.01971 3.0 - - - - - 33.3 30.5 - - - 1.0 67.8

A126 - 16
1972 - 3.3 - - - 20.8 16.0 - - - - 4.1 44.21973 - - - - - - 184.9 20.1 - - - 8.4 213.41974 - 0.6 - - - - - 0.4 - 0.6 - 5.6 7.21975 13.7 21.3 30.2 - - 0.3 - 76.9 21.1 - - - 163.51976 66.8 10.1 30.7 0.0 0.0 0.0 217.2 36.5 44.8 0.0 0.0 0.0 406.11977 10.3 0.0 0.0 2.3 0.0 34.8 302.6 44.8 88.5 0.0 5.2 0.0 488.51978 14.3 4.7 0.0 0.0 0.0 6.8 179.4 175.5 0.1 0.0 5.7 0.0 386.51979 1.7 96.0 0.0 0.0 0.0 3.4 0.0 262.5 0.0 3.9 0.0 13.5 381.01980 0.0 0.0 10.9 0.0 0.0 43.2 45.0 0.4 0.0 23.8 6.9 63.6 193.81981 0.0 25.0 37.4 3.6 0.0 0.0 40.2 43.4 0.0 0.0 0.0 0.0 149.61982 2.1 24.9 0.0 0.0 0.0 0.0 27.7 105.5 0.0 0.0 0.0 1.0 161.21983 0.0 3.7 0.0 38.5 0.0 0.0 54.7 159.1 25.5 0.0 0.0 0.0 281.51984 0.3 0.0 0.6 0.0 0.0 0.0 19.4 245.7 4.0 0.0 0.0 0.0 270.01985 0.9 0.0 0.0 17.6 0.0 0.5 80.6 25.0 0.0 0.0 0.0 0.0 124.61986 0.0 0.8 11.4 0.0 0.0 17.0 0.0 62.4 0.0 0.0 0.0 0.0 91.61987 0.0 0.0 0.0 0.0 0.0 0.0 0.0 0.0 0.0 0.0 0.0 0.0 0.01988 1.0 0.0 0.0 0.0 0.0 0.0 74.0 85.0 Trace 0.0 0.0 0.0 160.01989 0.5 8.3 1.5 0.0 0.0 0.0 166.8 4.3 0.0 0.0 0.2 3.5 185.11990 25.3 23.5 0.0 0.0 0.0 0.4 Trace 78.7 7.7 0.0 Trace 1.8 137.41991 3.0 19.5 2.0 0.0 0.0 0.0 Trace Trace Trace 0.0 0.0 0.0 24.51992 19.4 8.0 0.9 0.0 0.0 0.0 83.9 138.2 22.6 0.0 0.0 0.0 273.01993 7.0 11.8 0.0 0.0 0.0 0.0 8.4 Trace Trace 0.0 8.3 0.0 35.51994 2.2 2.5 0.0 Trace 0.0 Trace 256.3 147.8 61.7 0.0 0.0 11.0 481.51995 89.3 5.2 0.2 0.0 0.0 Trace 157.9 6.2 0.0 0.0 1.0 0.0 259.81996 13.0 33.2 9.6 0.0 0.0 30.0 12.8 0.4 0.0 0.0 0.0 Trace 99.01997 13.4 Trace 20.8 3.6 5.0 16.6 18.6 27.5 30.0 9.9 3.0 4.4 152.81998 9.1 4.3 4.9 0.0 0.0 28.0 10.6 0.5 0.0 25.6 0.0 0.0 83.01999 6.5 1.8 1.8 0.0 0.2 Trace 2.0 Trace 0.0 4.0 0.0 0.0 16.32000 19.0 3.0 0.0 0.0 Trace 0.0 Trace 24.9 Trace 0.0 0.0 0.0 46.92001 0.0 0.0 0.0 0.0 0.0 10.6 73.6 16.2 Trace 0.0 0.0 0.0 100.42002 0.0 2.4 0.0 0.0 0.0 Trace 0.0 52.2 Trace 0.0 0.5 0.4 55.52003 6.4 21.9 0.0 0.0 0.0 16.3 270.4 9.8 Trace 0.0 0.2 0.0 325.02004 13.7 0.0 0.0 0.0 0.0 Trace 3.0 5.6 Trace 39.3 0.0 4.3 65.9
Source: Pakistan Meteorological Department Table 126.1.9 Mean Monthly Temperature
Unit: ºC Year Jan Feb Mar Apr May Jun Jul Aug Sep Oct Nov Dec Annual 1996 18.0 21.1 25.9 28.8 30.9 32.3 30.7 28.3 28.7 28.4 23.5 19.7 26.4 1997 18.4 21.3 24.6 25.4 29.9 31.2 31.4 30.3 29.8 27.9 24.7 19.7 26.2 1998 19.4 20.8 25.8 29.9 32.0 32.4 30.7 29.6 31.0 29.3 25.2 21.9 27.3 1999 11.9 22.3 26.6 30.0 31.2 31.4 30.1 29.4 29.7 30.3 26.2 21.4 26.7 2000 19.5 21.4 25.6 30.0 30.9 31.7 30.4 29.2 29.5 29.6 25.7 21.5 27.1 2001 19.4 22.3 26.4 29.2 31.6 32.3 29.6 29.4 29.5 36.0 26.0 23.1 27.9 2002 19.9 21.0 26.4 29.6 31.3 31.6 29.5 28.3 28.0 29.4 25.1 21.4 26.8 2003 20.1 22.7 26.1 30.3 30.6 31.4 30.9 29.7 28.9 28.9 23.7 20.1 26.9 2004 19.7 22.2 27.7 30.2 32.0 32.1 30.6 29.5 29.0 28.1 24.3 22.4 27.3 2005 18.6 20.8 25.9 29.1 30.9 32.3 30.3 29.4 30.4 29.0 26.0 20.7 27.0
Source: Pakistan Meteorological Department (4) Wind Pattern Strong coastal winds are the characteristic feature of the region. The wind direction during the southwest monsoon period is dominantly from the northeast and wind intensity is depending on the air pressure of the continent. The effect of this air pressure is also felt on the Karachi cost where the winter air pressure is 1018 hectopascal in January and summer air pressure is 998 hectopascal in July. Mean wind velocity varies from 5.3 miles per hour (m.p.h, 8.5 km / hour) in November to 12.8 m.p.h. (20.4 km/hour) in July. Remarkably strong winds blow mostly from southwest or west during from March till October. In the coastal regions, the wind velocities reach up to 25 m.p.h. (40 km / hour). (See Table 126.10 and Table 126.11)
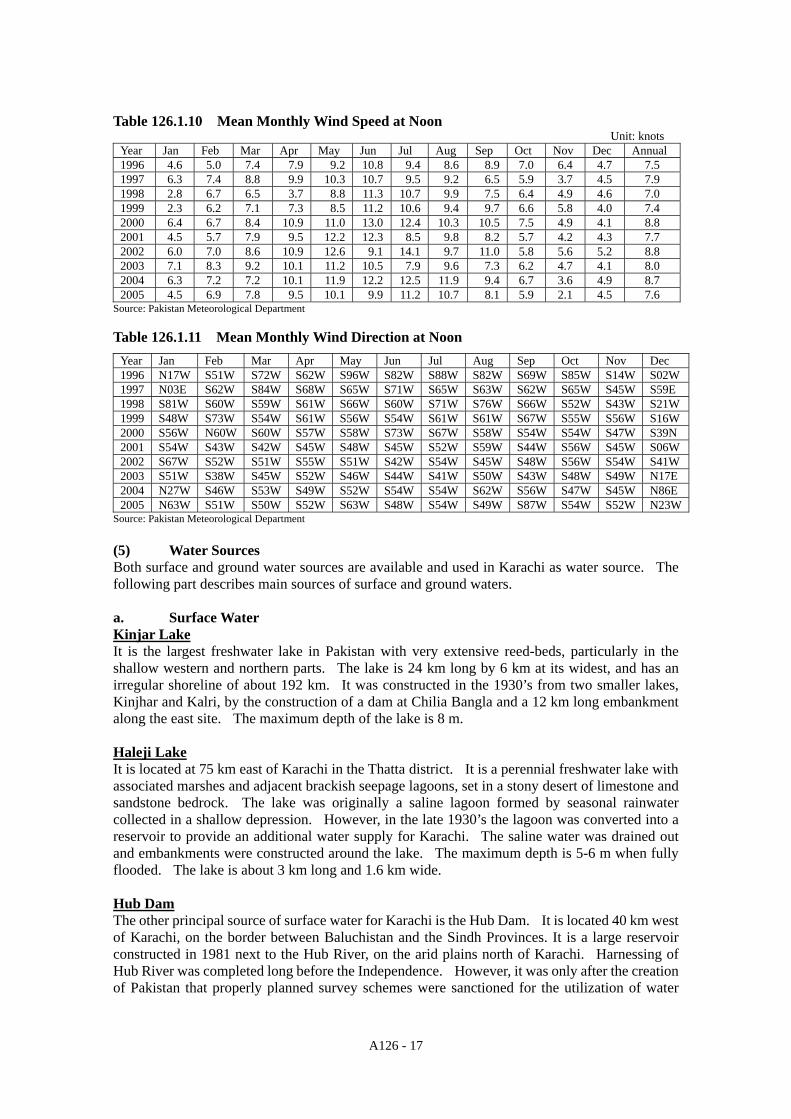
A126 - 17
Table 126.1.10 Mean Monthly Wind Speed at Noon Unit: knots
Year Jan Feb Mar Apr May Jun Jul Aug Sep Oct Nov Dec Annual 1996 4.6 5.0 7.4 7.9 9.2 10.8 9.4 8.6 8.9 7.0 6.4 4.7 7.5 1997 6.3 7.4 8.8 9.9 10.3 10.7 9.5 9.2 6.5 5.9 3.7 4.5 7.9 1998 2.8 6.7 6.5 3.7 8.8 11.3 10.7 9.9 7.5 6.4 4.9 4.6 7.0 1999 2.3 6.2 7.1 7.3 8.5 11.2 10.6 9.4 9.7 6.6 5.8 4.0 7.4 2000 6.4 6.7 8.4 10.9 11.0 13.0 12.4 10.3 10.5 7.5 4.9 4.1 8.8 2001 4.5 5.7 7.9 9.5 12.2 12.3 8.5 9.8 8.2 5.7 4.2 4.3 7.7 2002 6.0 7.0 8.6 10.9 12.6 9.1 14.1 9.7 11.0 5.8 5.6 5.2 8.8 2003 7.1 8.3 9.2 10.1 11.2 10.5 7.9 9.6 7.3 6.2 4.7 4.1 8.0 2004 6.3 7.2 7.2 10.1 11.9 12.2 12.5 11.9 9.4 6.7 3.6 4.9 8.7 2005 4.5 6.9 7.8 9.5 10.1 9.9 11.2 10.7 8.1 5.9 2.1 4.5 7.6
Source: Pakistan Meteorological Department Table 126.1.11 Mean Monthly Wind Direction at Noon
Year Jan Feb Mar Apr May Jun Jul Aug Sep Oct Nov Dec 1996 N17W S51W S72W S62W S96W S82W S88W S82W S69W S85W S14W S02W1997 N03E S62W S84W S68W S65W S71W S65W S63W S62W S65W S45W S59E 1998 S81W S60W S59W S61W S66W S60W S71W S76W S66W S52W S43W S21W1999 S48W S73W S54W S61W S56W S54W S61W S61W S67W S55W S56W S16W2000 S56W N60W S60W S57W S58W S73W S67W S58W S54W S54W S47W S39N2001 S54W S43W S42W S45W S48W S45W S52W S59W S44W S56W S45W S06W2002 S67W S52W S51W S55W S51W S42W S54W S45W S48W S56W S54W S41W2003 S51W S38W S45W S52W S46W S44W S41W S50W S43W S48W S49W N17E2004 N27W S46W S53W S49W S52W S54W S54W S62W S56W S47W S45W N86E2005 N63W S51W S50W S52W S63W S48W S54W S49W S87W S54W S52W N23W
Source: Pakistan Meteorological Department (5) Water Sources Both surface and ground water sources are available and used in Karachi as water source. The following part describes main sources of surface and ground waters. a. Surface Water Kinjar Lake It is the largest freshwater lake in Pakistan with very extensive reed-beds, particularly in the shallow western and northern parts. The lake is 24 km long by 6 km at its widest, and has an irregular shoreline of about 192 km. It was constructed in the 1930’s from two smaller lakes, Kinjhar and Kalri, by the construction of a dam at Chilia Bangla and a 12 km long embankment along the east site. The maximum depth of the lake is 8 m. Haleji Lake It is located at 75 km east of Karachi in the Thatta district. It is a perennial freshwater lake with associated marshes and adjacent brackish seepage lagoons, set in a stony desert of limestone and sandstone bedrock. The lake was originally a saline lagoon formed by seasonal rainwater collected in a shallow depression. However, in the late 1930’s the lagoon was converted into a reservoir to provide an additional water supply for Karachi. The saline water was drained out and embankments were constructed around the lake. The maximum depth is 5-6 m when fully flooded. The lake is about 3 km long and 1.6 km wide. Hub Dam The other principal source of surface water for Karachi is the Hub Dam. It is located 40 km west of Karachi, on the border between Baluchistan and the Sindh Provinces. It is a large reservoir constructed in 1981 next to the Hub River, on the arid plains north of Karachi. Harnessing of Hub River was completed long before the Independence. However, it was only after the creation of Pakistan that properly planned survey schemes were sanctioned for the utilization of water

A126 - 18
from the Hub and Malir rivers. As a result, detailed investigation was conducted, Hub Dam was proposed to be built at the present site just before the confluence of the Shorin Nallah and the Hub River. Hub Dam has a catchment area of 3,410 square miles (8,832 km2). However, because of low and variable rainfall in the catchment and high evaporation rates, both drinking water and irrigation demands are met only at the 80% level. The water level in the reservoir fluctuates widely according to rainfall in the catchment area; the maximum depth is 46 m and the average is 19 m. b. Groundwater Karachi city falls in a dry and arid zone with scanty and intermittent rainfall with prolonged period of drought. The Karachi District area comprises four (4) basin areas, namely: Malir River Basin Gadap Basin Lyari River Basin Hub River Basin (partial) The groundwater exists in these basins within the alluvial deposits of Quaternary age and Manchar conglomerate, sandstone, Gaj sandstone, limestone, Nari sandstone and silica sand. Groundwater aquifer is available in different depths of different strata. Semi artesian condition has also been identified in deeper confined aquifers. The depths of aquifers and the water table in Karachi ranges from 20 feet (6 m) to 300 feet (91 m) below ground surface. The groundwater is recharged mainly by precipitation which falls in the watershed area of the basins. Since the major streams and nallahs are ephemeral in natures, most of the precipitation is lost through surface runoff. Some of this water percolates into the subsoil strata and contributes to recharge of groundwater. At present, the groundwater is withdrawn from the open wells and tube wells. About 1000 existing dug wells and tube wells are provided with centrifugal or submersible pumps. The average pumping discharge of these wells has been estimated approximately as 80 gallons per minute (363 litter / min) that amounts to a discharge of 53 cusecs (1.5 m3) against an estimated recharge of 91 cusecs (2.6 m3). The balance of approximately 38 cusecs (1.1 m3) represents a rough assessment of the present potential availability of groundwater sources. This quantity is partly represented in groundwater flows for springs, evaporation, evapo-transpiration and base flows of sub-soil storage. In the past, ground water at Dumlottee location was a major source of water for Karachi. The Khadeji, Thaddo Nallah, Mole tributary are the main sources of recharge to the Malir Basin area. However, gradually with the passage of time and due to excessive lifting of sand from Malir River bed along with extensive use of ground water by farmers, the water table has dropped. Continuous lowering of the water table is likely to result in intrusion of seawater into the Malir River Basin under natural seepage conditions and under induced conditions of recharge of saline seawater in the coastal aquifers of Karachi. This is an encroachment of the interface between seawater and freshwater, through intrusion and/or upcoming. Contamination by salty seawater can further increase the deterioration of the groundwater quality in the coastal aquifer. There are some ground water sources along the coastal belt. However, the water is mostly saline and unsuitable for drinking. In many places within the Karachi coastal belt, groundwater is being used for domestic and household works and in some places the water is slightly saline. The areas where groundwater is used include the Cape Monze area, Buleji, Shamspir, Clifton and in areas adjacent to the Korangi Creek near the Rehri Village. Further inland, the sites include Mauripur, Lower Lyari area, around the Karachi Port, Kharadar, Methadar and Defence Housing

A126 - 19
Authority. The water table near the Karachi coast is assessed to be between 3-7 feet (0.9-2.1 m) to 20-60 feet (6.1-18.3m) in the landward areas. c. Sea Water and Coastal Oceanography The Karachi coastal zone lies in the north-eastern corner of the Pakistan coast bordering the northern Arabian Sea. The coastal oceanographic features of the Karachi coastal zone are therefore very much under the influence of the oceanographic characteristics of the northern Arabian Sea. The unique oceanographic features of the northern Arabian Sea such as high salinity, low precipitation, high evaporation rates, reversal of sea water circulation during the two monsoon periods, and high primary production rates, prevail all along the coastal and near-shore waters of the Karachi coastal belt. However, due to the small depths of the in-shore and backwaters, certain factors such as turbulence, turbidity, high suspended solids, littoral drift and organic and inorganic pollutants are more pronounced in the coastal waters within the coastal zone of Karachi. The annual range of sea-surface temperatures along the Karachi coast is 19 ºC to 31 ºC. The average variations of seawater salinity in the coastal waters usually range between 35,000 ppm to 37,000 ppm. The seawater salinities in the Karachi harbour generally range from 33,000 ppm to 37,000 ppm and are very much influenced by the input of freshwater discharged by the Lyari River. The seawater salinities in the greater part of the inter-tidal creeks of the Indus Delta near Karachi remain between 37,000 ppm to 41,000 ppm for the most part of the year. The seawater circulation pattern along the coast of Karachi can be grouped into three types, namely: clockwise circulation, anti-clockwise circulation and mixed circulation. The analysis of the long period tidal data recorded at Karachi Port reveals that the ‘Mean Sea Level’, is rising at a rate of about 1.1 mm/year. The waves on the coast vary with the seasons. Tides along the Karachi coast are semi-diurnal that is one tidal cycle, and diurnal inequality is also present. In the daily cycle there are two high waters and two low waters which vary considerably from each other in tidal heights. The speed of the seawater current is generally low, about 0.5 knot. The speed increases up to 1 knot during monsoon. The direction is directly related to the prevailing wind system. (6) Ambient Air Quality The main source of ambient air pollution in Karachi are vehicle emissions, waste burning, suspended solid and ‘dirty fuels’ for production purposes used by small scale businesses. Air pollution levels in Karachi and other urban centres of Pakistan are extremely high compared with the international standards and are rising every year. According to the Ministry of Environment, 40% of the urban population of Pakistan faces health risks from pollution. In Karachi, recent air quality surveys indicate a positive correlation between the incidences of ailments/symptoms and ambient air pollution from the transport sector. Higher than acceptable levels of major category pollutants, pollutant levels considered very harmful to human health are being recorded in Karachi. These include: carbon monoxide, sulphur dioxide, nitrogen oxides, particulate matter and ozone. In the areas where air quality was measured, sources of pollution are mainly transport vehicles and three wheelers. (See Table 126.12)

A126 - 20
Table 126.1.12 Air Pollutant Level in Karachi City
Year TSP (μg/m3)
PM10 (μg/m3)
NOX (ppb) SO2 (ppb) O3 (ppb) Methane
(ppm) 1999 210 164 16 11.7 11.2 0.5 2003 349 182 20.9 17 17 0.7 2004 374.5 194 28.8 24 18.8 6.5
% Increase / Decrease from 1999 to 2004 78 18 80 105 68 1200
Source: SUPARCO Baseline Ambient Air Quality Studies; World Bank (2005) (7) Ambient Noise Karachi is the hub of industrial and commercial activities in Sindh. In 1994, a survey was done to assess the degree of noise pollution in Karachi. Noise analysis data was collected for 16 hour periods and carried out in 72 selected sites. The local train whistling up-to 113 db was the worst polluter. The National Logistic Cell (NLC) trawler emitting 96 db came next. Similarly, other forms of vehicular traffic such as motorcycle, three wheelers etc. were the main contributors to high levels of noise pollution in the city. Noise levels varying from 87 to 99db were recorded at the harbour and the vegetable/meat market areas. Even near places such as hospitals high noise levels (81 to 82 db) were recorded. It is felt that rapid urbanization is contributing to increasing levels of ambient noise in the city, particularly sources from various forms of vehicular traffic. Increase in the number of vehicles, traffic jams, lack of maintenance of vehicles, traffic jams all contribute to this growing pollution threat. 4.2 Biological Environment (1) Protected Areas and Sensitive Habitats/Reserves In Pakistan there exists a system of protected areas for the protection of endangered species, habitats, ecosystems, archeological sites, monuments, buildings and other cultural heritage. Protected areas in Pakistan can be broadly categorized into two groups, namely: Ecosystems; and Archaeological and cultural sites
Ecosystems include protected areas such as wildlife reserves, national parks, and game reserves. The official classification of notified protected ecosystem in Pakistan is i) National Park ii) Wildlife Sanctuary iii) Game Reserve. In addition, there are protected forests, village forests, and state forests. The main features of a ‘National Park’ include protection and preservation of scenery, flora, fauna in its natural state and preserving areas of outstanding scenic merit and natural forest. The main features of a ‘Wildlife Sanctuary’ include areas with undisturbed breeding grounds, prohibited or regulated public areas and areas prohibiting non-exploitation of forests. The government may, by notification in the official gazette, declare any area to be a wildlife sanctuary and may demarcate it in a manner as it sees fit. The government may declare an area as a ‘Game Reserve’ where hunting and shooting of wild animals is not allowed; except under a special permit, which may specify the maximum numbers of animals or birds that may be killed or captured in the area and the period for which such permits will be valid. Archaeological sites and monuments are specifically protected by the Antiquities Act 1975, while the ‘Guidelines for Sensitive and Critical Areas’ of the Pakistan Environmental Protection Act 1997 focus on the protection of the existing sites. New sites may also be notified through the federal or provincial archaeology departments. (2) Bio-diversity – Fauna and Flora a. Coastal Bio-diversity The vegetation along the Karachi coast is dominated by mangrove forests. Eight species have

A126 - 21
been documented with Avicennia marina being the most abundant (95%). Dense mangroves are present in the Korangi and Phitti creeks. This ecosystem provides habitat for wildlife of terrestrial and marine origin. The mammals of the mangrove forest include tropical dolphins, porpoises and occasionally visitors such as toothed whales. Little information is available on the reptiles, however, three species of lizards, one species of poisonous snakes and two species of marine snakes have been reported. The common fauna and flora of the relatively less polluted areas within the backwaters of Karachi include the gastropod (Poteamides cinglatus), the barnacles (Balanus amphitrite, Euraphia withersii), mud skipper fish (periophthalmus dussemerie), the fiddler crab (Uca lacteal), the sea weed (Entermorpha intestinales, Ulva reticulates). The sandy shores of the Karachi coast has four main groups of macro marine organisms, namely, crabs, gastropods, interstitial fauna and cast off sea weed along the high water zone as well as floating near the coastal waters. The Hawks Bay and Sandspit beaches are one of the most important green turtle (Chelonya mydas) nesting sites in the world. The coastal creeks and backwaters attract a number of migratory birds, particularly water fowl (for details see section on Wetlands). The pelagic fauna of the creeks near Karachi includes fishes, Siphonophores and Ctenophores. The pelagic flora includes floating sea weeds. The demersal fauna of the area includes shrimps and demersal fish. b. Land based vegetation The characteristic vegetation on the ‘Hills’ in Karachi are xerophytic, growing on the slopes as well as on the hills. Inula granteoides is the most common species found on the top of the hills. Next to it are Blepharis scindia, Aristida mutabilis and Aristida adscenions. Shrubs like Commiphora wightii, Euphorbia caducifolia, Crewia tenax and Grewia villosa are the major constituents of the vegetation on the slopes. Northern and north-eastern sides of the hills show better vegetation growth as compared to the southern and western exposures. On the ‘Alluvial Plain’, vegetation is composed of deciduous xerophytic shrubs, forming open communities. A few of them are progressing towards climax, while others remain under various physiographic and edaphic control. The pioneer plants are Corchorus depressus, Launaea nudicaulis, Salvia santolinifolia, Fagonia Arabica, Tibulus terrestris, Zygophyllum simplex, Cucumis prophetarium, Sida ovata alongwith the grasses Aristida mutabilis and Eleusine compressa followed by herbs of Cassia holosericea, Cassia senna, Aerva javanica and Indigofera oblongifolia. On the ‘Dry Stream Beds’ around Karachi, pioneer species are Pteropyrum oleveri, Rhazya stricta which are found in the heart of the dry stream beds because these two plants comparatively require shallow water depth. These plants are followed by Nerium odorum which is succeeded by Gymnosporia Montana, Rhus mysorensis, and Tamarix articulate, on the either sides of the dry banks, plants of Rhus mysorensis, Acacia jacquemonti and Gymnosporia Montana nurse the seedlings of Eiphorbia caucifolia which later on dominates over them. The land in Karachi also supports vegetation in the ‘Cultivated Fields’. Near Manghopir are found sulphur springs and sweet water streams. The area gives an appearance of an oasis. Date palm groves are dominant, besides date palm Ricinus communis, Vinca rosea and some vegetables are also commonly grown. Euphorbia tirucalli is commonly grown as shelterbelts around the cultivated fields. In Malir where sweet sub-soil water is available, vegetable and fruit trees grow by the help of tube-well irrigation. The common fruit trees grown here are Mangifera indica, Phoenix sylvestris, Carica papaya, Psidium gaujava, Zizyphus jujube, Musa sapientum and Anona squamosa. In addition, the Hub Dam area and Gadap are also vegetable growing areas.

A126 - 22
(3) Wetland Resources Some important wetlands located within and in the vicinity of Karachi city are discussed below; a. Kinjhar (Kalri) Lake The lake and surrounding areas are state owned (Government of Sindh). The site was listed as a ‘Wetland of International Importance’ under the ‘Ramsar Convention’, in July 1976, and declared a ‘Wildlife Sanctuary’, in March 1977 under Section 14 of the Sindh Wildlife Protection Ordinance 1972. Commercial fishing, domestic water supply for Karachi city, scientific research and public recreation are the dominant land uses. Unsustainable fishing activities constitute the major threat to the ecosystem. b. Haleji Lake The lake and the surrounding areas are state owned (Government of Sindh). The area was declared a ‘Wildlife Sanctuary’ (1,704 ha), in March 1977 under Section 14 of the Sindh Wildlife Protection Ordinance 1972. Haleji Lake Wildlife Sanctuary was listed as a ‘Wetland of International Importance’, in July 1976. Fishing and domestic water supply to Karachi City constitute the principal uses of the lake. Illegal fishing, hunting and increased situation and eutrophication are the major threats to the ecosystem. c. Hadero Lake It is located 85 km east of Karachi in the district of Thatta. The lake and stony desert to the north and west are state owned (Government of Sindh). The area was declared as a ‘Wildlife Sanctuary’ (1,321 ha), in March 1977 under Section 14 of the Sindh Wildlife Protection Ordinance 1972. Commercial/sport fishing and excavation of stone for road construction in the adjacent areas are currently practiced. Excessive fishing, illegal hunting and indiscriminate removal of superficial layers of limestone are the major threats to the ecosystem. d. Hub Dam The Dam is state owned while the adjacent areas are privately owned communal lands. Its reservoir is protected within the ‘Hub Dam Wildlife Sanctuary’ (27,219 ha), established in 1972. Fishing activities take place while the reservoir provides drinking water to Karachi city and water for irrigating agricultural land in Lasbella District, Baluchistan. Fishing activities cause some disturbance to waterfowl population and the Dam has had detrimental effects on the ecology of the downstream of the estuarine system. The Dam is considered to have the highest fishery potential among the smaller reservoirs in Pakistan. e. Hawks Bay/Sandspit Beaches and adjacent creeks The beaches are located on the coast southwest of Karachi City. They are gently sloping sand beaches with open sandy offshore approaches stretching for about 20 km along the Arabian Sea coast west from Manora Point at the mouth of Karachi harbour, and there are a complex of creeks and shallow tidal lagoons with extensive inter-tidal mudflats and some mangrove swamps behind the beach. The eastern part of the beach (Sand spit) is all sand and the western part (Hawks Bay) has some rocky areas. The site is one of the regions of most important green turtle nesting site. The green turtles are recognized as endangered species by the Sindh Government. Beach recreation is the main land use. There are many beach huts built along the beach and human usage of the beach resulting in generation of garbage (that attracts predators such as dogs/crows), night lightening etc. are having harmful effects on the nesting turtles and their hatchlings. In addition, the beach huts (often built in violation of the relevant building laws) are encroaching on prime turtle nesting space. The adjoining creek system is one of the most important areas for wintering, passage and summering shorebirds in Pakistan, and also supports significant amount of cormorants, flamingos, ducks, gulls and terns.

A126 - 23
f. Clifton Beach Located on the coast south of Karachi City, it is a long sandy beach with adjacent tidal mudflats, backed by sand dunes. The sand dunes have practically no vegetation on their seaward slope. Land use status is public recreational beach. Part of the mudflats have been lost as a result of dyke construction while significant amount of sewage from the Defence Housing Authority / Clifton Cantonment area is discharged directly to the Clifton beach, spoiling its environment and recreational value. g. Korangi and Gharo Creeks The creeks are located about 20-30 km southeast of Karachi, at the northern extremity of the Indus Delta. The site is a complex of large tidal creeks with extensive mangrove swamps and inter-tidal mudflats, near the southeastern outskirts of Karachi. The creek system was originally developed as a part of the Indus Delta, but is no longer hydraulically connected to the delta. The tidal range is about 2m. The creeks are state owned and under the administration of the Port Qasim Authority. Surrounding areas are privately owned. An area of 80,743 ha, including 48,286 ha of mangroves, has been declared as a ‘Protected Forest’ and is managed by the Sindh Forest Department. Grazing by domestic livestock in the mangroves, the cutting of mangrove branches for cattle fodder, and fishing are the principal uses. The creeks provide a supply of water for nearby industries and are uses as a transportation network. There are several large industrial developments, many fishing villages and a port in the area. The mangrove ecosystem is of considerable importance as a breeding and nursery ground for many species of fish and shrimps of economic value. The two major threats to the area are pollution (mostly sourced from the nearby industrial establishments) and over-exploitation of natural resources. 4.3 SOCIO-CULTURAL ENVIRONMENTAL (1) Population It is now estimated that Karachi’s population is approximately 13 million (9.8 million in the 1998 census). Currently an estimated 350,000 persons are added to the population every year. Another estimate puts the increase at 33,000 households annually. The city contains close to 33% of the population of Sindh and 7.5% of the population of Pakistan. In the early period of Karachi’s growth, after the creation of Pakistan, migration played an important role. This trend continued over the years. (See from Table 126.13 to Table 126.15) Table 126.1.13 Karachi’s Population Growth
Year Population Increase/Decrease Over Last Census / Survey
No. of Years in Between
Percent Increase / Decrease
Average Annual Growth Rate
1941 435,887 135,108 10 44.90 3.70 1951 1,137,667 701,780 10 161.00 11.50 1961 2,044,044 906,377 10 79.70 6.05 1972 3,606,746 1,562,702 11 76.50 5.00 1981 5,437,984 1,831,238 9 50.80 4.96 1998 9,802,134 4,540,422 17 86.29 3.52
Source: Government of Pakistan Census Reports.
A126 - 24
Table 126.1.14 Population of Municipal Corporations and Cantonment Areas by Sex (1998 Census)
Municipal Corporations / Cantonment areas Total Male Female Municipal Corporation East. 2,612,158 1,392,079 1,220,079 Cantonment area Faisal Drigh Road 133,856 72,281 61,575 Municipal Corporation west 1,899,566 1,038,346 861,220 Manora Cantonment 10,008 6,036 3,972 Municipal Corporation South 1,504,461 807,619 696,842 Karachi Cantonment & Clifton Cantonment 240,577 135,746 104,831 Municipal Corporation Central 2,277,931 1,200,536 1,077,395 Municipal Corporation Malir 447,282 254,767 192,515 Malir Cantonment & Korangi Creek Cantonment 78,641 47,485 31,156
Source: Development Statistics of Sindh, 2003 Table 126.1.15 Population of Katchi Abadi
1970s (1978)
1980s (1985)
Most Recent (1988)
2000 (Projection)
Katchi abadi population 2,000,000 2,600,000 3,400,000 7,070,000 No. of Katchi abadi Households
227,000 356,000 465,000 960,000
Source: Karachi Land and Housing Study: Dr. D. Dowall/KDA-MPD, 1989. Shelter for Low Income Communities: Inception Report on Sindh: World Bank, October 19990 (2) Land Use and Urban Planning a. Land In 1870, the urbanized area of the Karachi District was 13 sq.km, the 1971 census report gives the figure of 289 sq.km, the 1974 Master Plan defined metropolitan Karachi as 349 sq.km and the 1988 Karachi Development Plan gives a figure of 3,520 sq.km. The area of Karachi District is 3,527 sq.km. At the current rate of urban land conversion of about 6,780 acres (27 km2) per year, Karachi will outstrip its present boundaries. In Karachi, nearly 400,000 acres (1,618 km2) of the 425,000 acres (1,719 km2) makes up its metropolitan area and account for 94% of all land in the district are in some form of public ownership. Land for development is transferred from the Government of Sindh to the city development agencies that plan and develop land as per their rules and regulations and make plots available to private developers, cooperative societies and individuals for construction purposes. These development authorities also set aside land for social and physical infrastructure development and for commercial and recreational purposes. In addition to formal sector development, there is a lot of informal development. Around 1000 acres (4.0 km2) of government land is encroached upon for developing squatter settlements (Katchi Abadis) each year. Almost 50% of the city population lives in these Katchi Abadis. b. Urban Planning The key urban master planning exercises carried out for Karachi City are briefly discussed below: The Karachi Development Plan 2000 On the expiry of the 1974-85 Karachi Master Plan period, the Karachi Development Plan 2000 was initiated by the KDA with UNDP assistance. The plan document was completed in 1990. Essentially the plan consisted of a computer model that would monitor developments in Karachi so that investments could be directed appropriately. It also contained important recommendations for planning and a related institutional set-up which included the setting up of an independent Karachi Division Physical Planning Agency (KDPPA) supported by a steering committee and an implementation board. Building control in this agreement was to be subject to the KDPPA. However, the monitoring and related planning exercise could not be carried out

A126 - 25
without a constant supply of data for which no system was proposed by the plan. This and other related factors rendered the entire set-up created for the Karachi Development Plan 2000 ineffective. In addition, the plan was never authorised as its Steering Committee could not meet to approve it. Master Plan 2020 for the Development of Karachi A project for the formulation of a Master Plan 2020 for Karachi City is presently being carried out within the Master Plan Group of Offices (MPGO) of the City District Government Karachi (CDGK). The present planning exercise focuses on updating conditions, improving the technical tools, adding new tools to planning, new spatial planning, change of land use, relationship between land use and zoning regulations, rate of growth of squatter settlements and change in urban profile, etc. (3) Transport and Traffic Karachi has 14,854 intra-city buses, all owned by private operators. In addition, it has 513 inter-city buses as well. These buses do not have proper terminals, workshops or depots for their use. There are also 13,613 taxis and 23,337 rickshaws in the city. According to the Regional Transport Authority (RTA) figures, 72% of all commuters using buses travel by Karachi’s 8,773 mini-buses. The mini-buses are owned by individuals. Karachi’s traffic is the main cause of air and noise pollution in the city. Much of the heavy traffic is related to port based activities. Because of the problems with the piped network in Karachi and the urgency of the water demand, water tanker deliveries now comprise as much as 25% of all water supply in the city, delivering about 95 MGD and constituting a major component of the daily traffic load in the city. It is estimated that about 4000 ‘general public’ tanker deliveries are made per day to un-served and water scarce areas of the city. The railway system in Karachi comprises the main line which runs from Keamari through Karachi City, Karachi Cantonment, Landhi, Bin Qasim and to the rest of Pakistan. (4) Socio-economic Activities a. Health Karachi has a variety of medical facilities. It has all sorts of hospitals, clinics and dispensaries, both in the public and private sectors. However, a vast majority of the population also get treatment from medical practitioners, both qualified and unqualified and by hakims (traditional doctors using herbal medicines). Most of these doctors operate from small, one room clinics and have no proper diagnostic facilities. There is no record of the number of such clinics. However, they greatly outnumber the formal sector health facilities. This is particularly the case in informal settlements. According to one survey, there are over 400 private clinics in Orangi and only 18 government and proper formal sector health facilities. b. Education In Karachi, according to the 1981 census, the literacy rate was 57% as compared to 26% in the whole Pakistan. According to a survey conducted by the Applied Economic Research Centre (AERC) in 1987, the literacy rate in the planned areas was 76% and 48.6% in unplanned areas. The Government of Sindh, the federal government, the City Government and the private sector are the main providers of education in Karachi. However, owing to the inadequacy of the government educational facilities, such facilities have been greatly supplemented by the private sector. Social indicators representing the whole of Karachi may be misleading since there are major differences between the social indicators for the city’s planned areas and Katchi Abadis. There are also major differences in social indicators among low-income settlements themselves. The data also shows that better incomes do not necessarily mean better social indicators.

A126 - 26
c. Economy Karachi is the financial capital of Pakistan; it has the greatest share of GDP and generates approximately 65% of the national revenue. Karachi has Pakistan’s largest port, and it was the federal capital for the first two decades after independence. Estimates from the mid 1980’s reveal that Karachi has made considerable contribution to the economy of the country. Karachi’s per capita income is two and a half times that of the national average. In terms of large scale manufacturing industry, for example, Karachi still has a share of around one third in the national value added for the sector. In terms of contribution to the energy sector (electricity and gas), the transport, communication and storage sector, as well as the wholesale and trade sector, Karachi’s contribution in each of these areas is at least 25% of the country’s value addition. The footprint of the corporate multinationals is on the increase in Pakistan and headquarters of a majority of the large corporate players are based in Karachi. For example, the headquarters of all the multinational banks operating in Pakistan (14 out of a total of 39 commercial banks operating in Pakistan) are located on the Wall Street of Karachi – the I.I. Chundrigar Road. A high percentage of the population also works in the informal sectors. However, unemployment is still over 10% and income disparities are quite prominent. Almost 50% of the population lives in squatter settlements (Katchi Abadis) with limited access to public utilities and gainful employment opportunities. (5) Solid Waste Management Karachi does not possess a properly functioning garbage management system. Garbage is often dumped in nallahs, open drains and sewer manholes, thus clogging the system, causing sewage overflows and system breakdowns. Karachi generates about 6,113 tons of solid waste every day. About 5,057 tons is collected and 1,057 tons is not collected. About 10% of this waste is removed at source by housewives and sold to about 15,000 kabaris who pick up the waste from households. This solid waste consists of glass, plastic, metal and paper. In addition, another 600 tons of solid waste is collected from kutchra kundis and from the streets and markets by waste pickers. This waste consists of paper, rags, plastic, metal objects, glass and bones. Sweepers employed by the municipal agencies or hired by residents, provide door-to-door garbage collection service. From the households, the waste is taken to neighbourhood collection points (concrete/steel bins) stationed at roadsides, on pathways, in parks and playgrounds. The garbage may also be dumped openly in storm drains, parks/playgrounds, back lanes etc. In such places, garbage is either burnt or is collected by the municipal agencies and transported to the landfill sites located in the outskirts of the city, one at Jam Chakro, Surjani Town and the other at Gond Pass, Hub River Road, 30-35 km from the city centre. In the absence of any officially provided service in the recycle/reuse of solid waste, the informal sector has filled this gap to a great extent. The informal sector comprises of an organized chain of actors, starting from the rag pickers on the streets to the recycling factory owners. It is a flourishing business, which at a conservative estimate, accounts for 15%-20% of the total generated waste of the city. This sector provides employment to more than 55,000 families and had an annual turnover of Rs.1.2 billion. More than 1,000 recycling units are operative in the informal sector. About 2.7 tons of waste is generated by 200 hospitals having total number of beds of 9,000. It contains 540 kg hazardous waste and 2,160 kg non-hazardous waste. For disposing of hospital waste, some private and government run hospitals have installed imported/locally developed waste incinerators. The City District Government has also installed two waste incinerators in the city. They cater only for the waste of about 140 health care units and are presently running at

A126 - 27
very low efficiency. In the areas not covered by the City Government such as the cantonment areas, Clifton, Malir, Faisal and Korangi cantonments there are 34 vehicles that collect an estimated 311 tons of garbage each day, which incurs a daily cost of Rs.197, 000 for sweeping and transportation. (See Table 162.1.16) Table 126.1.16 Solid Waste Management Statistics
Town Waste generated Tons per day
Waste Lifted Tons per day
Waste Lifted Unattended /
Backlog Gadap 350 tons 320 tons 30 tons Korangi 360 tons 272 tons 88 tons Malir 280 tons 270 tons 10 tons Gulberg 330 tons 330 tons Zero North Nazimabad 375 tons 336 tons 39 tons Liaquatabad 800 tons 594 tons 206 tons Baldia 400 tons 302 tons 98 tons SITE 167 tons 153 tons 14 tons Landhi 370 tons 324 tons 46 tons North Karachi 365 tons 280 tons 85 tons Keamari 220 tons 180 tons 40 tons Shah Faisal 105 tons 105 tons Zero Orangi Town 346 tons 240 tons 106 tons Gulshan-e-Iqbal 400 tons 318 tons 82 tons Bin Qasim 65 tons 27 tons 38 tons Lyari 350 tons 300 tons 50 tons Jamshed 330 tons 252 tons 78 tons Saddar 500 tons 454 tons 46 tons
Source: Development Statistics of Sindh, 2003 (6) Cultural Assets Karachi has a very rich built heritages. Most of them are located in the old city. The heritages consist of residential, public and institutional buildings such as hospitals, municipal offices, courts, prisons, halls, auditoriums, libraries, churches, schools and colleges and warehousing in the port area. Most of these buildings are of the early British period. Many of these heritages have been destroyed, both in the Saddar area and in the old city. Under the Sindh Cultural Heritage (Preservation) Act 1994, a large number of buildings (about 900) have been listed as protected buildings and their demolition is illegal under the Act. There are also a number of cultural sites in and around Karachi which record its long and complex history. (7) Water Rights The ‘Constitution’ of Pakistan protects the life of its people and obliges the State to secure the well being of the people and to provide for all the citizens, within the available resources of the country, facilitates for adequate livelihood and basic necessities of life. In 1994, the Supreme Court of Pakistan interpreted the constitutionally protected right to life and dignity to include the right to a healthy environment. Furthermore, the State is urged to promote, with special care, the economic interests of poorer classes or areas. According to the ‘Constitution’, water is a provincial subject. However, the Government of Pakistan has also to perform a number of functions and responsibilities in the water sector, mostly relating to inter-provincial matters. With regards to rights and interests in water, any individual has the right to complain about actual or proposed executive or legislative acts and failures of any authorities with respect to the use, distribution or control of water. With regard to the access to safe drinking water, the Supreme Court of Pakistan specified in another case in 1994, that mining companies have violated the rights of citizens by polluting local drinking water supplies. The Court expanded the Article 9 of

A126 - 28
the right to life and said that it is a right to every person to have unpolluted water, wherever he lives. (8) Industrial Activities After the creation of Pakistan, the strategy adopted for industrialisation in the Sindh province promoted the creation of planned industrial estates and an engineering base. The first industrial estate established was the Sindh Industrial Trading Estate (S.I.T.E) beyond the Lyari River in Karachi in 1947, which was meant to be the industrial hub of the country, not just Sindh. S.I.T.E. was provided with infrastructure such as water, roads and a sewerage network with the specific condition that it would be used only if the effluent from the factories were treated according to the requirements of the Factory Act 1934. Industrial estates in Landhi (1953), Korangi (1959) and North Karachi Township (early 1970) were established subsequently. About 70% of the total industry of Pakistan is located in Karachi. Nearly 30 MGD (136,000 m3 / day) of water is being provided to industrial sites located at S.I.T.E, Korangi, Landhi, F.B Area, North Karachi and elsewhere in the city. However, none of the industrial estates in Karachi is served with effluent collection and conveyance system. So the effluents are not collected and conveyed to the KW&SB treatment plants and instead are discharged mostly untreated into the sea via the Malir and Lyari Rivers. S.I.T.E covers an area of about 1,600 hectares and 2,000 industrial units. The effluents of S.I.T.E area are discharged into the Lyari River and ultimately into the Manora Channel of Karachi Harbour. The Landhi Industrial Trading Estate (L.I.T.E) and the Korangi Industrial Area discharge their effluents that include heavy metals, organic matter, oils, greases and a host of toxic chemicals into Malir River, that ultimately discharges them, along with domestic wastes, on the tidal flats of the Gizri Creek, from where the highly polluted waste water moves to the Arabian Sea. Chapter 5 Impact Identification and Mitigation Measures 5.1 OVERALL IMPACT IDENTIFICATION The first step in EIA is to identify the potentially significant impacts. The various aspects considered in impact identification of the project are as follows:
Project components Project stages Impact generating activities Type of impact
A matrix table was used to overall identify the impacts. The matrix thus identifies the environmental factors likely to be affected, and the activities responsible for this. The cells, which fall at the junction of an activity and an affected parameter, have been graded as A, B, C and blank. (See Table 126.1.17) The adverse impacts have been classified in two categories, namely construction stage and operational stage. Impacts during construction stage may be regarded as temporary or short-term whereas those during operation stage are likely to have long-term effects. The environmental impacts have been discussed separately for the construction stage and the operational stage.
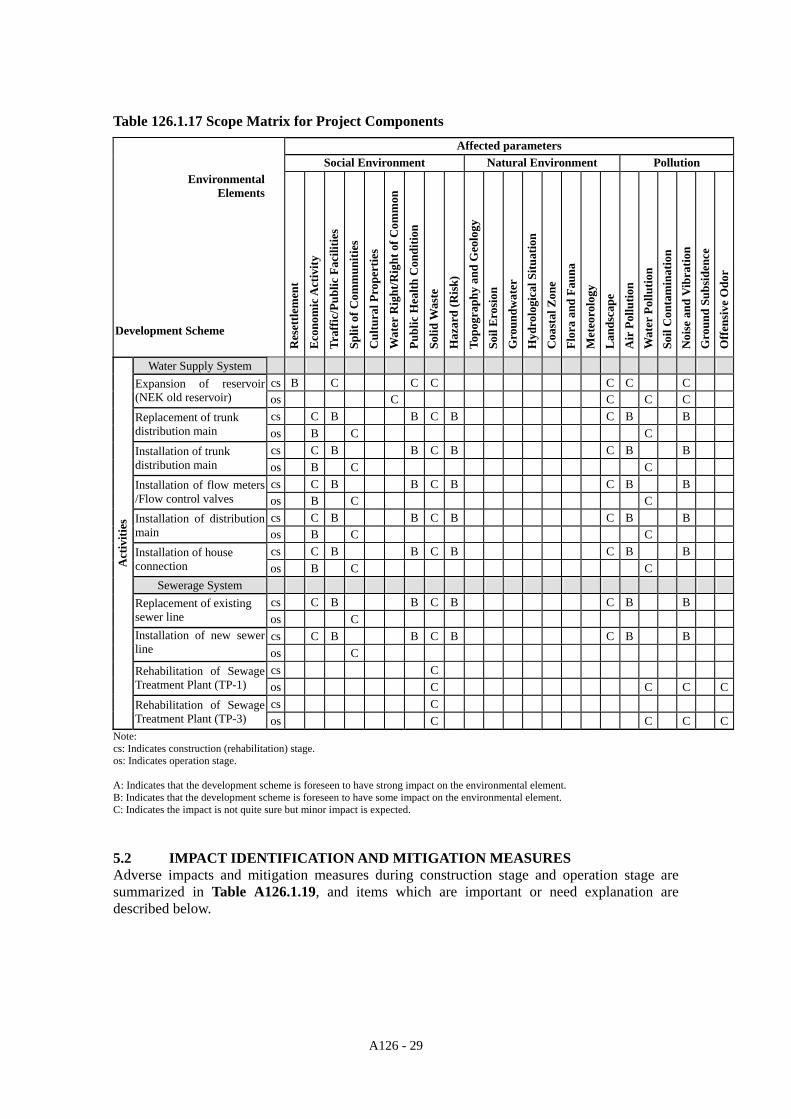
A126 - 29
Table 126.1.17 Scope Matrix for Project Components Affected parameters Social Environment Natural Environment Pollution
Environmental Elements
Development Scheme
Res
ettle
men
t
Eco
nom
ic A
ctiv
ity
Traf
fic/P
ublic
Fac
ilitie
s
Split
of C
omm
uniti
es
Cul
tura
l Pro
pert
ies
Wat
er R
ight
/Rig
ht o
f Com
mon
Publ
ic H
ealth
Con
ditio
n
Solid
Was
te
Haz
ard
(Ris
k)
Topo
grap
hy a
nd G
eolo
gy
Soil
Ero
sion
G
roun
dwat
er
Hyd
rolo
gica
l Situ
atio
n C
oast
al Z
one
Flor
a an
d Fa
una
Met
eoro
logy
L
ands
cape
A
ir P
ollu
tion
Wat
er P
ollu
tion
Soil
Con
tam
inat
ion
Noi
se a
nd V
ibra
tion
Gro
und
Subs
iden
ce
Off
ensi
ve O
dor
Water Supply System cs B C C C C C CExpansion of reservoir
(NEK old reservoir) os C C C Ccs C B B C B C B BReplacement of trunk
distribution main os B C C cs C B B C B C B BInstallation of trunk
distribution main os B C C cs C B B C B C B BInstallation of flow meters
/Flow control valves os B C C cs C B B C B C B BInstallation of distribution
main os B C C cs C B B C B C B BInstallation of house
connection os B C C Sewerage System
cs C B B C B C B BReplacement of existing sewer line os C
cs C B B C B C B BInstallation of new sewer line os C
cs C Rehabilitation of Sewage Treatment Plant (TP-1) os C C C C
cs C
Act
iviti
es
Rehabilitation of Sewage Treatment Plant (TP-3) os C C C C
Note: cs: Indicates construction (rehabilitation) stage. os: Indicates operation stage. A: Indicates that the development scheme is foreseen to have strong impact on the environmental element. B: Indicates that the development scheme is foreseen to have some impact on the environmental element. C: Indicates the impact is not quite sure but minor impact is expected. 5.2 IMPACT IDENTIFICATION AND MITIGATION MEASURES Adverse impacts and mitigation measures during construction stage and operation stage are summarized in Table A126.1.19, and items which are important or need explanation are described below.

A126 - 30
0 100 200 300 m
Vacant Area (Land owner is the Sindh Province)
NEK Old Reservoir(KW&SB)
The area in the circleis about 1.5 ha
Expansion of Reservoir (NEK Old Reservoir) - Construction Stage, Water Supply System Resettlement Impact: Expansion of existing reservoir (NEK Old Reservoir) is proposed as the priority project
component, and the land acquisition for expansion is necessary. Resettlement and disappearance of productive green /agricultural land may cause by land acquisition.
Mitigation Measures: The NEK Old Reservoir is located in a suburb area of the north side of the Study Area. However, actual location of construction site is not determined yet. The existing boundary of water supply facilities area and an adjoining vacant area are shown in Figure 126.1.2. Land owner of this vacant area is the Sindh Provincial Government, and there is no house and any facilities. If it is possible that the adjoining vacant area is able to acquire for the expansion project site, the level of adverse impacts caused by the land acquisition for the expansion of reservoir is expected not significant. The requirement of the land acquisition is shown in Table 126.1.18.
Table 126.1.18 The Land Acquisition for the Expansion of Reservoir
Project Component Capacity of Facility to be Expanded Area Need to Acquire
Expansion of NEK Old Reservoir 30 million gallons 1.5 ha
Figure 126.1.2 The Suitable Site for the Expansion of Reservoir
Construction of Distribution Network - Construction Stage, Water Supply System
Construction of distribution network is an integrated combination of the following

A126 - 31
works: Replacement of trunk distribution main Installation of trunk distribution main Installation of flow meters /Flow control valves Installation of distribution main and line Installation of house connection
Traffic/Public Facilities Impact:
During the construction stage, serious disruptions of vehicular traffic and pedestrian, traffic jams, bottlenecks and blockages to roads will be expected. During the construction of house connection, water supply may be partly disrupted for a certain period of time.
Mitigation Measures: These impacts could be mitigated or minimized by the following countermeasures: The announcement and public notification concerning the construction of facilities and
its schedule before the construction. As mitigation measures, during the construction period, watchman or traffic control
staff will be deployed at the site to control the traffic, and schedule of the transport of construction material should be controlled.
Traffic diversion management should be properly implemented to control pedestrian movement.
Temporary fences with appropriate warning signs should be used to isolate the construction site. Especially, construction sites in the vicinity of schools, mosques and locations of public concentration should be strictly fenced.
If blockages to roads and other services are unavoidable, such blockage areas should be identified well in advance and circulate to public with appropriate details on maps.
During the construction stage, the project owner or building constructor should arrange an information desk and a person responsible at the construction site office.
When construction of house connection is carried out, constructor should inform the related household about preparation of water for drinking and domestic use. If necessary, the project owner should arrange sharing water with neighbours or water service by tankers.
Hazard (Risk) Impact
The accident by the unapproved entry to the construction site can be considered. It is said that about 50% of the existing distribution line in the Study Area uses an
asbestos cement pipe. Respiratory organs illness by asbestos to workers and residents possibly occur by work such as cutting of asbestos cement pipe.
Mitigation Measures (Accident) At the time of construction, the safety of public is one of the most important issues.
Following combination of the activities increases the risks of accidents (especially local population) during construction stage:
Unauthorized access to a construction site Absence of control over access to construction sites Collision with construction vehicles Poor site safety measures and warning system Inadequate site management
Countermeasures such as fences with appropriate warning signs and personnel assignment against the above-mentioned items should be taken.
A126 - 32
Mitigation Measures (Asbestos Cement Pipe) In principle, the existing distribution line will be abandoned with the present condition. Consequently, the adverse impact at construction sites or move-out processes will be not generated. When the work such as cutting of asbestos cement pipe is needed, it is required to work with careful attention to the following points.
Workers wear an anti-dust mask and working clothes, and these equipments is discarded after the end of work.
In principle, cutting work of the pipe is avoided as much as possible. When cutting a pipe, it should be done after pouring water and making pipes wet. The scob of cutting is kept in a container with a lid and should be incinerated. The construction site forbids entry except the persons concerned. When conveyance of an asbestos pipe is needed, it should be packed up with a
plastic sheet and scattering of asbestos is prevented. Replacement of Existing Sewer Line & Installation of New Sewer Line - Construction Stage, Sewerage System
It is desirable to construct sewers and water supply distribution networks simultaneously, which possibly reduces the whole adverse impacts by construction. Work schedule and sequencing for combined construction works between sewers and water supply distribution networks should be considered. Normally, Sewers will be laid away from the water supply lines and at a greater depth. Basically, adverse impacts during construction stage in sewage collection network are the same as these of distribution network for water supply except adverse impact concerning Asbestos Cement Pipe. Therefore, the possibility of the adverse impact is predicted concerning the following environmental elements.
Economic activity Traffic /Public Facilities Public Health Condition Solid Waste Hazard (Risk) Landscape Air Pollution Noise and Vibration
Description of adverse impacts in the above environmental elements for the sewers (replacement of existing sewers and installation of new sewers) is omitted. (For details, refer to Table 126.1.19)
Rehabilitation of Sewage Treatment Plants (TP-1 & TP-3) - Construction Stage, Sewerage System
The rehabilitation of sewage treatment plants is only exchange work of equipment such as pumps, motors, sludge scraper, primary effluent sprinklers and electrical equipment with minor civil works. Therefore, it is expected that adverse impacts in the rehabilitation of sewage treatment plants are not significant to environmental and social aspects.
Solid Waste Impact:
Solid waste is generated by replacement of equipment such as pumps and electrical equipment.
A126 - 33
Mitigation Measures: The generated solid waste is recyclable and valuable waste such as pumps and iron material.
Expansion of Reservoir (NEK Old Reservoir) - Operation Stage, Water Supply System Water Right/Right of Common Impact:
There may be a possible occurrence of adverse impact on the additional water right from the Indus River.
Mitigation Measures: No additional water intake from Indus River is required till 2025.
Construction of Distribution Networks - Operation Stage, Water Supply System Economic Activity Impact:
The household which runs short of water or dose not have house connection receives water supply by a tanker that is operated by the Ranger. Therefore, if all the houses have connection and sufficient water can be supplied, water supply tankers will become unnecessary and business will be suspended. There might be possible unemployment of Rangers.
Mitigation Measures: The water supply facilities will be constructed step by step till 2025, and the demand for water supply tankers will not decrease immediately. Moreover, it is expected that the rapid increase in population of Karachi city will increase the necessity for water supply tankers.
Split of Communities Impact:
An obvious difference will arise in the water supply service level between adjacent towns and the project area by the implementation of this project.
Mitigation Measures: Neighbouring towns are also included in the sole Master Plan. The opportunity to receive the same water supply service with the project area in the future is obtained. However, project area has a charge system equivalent to water supply service level.
Rehabilitation of Sewage Treatment Plants (TP-1 & TP-3) - Operation Stage, Sewerage System
Offensive Odour Impact:
Emission of odour is expected from the sewage and sludge treatment processes in the sewage treatment plants.
Mitigation Measures: Basically, it is expected that if the plants are operated and maintained properly, it is possible to control odor emission to the minimum. In addition, it is expected that adverse impacts will be reduced at the circumference environment of the sewage treatment plant. The east and west side of the sewage treatment plant (TP-1) are surrounded is vacant, and the northern and southern areas are occupied by many factories. Similarly, the sewage treatment plant (TP-3) is surrounded by factories, container yards and sea area. Therefore, the odour from these sewage treatment plants is not considered to cause the adverse impacts to local residents. However, the odour monitoring at the boundary of the sewage treatment plants should

A126 - 34
be carried out. According to the monitoring data, it can be judged that the circumference environment of the sewage treatment plants met environmental standards. It is recommended to accumulate the relevant data in the future.

A126 - 35
Tabl
e 12
6.1.
19
Sum
mar
y of
Adv
erse
Impa
cts a
nd M
itiga
tion
Mea
sure
s

A126 - 36
A126 - 37

A126 - 38
A126 - 39

A126 - 40
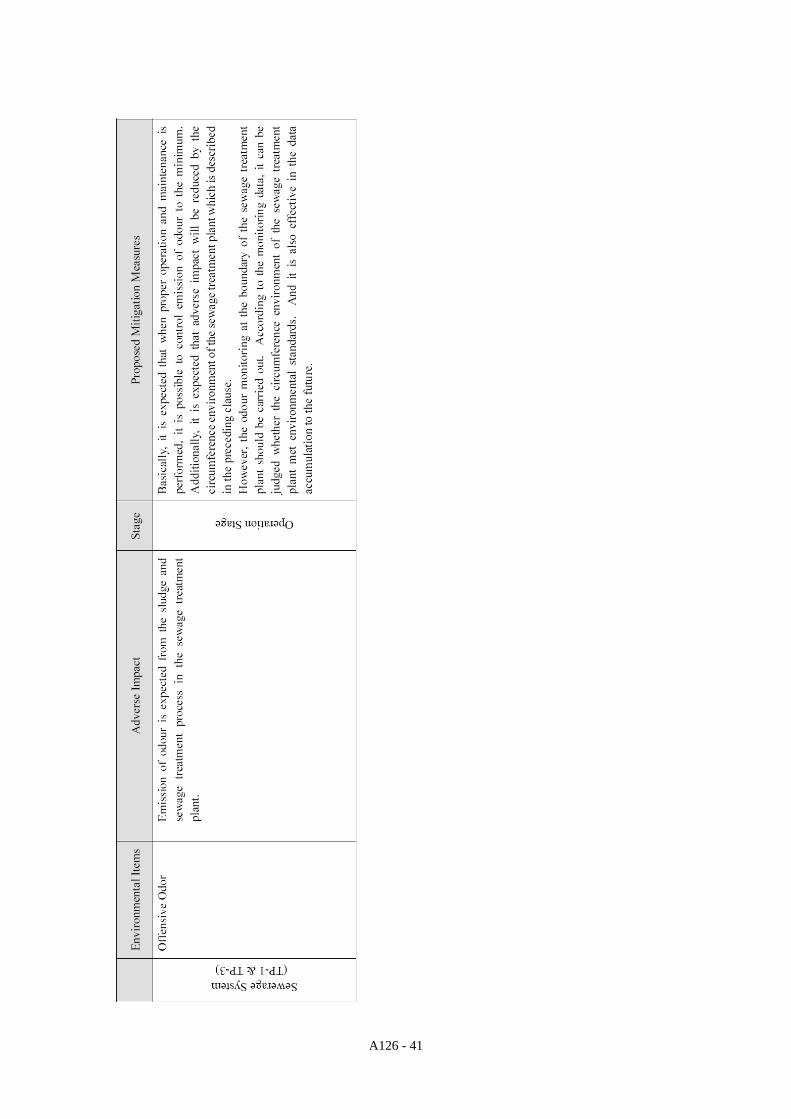
A126 - 41

A126 - 42
Chapter 6 Environmental Management Plan 6.1 RISK ANALYSIS AND MITIGATION PLAN During the operation stage, attention should be paid to the following aspects as Risk Analysis. Power supply One of the main reasons for malfunction of the water supply facilities and the sewage treatment plants is energy shortage. It is suggested that the power generators and fuel storage against emergency be provided to ensure at least minimum services in case of power cuts. Electrical & Mechanical Equipment Failure Operational disruption due to electrical & mechanical equipment failures can be avoided by spare parts and stand-by provision available at site. Operation & maintenance instructions and manuals for emergency should be provided with training to the operation staff in the filtration plants and sewage treatment plants. Water Pollution and Contamination (Water Supply System) Raw water might be possible contaminated. Especially, the contamination by substance which has influence on water use and human health should be considered. If such a situation occurs, measures have to be taken such as raw water bypass and operation stop immediately. These impacts can be mitigated by adopting the following measures:
Regular water quality monitoring Establishment of urgent communication network with the river administrator and related
organization. Preparation of the operations manual for emergency situation Training to the operation staff for the emergency situation
Water Pollution and Contamination (Sewerage System) The possibility of water quality pollution and contamination of the sewage to the sewage treatment plant by an accidental industrial wastewater can be considered. Accidental water quality problems may cause the following problems: Malfunction of treatment process Non compliance with effluent quality standard Influence on the reuse of treated effluent and sludge These impacts can be mitigated by adopting the following measures:
Regular water quality monitoring: Factory asset list preparation and its management that possibly emits hazardous wastes. Establishment of urgent communication network with listed factories and the
Environmental Protection Agency (EPA –Sindh and others.). Preparation of the operations manual for emergency situation Training to the operation staff for the emergency situation
6.2 MONITORING PLAN The project owner should establish monitoring system to assess the quality of the neighbouring environment after the commissioning of the project. An environmental monitoring programme is important as it provides useful information and helps to:
Verify the predictions on environmental impacts presented in this study, Assist in detecting the development of any unwanted environmental situation, and thus,
provides opportunities for adopting appropriate control measures.
Monitoring plan for Water supply system The sampling and water quality analysis of raw water and distributed water will be carried out

A126 - 43
to check the performance of treatment plant and safety of water supply service. Monitoring plan for Sewerage System The sampling and water quality analysis of influent and effluent in the sewage treatment plant will be carried out to check the performance of treatment plant. Moreover, sludge characteristics and air quality should be monitored for the consideration of environmental impacts. The Preliminary Environmental Monitoring Programmes are summarized in Table 126.1.20. Table 126.1.20 Preliminary Environmental Monitoring Programme
Object Monitoring Point Parameters Frequency Water quality (Raw water)
Water quality (Distributed water)
NEK old reservoir Basic parameters for water supply: Escherichia Coli, Color, Taste, Odor, Turbidity and etc. Hazardous substances: According to the WHO Guidelines
- Daily for basic items- Three or four times a
year for hazardous substance
Wat
er S
uppl
y Sy
stem
Water quality and others (Tap water)
Selected house connections
Water pressure, pH, Turbidity, E. Coli, Total coliform and etc.
- Once in a season for two seasons
Water quality (Influent)
Water quality (Treated effluent)
Simple parameters: Temperature, pH, transparency and etc. Basic parameters: BOD, CODcr, SS, Nitrogen and etc. Hazardous substance: According to the effluent Standards.
Daily for the simple parameters and weekly for the basic parameters
- Three or four times a
year for hazardous substances
Sludge characteristics
Hazardous substance and etc.
- Twice in a year Sew
erag
e Sy
stem
Air quality
TP-1 and TP-3
Ammonia, Methyl Mercaptan, Hydrogen Sulphide, and etc.
- Three consecutive days in each of two seasons
Chapter 7 Public Consultation The selection of stakeholder is done by KW&SB in collaboration with JICA Study Team, and the stakeholders are categorized as follows. People in the Study area and people who will be affected by the proposed projects, including
socially vulnerable people Ministries and relevant governmental agencies Local governments such as municipality, commune, and counsel International organizations and donors Non-governmental organizations Universities and research institutes Private sector including bulk users In this Study, three stakeholder meetings (in the early Study stage, the Master Plan stage and the Feasibility stage) were planned in consideration of implementation of EIA Study. The first stakeholder meeting was organized by KW&SB, CDGK, and held on 7 September 2006. The second stakeholder meeting was proposed to be held at the end of the Master Plan stage to inform of contents of the Master Plan and result of environmental and social considerations in the Master

A126 - 44
Plan to the stakeholders. However, as the K-IV project and S-3 Project, the former is under PC-1 process and the latter is under pre-qualification stage of consultants, are included in the M/P, KW&SB was reluctant to disclose the information to the public at this stage. Therefore, the stakeholder meeting to inform of the contents of the Master Plan and results of environmental and social considerations was not held. By postponing the 2nd stakeholder meeting, 3rd meeting is not held yet. The results of the first stakeholder meeting are summarized as below. First Stakeholder Meeting (1) Participants The stakeholders were selected by KW&SB in collaboration with JICA Study Team and invitation letters were sent to the invitees from 25 August 2006. At this stage, as the contents of M/P are not fixed yet, it is difficult to specify who will be affected directly or indirectly by the project. The main objective is to inform about the approaches to environmental and social considerations, thus, as the representative of the people, Town Nazims (town head) who are elected directly by the people were invited. The following table shows the category and number of participants. Table A73.9.1 Number of Attendants at the First Stakeholder Meeting
City District Government 4 Universities & Research Institutes 4 Town Nazims 7 NGOs 3 Government of Sindh 4 International Organisations &Donors 3 Bulk Consumers 14 Cantonment Board & DHA 1 KW&SB 37 Media 7 JICA Study Team 10 TOTAL 94
(2) Main Topics Discussed The main topics discussed in the meeting are summarized below: Many Master Plans (M/Ps) were prepared in the late 1980s but never implemented. Various
agencies have their own M/Ps so the Study Team should incorporate all the M/Ps into future JICA M/P. Real stakeholders such as towns, citizens should be invited. To this comment, KW&SB answered that the Study Team would go through other M/Ps. About the stakeholders, the representative of Town i.e. Town Nazims are invited to the meeting.
There is the opinion that the treatment plants are not properly working and the nallahs turned into the sewers. To this comment, treatment plants are working but not at full capacity due to the encroachment on the drainage. CDGK will take the action to remove all the encroaching premises to utilize the nallah / drainage for their original use.
There is the suggestion to use another water source such as rain harvesting or groundwater, not only Indus River and Hub Dam. The amount of water necessary for Karachi City is huge and the groundwater is not sufficient for water supply according to the study already carried out. Another source is required and desalination is one option that will be considered.
Chapter 8 Conclusion The expected positive impacts of the priority project include: Realization of the living condition which has possibility to access safe water during all day; Possibility to collect all of generated sewage and to treat appropriately, and expectation of the
health, sanitary and environmental improvement as the result; Enhanced employment opportunities particularly in the construction stage. Furthermore,
promotion of the regional economy by improvement of the living environment of the overall project area is expected.
Based on the findings of the EIA Study, the following items should be considered as mitigation measures for project implementation. However, the following adverse impacts are not fatal. If mitigation measures are taken properly, the adverse impacts will be satisfactorily controlled
A126 - 45
extremely. Land acquisition for expansion of reservoir (NEK old) The site (land owner is the Sindh Province) which adjoins the east side of the existing reservoir is not used for other project and there is sufficient area as the construction site for the expansion of reservoir (NEK Old Reservoir). If this site is determined as a proposed site, it is expected that adverse impacts of land acquisition are very small. Construction of water distribution network and sewer collection network The main adverse impacts in the construction stage of water distribution network and sewer collection network are effects of the economic activity, traffic situation, public health condition, air pollution, noise and vibration. Especially, when appropriate measures are not performed, it is expected that serious traffic disturbance will occur. However, these are short-term impacts, and these can be reduced by appropriate construction site management including an announcement and traffic control. Impact on the tanker water service by implementation of the Distribution Network Improvement The Distribution Network Improvement in the priority project area will be completed by 2014. Consequently, it is predicted that the tanker water service will become unnecessary in the project area and its business will end. However, the water supply facilities in the Karachi city will be constructed step by step till 2025, the demand for tanker water supply will not decrease immediately. In fact, it is even predicted that the quick increase in population of Karachi City will raise the necessity for tanker water service. Water pollution and offensive odor from sewage treatment plants (TP-1 and TP-3) According to the sewerage system planning, if the treatment plants are properly operated and maintained, the effluent will meet the effluent water quality standards and no significant adverse impacts may be expected. Similarly, it is expected that when proper operation and maintenance is performed, odor emission can be controlled. Impact due to disruption of operation of the water supply facilities and the sewage treatment plants (power cut and electrical accident) A power failure can be compensated for the installation of power generator. The social infrastructure improvement concerning electricity progresses in the future, and it is expected that power failure will less frequently occur. Furthermore, the adverse Impacts can be controlled to the minimum by preparation of the spare electrical & mechanical equipment, operation manual for emergency, and training to the operation staff for the emergency situation.

APPENDIX – A127.1
Economic and Financial Evaluation and Impacts

A127 - 1
A127.1 Economic and Financial Evaluation and Economic Impacts Table A127.1.1 Beneficiary and Water Demand of Water Supply Project: 2012 to 2014
Item Year Type 1 Type 2 Type 3 Type 4 TotalBeneficiary (Population Base: Unit: 1000)
Existing Residents2012 170.5 199.9 100.7 136.1 607.32013 531.9 623.5 314.2 424.5 1,894.02014 716.9 840.4 423.4 572.1 2,552.82015 716.9 840.4 423.4 572.1 2,552.82016 716.9 840.4 423.4 572.1 2,552.8
Increment Residents2012 11.6 13.6 6.8 9.2 41.22013 23.1 27.1 13.6 18.4 82.32014 34.7 40.6 20.5 27.7 123.42015 34.7 40.6 20.5 27.7 123.42016 34.7 40.6 20.5 27.7 123.4
Total Residents2012 182.1 213.5 107.6 145.3 648.52013 555.0 650.6 327.8 442.9 1,976.32014 751.5 881.0 443.9 599.7 2,676.22015 751.5 881.0 443.9 599.7 2,676.22016 751.5 881.0 443.9 599.7 2,676.2
Beneficiary (Household Base, Unit:1000)Existing Residents
2012 24.4 28.6 14.4 19.4 86.82013 76.0 89.1 44.9 60.6 270.62014 102.4 120.1 60.5 81.7 364.72015 102.4 120.1 60.5 81.7 364.72016 102.4 120.1 60.5 81.7 364.7
Increment Residents2012 1.7 1.9 1.0 1.3 5.92013 3.3 3.9 1.9 2.6 11.82014 5.0 5.8 2.9 4.0 17.62015 5.0 5.8 2.9 4.0 17.62016 5.0 5.8 2.9 4.0 17.6
Total Residents2012 26.0 30.5 15.4 20.8 92.62013 79.3 92.9 46.8 63.3 282.32014 107.4 125.9 63.4 85.7 382.32015 107.4 125.9 63.4 85.7 382.32016 107.4 125.9 63.4 85.7 382.3
Domestic Water Consumption of Beneficiaries (Unit: Million m3/Year)Existing Residents
2012 3.8 6.6 3.9 6.7 21.02013 11.8 20.8 12.2 21.2 66.02014 16.0 28.2 16.7 29.0 90.02015 16.0 28.2 16.7 29.0 90.02016 16.0 28.2 16.7 29.0 90.0
Increment Residents2012 0.3 0.4 0.3 0.5 1.42013 0.5 0.9 0.5 0.9 2.92014 0.8 1.4 0.8 1.4 4.42015 0.8 1.4 0.8 1.4 4.42016 0.8 1.4 0.8 1.4 4.4
Total Residents2012 4.0 7.0 4.1 7.2 22.42013 12.3 21.7 12.7 22.1 68.82014 16.8 29.6 17.5 30.4 94.42015 16.8 29.6 17.5 30.4 94.42016 16.8 29.6 17.5 30.4 94.4
Non-domestic Water Consumption of Beneficiaries (Unit: Million m3/Year)2012 10.52013 32.32014 44.02015 44.02016 44.0

A127 - 2
Table A127.1.2 Economic Benefit of Proposed Water Supply Project
(Unit: Rs. Million)Positive Benefit
Domestic Saving Benefit
2012 108 215 137 349 809 362013 439 1,323 845 2,146 4,753 2232014 844 1,542 1,085 2,751 6,221 2842015 904 1,805 1,165 2,953 6,827 304
Positive BenefitMedical Benefit
Family ExpenseType 1 Type 2 Type 3 Type 4
2012 20 20 12 35 21 2 1112013 42 41 25 72 85 6 2722014 169 165 102 291 150 11 8892015 169 165 102 291 173 13 913
Positive Benefit Negative BenefitReduction Positive
of O&M BenefitExpenses Total Type 1 Type 2
2012 11 967 461 363 9772013 45 5,292 465 769 2,0702014 81 7,475 487 394 1,0602015 93 8,136 0 0 0
Type 3 Type 42012 627 1729 137 4293 -33262013 1329 3662 283 8578 -32852014 681 1875 152 4648 28272015 0 0 0 0 8,136
Type 4
Domestic Water System Non-domestic
SystemTotal
Type 1 Type 2 Type 3
MedicalTreatment
Sub-total
Year
Year
Year
Year Grand Total
Non-domesticSavingBenefit
DistributionPiping
Domestic Water System
Sub-total
Absence fromWork
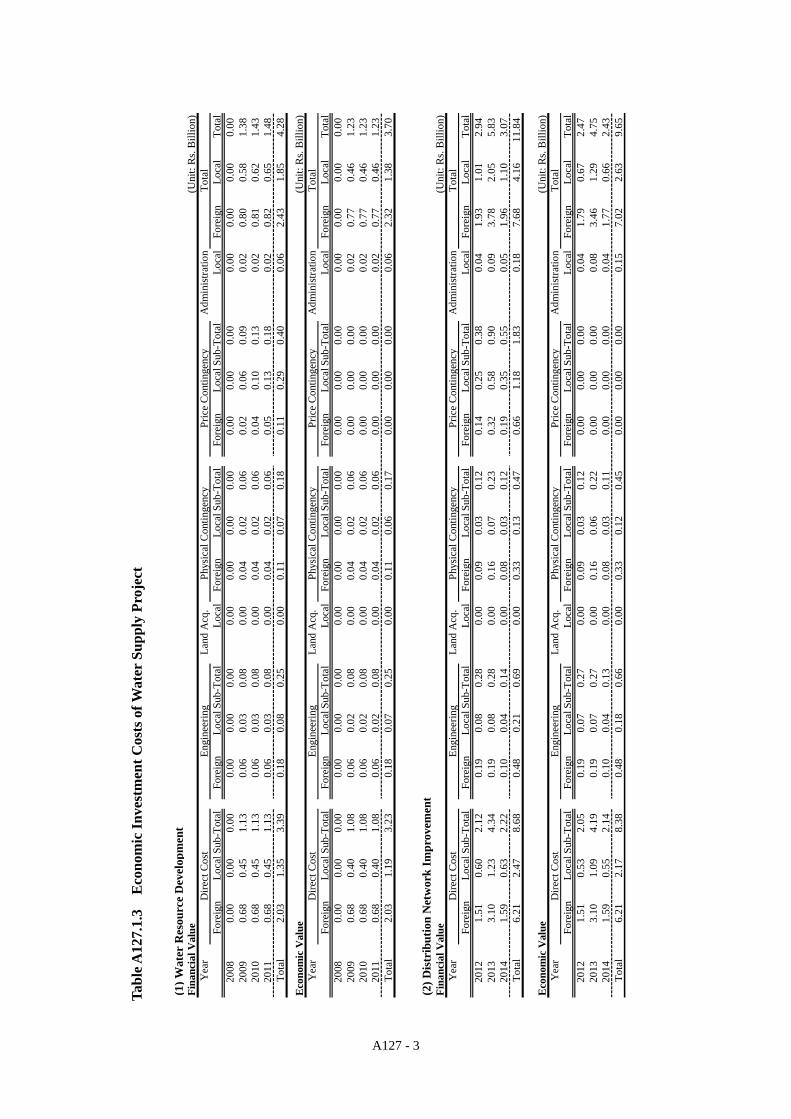
A127 - 3
(1) W
ater
Res
ourc
e D
evel
opm
ent
Fina
ncia
l Val
ue(U
nit:
Rs.
Bill
ion)
Yea
rD
irect
Cos
t
Engi
neer
ing
Land
Acq
.Ph
ysic
al C
ontin
genc
y
Pric
e C
ontin
genc
yA
dmin
istra
tion
Tota
lFo
reig
nLo
calS
ub-T
otal
Fore
ign
Loca
lSub
-Tot
alLo
cal
Fore
ign
Loca
lSub
-Tot
alFo
reig
nLo
calS
ub-T
otal
Loca
lFo
reig
nLo
cal
Tota
l20
080.
000.
000.
000.
000.
000.
000.
000.
000.
000.
000.
000.
000.
000.
000.
000.
000.
0020
090.
680.
451.
130.
060.
030.
080.
000.
040.
020.
060.
020.
060.
090.
020.
800.
581.
3820
100.
680.
451.
130.
060.
030.
080.
000.
040.
020.
060.
040.
100.
130.
020.
810.
621.
4320
110.
680.
451.
130.
060.
030.
080.
000.
040.
020.
060.
050.
130.
180.
020.
820.
651.
48To
tal
2.03
1.35
3.39
0.18
0.08
0.25
0.00
0.11
0.07
0.18
0.11
0.29
0.40
0.06
2.43
1.85
4.28
Eco
nom
ic V
alue
(Uni
t: R
s. B
illio
n)Y
ear
Dire
ct C
ost
En
gine
erin
gLa
nd A
cq.
Phys
ical
Con
tinge
ncy
Pr
ice
Con
tinge
ncy
Adm
inist
ratio
nTo
tal
Fore
ign
Loca
lSub
-Tot
alFo
reig
nLo
calS
ub-T
otal
Loca
lFo
reig
nLo
calS
ub-T
otal
Fore
ign
Loca
lSub
-Tot
alLo
cal
Fore
ign
Loca
lTo
tal
2008
0.00
0.00
0.00
0.00
0.00
0.00
0.00
0.00
0.00
0.00
0.00
0.00
0.00
0.00
0.00
0.00
0.00
2009
0.68
0.40
1.08
0.06
0.02
0.08
0.00
0.04
0.02
0.06
0.00
0.00
0.00
0.02
0.77
0.46
1.23
2010
0.68
0.40
1.08
0.06
0.02
0.08
0.00
0.04
0.02
0.06
0.00
0.00
0.00
0.02
0.77
0.46
1.23
2011
0.68
0.40
1.08
0.06
0.02
0.08
0.00
0.04
0.02
0.06
0.00
0.00
0.00
0.02
0.77
0.46
1.23
Tota
l2.
031.
193.
230.
180.
070.
250.
000.
110.
060.
170.
000.
000.
000.
062.
321.
383.
70
(2) D
istr
ibut
ion
Net
wor
k Im
prov
emen
tFi
nanc
ial V
alue
(Uni
t: R
s. B
illio
n)Y
ear
Dire
ct C
ost
En
gine
erin
gLa
nd A
cq.
Phys
ical
Con
tinge
ncy
Pr
ice
Con
tinge
ncy
Adm
inist
ratio
nTo
tal
Fore
ign
Loca
lSub
-Tot
alFo
reig
nLo
calS
ub-T
otal
Loca
lFo
reig
nLo
calS
ub-T
otal
Fore
ign
Loca
lSub
-Tot
alLo
cal
Fore
ign
Loca
lTo
tal
2012
1.51
0.60
2.12
0.19
0.08
0.28
0.00
0.09
0.03
0.12
0.14
0.25
0.38
0.04
1.93
1.01
2.94
2013
3.10
1.23
4.34
0.19
0.08
0.28
0.00
0.16
0.07
0.23
0.32
0.58
0.90
0.09
3.78
2.05
5.83
2014
1.59
0.63
2.22
0.10
0.04
0.14
0.00
0.08
0.03
0.12
0.19
0.35
0.55
0.05
1.96
1.10
3.07
Tota
l6.
212.
478.
680.
480.
210.
690.
000.
330.
130.
470.
661.
181.
830.
187.
684.
1611
.84
Eco
nom
ic V
alue
(Uni
t: R
s. B
illio
n)Y
ear
Dire
ct C
ost
En
gine
erin
gLa
nd A
cq.
Phys
ical
Con
tinge
ncy
Pr
ice
Con
tinge
ncy
Adm
inist
ratio
nTo
tal
Fore
ign
Loca
lSub
-Tot
alFo
reig
nLo
calS
ub-T
otal
Loca
lFo
reig
nLo
calS
ub-T
otal
Fore
ign
Loca
lSub
-Tot
alLo
cal
Fore
ign
Loca
lTo
tal
2012
1.51
0.53
2.05
0.19
0.07
0.27
0.00
0.09
0.03
0.12
0.00
0.00
0.00
0.04
1.79
0.67
2.47
2013
3.10
1.09
4.19
0.19
0.07
0.27
0.00
0.16
0.06
0.22
0.00
0.00
0.00
0.08
3.46
1.29
4.75
2014
1.59
0.55
2.14
0.10
0.04
0.13
0.00
0.08
0.03
0.11
0.00
0.00
0.00
0.04
1.77
0.66
2.43
Tota
l6.
212.
178.
380.
480.
180.
660.
000.
330.
120.
450.
000.
000.
000.
157.
022.
639.
65
Tabl
e A12
7.1.
3 E
cono
mic
Inve
stm
ent C
osts
of W
ater
Sup
ply
Proj
ect

A127 - 4
Table A127.1.4 Economic O&M Costs of Water Supply Project Bulk Water SourceFinancial Value (Unit: Rs. Million) Economic Value (Unit: Rs. Million)
Year Elec-tricity
Chemi-cal
Mainte-nance
OtherCosts
PriceContin-gency
Total Year Elec-tricity
Chemi-cal
Mainte-nance
OtherCosts
PriceContin-gency
Total
2012 26 0 10 44 20 101 2012 25 0 10 39 0 742013 78 0 31 49 41 199 2013 75 0 30 43 0 1482014 104 0 42 52 59 257 2014 100 0 40 46 0 1862015 104 0 42 52 70 267 2015 100 0 40 46 0 1862016 104 0 42 52 81 278 2016 100 0 40 46 0 1862017 104 0 42 52 92 290 2017 100 0 40 46 0 1862018 104 0 42 52 104 302 2018 100 0 40 46 0 1862019 104 0 42 52 117 314 2019 100 0 40 46 0 1862020 104 0 42 52 130 328 2020 100 0 40 46 0 1862021 104 0 42 52 144 342 2021 100 0 40 46 0 1862022 104 0 42 52 159 357 2022 100 0 40 46 0 1862023 104 0 42 52 175 372 2023 100 0 40 46 0 1862024 104 0 42 52 191 389 2024 100 0 40 46 0 1862025 104 0 42 52 209 406 2025 100 0 40 46 0 1862026 104 0 42 52 227 425 2026 100 0 40 46 0 186
:: :: :: :: :: :: :: :: :: :: :: :: :: :: :: :: :: :: :: :: :: :: :: :: :: :: :: ::
2044 104 0 42 52 806 1,003 2055 100 0 40 46 0 186
DNI (Including O&M and Replacement Costs)Financial Value (Unit: Rs. Million) Economic Value (Unit: Rs. Million)
Year Elec-tricity
Chemi-cal
Mainte-nance
OtherCosts
PriceContin-gency
Total Year Elec-tricity
Chemi-cal
Mainte-nance
OtherCosts
PriceContin-gency
Total
2012 0 0 55 0 9 64 2012 0 0 53 0 0 532013 0 0 165 0 32 197 2013 0 0 159 0 0 1592014 0 0 220 0 50 271 2014 0 0 212 0 0 2122015 0 0 220 0 59 279 2015 0 0 212 0 0 2122016 0 0 220 0 68 288 2016 0 0 212 0 0 2122017 0 0 220 0 77 297 2017 0 0 212 0 0 2122018 0 0 220 0 87 307 2018 0 0 212 0 0 2122019 0 0 220 0 97 317 2019 0 0 212 0 0 2122020 0 0 220 0 108 328 2020 0 0 212 0 0 2122021 0 0 220 0 119 339 2021 0 0 212 0 0 2122022 0 0 220 0 131 351 2022 0 0 212 0 0 2122023 0 0 220 0 143 364 2023 0 0 212 0 0 2122024 0 0 220 0 156 377 2024 0 0 212 0 0 2122025 0 0 220 0 170 390 2025 0 0 212 0 0 2122026 0 0 220 0 0 221 2026 0 0 212 0 0 212
:: :: :: :: :: :: :: :: :: :: :: :: :: :: :: :: :: :: :: :: :: :: :: :: :: :: :: ::
2044 0 0 220 0 618 839 2055 0 0 212 0 0 212
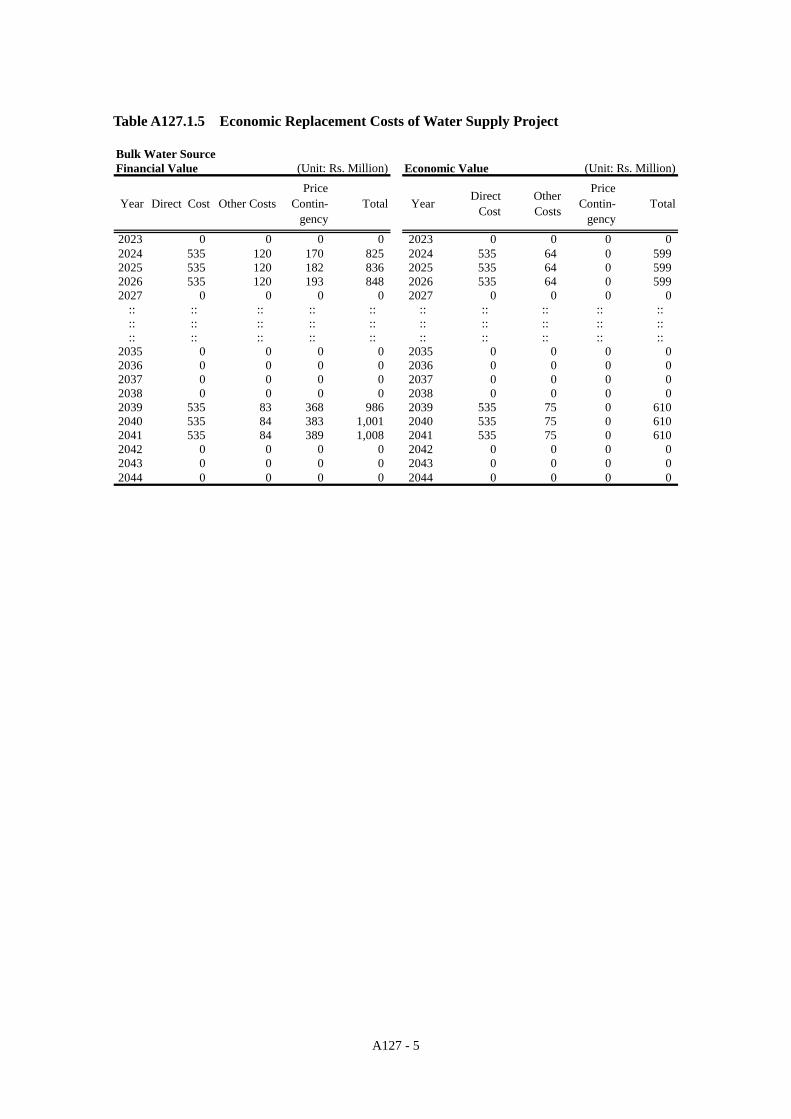
A127 - 5
Table A127.1.5 Economic Replacement Costs of Water Supply Project Bulk Water SourceFinancial Value (Unit: Rs. Million) Economic Value (Unit: Rs. Million)
Year Direct Cost Other CostsPrice
Contin-gency
Total Year DirectCost
OtherCosts
PriceContin-
gencyTotal
2023 0 0 0 0 2023 0 0 0 02024 535 120 170 825 2024 535 64 0 5992025 535 120 182 836 2025 535 64 0 5992026 535 120 193 848 2026 535 64 0 5992027 0 0 0 0 2027 0 0 0 0
:: :: :: :: :: :: :: :: :: :: :: :: :: :: :: :: :: :: :: :: :: :: :: :: :: :: :: :: :: ::
2035 0 0 0 0 2035 0 0 0 02036 0 0 0 0 2036 0 0 0 02037 0 0 0 0 2037 0 0 0 02038 0 0 0 0 2038 0 0 0 02039 535 83 368 986 2039 535 75 0 6102040 535 84 383 1,001 2040 535 75 0 6102041 535 84 389 1,008 2041 535 75 0 6102042 0 0 0 0 2042 0 0 0 02043 0 0 0 0 2043 0 0 0 02044 0 0 0 0 2044 0 0 0 0
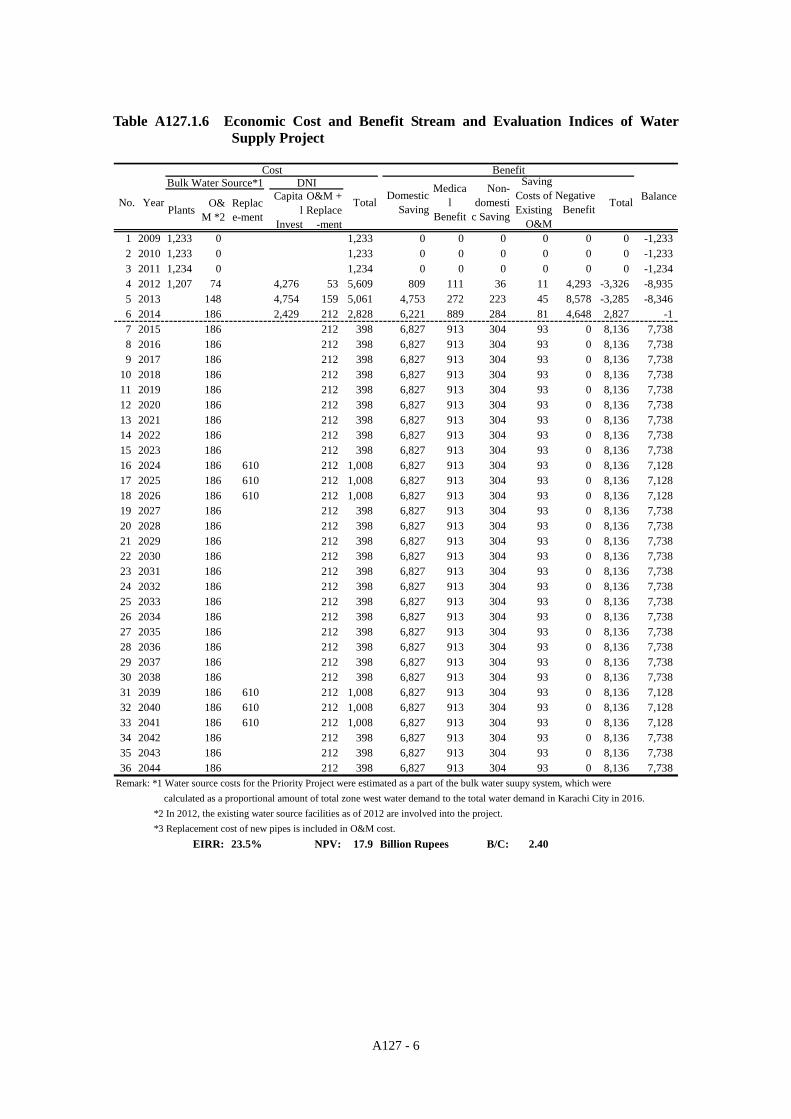
A127 - 6
Table A127.1.6 Economic Cost and Benefit Stream and Evaluation Indices of Water Supply Project
Cost Benefit
Bulk Water Source*1 DNI
Plants O&M *2
Replace-ment
Capital
Invest
O&M +Replace
-ment1 2009 1,233 0 1,233 0 0 0 0 0 0 -1,2332 2010 1,233 0 1,233 0 0 0 0 0 0 -1,2333 2011 1,234 0 1,234 0 0 0 0 0 0 -1,2344 2012 1,207 74 4,276 53 5,609 809 111 36 11 4,293 -3,326 -8,9355 2013 148 4,754 159 5,061 4,753 272 223 45 8,578 -3,285 -8,3466 2014 186 2,429 212 2,828 6,221 889 284 81 4,648 2,827 -17 2015 186 212 398 6,827 913 304 93 0 8,136 7,7388 2016 186 212 398 6,827 913 304 93 0 8,136 7,7389 2017 186 212 398 6,827 913 304 93 0 8,136 7,738
10 2018 186 212 398 6,827 913 304 93 0 8,136 7,73811 2019 186 212 398 6,827 913 304 93 0 8,136 7,73812 2020 186 212 398 6,827 913 304 93 0 8,136 7,73813 2021 186 212 398 6,827 913 304 93 0 8,136 7,73814 2022 186 212 398 6,827 913 304 93 0 8,136 7,73815 2023 186 212 398 6,827 913 304 93 0 8,136 7,73816 2024 186 610 212 1,008 6,827 913 304 93 0 8,136 7,12817 2025 186 610 212 1,008 6,827 913 304 93 0 8,136 7,12818 2026 186 610 212 1,008 6,827 913 304 93 0 8,136 7,12819 2027 186 212 398 6,827 913 304 93 0 8,136 7,73820 2028 186 212 398 6,827 913 304 93 0 8,136 7,73821 2029 186 212 398 6,827 913 304 93 0 8,136 7,73822 2030 186 212 398 6,827 913 304 93 0 8,136 7,73823 2031 186 212 398 6,827 913 304 93 0 8,136 7,73824 2032 186 212 398 6,827 913 304 93 0 8,136 7,73825 2033 186 212 398 6,827 913 304 93 0 8,136 7,73826 2034 186 212 398 6,827 913 304 93 0 8,136 7,73827 2035 186 212 398 6,827 913 304 93 0 8,136 7,73828 2036 186 212 398 6,827 913 304 93 0 8,136 7,73829 2037 186 212 398 6,827 913 304 93 0 8,136 7,73830 2038 186 212 398 6,827 913 304 93 0 8,136 7,73831 2039 186 610 212 1,008 6,827 913 304 93 0 8,136 7,12832 2040 186 610 212 1,008 6,827 913 304 93 0 8,136 7,12833 2041 186 610 212 1,008 6,827 913 304 93 0 8,136 7,12834 2042 186 212 398 6,827 913 304 93 0 8,136 7,73835 2043 186 212 398 6,827 913 304 93 0 8,136 7,73836 2044 186 212 398 6,827 913 304 93 0 8,136 7,738
Remark: *1 Water source costs for the Priority Project were estimated as a part of the bulk water suupy system, which were calculated as a proportional amount of total zone west water demand to the total water demand in Karachi City in 2016. *2 In 2012, the existing water source facilities as of 2012 are involved into the project. *3 Replacement cost of new pipes is included in O&M cost.
EIRR: 23.5% NPV: 17.9 Billion Rupees B/C: 2.40
BalanceTotalNo. Year DomesticSaving
Medical
Benefit
Non-domesti
c Saving
SavingCosts ofExisting
O&M
NegativeBenefit Total
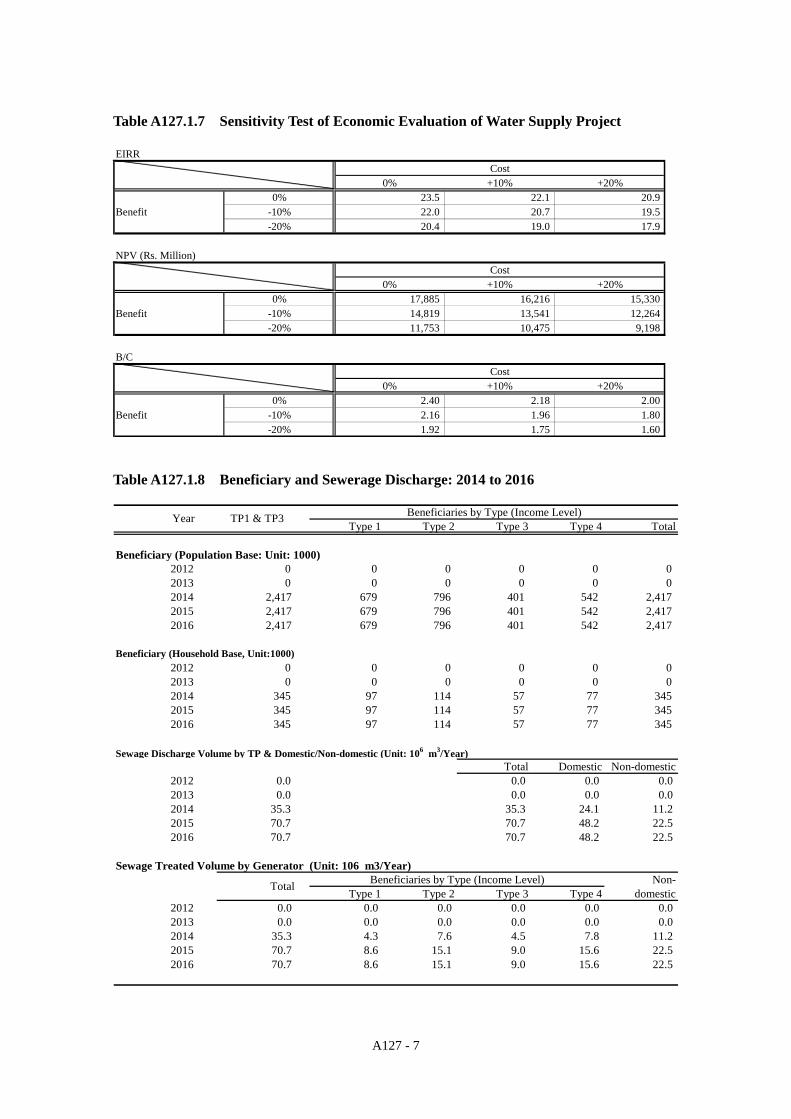
A127 - 7
Table A127.1.7 Sensitivity Test of Economic Evaluation of Water Supply Project EIRR
Cost0% +10% +20%
0% 23.5 22.1 20.9Benefit -10% 22.0 20.7 19.5
-20% 20.4 19.0 17.9
NPV (Rs. Million)Cost
0% +10% +20%0% 17,885 16,216 15,330
Benefit -10% 14,819 13,541 12,264-20% 11,753 10,475 9,198
B/CCost
0% +10% +20%0% 2.40 2.18 2.00
Benefit -10% 2.16 1.96 1.80-20% 1.92 1.75 1.60
Table A127.1.8 Beneficiary and Sewerage Discharge: 2014 to 2016
Beneficiaries by Type (Income Level)Type 1 Type 2 Type 3 Type 4 Total
Beneficiary (Population Base: Unit: 1000)2012 0 0 0 0 0 02013 0 0 0 0 0 02014 2,417 679 796 401 542 2,4172015 2,417 679 796 401 542 2,4172016 2,417 679 796 401 542 2,417
Beneficiary (Household Base, Unit:1000)2012 0 0 0 0 0 02013 0 0 0 0 0 02014 345 97 114 57 77 3452015 345 97 114 57 77 3452016 345 97 114 57 77 345
Sewage Discharge Volume by TP & Domestic/Non-domestic (Unit: 106 m3/Year)Total Domestic Non-domestic
2012 0.0 0.0 0.0 0.02013 0.0 0.0 0.0 0.02014 35.3 35.3 24.1 11.22015 70.7 70.7 48.2 22.52016 70.7 70.7 48.2 22.5
Sewage Treated Volume by Generator (Unit: 106 m3/Year)Beneficiaries by Type (Income Level) Non-
Type 1 Type 2 Type 3 Type 4 domestic2012 0.0 0.0 0.0 0.0 0.0 0.02013 0.0 0.0 0.0 0.0 0.0 0.02014 35.3 4.3 7.6 4.5 7.8 11.22015 70.7 8.6 15.1 9.0 15.6 22.52016 70.7 8.6 15.1 9.0 15.6 22.5
Total
Year TP1 & TP3

A127 - 8
Table A127.1.9 Economic Benefit of Sewerage Project
(Unit: Rs. Million)Domestic Benefit of Improved Environment
Year
2012 0.00 0.00 0.00 0.00 0.00 0.002013 0.00 0.00 0.00 0.00 0.00 0.002014 24.94 75.82 61.60 174.60 336.95 85.792015 49.87 151.64 123.19 349.20 673.91 171.58
Medical BenefitYear Family Expense
Type 1 Type 2 Type 3 Type 42012 0.00 0.00 0.00 0.00 0.00 0.00 0.002013 0.00 0.00 0.00 0.00 0.00 0.00 0.002014 30.51 29.89 18.51 52.54 28.09 1.81 161.342015 61.02 59.77 37.01 105.08 56.19 3.61 322.68
Saving Benefit of O&M Expenses Reduction PositiveYear of Septic Tank of O&M Benefit
Type 1 Type 2 Total Expenses Total2012 0.00 0.00 0.00 0.00 0.002013 0.00 0.00 0.00 0.00 0.002014 7.29 16.72 24.02 7.23 615.332015 14.59 33.45 48.04 29.56 1,245.76
Negative BenefitYear Elimination of Septic Tanks
Type 1 Type 2 Total2012 15.11 0.00 0.00 15.11 -15.112013 13.27 0.00 0.00 13.27 -13.272014 13.32 37.32 85.55 136.19 479.142015 0 0.00 0.00 0.00 1,245.76
Disposal ofExisting Sewer
Type 1 Type 2 Type 3 Type 4
Grand Total
MedicalTreatment
Absence fromWork
Sub-total
Non-domesticBenefit of
Imp.Sub-total

A127 - 9
Table A127.1.10 Investment Costs of Sewerage Project Financial Value (Unit: Rs. Million)
Year Direct Cost Engineering Physical ContingencyForeign Local Sub-Total Foreign Local Sub-Total Foreign Local Sub-Total
2012 191.68 505.84 697.52 55.64 23.85 79.49 12.37 26.48 38.852013 356.68 910.43 1,267.10 55.64 23.85 79.49 20.62 46.71 67.332014 164.98 404.56 569.54 27.82 11.92 39.74 9.64 20.82 30.46Total 713.33 1,820.83 2,534.16 139.11 59.62 198.72 42.62 94.02 136.64
Year Price Contingency Administration TotalForeign Local Sub-Total Local Foreign Local Total
2012 20.07 188.11 208.18 15.36 279.75 759.64 1,039.402013 40.45 410.56 451.02 27.97 473.39 1,419.52 1,892.912014 22.24 220.24 242.48 13.23 224.67 670.79 895.46Total 82.76 818.92 901.68 56.57 977.81 2,849.95 3,827.77
Economic Value (Unit: Rs. Billion)Year Direct Cost Engineering Physical Contingency
Foreign Local Sub-Total Foreign Local Sub-Total Foreign Local Sub-Total2012 191.68 445.14 636.82 55.64 20.98 76.63 12.37 23.31 35.672013 356.68 801.18 1,157.85 55.64 20.98 76.63 20.62 41.11 61.722014 164.98 356.02 520.99 27.82 10.49 38.31 9.64 18.33 27.97Total 713.33 1,602.33 2,315.66 139.11 52.46 191.57 42.62 82.74 125.36
Year Price Contingency Administration Grand TotalForeign Local Sub-Total Local Foreign Local Total
2012 0.00 0.00 0.00 11.24 259.68 500.67 760.352013 0.00 0.00 0.00 19.44 432.93 882.71 1,315.642014 0.00 0.00 0.00 8.81 202.44 393.64 596.08Total 0.00 0.00 0.00 39.49 895.05 1,777.02 2,672.07
Remark: The table indicates facilities newly constructed in the project. Table A127.1.11 Economic O&M Costs of Sewerage Project Financial Value (Unit: Rs. Million) Economic Value (Unit: Rs. Million)
Year Elec-tricity
SludgeDispo-
sal
Mainte-nance
Person-nel
OtherCosts
PriceContin-gency
Total Year Elec-tricity
SludgeDispo-
sal
Mainte-nance
Person-nel
OtherCosts
PriceContin-gency
Total
2012 0.00 0.00 0.00 0.00 0.00 0.00 0.00 2012 0.00 0.00 0.00 0.00 0.00 0.00 0.002013 0.00 0.00 0.00 0.00 0.00 0.00 0.00 2013 0.00 0.00 0.00 0.00 0.00 0.00 0.002014 11.62 2.45 6.00 5.65 5.29 8.92 39.94 2014 11.20 0.00 5.79 4.97 3.90 0.00 25.872015 23.25 4.90 12.01 11.30 10.59 20.93 82.98 2015 22.41 0.00 11.57 9.95 7.81 0.00 51.742016 23.25 4.90 12.01 11.30 10.59 24.18 86.23 2016 22.41 0.00 11.57 9.95 7.81 0.00 51.742017 23.25 4.90 12.01 11.30 10.59 27.60 89.65 2017 22.41 0.00 11.57 9.95 7.81 0.00 51.742018 23.25 4.90 12.01 11.30 10.59 31.20 93.25 2018 22.41 0.00 11.57 9.95 7.81 0.00 51.742019 23.25 4.90 12.01 11.30 10.59 34.99 97.04 2019 22.41 0.00 11.57 9.95 7.81 0.00 51.742020 23.25 4.90 12.01 11.30 10.59 38.98 101.03 2020 22.41 0.00 11.57 9.95 7.81 0.00 51.742021 23.25 4.90 12.01 11.30 10.59 43.18 105.23 2021 22.41 0.00 11.57 9.95 7.81 0.00 51.742022 23.25 4.90 12.01 11.30 10.59 47.61 109.66 2022 22.41 0.00 11.57 9.95 7.81 0.00 51.742023 23.25 4.90 12.01 11.30 10.59 52.27 114.32 2023 22.41 0.00 11.57 9.95 7.81 0.00 51.742024 23.25 4.90 12.01 11.30 10.59 57.19 119.23 2024 22.41 0.00 11.57 9.95 7.81 0.00 51.742025 23.25 4.90 12.01 11.30 10.59 62.36 124.41 2025 22.41 0.00 11.57 9.95 7.81 0.00 51.742026 23.25 4.90 12.01 0.01 10.59 67.83 118.58 2026 22.41 0.00 11.57 9.95 7.81 0.00 51.74
:: :: :: :: :: :: :: :: :: :: :: :: :: :: :: :: :: :: :: :: :: :: :: :: :: :: :: ::
2044 23.25 4.90 12.01 0.01 10.59 0.37 51.13 2055 22.41 0.00 11.57 9.95 7.81 0.00 51.74
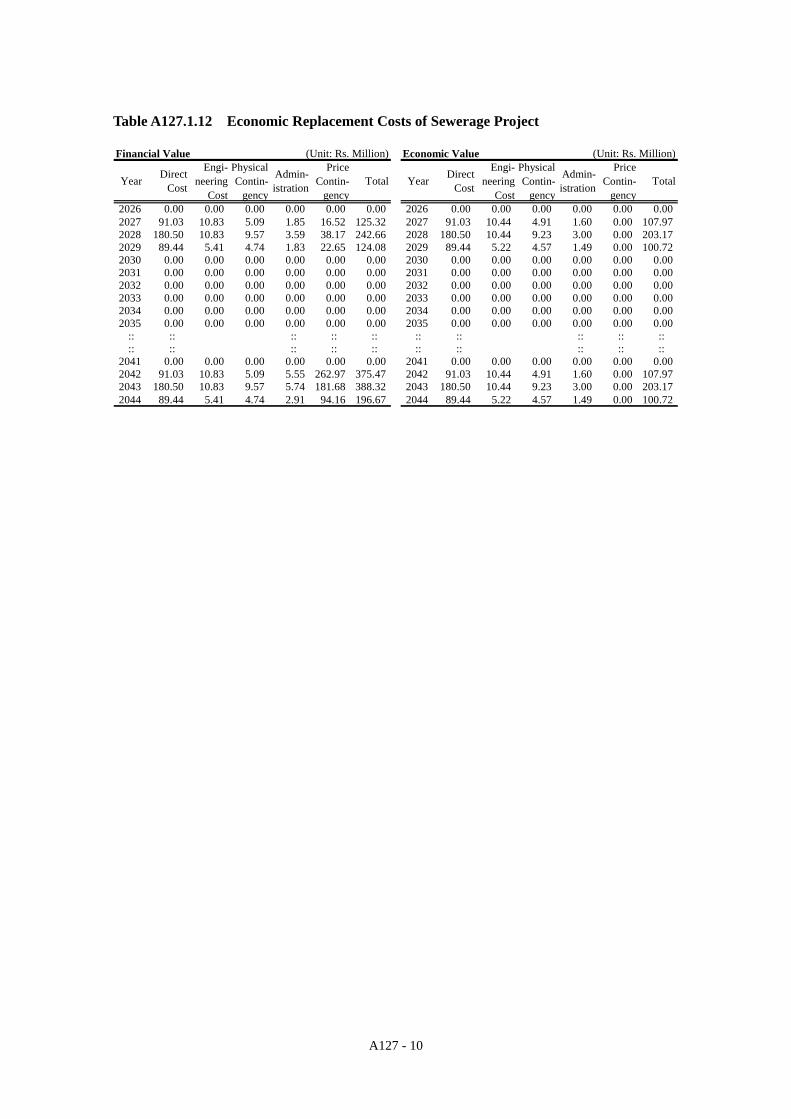
A127 - 10
Table A127.1.12 Economic Replacement Costs of Sewerage Project Financial Value (Unit: Rs. Million) Economic Value (Unit: Rs. Million)
Year DirectCost
Engi-neering
Cost
PhysicalContin-
gency
Admin-istration
PriceContin-
gencyTotal Year Direct
Cost
Engi-neering
Cost
PhysicalContin-
gency
Admin-istration
PriceContin-
gencyTotal
2026 0.00 0.00 0.00 0.00 0.00 0.00 2026 0.00 0.00 0.00 0.00 0.00 0.002027 91.03 10.83 5.09 1.85 16.52 125.32 2027 91.03 10.44 4.91 1.60 0.00 107.972028 180.50 10.83 9.57 3.59 38.17 242.66 2028 180.50 10.44 9.23 3.00 0.00 203.172029 89.44 5.41 4.74 1.83 22.65 124.08 2029 89.44 5.22 4.57 1.49 0.00 100.722030 0.00 0.00 0.00 0.00 0.00 0.00 2030 0.00 0.00 0.00 0.00 0.00 0.002031 0.00 0.00 0.00 0.00 0.00 0.00 2031 0.00 0.00 0.00 0.00 0.00 0.002032 0.00 0.00 0.00 0.00 0.00 0.00 2032 0.00 0.00 0.00 0.00 0.00 0.002033 0.00 0.00 0.00 0.00 0.00 0.00 2033 0.00 0.00 0.00 0.00 0.00 0.002034 0.00 0.00 0.00 0.00 0.00 0.00 2034 0.00 0.00 0.00 0.00 0.00 0.002035 0.00 0.00 0.00 0.00 0.00 0.00 2035 0.00 0.00 0.00 0.00 0.00 0.00
:: :: :: :: :: :: :: :: :: :: :: :: :: :: :: :: :: :: :: ::
2041 0.00 0.00 0.00 0.00 0.00 0.00 2041 0.00 0.00 0.00 0.00 0.00 0.002042 91.03 10.83 5.09 5.55 262.97 375.47 2042 91.03 10.44 4.91 1.60 0.00 107.972043 180.50 10.83 9.57 5.74 181.68 388.32 2043 180.50 10.44 9.23 3.00 0.00 203.172044 89.44 5.41 4.74 2.91 94.16 196.67 2044 89.44 5.22 4.57 1.49 0.00 100.72

A127 - 11
Table A127.1.13 Economic Cost and Benefit Stream and Evaluation Indices of Sewerage Project
(Unit: Rs. Million)
Cost BenefitSaving of O&M Cost
SepticTank
ExistingSewerage
System
1 2008 612 0 612 0 0 0 0 0 0 0 -6122 2009 0 0 0 0 0 0 0 0 0 0 03 2010 0 0 0 0 0 0 0 0 0 0 04 2011 0 0 0 0 0 0 0 0 0 0 05 2012 1,533 0 1,533 0 0 0 0 0 15 -15 -1,5486 2013 1,316 0 1,316 0 0 0 0 0 13 -13 -1,3297 2014 598 26 624 337 161 86 24 7 136 479 -1458 2015 52 52 674 323 172 48 30 0 1,246 1,1949 2016 52 52 674 323 172 48 30 0 1,246 1,194
10 2017 52 52 674 323 172 48 30 0 1,246 1,19411 2018 52 52 674 323 172 48 30 0 1,246 1,19412 2019 52 52 674 323 172 48 30 0 1,246 1,19413 2020 52 52 674 323 172 48 30 0 1,246 1,19414 2021 52 52 674 323 172 48 30 0 1,246 1,19415 2022 52 52 674 323 172 48 30 0 1,246 1,19416 2023 52 52 674 323 172 48 30 0 1,246 1,19417 2024 52 52 674 323 172 48 30 0 1,246 1,19418 2025 52 52 674 323 172 48 30 0 1,246 1,19419 2026 52 52 674 323 172 48 30 0 1,246 1,19420 2027 52 108 160 674 323 172 48 30 0 1,246 1,08621 2028 52 203 255 674 323 172 48 30 0 1,246 99122 2029 52 101 152 674 323 172 48 30 0 1,246 1,09323 2030 52 52 674 323 172 48 30 0 1,246 1,19424 2031 52 52 674 323 172 48 30 0 1,246 1,19425 2032 52 52 674 323 172 48 30 0 1,246 1,19426 2033 52 52 674 323 172 48 30 0 1,246 1,19427 2034 52 52 674 323 172 48 30 0 1,246 1,19428 2035 52 52 674 323 172 48 30 0 1,246 1,19429 2036 52 52 674 323 172 48 30 0 1,246 1,19430 2037 52 52 674 323 172 48 30 0 1,246 1,19431 2038 52 52 674 323 172 48 30 0 1,246 1,19432 2039 52 52 674 323 172 48 30 0 1,246 1,19433 2040 52 52 674 323 172 48 30 0 1,246 1,19434 2041 52 52 674 323 172 48 30 0 1,246 1,19435 2042 52 108 160 674 323 172 48 30 0 1,246 1,08636 2043 52 203 255 674 323 172 48 30 0 1,246 99137 2044 52 101 152 674 323 172 48 30 0 1,246 1,093
Remark: The existing fixed assets of sewerage systems were carried over into the priority project. TP3 system accounts for 41.8% of the total sunk cost (Rs.1.46 billion) in 2008. TP1 system accounts of the total sunk cost (Rs.0.77 billion) in 2014.
EIRR: 20.3% NPV: 2,142 Million Rupees B/C: 1.82
BalanceNega-
tiveBenefit
Non-domestic
Benefit
Replace-ment Total Medical
BenefitNo. Year
CapitalInvest-
mentO&M Domestic
Benefit Total

A127 - 12
Table A127.1.14 Sensitivity Test of Economic Evaluation of Sewerage Project EIRR
Cost0% +10% +20%
0% 20.3 18.8 17.5Benefit -10% 18.7 17.3 16.1
-20% 17.0 15.6 14.5
NPV (Rs. Million)Cost
0% +10% +20%0% 5,193 4,868 4,543
Benefit -10% 4,349 4,023 3,698-20% 3,504 3,179 2,854
B/CCost
0% +10% +20%0% 2.60 2.36 2.16
Benefit -10% 2.34 2.13 1.95-20% 2.03 1.89 1.73

A127 - 13
Table A127.1.15 Economic Cost and Benefit Stream and Evaluation Indices of Integrated Project
(Unit: Rs. Million)
Cost BenefitWater Supply
1 2008 0 0 612 612 0 0 0 0 -6122 2009 1,233 0 0 1,233 0 0 0 0 -1,2333 2010 1,233 0 0 1,233 0 0 0 0 -1,2334 2011 1,234 0 0 1,234 0 0 0 0 -1,2345 2012 1,280 4,329 1,533 7,142 967 0 4,308 -3,341 -10,4836 2013 148 4,913 1,316 6,377 5,292 0 8,591 -3,299 -9,6757 2014 186 2,642 624 3,452 7,475 615 4,784 3,306 -1468 2015 186 212 52 450 8,136 1,246 0 9,382 8,9329 2016 186 212 52 450 8,136 1,246 0 9,382 8,932
10 2017 186 212 52 450 8,136 1,246 0 9,382 8,93211 2018 186 212 52 450 8,136 1,246 0 9,382 8,93212 2019 186 212 52 450 8,136 1,246 0 9,382 8,93213 2020 186 212 52 450 8,136 1,246 0 9,382 8,93214 2021 186 212 52 450 8,136 1,246 0 9,382 8,93215 2022 186 212 52 450 8,136 1,246 0 9,382 8,93216 2023 186 212 52 450 8,136 1,246 0 9,382 8,93217 2024 796 212 52 1,060 8,136 1,246 0 9,382 8,32218 2025 796 212 52 1,060 8,136 1,246 0 9,382 8,32219 2026 796 212 52 1,060 8,136 1,246 0 9,382 8,32220 2027 186 212 160 558 8,136 1,246 0 9,382 8,82421 2028 186 212 255 653 8,136 1,246 0 9,382 8,72922 2029 186 212 152 551 8,136 1,246 0 9,382 8,83123 2030 186 212 52 450 8,136 1,246 0 9,382 8,93224 2031 186 212 52 450 8,136 1,246 0 9,382 8,93225 2032 186 212 52 450 8,136 1,246 0 9,382 8,93226 2033 186 212 52 450 8,136 1,246 0 9,382 8,93227 2034 186 212 52 450 8,136 1,246 0 9,382 8,93228 2035 186 212 52 450 8,136 1,246 0 9,382 8,93229 2036 186 212 52 450 8,136 1,246 0 9,382 8,93230 2037 186 212 52 450 8,136 1,246 0 9,382 8,93231 2038 186 212 52 450 8,136 1,246 0 9,382 8,93232 2039 796 212 52 1,060 8,136 1,246 0 9,382 8,32233 2040 796 212 52 1,060 8,136 1,246 0 9,382 8,32234 2041 796 212 52 1,060 8,136 1,246 0 9,382 8,32235 2042 186 212 160 558 8,136 1,246 0 9,382 8,82436 2043 186 212 255 653 8,136 1,246 0 9,382 8,72937 2044 186 212 152 551 8,136 1,246 0 9,382 8,831
EIRR: 23.0% NPV: 18.1 Billion Rupees B/C: 2.29
NegativeBenefits TotalNo. Year Water
SourceDNI
System
Balance TotalSewerageSystem
WaterSupply
Benefits
SewerageBenefits

A127 - 14
Table A127.1.16 Sensitivity Test of Economic Evaluation of Integrated Project EIRR
Cost0% +10% +20%
0% 23.0% 21.6% 20.4%Benefit -10% 21.4% 20.1% 18.9%
-20% 19.8% 18.5% 17.3%
NPV (Rs. Million)Cost
0% +10% +20%0% 18,110 16,710 15,309
Benefit -10% 14,899 13,498 12,098-20% 11,687 10,287 8,886
B/CCost
0% +10% +20%0% 2.29 2.08 1.91
Benefit -10% 2.06 1.88 1.72-20% 1.83 1.67 1.53

A127 - 15
Table A127.1.17 Financial Cost and Benefit Stream and Evaluation Indices of Water Supply Project
(Unit: Rs. Million)
Cost RevenueBulk Water Source*1 DNI
Plants O&M *2 Replace-ment
CapitalInvest-
ment
O&M +Replace-
ment1 2009 1,381 0 1,381 0 0 0 -1,3812 2010 1,427 0 1,427 0 0 0 -1,4273 2011 1,476 0 1,476 0 0 0 -1,4764 2012 1,371 101 5,002 64 6,537 547 157 704 -5,8335 2013 199 5,832 197 6,228 1,232 266 1,498 -4,7306 2014 257 3,069 271 3,596 2,078 443 2,521 -1,0757 2015 267 279 546 2,211 470 2,681 2,1358 2016 278 288 566 2,211 470 2,681 2,1159 2017 290 297 587 2,211 470 2,681 2,094
10 2018 302 307 609 2,211 470 2,681 2,07311 2019 314 317 632 2,211 470 2,681 2,05012 2020 328 328 656 2,211 470 2,681 2,02513 2021 342 339 681 2,211 470 2,681 2,00014 2022 357 351 708 2,211 470 2,681 1,97315 2023 372 364 736 2,211 470 2,681 1,94516 2024 389 789 377 1,555 2,211 470 2,681 1,12717 2025 406 801 390 1,598 2,211 470 2,681 1,08418 2026 425 813 405 1,642 2,211 470 2,681 1,03919 2027 444 420 864 2,211 470 2,681 1,81720 2028 465 436 900 2,211 470 2,681 1,78121 2029 486 452 939 2,211 470 2,681 1,74322 2030 509 470 979 2,211 470 2,681 1,70323 2031 533 488 1,021 2,211 470 2,681 1,66024 2032 559 508 1,066 2,211 470 2,681 1,61525 2033 585 528 1,113 2,211 470 2,681 1,56826 2034 614 549 1,163 2,211 470 2,681 1,51827 2035 644 572 1,216 2,211 470 2,681 1,46628 2036 676 596 1,271 2,211 470 2,681 1,41029 2037 709 621 1,330 2,211 470 2,681 1,35230 2038 744 647 1,392 2,211 470 2,681 1,29031 2039 782 986 675 2,443 2,211 470 2,681 23832 2040 821 1,001 704 2,527 2,211 470 2,681 15533 2041 863 2,389 735 3,988 2,211 470 2,681 -1,30634 2042 907 768 1,675 2,211 470 2,681 1,00635 2043 954 802 1,756 2,211 470 2,681 92536 2044 1,003 839 1,842 2,211 470 2,681 839
Remark: *1 Water source costs for the zone west were estimated as a part of the bulk water suupy system, which were calculated as a proportional amount of total zone west water demand to the total water demand in Karachi City in 2016. *2 Replacement cost of new pipes is included in O&M cost.
Evaluation Indices (Interest Rate: 8%) AverageUnit Price at Current Price in 2008FIRR: 8.3% Present New PriceNPV: 0.3 Million Rupees Domestic 44 128 Rs./1000 gallonB/C: 1.01 Non-Domestic 73 212 Rs./1000 gallon
BalanceTotal TotalNo. Year DomesticWater
Non-domestic
Water
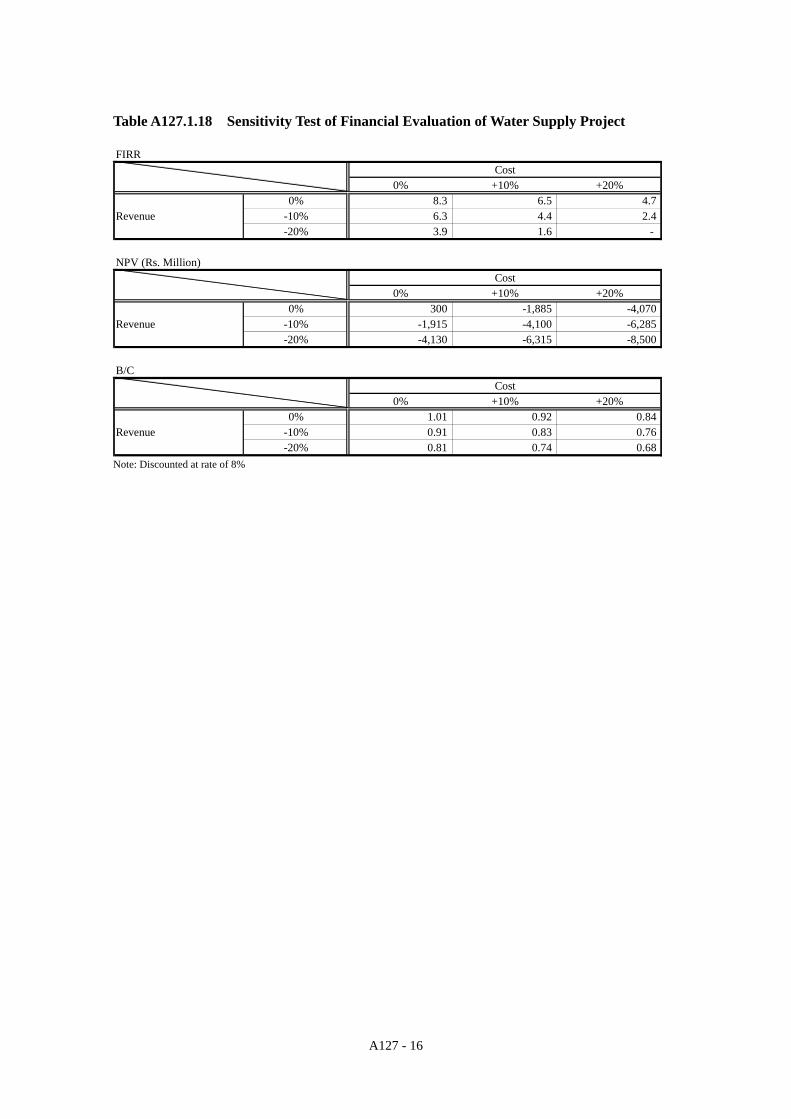
A127 - 16
Table A127.1.18 Sensitivity Test of Financial Evaluation of Water Supply Project FIRR
Cost0% +10% +20%
0% 8.3 6.5 4.7Revenue -10% 6.3 4.4 2.4
-20% 3.9 1.6 -
NPV (Rs. Million)Cost
0% +10% +20%0% 300 -1,885 -4,070
Revenue -10% -1,915 -4,100 -6,285-20% -4,130 -6,315 -8,500
B/CCost
0% +10% +20%0% 1.01 0.92 0.84
Revenue -10% 0.91 0.83 0.76-20% 0.81 0.74 0.68
Note: Discounted at rate of 8%

A127 - 17
Table A127.1.19 Financial Cost and Benefit Stream and Evaluation Indices of Sewerage Project
(Unit: Rs. Million)
Cost Revenue
1 2008 696 0 696 0 0 0 -6962 2009 0 0 0 0 0 0 03 2010 0 0 0 0 0 0 04 2011 0 0 0 0 0 0 05 2012 1,917 0 1,917 0 0 0 -1,9176 2013 1,893 0 1,893 0 0 0 -1,8937 2014 895 40 935 531 113 644 -2918 2015 83 83 553 118 670 5879 2016 86 86 553 118 670 584
10 2017 90 90 553 118 670 58111 2018 93 93 553 118 670 57712 2019 97 97 553 118 670 57313 2020 101 101 553 118 670 56914 2021 105 105 553 118 670 56515 2022 110 110 553 118 670 56116 2023 114 114 553 118 670 55617 2024 119 119 553 118 670 55118 2025 124 124 553 118 670 54619 2026 130 130 553 118 670 54020 2027 136 125 261 553 118 670 40921 2028 142 243 384 553 118 670 28622 2029 148 124 272 553 118 670 39823 2030 155 155 553 118 670 51524 2031 162 162 553 118 670 50825 2032 170 170 553 118 670 50126 2033 177 177 553 118 670 49327 2034 186 186 553 118 670 48428 2035 195 195 553 118 670 47629 2036 204 204 553 118 670 46630 2037 214 214 553 118 670 45631 2038 224 224 553 118 670 44632 2039 235 235 553 118 670 43533 2040 247 247 553 118 670 42334 2041 259 259 553 118 670 41135 2042 272 375 648 553 118 670 2236 2043 286 388 675 553 118 670 -437 2044 301 197 497 553 118 670 173
Remark: The existging fixed assets of sewerage systems were carried over into the priority project. TP3 system accounts for 41.8% of the total sunk cost (Rs.1.66 billion) in 2008. TP1 system accounts of the total sunk cost (Rs.0.88 billion) in 2014.Evaluation Indices (Interest rate: 8%) Average Unit Price of Sewerage Service at Current Price in 2008
FIRR: 8.2% Present Rate: 25% of Water Supply TariffNPV: -848 Million Rupees New Rate: 50% of Water Supply TariffB/C: 0.76
Replace-ment Total
Non-domestic
Water
DomesticBenefit Total BalanceNo. Year Capital
Invest-ment O&M
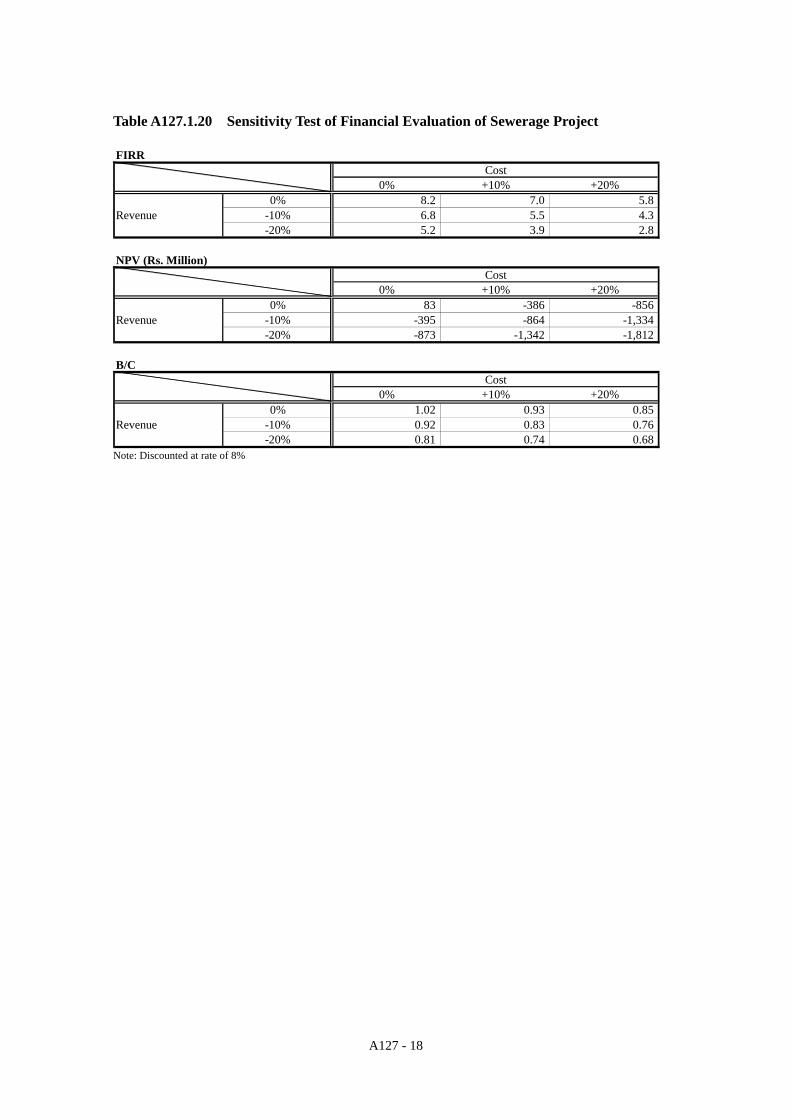
A127 - 18
Table A127.1.20 Sensitivity Test of Financial Evaluation of Sewerage Project FIRR
Cost0% +10% +20%
0% 8.2 7.0 5.8Revenue -10% 6.8 5.5 4.3
-20% 5.2 3.9 2.8
NPV (Rs. Million)Cost
0% +10% +20%0% 83 -386 -856
Revenue -10% -395 -864 -1,334-20% -873 -1,342 -1,812
B/CCost
0% +10% +20%0% 1.02 0.93 0.85
Revenue -10% 0.92 0.83 0.76-20% 0.81 0.74 0.68
Note: Discounted at rate of 8%

A127 - 19
Table A127.1.21 Financial Cost and Benefit Stream and Evaluation Indices of Integrated Project
(Unit: Rs. Million)
Cost RevenueWater Supply
1 2008 0 0 696 696 0 0 0 -6962 2009 1,381 0 0 1,381 0 0 0 -1,3813 2010 1,427 0 0 1,427 0 0 0 -1,4274 2011 1,476 0 0 1,476 0 0 0 -1,4765 2012 1,472 5,065 1,917 8,454 704 0 704 -7,7516 2013 199 6,029 1,893 8,121 1,498 0 1,498 -6,6227 2014 257 3,339 935 4,532 2,521 644 3,165 -1,3668 2015 267 279 83 629 2,681 670 3,352 2,7229 2016 278 288 86 652 2,681 670 3,352 2,699
10 2017 290 297 90 677 2,681 670 3,352 2,67511 2018 302 307 93 702 2,681 670 3,352 2,65012 2019 314 317 97 729 2,681 670 3,352 2,62313 2020 328 328 101 757 2,681 670 3,352 2,59514 2021 342 339 105 787 2,681 670 3,352 2,56515 2022 357 351 110 818 2,681 670 3,352 2,53416 2023 372 364 114 850 2,681 670 3,352 2,50117 2024 1,178 377 119 1,674 2,681 670 3,352 1,67818 2025 1,207 390 124 1,722 2,681 670 3,352 1,63019 2026 1,238 405 130 1,772 2,681 670 3,352 1,58020 2027 444 420 261 1,125 2,681 670 3,352 2,22721 2028 465 436 384 1,285 2,681 670 3,352 2,06722 2029 486 452 272 1,211 2,681 670 3,352 2,14123 2030 509 470 155 1,134 2,681 670 3,352 2,21824 2031 533 488 162 1,183 2,681 670 3,352 2,16825 2032 559 508 170 1,236 2,681 670 3,352 2,11626 2033 585 528 177 1,291 2,681 670 3,352 2,06127 2034 614 549 186 1,349 2,681 670 3,352 2,00328 2035 644 572 195 1,411 2,681 670 3,352 1,94129 2036 676 596 204 1,475 2,681 670 3,352 1,87630 2037 709 621 214 1,544 2,681 670 3,352 1,80831 2038 744 647 224 1,616 2,681 670 3,352 1,73632 2039 1,768 675 235 2,679 2,681 670 3,352 67333 2040 1,823 704 247 2,774 2,681 670 3,352 57834 2041 3,252 735 259 4,247 2,681 670 3,352 -89535 2042 907 768 648 2,323 2,681 670 3,352 1,02936 2043 954 802 675 2,431 2,681 670 3,352 92137 2044 1,003 839 497 2,339 2,681 670 3,352 1,012
Evaluation Indices (Interest rate: 8%) AverageUnit Price at Current Price in 2008FIRR: 8.3% Present New PriceNPV: 361 Million Rupees Domestic 44 128 Rs./1000 gallonB/C: 1.01 Non-Domestic 73 212 Rs./1000 gallon
Sewerage 25% 50% of Water Charge
No. Year WaterSource Distribution
Balance TotalSewerageSystem
WaterSupply
Benefits
SewerageBenefits Total

A127 - 20
Table A127.1.22 Sensitivity Test of Financial Evaluation of Integrated Project FIRR
Cost0% +10% +20%
0% 8.3 6.6 5.0Revenue -10% 6.4 4.7 2.9
-20% 4.2 2.3 0.0
NPV (Rs. Million)Cost
0% +10% +20%0% 361 -2,132 -3,968
Revenue -10% -2,168 -4,660 -7,153-20% -4,697 -7,189 -9,682
B/CCost
0% +10% +20%0% 1.01 0.92 0.86
Revenue -10% 0.91 0.83 0.76-20% 0.81 0.74 0.68
Note: Discounted at rate of 8%
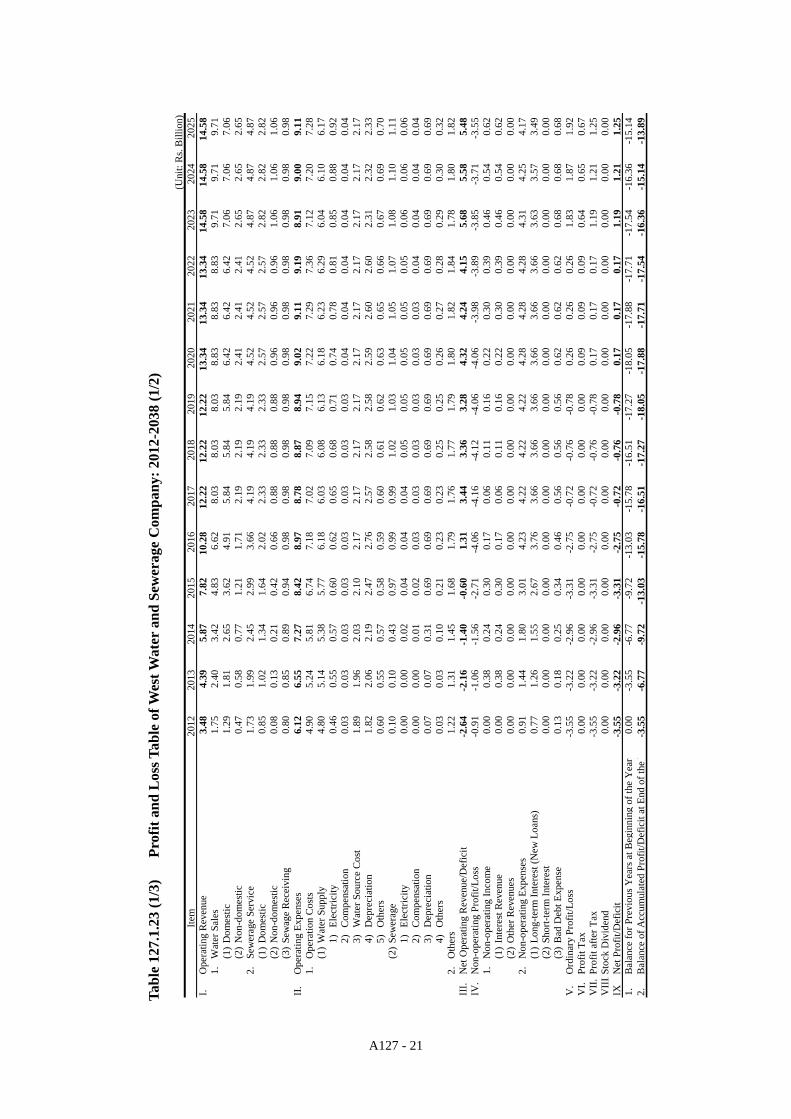
A127 - 21
(Uni
t: R
s. B
illio
n)Ite
m20
1220
1320
1420
1520
1620
1720
1820
1920
2020
2120
2220
2320
2420
25I.
Ope
ratin
g R
even
ue3.
484.
395.
877.
8210
.28
12.2
212
.22
12.2
213
.34
13.3
413
.34
14.5
814
.58
14.5
81.
Wat
er S
ales
1.75
2.40
3.42
4.83
6.62
8.03
8.03
8.03
8.83
8.83
8.83
9.71
9.71
9.71
(1)
Dom
estic
1.29
1.81
2.65
3.62
4.91
5.84
5.84
5.84
6.42
6.42
6.42
7.06
7.06
7.06
(2)
Non
-dom
estic
0.47
0.58
0.77
1.21
1.71
2.19
2.19
2.19
2.41
2.41
2.41
2.65
2.65
2.65
2.Se
wer
age
Serv
ice
1.73
1.99
2.45
2.99
3.66
4.19
4.19
4.19
4.52
4.52
4.52
4.87
4.87
4.87
(1)
Dom
estic
0.85
1.02
1.34
1.64
2.02
2.33
2.33
2.33
2.57
2.57
2.57
2.82
2.82
2.82
(2)
Non
-dom
estic
0.08
0.13
0.21
0.42
0.66
0.88
0.88
0.88
0.96
0.96
0.96
1.06
1.06
1.06
(3)
Sew
age
Rec
eivi
ng0.
800.
850.
890.
940.
980.
980.
980.
980.
980.
980.
980.
980.
980.
98II
.O
pera
ting
Expe
nses
6.12
6.55
7.27
8.42
8.97
8.78
8.87
8.94
9.02
9.11
9.19
8.91
9.00
9.11
1.O
pera
tion
Cost
s4.
905.
245.
816.
747.
187.
027.
097.
157.
227.
297.
367.
127.
207.
28(1
)W
ater
Sup
ply
4.80
5.14
5.38
5.77
6.18
6.03
6.08
6.13
6.18
6.23
6.29
6.04
6.10
6.17
1)El
ectri
city
0.46
0.55
0.57
0.60
0.62
0.65
0.68
0.71
0.74
0.78
0.81
0.85
0.88
0.92
2)C
ompe
nsat
ion
0.03
0.03
0.03
0.03
0.03
0.03
0.03
0.03
0.04
0.04
0.04
0.04
0.04
0.04
3)W
ater
Sou
rce
Cos
t1.
891.
962.
032.
102.
172.
172.
172.
172.
172.
172.
172.
172.
172.
174)
Dep
reci
atio
n1.
822.
062.
192.
472.
762.
572.
582.
582.
592.
602.
602.
312.
322.
335)
Oth
ers
0.60
0.55
0.57
0.58
0.59
0.60
0.61
0.62
0.63
0.65
0.66
0.67
0.69
0.70
(2)
Sew
erag
e0.
100.
100.
430.
970.
990.
991.
021.
031.
041.
051.
071.
081.
101.
111)
Elec
trici
ty0.
000.
000.
020.
040.
040.
040.
050.
050.
050.
050.
050.
060.
060.
062)
Com
pens
atio
n0.
000.
000.
010.
020.
030.
030.
030.
030.
030.
030.
040.
040.
040.
043)
Dep
reci
atio
n0.
070.
070.
310.
690.
690.
690.
690.
690.
690.
690.
690.
690.
690.
694)
Oth
ers
0.03
0.03
0.10
0.21
0.23
0.23
0.25
0.25
0.26
0.27
0.28
0.29
0.30
0.32
2.O
ther
s1.
221.
311.
451.
681.
791.
761.
771.
791.
801.
821.
841.
781.
801.
82II
I.N
et O
pera
ting
Rev
enue
/Def
icit
-2.6
4-2
.16
-1.4
0-0
.60
1.31
3.44
3.36
3.28
4.32
4.24
4.15
5.68
5.58
5.48
IV.
Non
-ope
ratin
g Pr
ofit/
Loss
-0.9
1-1
.06
-1.5
6-2
.71
-4.0
6-4
.16
-4.1
2-4
.06
-4.0
6-3
.98
-3.8
9-3
.85
-3.7
1-3
.55
1.N
on-o
pera
ting
Inco
me
0.00
0.38
0.24
0.30
0.17
0.06
0.11
0.16
0.22
0.30
0.39
0.46
0.54
0.62
(1)
Inte
rest
Rev
enue
0.00
0.38
0.24
0.30
0.17
0.06
0.11
0.16
0.22
0.30
0.39
0.46
0.54
0.62
(2)
Oth
er R
even
ues
0.00
0.00
0.00
0.00
0.00
0.00
0.00
0.00
0.00
0.00
0.00
0.00
0.00
0.00
2.N
on-o
pera
ting
Expe
nses
0.91
1.44
1.80
3.01
4.23
4.22
4.22
4.22
4.28
4.28
4.28
4.31
4.25
4.17
(1)
Long
-term
Inte
rest
(New
Loa
ns)
0.77
1.26
1.55
2.67
3.76
3.66
3.66
3.66
3.66
3.66
3.66
3.63
3.57
3.49
(2)
Shor
t-ter
m In
tere
st0.
000.
000.
000.
000.
000.
000.
000.
000.
000.
000.
000.
000.
000.
00(3
)B
ad D
ebt E
xpen
se0.
130.
180.
250.
340.
460.
560.
560.
560.
620.
620.
620.
680.
680.
68V
.O
rdin
ary
Prof
it/Lo
ss-3
.55
-3.2
2-2
.96
-3.3
1-2
.75
-0.7
2-0
.76
-0.7
80.
260.
260.
261.
831.
871.
92V
I.Pr
ofit
Tax
0.00
0.00
0.00
0.00
0.00
0.00
0.00
0.00
0.09
0.09
0.09
0.64
0.65
0.67
VII
.Pr
ofit
afte
r Tax
-3.5
5-3
.22
-2.9
6-3
.31
-2.7
5-0
.72
-0.7
6-0
.78
0.17
0.17
0.17
1.19
1.21
1.25
VII
I.St
ock
Div
iden
d0.
000.
000.
000.
000.
000.
000.
000.
000.
000.
000.
000.
000.
000.
00IX
Net
Pro
fit/D
efic
it-3
.55
-3.2
2-2
.96
-3.3
1-2
.75
-0.7
2-0
.76
-0.7
80.
170.
170.
171.
191.
211.
251.
Bal
ance
for P
revi
ous Y
ears
at B
egin
ning
of t
he Y
ear
0.00
-3.5
5-6
.77
-9.7
2-1
3.03
-15.
78-1
6.51
-17.
27-1
8.05
-17.
88-1
7.71
-17.
54-1
6.36
-15.
142.
Bal
ance
of A
ccum
ulat
ed P
rofit
/Def
icit
at E
nd o
f the
Y-3
.55
-6.7
7-9
.72
-13.
03-1
5.78
-16.
51-1
7.27
-18.
05-1
7.88
-17.
71-1
7.54
-16.
36-1
5.14
-13.
89
Tabl
e 12
7.1.
23 (1
/3)
Pr
ofit
and
Los
s Tab
le o
f Wes
t Wat
er a
nd S
ewer
age
Com
pany
: 201
2-20
38 (1
/2)

A127 - 22
(Uni
t: R
s. B
illio
n)Ite
m20
2620
2720
2820
2920
3020
3120
3220
3320
3420
3520
3620
3720
38I.
Ope
ratin
g R
even
ue15
.94
15.9
415
.94
17.4
417
.44
17.4
419
.08
19.0
819
.08
20.8
920
.89
20.8
922
.88
1.W
ater
Sal
es10
.68
10.6
810
.68
11.7
511
.75
11.7
512
.93
12.9
312
.93
14.2
214
.22
14.2
215
.64
(1)
Dom
estic
7.77
7.77
7.77
8.54
8.54
8.54
9.40
9.40
9.40
10.3
410
.34
10.3
411
.37
(2)
Non
-dom
estic
2.92
2.92
2.92
3.21
3.21
3.21
3.53
3.53
3.53
3.88
3.88
3.88
4.27
2.Se
wer
age
Serv
ice
5.26
5.26
5.26
5.68
5.68
5.68
6.15
6.15
6.15
6.67
6.67
6.67
7.24
(1)
Dom
estic
3.11
3.11
3.11
3.42
3.42
3.42
3.76
3.76
3.76
4.14
4.14
4.14
4.55
(2)
Non
-dom
estic
1.17
1.17
1.17
1.28
1.28
1.28
1.41
1.41
1.41
1.55
1.55
1.55
1.71
(3)
Sew
age
Rec
eivi
ng0.
980.
980.
980.
980.
980.
980.
980.
980.
980.
980.
980.
980.
98II
.O
pera
ting
Expe
nses
9.30
9.01
9.08
9.08
9.08
9.29
9.08
9.31
9.56
9.82
10.0
810
.33
10.6
01.
Ope
ratio
n C
osts
7.44
7.21
7.26
7.26
7.27
7.43
7.26
7.45
7.65
7.85
8.07
8.27
8.48
(1)
Wat
er S
uppl
y6.
316.
086.
116.
196.
216.
236.
086.
246.
416.
596.
786.
957.
121)
Elec
trici
ty0.
961.
011.
051.
101.
151.
201.
251.
311.
371.
431.
491.
561.
632)
Com
pens
atio
n0.
050.
050.
050.
050.
060.
060.
060.
060.
070.
070.
070.
070.
083)
Wat
er S
ourc
e C
ost
2.17
2.17
2.17
2.17
2.17
2.17
2.17
2.17
2.17
2.17
2.17
2.17
2.17
4)D
epre
ciat
ion
2.40
2.12
2.08
2.08
2.04
1.98
1.75
1.83
1.91
2.00
2.09
2.15
2.22
5)O
ther
s0.
720.
740.
750.
770.
790.
820.
840.
870.
890.
920.
950.
991.
02(2
)Se
wer
age
1.13
1.13
1.15
1.08
1.06
1.20
1.18
1.21
1.23
1.26
1.29
1.32
1.35
1)El
ectri
city
0.06
0.07
0.07
0.07
0.08
0.08
0.08
0.09
0.09
0.09
0.10
0.10
0.11
2)C
ompe
nsat
ion
0.04
0.04
0.05
0.05
0.05
0.05
0.06
0.06
0.06
0.06
0.07
0.07
0.07
3)D
epre
ciat
ion
0.69
0.67
0.68
0.58
0.54
0.66
0.62
0.62
0.62
0.62
0.62
0.62
0.62
4)O
ther
s0.
330.
340.
360.
370.
390.
400.
420.
440.
460.
480.
500.
520.
552.
Oth
ers
1.86
1.80
1.82
1.82
1.82
1.86
1.82
1.86
1.91
1.96
2.02
2.07
2.12
III.
Net
Ope
ratin
g R
even
ue/D
efic
it6.
646.
936.
878.
368.
358.
1510
.00
9.77
9.52
11.0
710
.81
10.5
612
.29
IV.
Non
-ope
ratin
g Pr
ofit/
Loss
-3.4
3-3
.24
-3.0
2-2
.87
-2.6
2-2
.44
-2.3
5-2
.21
-2.0
6-2
.01
-1.8
5-1
.67
-1.5
81.
Non
-ope
ratin
g In
com
e0.
680.
690.
720.
770.
840.
830.
820.
780.
740.
700.
680.
670.
67(1
)In
tere
st R
even
ue0.
680.
690.
720.
770.
840.
830.
820.
780.
740.
700.
680.
670.
67(2
)O
ther
Rev
enue
s0.
000.
000.
000.
000.
000.
000.
000.
000.
000.
000.
000.
000.
002.
Non
-ope
ratin
g Ex
pens
es4.
113.
933.
743.
643.
453.
273.
172.
982.
802.
712.
532.
342.
26(1
)Lo
ng-te
rm In
tere
st (N
ew L
oans
)3.
363.
183.
002.
812.
632.
452.
262.
081.
901.
711.
531.
351.
16(2
)Sh
ort-t
erm
Inte
rest
0.00
0.00
0.00
0.00
0.00
0.00
0.00
0.00
0.00
0.00
0.00
0.00
0.00
(3)
Bad
Deb
t Exp
ense
0.75
0.75
0.75
0.82
0.82
0.82
0.90
0.90
0.90
1.00
1.00
1.00
1.09
V.
Ord
inar
y Pr
ofit/
Loss
3.21
3.69
3.85
5.49
5.74
5.70
7.65
7.56
7.46
9.06
8.96
8.88
10.7
0V
I.Pr
ofit
Tax
1.12
1.29
1.35
1.92
2.01
2.00
2.68
2.65
2.61
3.17
3.14
3.11
3.75
VII
.Pro
fit a
fter T
ax2.
092.
402.
503.
573.
733.
714.
974.
914.
855.
895.
825.
786.
96V
IIIS
tock
Div
iden
d0.
000.
000.
000.
000.
000.
004.
444.
444.
444.
444.
444.
444.
44IX
Net
Pro
fit/D
efic
it2.
092.
402.
503.
573.
733.
710.
530.
470.
411.
451.
381.
342.
521.
Bal
ance
for P
revi
ous Y
ears
at B
egin
ning
of t
he Y
ear
-13.
89-1
1.80
-9.4
0-6
.90
-3.3
30.
404.
104.
645.
115.
526.
978.
359.
692.
Bal
ance
of A
ccum
ulat
ed P
rofit
/Def
icit
at E
nd o
f the
Yea
r-1
1.80
-9.4
0-6
.90
-3.3
30.
404.
104.
645.
115.
526.
978.
359.
6912
.20
Tabl
e 12
7.1.
23 (1
/3)
Pr
ofit
and
Los
s Tab
le o
f Wes
t Wat
er a
nd S
ewer
age
Com
pany
: 201
2-20
38 (2
/2)

A127 - 23
(Uni
t: R
s. B
illio
n)Ite
m20
1220
1320
1420
1520
1620
1720
1820
1920
2020
2120
2220
2320
2420
25I.
Proc
urem
ent
1.O
pera
ting
Rev
enue
2.68
3.54
4.98
6.89
9.30
11.2
411
.24
11.2
412
.36
12.3
612
.36
13.6
013
.60
13.6
02.
Sew
age
Rec
eivi
ng0.
800.
850.
890.
940.
980.
980.
980.
980.
980.
980.
980.
980.
980.
983.
Dep
reci
atio
n1.
882.
132.
493.
173.
463.
263.
273.
283.
283.
293.
303.
003.
013.
024.
Acc
ount
Rec
eiva
ble*
1-0
.44
-0.1
4-0
.24
-0.3
1-0
.39
-0.3
20.
000.
00-0
.18
0.00
0.00
-0.2
00.
000.
005.
Inte
rest
Rev
enue
from
Sav
ing
0.00
0.38
0.24
0.30
0.17
0.06
0.11
0.16
0.22
0.30
0.39
0.46
0.54
0.62
Gro
ss In
tern
al C
ash
Posi
tion
4.92
6.75
8.37
10.9
813
.51
15.2
315
.60
15.6
616
.67
16.9
417
.03
17.8
418
.13
18.2
21.
Capi
tal I
nfus
ion
14.0
02.
Exis
ting
Faci
litie
s Tak
en O
ver
12.1
53.
Don
atio
n of
Exi
stin
g Fa
cilit
ies
18.2
54.
Fore
ign
Loan
(Exi
stin
g)6.
005.
Fore
ign
Loan
(New
Loa
ns)
8.60
6.10
3.80
12.7
013
.20
6.G
over
nmen
t Ass
ista
nce
0.00
7.Sh
ort-t
erm
Bor
row
ing
0.00
0.00
0.00
0.00
0.00
0.00
0.00
0.00
0.00
0.00
0.00
0.00
0.00
0.00
Tota
l Sou
rces
63.9
212
.85
12.1
723
.68
26.7
115
.23
15.6
015
.66
16.6
716
.94
17.0
317
.84
18.1
318
.22
II.
Dis
burs
emen
t1.
Inve
stm
ent
41.1
5(1
)Ex
istin
g Fa
cilit
ies T
aken
Ove
r12
.15
(2)
Don
atio
n fro
m K
W&
SB18
.25
(3)
Wat
er S
uppl
y Fa
cilit
ies
8.43
5.81
3.06
6.65
6.85
(4)
Sew
erag
e Fa
cilit
ies
2.32
1.77
1.72
9.28
9.68
(5)
Rep
lace
men
t of W
ater
Sup
ply
0.16
0.16
0.16
0.17
0.17
0.17
0.17
0.21
0.22
(6)
Rep
lace
men
t of S
ewer
age
2.D
ebt S
ervi
ces
1.71
2.12
2.38
3.47
4.53
4.39
4.36
4.33
4.29
4.26
4.66
4.89
4.99
5.52
(1)
Prin
cipa
l Rep
aym
ent (
Tran
sfer
red)
0.40
0.40
0.40
0.40
0.40
0.40
0.40
0.40
0.40
0.40
0.40
0.40
0.40
0.40
(2)
Prin
cipa
l Rep
aym
ent
(New
Loa
ns)
0.00
0.00
0.00
0.00
0.00
0.00
0.00
0.00
0.00
0.00
0.43
0.74
0.93
1.56
(3)
Fina
ncia
l Cha
rges
(Tra
nsfe
rred
)0.
540.
460.
430.
400.
360.
330.
300.
260.
230.
200.
170.
130.
100.
07(4
)Fi
nanc
ial C
harg
es (N
ew L
oans
)0.
771.
261.
552.
673.
763.
663.
663.
663.
663.
663.
663.
633.
573.
493.
Deb
t Ser
vice
s for
Sho
rt Fi
nanc
ing
0.00
0.00
0.00
0.00
0.00
0.00
0.00
0.00
0.00
0.00
0.00
0.00
0.00
0.00
(1)
Prin
cipa
l Rep
aym
ent
0.00
0.00
0.00
0.00
0.00
0.00
0.00
0.00
0.00
0.00
0.00
0.00
0.00
0.00
(2)
Fina
ncia
l Cha
rges
0.00
0.00
0.00
0.00
0.00
0.00
0.00
0.00
0.00
0.00
0.00
0.00
0.00
0.00
4.D
efer
red
Ass
ets
1.00
0.00
0.00
0.00
0.00
0.00
0.00
0.00
0.00
0.00
0.00
0.00
0.00
0.00
5.In
vent
ory
Stoc
k*2
0.19
0.17
0.20
0.24
0.25
0.25
0.26
0.26
0.27
0.28
0.28
0.29
0.30
0.31
6.O
ther
Dis
burs
emen
t4.
244.
424.
775.
265.
515.
525.
605.
675.
745.
825.
905.
905.
996.
097.
Prof
it Ta
x0.
000.
000.
000.
000.
000.
000.
000.
000.
090.
090.
090.
640.
650.
67To
tal D
isbu
rsem
ent
48.2
96.
727.
358.
9610
.29
10.1
610
.21
10.2
610
.39
10.4
410
.93
11.7
311
.94
12.5
8II
I.N
et C
ash
Flow
15.6
46.
134.
8214
.72
16.4
35.
075.
395.
416.
276.
496.
106.
116.
195.
64IV
.O
peni
ng C
ash
Bal
ance
0.00
15.6
421
.77
26.5
941
.31
57.7
362
.80
68.1
973
.60
79.8
786
.36
92.4
798
.58
104.
77V
.A
ccum
ulat
ed C
ash
Posi
tion
15.6
421
.77
26.5
941
.31
57.7
362
.80
68.1
973
.60
79.8
786
.36
92.4
798
.58
104.
7711
0.41
Not
e:*1
Tur
nove
r of a
ccou
nt re
ceiv
able
was
ass
umed
at 6
.1*2
Inve
ntor
y St
ock
ws a
ssum
ed a
s 30%
of a
nnua
l con
sum
ptio
n.
Tabl
e 12
7.1.
23 (2
/3)
C
ash
Flow
Tab
le o
f Wes
t Wat
er a
nd S
ewer
age
Com
pany
: 201
2-20
38 (1
/2)
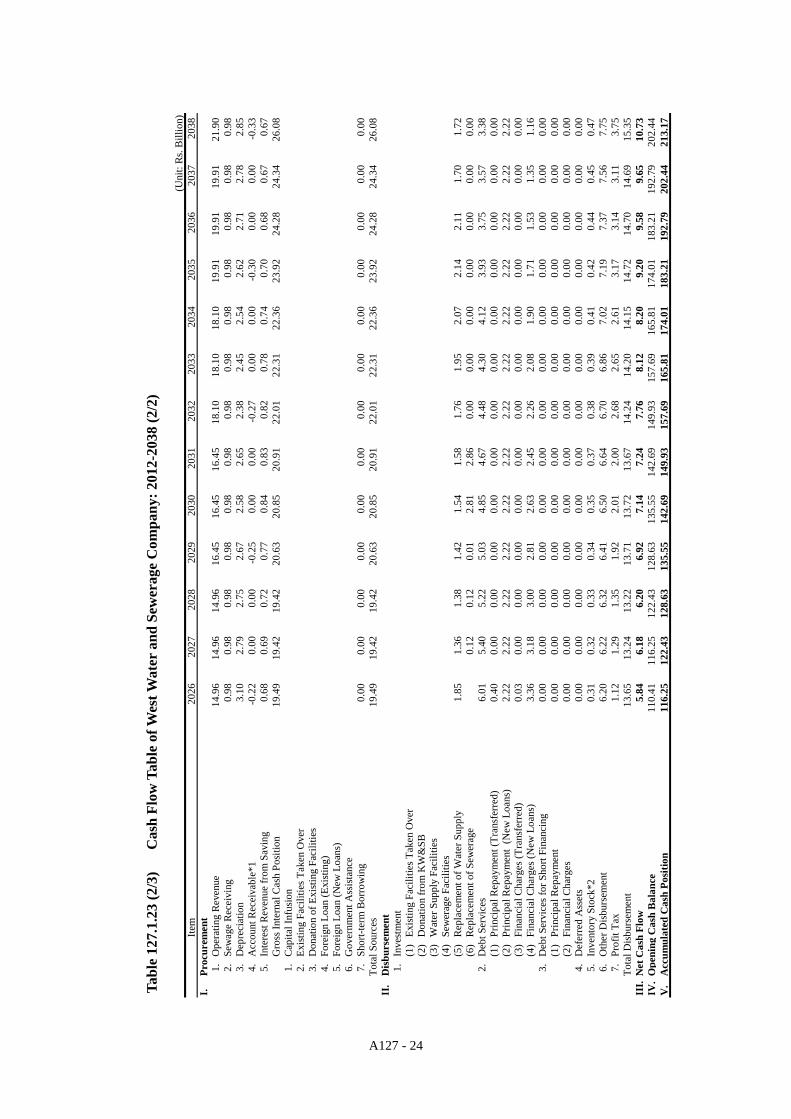
A127 - 24
(Uni
t: R
s. B
illio
n)Ite
m20
2620
2720
2820
2920
3020
3120
3220
3320
3420
3520
3620
3720
38I.
Proc
urem
ent
1.O
pera
ting
Rev
enue
14.9
614
.96
14.9
616
.45
16.4
516
.45
18.1
018
.10
18.1
019
.91
19.9
119
.91
21.9
02.
Sew
age
Rec
eivi
ng0.
980.
980.
980.
980.
980.
980.
980.
980.
980.
980.
980.
980.
983.
Dep
reci
atio
n3.
102.
792.
752.
672.
582.
652.
382.
452.
542.
622.
712.
782.
854.
Acc
ount
Rec
eiva
ble*
1-0
.22
0.00
0.00
-0.2
50.
000.
00-0
.27
0.00
0.00
-0.3
00.
000.
00-0
.33
5.In
tere
st R
even
ue fr
om S
avin
g0.
680.
690.
720.
770.
840.
830.
820.
780.
740.
700.
680.
670.
67G
ross
Inte
rnal
Cas
h Po
sitio
n19
.49
19.4
219
.42
20.6
320
.85
20.9
122
.01
22.3
122
.36
23.9
224
.28
24.3
426
.08
1.C
apita
l Inf
usio
n2.
Exis
ting
Faci
litie
s Tak
en O
ver
3.D
onat
ion
of E
xist
ing
Faci
litie
s4.
Fore
ign
Loan
(Exi
stin
g)5.
Fore
ign
Loan
(New
Loa
ns)
6.G
over
nmen
t Ass
ista
nce
7.Sh
ort-t
erm
Bor
row
ing
0.00
0.00
0.00
0.00
0.00
0.00
0.00
0.00
0.00
0.00
0.00
0.00
0.00
Tota
l Sou
rces
19.4
919
.42
19.4
220
.63
20.8
520
.91
22.0
122
.31
22.3
623
.92
24.2
824
.34
26.0
8II
.D
isbu
rsem
ent
1.In
vest
men
t(1
)Ex
istin
g Fa
cilit
ies T
aken
Ove
r(2
)D
onat
ion
from
KW
&SB
(3)
Wat
er S
uppl
y Fa
cilit
ies
(4)
Sew
erag
e Fa
cilit
ies
(5)
Rep
lace
men
t of W
ater
Sup
ply
1.85
1.36
1.38
1.42
1.54
1.58
1.76
1.95
2.07
2.14
2.11
1.70
1.72
(6)
Rep
lace
men
t of S
ewer
age
0.12
0.12
0.01
2.81
2.86
0.00
0.00
0.00
0.00
0.00
0.00
0.00
2.D
ebt S
ervi
ces
6.01
5.40
5.22
5.03
4.85
4.67
4.48
4.30
4.12
3.93
3.75
3.57
3.38
(1)
Prin
cipa
l Rep
aym
ent (
Tran
sfer
red)
0.40
0.00
0.00
0.00
0.00
0.00
0.00
0.00
0.00
0.00
0.00
0.00
0.00
(2)
Prin
cipa
l Rep
aym
ent
(New
Loa
ns)
2.22
2.22
2.22
2.22
2.22
2.22
2.22
2.22
2.22
2.22
2.22
2.22
2.22
(3)
Fina
ncia
l Cha
rges
(Tra
nsfe
rred
)0.
030.
000.
000.
000.
000.
000.
000.
000.
000.
000.
000.
000.
00(4
)Fi
nanc
ial C
harg
es (N
ew L
oans
)3.
363.
183.
002.
812.
632.
452.
262.
081.
901.
711.
531.
351.
163.
Deb
t Ser
vice
s for
Sho
rt Fi
nanc
ing
0.00
0.00
0.00
0.00
0.00
0.00
0.00
0.00
0.00
0.00
0.00
0.00
0.00
(1)
Prin
cipa
l Rep
aym
ent
0.00
0.00
0.00
0.00
0.00
0.00
0.00
0.00
0.00
0.00
0.00
0.00
0.00
(2)
Fina
ncia
l Cha
rges
0.00
0.00
0.00
0.00
0.00
0.00
0.00
0.00
0.00
0.00
0.00
0.00
0.00
4.D
efer
red
Ass
ets
0.00
0.00
0.00
0.00
0.00
0.00
0.00
0.00
0.00
0.00
0.00
0.00
0.00
5.In
vent
ory
Stoc
k*2
0.31
0.32
0.33
0.34
0.35
0.37
0.38
0.39
0.41
0.42
0.44
0.45
0.47
6.O
ther
Dis
burs
emen
t6.
206.
226.
326.
416.
506.
646.
706.
867.
027.
197.
377.
567.
757.
Prof
it Ta
x1.
121.
291.
351.
922.
012.
002.
682.
652.
613.
173.
143.
113.
75To
tal D
isbu
rsem
ent
13.6
513
.24
13.2
213
.71
13.7
213
.67
14.2
414
.20
14.1
514
.72
14.7
014
.69
15.3
5II
I.N
et C
ash
Flow
5.84
6.18
6.20
6.92
7.14
7.24
7.76
8.12
8.20
9.20
9.58
9.65
10.7
3IV
.O
peni
ng C
ash
Bal
ance
110.
4111
6.25
122.
4312
8.63
135.
5514
2.69
149.
9315
7.69
165.
8117
4.01
183.
2119
2.79
202.
44V
.A
ccum
ulat
ed C
ash
Posi
tion
116.
2512
2.43
128.
6313
5.55
142.
6914
9.93
157.
6916
5.81
174.
0118
3.21
192.
7920
2.44
213.
17
Tabl
e 12
7.1.
23 (2
/3)
C
ash
Flow
Tab
le o
f Wes
t Wat
er a
nd S
ewer
age
Com
pany
: 201
2-20
38 (2
/2)

A127 - 25
(Uni
t: R
s. B
illio
n)Ite
m20
1220
1320
1420
1520
1620
1720
1820
1920
2020
2120
2220
2320
2420
25
I.A
sset
s55
.05
57.9
358
.38
67.3
777
.42
76.2
975
.13
73.9
573
.72
73.4
972
.83
72.8
872
.77
72.0
61.
Fixe
d A
sset
s41
.58
48.8
047
.00
59.9
273
.15
70.0
566
.94
63.8
260
.71
57.5
854
.46
51.6
348
.83
46.0
3(1
)Fi
xed
Ass
ets
41.1
548
.73
53.5
069
.59
86.2
886
.44
86.6
086
.76
86.9
387
.10
87.2
787
.44
87.6
587
.87
(2)
Acc
umul
ated
Dep
reci
atio
n-1
.88
-4.0
1-6
.50
-9.6
7-1
3.13
-16.
39-1
9.66
-22.
94-2
6.22
-29.
51-3
2.81
-35.
81-3
8.82
-41.
84(3
)W
orks
in P
rogr
ess
2.32
4.08
0.00
0.00
0.00
0.00
0.00
0.00
0.00
0.00
0.00
0.00
0.00
0.00
2.C
urre
nt A
sset
s13
.47
(1)
Cas
h1.
911.
231.
520.
860.
300.
540.
831.
121.
521.
952.
322.
713.
113.
42(2
)B
ank
Dep
osit
10.8
06.
978.
604.
881.
733.
064.
706.
348.
5911
.04
13.1
315
.34
17.6
219
.39
(3)
Acc
ount
Rec
eiva
ble
0.44
0.58
0.82
1.13
1.52
1.84
1.84
1.84
2.03
2.03
2.03
2.23
2.23
2.23
(4)
Allo
wan
ce fo
r Dou
btfu
l Acc
ount
0.13
0.18
0.25
0.34
0.46
0.56
0.56
0.56
0.62
0.62
0.62
0.68
0.68
0.68
(5)
Inve
ntor
y St
ock
0.19
0.17
0.20
0.24
0.25
0.25
0.26
0.26
0.27
0.28
0.28
0.29
0.30
0.31
(6)
Oth
er A
sset
s0.
000.
000.
000.
000.
000.
000.
000.
000.
000.
000.
000.
000.
000.
00
II.
Equ
ity a
nd L
iabi
litie
s55
.05
57.9
358
.38
67.3
777
.42
76.2
975
.13
73.9
573
.72
73.4
972
.83
72.8
872
.77
72.0
61.
Long
Ter
m L
iabi
litie
s14
.20
20.3
023
.70
36.0
048
.80
48.4
048
.00
47.6
047
.20
46.8
045
.97
44.8
443
.51
41.5
5(1
)C
onsu
mer
Dep
osits
0.00
0.00
0.00
0.00
0.00
0.00
0.00
0.00
0.00
0.00
0.00
0.00
0.00
0.00
(2)
Long
Ter
m F
orei
gn L
oans
(Exi
stin
g)5.
605.
605.
204.
804.
404.
003.
603.
202.
802.
402.
001.
601.
200.
80(3
)Lo
ng T
erm
For
eign
Loa
ns (N
ew)
8.60
14.7
018
.50
31.2
044
.40
44.4
044
.40
44.4
044
.40
44.4
043
.97
43.2
442
.31
40.7
52.
Cur
rent
Lia
bilit
ies
0.00
0.00
0.00
0.00
0.00
0.00
0.00
0.00
0.00
0.00
0.00
0.00
0.00
0.00
(1)
Shor
t-ter
m b
orro
win
g0.
000.
000.
000.
000.
000.
000.
000.
000.
000.
000.
000.
000.
000.
00(2
)C
ontra
ctor
Dep
osit
0.00
0.00
0.00
0.00
0.00
0.00
0.00
0.00
0.00
0.00
0.00
0.00
0.00
0.00
3.Eq
uity
40.8
537
.63
34.6
831
.37
28.6
227
.89
27.1
326
.35
26.5
226
.69
26.8
628
.04
29.2
630
.51
(1)
Equi
ty14
.00
14.0
014
.00
14.0
014
.00
14.0
014
.00
14.0
014
.00
14.0
014
.00
14.0
014
.00
14.0
0(2
)Eq
uity
(Don
atio
n of
Exi
stin
g Fa
cilit
ies)
30.4
030
.40
30.4
030
.40
30.4
030
.40
30.4
030
.40
30.4
030
.40
30.4
030
.40
30.4
030
.40
(3)
Prof
it/Lo
ss fo
r the
Yea
r-3
.55
-6.7
7-9
.72
-13.
03-1
5.78
-16.
51-1
7.27
-18.
05-1
7.88
-17.
71-1
7.54
-16.
36-1
5.14
-13.
89(4
)G
rant
in A
id (f
or C
apita
l Wor
ks)
0.00
0.00
0.00
0.00
0.00
0.00
0.00
0.00
0.00
0.00
0.00
0.00
0.00
0.00
Not
e*1
Turn
over
of a
ccou
nt re
ceiv
able
was
ass
umed
at 6
.1*2
Inve
ntor
y St
ock
ws a
ssum
ed a
s 30%
of a
nnua
l con
sum
ptio
n.
Tabl
e 12
7.1.
23 (3
/3)
B
alan
ce S
heet
of W
est W
ater
and
Sew
erag
e C
ompa
ny: 2
012-
2038
(1/2
)
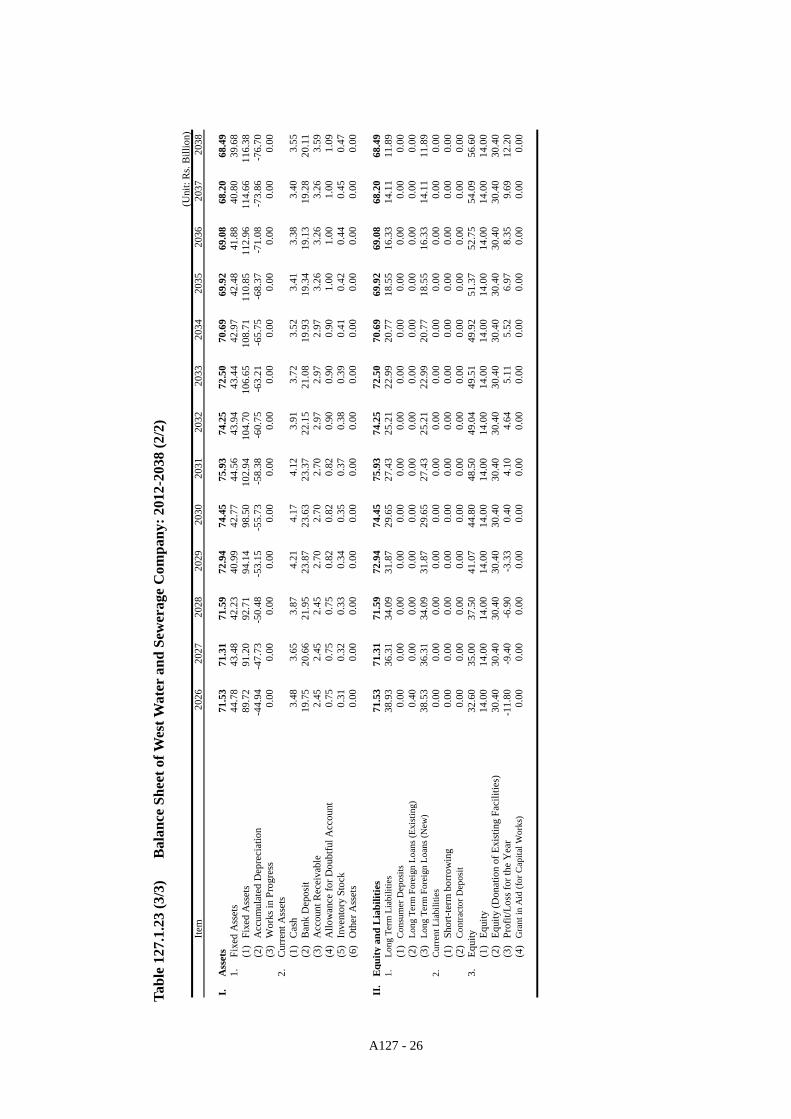
A127 - 26
(Uni
t: R
s. B
illio
n)Ite
m20
2620
2720
2820
2920
3020
3120
3220
3320
3420
3520
3620
3720
38
I.A
sset
s71
.53
71.3
171
.59
72.9
474
.45
75.9
374
.25
72.5
070
.69
69.9
269
.08
68.2
068
.49
1.Fi
xed
Ass
ets
44.7
843
.48
42.2
340
.99
42.7
744
.56
43.9
443
.44
42.9
742
.48
41.8
840
.80
39.6
8(1
)Fi
xed
Ass
ets
89.7
291
.20
92.7
194
.14
98.5
010
2.94
104.
7010
6.65
108.
7111
0.85
112.
9611
4.66
116.
38(2
)A
ccum
ulat
ed D
epre
ciat
ion
-44.
94-4
7.73
-50.
48-5
3.15
-55.
73-5
8.38
-60.
75-6
3.21
-65.
75-6
8.37
-71.
08-7
3.86
-76.
70(3
)W
orks
in P
rogr
ess
0.00
0.00
0.00
0.00
0.00
0.00
0.00
0.00
0.00
0.00
0.00
0.00
0.00
2.C
urre
nt A
sset
s(1
)C
ash
3.48
3.65
3.87
4.21
4.17
4.12
3.91
3.72
3.52
3.41
3.38
3.40
3.55
(2)
Ban
k D
epos
it19
.75
20.6
621
.95
23.8
723
.63
23.3
722
.15
21.0
819
.93
19.3
419
.13
19.2
820
.11
(3)
Acc
ount
Rec
eiva
ble
2.45
2.45
2.45
2.70
2.70
2.70
2.97
2.97
2.97
3.26
3.26
3.26
3.59
(4)
Allo
wan
ce fo
r Dou
btfu
l Acc
ount
0.75
0.75
0.75
0.82
0.82
0.82
0.90
0.90
0.90
1.00
1.00
1.00
1.09
(5)
Inve
ntor
y St
ock
0.31
0.32
0.33
0.34
0.35
0.37
0.38
0.39
0.41
0.42
0.44
0.45
0.47
(6)
Oth
er A
sset
s0.
000.
000.
000.
000.
000.
000.
000.
000.
000.
000.
000.
000.
00
II.
Equ
ity a
nd L
iabi
litie
s71
.53
71.3
171
.59
72.9
474
.45
75.9
374
.25
72.5
070
.69
69.9
269
.08
68.2
068
.49
1.Lo
ng T
erm
Lia
bilit
ies
38.9
336
.31
34.0
931
.87
29.6
527
.43
25.2
122
.99
20.7
718
.55
16.3
314
.11
11.8
9(1
)C
onsu
mer
Dep
osits
0.00
0.00
0.00
0.00
0.00
0.00
0.00
0.00
0.00
0.00
0.00
0.00
0.00
(2)
Long
Ter
m F
orei
gn L
oans
(Exi
stin
g)0.
400.
000.
000.
000.
000.
000.
000.
000.
000.
000.
000.
000.
00(3
)Lo
ng T
erm
For
eign
Loa
ns (N
ew)
38.5
336
.31
34.0
931
.87
29.6
527
.43
25.2
122
.99
20.7
718
.55
16.3
314
.11
11.8
92.
Cur
rent
Lia
bilit
ies
0.00
0.00
0.00
0.00
0.00
0.00
0.00
0.00
0.00
0.00
0.00
0.00
0.00
(1)
Shor
t-ter
m b
orro
win
g0.
000.
000.
000.
000.
000.
000.
000.
000.
000.
000.
000.
000.
00(2
)C
ontra
ctor
Dep
osit
0.00
0.00
0.00
0.00
0.00
0.00
0.00
0.00
0.00
0.00
0.00
0.00
0.00
3.Eq
uity
32.6
035
.00
37.5
041
.07
44.8
048
.50
49.0
449
.51
49.9
251
.37
52.7
554
.09
56.6
0(1
)Eq
uity
14.0
014
.00
14.0
014
.00
14.0
014
.00
14.0
014
.00
14.0
014
.00
14.0
014
.00
14.0
0(2
)Eq
uity
(Don
atio
n of
Exi
stin
g Fa
cilit
ies)
30.4
030
.40
30.4
030
.40
30.4
030
.40
30.4
030
.40
30.4
030
.40
30.4
030
.40
30.4
0(3
)Pr
ofit/
Loss
for t
he Y
ear
-11.
80-9
.40
-6.9
0-3
.33
0.40
4.10
4.64
5.11
5.52
6.97
8.35
9.69
12.2
0(4
)G
rant
in A
id (f
or C
apita
l Wor
ks)
0.00
0.00
0.00
0.00
0.00
0.00
0.00
0.00
0.00
0.00
0.00
0.00
0.00
Tabl
e 12
7.1.
23 (3
/3)
B
alan
ce S
heet
of W
est W
ater
and
Sew
erag
e C
ompa
ny: 2
012-
2038
(2/2
)

A127 - 27
(Uni
t: R
s. B
illio
n)Ite
m20
1220
1320
1420
1520
1620
1720
1820
1920
2020
2120
2220
2320
2420
25I.
Ope
ratin
g R
even
ue3.
484.
395.
877.
8210
.28
12.2
212
.22
12.2
213
.34
13.3
413
.34
14.5
814
.58
14.5
81.
Wat
er S
ales
1.75
2.40
3.42
4.83
6.62
8.03
8.03
8.03
8.83
8.83
8.83
9.71
9.71
9.71
(1)
Dom
estic
1.29
1.81
2.65
3.62
4.91
5.84
5.84
5.84
6.42
6.42
6.42
7.06
7.06
7.06
(2)
Non
-dom
estic
0.47
0.58
0.77
1.21
1.71
2.19
2.19
2.19
2.41
2.41
2.41
2.65
2.65
2.65
2.Se
wer
age
Serv
ice
1.73
1.99
2.45
2.99
3.66
4.19
4.19
4.19
4.52
4.52
4.52
4.87
4.87
4.87
(1)
Dom
estic
0.85
1.02
1.34
1.64
2.02
2.33
2.33
2.33
2.57
2.57
2.57
2.82
2.82
2.82
(2)
Non
-dom
estic
0.08
0.13
0.21
0.42
0.66
0.88
0.88
0.88
0.96
0.96
0.96
1.06
1.06
1.06
(3)
Sew
age
Rec
eivi
ng0.
800.
850.
890.
940.
980.
980.
980.
980.
980.
980.
980.
980.
980.
98II
.O
pera
ting
Expe
nses
5.30
5.70
6.39
7.51
8.03
9.02
9.10
9.18
9.26
9.34
9.43
9.14
9.24
9.34
1.O
pera
tion
Cost
s4.
244.
565.
116.
016.
427.
217.
287.
347.
417.
477.
547.
317.
397.
47(1
)W
ater
Sup
ply
4.14
4.46
4.68
5.04
5.43
6.22
6.27
6.32
6.37
6.42
6.48
6.23
6.29
6.36
1)El
ectri
city
0.46
0.55
0.57
0.60
0.62
0.65
0.68
0.71
0.74
0.78
0.81
0.85
0.88
0.92
2)C
ompe
nsat
ion
0.03
0.03
0.03
0.03
0.03
0.03
0.03
0.03
0.04
0.04
0.04
0.04
0.04
0.04
3)W
ater
Sou
rce
Cos
t1.
231.
281.
321.
371.
422.
362.
362.
362.
362.
362.
362.
362.
362.
364)
Dep
reci
atio
n1.
822.
062.
192.
472.
762.
572.
582.
582.
592.
602.
602.
312.
322.
335)
Oth
ers
0.60
0.55
0.57
0.58
0.59
0.60
0.61
0.62
0.63
0.65
0.66
0.67
0.69
0.70
(2)
Sew
erag
e0.
100.
100.
430.
970.
990.
991.
021.
031.
041.
051.
071.
081.
101.
111)
Elec
trici
ty0.
000.
000.
020.
040.
040.
040.
050.
050.
050.
050.
050.
060.
060.
062)
Com
pens
atio
n0.
000.
000.
010.
020.
030.
030.
030.
030.
030.
030.
040.
040.
040.
043)
Dep
reci
atio
n0.
070.
070.
310.
690.
690.
690.
690.
690.
690.
690.
690.
690.
690.
694)
Oth
ers
0.03
0.03
0.10
0.21
0.23
0.23
0.25
0.25
0.26
0.27
0.28
0.29
0.30
0.32
2.O
ther
s1.
061.
141.
281.
501.
611.
801.
821.
841.
851.
871.
891.
831.
851.
87II
I.N
et O
pera
ting
Rev
enue
/Def
icit
-1.8
2-1
.31
-0.5
20.
312.
253.
203.
123.
044.
094.
003.
915.
445.
345.
24IV
.N
on-o
pera
ting
Prof
it/Lo
ss-0
.56
-0.4
3-0
.74
-1.3
4-2
.08
-2.1
1-2
.02
-1.9
2-1
.87
-1.7
5-1
.63
-1.5
6-1
.41
-1.2
51.
Non
-ope
ratin
g In
com
e0.
000.
410.
320.
430.
370.
340.
430.
530.
640.
750.
880.
991.
111.
23(1
)In
tere
st R
even
ue0.
000.
410.
320.
430.
370.
340.
430.
530.
640.
750.
880.
991.
111.
23(2
)O
ther
Rev
enue
s0.
000.
000.
000.
000.
000.
000.
000.
000.
000.
000.
000.
000.
000.
002.
Non
-ope
ratin
g Ex
pens
es0.
560.
851.
061.
772.
452.
452.
452.
452.
512.
512.
512.
552.
522.
48(1
)Lo
ng-te
rm In
tere
st (N
ew L
oans
)0.
430.
670.
811.
421.
991.
891.
891.
891.
891.
891.
891.
871.
841.
80(2
)Sh
ort-t
erm
Inte
rest
0.00
0.00
0.00
0.00
0.00
0.00
0.00
0.00
0.00
0.00
0.00
0.00
0.00
0.00
(3)
Bad
Deb
t Exp
ense
0.13
0.18
0.25
0.34
0.46
0.56
0.56
0.56
0.62
0.62
0.62
0.68
0.68
0.68
V.
Ord
inar
y Pr
ofit/
Loss
-2.3
8-1
.74
-1.2
6-1
.02
0.17
1.10
1.10
1.13
2.22
2.25
2.29
3.88
3.93
3.99
VI.
Prof
it Ta
x0.
000.
000.
000.
000.
060.
380.
390.
390.
780.
790.
801.
361.
381.
40V
II.
Prof
it af
ter T
ax-2
.38
-1.7
4-1
.26
-1.0
20.
110.
710.
720.
731.
441.
461.
492.
522.
562.
59V
III .
Stoc
k D
ivid
end
0.00
0.00
0.00
0.00
0.00
0.00
0.00
0.00
0.00
0.00
0.00
0.00
0.00
0.00
IXN
et P
rofit
/Def
icit
-2.3
8-1
.74
-1.2
6-1
.02
0.11
0.71
0.72
0.73
1.44
1.46
1.49
2.52
2.56
2.59
1.B
alan
ce fo
r Pre
viou
s Yea
rs a
t Beg
inni
ng o
f the
Yea
r0.
00-2
.38
-4.1
3-5
.38
-6.4
1-6
.30
-5.5
8-4
.86
-4.1
3-2
.69
-1.2
30.
262.
785.
332.
Bal
ance
of A
ccum
ulat
ed P
rofit
/Def
icit
at E
nd o
f the
Y-2
.38
-4.1
3-5
.38
-6.4
1-6
.30
-5.5
8-4
.86
-4.1
3-2
.69
-1.2
30.
262.
785.
337.
93N
ote:
1.O
verh
ead
ratio
(inc
ludi
ng ta
xes)
10%
of W
ater
and
Sew
erag
e C
osts
<==
incl
udin
g ta
xes a
nd d
utie
s2.
Rat
io o
f bad
acc
ount
rece
ivab
le5%
of W
ater
Sup
ply
and
Sew
erag
e Se
rvic
e 3.
Cor
pora
te T
ax35
%of
Pro
fit o
f the
Yea
r
Tabl
e 12
7.1.
24 (1
/3)
Pr
ofit
and
Los
s Tab
le o
f Wes
t Wat
er a
nd S
ewer
age
Com
pany
(Cas
e 1)
: 201
2-20
38 (1
/2)
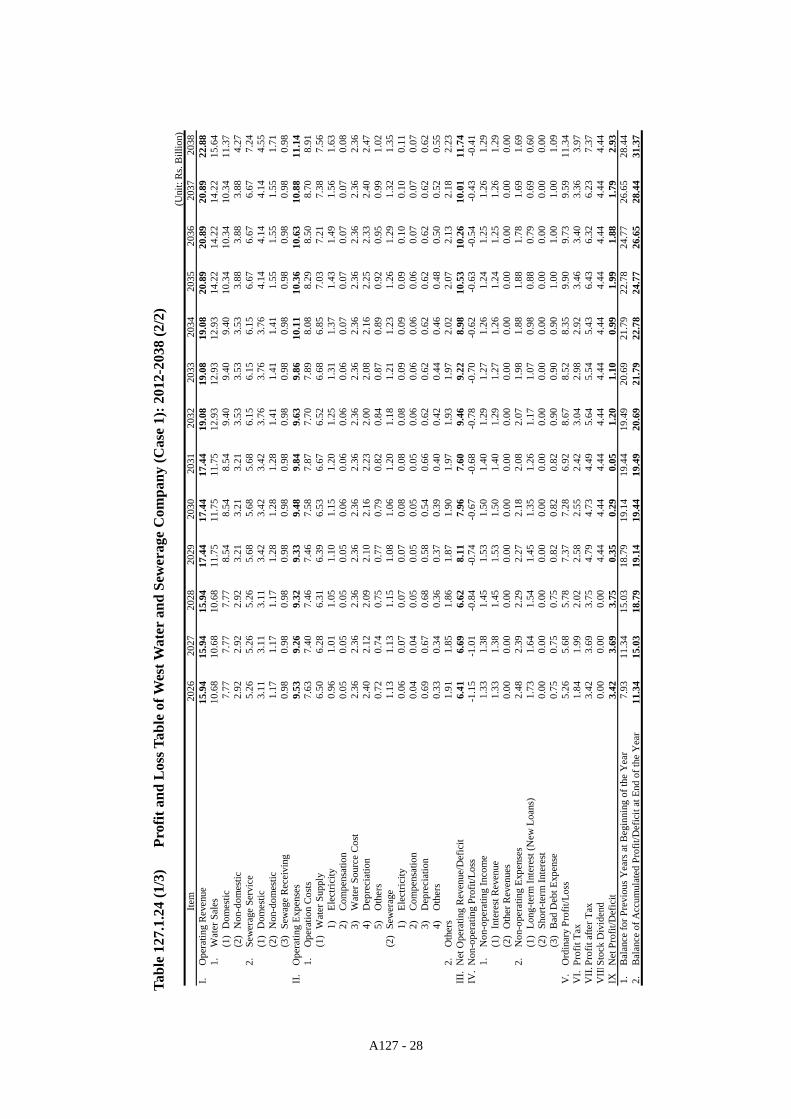
A127 - 28
(Uni
t: R
s. B
illio
n)Ite
m20
2620
2720
2820
2920
3020
3120
3220
3320
3420
3520
3620
3720
38I.
Ope
ratin
g Re
venu
e15
.94
15.9
415
.94
17.4
417
.44
17.4
419
.08
19.0
819
.08
20.8
920
.89
20.8
922
.88
1.W
ater
Sal
es10
.68
10.6
810
.68
11.7
511
.75
11.7
512
.93
12.9
312
.93
14.2
214
.22
14.2
215
.64
(1)
Dom
estic
7.77
7.77
7.77
8.54
8.54
8.54
9.40
9.40
9.40
10.3
410
.34
10.3
411
.37
(2)
Non
-dom
estic
2.92
2.92
2.92
3.21
3.21
3.21
3.53
3.53
3.53
3.88
3.88
3.88
4.27
2.Se
wer
age
Serv
ice
5.26
5.26
5.26
5.68
5.68
5.68
6.15
6.15
6.15
6.67
6.67
6.67
7.24
(1)
Dom
estic
3.11
3.11
3.11
3.42
3.42
3.42
3.76
3.76
3.76
4.14
4.14
4.14
4.55
(2)
Non
-dom
estic
1.17
1.17
1.17
1.28
1.28
1.28
1.41
1.41
1.41
1.55
1.55
1.55
1.71
(3)
Sew
age
Rec
eivi
ng0.
980.
980.
980.
980.
980.
980.
980.
980.
980.
980.
980.
980.
98II
.O
pera
ting
Expe
nses
9.53
9.26
9.32
9.33
9.48
9.84
9.63
9.86
10.1
110
.36
10.6
310
.88
11.1
41.
Ope
ratio
n C
osts
7.63
7.40
7.46
7.46
7.58
7.87
7.70
7.89
8.08
8.29
8.50
8.70
8.91
(1)
Wat
er S
uppl
y6.
506.
286.
316.
396.
536.
676.
526.
686.
857.
037.
217.
387.
561)
Elec
trici
ty0.
961.
011.
051.
101.
151.
201.
251.
311.
371.
431.
491.
561.
632)
Com
pens
atio
n0.
050.
050.
050.
050.
060.
060.
060.
060.
070.
070.
070.
070.
083)
Wat
er S
ourc
e C
ost
2.36
2.36
2.36
2.36
2.36
2.36
2.36
2.36
2.36
2.36
2.36
2.36
2.36
4)D
epre
ciat
ion
2.40
2.12
2.09
2.10
2.16
2.23
2.00
2.08
2.16
2.25
2.33
2.40
2.47
5)O
ther
s0.
720.
740.
750.
770.
790.
820.
840.
870.
890.
920.
950.
991.
02(2
)Se
wer
age
1.13
1.13
1.15
1.08
1.06
1.20
1.18
1.21
1.23
1.26
1.29
1.32
1.35
1)El
ectri
city
0.06
0.07
0.07
0.07
0.08
0.08
0.08
0.09
0.09
0.09
0.10
0.10
0.11
2)C
ompe
nsat
ion
0.04
0.04
0.05
0.05
0.05
0.05
0.06
0.06
0.06
0.06
0.07
0.07
0.07
3)D
epre
ciat
ion
0.69
0.67
0.68
0.58
0.54
0.66
0.62
0.62
0.62
0.62
0.62
0.62
0.62
4)O
ther
s0.
330.
340.
360.
370.
390.
400.
420.
440.
460.
480.
500.
520.
552.
Oth
ers
1.91
1.85
1.86
1.87
1.90
1.97
1.93
1.97
2.02
2.07
2.13
2.18
2.23
III.
Net
Ope
ratin
g R
even
ue/D
efic
it6.
416.
696.
628.
117.
967.
609.
469.
228.
9810
.53
10.2
610
.01
11.7
4IV
.N
on-o
pera
ting
Prof
it/Lo
ss-1
.15
-1.0
1-0
.84
-0.7
4-0
.67
-0.6
8-0
.78
-0.7
0-0
.62
-0.6
3-0
.54
-0.4
3-0
.41
1.N
on-o
pera
ting
Inco
me
1.33
1.38
1.45
1.53
1.50
1.40
1.29
1.27
1.26
1.24
1.25
1.26
1.29
(1)
Inte
rest
Rev
enue
1.33
1.38
1.45
1.53
1.50
1.40
1.29
1.27
1.26
1.24
1.25
1.26
1.29
(2)
Oth
er R
even
ues
0.00
0.00
0.00
0.00
0.00
0.00
0.00
0.00
0.00
0.00
0.00
0.00
0.00
2.N
on-o
pera
ting
Expe
nses
2.48
2.39
2.29
2.27
2.18
2.08
2.07
1.98
1.88
1.88
1.78
1.69
1.69
(1)
Long
-term
Inte
rest
(New
Loa
ns)
1.73
1.64
1.54
1.45
1.35
1.26
1.17
1.07
0.98
0.88
0.79
0.69
0.60
(2)
Shor
t-ter
m In
tere
st0.
000.
000.
000.
000.
000.
000.
000.
000.
000.
000.
000.
000.
00(3
)B
ad D
ebt E
xpen
se0.
750.
750.
750.
820.
820.
820.
900.
900.
901.
001.
001.
001.
09V
.O
rdin
ary
Prof
it/Lo
ss5.
265.
685.
787.
377.
286.
928.
678.
528.
359.
909.
739.
5911
.34
VI.
Prof
it Ta
x1.
841.
992.
022.
582.
552.
423.
042.
982.
923.
463.
403.
363.
97V
II.P
rofit
afte
r Tax
3.42
3.69
3.75
4.79
4.73
4.49
5.64
5.54
5.43
6.43
6.32
6.23
7.37
VII
ISto
ck D
ivid
end
0.00
0.00
0.00
4.44
4.44
4.44
4.44
4.44
4.44
4.44
4.44
4.44
4.44
IXN
et P
rofit
/Def
icit
3.42
3.69
3.75
0.35
0.29
0.05
1.20
1.10
0.99
1.99
1.88
1.79
2.93
1.B
alan
ce fo
r Pre
viou
s Yea
rs a
t Beg
inni
ng o
f the
Yea
r7.
9311
.34
15.0
318
.79
19.1
419
.44
19.4
920
.69
21.7
922
.78
24.7
726
.65
28.4
42.
Bal
ance
of A
ccum
ulat
ed P
rofit
/Def
icit
at E
nd o
f the
Yea
r11
.34
15.0
318
.79
19.1
419
.44
19.4
920
.69
21.7
922
.78
24.7
726
.65
28.4
431
.37
Tabl
e 12
7.1.
24 (1
/3)
Pr
ofit
and
Los
s Tab
le o
f Wes
t Wat
er a
nd S
ewer
age
Com
pany
(Cas
e 1)
: 201
2-20
38 (2
/2)

A127 - 29
(Uni
t: R
s. B
illio
n)Ite
m20
1220
1320
1420
1520
1620
1720
1820
1920
2020
2120
2220
2320
2420
25I.
Proc
urem
ent
1.O
pera
ting
Rev
enue
2.68
3.54
4.98
6.89
9.30
11.2
411
.24
11.2
412
.36
12.3
612
.36
13.6
013
.60
13.6
02.
Sew
age
Rec
eivi
ng0.
800.
850.
890.
940.
980.
980.
980.
980.
980.
980.
980.
980.
980.
983.
Dep
reci
atio
n1.
882.
132.
493.
173.
463.
263.
273.
283.
283.
293.
303.
003.
013.
024.
Acc
ount
Rec
eiva
ble*
1-0
.44
-0.1
4-0
.24
-0.3
1-0
.39
-0.3
20.
000.
00-0
.18
0.00
0.00
-0.2
00.
000.
005.
Inte
rest
Rev
enue
from
Sav
ing
0.00
0.41
0.32
0.43
0.37
0.34
0.43
0.53
0.64
0.75
0.88
0.99
1.11
1.23
Gro
ss In
tern
al C
ash
Posi
tion
4.92
6.79
8.45
11.1
113
.71
15.5
115
.92
16.0
317
.08
17.3
917
.52
18.3
718
.70
18.8
31.
Capi
tal I
nfus
ion
14.0
02.
Exis
ting
Faci
litie
s Tak
en O
ver
12.1
53.
Don
atio
n of
Exi
stin
g Fa
cilit
ies
18.2
54.
Fore
ign
Loan
(Exi
stin
g)6.
005.
Fore
ign
Loan
(New
Loa
ns)
8.60
6.10
3.80
12.7
013
.20
6.G
over
nmen
t Ass
ista
nce
0.00
7.Sh
ort-t
erm
Bor
row
ing
0.00
0.00
0.00
0.00
0.00
0.00
Tota
l Sou
rces
63.9
212
.89
12.2
523
.81
26.9
115
.51
15.9
216
.03
17.0
817
.39
17.5
218
.37
18.7
018
.83
II.
Dis
burs
emen
t1.
Inve
stm
ent
41.1
5(1
)Ex
istin
g Fa
cilit
ies T
aken
Ove
r12
.15
(2)
Don
atio
n fro
m K
W&
SB18
.25
(3)
Wat
er S
uppl
y Fa
cilit
ies
8.43
5.81
3.06
6.65
6.85
(4)
Sew
erag
e Fa
cilit
ies
2.32
1.77
1.72
9.28
9.68
(5)
Rep
lace
men
t of W
ater
Sup
ply
0.16
0.16
0.16
0.17
0.17
0.17
0.17
0.21
0.22
(6)
Rep
lace
men
t of S
ewer
age
2.D
ebt S
ervi
ces
1.13
1.31
1.44
2.03
2.57
2.46
2.44
2.42
2.41
2.39
2.80
3.07
3.21
3.79
(1)
Prin
cipa
l Rep
aym
ent (
Tran
sfer
red)
0.40
0.40
0.40
0.40
0.40
0.40
0.40
0.40
0.40
0.40
0.40
0.40
0.40
0.40
(2)
Prin
cipa
l Rep
aym
ent
(New
Loa
ns)
0.00
0.00
0.00
0.00
0.00
0.00
0.00
0.00
0.00
0.00
0.43
0.74
0.93
1.56
(3)
Fina
ncia
l Cha
rges
(Tra
nsfe
rred
)0.
300.
240.
220.
200.
190.
170.
150.
140.
120.
100.
090.
070.
050.
03(4
)Fi
nanc
ial C
harg
es (N
ew L
oans
)0.
430.
670.
811.
421.
991.
891.
891.
891.
891.
891.
891.
871.
841.
803.
Deb
t Ser
vice
s for
Sho
rt Fi
nanc
ing
0.00
0.00
0.00
0.00
0.00
0.00
0.00
0.00
0.00
0.00
0.00
0.00
0.00
0.00
(1)
Prin
cipa
l Rep
aym
ent
0.00
0.00
0.00
0.00
0.00
0.00
0.00
0.00
0.00
0.00
0.00
0.00
0.00
0.00
(2)
Fina
ncia
l Cha
rges
0.00
0.00
0.00
0.00
0.00
0.00
0.00
0.00
0.00
0.00
0.00
0.00
0.00
0.00
4.D
efer
red
Ass
ets
1.00
0.00
0.00
0.00
0.00
0.00
0.00
0.00
0.00
0.00
0.00
0.00
0.00
0.00
5.In
vent
ory
Stoc
k*2
0.19
0.17
0.20
0.24
0.25
0.25
0.26
0.26
0.27
0.28
0.28
0.29
0.30
0.31
6.O
ther
Dis
burs
emen
t3.
413.
573.
894.
354.
575.
755.
835.
905.
976.
056.
136.
146.
236.
327.
Prof
it Ta
x0.
000.
000.
000.
000.
060.
380.
390.
390.
780.
790.
801.
361.
381.
40To
tal D
isbu
rsem
ent
46.8
85.
055.
536.
617.
458.
848.
918.
989.
439.
5010
.02
10.8
611
.12
11.8
2II
I.N
et C
ash
Flow
17.0
47.
836.
7317
.20
19.4
66.
677.
017.
057.
657.
887.
507.
517.
587.
01IV
.O
peni
ng C
ash
Bal
ance
0.00
17.0
424
.87
31.6
048
.80
68.2
674
.93
81.9
488
.99
96.6
410
4.53
112.
0311
9.54
127.
12V
.A
ccum
ulat
ed C
ash
Posi
tion
17.0
424
.87
31.6
048
.80
68.2
674
.93
81.9
488
.99
96.6
410
4.53
112.
0311
9.54
127.
1213
4.13
Not
e:*1
Tur
nove
r of a
ccou
nt re
ceiv
able
was
ass
umed
at 6
.1*2
Inve
ntor
y St
ock
ws a
ssum
ed a
s 30%
of a
nnua
l con
sum
ptio
n.
Tabl
e 12
7.1.
24 (2
/3)
C
ash
Flow
Tab
le o
f Wes
t Wat
er a
nd S
ewer
age
Com
pany
(Cas
e 1)
: 201
2-20
38 (1
/2)
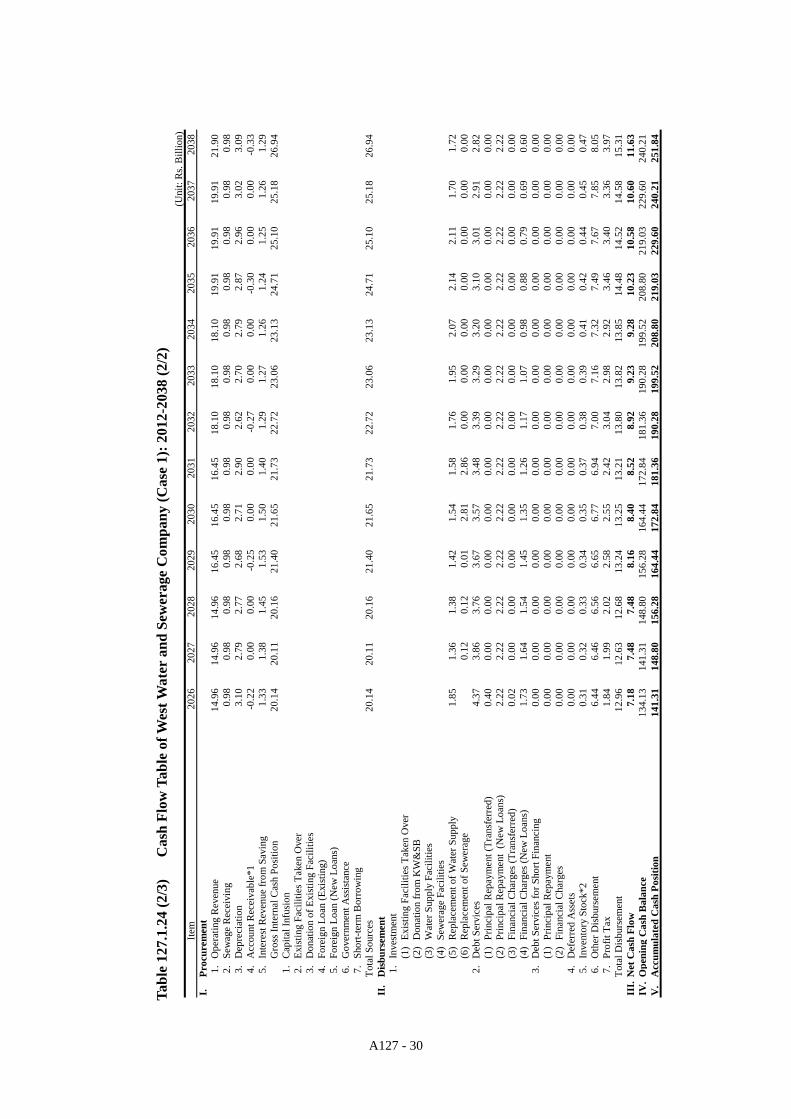
A127 - 30
(Uni
t: R
s. B
illio
n)Ite
m20
2620
2720
2820
2920
3020
3120
3220
3320
3420
3520
3620
3720
38I.
Proc
urem
ent
1.O
pera
ting
Rev
enue
14.9
614
.96
14.9
616
.45
16.4
516
.45
18.1
018
.10
18.1
019
.91
19.9
119
.91
21.9
02.
Sew
age
Rec
eivi
ng0.
980.
980.
980.
980.
980.
980.
980.
980.
980.
980.
980.
980.
983.
Dep
reci
atio
n3.
102.
792.
772.
682.
712.
902.
622.
702.
792.
872.
963.
023.
094.
Acc
ount
Rec
eiva
ble*
1-0
.22
0.00
0.00
-0.2
50.
000.
00-0
.27
0.00
0.00
-0.3
00.
000.
00-0
.33
5.In
tere
st R
even
ue fr
om S
avin
g1.
331.
381.
451.
531.
501.
401.
291.
271.
261.
241.
251.
261.
29G
ross
Inte
rnal
Cas
h Po
sitio
n20
.14
20.1
120
.16
21.4
021
.65
21.7
322
.72
23.0
623
.13
24.7
125
.10
25.1
826
.94
1.C
apita
l Inf
usio
n2.
Exis
ting
Faci
litie
s Tak
en O
ver
3.D
onat
ion
of E
xist
ing
Faci
litie
s4.
Fore
ign
Loan
(Exi
stin
g)5.
Fore
ign
Loan
(New
Loa
ns)
6.G
over
nmen
t Ass
ista
nce
7.Sh
ort-t
erm
Bor
row
ing
Tota
l Sou
rces
20.1
420
.11
20.1
621
.40
21.6
521
.73
22.7
223
.06
23.1
324
.71
25.1
025
.18
26.9
4II
.D
isbu
rsem
ent
1.In
vest
men
t(1
)Ex
istin
g Fa
cilit
ies T
aken
Ove
r(2
)D
onat
ion
from
KW
&SB
(3)
Wat
er S
uppl
y Fa
cilit
ies
(4)
Sew
erag
e Fa
cilit
ies
(5)
Rep
lace
men
t of W
ater
Sup
ply
1.85
1.36
1.38
1.42
1.54
1.58
1.76
1.95
2.07
2.14
2.11
1.70
1.72
(6)
Rep
lace
men
t of S
ewer
age
0.12
0.12
0.01
2.81
2.86
0.00
0.00
0.00
0.00
0.00
0.00
0.00
2.D
ebt S
ervi
ces
4.37
3.86
3.76
3.67
3.57
3.48
3.39
3.29
3.20
3.10
3.01
2.91
2.82
(1)
Prin
cipa
l Rep
aym
ent (
Tran
sfer
red)
0.40
0.00
0.00
0.00
0.00
0.00
0.00
0.00
0.00
0.00
0.00
0.00
0.00
(2)
Prin
cipa
l Rep
aym
ent
(New
Loa
ns)
2.22
2.22
2.22
2.22
2.22
2.22
2.22
2.22
2.22
2.22
2.22
2.22
2.22
(3)
Fina
ncia
l Cha
rges
(Tra
nsfe
rred
)0.
020.
000.
000.
000.
000.
000.
000.
000.
000.
000.
000.
000.
00(4
)Fi
nanc
ial C
harg
es (N
ew L
oans
)1.
731.
641.
541.
451.
351.
261.
171.
070.
980.
880.
790.
690.
603.
Deb
t Ser
vice
s for
Sho
rt Fi
nanc
ing
0.00
0.00
0.00
0.00
0.00
0.00
0.00
0.00
0.00
0.00
0.00
0.00
0.00
(1)
Prin
cipa
l Rep
aym
ent
0.00
0.00
0.00
0.00
0.00
0.00
0.00
0.00
0.00
0.00
0.00
0.00
0.00
(2)
Fina
ncia
l Cha
rges
0.00
0.00
0.00
0.00
0.00
0.00
0.00
0.00
0.00
0.00
0.00
0.00
0.00
4.D
efer
red
Ass
ets
0.00
0.00
0.00
0.00
0.00
0.00
0.00
0.00
0.00
0.00
0.00
0.00
0.00
5.In
vent
ory
Stoc
k*2
0.31
0.32
0.33
0.34
0.35
0.37
0.38
0.39
0.41
0.42
0.44
0.45
0.47
6.O
ther
Dis
burs
emen
t6.
446.
466.
566.
656.
776.
947.
007.
167.
327.
497.
677.
858.
057.
Prof
it Ta
x1.
841.
992.
022.
582.
552.
423.
042.
982.
923.
463.
403.
363.
97To
tal D
isbu
rsem
ent
12.9
612
.63
12.6
813
.24
13.2
513
.21
13.8
013
.82
13.8
514
.48
14.5
214
.58
15.3
1II
I.N
et C
ash
Flow
7.18
7.48
7.48
8.16
8.40
8.52
8.92
9.23
9.28
10.2
310
.58
10.6
011
.63
IV.
Ope
ning
Cas
h B
alan
ce13
4.13
141.
3114
8.80
156.
2816
4.44
172.
8418
1.36
190.
2819
9.52
208.
8021
9.03
229.
6024
0.21
V.
Acc
umul
ated
Cas
h Po
sitio
n14
1.31
148.
8015
6.28
164.
4417
2.84
181.
3619
0.28
199.
5220
8.80
219.
0322
9.60
240.
2125
1.84
Tabl
e 12
7.1.
24 (2
/3)
C
ash
Flow
Tab
le o
f Wes
t Wat
er a
nd S
ewer
age
Com
pany
(Cas
e 1)
: 201
2-20
38 (2
/2)

A127 - 31
(Uni
t: R
s. B
illio
n)Ite
m20
1220
1320
1420
1520
1620
1720
1820
1920
2020
2120
2220
2320
2420
25
I.A
sset
s56
.22
60.5
762
.72
74.0
086
.91
87.2
287
.54
87.8
788
.91
89.9
790
.63
92.0
293
.25
93.8
81.
Fixe
d A
sset
s41
.58
48.8
047
.00
59.9
273
.15
70.0
566
.94
63.8
260
.71
57.5
854
.46
51.6
348
.83
46.0
3(1
)Fi
xed
Ass
ets
41.1
548
.73
53.5
069
.59
86.2
886
.44
86.6
086
.76
86.9
387
.10
87.2
787
.44
87.6
587
.87
(2)
Acc
umul
ated
Dep
reci
atio
n-1
.88
-4.0
1-6
.50
-9.6
7-1
3.13
-16.
39-1
9.66
-22.
94-2
6.22
-29.
51-3
2.81
-35.
81-3
8.82
-41.
84(3
)W
orks
in P
rogr
ess
2.32
4.08
0.00
0.00
0.00
0.00
0.00
0.00
0.00
0.00
0.00
0.00
0.00
0.00
2.Cu
rren
t Ass
ets
14.6
40.
000.
000.
000.
000.
000.
000.
000.
000.
000.
000.
000.
000.
00(1
)C
ash
2.08
1.63
2.17
1.85
1.73
2.18
2.69
3.21
3.79
4.42
4.99
5.58
6.18
6.69
(2)
Ban
k D
epos
it11
.79
9.21
12.2
910
.51
9.79
12.3
415
.25
18.1
721
.50
25.0
528
.26
31.6
135
.03
37.9
4(3
)A
ccou
nt R
ecei
vabl
e0.
440.
580.
821.
131.
521.
841.
841.
842.
032.
032.
032.
232.
232.
23(4
)A
llow
ance
for D
oubt
ful A
ccou
nt0.
130.
180.
250.
340.
460.
560.
560.
560.
620.
620.
620.
680.
680.
68(5
)In
vent
ory
Stoc
k0.
190.
170.
200.
240.
250.
250.
260.
260.
270.
280.
280.
290.
300.
31(6
)O
ther
Ass
ets
0.00
0.00
0.00
0.00
0.00
0.00
0.00
0.00
0.00
0.00
0.00
0.00
0.00
0.00
II.
E qui
ty a
nd L
iabi
litie
s56
.22
60.5
762
.72
74.0
086
.91
87.2
287
.54
87.8
788
.91
89.9
790
.63
92.0
293
.25
93.8
81.
Long
Ter
m L
iabi
litie
s14
.20
20.3
023
.70
36.0
048
.80
48.4
048
.00
47.6
047
.20
46.8
045
.97
44.8
443
.51
41.5
5(1
)C
onsu
mer
Dep
osits
0.00
0.00
0.00
0.00
0.00
0.00
0.00
0.00
0.00
0.00
0.00
0.00
0.00
0.00
(2)
Long
Ter
m F
orei
gn L
oans
(Exi
stin
g)5.
605.
605.
204.
804.
404.
003.
603.
202.
802.
402.
001.
601.
200.
80(3
)Lo
ng T
erm
For
eign
Loa
ns (N
ew)
8.60
14.7
018
.50
31.2
044
.40
44.4
044
.40
44.4
044
.40
44.4
043
.97
43.2
442
.31
40.7
52.
Cur
rent
Lia
bilit
ies
0.00
0.00
0.00
0.00
0.00
0.00
0.00
0.00
0.00
0.00
0.00
0.00
0.00
0.00
(1)
Shor
t-ter
m b
orro
win
g0.
000.
000.
000.
000.
000.
000.
000.
000.
000.
000.
000.
000.
000.
00(2
)C
ontra
ctor
Dep
osit
0.00
0.00
0.00
0.00
0.00
0.00
0.00
0.00
0.00
0.00
0.00
0.00
0.00
0.00
3.Eq
uity
42.0
240
.27
39.0
238
.00
38.1
138
.82
39.5
440
.27
41.7
143
.17
44.6
647
.18
49.7
452
.33
(1)
Equi
ty14
.00
14.0
014
.00
14.0
014
.00
14.0
014
.00
14.0
014
.00
14.0
014
.00
14.0
014
.00
14.0
0(2
)Eq
uity
(Don
atio
n of
Exi
stin
g Fa
cilit
ies)
30.4
030
.40
30.4
030
.40
30.4
030
.40
30.4
030
.40
30.4
030
.40
30.4
030
.40
30.4
030
.40
(3)
Prof
it/Lo
ss fo
r the
Yea
r-2
.38
-4.1
3-5
.38
-6.4
1-6
.30
-5.5
8-4
.86
-4.1
3-2
.69
-1.2
30.
262.
785.
337.
93(4
)G
rant
in A
id (f
or C
apita
l Wor
ks)
0.00
0.00
0.00
0.00
0.00
0.00
0.00
0.00
0.00
0.00
0.00
0.00
0.00
0.00
Not
e*1
Turn
over
of a
ccou
nt re
ceiv
able
was
ass
umed
at 6
.1*2
Inve
ntor
y St
ock
ws a
ssum
ed a
s 30%
of a
nnua
l con
sum
ptio
n.
Tabl
e 12
7.1.
24 (3
/3)
B
alan
ce S
heet
of W
est W
ater
and
Sew
erag
e C
ompa
ny (C
ase
1): 2
012-
2038
(1/2
)

A127 - 32
(Uni
t: R
s. B
illio
n)Ite
m20
2620
2720
2820
2920
3020
3120
3220
3320
3420
3520
3620
3720
38
I.A
sset
s94
.67
95.7
597
.28
95.4
193
.49
91.3
290
.30
89.1
887
.95
87.7
287
.38
86.9
587
.66
1.Fi
xed
Ass
ets
44.7
843
.47
42.2
140
.97
42.6
144
.16
43.2
942
.54
41.8
241
.09
40.2
438
.92
37.5
5(1
)Fi
xed
Ass
ets
89.7
291
.20
92.7
194
.14
98.5
010
2.94
104.
7010
6.65
108.
7111
0.85
112.
9611
4.66
116.
38(2
)A
ccum
ulat
ed D
epre
ciat
ion
-44.
94-4
7.73
-50.
50-5
3.18
-55.
88-5
8.78
-61.
40-6
4.10
-66.
89-6
9.76
-72.
72-7
5.74
-78.
83(3
)W
orks
in P
rogr
ess
0.00
0.00
0.00
0.00
0.00
0.00
0.00
0.00
0.00
0.00
0.00
0.00
0.00
2.C
urre
nt A
sset
s0.
000.
000.
000.
000.
000.
000.
000.
000.
000.
000.
000.
000.
00(1
)C
ash
6.96
7.31
7.73
7.59
7.05
6.49
6.41
6.36
6.28
6.29
6.37
6.50
6.74
(2)
Ban
k D
epos
it39
.42
41.4
443
.80
43.0
039
.95
36.7
936
.34
36.0
135
.57
35.6
636
.08
36.8
338
.22
(3)
Acc
ount
Rec
eiva
ble
2.45
2.45
2.45
2.70
2.70
2.70
2.97
2.97
2.97
3.26
3.26
3.26
3.59
(4)
Allo
wan
ce fo
r Dou
btfu
l Acc
ount
0.75
0.75
0.75
0.82
0.82
0.82
0.90
0.90
0.90
1.00
1.00
1.00
1.09
(5)
Inve
ntor
y St
ock
0.31
0.32
0.33
0.34
0.35
0.37
0.38
0.39
0.41
0.42
0.44
0.45
0.47
(6)
Oth
er A
sset
s0.
000.
000.
000.
000.
000.
000.
000.
000.
000.
000.
000.
000.
00
II.
Equ
ity a
nd L
iabi
litie
s94
.67
95.7
597
.28
95.4
193
.49
91.3
290
.30
89.1
887
.95
87.7
287
.38
86.9
587
.66
1.Lo
ng T
erm
Lia
bilit
ies
38.9
336
.31
34.0
931
.87
29.6
527
.43
25.2
122
.99
20.7
718
.55
16.3
314
.11
11.8
9(1
)C
onsu
mer
Dep
osits
0.00
0.00
0.00
0.00
0.00
0.00
0.00
0.00
0.00
0.00
0.00
0.00
0.00
(2)
Long
Ter
m F
orei
gn L
oans
(Exi
stin
g)0.
400.
000.
000.
000.
000.
000.
000.
000.
000.
000.
000.
000.
00(3
)Lo
ng T
erm
For
eign
Loa
ns (N
ew)
38.5
336
.31
34.0
931
.87
29.6
527
.43
25.2
122
.99
20.7
718
.55
16.3
314
.11
11.8
92.
Cur
rent
Lia
bilit
ies
0.00
0.00
0.00
0.00
0.00
0.00
0.00
0.00
0.00
0.00
0.00
0.00
0.00
(1)
Shor
t-ter
m b
orro
win
g0.
000.
000.
000.
000.
000.
000.
000.
000.
000.
000.
000.
000.
00(2
)C
ontra
ctor
Dep
osit
0.00
0.00
0.00
0.00
0.00
0.00
0.00
0.00
0.00
0.00
0.00
0.00
0.00
3.Eq
uity
55.7
459
.44
63.1
963
.54
63.8
463
.89
65.0
966
.19
67.1
869
.17
71.0
572
.84
75.7
7(1
)Eq
uity
14.0
014
.00
14.0
014
.00
14.0
014
.00
14.0
014
.00
14.0
014
.00
14.0
014
.00
14.0
0(2
)Eq
uity
(Don
atio
n of
Exi
stin
g Fa
cilit
ies)
30.4
030
.40
30.4
030
.40
30.4
030
.40
30.4
030
.40
30.4
030
.40
30.4
030
.40
30.4
0(3
)Pr
ofit/
Loss
for t
he Y
ear
11.3
415
.03
18.7
919
.14
19.4
419
.49
20.6
921
.79
22.7
824
.77
26.6
528
.44
31.3
7(4
)G
rant
in A
id (f
or C
apita
l Wor
ks)
0.00
0.00
0.00
0.00
0.00
0.00
0.00
0.00
0.00
0.00
0.00
0.00
0.00
Tabl
e 12
7.1.
24 (3
/3)
B
alan
ce S
heet
of W
est W
ater
and
Sew
erag
e C
ompa
ny (C
ase
1): 2
012-
2038
(2/2
)

A127 - 33
(Uni
t: R
s. B
illio
n)Ite
m20
1220
1320
1420
1520
1620
1720
1820
1920
2020
2120
2220
2320
2420
25I.
Ope
ratin
g R
even
ue3.
564.
516.
268.
4211
.13
13.8
213
.82
13.8
215
.75
15.7
515
.75
17.9
717
.97
17.9
71.
Wat
er S
ales
1.79
2.47
3.67
5.24
7.22
9.17
9.17
9.17
10.5
510
.55
10.5
512
.13
12.1
312
.13
(1)
Dom
estic
1.31
1.87
2.85
3.93
5.36
6.67
6.67
6.67
7.67
7.67
7.67
8.82
8.82
8.82
(2)
Non
-dom
estic
0.47
0.60
0.82
1.30
1.87
2.50
2.50
2.50
2.88
2.88
2.88
3.31
3.31
3.31
2.Se
wer
age
Serv
ice
1.77
2.05
2.59
3.18
3.91
4.65
4.65
4.65
5.20
5.20
5.20
5.84
5.84
5.84
(1)
Dom
estic
0.89
1.06
1.47
1.79
2.20
2.67
2.67
2.67
3.07
3.07
3.07
3.53
3.53
3.53
(2)
Non
-dom
estic
0.08
0.14
0.23
0.46
0.72
1.00
1.00
1.00
1.15
1.15
1.15
1.32
1.32
1.32
(3)
Sew
age
Rec
eivi
ng0.
800.
850.
890.
940.
980.
980.
980.
980.
980.
980.
980.
980.
980.
98II
.O
pera
ting
Expe
nses
5.30
5.70
6.39
7.51
8.03
9.02
9.10
9.18
9.26
9.34
9.43
9.14
9.24
9.34
1.O
pera
tion
Cost
s4.
244.
565.
116.
016.
427.
217.
287.
347.
417.
477.
547.
317.
397.
47(1
)W
ater
Sup
ply
4.14
4.46
4.68
5.04
5.43
6.22
6.27
6.32
6.37
6.42
6.48
6.23
6.29
6.36
1)El
ectri
city
0.46
0.55
0.57
0.60
0.62
0.65
0.68
0.71
0.74
0.78
0.81
0.85
0.88
0.92
2)C
ompe
nsat
ion
0.03
0.03
0.03
0.03
0.03
0.03
0.03
0.03
0.04
0.04
0.04
0.04
0.04
0.04
3)W
ater
Sou
rce
Cos
t1.
231.
281.
321.
371.
422.
362.
362.
362.
362.
362.
362.
362.
362.
364)
Dep
reci
atio
n1.
822.
062.
192.
472.
762.
572.
582.
582.
592.
602.
602.
312.
322.
335)
Oth
ers
0.60
0.55
0.57
0.58
0.59
0.60
0.61
0.62
0.63
0.65
0.66
0.67
0.69
0.70
(2)
Sew
erag
e0.
100.
100.
430.
970.
990.
991.
021.
031.
041.
051.
071.
081.
101.
111)
Elec
trici
ty0.
000.
000.
020.
040.
040.
040.
050.
050.
050.
050.
050.
060.
060.
062)
Com
pens
atio
n0.
000.
000.
010.
020.
030.
030.
030.
030.
030.
030.
040.
040.
040.
043)
Dep
reci
atio
n0.
070.
070.
310.
690.
690.
690.
690.
690.
690.
690.
690.
690.
690.
694)
Oth
ers
0.03
0.03
0.10
0.21
0.23
0.23
0.25
0.25
0.26
0.27
0.28
0.29
0.30
0.32
2.O
ther
s1.
061.
141.
281.
501.
611.
801.
821.
841.
851.
871.
891.
831.
851.
87II
I.N
et O
pera
ting
Rev
enue
/Def
icit
-1.7
4-1
.19
-0.1
20.
913.
104.
814.
724.
656.
496.
416.
328.
828.
738.
62IV
.N
on-o
pera
ting
Prof
it/Lo
ss-0
.57
-0.4
4-0
.76
-1.3
5-2
.09
-2.1
4-2
.03
-1.8
9-1
.86
-1.7
0-1
.53
-1.4
6-1
.38
-1.2
91.
Non
-ope
ratin
g In
com
e0.
000.
410.
330.
440.
400.
390.
500.
630.
770.
931.
101.
261.
311.
36(1
)In
tere
st R
even
ue0.
000.
410.
330.
440.
400.
390.
500.
630.
770.
931.
101.
261.
311.
36(2
)O
ther
Rev
enue
s0.
000.
000.
000.
000.
000.
000.
000.
000.
000.
000.
000.
000.
000.
002.
Non
-ope
ratin
g Ex
pens
es0.
570.
851.
081.
802.
492.
532.
532.
532.
632.
632.
632.
722.
692.
65(1
)Lo
ng-te
rm In
tere
st (N
ew L
oans
)0.
430.
670.
811.
421.
991.
891.
891.
891.
891.
891.
891.
871.
841.
80(2
)Sh
ort-t
erm
Inte
rest
0.00
0.00
0.00
0.00
0.00
0.00
0.00
0.00
0.00
0.00
0.00
0.00
0.00
0.00
(3)
Bad
Deb
t Exp
ense
0.14
0.18
0.27
0.37
0.51
0.64
0.64
0.64
0.74
0.74
0.74
0.85
0.85
0.85
V.
Ord
inar
y Pr
ofit/
Loss
-2.3
1-1
.63
-0.8
8-0
.44
1.01
2.67
2.70
2.75
4.64
4.71
4.79
7.37
7.35
7.34
VI.
Prof
it Ta
x0.
000.
000.
000.
000.
350.
930.
940.
961.
621.
651.
682.
582.
572.
57V
II.
Prof
it af
ter T
ax-2
.31
-1.6
3-0
.88
-0.4
40.
651.
731.
751.
793.
013.
063.
124.
794.
774.
77V
III .
Stoc
k D
ivid
end
0.00
0.00
0.00
0.00
0.00
0.00
0.00
0.00
0.00
0.00
0.00
4.44
4.44
4.44
IXN
et P
rofit
/Def
icit
-2.3
1-1
.63
-0.8
8-0
.44
0.65
1.73
1.75
1.79
3.01
3.06
3.12
0.35
0.33
0.33
1.B
alan
ce fo
r Pre
viou
s Yea
rs a
t Beg
inni
ng o
f the
Yea
r0.
00-2
.31
-3.9
4-4
.81
-5.2
5-4
.60
-2.8
7-1
.11
0.67
3.69
6.75
9.86
10.2
110
.55
2.B
alan
ce o
f Acc
umul
ated
Pro
fit/D
efic
it at
End
of t
he Y
-2.3
1-3
.94
-4.8
1-5
.25
-4.6
0-2
.87
-1.1
10.
673.
696.
759.
8610
.21
10.5
510
.87
Not
e:1.
Ove
rhea
d ra
tio (i
nclu
ding
taxe
s)10
%of
Wat
er a
nd S
ewer
age
Cos
ts <
== in
clud
ing
taxe
s and
dut
ies
2.R
atio
of b
ad a
ccou
nt re
ceiv
able
5%of
Wat
er S
uppl
y an
d Se
wer
age
Serv
ice
3.C
orpo
rate
Tax
35%
of P
rofit
of t
he Y
ear
Tabl
e A12
7.1.
25 (1
/3)
Pr
ofit
and
Los
s Tab
le o
f Wes
t Wat
er a
nd S
ewer
age
Com
pany
(Cas
e 2)
: 201
2-20
38 (1
/2)
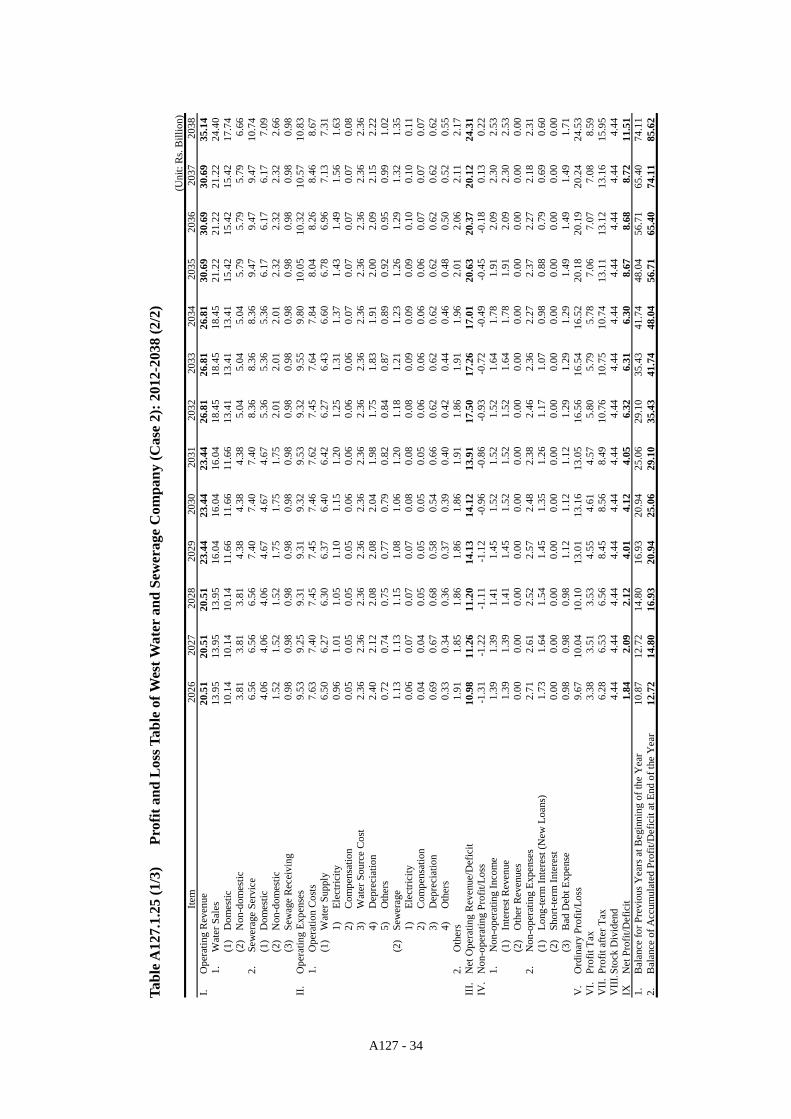
A127 - 34
(Uni
t: R
s. B
illio
n)Ite
m20
2620
2720
2820
2920
3020
3120
3220
3320
3420
3520
3620
3720
38I.
Ope
ratin
g R
even
ue20
.51
20.5
120
.51
23.4
423
.44
23.4
426
.81
26.8
126
.81
30.6
930
.69
30.6
935
.14
1.W
ater
Sal
es13
.95
13.9
513
.95
16.0
416
.04
16.0
418
.45
18.4
518
.45
21.2
221
.22
21.2
224
.40
(1)
Dom
estic
10.1
410
.14
10.1
411
.66
11.6
611
.66
13.4
113
.41
13.4
115
.42
15.4
215
.42
17.7
4(2
)N
on-d
omes
tic3.
813.
813.
814.
384.
384.
385.
045.
045.
045.
795.
795.
796.
662.
Sew
erag
e Se
rvic
e6.
566.
566.
567.
407.
407.
408.
368.
368.
369.
479.
479.
4710
.74
(1)
Dom
estic
4.06
4.06
4.06
4.67
4.67
4.67
5.36
5.36
5.36
6.17
6.17
6.17
7.09
(2)
Non
-dom
estic
1.52
1.52
1.52
1.75
1.75
1.75
2.01
2.01
2.01
2.32
2.32
2.32
2.66
(3)
Sew
age
Rec
eivi
ng0.
980.
980.
980.
980.
980.
980.
980.
980.
980.
980.
980.
980.
98II
.O
pera
ting
Expe
nses
9.53
9.25
9.31
9.31
9.32
9.53
9.32
9.55
9.80
10.0
510
.32
10.5
710
.83
1.O
pera
tion
Cos
ts7.
637.
407.
457.
457.
467.
627.
457.
647.
848.
048.
268.
468.
67(1
)W
ater
Sup
ply
6.50
6.27
6.30
6.37
6.40
6.42
6.27
6.43
6.60
6.78
6.96
7.13
7.31
1)El
ectri
city
0.96
1.01
1.05
1.10
1.15
1.20
1.25
1.31
1.37
1.43
1.49
1.56
1.63
2)C
ompe
nsat
ion
0.05
0.05
0.05
0.05
0.06
0.06
0.06
0.06
0.07
0.07
0.07
0.07
0.08
3)W
ater
Sou
rce
Cos
t2.
362.
362.
362.
362.
362.
362.
362.
362.
362.
362.
362.
362.
364)
Dep
reci
atio
n2.
402.
122.
082.
082.
041.
981.
751.
831.
912.
002.
092.
152.
225)
Oth
ers
0.72
0.74
0.75
0.77
0.79
0.82
0.84
0.87
0.89
0.92
0.95
0.99
1.02
(2)
Sew
erag
e1.
131.
131.
151.
081.
061.
201.
181.
211.
231.
261.
291.
321.
351)
Elec
trici
ty0.
060.
070.
070.
070.
080.
080.
080.
090.
090.
090.
100.
100.
112)
Com
pens
atio
n0.
040.
040.
050.
050.
050.
050.
060.
060.
060.
060.
070.
070.
073)
Dep
reci
atio
n0.
690.
670.
680.
580.
540.
660.
620.
620.
620.
620.
620.
620.
624)
Oth
ers
0.33
0.34
0.36
0.37
0.39
0.40
0.42
0.44
0.46
0.48
0.50
0.52
0.55
2.O
ther
s1.
911.
851.
861.
861.
861.
911.
861.
911.
962.
012.
062.
112.
17II
I.N
et O
pera
ting
Rev
enue
/Def
icit
10.9
811
.26
11.2
014
.13
14.1
213
.91
17.5
017
.26
17.0
120
.63
20.3
720
.12
24.3
1IV
.N
on-o
pera
ting
Prof
it/Lo
ss-1
.31
-1.2
2-1
.11
-1.1
2-0
.96
-0.8
6-0
.93
-0.7
2-0
.49
-0.4
5-0
.18
0.13
0.22
1.N
on-o
pera
ting
Inco
me
1.39
1.39
1.41
1.45
1.52
1.52
1.52
1.64
1.78
1.91
2.09
2.30
2.53
(1)
Inte
rest
Rev
enue
1.39
1.39
1.41
1.45
1.52
1.52
1.52
1.64
1.78
1.91
2.09
2.30
2.53
(2)
Oth
er R
even
ues
0.00
0.00
0.00
0.00
0.00
0.00
0.00
0.00
0.00
0.00
0.00
0.00
0.00
2.N
on-o
pera
ting
Expe
nses
2.71
2.61
2.52
2.57
2.48
2.38
2.46
2.36
2.27
2.37
2.27
2.18
2.31
(1)
Long
-term
Inte
rest
(New
Loa
ns)
1.73
1.64
1.54
1.45
1.35
1.26
1.17
1.07
0.98
0.88
0.79
0.69
0.60
(2)
Shor
t-ter
m In
tere
st0.
000.
000.
000.
000.
000.
000.
000.
000.
000.
000.
000.
000.
00(3
)B
ad D
ebt E
xpen
se0.
980.
980.
981.
121.
121.
121.
291.
291.
291.
491.
491.
491.
71V
.O
rdin
ary
Prof
it/Lo
ss9.
6710
.04
10.1
013
.01
13.1
613
.05
16.5
616
.54
16.5
220
.18
20.1
920
.24
24.5
3V
I.Pr
ofit
Tax
3.38
3.51
3.53
4.55
4.61
4.57
5.80
5.79
5.78
7.06
7.07
7.08
8.59
VII
.Pr
ofit
afte
r Tax
6.28
6.53
6.56
8.45
8.56
8.49
10.7
610
.75
10.7
413
.11
13.1
213
.16
15.9
5V
III .
Stoc
k D
ivid
end
4.44
4.44
4.44
4.44
4.44
4.44
4.44
4.44
4.44
4.44
4.44
4.44
4.44
IXN
et P
rofit
/Def
icit
1.84
2.09
2.12
4.01
4.12
4.05
6.32
6.31
6.30
8.67
8.68
8.72
11.5
11.
Bal
ance
for P
revi
ous Y
ears
at B
egin
ning
of t
he Y
ear
10.8
712
.72
14.8
016
.93
20.9
425
.06
29.1
035
.43
41.7
448
.04
56.7
165
.40
74.1
12.
Bal
ance
of A
ccum
ulat
ed P
rofit
/Def
icit
at E
nd o
f the
Yea
r12
.72
14.8
016
.93
20.9
425
.06
29.1
035
.43
41.7
448
.04
56.7
165
.40
74.1
185
.62
Tabl
e A12
7.1.
25 (1
/3)
Pr
ofit
and
Los
s Tab
le o
f Wes
t Wat
er a
nd S
ewer
age
Com
pany
(Cas
e 2)
: 201
2-20
38 (2
/2)
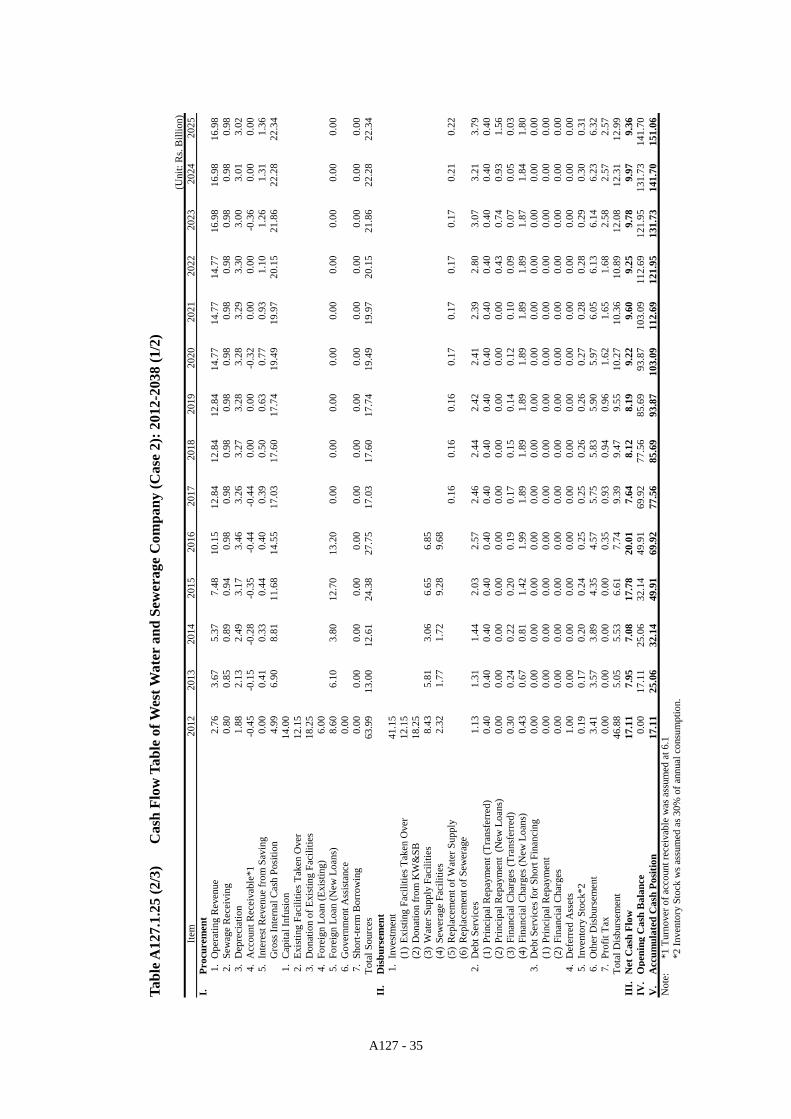
A127 - 35
(Uni
t: R
s. B
illio
n)Ite
m20
1220
1320
1420
1520
1620
1720
1820
1920
2020
2120
2220
2320
2420
25I.
Proc
urem
ent
1.O
pera
ting
Rev
enue
2.76
3.67
5.37
7.48
10.1
512
.84
12.8
412
.84
14.7
714
.77
14.7
716
.98
16.9
816
.98
2.Se
wag
e R
ecei
ving
0.80
0.85
0.89
0.94
0.98
0.98
0.98
0.98
0.98
0.98
0.98
0.98
0.98
0.98
3.D
epre
ciat
ion
1.88
2.13
2.49
3.17
3.46
3.26
3.27
3.28
3.28
3.29
3.30
3.00
3.01
3.02
4.A
ccou
nt R
ecei
vabl
e*1
-0.4
5-0
.15
-0.2
8-0
.35
-0.4
4-0
.44
0.00
0.00
-0.3
20.
000.
00-0
.36
0.00
0.00
5.In
tere
st R
even
ue fr
om S
avin
g0.
000.
410.
330.
440.
400.
390.
500.
630.
770.
931.
101.
261.
311.
36G
ross
Inte
rnal
Cas
h Po
sitio
n4.
996.
908.
8111
.68
14.5
517
.03
17.6
017
.74
19.4
919
.97
20.1
521
.86
22.2
822
.34
1.Ca
pita
l Inf
usio
n14
.00
2.Ex
istin
g Fa
cilit
ies T
aken
Ove
r12
.15
3.D
onat
ion
of E
xist
ing
Faci
litie
s18
.25
4.Fo
reig
n Lo
an (E
xist
ing)
6.00
5.Fo
reig
n Lo
an (N
ew L
oans
)8.
606.
103.
8012
.70
13.2
00.
000.
000.
000.
000.
000.
000.
000.
000.
006.
Gov
ernm
ent A
ssis
tanc
e0.
007.
Shor
t-ter
m B
orro
win
g0.
000.
000.
000.
000.
000.
000.
000.
000.
000.
000.
000.
000.
000.
00To
tal S
ourc
es63
.99
13.0
012
.61
24.3
827
.75
17.0
317
.60
17.7
419
.49
19.9
720
.15
21.8
622
.28
22.3
4II
.D
isbu
rsem
ent
1.In
vest
men
t41
.15
(1)
Exist
ing
Faci
litie
s Tak
en O
ver
12.1
5(2
)D
onat
ion
from
KW
&SB
18.2
5(3
)W
ater
Sup
ply
Faci
litie
s8.
435.
813.
066.
656.
85(4
)Se
wer
age
Faci
litie
s2.
321.
771.
729.
289.
68(5
)R
epla
cem
ent o
f Wat
er S
uppl
y0.
160.
160.
160.
170.
170.
170.
170.
210.
22(6
)R
epla
cem
ent o
f Sew
erag
e2.
Deb
t Ser
vice
s1.
131.
311.
442.
032.
572.
462.
442.
422.
412.
392.
803.
073.
213.
79(1
)Pr
inci
pal R
epay
men
t (Tr
ansf
erre
d)0.
400.
400.
400.
400.
400.
400.
400.
400.
400.
400.
400.
400.
400.
40(2
)Pr
inci
pal R
epay
men
t (N
ew L
oans
)0.
000.
000.
000.
000.
000.
000.
000.
000.
000.
000.
430.
740.
931.
56(3
)Fi
nanc
ial C
harg
es (T
rans
ferr
ed)
0.30
0.24
0.22
0.20
0.19
0.17
0.15
0.14
0.12
0.10
0.09
0.07
0.05
0.03
(4)
Fina
ncia
l Cha
rges
(New
Loa
ns)
0.43
0.67
0.81
1.42
1.99
1.89
1.89
1.89
1.89
1.89
1.89
1.87
1.84
1.80
3.D
ebt S
ervi
ces f
or S
hort
Fina
ncin
g0.
000.
000.
000.
000.
000.
000.
000.
000.
000.
000.
000.
000.
000.
00(1
)Pr
inci
pal R
epay
men
t0.
000.
000.
000.
000.
000.
000.
000.
000.
000.
000.
000.
000.
000.
00(2
)Fi
nanc
ial C
harg
es0.
000.
000.
000.
000.
000.
000.
000.
000.
000.
000.
000.
000.
000.
004.
Def
erre
d A
sset
s1.
000.
000.
000.
000.
000.
000.
000.
000.
000.
000.
000.
000.
000.
005.
Inve
ntor
y St
ock*
20.
190.
170.
200.
240.
250.
250.
260.
260.
270.
280.
280.
290.
300.
316.
Oth
er D
isbu
rsem
ent
3.41
3.57
3.89
4.35
4.57
5.75
5.83
5.90
5.97
6.05
6.13
6.14
6.23
6.32
7.Pr
ofit
Tax
0.00
0.00
0.00
0.00
0.35
0.93
0.94
0.96
1.62
1.65
1.68
2.58
2.57
2.57
Tota
l Dis
burs
emen
t46
.88
5.05
5.53
6.61
7.74
9.39
9.47
9.55
10.2
710
.36
10.8
912
.08
12.3
112
.99
III.
Net
Cas
h Fl
ow17
.11
7.95
7.08
17.7
820
.01
7.64
8.12
8.19
9.22
9.60
9.25
9.78
9.97
9.36
IV.
Ope
ning
Cas
h B
alan
ce0.
0017
.11
25.0
632
.14
49.9
169
.92
77.5
685
.69
93.8
710
3.09
112.
6912
1.95
131.
7314
1.70
V.
Acc
umul
ated
Cas
h Po
sitio
n17
.11
25.0
632
.14
49.9
169
.92
77.5
685
.69
93.8
710
3.09
112.
6912
1.95
131.
7314
1.70
151.
06N
ote:
*1 T
urno
ver o
f acc
ount
rece
ivab
le w
as a
ssum
ed a
t 6.1
*2 In
vent
ory
Stoc
k w
s ass
umed
as 3
0% o
f ann
ual c
onsu
mpt
ion.
Tabl
e A12
7.1.
25 (2
/3)
C
ash
Flow
Tab
le o
f Wes
t Wat
er a
nd S
ewer
age
Com
pany
(Cas
e 2)
: 201
2-20
38 (1
/2)

A127 - 36
(Uni
t: R
s. B
illio
n)Ite
m20
2620
2720
2820
2920
3020
3120
3220
3320
3420
3520
3620
3720
38I.
Proc
urem
ent
1.O
pera
ting
Rev
enue
19.5
319
.53
19.5
322
.46
22.4
622
.46
25.8
325
.83
25.8
329
.70
29.7
029
.70
34.1
62.
Sew
age
Rec
eivi
ng0.
980.
980.
980.
980.
980.
980.
980.
980.
980.
980.
980.
980.
983.
Dep
reci
atio
n3.
102.
792.
752.
672.
582.
652.
382.
452.
542.
622.
712.
782.
854.
Acc
ount
Rec
eiva
ble*
1-0
.42
0.00
0.00
-0.4
80.
000.
00-0
.55
0.00
0.00
-0.6
40.
000.
00-0
.73
5.In
tere
st R
even
ue fr
om S
avin
g1.
391.
391.
411.
451.
521.
521.
521.
641.
781.
912.
092.
302.
53G
ross
Inte
rnal
Cas
h Po
sitio
n24
.59
24.6
924
.68
27.0
827
.54
27.6
130
.16
30.9
131
.13
34.5
935
.49
35.7
739
.79
1.C
apita
l Inf
usio
n2.
Exis
ting
Faci
litie
s Tak
en O
ver
3.D
onat
ion
of E
xist
ing
Faci
litie
s4.
Fore
ign
Loan
(Exi
stin
g)5.
Fore
ign
Loan
(New
Loa
ns)
0.00
0.00
0.00
0.00
0.00
0.00
0.00
0.00
0.00
0.00
0.00
0.00
0.00
6.G
over
nmen
t Ass
ista
nce
7.Sh
ort-t
erm
Bor
row
ing
0.00
0.00
0.00
0.00
0.00
0.00
0.00
0.00
0.00
0.00
0.00
0.00
0.00
Tota
l Sou
rces
24.5
924
.69
24.6
827
.08
27.5
427
.61
30.1
630
.91
31.1
334
.59
35.4
935
.77
39.7
9II
.D
isbu
rsem
ent
1.In
vest
men
t(1
)Ex
istin
g Fa
cilit
ies T
aken
Ove
r(2
)D
onat
ion
from
KW
&SB
(3)
Wat
er S
uppl
y Fa
cilit
ies
(4)
Sew
erag
e Fa
cilit
ies
(5)
Rep
lace
men
t of W
ater
Sup
ply
1.85
1.36
1.38
1.42
1.54
1.58
1.76
1.95
2.07
2.14
2.11
1.70
1.72
(6)
Rep
lace
men
t of S
ewer
age
0.12
0.12
0.01
2.81
2.86
0.00
0.00
0.00
0.00
0.00
0.00
0.00
2.D
ebt S
ervi
ces
4.37
3.86
3.76
3.67
3.57
3.48
3.39
3.29
3.20
3.10
3.01
2.91
2.82
(1)
Prin
cipa
l Rep
aym
ent (
Tran
sfer
red)
0.40
0.00
0.00
0.00
0.00
0.00
0.00
0.00
0.00
0.00
0.00
0.00
0.00
(2)
Prin
cipa
l Rep
aym
ent
(New
Loa
ns)
2.22
2.22
2.22
2.22
2.22
2.22
2.22
2.22
2.22
2.22
2.22
2.22
2.22
(3)
Fina
ncia
l Cha
rges
(Tra
nsfe
rred
)0.
020.
000.
000.
000.
000.
000.
000.
000.
000.
000.
000.
000.
00(4
)Fi
nanc
ial C
harg
es (N
ew L
oans
)1.
731.
641.
541.
451.
351.
261.
171.
070.
980.
880.
790.
690.
603.
Deb
t Ser
vice
s for
Sho
rt Fi
nanc
ing
0.00
0.00
0.00
0.00
0.00
0.00
0.00
0.00
0.00
0.00
0.00
0.00
0.00
(1)
Prin
cipa
l Rep
aym
ent
0.00
0.00
0.00
0.00
0.00
0.00
0.00
0.00
0.00
0.00
0.00
0.00
0.00
(2)
Fina
ncia
l Cha
rges
0.00
0.00
0.00
0.00
0.00
0.00
0.00
0.00
0.00
0.00
0.00
0.00
0.00
4.D
efer
red
Ass
ets
0.00
0.00
0.00
0.00
0.00
0.00
0.00
0.00
0.00
0.00
0.00
0.00
0.00
5.In
vent
ory
Stoc
k*2
0.31
0.32
0.33
0.34
0.35
0.37
0.38
0.39
0.41
0.42
0.44
0.45
0.47
6.O
ther
Dis
burs
emen
t6.
446.
466.
566.
656.
746.
886.
947.
107.
267.
437.
617.
797.
997.
Prof
it Ta
x3.
383.
513.
534.
554.
614.
575.
805.
795.
787.
067.
077.
088.
59To
tal D
isbu
rsem
ent
14.5
014
.16
14.1
915
.21
15.2
815
.29
16.5
016
.57
16.6
418
.02
18.1
218
.24
19.8
6II
I.N
et C
ash
Flow
10.0
810
.54
10.5
011
.87
12.2
712
.32
13.6
614
.34
14.4
816
.57
17.3
717
.52
19.9
2IV
.O
peni
ng C
ash
Bal
ance
151.
0616
1.14
171.
6818
2.17
194.
0420
6.30
218.
6223
2.28
246.
6226
1.10
277.
6829
5.05
312.
57V
.A
ccum
ulat
ed C
ash
Posi
tion
161.
1417
1.68
182.
1719
4.04
206.
3021
8.62
232.
2824
6.62
261.
1027
7.68
295.
0531
2.57
332.
49
Tabl
e A12
7.1.
25 (2
/3)
C
ash
Flow
Tab
le o
f Wes
t Wat
er a
nd S
ewer
age
Com
pany
(Cas
e 2)
: 201
2-20
38 (2
/2)
A127 - 37
(Uni
t: R
s. B
illio
n)Ite
m20
1220
1320
1420
1520
1620
1720
1820
1920
2020
2120
2220
2320
2420
25
I.A
sset
s56
.29
60.7
663
.29
75.1
588
.60
89.9
391
.29
92.6
795
.29
97.9
510
0.23
99.4
598
.46
96.8
31.
Fixe
d A
sset
s41
.58
48.8
047
.00
59.9
273
.15
70.0
566
.94
63.8
260
.71
57.5
854
.46
51.6
348
.83
46.0
3(1
)Fi
xed
Ass
ets
41.1
548
.73
53.5
069
.59
86.2
886
.44
86.6
086
.76
86.9
387
.10
87.2
787
.44
87.6
587
.87
(2)
Acc
umul
ated
Dep
reci
atio
n-1
.88
-4.0
1-6
.50
-9.6
7-1
3.13
-16.
39-1
9.66
-22.
94-2
6.22
-29.
51-3
2.81
-35.
81-3
8.82
-41.
84(3
)W
orks
in P
rogr
ess
2.32
4.08
0.00
0.00
0.00
0.00
0.00
0.00
0.00
0.00
0.00
0.00
0.00
0.00
2.Cu
rren
t Ass
ets
14.7
10.
000.
000.
000.
000.
000.
000.
000.
000.
000.
000.
000.
000.
00(1
)C
ash
2.09
1.65
2.24
2.01
1.95
2.53
3.20
3.88
4.67
5.54
6.35
6.58
6.85
7.03
(2)
Ban
k D
epos
it11
.84
9.35
12.7
011
.38
11.0
814
.36
18.1
421
.96
26.4
831
.39
35.9
937
.31
38.8
439
.83
(3)
Acc
ount
Rec
eiva
ble
0.45
0.60
0.88
1.23
1.66
2.11
2.11
2.11
2.42
2.42
2.42
2.78
2.78
2.78
(4)
Allo
wan
ce fo
r Dou
btfu
l Acc
ount
0.14
0.18
0.27
0.37
0.51
0.64
0.64
0.64
0.74
0.74
0.74
0.85
0.85
0.85
(5)
Inve
ntor
y St
ock
0.19
0.17
0.20
0.24
0.25
0.25
0.26
0.26
0.27
0.28
0.28
0.29
0.30
0.31
(6)
Oth
er A
sset
s0.
000.
000.
000.
000.
000.
000.
000.
000.
000.
000.
000.
000.
000.
00
II.
Equ
ity a
nd L
iabi
litie
s56
.29
60.7
663
.29
75.1
588
.60
89.9
391
.29
92.6
795
.29
97.9
510
0.23
99.4
598
.46
96.8
31.
Long
Ter
m L
iabi
litie
s14
.20
20.3
023
.70
36.0
048
.80
48.4
048
.00
47.6
047
.20
46.8
045
.97
44.8
443
.51
41.5
5(1
)C
onsu
mer
Dep
osits
0.00
0.00
0.00
0.00
0.00
0.00
0.00
0.00
0.00
0.00
0.00
0.00
0.00
0.00
(2)
Long
Ter
m F
orei
gn L
oans
(Exi
stin
g)5.
605.
605.
204.
804.
404.
003.
603.
202.
802.
402.
001.
601.
200.
80(3
)Lo
ng T
erm
For
eign
Loa
ns (N
ew)
8.60
14.7
018
.50
31.2
044
.40
44.4
044
.40
44.4
044
.40
44.4
043
.97
43.2
442
.31
40.7
52.
Cur
rent
Lia
bilit
ies
0.00
0.00
0.00
0.00
0.00
0.00
0.00
0.00
0.00
0.00
0.00
0.00
0.00
0.00
(1)
Shor
t-ter
m b
orro
win
g0.
000.
000.
000.
000.
000.
000.
000.
000.
000.
000.
000.
000.
000.
00(2
)C
ontra
ctor
Dep
osit
0.00
0.00
0.00
0.00
0.00
0.00
0.00
0.00
0.00
0.00
0.00
0.00
0.00
0.00
3.Eq
uity
42.0
940
.46
39.5
939
.15
39.8
041
.53
43.2
945
.07
48.0
951
.15
54.2
654
.61
54.9
555
.28
(1)
Equi
ty14
.00
14.0
014
.00
14.0
014
.00
14.0
014
.00
14.0
014
.00
14.0
014
.00
14.0
014
.00
14.0
0(2
)Eq
uity
(Don
atio
n of
Exi
stin
g Fa
cilit
ies)
30.4
030
.40
30.4
030
.40
30.4
030
.40
30.4
030
.40
30.4
030
.40
30.4
030
.40
30.4
030
.40
(3)
Prof
it/Lo
ss fo
r the
Yea
r-2
.31
-3.9
4-4
.81
-5.2
5-4
.60
-2.8
7-1
.11
0.67
3.69
6.75
9.86
10.2
110
.55
10.8
7(4
)G
rant
in A
id (f
or C
apita
l Wor
ks)
0.00
0.00
0.00
0.00
0.00
0.00
0.00
0.00
0.00
0.00
0.00
0.00
0.00
0.00
Not
e*1
Turn
over
of a
ccou
nt re
ceiv
able
was
ass
umed
at 6
.1*2
Inve
ntor
y St
ock
ws a
ssum
ed a
s 30%
of a
nnua
l con
sum
ptio
n.
Tabl
e A12
7.1.
25 (3
/3)
B
alan
ce S
heet
of W
est W
ater
and
Sew
erag
e C
ompa
ny (C
ase
2): 2
012-
2038
(1/2
)

A127 - 38
(Uni
t: R
s. B
illio
n)Ite
m20
2620
2720
2820
2920
3020
3120
3220
3320
3420
3520
3620
3720
38
I.A
sset
s96
.05
95.5
295
.42
97.2
199
.11
100.
9310
5.04
109.
1311
3.21
119.
6612
6.13
132.
6214
1.91
1.Fi
xed
Ass
ets
44.7
843
.48
42.2
340
.99
42.7
744
.56
43.9
443
.44
42.9
742
.48
41.8
840
.80
39.6
8(1
)Fi
xed
Ass
ets
89.7
291
.20
92.7
194
.14
98.5
010
2.94
104.
7010
6.65
108.
7111
0.85
112.
9611
4.66
116.
38(2
)A
ccum
ulat
ed D
epre
ciat
ion
-44.
94-4
7.73
-50.
48-5
3.15
-55.
73-5
8.38
-60.
75-6
3.21
-65.
75-6
8.37
-71.
08-7
3.86
-76.
70(3
)W
orks
in P
rogr
ess
0.00
0.00
0.00
0.00
0.00
0.00
0.00
0.00
0.00
0.00
0.00
0.00
0.00
2.C
urre
nt A
sset
s0.
000.
000.
000.
000.
000.
000.
000.
000.
000.
000.
000.
000.
00(1
)C
ash
7.02
7.13
7.30
7.66
7.68
7.68
8.28
8.97
9.65
10.5
611
.62
12.7
514
.17
(2)
Ban
k D
epos
it39
.76
40.4
141
.38
43.4
143
.50
43.5
246
.91
50.8
154
.67
59.8
565
.84
72.2
680
.28
(3)
Acc
ount
Rec
eiva
ble
3.20
3.20
3.20
3.68
3.68
3.68
4.23
4.23
4.23
4.87
4.87
4.87
5.60
(4)
Allo
wan
ce fo
r Dou
btfu
l Acc
ount
0.98
0.98
0.98
1.12
1.12
1.12
1.29
1.29
1.29
1.49
1.49
1.49
1.71
(5)
Inve
ntor
y St
ock
0.31
0.32
0.33
0.34
0.35
0.37
0.38
0.39
0.41
0.42
0.44
0.45
0.47
(6)
Oth
er A
sset
s0.
000.
000.
000.
000.
000.
000.
000.
000.
000.
000.
000.
000.
00
II.
Equ
ity a
nd L
iabi
litie
s96
.05
95.5
295
.42
97.2
199
.11
100.
9310
5.04
109.
1311
3.21
119.
6612
6.13
132.
6214
1.91
1.Lo
ng T
erm
Lia
bilit
ies
38.9
336
.31
34.0
931
.87
29.6
527
.43
25.2
122
.99
20.7
718
.55
16.3
314
.11
11.8
9(1
)C
onsu
mer
Dep
osits
0.00
0.00
0.00
0.00
0.00
0.00
0.00
0.00
0.00
0.00
0.00
0.00
0.00
(2)
Long
Ter
m F
orei
gn L
oans
(Exi
stin
g)0.
400.
000.
000.
000.
000.
000.
000.
000.
000.
000.
000.
000.
00(3
)Lo
ng T
erm
For
eign
Loa
ns (N
ew)
38.5
336
.31
34.0
931
.87
29.6
527
.43
25.2
122
.99
20.7
718
.55
16.3
314
.11
11.8
92.
Cur
rent
Lia
bilit
ies
0.00
0.00
0.00
0.00
0.00
0.00
0.00
0.00
0.00
0.00
0.00
0.00
0.00
(1)
Shor
t-ter
m b
orro
win
g0.
000.
000.
000.
000.
000.
000.
000.
000.
000.
000.
000.
000.
00(2
)C
ontra
ctor
Dep
osit
0.00
0.00
0.00
0.00
0.00
0.00
0.00
0.00
0.00
0.00
0.00
0.00
0.00
3.Eq
uity
57.1
259
.21
61.3
365
.34
69.4
673
.50
79.8
386
.14
92.4
410
1.11
109.
8011
8.51
130.
02(1
)Eq
uity
14.0
014
.00
14.0
014
.00
14.0
014
.00
14.0
014
.00
14.0
014
.00
14.0
014
.00
14.0
0(2
)Eq
uity
(Don
atio
n of
Exi
stin
g Fa
cilit
ies)
30.4
030
.40
30.4
030
.40
30.4
030
.40
30.4
030
.40
30.4
030
.40
30.4
030
.40
30.4
0(3
)Pr
ofit/
Loss
for t
he Y
ear
12.7
214
.80
16.9
320
.94
25.0
629
.10
35.4
341
.74
48.0
456
.71
65.4
074
.11
85.6
2(4
)G
rant
in A
id (f
or C
apita
l Wor
ks)
0.00
0.00
0.00
0.00
0.00
0.00
0.00
0.00
0.00
0.00
0.00
0.00
0.00
Tabl
e A12
7.1.
25 (3
/3)
B
alan
ce S
heet
of W
est W
ater
and
Sew
erag
e C
ompa
ny (C
ase
2): 2
012-
2038
(2/2
)