
Appendix IV
51
Section 12A Rezoning Application - Request for Amendment to the Draft Ping Shan Outline Zoning Plan No. S/YL-PS/19 from “Village Type Development” Zone and “Comprehensive Development Area” Zone to “Residential (Group B) 2” Zone at Various Lots in D.D 121 and D.D. 122 and Adjoining Government Land, Ping Shan, Yuen Long, New Territories Ref.: ADCL/PLG-10224/R001 Aikon Development Consultancy Ltd. 毅 勤 發 展 顧 問 有 限 公 司 Appendix IV Traffic Impact Assessment
-
Upload
khangminh22 -
Category
Documents
-
view
3 -
download
0
Transcript of Appendix IV

Section 12A Rezoning Application - Request for Amendment to the Draft Ping Shan Outline Zoning Plan No. S/YL-PS/19 from “Village Type Development” Zone and “Comprehensive Development Area” Zone to “Residential (Group B) 2” Zone at Various Lots in D.D 121 and D.D. 122 and Adjoining Government Land, Ping Shan, Yuen Long, New Territories
Ref.: ADCL/PLG-10224/R001
Aikon Development Consultancy Ltd. 毅 勤 發 展 顧 問 有 限 公 司
A p p e n d i x IV Traffic Impact Assessment

Proposed Residential Care Home for the Elderly
and Flat at Various Lots in D.D. 121 and D.D. 122,
Ping Shan, Yuen Long
Traffic Impact Assessment
Final Report
August 2021
Prepared by: CKM Asia Limited
Prepared for: On Billion International Limited
Proposed Residential Care Home for the
Elderly and Flat at Various Lots in D.D. 121
and D.D. 122, Ping Shan, Yuen Long
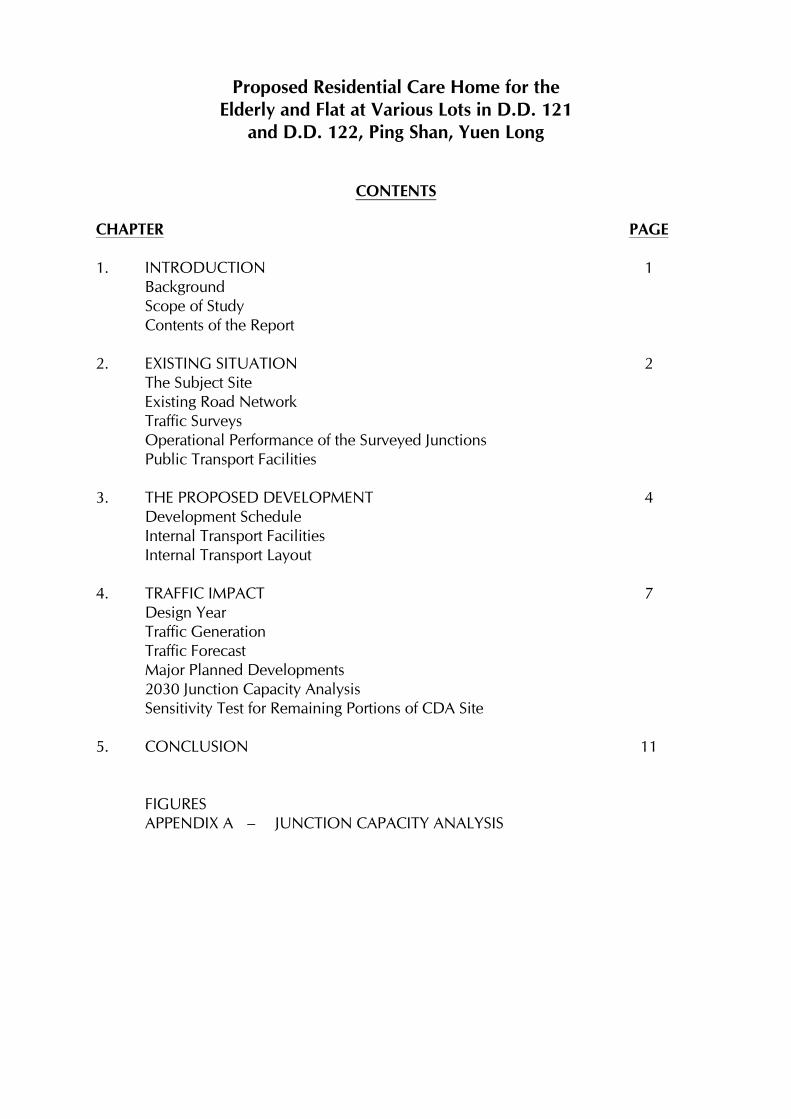
CONTENTS
CHAPTER PAGE
1. INTRODUCTION
Background
Scope of Study
Contents of the Report
1
2. EXISTING SITUATION
The Subject Site
Existing Road Network
Traffic Surveys
Operational Performance of the Surveyed Junctions
Public Transport Facilities
2
3. THE PROPOSED DEVELOPMENT
Development Schedule
Internal Transport Facilities
Internal Transport Layout
4
4. TRAFFIC IMPACT
Design Year
Traffic Generation
Traffic Forecast
Major Planned Developments
2030 Junction Capacity Analysis
Sensitivity Test for Remaining Portions of CDA Site
7
5. CONCLUSION
11
FIGURES
APPENDIX A – JUNCTION CAPACITY ANALYSIS
Proposed Residential Care Home for the
Elderly and Flat at Various Lots in D.D. 121
and D.D. 122, Ping Shan, Yuen Long
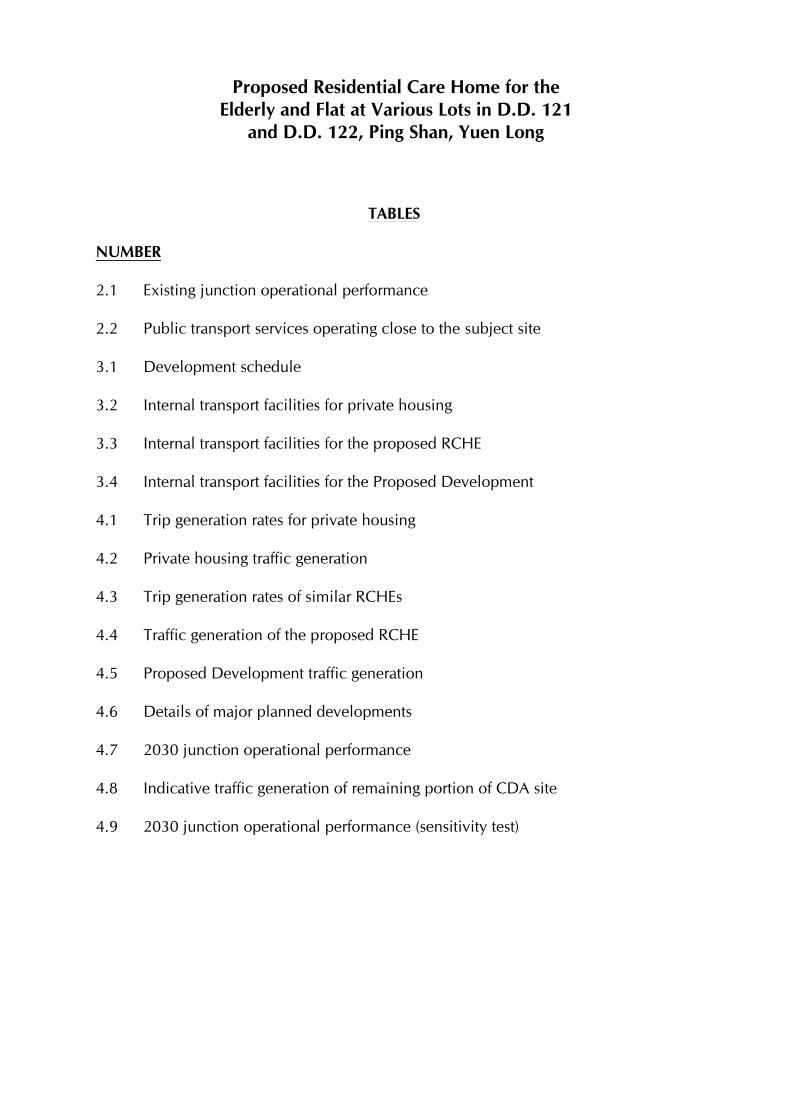
TABLES
NUMBER
2.1 Existing junction operational performance
2.2 Public transport services operating close to the subject site
3.1 Development schedule
3.2 Internal transport facilities for private housing
3.3 Internal transport facilities for the proposed RCHE
3.4 Internal transport facilities for the Proposed Development
4.1 Trip generation rates for private housing
4.2 Private housing traffic generation
4.3 Trip generation rates of similar RCHEs
4.4 Traffic generation of the proposed RCHE
4.5 Proposed Development traffic generation
4.6 Details of major planned developments
4.7 2030 junction operational performance
4.8 Indicative traffic generation of remaining portion of CDA site
4.9 2030 junction operational performance (sensitivity test)

Proposed Residential Care Home for the
Elderly and Flat at Various Lots in D.D. 121
and D.D. 122, Ping Shan, Yuen Long
FIGURES
NUMBER
1.1 Location of the subject site
2.1 Surveyed junctions
2.2 Junction of Castle Peak Road – Ping Shan / Ping Ha Road / Tong Yan San Tsuen
Road (J1)
2.3 Junction of Castle Peak Road – Ping Shan / Site Access Road (J2)
2.4 Junction of Castle Peak Road – Ping Shan / Ping Kwai Road / San Hi Tsuen
Street (J3)
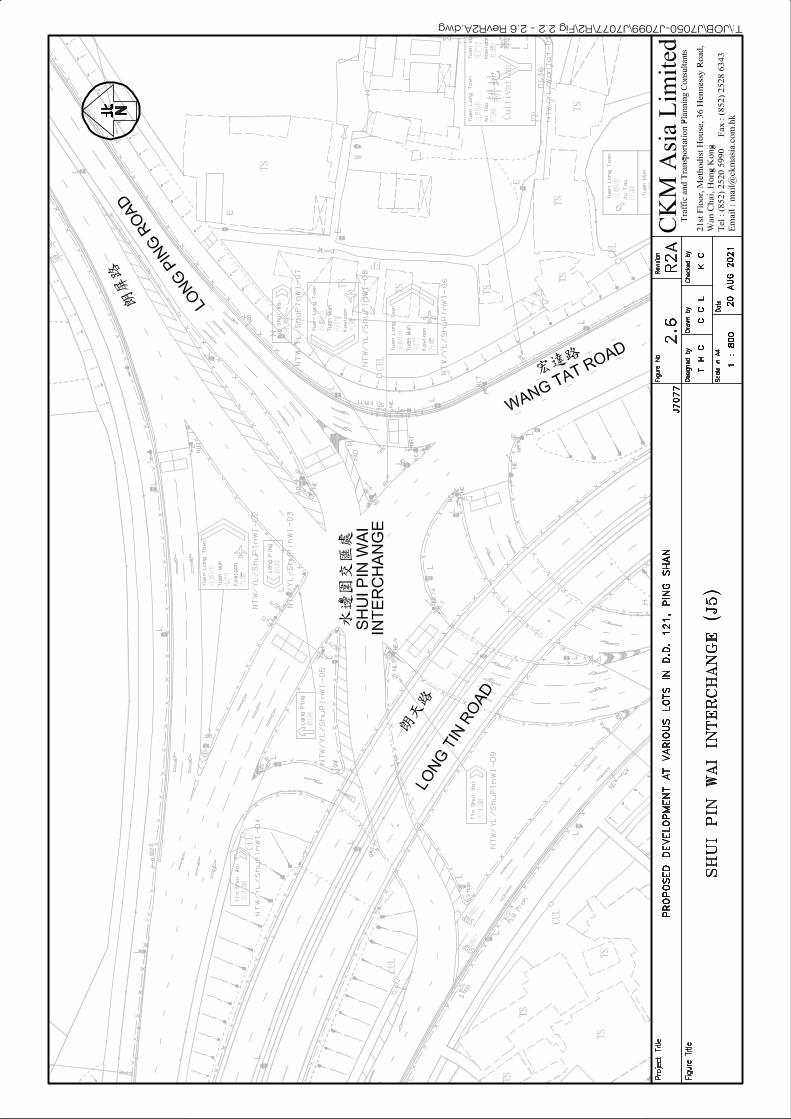
2.5 Junction of Castle Peak Road – Ping Shan / Ma Wang Road / Slip Road to Tong
Yan San Tsuen Interchange (J4)
2.6 Shui Pin Wai Interchange (J5)
2.7 Existing peak hour traffic flows
3.1 Ground Floor Plan
3.2 Basement Floor Plan
4.1 2030 peak hour traffic flows without Proposed Development
4.2 2030 peak hour traffic flows with Proposed Development
4.3 2030 peak hour traffic flows for sensitivity test
Proposed Residential Care Home for the
Elderly and Flat at Various Lots in D.D. 121 Traffic Impact Assessment
and D.D. 122, Ping Shan, Yuen Long Final Report
J7077_TIA_FR_R2, 20 August 2021 Page 1 Prepared by CKM Asia Limited
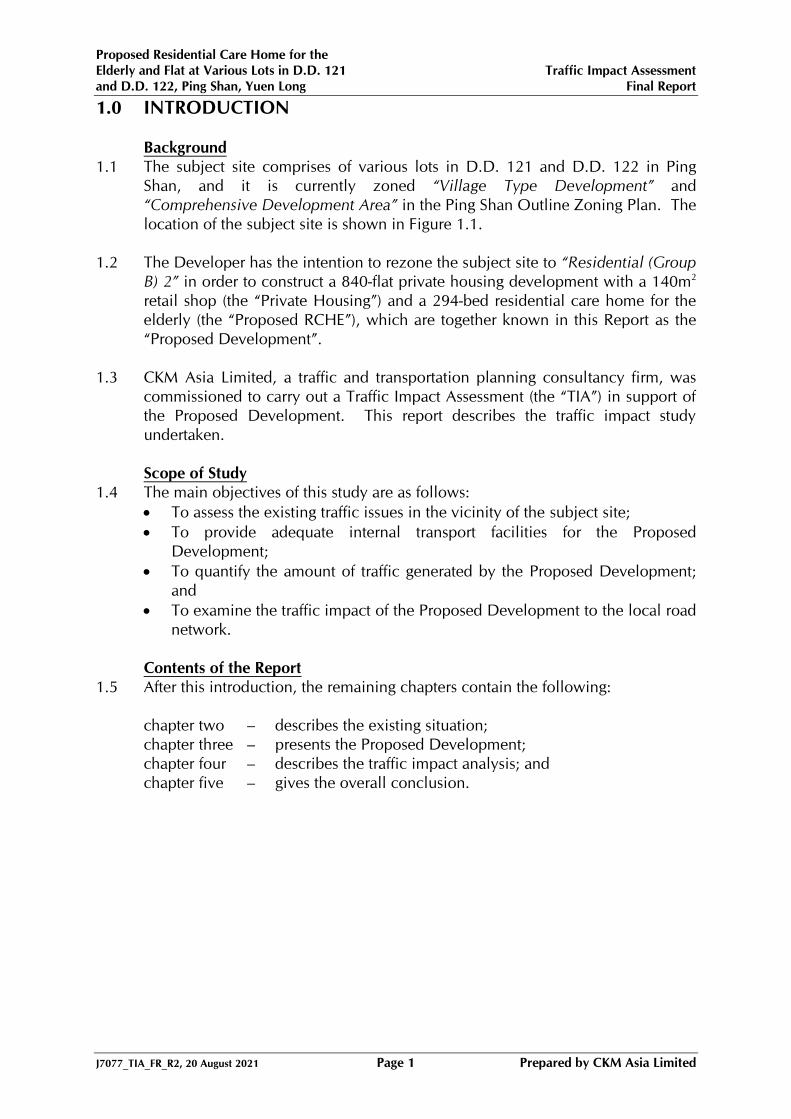
1.0 INTRODUCTION
Background
1.1 The subject site comprises of various lots in D.D. 121 and D.D. 122 in Ping
Shan, and it is currently zoned “Village Type Development” and
“Comprehensive Development Area” in the Ping Shan Outline Zoning Plan. The
location of the subject site is shown in Figure 1.1.
1.2 The Developer has the intention to rezone the subject site to “Residential (Group
B) 2” in order to construct a 840-flat private housing development with a 140m2
retail shop (the “Private Housing”) and a 294-bed residential care home for the
elderly (the “Proposed RCHE”), which are together known in this Report as the
“Proposed Development”.
1.3 CKM Asia Limited, a traffic and transportation planning consultancy firm, was
commissioned to carry out a Traffic Impact Assessment (the “TIA”) in support of
the Proposed Development. This report describes the traffic impact study
undertaken.
Scope of Study
1.4 The main objectives of this study are as follows:
To assess the existing traffic issues in the vicinity of the subject site;
To provide adequate internal transport facilities for the Proposed
Development;
To quantify the amount of traffic generated by the Proposed Development;
and
To examine the traffic impact of the Proposed Development to the local road
network.
Contents of the Report
1.5 After this introduction, the remaining chapters contain the following:
chapter two – describes the existing situation;
chapter three – presents the Proposed Development;
chapter four – describes the traffic impact analysis; and
chapter five – gives the overall conclusion.

Proposed Residential Care Home for the
Elderly and Flat at Various Lots in D.D. 121 Traffic Impact Assessment
and D.D. 122, Ping Shan, Yuen Long Final Report
J7077_TIA_FR_R2, 20 August 2021 Page 2 Prepared by CKM Asia Limited
2.0 EXISTING SITUATION
The Subject Site
2.1 The subject site is bounded by Castle Peak Road – Ping Shan to the south, Ping
Ha Road to the north, a factory building known as Century Centre to the east
and village houses to the west.
Existing Road Network
2.2 The section of Castle Peak Road – Ping Shan near the subject site is a dual
carriageway 2 to 3-lane running in east-west direction. It is classified as rural
trunk road and connects Tuen Mun and Hung Shui Kiu to the west and Yuen
Long to the east.
2.3 Ping Ha Road is a single carriageway 2-lane rural road connecting Castle Peak
Road – Ping Shan and Tin Shui Wai. This road serves the subject site and local
villages and developments nearby.
Traffic Surveys
2.4 Manual classified counts were conducted on a weekday AM and PM peak
periods at junctions which are located in the vicinity of the subject site in order
to establish the peak hour traffic flows. The surveyed junctions included the
following:
J1 – Castle Peak Road – Ping Shan / Ping Ha Road / Tong Yan San Tsuen Road
J2 – Castle Peak Road – Ping Shan / Site Access Road
J3 – Castle Peak Road – Ping Shan / Ping Kwai Road / San Hi Tsuen Street
J4 – Castle Peak Road – Ping Shan / Ma Wang Road / Slip Road to Tong Yan
San Tsuen Interchange
J5 – Shui Pin Wai Interchange
2.5 The traffic counts were classified by vehicle type to enable traffic flows in
passenger car units (pcu) to be calculated. The locations and layouts of the
surveyed junctions are shown in Figure 2.1 and Figures 2.2 – 2.6 respectively.
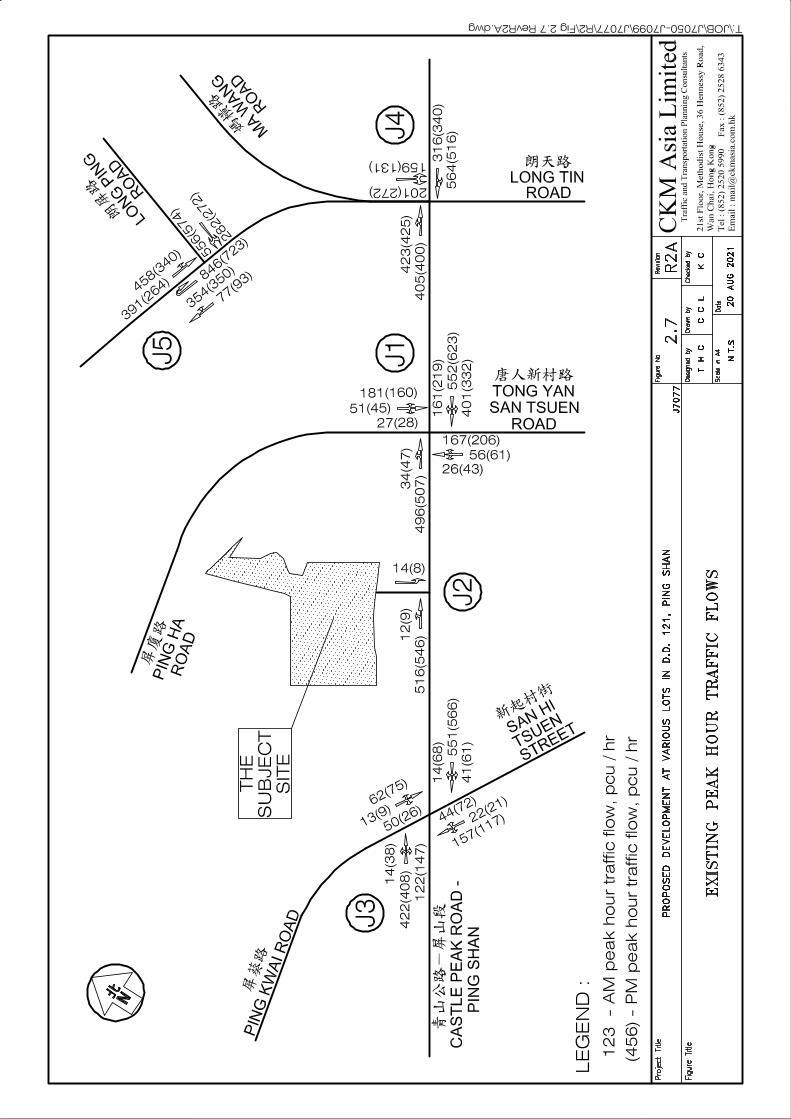
2.6 The AM and PM peak hour traffic flows were found to occur at 0745 – 0845 and
1700 – 1800 hours respectively, and the peak hour traffic flows are illustrated in
Figure 2.7.
Operational Performance of the Surveyed Junctions
2.7 The existing operational performance of the surveyed junctions was calculated
based on the observed traffic counts and the analysis method found in the
Transport Planning and Design Manual (the “TPDM”). The analysis results are
summarised in Table 2.1 and detailed calculations are found in Appendix A.

Proposed Residential Care Home for the
Elderly and Flat at Various Lots in D.D. 121 Traffic Impact Assessment
and D.D. 122, Ping Shan, Yuen Long Final Report
J7077_TIA_FR_R2, 20 August 2021 Page 3 Prepared by CKM Asia Limited
TABLE 2.1 EXISTING JUNCTION OPERATIONAL PERFORMANCE
Ref.
Signal Junction
Reserve Capacity
AM Peak PM Peak
J1 Castle Peak Road – Ping Shan / Ping Ha Road / Tong Yan
San Tsuen Road (1)
>100% >100%
J2 Castle Peak Road – Ping Shan / Site Access Road (1) >100% >100%
J3 Castle Peak Road – Ping Shan / Ping Kwai Road / San Hi
Tsuen Street (1)
>100% >100%
J4 Castle Peak Road – Ping Shan / Ma Wang Road / Slip Road
to Tong Yan San Tsuen Interchange (1)
88% >100%
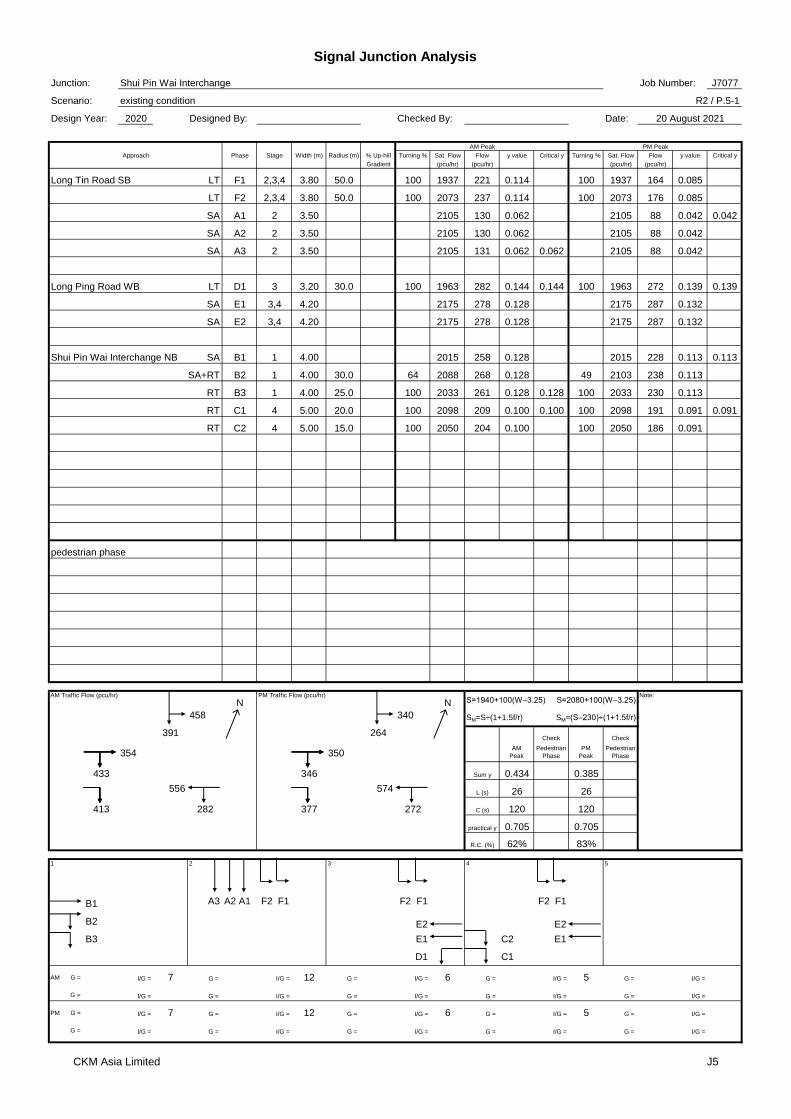
J5 Shui Pin Wai Interchange 62% 83%
Note: (1) actual lost times adopted from site measurements to reflect the effect of Light Rail
2.8 The above results indicate that the analysed junctions currently operate with
capacities during the AM and PM peak hours.
Public Transport Facilities
2.9 Access to road-based and rail-based public transport services from the subject
site is convenient. The Light Rail Ping Shan Station is located within 300m, or
equivalent to around 5 minutes’ walk from the subject site to the east.
2.10 Franchised bus and green minibus routes operate along Castle Peak Road – Ping
Shan and Tong Yan San Tsuen Road, within 500 metres or about 10 minutes
walk away. Details of the road-based public transport services operating close to
the subject site are presented in Table 2.2.
TABLE 2.2 PUBLIC TRANSPORT SERVICES OPERATING CLOSE TO THE
SUBJECT SITE
Route No.
Routing
Frequency
(min)
KMB 53 MTR Tsuen Wan West Station – Yuen Long (East) 25 – 35
KMB 68A Long Ping Estate – MTR Tsing Yi Station 8 – 25
KMB 68X Mong Kok (Park Avenue) – Hung Shui Kiu (Hung Fuk Estate) 9 – 25
KMB 268X Hung Shui Kiu (Hung Fuk Estate) – Jordan (To Wah Road) 7 – 35
KMB 276 Tin Tsz – Sheung Shui 15 – 25
KMB 276P Tin Shui Wai Station – Sheung Shui 15 – 25
KMB 296D Tin Fu – Lek Yuen 5 – 25
NLB B2 MTR Yuen Long Station – Shenzhen Bay Port 10 – 20
MTR K65 Lau Fau Shan – Yuen Long (East) 10 – 16
CTB N969 Causeway Bay (Moreton Terrace) – Tin Shui Wai Town Centre overnight
GMB 31 Yuen Long (Hong Keung Street) – Tong Yan San Tsuen (circular) 7 – 15
GMB 31A Tong Yan San Tsuen – Yuen Long Plaza (circular) AM peak
GMB 32 Yuen Long Station (North) – Tan Kwei Tsuen 10 – 15
GMB 34 Yuen Long (Tai Fung Street) – Lau Fau Shan 20
GMB 622 Hung Shui Kiu (Hung Yuen Road) – Long Ping Station (circular) 15 – 30
Note: KMB – Kowloon Motor Bus NLB – New Lantao Bus
CTB – CityBus MTR – MTR Feeder Bus
GMB – Green Minibus

Proposed Residential Care Home for the
Elderly and Flat at Various Lots in D.D. 121 Traffic Impact Assessment
and D.D. 122, Ping Shan, Yuen Long Final Report
J7077_TIA_FR_R2, 20 August 2021 Page 4 Prepared by CKM Asia Limited
3.0 THE PROPOSED DEVELOPMENT
Development Schedule
3.1 The Proposed Development comprises of the Private Housing which is located at
the southern portion of the subject site, and the Proposed RCHE is at the
northern portion. The development schedule is given in Table 3.1.
TABLE 3.1 DEVELOPMENT SCHEDULE
Use
GFA (Approx.)
Item
Parameters
Private Housing 42,039m2
No
. o
f Fla
t
(in
GFA
)
≤ 40m2 435
40 – 70m2 400
70 – 100m2 0
100 – 130m2 5
130 – 160m2 0
> 160m2 0
Total 840
No. of Housing Block 3
Domestic Plot Ratio 3
Average Flat Size (GFA) 50m2
Retail Shop (GFA) 140m2
Residential Care Home
for the Elderly (RCHE)
5,400m2 No. of Beds for Elderly 294
Internal Transport Facilities
(A) Private Housing
3.2 The internal transport facilities for Private Housing are calculated based on the
Hong Kong Planning Standards and Guidelines (HKPSG) and are presented in
Table 3.2.
TABLE 3.2 INTERNAL TRANSPORT FACILITIES FOR PRIVATE HOUSING
Item
Type
HKPSG Recommendations
Proposed
Provision
Car Parking
Space
Residential Requirement = GPS × R1 × R2 × R3
GPS = 1 space per 4 – 7 flats
R1 = 0.5 for flat size ≤ 40m2 (435 flats)
= 1.2 for flat size 40 – 70m2 (400 flats)
= 4.1 for flat size 100 – 130m2 (5 flats)
R2 = 1 for development outside 500m of rail
station
R3 = 1 for domestic plot ratio 2 – 5
Min = (435 × 0.5 + 400 × 1.2 + 5 × 4.1) ÷ 7 × 1
× 1 = 103 nos.
Max = (435 × 0.5 + 400 × 1.2 + 5 × 4.1) ÷ 4 × 1
× 1 = 180 nos.
180 nos. (1)
Visitor 5 visitor car parking spaces for developments
with more than 75 units per block
No. = 3 × 5 = 15 nos.
15 nos. (1)
Retail 1 space per 150 – 300m2 GFA
Min = 140 ÷ 300 = 1 no.
Max = 140 ÷ 150 = 1 no.
1 no. (1)
Total Min = 103 + 15 + 1 = 119 nos.
Max = 180 + 15 + 1 = 196 nos.
196 nos.
Proposed Residential Care Home for the
Elderly and Flat at Various Lots in D.D. 121 Traffic Impact Assessment
and D.D. 122, Ping Shan, Yuen Long Final Report
J7077_TIA_FR_R2, 20 August 2021 Page 5 Prepared by CKM Asia Limited
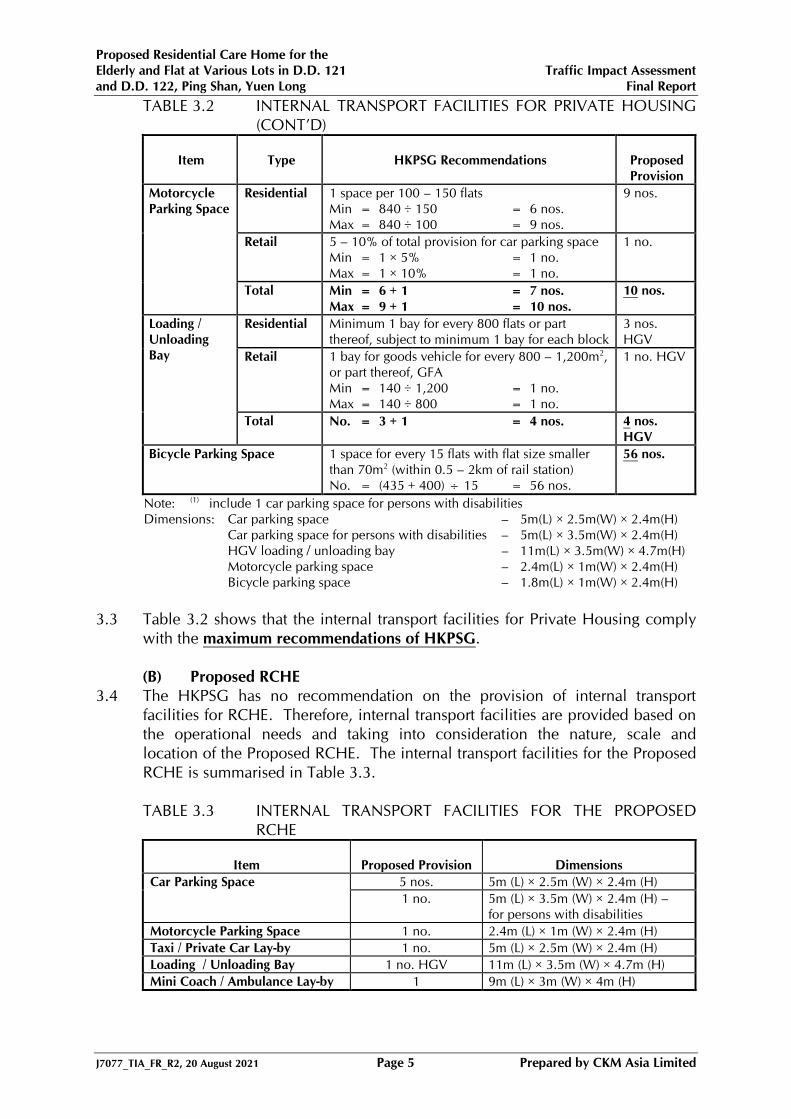
TABLE 3.2 INTERNAL TRANSPORT FACILITIES FOR PRIVATE HOUSING
(CONT’D)
Item
Type
HKPSG Recommendations
Proposed
Provision
Motorcycle
Parking Space
Residential 1 space per 100 – 150 flats
Min = 840 ÷ 150 = 6 nos.
Max = 840 ÷ 100 = 9 nos.
9 nos.
Retail 5 – 10% of total provision for car parking space
Min = 1 × 5% = 1 no.
Max = 1 × 10% = 1 no.
1 no.
Total Min = 6 + 1 = 7 nos.
Max = 9 + 1 = 10 nos.
10 nos.
Loading /
Unloading
Bay
Residential Minimum 1 bay for every 800 flats or part
thereof, subject to minimum 1 bay for each block
3 nos.
HGV
Retail 1 bay for goods vehicle for every 800 – 1,200m2,
or part thereof, GFA
Min = 140 ÷ 1,200 = 1 no.
Max = 140 ÷ 800 = 1 no.
1 no. HGV
Total No. = 3 + 1 = 4 nos. 4 nos.
HGV
Bicycle Parking Space 1 space for every 15 flats with flat size smaller
than 70m2 (within 0.5 – 2km of rail station)
No. = (435 + 400) ÷ 15 = 56 nos.
56 nos.
Note: (1) include 1 car parking space for persons with disabilities
Dimensions: Car parking space – 5m(L) × 2.5m(W) × 2.4m(H)
Car parking space for persons with disabilities – 5m(L) × 3.5m(W) × 2.4m(H) HGV loading / unloading bay – 11m(L) × 3.5m(W) × 4.7m(H) Motorcycle parking space – 2.4m(L) × 1m(W) × 2.4m(H) Bicycle parking space – 1.8m(L) × 1m(W) × 2.4m(H)
3.3 Table 3.2 shows that the internal transport facilities for Private Housing comply
with the maximum recommendations of HKPSG.
(B) Proposed RCHE
3.4 The HKPSG has no recommendation on the provision of internal transport
facilities for RCHE. Therefore, internal transport facilities are provided based on
the operational needs and taking into consideration the nature, scale and
location of the Proposed RCHE. The internal transport facilities for the Proposed
RCHE is summarised in Table 3.3.
TABLE 3.3 INTERNAL TRANSPORT FACILITIES FOR THE PROPOSED
RCHE
Item
Proposed Provision
Dimensions
Car Parking Space 5 nos. 5m (L) × 2.5m (W) × 2.4m (H)
1 no. 5m (L) × 3.5m (W) × 2.4m (H) –
for persons with disabilities
Motorcycle Parking Space 1 no. 2.4m (L) × 1m (W) × 2.4m (H)
Taxi / Private Car Lay-by 1 no. 5m (L) × 2.5m (W) × 2.4m (H)
Loading / Unloading Bay 1 no. HGV 11m (L) × 3.5m (W) × 4.7m (H)
Mini Coach / Ambulance Lay-by 1 9m (L) × 3m (W) × 4m (H)

Proposed Residential Care Home for the
Elderly and Flat at Various Lots in D.D. 121 Traffic Impact Assessment
and D.D. 122, Ping Shan, Yuen Long Final Report
J7077_TIA_FR_R2, 20 August 2021 Page 6 Prepared by CKM Asia Limited
(C) Overall Provision
3.5 The overall provision of internal transport facilities for the Proposed
Development is summarised in Table 3.4.
TABLE 3.4 INTERNAL TRANSPORT FACILITIES FOR THE PROPOSED
DEVELOPMENT
Item
Proposed Development
Private Housing RCHE Overall
Residential Retail
Car Parking Space 195, including:
180 (for residents) (1)
15 (for visitors) (1)
1 (1) 5 (1) 201
Motorcycle Parking Space 9 1 1 11
Taxi / Private Car Lay-by – – 1 1
HGV Loading / Unloading Bay 3 1 1 5
Mini Coach / Ambulance Lay-by – – 1 1
Bicycle Parking Space 56 – – 56
RCV Loading / Unloading Bay 1 1
Note: (1) include 1 car parking space for persons with disabilities
Internal Transport Layout
3.6 The ground and basement floor plans showing the internal transport facilities are
presented in Figures 3.1 and 3.2.
3.7 The existing site access road leading from Castle Peak Road – Ping Shan will be
maintained as the run-in / out for the Private Housing. To facilitate the operation
of the Proposed RCHE, the run-in / out is proposed at Ping Ha Road.

Proposed Residential Care Home for the
Elderly and Flat at Various Lots in D.D. 121 Traffic Impact Assessment
and D.D. 122, Ping Shan, Yuen Long Final Report
J7077_TIA_FR_R2, 20 August 2021 Page 7 Prepared by CKM Asia Limited
4.0 TRAFFIC IMPACT
Design Year
4.1 The Proposed Development is expected to be completed in 2027. Thus, the
design year adopted for the capacity analysis is 2030, i.e. “3 years after the
planned completion of the development”.
Traffic Generation
(A) Private Housing
4.2 To estimate traffic generation of the Private Housing, trip generation rates for
residential and retail found in Volume 1 of the TPDM are adopted. Since the
average size of the residential flats is around 50m2, trip generation rates for
private housing with average flat size of 60m2, which is the smallest in the
TPDM, is adopted. The adopted trip generation rates are presented in Table 4.1.
TABLE 4.1 TRIP GENERATION RATES FOR PRIVATE HOUSING
Use
Unit
Trip Generation Rates (from TPDM)
AM Peak PM Peak
IN OUT IN OUT
Residential pcu/hour/flat 0.0425 0.0718 0.0370 0.0286
Retail Shop pcu/hour/100m2 0.2434 0.2296 0.3563 0.3100
4.3 The trip generation rates presented in Table 4.1 are used to calculate the traffic
generated associated with the Private Housing, and the calculated traffic
generation is presented in Table 4.2.
TABLE 4.2 PRIVATE HOUSING TRAFFIC GENERATION
Use
Quantity
Traffic Generation (pcu/hour)
AM Peak PM Peak
IN OUT IN OUT
Residential 840 flats 36 61 32 25
Retail Shop 140m2 GFA 1 1 1 1
Total
37 62 33 26
(B) Proposed RCHE
4.4 In view that TPDM does not provide trip generation rates for RCHE, traffic
generation associated with the Proposed RCHE is estimated based on traffic
generation surveys conducted at similar RCHEs located in Tuen Mun. The
survey results and the adopted trip generation rates for the Proposed RCHE are
presented in Table 4.3.

Proposed Residential Care Home for the
Elderly and Flat at Various Lots in D.D. 121 Traffic Impact Assessment
and D.D. 122, Ping Shan, Yuen Long Final Report
J7077_TIA_FR_R2, 20 August 2021 Page 8 Prepared by CKM Asia Limited
TABLE 4.3 TRIP GENERATION RATES OF SIMILAR RCHEs
RCHE
No. of
Beds
Traffic Generation
(pcu/hour)
Trip Generation Rate
(pcu/hour/bed)
AM Peak PM Peak AM Peak PM Peak
IN OUT IN OUT IN OUT IN OUT
Pok Oi Hospital Tuen
Mun Nursing Home (1)
216 4 8 4 2 0.0185 0.0370 0.0185 0.0093
Caritas Li Ka Shing Care
and Attention Home (2)
260 10 9 6 4 0.0385 0.0346 0.0231 0.0154
Adopted Trip Generation Rate (maximum)
0.0385 0.0370 0.0231 0.0154
Note: (1) located at 2 Siu Lun Street in Tuen Mun (2) located at 16 Wah Fat Street in Tuen Mun
4.5 The adopted trip generation rates presented in Table 4.3 are used to calculate the
traffic generated associated with the Proposed RCHE, and the calculated traffic
generation is presented in Table 4.4.
TABLE 4.4 TRAFFIC GENERATION OF THE PROPOSED RCHE
Proposed RCHE (with 294 beds)
Unit
AM Peak
PM Peak
IN OUT IN OUT
Trip Generation Rate (from Table 4.2) pcu/hour/bed 0.0385 0.0370 0.0231 0.0154
Traffic Generation pcu/hour 12 11 7 5
(C) Overall Traffic Generation
4.6 The results presented in Tables 4.2 and 4.4 are used to calculate the overall
traffic generated associated with the Proposed Development, and the calculated
traffic generation is presented in Table 4.5.
TABLE 4.5 PROPOSED DEVELOPMENT TRAFFIC GENERATION
Type of Use
Quantity
Traffic Generation (pcu/hour)
AM Peak PM Peak
IN OUT IN OUT
Private Housing 840 flats 36 61 32 25
140m2 Retail GFA 1 1 1 1
Proposed RCHE 294 beds 12 11 7 5
Total
49 73 40 31
Traffic Forecast
4.7 The 2030 design traffic flows for capacity analysis are derived with reference to
(i) the NTW1 BDTM updated with planned developments and road network
located in the vicinity; and (ii) expected traffic generation associated with the
Proposed Development.
Major Planned Developments
4.8 The major planned developments in the vicinity of the Proposed Development
are summarised in Table 4.6.

Proposed Residential Care Home for the
Elderly and Flat at Various Lots in D.D. 121 Traffic Impact Assessment
and D.D. 122, Ping Shan, Yuen Long Final Report
J7077_TIA_FR_R2, 20 August 2021 Page 9 Prepared by CKM Asia Limited
TABLE 4.6 DETAILS OF MAJOR PLANNED DEVELOPMENTS
Ref.
Location
Use
Development Parameters
(Approx.)
A Hung Shui Kiu / Ha Tsuen New
Development Area
New Town with around 61,000 flats and over
600 hectares floor area for
commercial and industrial uses
B Yuen Long South Development Extension of
Yuen Long
New Town
with around 28,500 flats and around
57 hectares floor area for commercial
and industrial uses
C Public Housing Development at
Tan Kwai Tsuen
Public
Housing
around 7,400 flats, commercial GFA
of around 6,600m2 and community
facilities
D Public Housing Development at
Long Bin
Public
Housing
around 11,940 flats, commercial GFA
of around 10,380m2 and community
facilities
4.9 The major planned developments listed in Table 4.6 have been included in the
traffic forecast.
2030 Junction Capacity Analysis
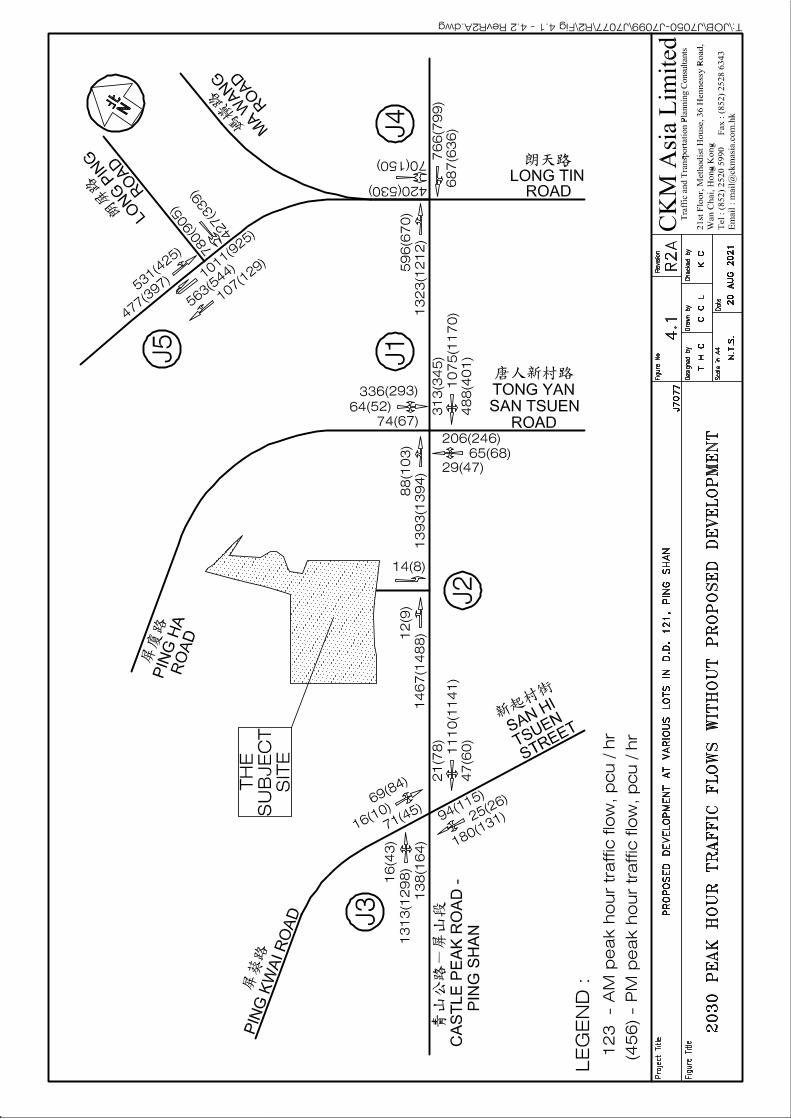
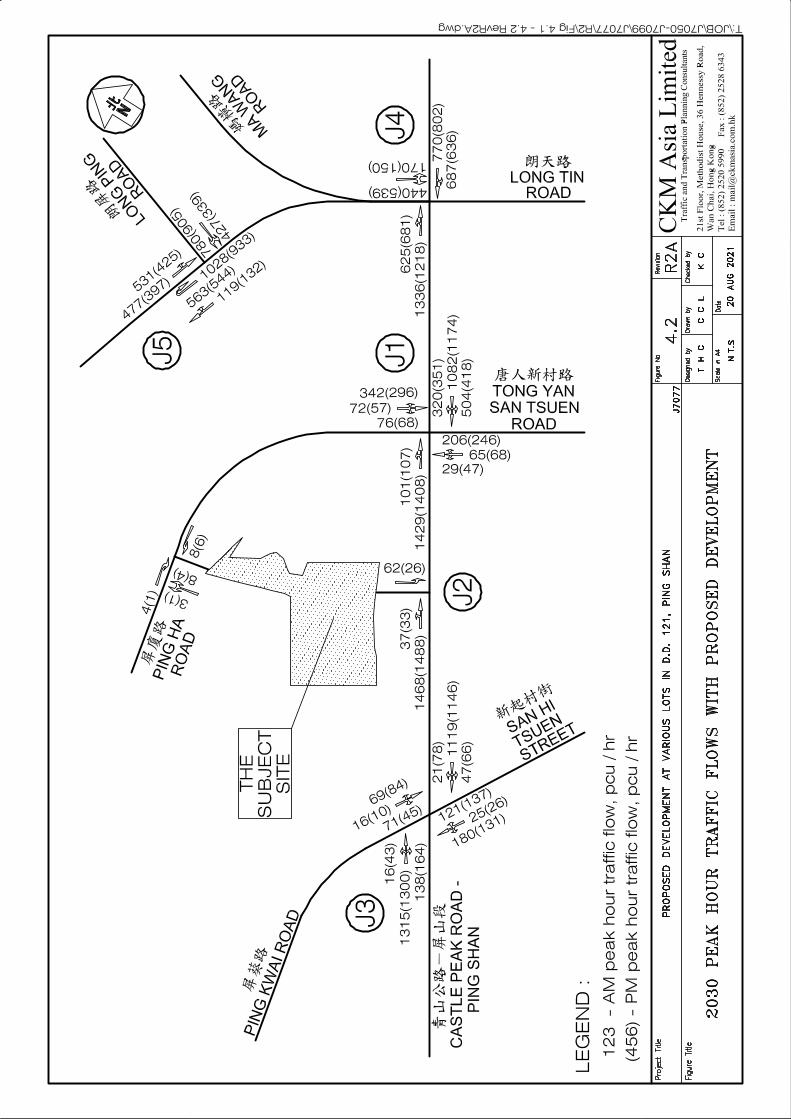
4.10 The 2030 peak hour traffic flows without and with the Proposed Development
are shown in Figures 4.1 and 4.2 respectively.
4.11 The 2030 junction capacity analysis for the cases without and with the Proposed
Development are summarised in Table 4.7, and detailed calculations are found
in Appendix A.
TABLE 4.7 2030 JUNCTION OPERATIONAL PERFORMANCE
Ref.
Signal Junction
Reserve Capacity
Without Proposed
Development
With Proposed
Development
AM Peak PM Peak AM Peak PM Peak
J1 Castle Peak Road – Ping Shan / Ping Ha
Road / Tong Yan San Tsuen Road (1)
29% 25% 27% 24%
J2 Castle Peak Road – Ping Shan / Site
Access Road (1)
>100% >100% >100% >100%
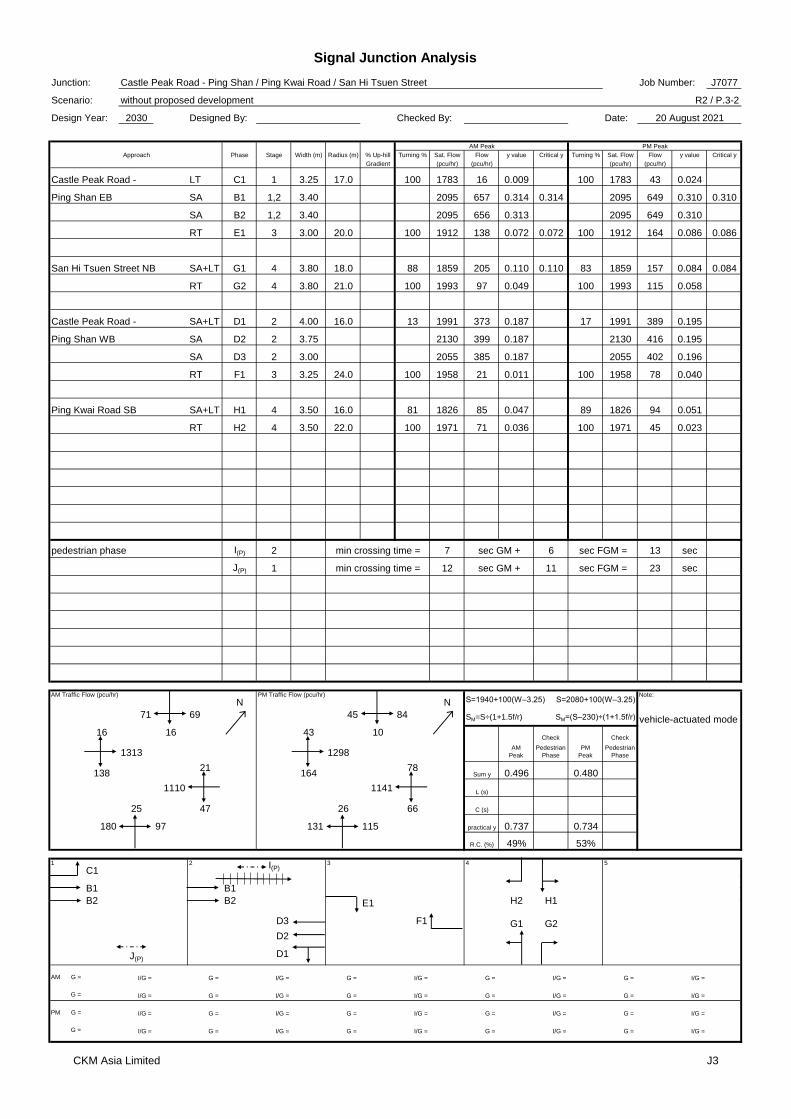
J3 Castle Peak Road – Ping Shan / Ping
Kwai Road / San Hi Tsuen Street (1)
49% 53% 48% 53%
J4 Castle Peak Road – Ping Shan / Ma
Wang Road / Slip Road to Tong Yan San
Tsuen Interchange (1)
57% 54% 55% 53%
J5 Shui Pin Wai Interchange 19% 37% 19% 37%
Note: (1) actual lost times adopted from site measurements to reflect the effect of Light Rail
4.12 The above results indicate that the analysed junctions are expected to operate
with capacities during the peak hours in 2030. The junctions analysed have
sufficient capacity to accommodate the (i) expected traffic growth; and (ii) traffic
generated by the Proposed Development.
4.13 The traffic generated by the Proposed Development is expected to have minimal
impact to the capacity of the analysed junctions. It can be concluded that the
Proposed Development is acceptable from traffic engineering terms.

Proposed Residential Care Home for the
Elderly and Flat at Various Lots in D.D. 121 Traffic Impact Assessment
and D.D. 122, Ping Shan, Yuen Long Final Report
J7077_TIA_FR_R2, 20 August 2021 Page 10 Prepared by CKM Asia Limited
Sensitivity Test for Remaining Portions of the CDA Site
4.14 The subject site falls within the CDA site located at the southeast of Tong Fong
Tsuen and west of Ping Ha Road, and the remaining portions (“remaining
portions“) of this CDA site include (i) Lot No. 1694 RP & Exts Thereto in D.D.
122; and (ii) Lot No. 1702 RP in D.D. 122.
4.15 To ascertain the traffic impact associated to the whole CDA site, a sensitivity test
is conducted for the whole CDA, and assuming that the remaining portions are
redeveloped as residential use with plot ratio 3 and similar average flat size as
the Proposed Development. The indicative development parameters and traffic
generation for the remaining portions are presented in Table 4.8.
TABLE 4.8 INDICATIVE TRAFFIC GENERATION OF REMAINING
PORTION OF CDA SITE
D.D. 122
No. of Flat (1)
Traffic Generation (pcu/hour) (2)
AM Peak PM Peak
IN OUT IN OUT
Lot No. 1694 RP & Exts Thereto 263 12 19 10 8
Lot No. 1702 RP 198 9 15 8 6
Total
461 21 34 18 14
Note: (1) assuming plot ratio of 3 and average flat size of 50m2
(2) calculated based on trip generation rates in Table 4.1
4.16 The 2030 peak hour traffic flows for the sensitivity test are shown in Figure 4.3,
and the corresponding junction capacity analysis is summarised in Table 4.9.
Detailed calculations are found in Appendix A.
TABLE 4.9 2030 JUNCTION OPERATIONAL PERFORMANCE
(SENSITIVITY TEST)
Ref.
Signal Junction
Reserve Capacity
With Proposed
Development (2)
Sensitivity Test –
Redevelopment of
Whole CDA Site
AM Peak PM Peak AM Peak PM Peak
J1 Castle Peak Road – Ping Shan / Ping Ha
Road / Tong Yan San Tsuen Road (1)
27% 24% 25% 22%
J2 Castle Peak Road – Ping Shan / Site
Access Road (1)
>100% >100% >100% >100%
J3 Castle Peak Road – Ping Shan / Ping
Kwai Road / San Hi Tsuen Street (1)
48% 53% 48% 53%
J4 Castle Peak Road – Ping Shan / Ma
Wang Road / Slip Road to Tong Yan San
Tsuen Interchange (1)
55% 53% 55% 52%
J5 Shui Pin Wai Interchange 19% 37% 18% 37%
Note: (1) actual lost times adopted from site measurements to reflect the effect of Light Rail (2) from Table 4.7
4.17 The sensitivity test indicates that the analysed junctions are expected to operate
with capacities during the peak hours in 2030. It can be concluded that the
redevelopment of whole CDA site will result in no adverse traffic impact to the
surrounding road network.

Proposed Residential Care Home for the
Elderly and Flat at Various Lots in D.D. 121 Traffic Impact Assessment
and D.D. 122, Ping Shan, Yuen Long Final Report
J7077_TIA_FR_R2, 20 August 2021 Page 11 Prepared by CKM Asia Limited
5.0 CONCLUSION
5.1 The subject site comprises of various lots in D.D. 121 and D.D. 122 in Ping
Shan. The Applicant has the intention to construct within the subject site (i) a
private housing comprising of 840 flats with average flat size of around 50m2
and retail shop with 140m2 GFA; and (ii) a RCHE with 294 beds.
5.2 The internal transport facilities provided for the Private Housing comply with the
maximum recommendations of HKPSG while the internal transport facilities for
the Proposed RCHE are provided to meet the operational needs.
5.3 Manual classified counts were conducted at key junctions during the AM and
PM peak hours. The 2030 design traffic flows are derived with reference to the
BDTM and updated with the planned developments in the vicinity.
5.4 The 2030 junction capacity analysis was undertaken for the cases with and
without the Proposed Development. The junctions analysed have sufficient
capacity to accommodate the expected traffic volume in 2030 and the additional
traffic generated by the Proposed Development and remaining portions of the
CDA site.
5.5 The TIA concluded that the Proposed Development will result in no adverse
traffic impact to the surrounding road network. From traffic engineering
grounds, the Proposed Development is acceptable.

Figures


Appendix A – Junction Capacity Analysis

Signal Junction Analysis
Junction: Castle Peak Road - Ping Shan / Ping Ha Road / Tong Yan San Tsuen Road Job Number: J7077
Scenario: existing condition R2 / P.1-1
Design Year: 2020 Designed By: Checked By: Date: 20 August 2021
AM Peak PM Peak
Approach Phase Stage Width (m) Radius (m) % Up-hill Turning % Sat. Flow Flow y value Critical y Turning % Sat. Flow Flow y value Critical y
Gradient (pcu/hr) (pcu/hr) (pcu/hr) (pcu/hr)
Castle Peak Road - LT E1 8 3.50 12.0 100 1747 34 0.019 100 1747 47 0.027
Ping Shan EB SA D1 4,8 3.50 2105 165 0.078 2105 169 0.080
SA D2 4,8 3.50 2105 165 0.078 2105 169 0.080
SA D3 4,8 3.50 2105 165 0.078 2105 169 0.080
Tong Yan San Tsuen LT K1 7 5.00 15.0 100 1923 26 0.014 100 1923 43 0.022
Road NB SA+RT K2 7 3.60 16.0 51 2018 115 0.057 56 2018 138 0.068
RT K3 7 3.60 13.0 100 1896 108 0.057 0.057 100 1896 129 0.068 0.068
Castle Peak Road - SA+LT F1 4,5,8 3.50 15.0 91 1801 439 0.244 75 1828 444 0.243 0.243
Ping Shan WB SA F2 4,5,8 3.50 2105 514 0.244 0.244 2105 511 0.243
RT G1 5 3.00 20.0 100 1912 161 0.084 100 1912 219 0.115
Ping Ha Road SB LT H 5 4.00 10.0 100 1752 123 0.070 100 1752 120 0.068
LT+SA+RT H+I 6 4.00 10.0 63 1881 136 0.072 0.072 60 1883 113 0.060 0.060
pedestrian phase J(P) 4 7 8 15 sec
AM Traffic Flow (pcu/hr)
NPM Traffic Flow (pcu/hr)
N S=1940+100(W–3.25) S=2080+100(W–3.25)Note:
27 181 28 160 SM=S÷(1+1.5f/r) SM=(S–230)÷(1+1.5f/r) vehicle-actuated mode
34 51 47 45Check Check
496 507AM
Peak
Pedestrian
Phase
PM
Peak
Pedestrian
Phase
161 219Sum y 0.373 0.371
552 623 L (s)
56 401 61 332 C (s)
26 167 43 206 practical y 0.772 0.782
R.C. (%) >100% >100%
4 J(P)5 6 7 8
E1
D1 D1
D2 H+I D2
D3F2 F2 K1 K2 K3
D3F2
F1 F1 F1
AM G = I/G = G = I/G = G = I/G = G = I/G = G = I/G =
G = I/G = G = I/G = G = I/G = G = I/G = G = I/G =
PM G = I/G = G = I/G = G = I/G = G = I/G = G = I/G =
G = I/G = G = I/G = G = I/G = G = I/G = G = I/G =
min crossing time = sec GM + sec FGM =
G1
CKM Asia Limited J1
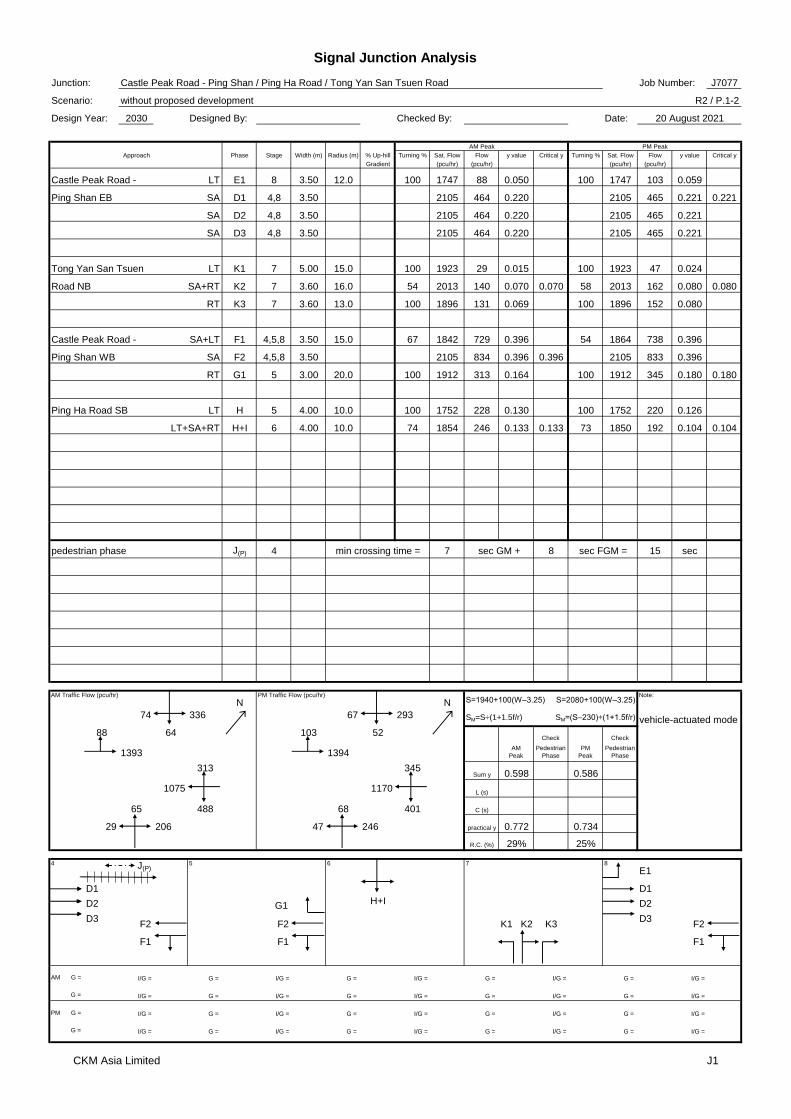
Signal Junction Analysis
Junction: Castle Peak Road - Ping Shan / Ping Ha Road / Tong Yan San Tsuen Road Job Number: J7077
Scenario: without proposed development R2 / P.1-2
Design Year: 2030 Designed By: Checked By: Date: 20 August 2021
AM Peak PM Peak
Approach Phase Stage Width (m) Radius (m) % Up-hill Turning % Sat. Flow Flow y value Critical y Turning % Sat. Flow Flow y value Critical y
Gradient (pcu/hr) (pcu/hr) (pcu/hr) (pcu/hr)
Castle Peak Road - LT E1 8 3.50 12.0 100 1747 88 0.050 100 1747 103 0.059
Ping Shan EB SA D1 4,8 3.50 2105 464 0.220 2105 465 0.221 0.221
SA D2 4,8 3.50 2105 464 0.220 2105 465 0.221
SA D3 4,8 3.50 2105 464 0.220 2105 465 0.221
Tong Yan San Tsuen LT K1 7 5.00 15.0 100 1923 29 0.015 100 1923 47 0.024
Road NB SA+RT K2 7 3.60 16.0 54 2013 140 0.070 0.070 58 2013 162 0.080 0.080
RT K3 7 3.60 13.0 100 1896 131 0.069 100 1896 152 0.080
Castle Peak Road - SA+LT F1 4,5,8 3.50 15.0 67 1842 729 0.396 54 1864 738 0.396
Ping Shan WB SA F2 4,5,8 3.50 2105 834 0.396 0.396 2105 833 0.396
RT G1 5 3.00 20.0 100 1912 313 0.164 100 1912 345 0.180 0.180
Ping Ha Road SB LT H 5 4.00 10.0 100 1752 228 0.130 100 1752 220 0.126
LT+SA+RT H+I 6 4.00 10.0 74 1854 246 0.133 0.133 73 1850 192 0.104 0.104
pedestrian phase J(P) 4 7 8 15 sec
AM Traffic Flow (pcu/hr)
NPM Traffic Flow (pcu/hr)
N S=1940+100(W–3.25) S=2080+100(W–3.25)Note:
74 336 67 293 SM=S÷(1+1.5f/r) SM=(S–230)÷(1+1.5f/r) vehicle-actuated mode
88 64 103 52Check Check
1393 1394AM
Peak
Pedestrian
Phase
PM
Peak
Pedestrian
Phase
313 345Sum y 0.598 0.586
1075 1170 L (s)
65 488 68 401 C (s)
29 206 47 246 practical y 0.772 0.734
R.C. (%) 29% 25%
4 J(P)5 6 7 8
E1
D1 D1
D2 H+I D2
D3F2 F2 K1 K2 K3
D3F2
F1 F1 F1
AM G = I/G = G = I/G = G = I/G = G = I/G = G = I/G =
G = I/G = G = I/G = G = I/G = G = I/G = G = I/G =
PM G = I/G = G = I/G = G = I/G = G = I/G = G = I/G =
G = I/G = G = I/G = G = I/G = G = I/G = G = I/G =
min crossing time = sec GM + sec FGM =
G1
CKM Asia Limited J1

Signal Junction Analysis
Junction: Castle Peak Road - Ping Shan / Ping Ha Road / Tong Yan San Tsuen Road Job Number: J7077
Scenario: with proposed development R2 / P.1-3
Design Year: 2030 Designed By: Checked By: Date: 20 August 2021
AM Peak PM Peak
Approach Phase Stage Width (m) Radius (m) % Up-hill Turning % Sat. Flow Flow y value Critical y Turning % Sat. Flow Flow y value Critical y
Gradient (pcu/hr) (pcu/hr) (pcu/hr) (pcu/hr)
Castle Peak Road - LT E1 8 3.50 12.0 100 1747 101 0.058 100 1747 107 0.061
Ping Shan EB SA D1 4,8 3.50 2105 476 0.226 2105 469 0.223 0.223
SA D2 4,8 3.50 2105 476 0.226 2105 469 0.223
SA D3 4,8 3.50 2105 476 0.226 2105 469 0.223
Tong Yan San Tsuen LT K1 7 5.00 15.0 100 1923 29 0.015 100 1923 47 0.024
Road NB SA+RT K2 7 3.60 16.0 54 2013 140 0.070 0.070 58 2013 162 0.080 0.080
RT K3 7 3.60 13.0 100 1896 131 0.069 100 1896 152 0.080
Castle Peak Road - SA+LT F1 4,5,8 3.50 15.0 68 1840 740 0.402 56 1861 747 0.401
Ping Shan WB SA F2 4,5,8 3.50 2105 846 0.402 0.402 2105 845 0.401
RT G1 5 3.00 20.0 100 1912 320 0.167 100 1912 351 0.184 0.184
Ping Ha Road SB LT H 5 4.00 10.0 100 1752 233 0.133 100 1752 222 0.127
LT+SA+RT H+I 6 4.00 10.0 72 1859 257 0.138 0.138 71 1855 199 0.107 0.107
pedestrian phase J(P) 4 7 8 15 sec
AM Traffic Flow (pcu/hr)
NPM Traffic Flow (pcu/hr)
N S=1940+100(W–3.25) S=2080+100(W–3.25)Note:
76 342 68 296 SM=S÷(1+1.5f/r) SM=(S–230)÷(1+1.5f/r) vehicle-actuated mode
101 72 107 57Check Check
1429 1408AM
Peak
Pedestrian
Phase
PM
Peak
Pedestrian
Phase
320 351Sum y 0.610 0.594
1082 1174 L (s)
65 504 68 418 C (s)
29 206 47 246 practical y 0.772 0.734
R.C. (%) 27% 24%
4 J(P)5 6 7 8
E1
D1 D1
D2 H+I D2
D3F2 F2 K1 K2 K3
D3F2
F1 F1 F1
AM G = I/G = G = I/G = G = I/G = G = I/G = G = I/G =
G = I/G = G = I/G = G = I/G = G = I/G = G = I/G =
PM G = I/G = G = I/G = G = I/G = G = I/G = G = I/G =
G = I/G = G = I/G = G = I/G = G = I/G = G = I/G =
min crossing time = sec GM + sec FGM =
G1
CKM Asia Limited J1
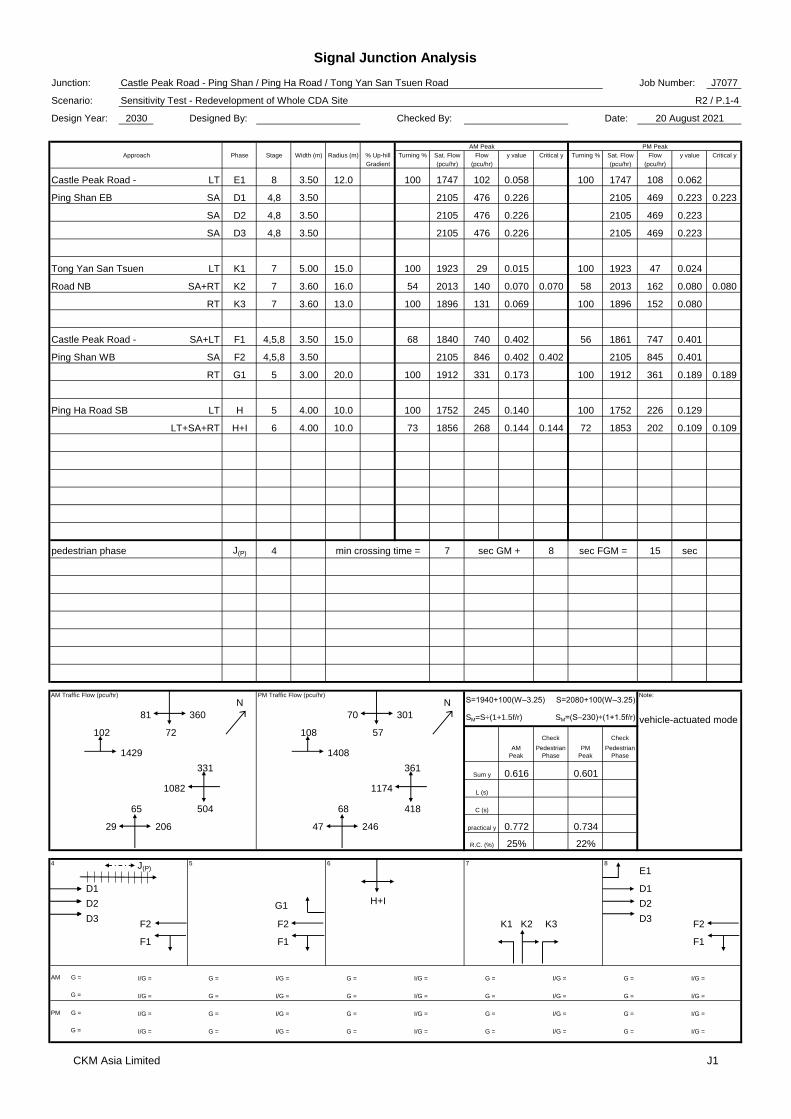
Signal Junction Analysis
Junction: Castle Peak Road - Ping Shan / Ping Ha Road / Tong Yan San Tsuen Road Job Number: J7077
Scenario: Sensitivity Test - Redevelopment of Whole CDA Site R2 / P.1-4
Design Year: 2030 Designed By: Checked By: Date: 20 August 2021
AM Peak PM Peak
Approach Phase Stage Width (m) Radius (m) % Up-hill Turning % Sat. Flow Flow y value Critical y Turning % Sat. Flow Flow y value Critical y
Gradient (pcu/hr) (pcu/hr) (pcu/hr) (pcu/hr)
Castle Peak Road - LT E1 8 3.50 12.0 100 1747 102 0.058 100 1747 108 0.062
Ping Shan EB SA D1 4,8 3.50 2105 476 0.226 2105 469 0.223 0.223
SA D2 4,8 3.50 2105 476 0.226 2105 469 0.223
SA D3 4,8 3.50 2105 476 0.226 2105 469 0.223
Tong Yan San Tsuen LT K1 7 5.00 15.0 100 1923 29 0.015 100 1923 47 0.024
Road NB SA+RT K2 7 3.60 16.0 54 2013 140 0.070 0.070 58 2013 162 0.080 0.080
RT K3 7 3.60 13.0 100 1896 131 0.069 100 1896 152 0.080
Castle Peak Road - SA+LT F1 4,5,8 3.50 15.0 68 1840 740 0.402 56 1861 747 0.401
Ping Shan WB SA F2 4,5,8 3.50 2105 846 0.402 0.402 2105 845 0.401
RT G1 5 3.00 20.0 100 1912 331 0.173 100 1912 361 0.189 0.189
Ping Ha Road SB LT H 5 4.00 10.0 100 1752 245 0.140 100 1752 226 0.129
LT+SA+RT H+I 6 4.00 10.0 73 1856 268 0.144 0.144 72 1853 202 0.109 0.109
pedestrian phase J(P) 4 7 8 15 sec
AM Traffic Flow (pcu/hr)
NPM Traffic Flow (pcu/hr)
N S=1940+100(W–3.25) S=2080+100(W–3.25)Note:
81 360 70 301 SM=S÷(1+1.5f/r) SM=(S–230)÷(1+1.5f/r) vehicle-actuated mode
102 72 108 57Check Check
1429 1408AM
Peak
Pedestrian
Phase
PM
Peak
Pedestrian
Phase
331 361Sum y 0.616 0.601
1082 1174 L (s)
65 504 68 418 C (s)
29 206 47 246 practical y 0.772 0.734
R.C. (%) 25% 22%
4 J(P)5 6 7 8
E1
D1 D1
D2 H+I D2
D3F2 F2 K1 K2 K3
D3F2
F1 F1 F1
AM G = I/G = G = I/G = G = I/G = G = I/G = G = I/G =
G = I/G = G = I/G = G = I/G = G = I/G = G = I/G =
PM G = I/G = G = I/G = G = I/G = G = I/G = G = I/G =
G = I/G = G = I/G = G = I/G = G = I/G = G = I/G =
min crossing time = sec GM + sec FGM =
G1
CKM Asia Limited J1
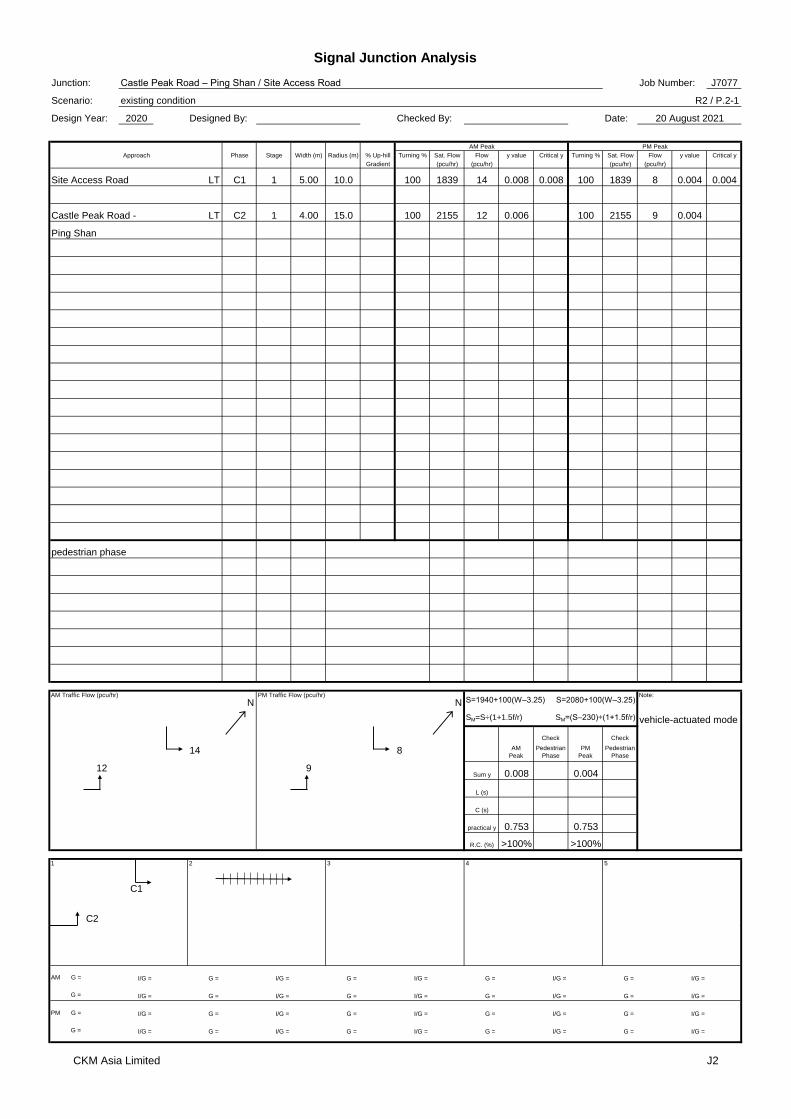
Signal Junction Analysis
Junction: Castle Peak Road – Ping Shan / Site Access Road Job Number: J7077
Scenario: existing condition R2 / P.2-1
Design Year: 2020 Designed By: Checked By: Date: 20 August 2021
AM Peak PM Peak
Approach Phase Stage Width (m) Radius (m) % Up-hill Turning % Sat. Flow Flow y value Critical y Turning % Sat. Flow Flow y value Critical y
Gradient (pcu/hr) (pcu/hr) (pcu/hr) (pcu/hr)
Site Access Road LT C1 1 5.00 10.0 100 1839 14 0.008 0.008 100 1839 8 0.004 0.004
Castle Peak Road - LT C2 1 4.00 15.0 100 2155 12 0.006 100 2155 9 0.004
Ping Shan
pedestrian phase
AM Traffic Flow (pcu/hr)
NPM Traffic Flow (pcu/hr)
N S=1940+100(W–3.25) S=2080+100(W–3.25)Note:
SM=S÷(1+1.5f/r) SM=(S–230)÷(1+1.5f/r) vehicle-actuated mode
Check Check
14 8 AM
Peak
Pedestrian
Phase
PM
Peak
Pedestrian
Phase
12 9Sum y 0.008 0.004
L (s)
C (s)
practical y 0.753 0.753
R.C. (%) >100% >100%
1 2 3 4 5
C1
C2
AM G = I/G = G = I/G = G = I/G = G = I/G = G = I/G =
G = I/G = G = I/G = G = I/G = G = I/G = G = I/G =
PM G = I/G = G = I/G = G = I/G = G = I/G = G = I/G =
G = I/G = G = I/G = G = I/G = G = I/G = G = I/G =
CKM Asia Limited J2

Signal Junction Analysis
Junction: Castle Peak Road – Ping Shan / Site Access Road Job Number: J7077
Scenario: without proposed development R2 / P.2-2
Design Year: 2030 Designed By: Checked By: Date: 20 August 2021
AM Peak PM Peak
Approach Phase Stage Width (m) Radius (m) % Up-hill Turning % Sat. Flow Flow y value Critical y Turning % Sat. Flow Flow y value Critical y
Gradient (pcu/hr) (pcu/hr) (pcu/hr) (pcu/hr)
Site Access Road LT C1 1 5.00 10.0 100 1839 14 0.008 0.008 100 1839 8 0.004 0.004
Castle Peak Road - LT C2 1 4.00 15.0 100 2155 12 0.006 100 2155 9 0.004
Ping Shan
pedestrian phase
AM Traffic Flow (pcu/hr)
NPM Traffic Flow (pcu/hr)
N S=1940+100(W–3.25) S=2080+100(W–3.25)Note:
SM=S÷(1+1.5f/r) SM=(S–230)÷(1+1.5f/r) vehicle-actuated mode
Check Check
14 8 AM
Peak
Pedestrian
Phase
PM
Peak
Pedestrian
Phase
12 9Sum y 0.008 0.004
L (s)
C (s)
practical y 0.753 0.753
R.C. (%) >100% >100%
1 2 3 4 5
C1
C2
AM G = I/G = G = I/G = G = I/G = G = I/G = G = I/G =
G = I/G = G = I/G = G = I/G = G = I/G = G = I/G =
PM G = I/G = G = I/G = G = I/G = G = I/G = G = I/G =
G = I/G = G = I/G = G = I/G = G = I/G = G = I/G =
CKM Asia Limited J2

Signal Junction Analysis
Junction: Castle Peak Road – Ping Shan / Site Access Road Job Number: J7077
Scenario: with proposed development R2 / P.2-3
Design Year: 2030 Designed By: Checked By: Date: 20 August 2021
AM Peak PM Peak
Approach Phase Stage Width (m) Radius (m) % Up-hill Turning % Sat. Flow Flow y value Critical y Turning % Sat. Flow Flow y value Critical y
Gradient (pcu/hr) (pcu/hr) (pcu/hr) (pcu/hr)
Site Access Road LT C1 1 5.00 10.0 100 1839 62 0.034 0.034 100 1839 26 0.014
Castle Peak Road - LT C2 1 4.00 15.0 100 2155 37 0.017 100 2155 33 0.015 0.015
Ping Shan
pedestrian phase
AM Traffic Flow (pcu/hr)
NPM Traffic Flow (pcu/hr)
N S=1940+100(W–3.25) S=2080+100(W–3.25)Note:
SM=S÷(1+1.5f/r) SM=(S–230)÷(1+1.5f/r) vehicle-actuated mode
Check Check
62 26 AM
Peak
Pedestrian
Phase
PM
Peak
Pedestrian
Phase
37 33Sum y 0.034 0.015
L (s)
C (s)
practical y 0.753 0.753
R.C. (%) >100% >100%
1 2 3 4 5
C1
C2
AM G = I/G = G = I/G = G = I/G = G = I/G = G = I/G =
G = I/G = G = I/G = G = I/G = G = I/G = G = I/G =
PM G = I/G = G = I/G = G = I/G = G = I/G = G = I/G =
G = I/G = G = I/G = G = I/G = G = I/G = G = I/G =
CKM Asia Limited J2

Signal Junction Analysis
Junction: Castle Peak Road – Ping Shan / Site Access Road Job Number: J7077
Scenario: Sensitivity Test - Redevelopment of Whole CDA Site R2 / P.2-4
Design Year: 2030 Designed By: Checked By: Date: 20 August 2021
AM Peak PM Peak
Approach Phase Stage Width (m) Radius (m) % Up-hill Turning % Sat. Flow Flow y value Critical y Turning % Sat. Flow Flow y value Critical y
Gradient (pcu/hr) (pcu/hr) (pcu/hr) (pcu/hr)
Site Access Road LT C1 1 5.00 10.0 100 1839 62 0.034 0.034 100 1839 26 0.014
Castle Peak Road - LT C2 1 4.00 15.0 100 2155 37 0.017 100 2155 33 0.015 0.015
Ping Shan
pedestrian phase
AM Traffic Flow (pcu/hr)
NPM Traffic Flow (pcu/hr)
N S=1940+100(W–3.25) S=2080+100(W–3.25)Note:
SM=S÷(1+1.5f/r) SM=(S–230)÷(1+1.5f/r) vehicle-actuated mode
Check Check
62 26 AM
Peak
Pedestrian
Phase
PM
Peak
Pedestrian
Phase
37 33Sum y 0.034 0.015
L (s)
C (s)
practical y 0.753 0.753
R.C. (%) >100% >100%
1 2 3 4 5
C1
C2
AM G = I/G = G = I/G = G = I/G = G = I/G = G = I/G =
G = I/G = G = I/G = G = I/G = G = I/G = G = I/G =
PM G = I/G = G = I/G = G = I/G = G = I/G = G = I/G =
G = I/G = G = I/G = G = I/G = G = I/G = G = I/G =
CKM Asia Limited J2

Signal Junction Analysis
Junction: Castle Peak Road - Ping Shan / Ping Kwai Road / San Hi Tsuen Street Job Number: J7077
Scenario: existing condition R2 / P.3-1
Design Year: 2020 Designed By: Checked By: Date: 20 August 2021
AM Peak PM Peak
Approach Phase Stage Width (m) Radius (m) % Up-hill Turning % Sat. Flow Flow y value Critical y Turning % Sat. Flow Flow y value Critical y
Gradient (pcu/hr) (pcu/hr) (pcu/hr) (pcu/hr)
Castle Peak Road - LT C1 1 3.25 17.0 100 1783 14 0.008 0.008 100 1783 38 0.021 0.021
Ping Shan EB SA B1 1,2 3.40 2095 211 0.101 2095 204 0.097
SA B2 1,2 3.40 2095 211 0.101 2095 204 0.097
RT E1 3 3.00 20.0 100 1912 122 0.064 0.064 100 1912 147 0.077 0.077
San Hi Tsuen Street NB SA+LT G1 4 3.80 18.0 88 1859 179 0.096 0.096 85 1859 138 0.074 0.074
RT G2 4 3.80 21.0 100 1993 44 0.022 100 1993 72 0.036
Castle Peak Road - SA+LT D1 2 4.00 16.0 22 1974 190 0.096 0.096 30 1974 201 0.102 0.102
Ping Shan WB SA D2 2 3.75 2130 205 0.096 2130 217 0.102
SA D3 2 3.00 2055 197 0.096 2055 209 0.102
RT F1 3 3.25 24.0 100 1958 14 0.007 100 1958 68 0.035
Ping Kwai Road SB SA+LT H1 4 3.50 16.0 83 1823 75 0.041 89 1823 84 0.046
RT H2 4 3.50 22.0 100 1971 50 0.025 100 1971 26 0.013
pedestrian phase I(P) 2 7 6 13 sec
J(P) 1 12 11 23 sec
AM Traffic Flow (pcu/hr)
NPM Traffic Flow (pcu/hr)
N S=1940+100(W–3.25) S=2080+100(W–3.25)Note:
50 62 26 75 SM=S÷(1+1.5f/r) SM=(S–230)÷(1+1.5f/r) vehicle-actuated mode
14 13 38 9Check Check
422 408AM
Peak
Pedestrian
Phase
PM
Peak
Pedestrian
Phase
12214
14768
Sum y 0.264 0.274
551 566 L (s)
22 41 21 61 C (s)
157 44 117 72 practical y 0.667 0.653
R.C. (%) >100% >100%
1
C12 I(P)
3 4 5
B1 B1
B2 B2 E1 H2 H1
D3 F1 G1 G2
D2
J(P)D1
AM G = I/G = G = I/G = G = I/G = G = I/G = G = I/G =
G = I/G = G = I/G = G = I/G = G = I/G = G = I/G =
PM G = I/G = G = I/G = G = I/G = G = I/G = G = I/G =
G = I/G = G = I/G = G = I/G = G = I/G = G = I/G =
min crossing time = sec GM + sec FGM =
min crossing time = sec GM + sec FGM =
CKM Asia Limited J3
Signal Junction Analysis
Junction: Castle Peak Road - Ping Shan / Ping Kwai Road / San Hi Tsuen Street Job Number: J7077
Scenario: without proposed development R2 / P.3-2
Design Year: 2030 Designed By: Checked By: Date: 20 August 2021
AM Peak PM Peak
Approach Phase Stage Width (m) Radius (m) % Up-hill Turning % Sat. Flow Flow y value Critical y Turning % Sat. Flow Flow y value Critical y
Gradient (pcu/hr) (pcu/hr) (pcu/hr) (pcu/hr)
Castle Peak Road - LT C1 1 3.25 17.0 100 1783 16 0.009 100 1783 43 0.024
Ping Shan EB SA B1 1,2 3.40 2095 657 0.314 0.314 2095 649 0.310 0.310
SA B2 1,2 3.40 2095 656 0.313 2095 649 0.310
RT E1 3 3.00 20.0 100 1912 138 0.072 0.072 100 1912 164 0.086 0.086
San Hi Tsuen Street NB SA+LT G1 4 3.80 18.0 88 1859 205 0.110 0.110 83 1859 157 0.084 0.084
RT G2 4 3.80 21.0 100 1993 97 0.049 100 1993 115 0.058
Castle Peak Road - SA+LT D1 2 4.00 16.0 13 1991 373 0.187 17 1991 389 0.195
Ping Shan WB SA D2 2 3.75 2130 399 0.187 2130 416 0.195
SA D3 2 3.00 2055 385 0.187 2055 402 0.196
RT F1 3 3.25 24.0 100 1958 21 0.011 100 1958 78 0.040
Ping Kwai Road SB SA+LT H1 4 3.50 16.0 81 1826 85 0.047 89 1826 94 0.051
RT H2 4 3.50 22.0 100 1971 71 0.036 100 1971 45 0.023
pedestrian phase I(P) 2 7 6 13 sec
J(P) 1 12 11 23 sec
AM Traffic Flow (pcu/hr)
NPM Traffic Flow (pcu/hr)
N S=1940+100(W–3.25) S=2080+100(W–3.25)Note:
71 69 45 84 SM=S÷(1+1.5f/r) SM=(S–230)÷(1+1.5f/r) vehicle-actuated mode
16 16 43 10Check Check
1313 1298AM
Peak
Pedestrian
Phase
PM
Peak
Pedestrian
Phase
13821
16478
Sum y 0.496 0.480
1110 1141 L (s)
25 47 26 66 C (s)
180 97 131 115 practical y 0.737 0.734
R.C. (%) 49% 53%
1
C12 I(P)
3 4 5
B1 B1
B2 B2 E1 H2 H1
D3 F1 G1 G2
D2
J(P)D1
AM G = I/G = G = I/G = G = I/G = G = I/G = G = I/G =
G = I/G = G = I/G = G = I/G = G = I/G = G = I/G =
PM G = I/G = G = I/G = G = I/G = G = I/G = G = I/G =
G = I/G = G = I/G = G = I/G = G = I/G = G = I/G =
min crossing time = sec GM + sec FGM =
min crossing time = sec GM + sec FGM =
CKM Asia Limited J3

Signal Junction Analysis
Junction: Castle Peak Road - Ping Shan / Ping Kwai Road / San Hi Tsuen Street Job Number: J7077
Scenario: with proposed development R2 / P.3-3
Design Year: 2030 Designed By: Checked By: Date: 20 August 2021
AM Peak PM Peak
Approach Phase Stage Width (m) Radius (m) % Up-hill Turning % Sat. Flow Flow y value Critical y Turning % Sat. Flow Flow y value Critical y
Gradient (pcu/hr) (pcu/hr) (pcu/hr) (pcu/hr)
Castle Peak Road - LT C1 1 3.25 17.0 100 1783 16 0.009 100 1783 43 0.024
Ping Shan EB SA B1 1,2 3.40 2095 658 0.314 0.314 2095 650 0.310 0.310
SA B2 1,2 3.40 2095 657 0.314 2095 650 0.310
RT E1 3 3.00 20.0 100 1912 138 0.072 0.072 100 1912 164 0.086 0.086
San Hi Tsuen Street NB SA+LT G1 4 3.80 18.0 88 1859 205 0.110 0.110 83 1859 157 0.084 0.084
RT G2 4 3.80 21.0 100 1993 121 0.061 100 1993 137 0.069
Castle Peak Road - SA+LT D1 2 4.00 16.0 13 1991 376 0.189 17 1991 391 0.196
Ping Shan WB SA D2 2 3.75 2130 402 0.189 2130 418 0.196
SA D3 2 3.00 2055 388 0.189 2055 403 0.196
RT F1 3 3.25 24.0 100 1958 21 0.011 100 1958 78 0.040
Ping Kwai Road SB SA+LT H1 4 3.50 16.0 81 1826 85 0.047 89 1826 94 0.051
RT H2 4 3.50 22.0 100 1971 71 0.036 100 1971 45 0.023
pedestrian phase I(P) 2 7 6 13 sec
J(P) 1 12 11 23 sec
AM Traffic Flow (pcu/hr)
NPM Traffic Flow (pcu/hr)
N S=1940+100(W–3.25) S=2080+100(W–3.25)Note:
71 69 45 84 SM=S÷(1+1.5f/r) SM=(S–230)÷(1+1.5f/r) vehicle-actuated mode
16 16 43 10Check Check
1315 1300AM
Peak
Pedestrian
Phase
PM
Peak
Pedestrian
Phase
13821
16478
Sum y 0.497 0.481
1119 1146 L (s)
25 47 26 66 C (s)
180 121 131 137 practical y 0.737 0.734
R.C. (%) 48% 53%
1
C12 I(P)
3 4 5
B1 B1
B2 B2 E1 H2 H1
D3 F1 G1 G2
D2
J(P)D1
AM G = I/G = G = I/G = G = I/G = G = I/G = G = I/G =
G = I/G = G = I/G = G = I/G = G = I/G = G = I/G =
PM G = I/G = G = I/G = G = I/G = G = I/G = G = I/G =
G = I/G = G = I/G = G = I/G = G = I/G = G = I/G =
sec GM + sec FGM =
min crossing time = sec GM + sec FGM =
min crossing time =
CKM Asia Limited J3

Signal Junction Analysis
Junction: Castle Peak Road - Ping Shan / Ping Kwai Road / San Hi Tsuen Street Job Number: J7077
Scenario: Sensitivity Test - Redevelopment of Whole CDA Site R2 / P.3-4
Design Year: 2030 Designed By: Checked By: Date: 20 August 2021
AM Peak PM Peak
Approach Phase Stage Width (m) Radius (m) % Up-hill Turning % Sat. Flow Flow y value Critical y Turning % Sat. Flow Flow y value Critical y
Gradient (pcu/hr) (pcu/hr) (pcu/hr) (pcu/hr)
Castle Peak Road - LT C1 1 3.25 17.0 100 1783 16 0.009 100 1783 43 0.024
Ping Shan EB SA B1 1,2 3.40 2095 658 0.314 0.314 2095 651 0.311 0.311
SA B2 1,2 3.40 2095 658 0.314 2095 650 0.310
RT E1 3 3.00 20.0 100 1912 138 0.072 0.072 100 1912 164 0.086 0.086
San Hi Tsuen Street NB SA+LT G1 4 3.80 18.0 88 1859 205 0.110 0.110 83 1859 157 0.084 0.084
RT G2 4 3.80 21.0 100 1993 121 0.061 100 1993 137 0.069
Castle Peak Road - SA+LT D1 2 4.00 16.0 12 1993 378 0.190 17 1993 392 0.197
Ping Shan WB SA D2 2 3.75 2130 404 0.190 2130 419 0.197
SA D3 2 3.00 2055 389 0.189 2055 403 0.196
RT F1 3 3.25 24.0 100 1958 21 0.011 100 1958 78 0.040
Ping Kwai Road SB SA+LT H1 4 3.50 16.0 81 1826 85 0.047 89 1826 94 0.051
RT H2 4 3.50 22.0 100 1971 71 0.036 100 1971 45 0.023
pedestrian phase I(P) 2 7 6 13 sec
J(P) 1 12 11 23 sec
AM Traffic Flow (pcu/hr)
NPM Traffic Flow (pcu/hr)
N S=1940+100(W–3.25) S=2080+100(W–3.25)Note:
71 69 45 84 SM=S÷(1+1.5f/r) SM=(S–230)÷(1+1.5f/r) vehicle-actuated mode
16 16 43 10Check Check
1316 1301AM
Peak
Pedestrian
Phase
PM
Peak
Pedestrian
Phase
13821
16478
Sum y 0.497 0.481
1124 1148 L (s)
25 47 26 66 C (s)
180 121 131 137 practical y 0.737 0.734
R.C. (%) 48% 53%
1
C12 I(P)
3 4 5
B1 B1
B2 B2 E1 H2 H1
D3 F1 G1 G2
D2
J(P)D1
AM G = I/G = G = I/G = G = I/G = G = I/G = G = I/G =
G = I/G = G = I/G = G = I/G = G = I/G = G = I/G =
PM G = I/G = G = I/G = G = I/G = G = I/G = G = I/G =
G = I/G = G = I/G = G = I/G = G = I/G = G = I/G =
min crossing time = sec GM + sec FGM =
min crossing time = sec GM + sec FGM =
CKM Asia Limited J3

Signal Junction Analysis
Junction: Castle Peak Road - Ping Shan / Ma Wang Road / Slip Road to Tong Yan San Tsuen Interchange Job Number: J7077
Scenario: existing condition R2 / P.4-1
Design Year: 2020 Designed By: Checked By: Date: 20 August 2021
AM Peak PM Peak
Approach Phase Stage Width (m) Radius (m) % Up-hill Turning % Sat. Flow Flow y value Critical y Turning % Sat. Flow Flow y value Critical y
Gradient (pcu/hr) (pcu/hr) (pcu/hr) (pcu/hr)
Castle Peak Road - LT J1 1,3 3.20 30.0 100 1843 423 0.230 100 1843 425 0.231
Ping Shan EB SA B1 1 3.20 2075 203 0.098 2075 200 0.096
SA B2 1 3.20 2075 202 0.097 2075 200 0.096
Ma Wang Road SB LT+SA C1 3 4.00 20.0 100 1874 159 0.085 0.085 100 1874 131 0.070 0.070
SA C2 3 4.00 2155 101 0.047 2155 136 0.063
SA C3 3 4.00 2155 100 0.046 2155 136 0.063
Castle Peak Road - LT+SA D1 1,2 3.40 15.0 100 1777 564 0.317 0.317 100 1777 516 0.290 0.290
Ping Shan WB SA D2 1,2 3.40 2095 316 0.151 2095 340 0.162
pedestrian phase E(P) 3 10 9 19 sec
F(P) 1,2 5 10 15 sec
G(P) 2 5 6 11 sec
K(P) 3 5 9 14 sec
AM Traffic Flow (pcu/hr)
NPM Traffic Flow (pcu/hr)
N S=1940+100(W–3.25) S=2080+100(W–3.25)Note:
159 131 SM=S÷(1+1.5f/r) SM=(S–230)÷(1+1.5f/r) vehicle-actuated mode
423 201 425 272Check Check
405 400AM
Peak
Pedestrian
Phase
PM
Peak
Pedestrian
Phase
Sum y 0.402 0.360
316 340 L (s)
564 516 C (s)
practical y 0.758 0.757
R.C. (%) 88% >100%
1
I1F(P)
2G(P) F(P)
3
I1
4 5
J1 J1C3 C2 C1
B1
B2
H1
H2
H1
H2
D2 D2 K(P)
D1 D1 K(P)
AM G = I/G = G = I/G = G = I/G = G = I/G = G = I/G =
G = I/G = G = I/G = G = I/G = G = I/G = G = I/G =
PM G = I/G = G = I/G = G = I/G = G = I/G = G = I/G =
G = I/G = G = I/G = G = I/G = G = I/G = G = I/G =
min crossing time = sec GM + sec FGM =
min crossing time = sec GM + sec FGM =
min crossing time = sec GM + sec FGM =
min crossing time = sec GM + sec FGM =
CKM Asia Limited J4

Signal Junction Analysis
Junction: Castle Peak Road - Ping Shan / Ma Wang Road / Slip Road to Tong Yan San Tsuen Interchange Job Number: J7077
Scenario: without proposed development R2 / P.4-2
Design Year: 2030 Designed By: Checked By: Date: 20 August 2021
AM Peak PM Peak
Approach Phase Stage Width (m) Radius (m) % Up-hill Turning % Sat. Flow Flow y value Critical y Turning % Sat. Flow Flow y value Critical y
Gradient (pcu/hr) (pcu/hr) (pcu/hr) (pcu/hr)
Castle Peak Road - LT J1 1,3 3.20 30.0 100 1843 596 0.323 100 1843 670 0.364
Ping Shan EB SA B1 1 3.20 2075 662 0.319 2075 606 0.292
SA B2 1 3.20 2075 661 0.319 2075 606 0.292
Ma Wang Road SB LT+SA C1 3 4.00 20.0 93 1884 182 0.097 0.097 100 1874 150 0.080
SA C2 3 4.00 2155 208 0.097 2155 265 0.123 0.123
SA C3 3 4.00 2155 208 0.097 2155 265 0.123
Castle Peak Road - LT+SA D1 1,2 3.40 15.0 100 1777 687 0.387 0.387 96 1784 660 0.370 0.370
Ping Shan WB SA D2 1,2 3.40 2095 766 0.366 2095 775 0.370
pedestrian phase E(P) 3 10 9 19 sec
F(P) 1,2 5 10 15 sec
G(P) 2 5 6 11 sec
K(P) 3 5 9 14 sec
AM Traffic Flow (pcu/hr)
NPM Traffic Flow (pcu/hr)
N S=1940+100(W–3.25) S=2080+100(W–3.25)Note:
170 150 SM=S÷(1+1.5f/r) SM=(S–230)÷(1+1.5f/r) vehicle-actuated mode
596 428 670 530Check Check
1323 1212AM
Peak
Pedestrian
Phase
PM
Peak
Pedestrian
Phase
Sum y 0.483 0.493
766 799 L (s)
687 636 C (s)
practical y 0.758 0.757
R.C. (%) 57% 54%
1
I1F(P)
2G(P) F(P)
3
I1
4 5
J1 J1C3 C2 C1
B1
B2
H1
H2
H1
H2
D2 D2 K(P)
D1 D1 K(P)
AM G = I/G = G = I/G = G = I/G = G = I/G = G = I/G =
G = I/G = G = I/G = G = I/G = G = I/G = G = I/G =
PM G = I/G = G = I/G = G = I/G = G = I/G = G = I/G =
G = I/G = G = I/G = G = I/G = G = I/G = G = I/G =
min crossing time = sec GM + sec FGM =
min crossing time = sec GM + sec FGM =
min crossing time = sec GM + sec FGM =
min crossing time = sec GM + sec FGM =
CKM Asia Limited J4

Signal Junction Analysis
Junction: Castle Peak Road - Ping Shan / Ma Wang Road / Slip Road to Tong Yan San Tsuen Interchange Job Number: J7077
Scenario: with proposed development R2 / P.4-3
Design Year: 2030 Designed By: Checked By: Date: 20 August 2021
AM Peak PM Peak
Approach Phase Stage Width (m) Radius (m) % Up-hill Turning % Sat. Flow Flow y value Critical y Turning % Sat. Flow Flow y value Critical y
Gradient (pcu/hr) (pcu/hr) (pcu/hr) (pcu/hr)
Castle Peak Road - LT J1 1,3 3.20 30.0 100 1843 625 0.339 100 1843 681 0.370
Ping Shan EB SA B1 1 3.20 2075 668 0.322 2075 609 0.293
SA B2 1 3.20 2075 668 0.322 2075 609 0.293
Ma Wang Road SB LT+SA C1 3 4.00 20.0 100 1874 170 0.091 100 1874 150 0.080
SA C2 3 4.00 2155 220 0.102 2155 270 0.125 0.125
SA C3 3 4.00 2155 220 0.102 0.102 2155 269 0.125
Castle Peak Road - LT+SA D1 1,2 3.40 15.0 100 1777 687 0.387 0.387 96 1784 661 0.371
Ping Shan WB SA D2 1,2 3.40 2095 770 0.368 2095 777 0.371 0.371
pedestrian phase E(P) 3 10 9 19 sec
F(P) 1,2 5 10 15 sec
G(P) 2 5 6 11 sec
K(P) 3 5 9 14 sec
AM Traffic Flow (pcu/hr)
NPM Traffic Flow (pcu/hr)
N S=1940+100(W–3.25) S=2080+100(W–3.25)Note:
170 150 SM=S÷(1+1.5f/r) SM=(S–230)÷(1+1.5f/r) vehicle-actuated mode
625 440 681 539Check Check
1336 1218AM
Peak
Pedestrian
Phase
PM
Peak
Pedestrian
Phase
Sum y 0.489 0.496
770 802 L (s)
687 636 C (s)
practical y 0.758 0.757
R.C. (%) 55% 53%
1
I1F(P)
2G(P) F(P)
3
I1
4 5
J1 J1C3 C2 C1
B1
B2
H1
H2
H1
H2
D2 D2 K(P)
D1 D1 K(P)
AM G = I/G = G = I/G = G = I/G = G = I/G = G = I/G =
G = I/G = G = I/G = G = I/G = G = I/G = G = I/G =
PM G = I/G = G = I/G = G = I/G = G = I/G = G = I/G =
G = I/G = G = I/G = G = I/G = G = I/G = G = I/G =
min crossing time = sec GM + sec FGM =
min crossing time = sec GM + sec FGM =
min crossing time = sec GM + sec FGM =
min crossing time = sec GM + sec FGM =
CKM Asia Limited J4

Signal Junction Analysis
Junction: Castle Peak Road - Ping Shan / Ma Wang Road / Slip Road to Tong Yan San Tsuen Interchange Job Number: J7077
Scenario: Sensitivity Test - Redevelopment of Whole CDA Site R2 / P.4-4
Design Year: 2030 Designed By: Checked By: Date: 20 August 2021
AM Peak PM Peak
Approach Phase Stage Width (m) Radius (m) % Up-hill Turning % Sat. Flow Flow y value Critical y Turning % Sat. Flow Flow y value Critical y
Gradient (pcu/hr) (pcu/hr) (pcu/hr) (pcu/hr)
Castle Peak Road - LT J1 1,3 3.20 30.0 100 1843 640 0.347 100 1843 685 0.372
Ping Shan EB SA B1 1 3.20 2075 670 0.323 2075 610 0.294
SA B2 1 3.20 2075 669 0.322 2075 609 0.293
Ma Wang Road SB LT+SA C1 3 4.00 20.0 100 1874 170 0.091 100 1874 150 0.080
SA C2 3 4.00 2155 222 0.103 0.103 2155 271 0.126 0.126
SA C3 3 4.00 2155 221 0.103 2155 270 0.125
Castle Peak Road - LT+SA D1 1,2 3.40 15.0 100 1777 687 0.387 0.387 96 1784 662 0.371 0.371
Ping Shan WB SA D2 1,2 3.40 2095 771 0.368 2095 777 0.371
pedestrian phase E(P) 3 10 9 19 sec
F(P) 1,2 5 10 15 sec
G(P) 2 5 6 11 sec
K(P) 3 5 9 14 sec
AM Traffic Flow (pcu/hr)
NPM Traffic Flow (pcu/hr)
N S=1940+100(W–3.25) S=2080+100(W–3.25)Note:
170 150 SM=S÷(1+1.5f/r) SM=(S–230)÷(1+1.5f/r) vehicle-actuated mode
640 443 685 541Check Check
1339 1219AM
Peak
Pedestrian
Phase
PM
Peak
Pedestrian
Phase
Sum y 0.490 0.497
771 803 L (s)
687 636 C (s)
practical y 0.758 0.757
R.C. (%) 55% 52%
1
I1F(P)
2G(P) F(P)
3
I1
4 5
J1 J1C3 C2 C1
B1
B2
H1
H2
H1
H2
D2 D2 K(P)
D1 D1 K(P)
AM G = I/G = G = I/G = G = I/G = G = I/G = G = I/G =
G = I/G = G = I/G = G = I/G = G = I/G = G = I/G =
PM G = I/G = G = I/G = G = I/G = G = I/G = G = I/G =
G = I/G = G = I/G = G = I/G = G = I/G = G = I/G =
min crossing time = sec GM + sec FGM =
min crossing time = sec GM + sec FGM =
min crossing time = sec GM + sec FGM =
min crossing time = sec GM + sec FGM =
CKM Asia Limited J4
Signal Junction Analysis
Junction: Shui Pin Wai Interchange Job Number: J7077
Scenario: existing condition R2 / P.5-1
Design Year: 2020 Designed By: Checked By: Date: 20 August 2021
AM Peak PM Peak
Approach Phase Stage Width (m) Radius (m) % Up-hill Turning % Sat. Flow Flow y value Critical y Turning % Sat. Flow Flow y value Critical y
Gradient (pcu/hr) (pcu/hr) (pcu/hr) (pcu/hr)
Long Tin Road SB LT F1 2,3,4 3.80 50.0 100 1937 221 0.114 100 1937 164 0.085
LT F2 2,3,4 3.80 50.0 100 2073 237 0.114 100 2073 176 0.085
SA A1 2 3.50 2105 130 0.062 2105 88 0.042 0.042
SA A2 2 3.50 2105 130 0.062 2105 88 0.042
SA A3 2 3.50 2105 131 0.062 0.062 2105 88 0.042
Long Ping Road WB LT D1 3 3.20 30.0 100 1963 282 0.144 0.144 100 1963 272 0.139 0.139
SA E1 3,4 4.20 2175 278 0.128 2175 287 0.132
SA E2 3,4 4.20 2175 278 0.128 2175 287 0.132
Shui Pin Wai Interchange NB SA B1 1 4.00 2015 258 0.128 2015 228 0.113 0.113
SA+RT B2 1 4.00 30.0 64 2088 268 0.128 49 2103 238 0.113
RT B3 1 4.00 25.0 100 2033 261 0.128 0.128 100 2033 230 0.113
RT C1 4 5.00 20.0 100 2098 209 0.100 0.100 100 2098 191 0.091 0.091
RT C2 4 5.00 15.0 100 2050 204 0.100 100 2050 186 0.091
pedestrian phase
AM Traffic Flow (pcu/hr)
NPM Traffic Flow (pcu/hr)
N S=1940+100(W–3.25) S=2080+100(W–3.25)Note:
458 340 SM=S÷(1+1.5f/r) SM=(S–230)÷(1+1.5f/r)
391 264Check Check
354 350AM
Peak
Pedestrian
Phase
PM
Peak
Pedestrian
Phase
433 346 Sum y 0.434 0.385
556 574 L (s) 26 26
413 282 377 272 C (s) 120 120
practical y 0.705 0.705
R.C. (%) 62% 83%
1 2 3 4 5
B1 A3 A2 A1 F2 F1 F2 F1 F2 F1
B2 E2 E2
B3 E1 C2 E1
D1 C1
AM G = I/G = 7 G = I/G = 12 G = I/G = 6 G = I/G = 5 G = I/G =
G = I/G = G = I/G = G = I/G = G = I/G = G = I/G =
PM G = I/G = 7 G = I/G = 12 G = I/G = 6 G = I/G = 5 G = I/G =
G = I/G = G = I/G = G = I/G = G = I/G = G = I/G =
CKM Asia Limited J5

Signal Junction Analysis
Junction: Shui Pin Wai Interchange Job Number: J7077
Scenario: without proposed development R2 / P.5-2
Design Year: 2030 Designed By: Checked By: Date: 20 August 2021
AM Peak PM Peak
Approach Phase Stage Width (m) Radius (m) % Up-hill Turning % Sat. Flow Flow y value Critical y Turning % Sat. Flow Flow y value Critical y
Gradient (pcu/hr) (pcu/hr) (pcu/hr) (pcu/hr)
Long Tin Road SB LT F1 2,3,4 3.80 50.0 100 1937 257 0.133 100 1937 205 0.106
LT F2 2,3,4 3.80 50.0 100 2073 274 0.132 100 2073 220 0.106
SA A1 2 3.50 2105 159 0.076 0.076 2105 132 0.063
SA A2 2 3.50 2105 159 0.076 2105 132 0.063
SA A3 2 3.50 2105 159 0.076 2105 133 0.063 0.063
Long Ping Road WB LT D1 3 3.20 30.0 100 1963 427 0.218 0.218 100 1963 339 0.173 0.173
SA E1 3,4 4.20 2175 390 0.179 2175 453 0.208
SA E2 3,4 4.20 2175 390 0.179 2175 452 0.208
Shui Pin Wai Interchange NB SA B1 1 4.00 2015 338 0.168 2015 313 0.155
SA+RT B2 1 4.00 30.0 37 2116 355 0.168 0.168 30 2123 330 0.155
RT B3 1 4.00 35.0 100 2066 346 0.167 100 2066 322 0.156 0.156
RT C1 4 5.00 20.0 100 2098 271 0.129 0.129 100 2098 255 0.122 0.122
RT C2 4 5.00 15.0 100 2050 264 0.129 100 2050 249 0.121
pedestrian phase
AM Traffic Flow (pcu/hr)
NPM Traffic Flow (pcu/hr)
N S=1940+100(W–3.25) S=2080+100(W–3.25)Note:
531 425 SM=S÷(1+1.5f/r) SM=(S–230)÷(1+1.5f/r)
477 397Check Check
563 544AM
Peak
Pedestrian
Phase
PM
Peak
Pedestrian
Phase
476 421 Sum y 0.590 0.513
780 905 L (s) 26 26
535 427 504 339 C (s) 120 120
practical y 0.705 0.705
R.C. (%) 19% 37%
1 2 3 4 5
B1 A3 A2 A1 F2 F1 F2 F1 F2 F1
B2 E2 E2
B3 E1 C2 E1
D1 C1
AM G = I/G = 7 G = I/G = 12 G = I/G = 6 G = I/G = 5 G = I/G =
G = I/G = G = I/G = G = I/G = G = I/G = G = I/G =
PM G = I/G = 7 G = I/G = 12 G = I/G = 6 G = I/G = 5 G = I/G =
G = I/G = G = I/G = G = I/G = G = I/G = G = I/G =
CKM Asia Limited J5

Signal Junction Analysis
Junction: Shui Pin Wai Interchange Job Number: J7077
Scenario: with proposed development R2 / P.5-3
Design Year: 2030 Designed By: Checked By: Date: 20 August 2021
AM Peak PM Peak
Approach Phase Stage Width (m) Radius (m) % Up-hill Turning % Sat. Flow Flow y value Critical y Turning % Sat. Flow Flow y value Critical y
Gradient (pcu/hr) (pcu/hr) (pcu/hr) (pcu/hr)
Long Tin Road SB LT F1 2,3,4 3.80 50.0 100 1937 257 0.133 100 1937 205 0.106
LT F2 2,3,4 3.80 50.0 100 2073 274 0.132 100 2073 220 0.106
SA A1 2 3.50 2105 159 0.076 0.076 2105 132 0.063
SA A2 2 3.50 2105 159 0.076 2105 132 0.063
SA A3 2 3.50 2105 159 0.076 2105 133 0.063 0.063
Long Ping Road WB LT D1 3 3.20 30.0 100 1963 427 0.218 0.218 100 1963 339 0.173 0.173
SA E1 3,4 4.20 2175 390 0.179 2175 453 0.208
SA E2 3,4 4.20 2175 390 0.179 2175 452 0.208
Shui Pin Wai Interchange NB SA B1 1 4.00 2015 345 0.171 2015 318 0.158
SA+RT B2 1 4.00 30.0 40 2113 362 0.171 33 2120 334 0.158
RT B3 1 4.00 25.0 100 2033 349 0.172 0.172 100 2033 321 0.158 0.158
RT C1 4 5.00 20.0 100 2098 271 0.129 0.129 100 2098 255 0.122 0.122
RT C2 4 5.00 15.0 100 2050 264 0.129 100 2050 249 0.121
pedestrian phase
AM Traffic Flow (pcu/hr)
NPM Traffic Flow (pcu/hr)
N S=1940+100(W–3.25) S=2080+100(W–3.25)Note:
531 425 SM=S÷(1+1.5f/r) SM=(S–230)÷(1+1.5f/r)
477 397Check Check
563 544AM
Peak
Pedestrian
Phase
PM
Peak
Pedestrian
Phase
493 429 Sum y 0.594 0.515
780 905 L (s) 26 26
535 427 504 339 C (s) 120 120
practical y 0.705 0.705
R.C. (%) 19% 37%
1 2 3 4 5
B1 A3 A2 A1 F2 F1 F2 F1 F2 F1
B2 E2 E2
B3 E1 C2 E1
D1 C1
AM G = I/G = 7 G = I/G = 12 G = I/G = 6 G = I/G = 5 G = I/G =
G = I/G = G = I/G = G = I/G = G = I/G = G = I/G =
PM G = I/G = 7 G = I/G = 12 G = I/G = 6 G = I/G = 5 G = I/G =
G = I/G = G = I/G = G = I/G = G = I/G = G = I/G =
CKM Asia Limited J5
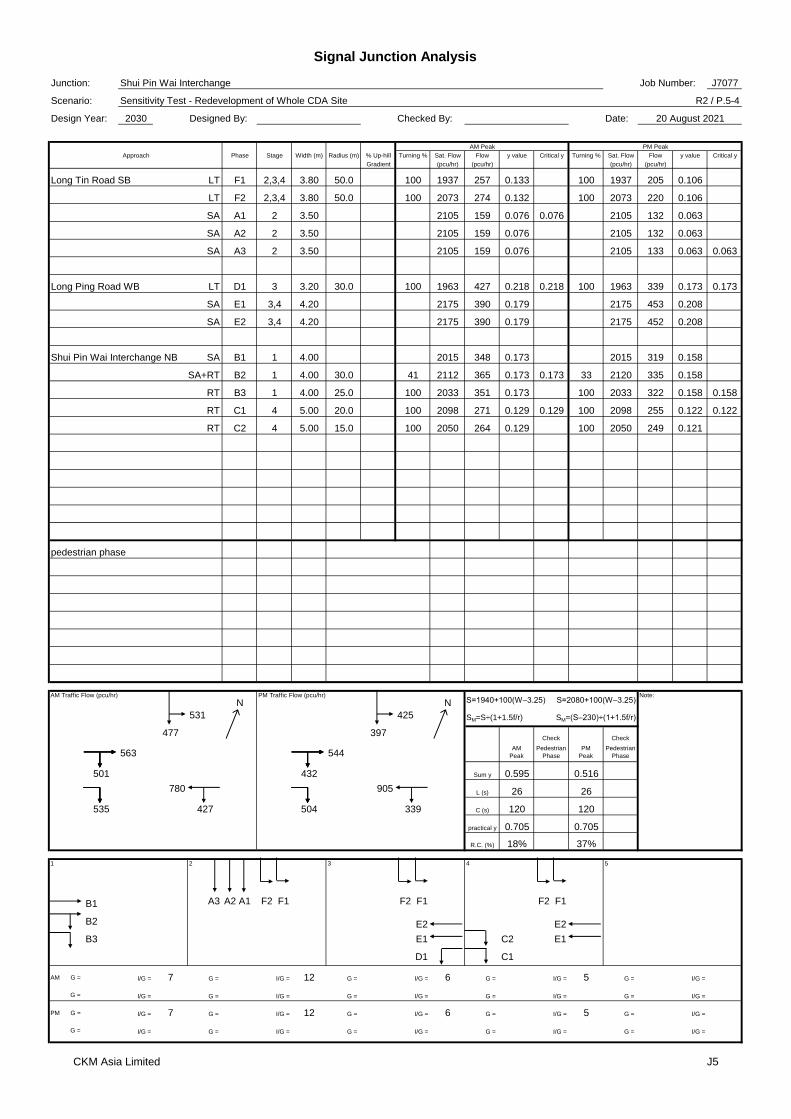
Signal Junction Analysis
Junction: Shui Pin Wai Interchange Job Number: J7077
Scenario: Sensitivity Test - Redevelopment of Whole CDA Site R2 / P.5-4
Design Year: 2030 Designed By: Checked By: Date: 20 August 2021
AM Peak PM Peak
Approach Phase Stage Width (m) Radius (m) % Up-hill Turning % Sat. Flow Flow y value Critical y Turning % Sat. Flow Flow y value Critical y
Gradient (pcu/hr) (pcu/hr) (pcu/hr) (pcu/hr)
Long Tin Road SB LT F1 2,3,4 3.80 50.0 100 1937 257 0.133 100 1937 205 0.106
LT F2 2,3,4 3.80 50.0 100 2073 274 0.132 100 2073 220 0.106
SA A1 2 3.50 2105 159 0.076 0.076 2105 132 0.063
SA A2 2 3.50 2105 159 0.076 2105 132 0.063
SA A3 2 3.50 2105 159 0.076 2105 133 0.063 0.063
Long Ping Road WB LT D1 3 3.20 30.0 100 1963 427 0.218 0.218 100 1963 339 0.173 0.173
SA E1 3,4 4.20 2175 390 0.179 2175 453 0.208
SA E2 3,4 4.20 2175 390 0.179 2175 452 0.208
Shui Pin Wai Interchange NB SA B1 1 4.00 2015 348 0.173 2015 319 0.158
SA+RT B2 1 4.00 30.0 41 2112 365 0.173 0.173 33 2120 335 0.158
RT B3 1 4.00 25.0 100 2033 351 0.173 100 2033 322 0.158 0.158
RT C1 4 5.00 20.0 100 2098 271 0.129 0.129 100 2098 255 0.122 0.122
RT C2 4 5.00 15.0 100 2050 264 0.129 100 2050 249 0.121
pedestrian phase
AM Traffic Flow (pcu/hr)
NPM Traffic Flow (pcu/hr)
N S=1940+100(W–3.25) S=2080+100(W–3.25)Note:
531 425 SM=S÷(1+1.5f/r) SM=(S–230)÷(1+1.5f/r)
477 397Check Check
563 544AM
Peak
Pedestrian
Phase
PM
Peak
Pedestrian
Phase
501 432 Sum y 0.595 0.516
780 905 L (s) 26 26
535 427 504 339 C (s) 120 120
practical y 0.705 0.705
R.C. (%) 18% 37%
1 2 3 4 5
B1 A3 A2 A1 F2 F1 F2 F1 F2 F1
B2 E2 E2
B3 E1 C2 E1
D1 C1
AM G = I/G = 7 G = I/G = 12 G = I/G = 6 G = I/G = 5 G = I/G =
G = I/G = G = I/G = G = I/G = G = I/G = G = I/G =
PM G = I/G = 7 G = I/G = 12 G = I/G = 6 G = I/G = 5 G = I/G =
G = I/G = G = I/G = G = I/G = G = I/G = G = I/G =
CKM Asia Limited J5