bulk polymerization of tpu for reactive processing using rheo- ftir
179
BULK POLYMERIZATION OF TPU FOR REACTIVE PROCESSING USING RHEO- FTIR By JESSE L. GADLEY Submitted in partial fulfilment of the requirements for the degree of Doctor of Philosophy Dissertation Adviser: Prof. João M. Maia Department of Macromolecular Science and Engineering Case Western Reserve University August 2016
-
Upload
khangminh22 -
Category
Documents
-
view
0 -
download
0
Transcript of bulk polymerization of tpu for reactive processing using rheo- ftir
BULK POLYMERIZATION OF TPU FOR REACTIVE PROCESSING USING RHEO-
FTIR
By
JESSE L. GADLEY
Submitted in partial fulfilment of the requirements for the degree of
Doctor of Philosophy
Dissertation Adviser: Prof. João M. Maia
Department of Macromolecular Science and Engineering
Case Western Reserve University
August 2016
2
CASE WESTERN RESERVE UNIVERSITY SCHOOL OF GRADUATE STUDIES
We hereby approve the thesis/dissertation of
Jesse L. Gadley
candidate for the degree of Ph.D *.
Committee Chair
Dr. João M. Maia
Committee Member
Dr. Gary Wnek
Committee Member
Dr. Michael J. A. Hore
Committee Member
Dr. Jesse S. Wainright
Date of Defense
June 21st, 2016
*We also certify that written approval has been obtained for any proprietary material contained
therein.

3
Dedication
This dissertation is dedicated to my grandfather, Guy Ellis, for inspiring me since a very
young age to follow a career in science and engineering.

4
Table of Contents
Dedication ....................................................................................................................... 3
List of Figures ................................................................................................................. 8
List of Tables ................................................................................................................ 13
Acknowledgments......................................................................................................... 14
Abstract ......................................................................................................................... 15
Chapter 1 : Introduction .................................................................................................... 17
1.1 TPU Background .................................................................................................... 18
1.2 Reactive Extrusion .................................................................................................. 20
1.3 Rheo-Kinetics of TPUs ........................................................................................... 21
1.5 Dissertation Scope .................................................................................................. 23
1.6 References ............................................................................................................... 24
Chapter 2 : Rheo-Kinetic Study of Thermoplastic Polyurethanes using In Situ FTIR
Analysis............................................................................................................................. 27
2.1 Abstract ................................................................................................................... 28
2.2 Introduction ............................................................................................................. 29
2.3 Experimental ........................................................................................................... 31
2.3.1 Materials .......................................................................................................... 31
2.3.2 On-Plate Polymer Synthesis ............................................................................ 32
2.3.3 Characterization ............................................................................................... 33
5
2.3.3.1 Rheology ................................................................................................... 33
2.3.3.2 In Situ FTIR .............................................................................................. 33
2.4 Results and Discussion ........................................................................................... 34
2.5 Conclusions ............................................................................................................. 39
2.6 References ............................................................................................................... 41
2.7 Figures..................................................................................................................... 43
2.8 Tables ...................................................................................................................... 51
Chapter 3 : Investigation of Rheological Behavior During Onset of Thermoplastic
Polyurethane Reactions ..................................................................................................... 54
3.1 Abstract ................................................................................................................... 55
3.2 Introduction ............................................................................................................. 56
3.3. Experimental .......................................................................................................... 59
3.3.1 Materials .......................................................................................................... 59
3.3.2 Characterization ............................................................................................... 60
3.3.2.1 Rheology ................................................................................................... 60
3.3.2.2 FTIR .......................................................................................................... 61
3.3.2.3 X-ray ......................................................................................................... 62
3.4 Results and Discussion ........................................................................................... 63
3.5 Conclusions ............................................................................................................. 68
3.6 Figures..................................................................................................................... 73

6
3.7 Tables ...................................................................................................................... 80
Chapter 4 : Rheo-kinetic Modeling of TPU Using In Situ FTIR Analysis ....................... 81
4.1 Abstract ................................................................................................................... 82
4.2 Introduction ............................................................................................................. 83
4.3 Experimental ........................................................................................................... 85
4.4 Results and Discussion ........................................................................................... 86
4.4.1 Constant Composition Under Steady Shear ..................................................... 86
4.4.2 Varied Hard Segment Composition Under Oscillatory Shear ......................... 91
4.4.3 Comparison of Model Between Steady Shear and Oscillatory Shear.............. 94
4.5 Conclusions ............................................................................................................. 95
4.6 References ............................................................................................................... 97
4.7 Figures..................................................................................................................... 99
Chapter 5 : Effect of Soft-to-Hard Segment Ratio on Viscoelastic Behavior of Model
Thermoplastic Polyurethanes During Phase Transitions ................................................ 113
5.1 Abstract ................................................................................................................. 114
5.2 Introduction ........................................................................................................... 115
5.8 Figures................................................................................................................... 136
5.9 Tables .................................................................................................................... 146
Chapter 6 : Contribution of Inflow Conditions on Residence Time Output in Extrusion
Adapter Analysis ............................................................................................................. 147
7
6.1 Abstract ................................................................................................................. 148
6.2 Introduction ........................................................................................................... 149
6.3 Experimental ......................................................................................................... 152
6.3.1 Simulation Setup and Parameters .................................................................. 152
6.4 Results and Discussion ......................................................................................... 154
6.5 Conclusions ........................................................................................................... 160
6.6 References ............................................................................................................. 161
6.7 Figures................................................................................................................... 163
Bibliography ................................................................................................................... 172
8
List of Figures
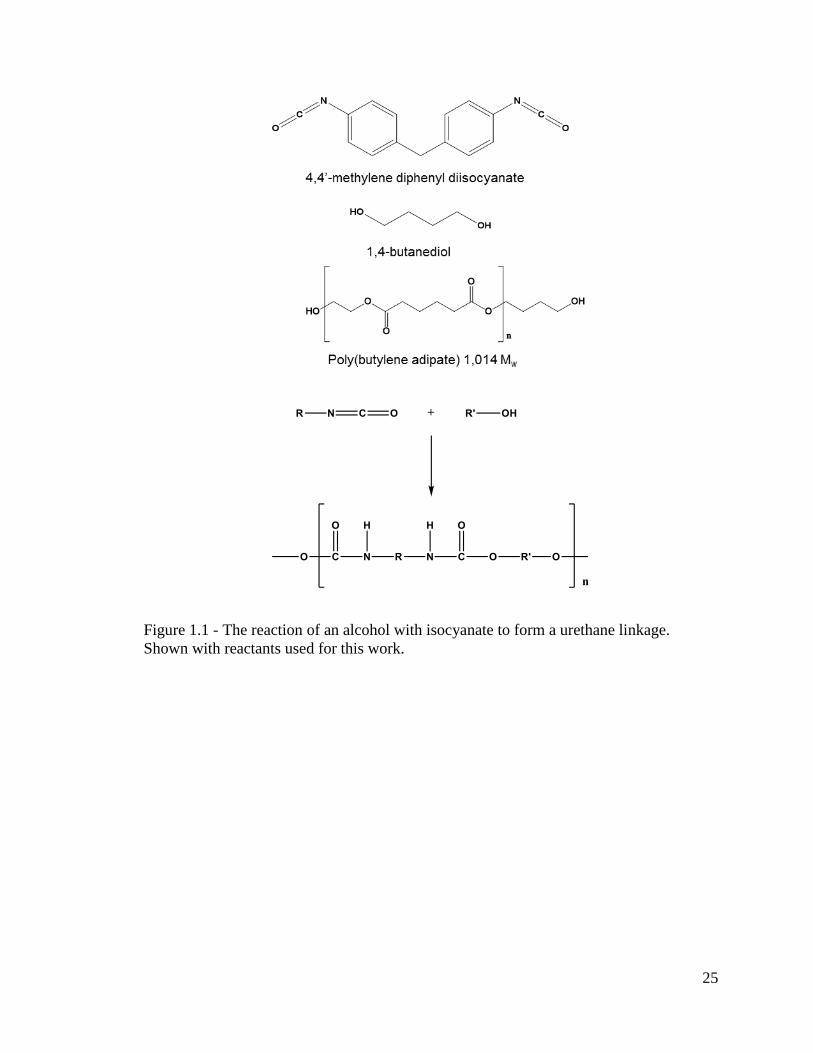
Figure 1.1 - The reaction of an alcohol with isocyanate to form a urethane linkage.
Shown with reactants used for this work. ......................................................................... 25
Figure 1.2 - Typical phase separated structured developed in multi-block TPU systems. 26
Figure 2.1 - Experimental procedure developed for performing polymerization
experiments on the rheometer. .......................................................................................... 43
Figure 2.2 – Example of FTIR spectra collected throughout rheology experiments (26.4%
HS shown). ........................................................................................................................ 44
Figure 2.3 – A) Comparison of G’ and G” during isothermal reaction of the three
compositions at 100 °C. Closed symbols represent G’ while open symbols represent G”.
B-D) Absorbance peak at 2260 cm-1 representing free isocyante consumption in 26.4 wt.
% HS, 36.8 wt. % HS, and 55.6 wt. % HS. ...................................................................... 45
Figure 2.4- Fitting for reaction constants on second order plot of the three compositions
at 100C. ............................................................................................................................. 46
Figure 2.5 - Comparison of G’ and G” during isothermal reaction of the three
compositions at 200 °C. Closed symbols represent G’ while open symbols represent G”.
........................................................................................................................................... 47
Figure 2.6– Second order reaction plots of free isocyanate consumption at 200 °C. ....... 48
Figure 2.7 – Shear viscosity versus time under isothermal conditions of 36.8 wt. % HS by
varying shear rate from 0.1 sec-1 to 20 sec-1. .................................................................... 49
Figure 2.8 – Second order reaction plots of free isocyanate consumption in the 36.8 wt. %
HS system at various shear rates. ...................................................................................... 50

9
Figure 3.1 - G' and G" plots during isothermal time study at 100 C of varying HS
content. .............................................................................................................................. 73
Figure 3.2 - FTIR waterfall plot demonstrating the data collected concurrently with
rheological measurements. ................................................................................................ 74
Figure 3.3 - Comparison of absorption bands throughout isothermal time study of 36.8
wt. % HS TPU................................................................................................................... 75
Figure 3.4 - Shift in wavenumber of carbonyl stretching peak throughout isothermal time
study. ................................................................................................................................. 76
Figure 3.5 - 1D WAXS plot at progressive time steps throughout the TPU reaction....... 77
Figure 3.6 Plot of SAXS data for the 36.8 wt.% HS sample with progressing reaction
time. .................................................................................................................................. 78
Figure 3.7 - Plot of increasing d-spacing with reaction time as a comparison between
multiple HS compositions. ................................................................................................ 79
Figure 4.1 - Viscosity versus time of 36.8 wt.% HS across a range of shear rates varying
from 0.1 sec-1 to 20 sec-1. .................................................................................................. 99
Figure 4.2 – Conversion versus time of 36.8 wt.% HS across a range of shear rates
varying from 0.1 sec-1 to 20 sec-1. ................................................................................... 100
Figure 4.3 Viscosity versus strain of 36.8 wt.% HS across a range of shear rates varying
from 0.1 sec-1 to 20 sec-1. ................................................................................................ 101
Figure 4.4 - Conversion versus strain of 36.8 wt.% HS across a range of shear rates
varying from 0.1 sec-1 to 20 sec-1. ................................................................................... 102
Figure 4.5 – Normalized viscosity versus conversion with fit using Equation 4.7. ....... 103
10
Figure 4.6 - Complex viscosity measured under oscillatory shear at 100 C for three
different hard segment compositions. ............................................................................. 105
Figure 4.7 – Normalized complex viscosity versus conversion for oscillatory shear
experiment at 100 °C. ..................................................................................................... 106
Figure 4.8 – Influence of total isocyanate consumed for compositions at 100C by
normalizing conversion by the initial concentration of NCO. ........................................ 107
Figure 4.9 - Viscosity versus time plot of polymerization under isothermal conditions at
200 C. .............................................................................................................................. 108
Figure 4.10 - Complex viscosity versus conversion for varied compositions under
oscillatory shear at 200 C. ............................................................................................... 109
Figure 4.11 - Master curve of complex viscosity versus conversion normalized by the
initial concentration of NCO in the system..................................................................... 110
Figure 4.12 - Comparison of viscosity versus conversion behavior between oscillatory
and steady shear experiments of 36.8 wt. % HS TPU. ................................................... 112
Figure 5.1 -DSC curves of TPUs with the endothermic peak become more pronounced
and shifted to higher temperatures with increase of HS. ................................................ 136
Figure 5.2 – Dynamic moduli versus time of TPUs at different temperatures: A) 26.4 wt.
% HS, B) 36.8 wt. % HS, and C) 55.6 wt. % HS where closed symbols represent G’, and
open symbols represent G” at each respective temperature. ........................................... 137
Figure 5.3 - Transient elongational viscosity pre-annealing data for A) TPU with 26.4%
HB at 100 °C, B) TPU with 36.8% HB at 150 °C, and C) TPU with 55.6% HB at 195 °C.
The dashed lines represent the linear viscoelastic envelope. .......................................... 139
Figure 5.4 - DSC curves for TPU samples before and after annealing. .......................... 140

11
Figure 5.5- SAXS patterns a) Comparison of differernt HS contentment and b) 36.8% HS
before and after annealing. .............................................................................................. 141
Figure 5.6 - WAXS before and after recrystallization of the 36.8 wt. % HS TPU. ........ 142
Figure 5.7 - Frequency sweep data after isothermal annealing for A) TPU with 26.4% HS
at 70 °C B) TPU with 36.8% HS at 150 °C, and C) TPU with 55.6% HS at 195 °C. .... 143
Figure 5.8- Transient elongational viscosity data after isothermal annealing for A) TPU
with 36.8% HB at 150 °C, and B) TPU with 55.6% HB at 195 °C. The dashed lines
represent the linear viscoelastic envelope. ...................................................................... 144
Figure 5.9- Top: Images of viscoelastic rupture under extensional flow (left) and a brittle-
like (right) for TPU with 36.8% HS. Bottom: Images of TPU with 36.8% after cessation
of flow before recrystallization (right) and after (left).................................................... 145
Figure 6.1 – 3D Model rendering of extrusion adapter used in simulation studies. ....... 163
Figure 6.2 – Extrusion adapter geometry showing meshed flow channel (A), inflow
boundary condition (B), zero wall velocity boundary surface (C), and outflow boundary
surface (D). ..................................................................................................................... 164
Figure 6.3 – Volume rendering of residence time (A), simplified inflow condition (B),
and velocity streamline plot (C). ..................................................................................... 165
Figure 6.4 – Helical inflow condition with Newtonian material characteristics (A) used to
generate a volume rendering of residence time (B), and velocity streamline plot (C). .. 166
Figure 6.5 - Helical inflow condition with PTT model material (A) used to generate a
volume rendering of residence time (B), and velocity streamline plot (C). ................... 167
Figure 6.6 – Depiction of purposely imbalanced inflow conditions based on material
exiting a counter-rotating twin screw extruder. .............................................................. 168

12
Figure 6.7 – Residence time volume rendering plot (A) shown with velocity streamline
plot (B) of an adapter with imbalanced inflow boundary conditions. ............................ 169
Figure 6.8– Comparison plot of material volume remaining versus residence time
between different adapter inflow boundary conditions. ................................................. 170
Figure 6.9 - Residence time distribution plots of various inflow conditions and material
models. ............................................................................................................................ 171
13
List of Tables
Table 2.1 – Rate constant comparison of three different composition TPUs under
isothermal conditions at 100 °C and 200 °C. .................................................................... 51
Table 2.2 - Rate viscosity buildup comparison between various shear rates of TPU under
isothermal conditions at 100 °C. ....................................................................................... 52
Table 2.3 – Rate constant comparison determined by FTIR of varied shear rates during
the formation of TPUs under isothermal conditions at 10 ................................................ 53
Table 3.1 - Comparison of transition time detected using FTIR and rheological
measurements. ................................................................................................................... 80
Table 4.1 - Fitting parameter comparison for model of TPU polymerization under steady
shear. ............................................................................................................................... 104
Table 4.2 - Fitting parameter comparison for model of TPU polymerization of varied HS
content under oscillatory shear. ...................................................................................... 111
Table 5.1– Molecular weight information of TPU before and after annealing. ............. 146
Table 6.1 - PTT Input Parameters for Simulations ......................................................... 154

14
Acknowledgments
I would like to start off by thanking my adviser, Dr. Joao Maia for providing me
with the opportunity to be a part of his research group. He has challenged me consistently,
introduced me to countless industrial projects, and supported all of my individual interest.
I can honestly say that he has had a significant impact on my development as a professional.
I would also like to thank my thesis committee: Dr. Gary Wnek, Dr. Michael Hore, and Dr.
Jesse Wainright for assisting me in the most crucial stages of this endeavor. From a
personal standpoint I would like to thank Dr. Lashanda Korley and Dr. David Schiraldi for
their guidance and support, specifically during some very challenging times.
Most importantly I would like to thank my family and friends for their support
throughout graduate school. I would not have made it this far if not for my friends,
especially Sid, Pat, Arman, Alex, Amanda, Stephen, and Nancy. I cannot stress enough
how important the support of my parents, Carrie and Terry, and my brother, Wayne, was
to my success. Without their help I certainly would not be where I am today.
Finally, I want to say thank you to my loving wife, Mahala, and daughter Paige.
Thank you for your support through all of the tough times and fun times alike. Finding
words to express my gratitude for putting up with me working late and all the stress of
these past five years is difficult. I love you both very much and look forward to all the
adventures we have ahead of us!

15
Abstract
Bulk Polymerization of TPU for Reactive Processing Using Rheo-FTIR
Jesse L. Gadley
Thermoplastic polyurethanes (TPUs) were studied to understand the complex
connection between changes in rheological characteristics and reaction behavior of bulk
polymerizations under flow. These materials are commonly produced using reactive
extrusion (REX) where the processing equipment is used as a reactor in which the
polymerizations take place. While under flow, the relationship between reaction progress,
melt viscosity, and processing conditions becomes very complex leading to difficulty in
targeting specific material properties and reproducibility. Generally, REX equipment is
viewed as a “black box” where carefully monitored reactants are added to the extruder, are
mixed in the presence of heat and shear, and the final product is then evaluated for the
desired results. While these systems have been the focus of significant research effort,
extending off-line experiments to processing conditions proves challenging by requiring
the inference of chemical behavior from rheological measurements or vice versa.
The focus of this work was to utilize simultaneous measurement of rheological
behavior and Fourier transform infrared spectroscopy (FTIR) to study the connection
between viscosity of the system and reaction kinetic behavior. First, an experimental
technique for monitoring bulk polymerization of TPUs in situ was developed. Using this
technique, the influence of hard to soft segment ratio within the TPU and the influence of

16
shear rate on these systems was investigated. This technique was also employed to study
the initial stages of polymerization and the potential influence of phase separation on the
development of mechanical properties throughout the reaction. The ability to
simultaneously measure changes in reactant concentration changes in time and viscosity
was then used to develop a model to connect conversion and viscosity under shear flow
conditions. Finally, the effect of thermal treatment on post processed materials were
studied under extensional flow. After processing, exposure to temperature near the phase
transition of the material resulted in changes in architecture and a subsequent change in
extensional flow properties. Overall, it was determined that varying hard to soft segment
composition resulted in a correlation between reaction rate, total isocyanate consumed
within the system, and final properties of the system. These TPU reactions also proved
sensitive to the shear rate applied due to the degree of mixing occurring during the reaction.
These observations provide important benchmarks moving forward when using TPUs in
reactive processing equipment. These results pave the way for future on-line studies of bulk
TPU polymerization processing methods.

17
Chapter 1 : Introduction

18
1.1 TPU Background
Polyurethanes (PU) are a class of polymers which contain urethane bonds as
linkages along the polymer backbone. Generally, the polyurethane bond results from the
reaction between isocyanate and a hydroxyl moiety. These materials are considered very
versatile due to a plethora a different diisocyanate and diol reactants to choose from,
providing access to a large array of potential polymer architectures. PUs are known for
their abrasion resistance, flexibility, and toughness which is conveniently tunable by
changing the chemical architecture of the system. While there are generally advantages
from a performance standpoint in application, many PUs are cross-linked thermosetting
resins. However, thermoset PUs lack processability and this restricts these materials to
casting techniques and reaction injection molding (RIM). While these materials are
undoubtedly useful, they are not recyclable and are application limited due to processing
technique compatibility.
In this work the PU subclass of materials, thermoplastic polyurethanes (TPUs), are
of primary interest. TPUs exhibit many of the advantages of polyurethanes while remaining
melt processable making them compatible with most traditional forming operations. These
materials typically exhibit properties somewhere between traditional rubber and plastic
materials currently on the market. In industry, TPUs are commonly produced through
reactive extrusion (REX) via bulk polymerization in the presence of shear and elevated
temperatures. These materials achieve these properties and process capability because they
are linear block copolymers rather than promoting crosslinking between polymer chains
with branching as occurs in traditional polyurethane materials. Instead of forming covalent
crosslinks, the TPUs form physical crosslinks through hydrogen bonding which occurs

19
between hard segments of adjacent chains. The high level of versatility in TPU systems
necessitate high precision process control to achieve the targeted product properties.
Typically, TPUs are produced through a step growth polymerization using a
diisocyante and two different diols as shown in Figure 1.1. The most commonly used
isocyanates consist of hexamethylene diisocyanate (HMDI), methylene diphenyl
diisocyante (MDI), and toluene diisocyanate (TDI). The isocyanate is reacted with a
mixture of short chain diols referred to as chain extender and a polyol which typically
ranges from 500 to 5,000 g/mol in molecular weight. The resultant material, when reacting
in a one-pot process, leads to a random distribution of isocyanates linked by either a very
short or very long chain yielding a segmented linear product. Consequently, the long
flexible soft segments (SS) and short rigid hard segments (HS) tend to phase separate into
soft and hard domains respectively. This phase separation usually results from an enthalpic
driving force due to chemical incompatibility between the HS and SS as shown in Figure
1.2. The hydrogen bonding between HS of adjacent polymer chains then act as physical
crosslinks which may be broken down by processing at temperatures above the order-
disorder temperature (ODT). TPUs owe their versatility and excellent mechanical
properties to this phase separated architecture. Through varying HS to SS content and the
relative level of flexibility within each phase, the phase separation behavior may be altered
drastically, thereby adjusting the ultimate performance of the system. Because of the near
limitless combinations of polyol molecular weights and chemical compositions that are
readily available, mechanical properties are readily tunable in TPU systems. While
versatility comprises the most significant advantage of TPUs, accessing the desired

20
properties through production of these materials in an efficient manner proves very
challenging.
1.2 Reactive Extrusion
The most common processing technique used to produce TPUs is reactive extrusion
(REX). Production through REX is a continuous process and has the capability of
producing larger volumes of material when compared to batch processes. This is
accomplished by feeding each of the reactants into the extruder separately under very
carefully metered conditions to ensure the correct stoichiometry is maintained throughout
the reaction. The reaction then proceeds due to the elevated temperature and mixing which
occurs within the extruder. The process is tuned to ensure the reaction completes prior to
exiting the die where the material is typically pelletized so it is usable in traditional forming
techniques for shaping into a final product. As a rule of thumb REX is most commonly
used for moderate to high reaction rate TPUs where slowly reacting systems are usually
limited to batch reaction type processes. In order to enhance the reaction rate for more
favorable extrusion conditions catalysts are commonly added to the extrusion process as
well. However, all of the materials used within this work were uncatalyzed systems which
react under heat and shear at a sufficient rate for reactive extrusion.
While the REX process is commonly implemented for production of TPUs, it is a
very complicated process. Reaching a target TPU composition using REX proves to be a
difficult task which is usually accomplished through experience of the operators. Because
of the complexity of these systems, producing them typically results in a very narrow
process window. Even though REX has economic and technical advantages over most
other polymerization methods, properly targeting the desired ultimate properties is
21
challenging. [1-4] The execution of tuning these processes typically result in a time
consuming and labor intensive endeavor driven by trial and error. [5] Since polymerization
drives the rheological behavior of these systems and these rheological properties in turn
drive the extrusion process, understanding the connection between the reaction progression
and subsequent changes of rheology is of the utmost importance to make the most of the
REX process.
1.3 Rheo-Kinetics of TPUs
While these materials have been heavily characterized for a multitude of reasons,
making connections to practice and between different measurement techniques proves
extremely difficult. Significant effort has been focused on understanding the chemical
reaction kinetics of TPUS and as a result their behavior has been well characterized.
Generally, TPUs are understood to follow second-order rate kinetics as shown in Equation
1.1. [6-8]
−𝑑[𝑁𝐶𝑂]
𝑑𝑡= 𝑘[𝑁𝐶𝑂][𝑂𝐻]
Equation 1.1
This equation is expressed in terms of the concentration of reactants (isocyanate
and hydroxyl groups) and a kinetic constant k. In order to connect this kinetic information
to a process, relationships between these rates, molecular weight, and subsequently
viscosity have been developed. It is known that the viscosity of a polymer in the melt state
is a function of shear rate, molecular weight, and temperature as shown by the relationship
depicted in Equation 1.2.

22
𝜂 = 𝑓(�̇�, 𝑀𝑤, 𝑇)
Equation 1.2
When considering a reactive system, particularly bulk polymerizations, all of these
variables change throughout production making the relationship between the viscosity and
reaction progress complicated. However, there are known relationships between viscosity
and the molecular weight that are also important to benchmarking reaction progress.
During polymerization of linear systems, the viscosity is proportional to the molecular
weight where the viscosity increases with molecular weight to the power 1 then increases
to the power 3.4 once entanglement molecular weight is reached.
𝜂 ∝ 𝑀𝑤𝑛
Equation 1.3
Further study of viscosity increasing over time has been shown to follow the
relationship in Equation 1.4. [1, 9, 10] Understanding how the viscosity is building directly
in time provides important insight to changes in the melt viscosity but is limited to specific
conditions and lacks a connection to the kinetics occurring during processing.
𝜂(𝑡) = 𝜂𝑜𝑒𝑘𝑛𝑡
Equation 1.4
The main scope of this work was to utilize a unique opportunity to simultaneously
measure chemical changes using Fourier transform infrared spectroscopy (FTIR) while
measuring viscosity under flow conditions. Using previously developed understanding of
these systems, the primary thrust of the work in this dissertation was to exploit this in situ
approach to help determine the connections linking viscosity changes over time and

23
consumption of reactants. These techniques hold promise for bridging the gap between
limited experimental techniques and bulk polymerization of TPUs in industrial processes.
1.5 Dissertation Scope
Chapter 2 focuses on developing a reliable experimental technique for the study of
bulk polymerization of TPUs. This chapter demonstrates the ability to produce reliable
results in these systems and determine potential connections between shear rate and
composition on rheo-kinetic behavior.
Chapter 3 focuses on a transition detected during the initial stages of bulk
polymerization of TPU. The relationship between early stages of the reaction and potential
influence of phase separation during the process was investigated.
Chapter 4 focuses on developing a model to connect viscosity of a TPU melt during
bulk polymerization and conversion as measured using FTIR. The influence of shear rate
on a single composition and the influence of varying composition were investigated. The
connection between these relationships and inconsistent viscosity buildup reported at high
conversions was investigated.
Chapter 5 focuses on the final properties of TPUs of various compositions. The
influence of post-processing and thermal treatment on extensional properties was
investigated.
Chapter 6 focuses on simulation techniques for extrusion adapters for use with
thermally sensitive materials. Various inflow conditions were coupled with Newtonian,
shear-thinning inelastic, and viscoelastic material models to investigate their influence on
residence time simulations.
24
1.6 References
[1] V. W. A. Verhoeven, A. D. Padsalgikar, K. J. Ganzeveld, and L. P. B. M. Janssen,
"A Kinetic Investigation of Polyurethane Polymerization for Reactive Extrusion
Purposes," Journal of Applied Polymer Science, vol. 101, pp. 370-382, 2006.
[2] J.-P. Puaux, P. Cassagnau, G. Bozga, and I. Nagy, "Modeling of Polyurethane
Synthesis by Reactive Extrusion," Chemical Engineering and Processing, vol. 45,
pp. 481-487, 2006.
[3] H. Madra, S. B. Tantekin-Ersolmaz, and F. S. Guner, "Monitoring of oil-based
polyurethane synthesis by FTIR-ATR," Polymer Testing, vol. 28, pp. 773-779,
2009.
[4] M. Szycher, Szycher's Handbook of Polyurethanes. Boca Raton: CRC Press,
1999.
[5] W. Michaeli, A. Greefenstein, and U. Berghaus, "Twin-Screw Extruders for
Reactive Extrusion," Polymer Engineering and Science, vol. 35, pp. 1485-1504,
1995.
[6] C. Hepburn, Polyurethane elastomers, 2nd ed. London ; New York
New York, NY, USA: Elsevier Applied Science ;
Sole distributed in the USA and Canada, Elsevier Science Pub. Co., 1992.
[7] G. G. Odian, Principles of polymerization, 4th ed ed. Hoboken, N.J.: Wiley, 2004.
[8] Z. Wirpsza and T. J. Kemp, Polyurethanes : chemistry, technology, and
applications. Chichester ; New York: E. Horwood, 1993.
[9] A. H. Navarchian, F. Picchioni, and L. P. B. M. Janssen, "Rheokinetics and effect
of shear rate on the kinetics of linear polyurethane formation," Polymer
Engineering and Science, vol. 45, pp. 279-287, Mar 2005.
[10] V. Sekkar, K. A. Devi, and K. N. Ninan, "Rheo-kinetic evaluation on the
formation of urethane networks based on hydroxyl-terminated polybutadiene,"
Journal of Applied Polymer Science, vol. 79, pp. 1869-1876, Mar 7 2001.
25
Figure 1.1 - The reaction of an alcohol with isocyanate to form a urethane linkage.
Shown with reactants used for this work.

26
Figure 1.2 - Typical phase separated structured developed in multi-block TPU systems.
Polyol
Chain Extender
Diisocyanate
Soft Segment Hard Segment
Hard Domain
Soft Domain

27
Chapter 2 : Rheo-Kinetic Study of Thermoplastic
Polyurethanes using In Situ FTIR Analysis
This chapter is partially based on:
Journal article:
J. L. Gadley and J. M. Maia Submitted (Polymer Testing)
28
2.1 Abstract
Thermoplastic polyurethanes (TPUs) are complicated yet highly versatile materials which
have greatly benefitted from the application of many characterization techniques for their
successful production. The focal point of this study was to utilize in situ FTIR (direct)
measurements concurrently with rheological (indirect) measurements to understand the
behavior of TPU reactions. Through the integration of these two methods chemical and
mechanical data were collected simultaneously and used to help eliminate potential short
comings of either technique alone. This work showed the combination of these
techniques indicates fundamental differences during the polymerization of different hard
segment (HS) ratio TPUs when using the same reactants. The complexity of these
systems were also showcased through studying a range of flow conditions within a single
composition which determined that these reactions are very sensitive to the shear rate
during the reaction. The results of this study indicated that the connection of information
between these direct and indirect measurement techniques provides a unique view of
these complex systems by permitting real time chemical changes to be compared to
viscosity development. This method provides a powerful tool for analyzing TPU systems
for industrial applications.

29
2.2 Introduction
Thermoplastic polyurethanes (TPUs) are commonly used materials which have
excellent versatility making them attractive for use across a broad range of applications.
These materials typically exhibit properties somewhere between traditional rubber and
plastic materials currently on the market. TPUs are known for their abrasion resistance,
flexibility, and toughness which is conveniently tunable by changing the chemical
architecture of the system. In industry, TPUs are commonly produced through reactive
extrusion (REX) via bulk polymerization in the presence of shear and elevated
temperatures.
The high level of versatility in TPU systems necessitate high precision process
control to achieve the targeted product properties. Because of the complexity of these
systems, producing them typically results in a very narrow process window. Even though
REX has economic and technical advantages over most other polymerization methods,
properly targeting the desired ultimate properties is challenging. [1-4] The execution of
tuning these processes typically result in a time consuming and labor intensive endeavor
driven by trial and error. [5]Since polymerization drives the rheological behavior of these
systems and these rheological properties in turn drive the extrusion process, understanding
the connection between the reaction progression and subsequent buildup of rheological
characteristics is of the utmost importance to make the most of REX processes.
Polyurethane reaction kinetics have been studied extensively through both direct
and indirect measurement techniques independently. Commonly, the direct methods used
to measure kinetics of these systems are Fourier transform infrared spectroscopy (FTIR)
and back titrations. [11, 12]Raman spectroscopy and NMR of these systems were studied
30
as well but much less commonly than the other direct methods. [13, 14]The sample
preparation process of these measurement methods is time intensive and sample
preparation quality radically affects the kinetic data collected. Furthermore, these
techniques are unable to directly measure these changes as they occur resulting in limited
practical relevance to industrial processes or bulk reactions. In order to circumvent some
of the aforementioned sample preparation issues it has been shown that FTIR in attenuated
total reflection (ATR) mode is capable of accurately capturing the consumption of free
isocyanate as confirmed by back titration [3, 15]
Indirect measurement techniques such as rheometry and differential scanning
calorimetry (DSC) are commonly pursued to study the reaction kinetics of these systems
due the simplicity of sample preparation and relevance to processing. While measuring
viscosity buildup is convenient and the kinetics of this process are crucial to understanding
the rheological transitions occurring to control processing, the high viscosity during
reaction in the bulk results in the inability to accurately estimate changes in functional
groups. [16]While direct measurement techniques, particularly in solvents, capture kinetics
much more accurately, it is known that bulk kinetics may be much different resulting in a
disconnect from predicted buildup of rheological properties. [14, 16, 17]In order to better
understand the reaction behavior under flow conditions in the melt state, the coupling of
both direct and indirect measurement techniques could provide feedback on changes in
rheological data with a direct connection to the chemical changes taking place.
The intent of this study was to use Rheo-FTIR to monitor the development of TPUs
under bulk reaction conditions. The combination of these techniques provide a unique
opportunity to monitor the consumption of free isocyanate within the system while

31
monitoring the changes in dynamic moduli in real time. The use of this method simplifies
the sample preparation procedure compared to that of traditional FTIR techniques.
Furthermore, performing the polymerization directly on the rheometer circumvents the
exposure of samples to additional thermal cycles which would alter the architecture or
reaction progress before measurements are attained.
This work consisted of a rheo-kinetic study using parallel plate rheometry in
tandem with in situ FTIR measurements collected under ATR mode. TPU reaction kinetics
were studied under small amplitude oscillatory shear (SAOS) and steady shear while
collecting FTIR measurements in real time. Bulk polymerization of TPUs containing 26.4
wt. %, 36.8 wt. %, and 55.6 wt. % HS was performed under isothermal conditions without
a catalyst. These compositions were achieved by varying the ratio of chain extender to
polyol in the system while maintaining a stoichiometric ratio of unity between hydroxyl
moieties and isocyanate groups. Varied HS content TPUs with the same reactants were
compared. The resulting changes in kinetic behavior were evaluated based on the
composition of a specific sample and the influence of different flow conditions were
investigated.
2.3 Experimental
2.3.1 Materials
The TPUs used in this study were polymerized through a bulk one-pot reaction
directly on the rheometer plate without the addition of a catalyst. The reaction was a three-
part system driven only by elevated temperatures to represent an uncatalyzed REX process
of a TPU system. The isocyanate component used was 4,4’-methylenedipenyl diisocyanate
(MDI) (Sigma Aldrich). The MDI was stored at -20 °C under a nitrogen blanket in a

32
desiccated vessel until immediately prior to use. The short chain diol used as a chain
extender was 1-4 butanediol (BDO) (Sigma Aldrich) which was stored in a sealed
container. The polyol component used was a poly(butylene adipate) with a molecular
weight of approximately 1000 g/mol. The polyol was stored as received in a sealed vessel.
2.3.2 On-Plate Polymer Synthesis
The on-plate reaction was performed by maintaining a 1:1 ratio of hydroxyl to free
isocyanate within the reaction mixture. Maintaining this ratio, the BDO to polyol ratios of
0.25:0.75, 0.50:0.50, and 0.75 :0.25 were used, resulting in 26.4 wt. %, 36.8 wt. %, and
55.6 wt. % HS respectively according to equation 1. The percentage of HS was calculated
by dividing the product of equivalent weights and number of equivalents of MDI and BDO
by the product of the total equivalent weight and number of equivalents of all three
components in the system.
𝐻𝑆% = 𝐸𝑞𝑊𝑡𝐻𝑆 ×𝐸𝑞𝐻𝑆
𝐸𝑞𝑊𝑡𝑇𝑜𝑡𝑎𝑙 ×𝐸𝑞𝑇𝑜𝑡𝑎𝑙 (2.1)
A metal ring was fixed to the bottom plate of the rheometer to create a reservoir and prevent
the initial low viscosity reactants from flowing out of the desired sampling area. The
bottom plate of the rheometer was set to the testing temperature and allowed to equilibrate
for 30 minutes. Once equilibrated the appropriate mass of polyol for the desired
composition was added to the testing fixture on the bottom plate and allowed to equilibrate
at temperature for 5 minutes. The appropriate volume of BDO was then added to the polyol
and stirred to provide a homogenous mixture of the diols. The MDI was added to the polyol
mixture and stirred briefly (less than 10 seconds). The reaction remained under isothermal
conditions for 1800 sec while rheological and FTIR measurements were taken.

33
2.3.3 Characterization
2.3.3.1 Rheology
Rheological experiments were conducted on a MARS III rheometer (Thermo
Scientific) using a round 20 mm stainless steel parallel plate as the testing geometry. These
experiments were carried out under isothermal conditions at temperatures of 100 °C and
200 °C. These two temperatures were chosen in order to demonstrate differences in the
bulk reaction behavior based on different levels of viscosity increase. First, an amplitude
sweep was performed on only the two diols (lowest viscosity material during the time
sweep) and on a fully reacted sample (highest viscosity experienced throughout
experiment) and a stress value of 100 Pa was chosen to ensure the experiment remained
within the linear viscoelastic regime (LVR) for its entirety. Using the stress within the
LVR, isothermal time sweeps were performed at a constant frequency of 6.28 rad/sec for
a total time interval of 1800 sec. In addition, these systems were studied under isothermal
steady shear at shear rates of 0.1, 1.0, 5.0, 10.0, 15.0, and 20.0 s-1 to probe the influence of
shear rate on the reaction kinetics of the system. All rheometry experiments were
performed at a gap height of 1.0 mm. The experimental procedure developed for this work
is shown in Figure 2.1.
2.3.3.2 In Situ FTIR
The in situ FTIR experiments were performed using the Rheonaut module (Thermo
Scientific). The Rheonaut is a bottom plate assembly for the rheometer that allows for
electrically controlled heating and collection of FTIR data in ATR mode. The ATR window
used for all experiments was a single reflection diamond crystal. The detector used in the
Rheonaut module was a mid-infrared region deutereated triglycine sulfate (DTGS) detector

34
with as spectral detection range of 400 – 4,000 cm-1. Prior to each experiment a background
scan was collected for use as a reference. During the rheometry experiments, at time zero
an FTIR scan was collected prior to any exposure of the system to oscillation or steady
shear. Immediately after the first scan the rheological measurements were started.
Throughout the duration of the experiment, FTIR spectra were collected continuously
using an instrument resolution setting of 32 on 16 scans per collection period. Under these
conditions an FTIR spectrum was collected approximately every 4 secs.
2.4 Results and Discussion
Typically, the peak positions of interest in IR spectra for TPU systems have
absorption bands located at approximately 1520 cm-1, 1720 cm-1, and 3340 cm-1. These
peaks correspond to amide II stretching associated with a urethane bond, carbonyl bending,
and N-H stretching respectively. In this study, the absorption band at 2260 cm-1 associated
with unbonded isocyanate was of primary interest. It has previously been demonstrated
that FTIR-ATR is a capable alternative to using back titration when tracking the
consumption of free isocyanate.[3] The spectra shown in Figure 2.2 is representative of the
data collected in situ during each isothermal rheological study. The resulting data is a
cascade plot with an IR spectrum collected every 4 sec. A cascade plot similar to Figure
2.2 was generated for each rheological experiment performed and analyzed to track the
consumption of free isocyanate within the system.
The storage modulus (G’) and loss modulus (G”) of the system was tracked over
time under isothermal conditions while maintaining a constant frequency of 6.28 rad/s. The
data shown in Figure 2.3 depicts the buildup of the dynamic moduli as the reaction was
progressing on the rheometer at 100 °C. The plot clearly shows an increase in both G’ and
35
G” approaching a plateau indicating the reaction was either completed or had become
inhibited by a diffusion limited state due to the high viscosity values reached. Further
investigation showed a free isocyanate remained in the system indicating that these
reactions did not reach 100% completion and the samples solidified throughout the
experiment indicating that the reaction had halted due to high viscosity. However, these
experiments still captured the kinetic behavior of the systems while the reaction persisted.
The rheological data showed a distinct difference in the progression of the reaction based
on changes in composition of the system. The moduli in Figure 2.3 indicates that as the HS
content in the system was increased, the reaction rate increased as was indicated by
plateauing earlier and by the difference in slope during the reaction period.
The trend of increasing viscosity at a higher rate was attributed to a localized
concentration effect. Although the isocyanate and hydroxyl groups were reacted at a 1:1
ratio, while trending toward a higher targeted HS content, the volume of BDO present in
the system compared to polyol is much greater. The higher concentration of BDO resulted
in a lower average distance between reactants promoting a higher rate of reaction as well
as a higher required amount of isocyanate within the system to balance the stoichiometric
ratio of the reactants while maintaining a constant sample volume for the experiment.
Considering the lowest HS content sample, it is then intuitive that increasing the polyol to
BDO ratio necessitates a reduction in isocyanate reactive groups to balance the
stoichiometry thereby reducing the effective concentration of the system and the rate of the
reaction. The increase in reaction rate with increasing HS of the same system has
previously been observed and attributed to the average distance between reactive groups
within the system.[16]
36
The FTIR data was analyzed in order to determine the kinetic parameters of these
samples. The change in the absorbance band of free isocyanate is plotted in Figure 2.4. The
reaction between aromatic isocyanates and polyester polyols are typically reported as
following second order reaction kinetics. [18-20] Therefore, the absorbance peak heights
of the 2260 cm-1 band were plotted after normalizing the absorbance as a function of time
(At) with the initial absorbance (Ao). This assumed that the initial measurement prior to
any rheological testing was representative of zero reaction progress or at least a small
enough reaction progression to remain negligible. Using this method (Ao/At) – 1 was
plotted as a function of time which is representative of a second order rate plot. The second
order rate plots are shown in figure 3B-D. These plots show a clear trend that increasing
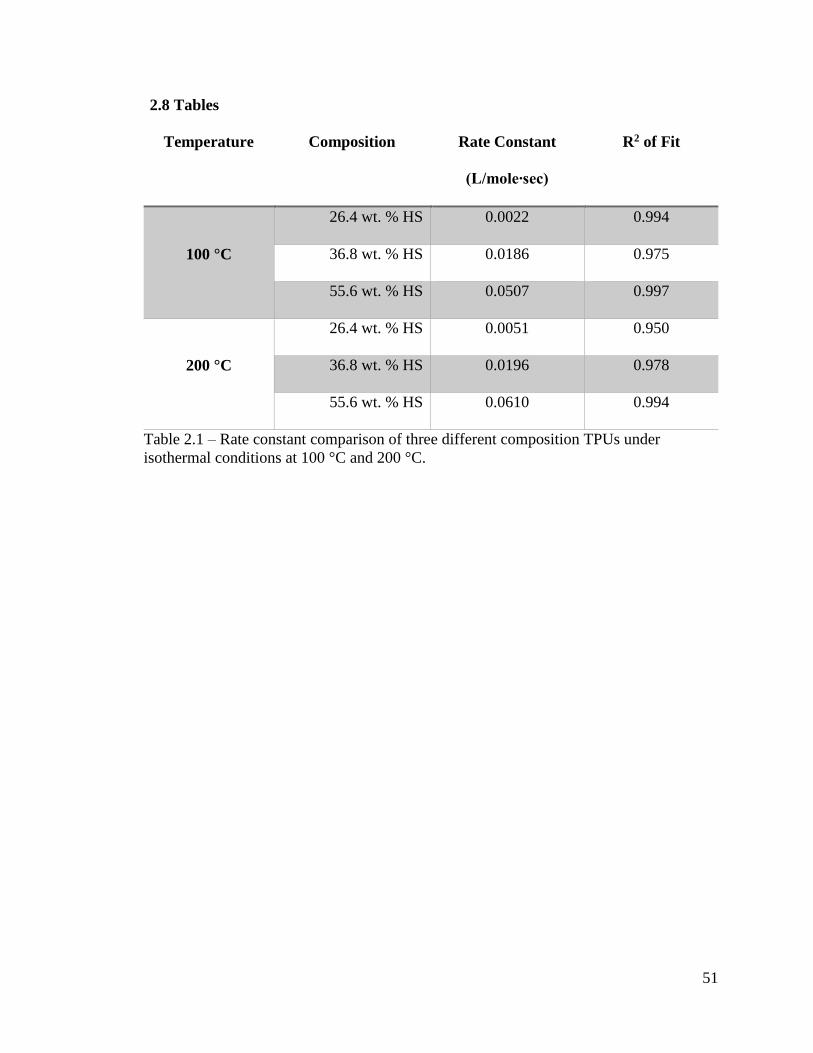
the HS content of the system increases the rate of the reaction. The reaction rate constants
from the linear regression shown on the plots are listed in Table 2.1. Prior to the linear
behavior of the reaction a region exists which appears to have a very low reaction rate or
even no reaction progression until a certain time. Discontinuity such as this has been
reported and was usually attributed to complex changes in the reaction conditions or
differential reactivity between system components. [3] This appears to act as an induction
period related to the amount of HS component added as evident by the longer time with
the increase in polyol content. Additionally, the samples at 100 °C reacted and transitioned
to a solid material with a melting temperature above the temperature of the reaction. This
inevitably lead to an incomplete reaction and increased complexity due to the liquid to solid
transition occurring.
In order to further understand the applicability of in situ FTIR analysis coupled with
rheometry, the experiments were repeated at 200 °C at a temperature above the order-

37
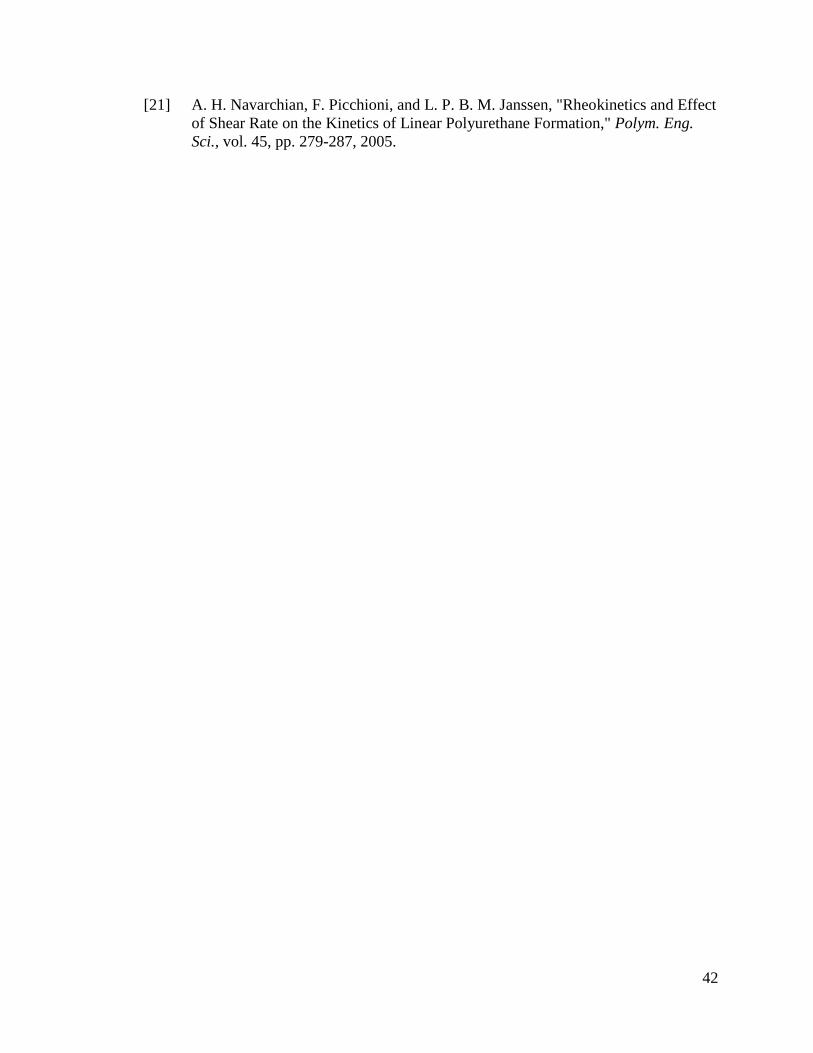
disorder temperature (ODT) of the final material. The SAOS experimental results are
shown in Figure 2.5. The results indicate a similar trend that demonstrates an increase in
HS content within the system causes the material to react more rapidly, achieve a higher
modulus value, and reach a plateau modulus earlier. However, under these conditions the
26.4 wt. % and 36.8 wt. % HS reached a completion percentage greater that 99% and the
55.6 wt. % reached a value of approximately 92%. The lower completion of the highest
HS content system was likely due to the higher viscosity and closer relative vicinity to the
Tm of the material inhibiting the reaction in the final stages.
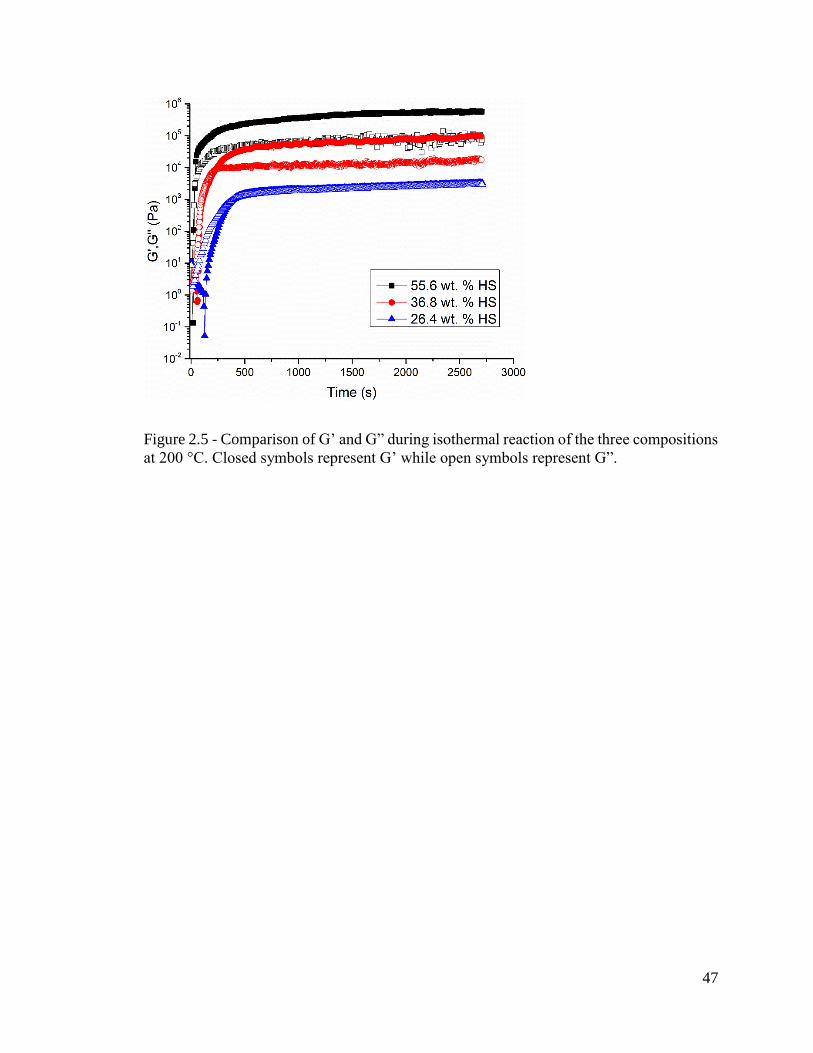
The FTIR results treated in the same fashion as at lower temperature are shown in
Figure 2.6. The first observation noted with the 200 °C samples was the lack of lower rate
stage induction period of the reaction. Under these conditions the reaction follows a second
order rate relationship from time zero. This is either a result of a more homogenous system
at the higher temperatures and less preference between reactive components or simply that
the reaction progresses too rapidly to detect any onset behavior under the experimental
conditions. A clear deviation from second order kinetics was observed once the viscosity
increased to a high enough value which is consistent with previous kinetic studies on bulk
systems. [3] Because of the discontinuity, the calculated rate constants were based solely
on the initial buildup of the reaction while a linear increase in storage modulus was still
occurring. The rate constants obtained are shown in Table 2.1.
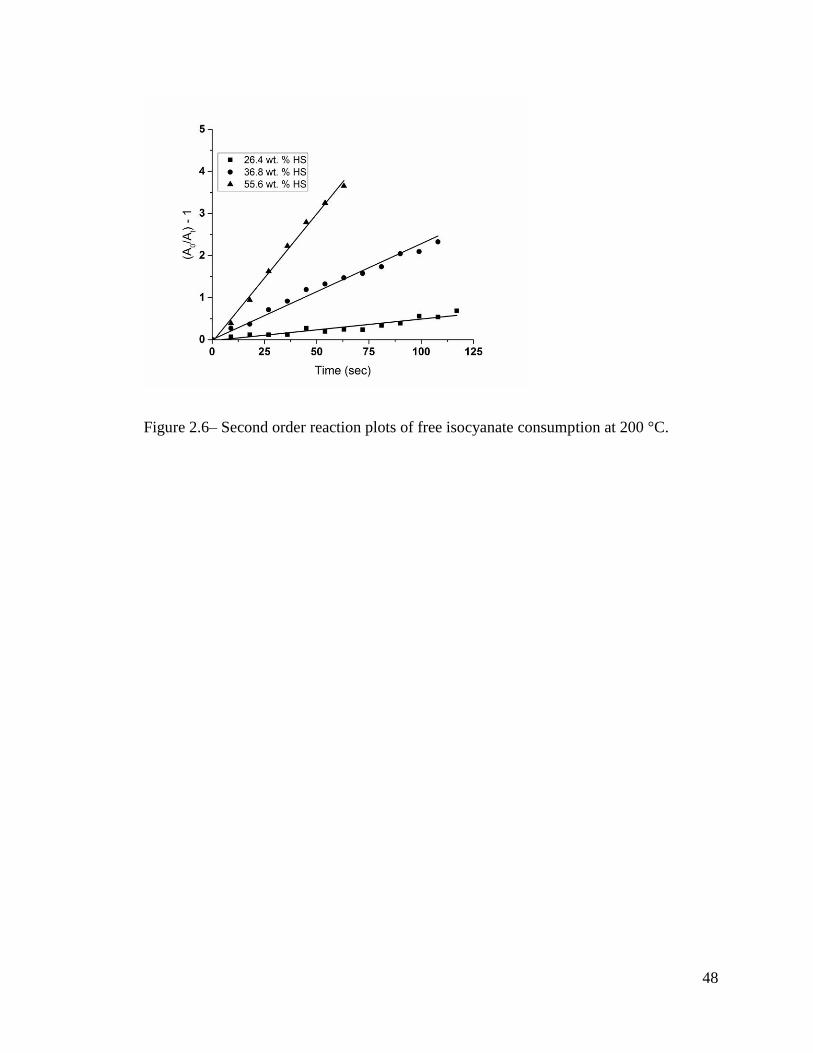
The influence of steady shear on the reaction behavior was investigated by
performing simultaneous collection of FTIR spectra and rheological data while
maintaining a shear rate ranging from 0.1 sec-1 to 20 sec-1 using the same setup as was
studied under oscillation. To understand the effect of shear, the composition of the system

38
remained constant. The 36.8 wt. % HS system specifically was utilized due to the moderate
melting temperature and rate of reaction observed under oscillatory conditions. The
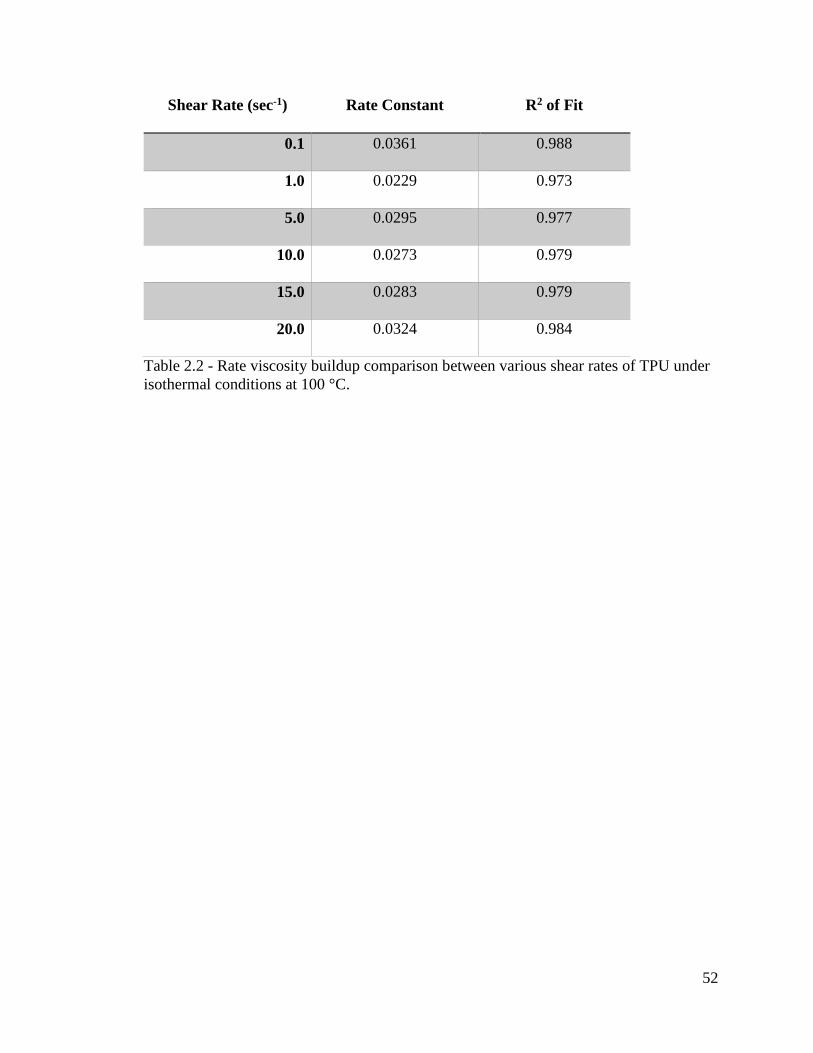
samples were exposed to isothermal steady shear conditions and buildup of viscosity was
tracked as shown in Figure 2.7. The initial slope was regarded as representative of the
reaction behavior to avoid an increasingly complex system as the viscosity reaches
relatively high values. Generally, the viscosity values follow a first order relationship with
time which is supported by previous studies associated with polyurethane formation.[21]
The rate of viscosity change is summarized in Table 2.1 which indicates little to no
variation in viscosity increase with increasing shear rate within the error of measurement.
These results suggest that the influence of flow conditions on the initial stages of the
reaction over a relatively small range in shear rate is minimal and the viscosity buildup
behavior does not change appreciably during these stages. This was attributed to the low
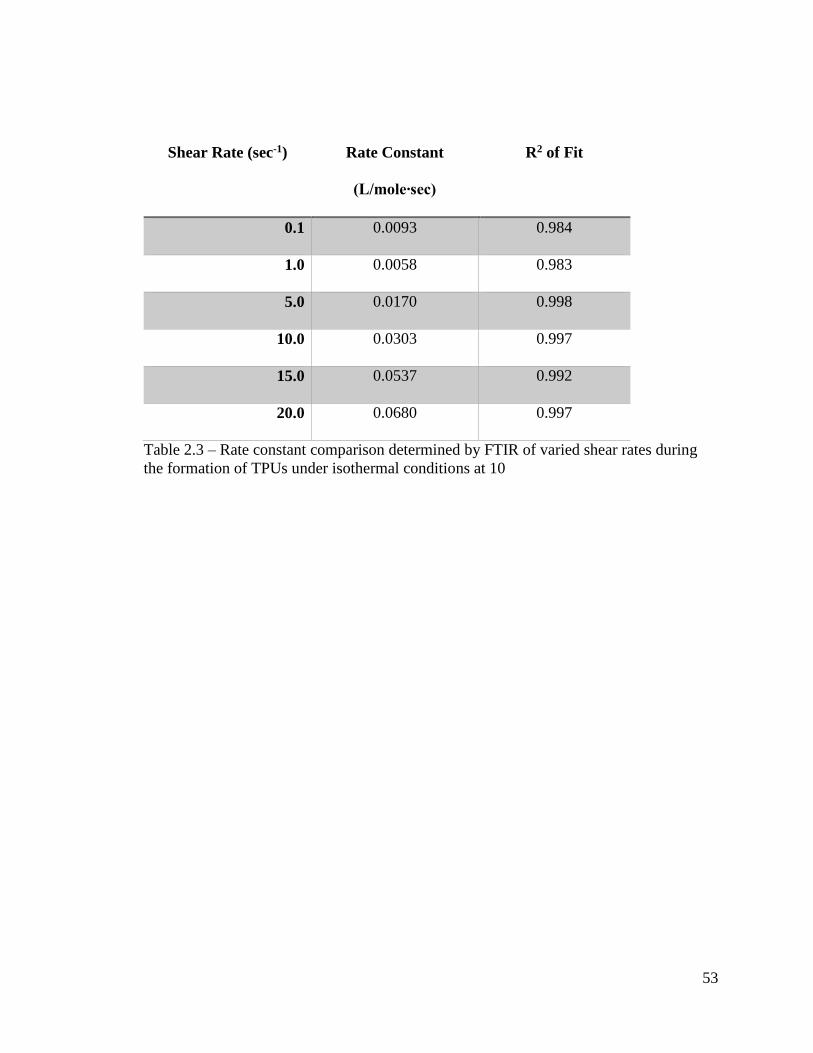
molecular weight likely generated throughout this period. FTIR data was collected
concurrently with these measurements and the consumption of free isocyanate was tracked.
The second order rate plots associated with isocyanate consumption are shown in Figure
2.8. Interestingly, this data indicates a strong dependence on the shear rate within the
system. The rate of this process is displayed in Table 2.3. This enhancement in reaction
rate was attributed to better mixing of the reactants through mechanically promoting their
diffusion to the reaction interface. The reactions in the initial stages still appears to follow
second order kinetics but indicate no induction period as was noted in the oscillatory
experiments suggesting that flow is more efficiently starting the reaction when compared
to the quasi-quiescent conditions of the oscillatory experiments. Furthermore, the FTIR
results suggest a significant change in reactant consumption as a function of shear value

39
which was undetectable through solely studying the rheological data. A shift to increased
reaction rate at higher shear rates ultimately related to different viscosity buildup
characteristics. By increasing the shear rate the viscosity increased more rapidly and
reached different final viscosity values. Considering these results, the FTIR has a higher
level of sensitivity at low viscosity values during the initial stages of the reaction.
Conversely, due to complications concerning penetration depth of the IR beam and
complexities in the bulk as viscosity reaches high values, the rheological measurements
likely provide more useful information after a threshold in reaction progress has been
reached. This behavior suggests that changes in flow conditions, although indistinguishable
in viscosity data, could affect the reaction’s progress ultimately leading to an altered final
architecture as evident by reaching different viscosity plateau values. Therefore, through
connecting direct and indirect measurement techniques simultaneously, new perspective is
gained when considering complex materials such as TPUs.
2.5 Conclusions
The work conducted within this study demonstrated the capability of a rheo-FTIR
system to track bulk reaction kinetics in a complicated TPU system. This technique showed
promise for understanding the effect of compositional changes within these systems and
sensitivity to adjustments in the flow environment during polymerization. Concerning
compositional changes, this work demonstrated that increasing HS content from 26.4 wt.
% to 55.6 wt. % HS resulted in an increased rate of polymerization, a decreased
polymerization time, and an increase in dynamic moduli. These results demonstrate the
complexity of TPUs and their reliance on precise control of reactants to achieve the desired
final product. In addition, the results indicate the complex relationship between reaction

40
rate and rheological response which must be understood to increase efficiency of their
production through reactive extrusion.
While maintaining a constant composition this study also indicated a change in flow
conditions has the potential to alter bulk reaction behavior even across a very small range
of shear rate. Changes in shear rate effect the rate at which reactants can interact due to
changes in mixing, ultimately affecting the reaction behavior of the system. Under these
conditions the FTIR proved more sensitive to changes, particularly in the early stages of
the reaction. Therefore, the advantage of simultaneously collecting FTIR and rheological
data on reactive systems is realized to enhance the overall picture associated with complex
changes taking place in the bulk. While these techniques are independently capable of
granting information on reactive TPU systems, the combination of direct and indirect
techniques provides the unique advantage of collecting all of the information under
precisely the same conditions in real time.
41
2.6 References
[1] V. W. A. Verhoeven, A. D. Padsalgikar, K. J. Ganzeveld, and L. P. B. M. Janssen,
"A Kinetic Investigation of Polyurethane Polymerization for Reactive Extrusion
Purposes," Journal of Applied Polymer Science, vol. 101, pp. 370-382, 2006.
[2] J.-P. Puaux, P. Cassagnau, G. Bozga, and I. Nagy, "Modeling of Polyurethane
Synthesis by Reactive Extrusion," Chemical Engineering and Processing, vol. 45,
pp. 481-487, 2006.
[3] H. Madra, S. B. Tantekin-Ersolmaz, and F. S. Guner, "Monitoring of oil-based
polyurethane synthesis by FTIR-ATR," Polymer Testing, vol. 28, pp. 773-779,
2009.
[4] M. Szycher, Szycher's Handbook of Polyurethanes. Boca Raton: CRC Press,
1999.
[5] W. Michaeli, A. Greefenstein, and U. Berghaus, "Twin-Screw Extruders for
Reactive Extrusion," Polymer Engineering and Science, vol. 35, pp. 1485-1504,
1995.
[11] S. Ajithkumar, S. S. Kansara, and N. K. Patel, "Kinetics of Castor Oil Based
Polyol-Toluene Diisocyanate Reactions," European Polymer Journal, vol. 34, pp.
1273-1276, 1998.
[12] I. Yilgor, B. D. Mather, S. Unal, E. Yilgor, and T. E. Long, "Preparation of
segemented, high molecular weight, aliphatic poly(ether-urea) copolymers in
isopropanol. In-situ FTIR studies and polymer synthesis," Polymer, vol. 45, pp.
5829-5836, 2004.
[13] S. Parnell, K. Min, and M. Cakmak, "Kinetic Studies of Polyurethane
Polymerization with Raman Spectroscopy," Polymer, vol. 44, pp. 5137-5144,
2003.
[14] C. Dubois, S. Desilets, A. Ait-Kadi, and P. Tanguy, "Bulk Polymerization of
Hydroxyl Terminated Polyubutadiene (HTPB) with Toluene Diisocyanate (TD):
A Kinetics Study using 13C-NMR," Journal of Applied Polymer Science, vol. 58,
pp. 827-834, 1995.
[15] D. Kincal and S. Ozkar, "Kinetic Study of the Reaction Between Hydroxyl-
Terminated Polybutadiene and Isophorone Diisocyanate in Bulk by Quantitative
FTIR Spectroscopy," Journal of Applied Polymer Science, vol. 66, pp. 1979-
1983, 1997.
[16] V. Sekkar, K. Ambika, and K. Ninan, "Rheo-kinetic Evaluation on the Formation
of Urethane Networks Based on Hydroxyl-Terminated Polybutadiene," Journal of
Applied Polymer Science, vol. 79, pp. 1869-1876, 2001.
[17] O. Gunter, Polyurethane Handbook. Munich: Hanser Publishers, 1985.
[18] L. L. Ferstandig and R. A. Scherrer, "Mechanism of Isocyanate Reactions with
Ethanol," Journal of American Chemical Society, vol. 81, pp. 4838-4842, 1959.
[19] H. G. Wissman, L. Rand, and K. C. Frisch, "Kinetics of Polyether Polyols-
Diisocyanate Reactions," Journal of Applied Polymer Science, vol. 8, pp. 2971-
2978, 1964.
[20] M. Gambiroza-jukic, Z. Gomzi, and H. J. Mencer, "Kinetic Analysis of Bulk
Polymerizatio of Diisocyanate and Polyol," Journal of Applied Polymer Science,
vol. 47, pp. 513-519, 1993.
42
[21] A. H. Navarchian, F. Picchioni, and L. P. B. M. Janssen, "Rheokinetics and Effect
of Shear Rate on the Kinetics of Linear Polyurethane Formation," Polym. Eng.
Sci., vol. 45, pp. 279-287, 2005.

43
2.7 Figures
Addition of polyol onto
rheometer plate BDO added Polyol + BDO mixed
MDI added Experiment begins immediately
Figure 2.1 - Experimental procedure developed for performing polymerization
experiments on the rheometer.

44
Figure 2.2 – Example of FTIR spectra collected throughout rheology experiments (26.4%
HS shown).

45
Figure 2.3 – A) Comparison of G’ and G” during isothermal reaction of the three
compositions at 100 °C. Closed symbols represent G’ while open symbols represent G”.
B-D) Absorbance peak at 2260 cm-1 representing free isocyante consumption in 26.4 wt.
% HS, 36.8 wt. % HS, and 55.6 wt. % HS.

46
Figure 2.4- Fitting for reaction constants on second order plot of the three compositions at
100C.
47
Figure 2.5 - Comparison of G’ and G” during isothermal reaction of the three compositions
at 200 °C. Closed symbols represent G’ while open symbols represent G”.
48
Figure 2.6– Second order reaction plots of free isocyanate consumption at 200 °C.
49
Figure 2.7 – Shear viscosity versus time under isothermal conditions of 36.8 wt. % HS by
varying shear rate from 0.1 sec-1 to 20 sec-1.

50
Figure 2.8 – Second order reaction plots of free isocyanate consumption in the 36.8 wt. %
HS system at various shear rates.
51
2.8 Tables
Temperature Composition Rate Constant
(L/mole∙sec)
R2 of Fit
100 °C
26.4 wt. % HS 0.0022 0.994
36.8 wt. % HS 0.0186 0.975
55.6 wt. % HS 0.0507 0.997
200 °C
26.4 wt. % HS 0.0051 0.950
36.8 wt. % HS 0.0196 0.978
55.6 wt. % HS 0.0610 0.994
Table 2.1 – Rate constant comparison of three different composition TPUs under
isothermal conditions at 100 °C and 200 °C.
52
Shear Rate (sec-1) Rate Constant R2 of Fit
0.1 0.0361 0.988
1.0 0.0229 0.973
5.0 0.0295 0.977
10.0 0.0273 0.979
15.0 0.0283 0.979
20.0 0.0324 0.984
Table 2.2 - Rate viscosity buildup comparison between various shear rates of TPU under
isothermal conditions at 100 °C.
53
Shear Rate (sec-1) Rate Constant
(L/mole∙sec)
R2 of Fit
0.1 0.0093 0.984
1.0 0.0058 0.983
5.0 0.0170 0.998
10.0 0.0303 0.997
15.0 0.0537 0.992
20.0 0.0680 0.997
Table 2.3 – Rate constant comparison determined by FTIR of varied shear rates during
the formation of TPUs under isothermal conditions at 10
54
Chapter 3 : Investigation of Rheological Behavior
During Onset of Thermoplastic Polyurethane Reactions
This chapter is partially based on:
Journal article:
J. L. Gadley and J. M. Maia Submitted (Rheologica Acta)

55
3.1 Abstract
The reaction conditions during thermoplastic polyurethane (TPU) polymerizations
have a complex relationship with the structural buildup within the system. Particularly,
during the initial stages of the reaction the rheological response is difficult to connect with
the reaction behavior. During these stages a sharp decrease in storage modulus (G’) was
detected. In order to understand the implications of this behavior on the developing TPU
system rheo-FTIR studies were performed. The aim of this work was to understand the
implication of the detected transition in G’ through connecting rheological and
spectroscopic measurements under precisely the same flow conditions. In doing so it was
determined that this transition is related to the onset of phase separation within the system
during competition in diffusion between reactants. The combination of these techniques
determined the transition in G’ could prove useful as a marker in understanding the
complex interactions occurring in the initial stages of TPU reactions which ultimately
dictates the architecture formed in these systems.
56
3.2 Introduction
One of the major challenges when manufacturing TPUs is achieving the desired
material composition during polymerization. Typically, TPUs are produced via reactive
extrusion (REX) which provides continuous output of material that is then capable of being
molded into a final product through most forming processes. However, the REX process is
very sensitive to any variation in stoichiometry which is only controlled by inflow
conditions of multiple reactants into the extruder. Since polymerization drives the
rheological behavior of these systems, and these flow properties dictate the proper
production conditions, the relationship between the extrusion process and material
properties quickly become extremely complex. Understanding the rheo-kinetic behavior of
these systems during the complex conditions present with increasing viscosity with
increased conversion would be highly beneficial for industrial applications.
Generally, synthesis of TPUs consist of a three-part system containing a
diisocyanate, low Mn diol, and a telechelic diol of a much higher Mn that is commonly
referred to as a polyol. Introducing a mixture of vastly different sized molecules results in
a system where under certain conditions the short chain diol has a relatively high diffusivity
when compared to the polyol which is expected to diffuse more slowly due to its size. This
is a direct result of a competition between reaction rate and mass transfer of reactants to
the reaction interface as well as products away from the reaction interface. [22, 23]
Consequently, these short chain diols can under certain conditions react much more readily
with the diisocyanate. In doing so they create the rigid portion of the polymer backbone,
termed a hard segment (HS), while the reaction product of the polyol and the diisocyanate
represents a flexible soft segment (SS) within the multiblock copolymer chain that is

57
generated. A unique architecture is then attainable through microphase separation which
results in a system comprised of urethane rich hard domains and polyol rich soft domains
that form via enthalpically unfavorable processes due to chemical incompatibility between
the HS and SS in the system. [24, 25] TPUs thus attain their high level of versatility from
the formation of a phase separated system comprised of hard and soft domains. The final
structure and mechanical behavior of TPU systems depend on a multitude of factors
including the HS to SS ratio, the distribution of these segments, molecular weight,
molecular weight distribution, hydrogen bonding and the chemical compatibility between
hard and soft phase. [26-30] These complex structures and subsequent relationship to
mechanical properties are reliant upon the reaction environment and processing to which
these materials are exposed during their formation. More specifically the different
conditions and configurations under which the reactants of these systems are permitted to
interact have shown drastically different reaction behavior and even final properties. Most
notably the microaggregation structure which occurs during a TPU reaction has been
studied and shown to be highly dependent on the reaction environment and interactions
between reactants of differing diffusivity. [31]
Various studies have been performed to enhance understanding of these TPUs
systems using different measurement techniques, including Fourier transform infrared
spectroscopy (FTIR), back titrations, Raman spectroscopy, nuclear magnetic resonance
(NMR), rheology, and differential scanning calorimetry (DSC). [9, 10, 32-36] While in
their own respect, each technique provides insightful information into the progress of TPU
reactions, rheological measurements are of particular interest in this work due to the
relevance to processing of these materials. Specifically, for studying bulk systems,

58
rheology is capable of tracking buildup of mechanical properties throughout the reaction.
Additionally, FTIR operated under attenuated total reflectance (ATR) mode has been
verified to accurately detect reaction progress through monitoring consumption of free
isocyanate in bulk polyurethane (PU) reactions. [33, 37] Under bulk polymerization
conditions, TPUs are typically viewed as second order reactions but is not always the case
due to complex shear scenarios and variations in reaction temperature. [38, 39] While many
studies have shown a relationship between rheological properties and polymerization
conditions, much less attention has been directed at understanding rheology during
polymerization processes. [40] In this work, we take advantage of a unique opportunity to
combine FTIR-ATR measurements with rheology through performing in situ experiments.
Using this method on a three component system, the chemical changes occurring were
detected in real time while tracking the buildup of mechanical response.
During rheo-kinetic studies of polyurethane systems, an abrupt drop in elastic
modulus (G’) causing an early peak in loss tangent (tan δ) has been observed and attributed
to onset of gelation in a thermoset system. [41-44] Through in situ study of a linear TPU
system the combination of ATR and mechanical response provides the opportunity to better
understand the transitions noted in the early stages of the reaction. Gaining a more complete
picture of reaction development during bulk polymerization enables a more accurate
targeting of compositional goals for end use. Due to the complexity of TPU systems,
accurately controlling morphology and HS composition poses a constant challenge in
application. Understanding the reaction progression even in the very early stages ultimately
provides an enhanced toolkit for use in developing these systems.
59
In order to understand the origin of the early peak in tan δ multiple wt. % HS
containing TPUs were studied. Small amplitude oscillatory shear (SAOS) was used to
measure the progress of the reaction while simultaneously collecting FTIR spectra in ATR
mode. The combination of these two techniques enabled for direct comparison of two
measurement techniques instead of relying upon one signal to speculate the cause of the
rheological transition detected in G’ in the early stages of the reaction. Complimentary to
this work, wide angle x-ray scattering (WAXS) and small angle x-ray scattering (SAXS)
synchrotron radiation experiments were performed at intervals throughout the reaction
connect structural development occurring in the system with the mechanical and chemical
data collected. Through the combination of these techniques a unique view of changes
occurring rapidly during the onset of the TPU reaction was attainable.
3.3. Experimental
3.3.1 Materials
The system studied in this work was a three-part system representative of a TPU
system commonly used in industry for reactive extrusion applications. The reactions were
performed directly on the bottom plate of the rheometer under isothermal conditions at
elevated temperature. These TPUs were polymerized as an uncatalyzed system in bulk as
a one-pot reaction. This particular system consisted of a diisocyanate, a chain extender
(short chain diol) and a polyol (long chain diol). The diisocyanate used for this study was
4-4’ methylenediphenyl diisocyanate (MDI) (Sigma Aldrich). The polyol utilized in this
system was poly(butylene adipate) with an Mn of approximately 1000 g/mol. The chain
extender used was 1-4 butane diol (BDO) (Sigma Aldrich). The MDI was stored under
nitrogen at -20 °C until prior to use for the experiment. The polyol was stored in a sealed
60
container then placed in a vacuum oven at 80 °C for 8 hours prior to use. The BDO was
stored in a sealed container in a desiccated vessel until immediately prior to use.
The on-plate synthesis of TPUs was executed by targeting different wt.% HS
compositions through varying the ratio of polyol to BDO in the system while maintaining
a stoichiometric ratio of unity between the available hydroxyl groups and free isocyanates
in the system. TPUs containing HS contents of 100 wt. %, 55.6 wt. %, 36.8 wt. %, 26.8 wt.
%, and 19.6 wt. % were synthesized through individual isothermal reactions on the
rheometer. These targeted HS contents were calculated by determining the product of the
equivalent weight and number of equivalents of MDI and BDO then dividing this value by
the product of the summation of equivalents in the system and total equivalent weight of
the system. In order to achieve reaction on the plate, a well was added onto the bottom
plate of the rheometer to prevent flow of the reactants from the desired geometric area
between the plates of the rheometer. The rheometer plates were heated to the desired
experiment temperature of either 100 °C or 200 °C and permitted to equilibrate for 30
minutes prior to use. The polyol was added to the testing fixture in the appropriate mass
for the targeted composition and allowed to equilibrate for 5 minutes. A composition
specific volume of BDO was added to the molten polyol and briefly stirred. The MDI was
then added to this mixture and stirred manually for approximately 5 seconds. The reactants
were then subjected to rheo-IR measurements for 30 minutes.
3.3.2 Characterization
3.3.2.1 Rheology
SAOS experiments were performed using a HAAKE MARS III parallel plate
rheometer (Thermo Scientific). The in situ reactions were performed using a standard
61
stainless steel parallel plate with a diameter of 20 mm. Initially, the linear viscoelastic
regime (LVR), where G’ and G” may be measured independent of the applied stress was
determined by performing a stress sweep at a constant frequency of 6.28 rad/sec. Two
stress sweeps were performed, one on the polyol only to represent the lowest viscosity
during the initial stages of the reaction and one on the final product after a benchtop
reaction of the highest wt. % HS material. A common stress of 100 Pa was chosen from
both amplitude sweeps was to guarantee the material was within the LVR for the entirety
of the reaction. The reactions were performed under isothermal conditions for a time
interval of 30 min. An initial study was performed to determine the proper experimental
gap by using different gap heights to ensure slip was not occurring at the plate during the
experiment. As a result, all of the reactions occurred with a geometry gap setting of 1.0
mm on the rheometer.
3.3.2.2 FTIR
In situ FTIR spectra was collected continuously throughout collection of SAOS
data. The enabling technology that provided this capability was the Rheonaut module
(Thermo Scientific) which interfaced directly with the HAAKE MARS III rheometer used.
The Rheonaut module contained a single reflection diamond crystal ATR window in an
electrically heated plate. The spectra were collected using a mid-infrared region deuterated
triglycine sulfate (DTGS) detector with a detection range of 400 – 4,000 cm-1. Before each
individual experiment a background reference spectrum was collected and the HAAKE
RheoWin software was used to perform a background subtraction on all spectra collected.
After the reactants were all added to the rheometer plate, the initial “time zero” scan was
taken then the SAOS experiment began immediately. During the oscillatory shear

62
experiment the Rheonoaut was set to collect a spectrum at a resolution setting of 32 with
16 scans per collection which generated one FTIR spectrum approximately every four
seconds. All FTIR spectra was normalized using the peak located at 2950 cm-1.
3.3.2.3 X-ray
Synchrotron radiation experiments were performed at Argonne National
Laboratory (ANL) Advanced Photon Source (APS) beamline 12-ID-B with a focused beam
spot size of 300 μm X 20 μm and a wavelength of 0.8856 nm. Simultaneous, two
dimensional (2D) WAXS and SAXS experiments were also performed on the TPU samples
in order to probe the chain spacing development during the reaction and growth of hard
domains respectively between specific time steps during the reaction. Samples for these
experiments were obtained by performing reactions under identical conditions used on the
rheometer then quenching the reaction in a cooling bath using solid CO2 and acetone.
Immediately after quenching the reaction the samples were placed into an auto sampler
array between two pieces of solid film Kapton tape and the scattering experiments were
performed.
The WAXS detector used was a Pilatus 300K set at a sample to collector distance
of 435.16 mm. Concurrently, a Pilatus 2M SAXS detector was utilized with a sample to
collector distance of 1,916.70 mm. The WAXS setup was calibrated using an aluminum
oxide (Al2O3) standard and the SAXS was calibrated using a silver behenate (AgBe)
standard. All experiments consisted of a 0.1 sec exposure time for five pulses. Prior to
exposure of the samples a background was collected using a “blank” sample under the
same exposure conditions. An established program using Matlab at the 12-ID-B
workstation used each samples collected transmission to overlay and average the five
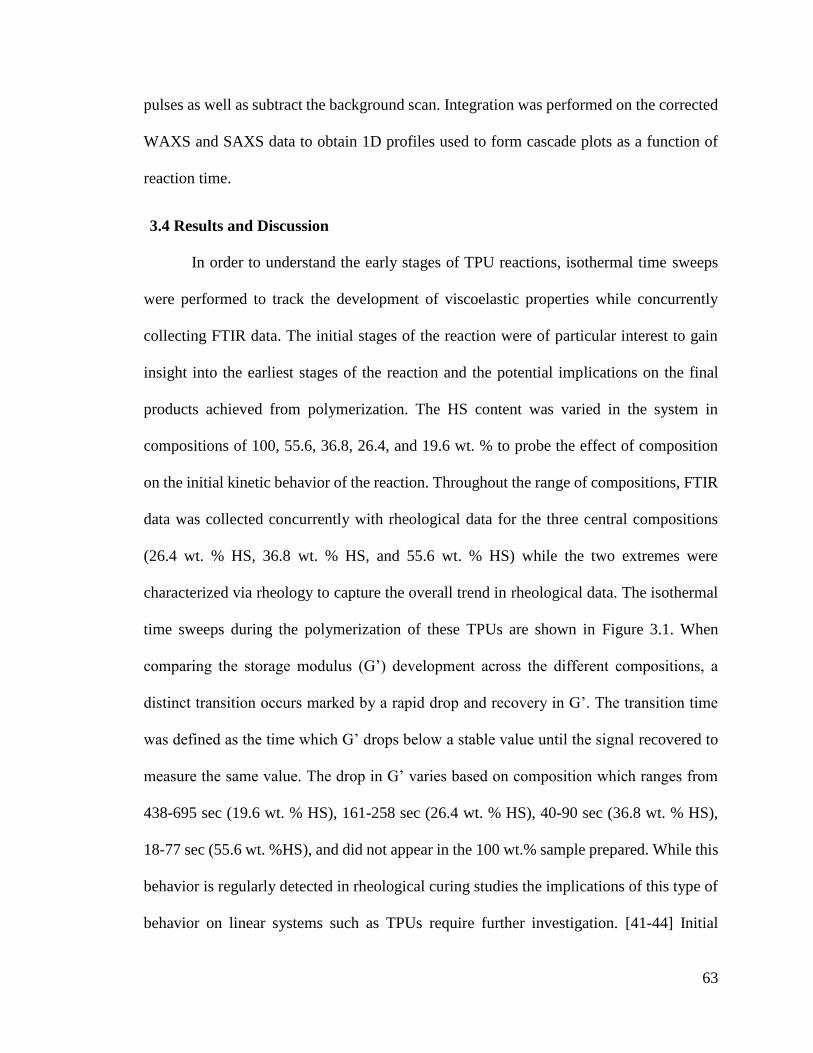
63
pulses as well as subtract the background scan. Integration was performed on the corrected
WAXS and SAXS data to obtain 1D profiles used to form cascade plots as a function of
reaction time.
3.4 Results and Discussion
In order to understand the early stages of TPU reactions, isothermal time sweeps
were performed to track the development of viscoelastic properties while concurrently
collecting FTIR data. The initial stages of the reaction were of particular interest to gain
insight into the earliest stages of the reaction and the potential implications on the final
products achieved from polymerization. The HS content was varied in the system in
compositions of 100, 55.6, 36.8, 26.4, and 19.6 wt. % to probe the effect of composition
on the initial kinetic behavior of the reaction. Throughout the range of compositions, FTIR
data was collected concurrently with rheological data for the three central compositions
(26.4 wt. % HS, 36.8 wt. % HS, and 55.6 wt. % HS) while the two extremes were
characterized via rheology to capture the overall trend in rheological data. The isothermal
time sweeps during the polymerization of these TPUs are shown in Figure 3.1. When
comparing the storage modulus (G’) development across the different compositions, a
distinct transition occurs marked by a rapid drop and recovery in G’. The transition time
was defined as the time which G’ drops below a stable value until the signal recovered to
measure the same value. The drop in G’ varies based on composition which ranges from
438-695 sec (19.6 wt. % HS), 161-258 sec (26.4 wt. % HS), 40-90 sec (36.8 wt. % HS),
18-77 sec (55.6 wt. %HS), and did not appear in the 100 wt.% sample prepared. While this
behavior is regularly detected in rheological curing studies the implications of this type of
behavior on linear systems such as TPUs require further investigation. [41-44] Initial
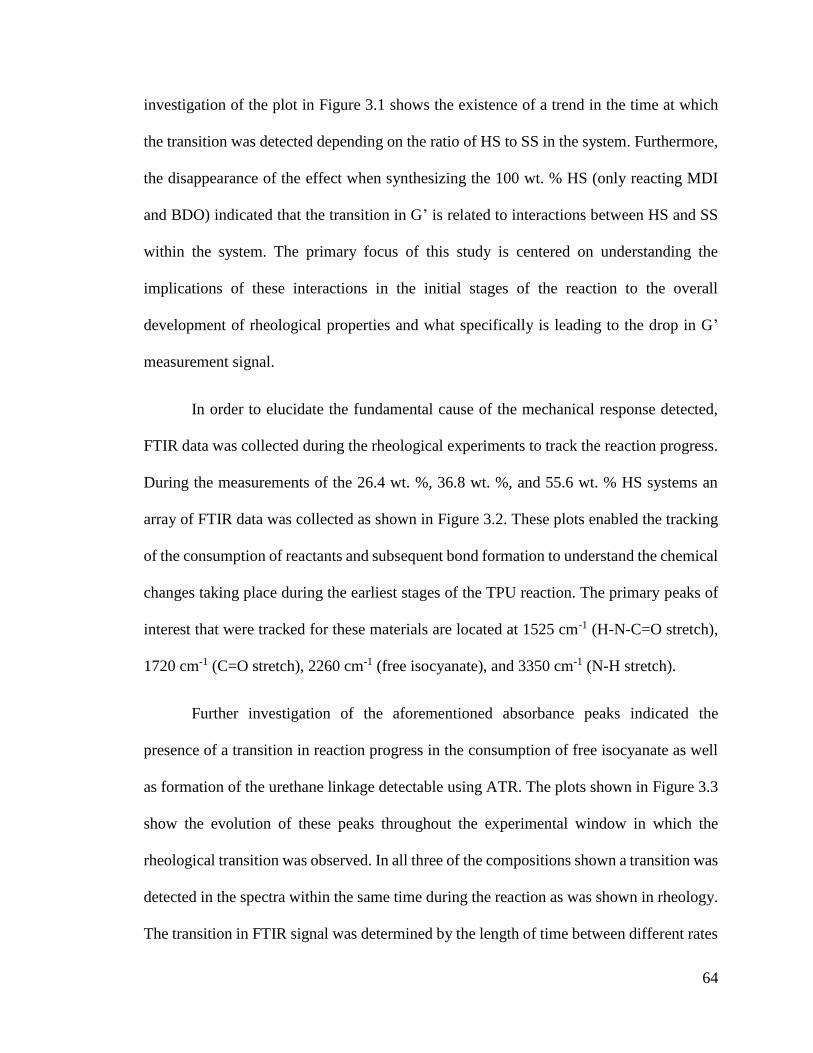
64
investigation of the plot in Figure 3.1 shows the existence of a trend in the time at which
the transition was detected depending on the ratio of HS to SS in the system. Furthermore,
the disappearance of the effect when synthesizing the 100 wt. % HS (only reacting MDI
and BDO) indicated that the transition in G’ is related to interactions between HS and SS
within the system. The primary focus of this study is centered on understanding the
implications of these interactions in the initial stages of the reaction to the overall
development of rheological properties and what specifically is leading to the drop in G’
measurement signal.
In order to elucidate the fundamental cause of the mechanical response detected,
FTIR data was collected during the rheological experiments to track the reaction progress.
During the measurements of the 26.4 wt. %, 36.8 wt. %, and 55.6 wt. % HS systems an
array of FTIR data was collected as shown in Figure 3.2. These plots enabled the tracking
of the consumption of reactants and subsequent bond formation to understand the chemical
changes taking place during the earliest stages of the TPU reaction. The primary peaks of
interest that were tracked for these materials are located at 1525 cm-1 (H-N-C=O stretch),
1720 cm-1 (C=O stretch), 2260 cm-1 (free isocyanate), and 3350 cm-1 (N-H stretch).
Further investigation of the aforementioned absorbance peaks indicated the
presence of a transition in reaction progress in the consumption of free isocyanate as well
as formation of the urethane linkage detectable using ATR. The plots shown in Figure 3.3
show the evolution of these peaks throughout the experimental window in which the
rheological transition was observed. In all three of the compositions shown a transition was
detected in the spectra within the same time during the reaction as was shown in rheology.
The transition in FTIR signal was determined by the length of time between different rates
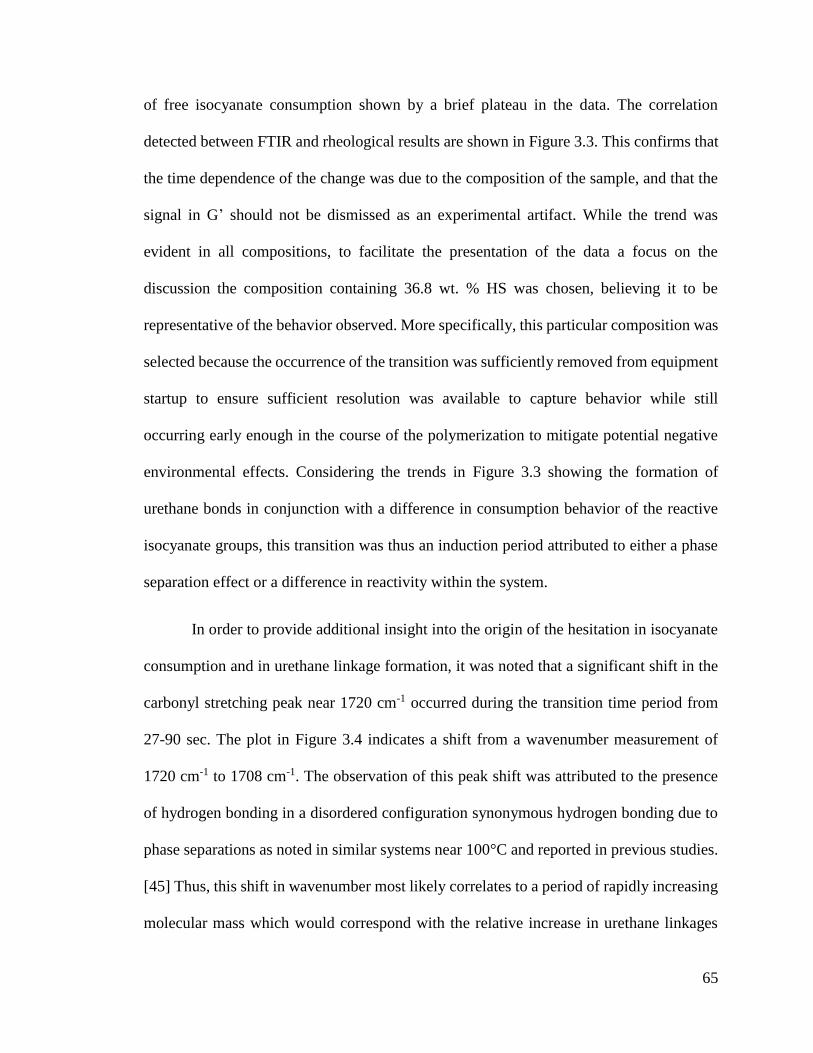
65
of free isocyanate consumption shown by a brief plateau in the data. The correlation
detected between FTIR and rheological results are shown in Figure 3.3. This confirms that
the time dependence of the change was due to the composition of the sample, and that the
signal in G’ should not be dismissed as an experimental artifact. While the trend was
evident in all compositions, to facilitate the presentation of the data a focus on the
discussion the composition containing 36.8 wt. % HS was chosen, believing it to be
representative of the behavior observed. More specifically, this particular composition was
selected because the occurrence of the transition was sufficiently removed from equipment
startup to ensure sufficient resolution was available to capture behavior while still
occurring early enough in the course of the polymerization to mitigate potential negative
environmental effects. Considering the trends in Figure 3.3 showing the formation of
urethane bonds in conjunction with a difference in consumption behavior of the reactive
isocyanate groups, this transition was thus an induction period attributed to either a phase
separation effect or a difference in reactivity within the system.
In order to provide additional insight into the origin of the hesitation in isocyanate
consumption and in urethane linkage formation, it was noted that a significant shift in the
carbonyl stretching peak near 1720 cm-1 occurred during the transition time period from
27-90 sec. The plot in Figure 3.4 indicates a shift from a wavenumber measurement of
1720 cm-1 to 1708 cm-1. The observation of this peak shift was attributed to the presence
of hydrogen bonding in a disordered configuration synonymous hydrogen bonding due to
phase separations as noted in similar systems near 100°C and reported in previous studies.
[45] Thus, this shift in wavenumber most likely correlates to a period of rapidly increasing
molecular mass which would correspond with the relative increase in urethane linkages

66
measured in the FTIR. Connecting the peak shift with the changes in absorbance all
happening within the same time period support the likelihood of a difference in reactivity
between reactants in the system. This connection supports the hypothesis that the smaller,
higher diffusivity diol may be interacting more rapidly in the early stages of the reaction
than the larger polyol. During the progression of the reaction the existence of phase
separation and physical configuration within the system was investigated using X-ray
scattering to compliment the rheological and FTIR experiments.
Offline reactions were performed under isothermal conditions at the same
temperature as the rheometry experiments and quenched in a dry ice cooling bath at
different reaction times immediately before collecting scattering data. The WAXS plots
collected for the 36.8 wt. % HS composition are shown in Figure 3.5. The WAXS data
indicates the development of a peak at a q value of 1.37 Å between 30 sec and 60 sec into
the reaction. The formation of this peak correlates to a spacing of approximately 4.6 Å
which is a known packing distance present in MDI-BDO hard segmented polyurethanes.
[46] The reaction time of the appearance of the peak correlates well to both the rheological
and FTIR results shown previously. The formation and growth of this peak indicates that
during this time frame the HS of adjacent chains have begun stacking beside one another,
supporting the molecular mass increase suggested in Figure 3.5. This stacking between
hard segments also supports the onset of phase separation where these individual segments
are beginning to cluster together and form domains. The SAXS patterns in Figure 3.6 were
then considered in order to compliment these WAXS results. Analysis of the SAXS results
show a shift toward lower q values starting at a time between 30 sec and 60 sec which
agrees with all previous experimental techniques. In this case, the d-spacing shifts from a
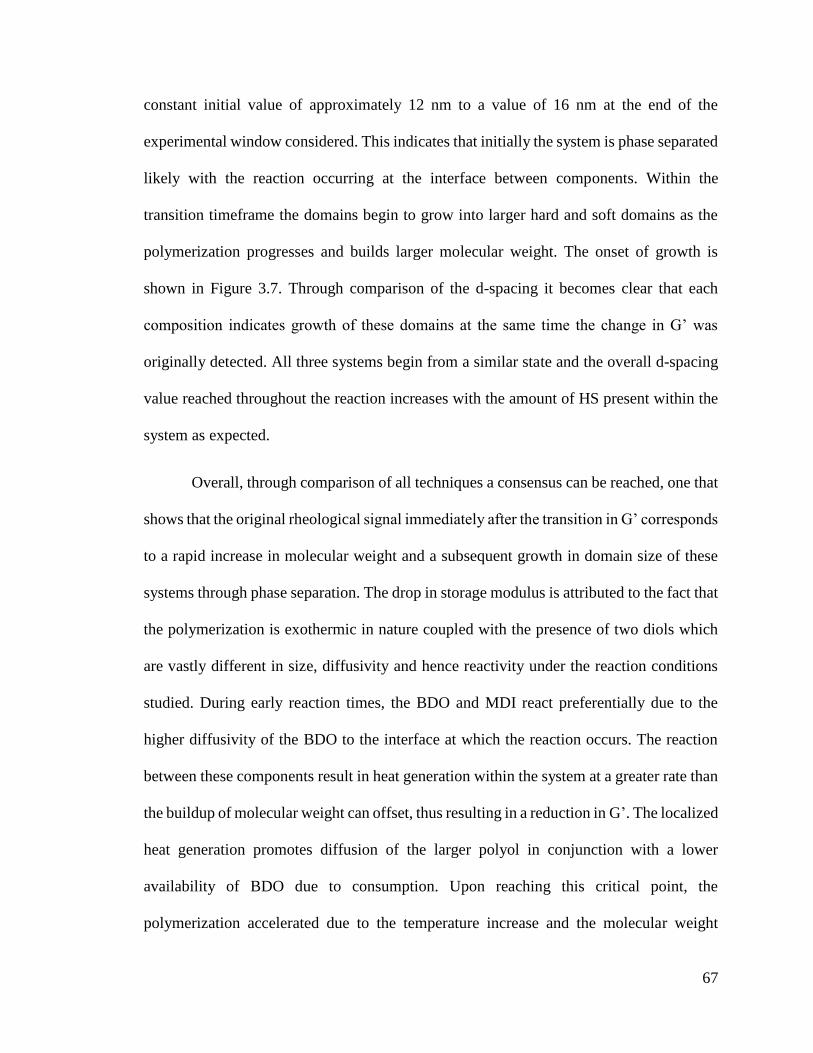
67
constant initial value of approximately 12 nm to a value of 16 nm at the end of the
experimental window considered. This indicates that initially the system is phase separated
likely with the reaction occurring at the interface between components. Within the
transition timeframe the domains begin to grow into larger hard and soft domains as the
polymerization progresses and builds larger molecular weight. The onset of growth is
shown in Figure 3.7. Through comparison of the d-spacing it becomes clear that each
composition indicates growth of these domains at the same time the change in G’ was
originally detected. All three systems begin from a similar state and the overall d-spacing
value reached throughout the reaction increases with the amount of HS present within the
system as expected.
Overall, through comparison of all techniques a consensus can be reached, one that
shows that the original rheological signal immediately after the transition in G’ corresponds
to a rapid increase in molecular weight and a subsequent growth in domain size of these
systems through phase separation. The drop in storage modulus is attributed to the fact that
the polymerization is exothermic in nature coupled with the presence of two diols which
are vastly different in size, diffusivity and hence reactivity under the reaction conditions
studied. During early reaction times, the BDO and MDI react preferentially due to the
higher diffusivity of the BDO to the interface at which the reaction occurs. The reaction
between these components result in heat generation within the system at a greater rate than
the buildup of molecular weight can offset, thus resulting in a reduction in G’. The localized
heat generation promotes diffusion of the larger polyol in conjunction with a lower
availability of BDO due to consumption. Upon reaching this critical point, the
polymerization accelerated due to the temperature increase and the molecular weight
68
begins to build more rapidly. The storage modulus then increases for the remainder of the
experiment as the molecular weight continues to build and increase the viscosity of the
system as would be expected.
Understanding the development of TPU systems and the complicated relationship
between rheological conditions, reaction behavior, and the effect of these factors on
property development are very important issues for industrial applications within this
material class. It is well understood that the initial reaction behavior within a specified
composition can affect the ultimate properties of the material. For example, it is known
that by maintaining a constant composition and creating a prepolymer as opposed to a
random configuration, or simply reacting at different temperatures, the properties of the
final material may behave significantly different. [31, 47-51] With this in mind, using
techniques such as rheo-FTIR studies to find markers for these behaviors such as in this
work, can assist in unraveling these complex behaviors. It can be envisaged that simply
changing temperature profiles in the initial zones of an extruder barrel while maintaining a
constant composition provides yet another tool to access the versatility TPUs offer for a
multitude of uses and aid in the efficiency of accomplishing these goals.
3.5 Conclusions
The study completed within this work was focused on determining the validity and
subsequent contributing factors to the transition detected in storage modulus during the
early stages of thermoplastic polyurethane reactions. The transition noted was marked by
sharp drop and recovery of the storage modulus signal. Further investigation showed that
the signal is tied to a transition in reactive behavior within the melt due to differences in
reactivity between the low molecular weight diols and the telechelic polyols present during
69
the reaction. This was concluded as the transition was strongly dependent upon the amount
of hard segment in the system. It is believed the transition in storage modulus results from
the exothermic nature of the reaction, i.e. the addition of heat to the system, and the
competition between heat generated within the system and the viscosity build up
characteristics of the system. This behavior was attributed to a differences in diffusivity of
reactants and the resultant molecular weight increase as the reaction progressed. Initially,
the more mobile species (BDO and MDI) react, increasing the heat present within the
system until the reaction with the polyol begins rapidly, thus increasing the molecular
weight of the system in a manner that outpaces the effect of heat on viscosity of the system.
FTIR data indicated a shift in the chemical composition that occurred within the same
timeframe as the rheological signal was detected, and was consistent with the rheological
findings. WAXS and SAXS were used to supplement this evidence by demonstrating that
chain packing as well as hard domain growth both rapidly increase during the time of this
transition. Understanding the importance of the early stages of reactions in TPU systems
is paramount when targeting specific behavior due to their high level of complexity.
Benchmarking a signal in rheology or through combined techniques such as rheo-FTIR
provides a quick and simple indication of factors which will influence the entire
polymerization in TPUs. Using these sorts of tools provides an additional approach to
industrial applications for efficiently producing TPUs for a multitude of uses.
References
[9] A. H. Navarchian, F. Picchioni, and L. P. B. M. Janssen, "Rheokinetics and effect
of shear rate on the kinetics of linear polyurethane formation," Polymer
Engineering and Science, vol. 45, pp. 279-287, Mar 2005.

70
[10] V. Sekkar, K. A. Devi, and K. N. Ninan, "Rheo-kinetic evaluation on the
formation of urethane networks based on hydroxyl-terminated polybutadiene,"
Journal of Applied Polymer Science, vol. 79, pp. 1869-1876, Mar 7 2001.
[22] R. G. Pearson and E. L. Williams, "Interfacial Polymerization of an Isocyanate
and a Diol," Journal of Polymer Science Part a-Polymer Chemistry, vol. 23, pp.
9-18, 1985.
[23] R. G. Pearson and E. L. Williams, "A Comparison of Heterogeneous and
Homogeneous Kinetics in the Formation of a Polyurethane," Journal of Polymer
Science Part a-Polymer Chemistry, vol. 25, pp. 565-573, Feb 1987.
[24] R. W. Seymour, G. M. Estes, and S. L. Cooper, "Infrared Studies of Segmented
Polyurethan Elastomers .1. Hydrogen Bonding," Macromolecules, vol. 3, pp. 579-
&, 1970.
[25] G. M. Estes, S. L. Cooper, and A. V. Tobolsky, "Block Polymers and Related
Heterophase Elastomers," Journal of Macromolecular Science-Reviews in
Macromolecular Chemistry, vol. C 4, pp. 313-&, 1970.
[26] H. D. Kim, J. H. Huh, E. Y. Kim, and C. C. Park, "Comparison of properties of
thermoplastic polyurethane elastomers with two different soft segments," Journal
of Applied Polymer Science, vol. 69, pp. 1349-1355, Aug 15 1998.
[27] S. Velankar and S. L. Cooper, "Microphase separation and rheological properties
of polyurethane melts. 2. Effect of block incompatibility on the microstructure,"
Macromolecules, vol. 33, pp. 382-394, Jan 25 2000.
[28] S. Velankar and S. L. Cooper, "Microphase separation and rheological properties
of polyurethane melts. 3. Effect of block incompatibility on the viscoelastic
properties," Macromolecules, vol. 33, pp. 395-403, Jan 25 2000.
[29] A. Kintanar, L. W. Jelinski, I. Gancarz, and J. T. Koberstein, "Complex
Molecular Motions in Bulk Hard-Segment Polyurethanes - a Deuterium Nmr-
Study," Macromolecules, vol. 19, pp. 1876-1884, Jul 1986.
[30] L. M. Leung and J. T. Koberstein, "Dsc Annealing Study of Microphase
Separation and Multiple Endothermic Behavior in Polyether-Based Polyurethane
Block Copolymers," Macromolecules, vol. 19, pp. 706-713, Mar 1986.
[31] S. Yamasaki, D. Nishiguchi, K. Kojio, and M. Furukawa, "Effects of
polymerization method on structure and properties of thermoplastic
polyurethanes," Journal of Polymer Science Part B-Polymer Physics, vol. 45, pp.
800-814, Apr 1 2007.
[32] C. Dubois, S. Desilets, A. Aitkadi, and P. Tanguy, "Bulk-Polymerization of
Hydroxyl Terminated Polybutadiene (Htpb) with Tolylene Diisocyanate (Tdi) - a
Kinetics Study Using C-13-Nmr Spectroscopy," Journal of Applied Polymer
Science, vol. 58, pp. 827-834, Oct 24 1995.
[33] D. Kincal and S. Ozkar, "Kinetic study of the reaction between hydroxyl-
terminated polybutadiene and isophorone diisocyanate in bulk by quantitative
FTIR spectroscopy," Journal of Applied Polymer Science, vol. 66, pp. 1979-1983,
Dec 5 1997.
[34] H. Kothandaraman and A. S. Nasar, "The Kinetics of the Polymerization Reaction
of Toluene Diisocyanate with Polyether Polyols," Journal of Macromolecular
Science-Pure and Applied Chemistry, vol. A31, pp. 339-350, 1994.
71
[35] S. Parnell, K. Min, and M. Cakmak, "Kinetic studies of polyurethane
polymerization with Raman spectroscopy," Polymer, vol. 44, pp. 5137-5144, Aug
2003.
[36] I. Yilgor, B. D. Mather, S. Unal, E. Yilgor, and T. E. Long, "Preparation of
segmented, high molecular weight, aliphatic poly(ether-urea) copolymers in
isopropanol. In-situ FTIR studies and polymer synthesis," Polymer, vol. 45, pp.
5829-5836, Aug 5 2004.
[37] H. Madra, S. B. Tantekin-Ersolmaz, and F. S. Guner, "Monitoring of oil-based
polyurethane synthesis by FTIR-ATR," Polymer Testing, vol. 28, pp. 773-779,
Oct 2009.
[38] E. B. Richter and C. W. Macosko, "Kinetics of Fast (Rim) Urethane
Polymerization," Polymer Engineering and Science, vol. 18, pp. 1012-1018,
1978.
[39] G. Anzuino, A. Pirro, O. Rossi, and L. P. Friz, "Reaction of Diisocyanates with
Alcohols .1. Uncatalyzed Reactions," Journal of Polymer Science Part a-Polymer
Chemistry, vol. 13, pp. 1657-1666, 1975.
[40] M. Cioffi, K. J. Ganzeveld, A. C. Hoffmann, and L. P. B. M. Janssen,
"Rheokinetics of linear polymerization. A literature review," Polymer
Engineering and Science, vol. 42, pp. 2383-2392, Dec 2002.
[41] E. Papadopoulos, M. Ginic-Markovic, and S. Clarke, "Reaction Kinetics of
Polyurethane Formation Using a Commercial Oligomeric Diisocyanate Resin
Studied by Calorimetric and Rheological Methods," Macromolecular Chemistry
and Physics, vol. 209, pp. 2302-2311, Nov 24 2008.
[42] J. S. Martin, J. M. Laza, M. L. Morras, M. Rodriguez, and L. M. Leon, "Study of
the curing process of a vinyl ester resin by means of TSR and DMTA," Polymer,
vol. 41, pp. 4203-4211, May 2000.
[43] A. Y. Malkin and S. G. Kulichikhin, "Rheokinetics of Curing," Advances in
Polymer Science, vol. 101, pp. 217-257, 1991.
[44] J. M. Laza, J. L. Vilas, F. Mijangos, M. Rodriguez, and L. M. Leon, "Analysis of
the crosslinking process of epoxy-phenolic mixtures by thermal scanning
rheometry," Journal of Applied Polymer Science, vol. 98, pp. 818-824, Oct 15
2005.
[45] M. M. Coleman, K. H. Lee, D. J. Skrovanek, and P. C. Painter, "Hydrogen-
Bonding in Polymers .4. Infrared Temperature Studies of a Simple Polyurethane,"
Macromolecules, vol. 19, pp. 2149-2157, Aug 1986.
[46] J. Blackwell and K. H. Gardner, "Structure of the Hard Segments in Polyurethane
Elastomers," Polymer, vol. 20, pp. 13-17, 1979.
[47] M. Furukawa, Y. Mitsui, T. Fukumaru, and K. Kojio, "Microphase-separated
structure and mechanical properties of novel polyurethane elastomers prepared
with ether based diisocyanate," Polymer, vol. 46, pp. 10817-10822, Nov 21 2005.
[48] K. Kojio, M. Furukawa, Y. Nonaka, and S. Nakamura, "Control of Mechanical
Properties of Thermoplastic Polyurethane Elastomers by Restriction of
Crystallization of Soft Segment," Materials, vol. 3, pp. 5097-5110, Dec 2010.
[49] M. S. Sanchez-Adsuar, E. Papon, and J. J. Villenave, "Influence of the synthesis
conditions on the properties of thermoplastic polyurethane elastomers," Journal of
Applied Polymer Science, vol. 76, pp. 1590-1595, Jun 6 2000.
72
[50] M. S. Sanchez-Adsuar, E. Papon, and J. J. Villenave, "Influence of the
prepolymerization on the properties of thermoplastic polyurethane elastomers.
Part II. Relationship between the prepolymer and polyurethane properties,"
Journal of Applied Polymer Science, vol. 76, pp. 1602-1607, Jun 6 2000.
[51] M. S. Sanchez-Adsuar, E. Papon, and J. J. Villenave, "Influence of the
prepolymerization on the properties of thermoplastic polyurethane elastomers.
Part 1. Prepolymer characterization," Journal of Applied Polymer Science, vol.
76, pp. 1596-1601, Jun 6 2000.

73
3.6 Figures
Figure 3.1 - G' and G" plots during isothermal time study at 100 C of varying HS
content.
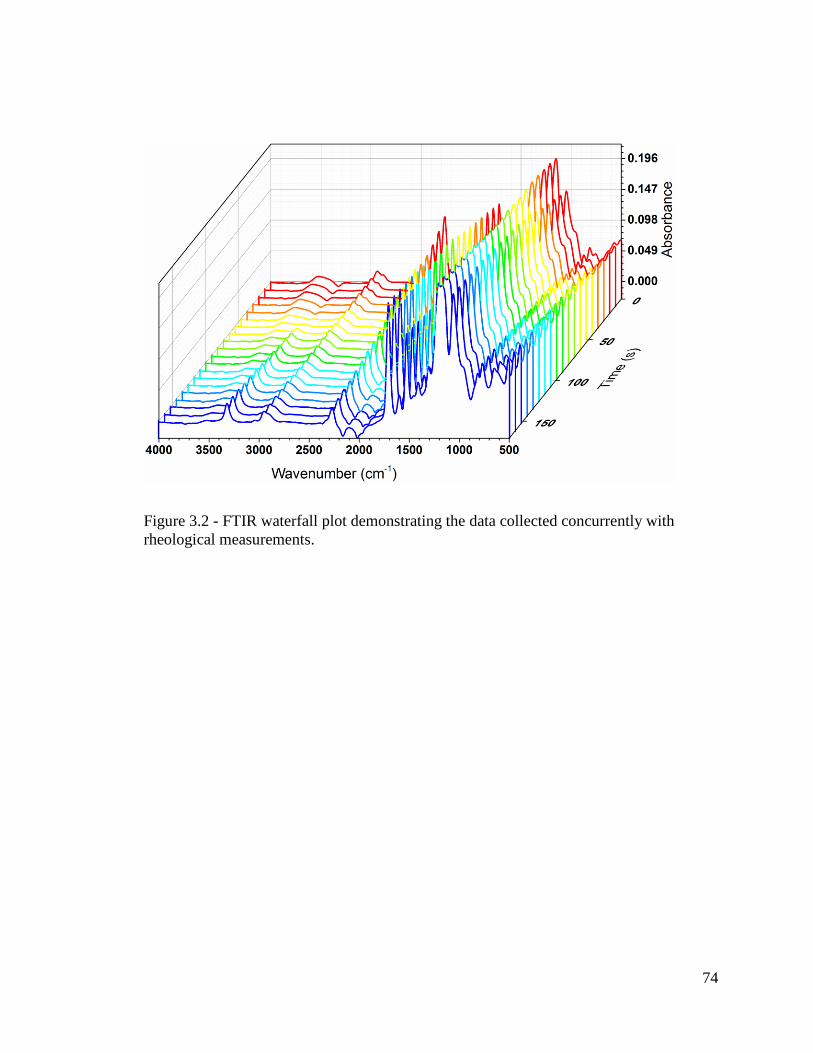
74
Figure 3.2 - FTIR waterfall plot demonstrating the data collected concurrently with
rheological measurements.

75
Figure 3.3 - Comparison of absorption bands throughout isothermal time study of 36.8
wt. % HS TPU.
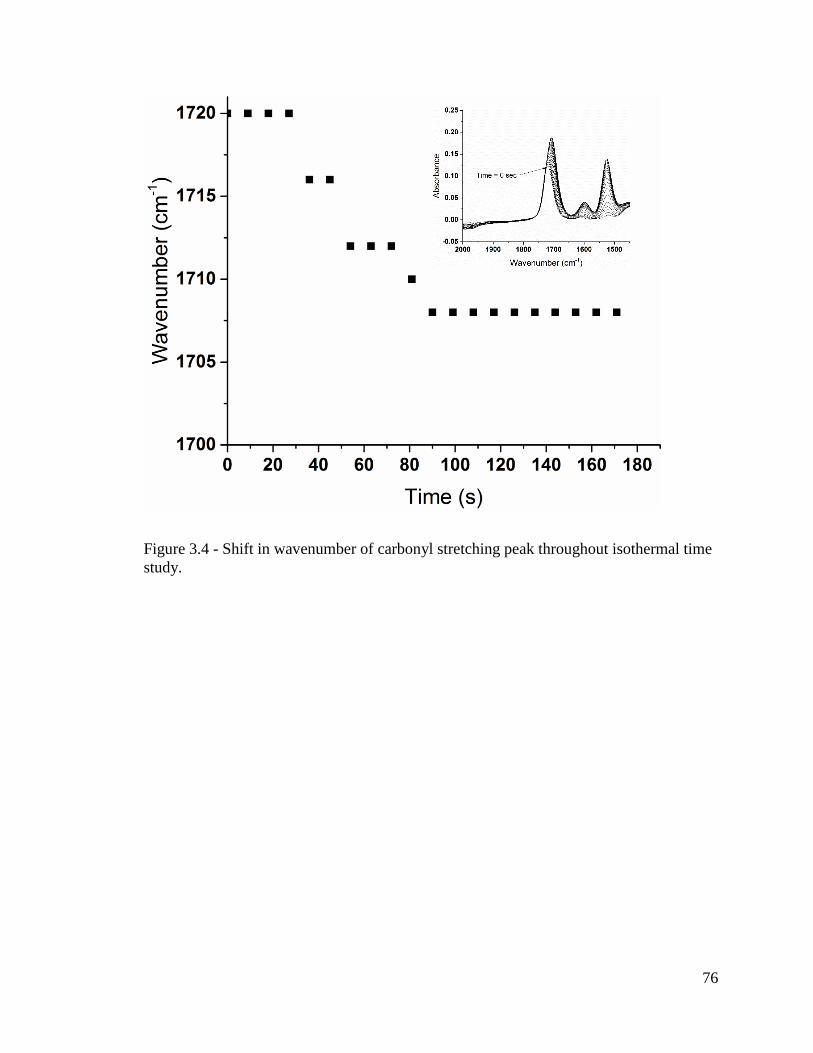
76
Figure 3.4 - Shift in wavenumber of carbonyl stretching peak throughout isothermal time
study.

77
Figure 3.5 - 1D WAXS plot at progressive time steps throughout the TPU reaction.

78
Figure 3.6 Plot of SAXS data for the 36.8 wt.% HS sample with progressing reaction
time.
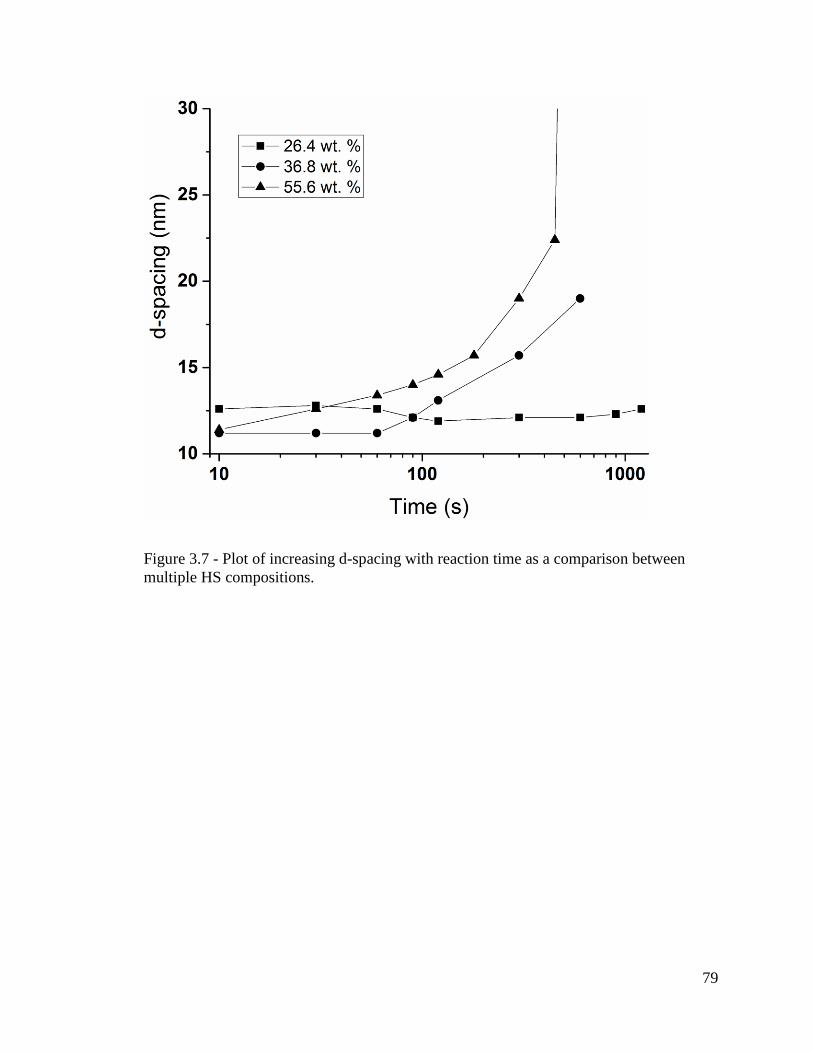
79
Figure 3.7 - Plot of increasing d-spacing with reaction time as a comparison between
multiple HS compositions.
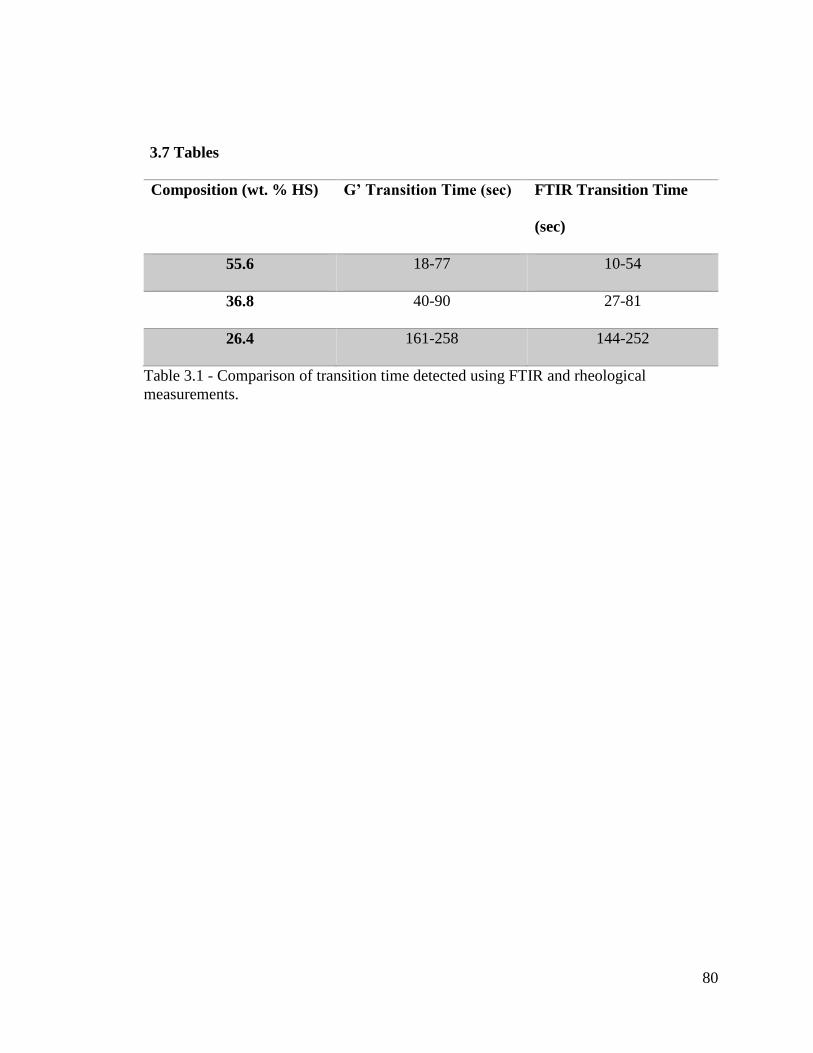
80
3.7 Tables
Composition (wt. % HS) G’ Transition Time (sec) FTIR Transition Time
(sec)
55.6 18-77 10-54
36.8 40-90 27-81
26.4 161-258 144-252
Table 3.1 - Comparison of transition time detected using FTIR and rheological
measurements.

81
Chapter 4 : Rheo-kinetic Modeling of TPU Using In
Situ FTIR Analysis
This chapter is partially based on:
Journal article:
J. L. Gadley, A. Boromand and J. M. Maia To Be Submitted (ACS Macro Letter)
82
4.1 Abstract
Bulk polymerization of thermoplastic polyurethanes (TPUs) are widely known to exhibit a
complex relationship between reaction behavior, viscosity of the system, and flow conditions
during polymerization. The intent of this work was to determine the influence of both shear rate
and composition during polymerization on a simple TPU system.
Using rheometry coupled with in situ FTIR measurements the relationship between
viscosity and conversion was determined. Under steady shear conditions, the total strain applied
during the reaction was identified as the most influential parameter affecting viscosity growth.
This observation also determined that a critical strain existed where the reaction transitioned from
a diffusion controlled process to a mixing dominated process. Using a simple model, the viscosity
and corresponding conversion can be predicted. When considering three different weight percent
hard segment (HS) compositions (26.4 wt. %, 36.8 wt. %, and 55.6 wt. %), it was observed that
the reaction is dependent upon the total isocyanate consumed during polymerization regardless of
the composition.
Through tracking viscosity of TPUs systems such as these, the conversion under known
conditions could be determined through a single simple experiment. Utilizing these sorts of
relationships are very promising to efficiently controlling polymerizations in processes such as
reactive extrusion.
83
4.2 Introduction
Thermoplastic polyurethanes (TPUs) are a subset of polyurethanes (PUs) that are heavily
used in performance applications. These materials are of particular interest because they are able
to take advantage of many traditional PU properties while remaining melt processable. TPUs are
most commonly produced through bulk reactions in reactive extrusion (REX) or via batch reactors
in the case of slowly reacting systems. For obvious reasons, the prospect of continuously reacting
and producing TPUs via extrusion is very attractive for industrial production of these materials for
use in other traditional forming methods. However, controlling the REX process has proven
difficult due to many factors at play during the reaction under the complex flow conditions within
the equipment. Because of the high level of unpredictability present in this process, the reaction
kinetics of these systems has been an area of significant research throughout the years.
Due to the inherent complexities of polymerizing TPUs in industrial processes, many
different approaches have been taken to elucidate the specific behavior contributing to
inconsistencies in reactive processing.[33, 37, 52-54] These types of polymerizations that take
place concurrently while being processed ultimately lead to connections between processing
conditions and polymerization behavior which cannot be separated. For example, most TPU
monomers are immiscible and the rate of reaction observed is strongly dependent upon the flow
conditions present. In this case, increasing total interfacial area due to mixing would be expected
to affect the reaction behavior. The ability of monomer to diffuse to these interfaces would also
play an important role in the kinetics of the system. However, as the reaction progresses the
viscosity of the mixture inevitably increases affecting flow, mixing and diffusion of the reactants.
[9] Experimental efforts to understand this kinetic behavior have been taken using nuclear
magnetic resonance (NMR), Fourier transform infrared spectroscopy (FTIR), adiabatic
84
temperature rise (ATR), and ramen spectroscopy. [11, 12, 22, 32, 33, 37] While each of these
studies provide a unique view of TPU behavior and how system stoichiometry, temperatures, and
catalysts affect the behavior, they generally do not focus on how shear flows during polymerization
affect the rate of the reaction. More pertinent studies have been performed using rheometry and
batch mixers to track the effect of shear on reactive systems. [1, 9, 38, 54-57] These sorts of studies
encompass both linear TPU formation as well as thermoset reactions in PUs but have shown that
flow conditions during bulk polymerization drastically change the kinetics observed. Throughout
these works it is generally accepted that shear rate had little effect on the reactions especially at
low viscosity and shear rate ranges. However, other studies have shown that increasing shear rate
increases the time at which viscosity buildup behavior changes during the reaction. [9, 58] These
studies show promise in unraveling the connection between the polymerization progress and the
viscosity buildup occurring in these complex systems. Further study of this behavior has noted that
while shear is affecting the onset point where rapid viscosity buildup occurs, after reaching
approximately 50% conversion, the reaction kinetics appear to deviate from the accepted second
order behavior. [1] At this point, reaction rate has been shown to increase in some cases while
decreasing in others.[54] The increase has been theorized to result from an autocatalysis of the
urethane bond while deceleration was attributed to diffusion limitations.[1, 59] Specifically, when
studying whether the diffusion limitation caused the reaction change, the deceleration was only
observed for very short diols.[59] However, this did suggest that a difference in reactivity during
reaction progression may be playing a significant role in viscosity buildup behavior. These studies
all tend to have difficulty definitively detecting the causes of the observed behavior because of the
complexity of these systems. Therefore, finding a potential way to ‘bridge the gap’ between

85
processing and easily performed experiments would provide tremendous benefit to identifying
inconsistencies in industrial bulk processes.
The intent of this work is to combine spectroscopy and rheometry in a simultaneous test to
help connect changes in viscosity with real time conversion measurements. The methodology for
such an effort were developed in Chapter 2 and indicate that tracking the buildup of mechanical
behavior and consumption of the reactants simultaneously can be reliably achieved. The scope of
this investigation focuses on whether or not this methodology can be used to create a viscosity
model that allows for prediction of conversion or viscosity behavior from a relatively simple
experiment. This approach provides the unique advantage of measuring reaction behavior under
known shear conditions allowing a direct comparison to be made. This work focused on using
three different TPU compositions ranging from 26.4 wt. % HS to 55.6 wt.% HS. These
compositions were exposed to different temperatures and different shear rates to understand the
connection between viscosity buildup behavior and monomer ratio as well as understand how shear
rates may affect a specific composition of reaction.
4.3 Experimental
In order to generate the data for this study to capture the relationship between bulk reaction
kinetics and the resultant flow behavior, TPUs were synthesized on the rheometer plate according
to the technique developed in Chapter 2. Using this methodology, TPUs containing 26.4 wt.%,
36.8 wt. %, and 55.6 wt.% were synthesized under oscillatory and steady shear flow conditions.
The polymerizations were performed at two different temperatures, 100 °C and 200 °C. The
samples were subjected to oscillation and measured at both temperatures to determine the influence
of hard segment composition on the reaction’s behavior and subsequent buildup of viscosity. To
understand the effect of shear on the samples, a range of shear rates were run (0.1, 1.0, 5.0, 10.0,

86
15.0, and 20.0 sec-1) on the 36.8 wt. % composition at 100 °C. This particular temperature and
composition were chosen to ensure the reaction rate occurred fast enough to mitigate
environmental influence while occurring slowly enough to capture data within the experimental
resolution of the rheometer and FTIR equipment. When comparing compositions, the oscillatory
experiments were performed at 100 °C to create a zero shear baseline for the varied shear rate
experiments. The oscillatory experiments at 200 °C were performed to ensure all compositions
were reacted to high conversions. This was of particular interest for this study because we wanted
to investigate whether or not a change in viscosity buildup behavior was observed after a certain
conversion as previously reported. It was hypothesized that observing this behavior with both
rheological and spectroscopic techniques simultaneously could provide a unique understanding as
to what the root cause of the change in viscosity buildup.
4.4 Results and Discussion
4.4.1 Constant Composition Under Steady Shear
In an effort to move toward modeling these complicated systems in such a way where
conversion data alone could predict viscosity or vice versa, polymerization of a single composition
under steady shear was initially considered. The steady shear viscosity data collected as a function
of time across different shear rates are depicted in Figure 4.1. The data in Figure 4.1 indicates that
the different shear rates measure similar initial values as would be expected. The sample viscosity
across all shear rates then appears to increase at similar reaction times. However, the final viscosity
varies depending upon the shear rate applied to the system. In fact, increasing shear rate generally
caused an increase in the maximum viscosity value reached during polymerization. Although it
would be expected that these materials exhibit shear-thinning behavior, the increasing viscosity
with increasing shear rate indicates the flow condition was altering the reaction interface in the

87
melt enough to alter the reaction rate. The FTIR data collected during these experiments were used
to further investigate the relationship between shear rate and the viscosity. The conversion of free
isocyanate was determined by tracking the absorbance peak at 2260 cm-1 and plotted against the
reaction time as shown in Figure 4.2. This plot shows independently that as the shear rate of the
system was varied, the conversion rate and extent of conversion was shifted to higher values as
the applied shear rate increased. This indicates a change related to the flow behavior of the system.
For example, increasing shear rate can be causing increased interfacial area for the reaction. The
higher total conversion reached at higher shear rates was responsible for the increased in final
viscosity reached during the rheological measurement. The relationship shown in Figure 4.2 was
interpreted as a shift in reaction rate due to increased interfacial area available to reactants due to
the flow conditions applied to the system. In order to better understand the influence of flow on
the reactive system, the conversion and viscosity information were plotted as a function of total
strain in the system.
Considering the effect of shear rate on the FTIR measurements, the same values were
plotted as a function of total strain applied as shown in Figure 4.3. Considering the viscosity versus
total strain applied, a shift in strain at which the viscosity increases was observed as well as a
change in slope of viscosity buildup. After reaching a shear rate of 10 sec-1, further increases in
shear rate appeared to follow very similar behavior between shear rates. This effect was attributed
to a shift from a mostly diffusion controlled reaction environment to a flow dominated
environment. Also shown in the Figure 4.3 inlay, was the change in viscosity as a function of the
conversion during the reaction. The data indicated that at a critical conversion, the viscosity values
increase rapidly. The conversion reached was dependent on the shear rate applied to the system.

88
This behavior further supports the FTIR data indicating that applying shear to these reactions even
across a small range of shear rates has a significant effect on the polymerization behavior.
Further investigation of this behavior is depicted in Figure 4.4. However, it should be noted
that the viscosity measured for 15 sec-1 and 20 sec-1 increased and fluctuated erratically. This was
attributed to exceeding the sampling rate of FTIR in this case or due to the flow rate occurring
under the shear flow conditions. Because of this behavior, the maximum shear rate under these
experimental conditions was determined to be 10 sec-1. This curve indicates that consumption of
isocyanate in the system was related to the shear rate applied to the melt. This effect is likely due
to an increase in interfacial area between the reactants. Considering the dependence of the reaction
behavior on strain across the relatively small shear rate range measured suggests that a shift in
reaction behavior from diffusion dominated to flow dominated was observable. At low shear rates,
little strain is applied to the system throughout the reaction resulting in a mostly diffusion
controlled process because minimal distortion of the reaction interface is occurring. After reaching
a sufficiently high shear rate, in this case 10 sec-1, enough strain has been applied to the reaction
to transition to a regime where the reaction is drastically affected by the flow conditions present.
At a strain value of approximately 60, the isocyanate was consumed much more rapidly as the area
of the reaction interface increased due to flow which reduced the dependence on diffusion for the
reaction to occur. To better develop the connection between viscosity and conversion a model was
developed to help describe the relationship between shear rate and the behavior of these reactions.
The system was conceptualized to act as spherical particles for simplicity and treated as a growth
of these particles. This analogy can be thought of as behavior similar to that observed during
growth of crystals for example. Under this assumption, the relationship defined by Einstein was
89
used as shown in Equation 4.1 where it is known that in a particle system composed of hard
spheres, C1=2.5.
𝜂 = 𝜂0(1 + 𝐶1𝜑)
Equation 4.1
Considering a reacting system as is present in this case, more complex particle interactions
must be considered. Particularly, as these particles move very close together, as would happen
when approximating a reaction through this method. To capture this behavior the series is
expanded as shown in Equation 4.2.
𝜂 = 𝜂0(1 + 𝐶1𝜑 + 𝐶2𝜑2 + 𝐶3𝜑3 + ⋯ )
Equation 4.2
Given this equation it can be stated that:
𝜂 ∝ (∆𝜑)−1
Equation 4.3
Which can be written as:
𝜂 ∝1
𝜑𝑚𝑎𝑥 − 𝜑
Equation 4.4
The relationship can then be rewritten as:
𝜂 ∝ 1
𝜑𝑚𝑎𝑥(1 −𝜑
𝜑𝑚𝑎𝑥)
Equation 4.5

90
Using this relationship, the equation can be adapted with parameters for fitting to allow
for modeling the behavior of this system as shown in Equation 4.6.
𝜂 =1
𝜑𝑚𝑎𝑥⁄
(1 −𝜑
𝜑𝑚𝑎𝑥)𝐶
Equation 4.6
Finally, the form shown in Equation 4.7 can be written to allow for fitting across the
different viscosity changes even when approaching a very high conversion of a completed reaction.
𝜂 =1
(1 −𝛼𝐵)
𝐶
Equation 4.7
Using the combination of rheological measurements and FTIR data collected the
experimental data was fit using Equation 4.7 where η is viscosity, α represents conversion, B is a
fitting parameter containing αm, where αm is maximum conversion (ideally 1), and parameter C is
a fitting parameter. Ultimately, the ability to predict conversion or viscosity behavior based on one
measurement technique would provide a useful tool to predict viscosity buildup behavior for
processing applications. The resultant experimental data fit and corresponding fits are shown in
Figure 4.5. Due to the inconsistencies previously noted at higher shear rates with the FTIR data,
the maximum shear rate examined here was 10 sec-1. The fitting method used shows good
agreement with the experimental data indicating that this method provides a direct connection
between the viscosity and conversion values obtained experimentally. For these fits, B results in a
value of 4.239 (0.1 sec-1), 1.063 (1.0 sec-1), 1.017 (5.0 sec-1), and 1.001 (10 sec-1). Since these

91
values all approach a value of 1 within error, the model is accurately trending toward an ultimate
conversion value of unity as expected. The deviation from this behavior for the 0.1 sec-1 sample
was attributed to a difference in interaction between reaction sites under mostly diffusion
controlled conditions. The remaining fitting parameters are shown in
Shear Rate 0.1 sec-1 1.0 sec
-1 5.0 sec-1 10.0 sec
-1 B 4.239 1.063 1.017 1.001
C 24.99 3.155 2.354 1.519
R-Square 0.986 0.983 0.998 0.985
Table 4.1. Considering the trend shown in the parameters, particularly the exponent, c, the
equation shows a sharpening of the transition as shear rate was increased. Further investigation of
the viscosity versus conversion plot shows the influence of changing shear rate on a specific
composition of TPU. Increasing the shear rate causes a shift from a more gradual to a rapid increase
in viscosity at higher shear rates. This information could be very useful for tuning bulk reactions
under flow. Changes in viscosity and conversion behavior were apparent even when changing
shear rates across a small range. These results indicate that an increased shear rate provides a more
efficient route to reaching higher conversion. Using the relationship demonstrated here to predict
conversion knowing only the viscosity under specific flow conditions for example, provides a
powerful technique to control the relationship between a shear flow based process and the viscosity
of the system.
4.4.2 Varied Hard Segment Composition Under Oscillatory Shear
After determining that shear rate affects viscosity buildup and conversion rate within a
specific composition of bulk polymerized of TPU, oscillatory shear experiments were performed
to understand the influence of composition on polymerization behavior. In order to accomplish

92
this, TPUs were synthesized on the rheometer plate consisting of three different HS compositions,
26.4 wt. %, 36.8 wt. %, and 55.6 wt. %. These polymerizations progressed under SAOS, enabling
the tracking of viscosity growth while simultaneously monitoring chemical changes via FTIR.
First, the polymerization was tracked under isothermal conditions at 100 °C. The typical results of
such an experiment are shown in Figure 4.6 as a plot of complex viscosity versus time. While these
TPUs would typically be exposed to processing temperatures higher than 100 °C, these conditions
were chosen initially to delay reaction onset prior to measurement.
Considering Figure 4.6, increasing HS content affects the rate of viscosity buildup and
overall magnitude of viscosity as was noted in Chapter 1. Maintaining the goal of connecting the
polymerization viscosity with the conversion of the system, these measured variables were plotted
against each other as shown in Figure 4.7. These results indicated that at low conversion all three
compositions were behaving similarly. After reaching a conversion of approximately 50%, the
viscosity buildup behavior changes between the different HS content materials. At conversions
above this value, the relationship between viscosity and conversion develops differently based on
composition. The highest HS content system (55.6 wt. %) also indicated transition to a slower
increase in viscosity with conversion which was initially attributed to diffusion limitation of the
reaction at high viscosity values. The conversion values where then normalized by the initial
concentration of isocyanate in the system in order to directly compare the amount of isocyanate
consumed as shown in Figure 4.8. These results show that all three compositions develop viscosity
in the same manner under a conversion of approximately 50%. Above this value, all three
compositions rapidly increase in viscosity and form a master curve. This suggests that the reactions
under identical flow conditions and varied composition progress based on the total isocyanate

93
consumption up to any point in the reaction. The transition noted in the highest HS content to an
inhibited condition was an interesting result that required further study to identify potential causes.
In order to provide a more complete understanding of the influence of composition on
viscosity buildup in TPUs, the same experiments were performed under isothermal conditions at
200 °C to ensure the reaction remained in the melt state throughout the experiment. The viscosity
versus time data is depicted in Figure 4.9. Polymerization under the elevated temperature, more
representative of extrusion conditions and a significant difference in the data is immediately
apparent. In this case the complex viscosity rapidly increased then reached a stable value while
remaining in the melt state for the entirety of the experiment.
Next, the normalized complex viscosity was plotted against the conversion of isocyanate
as was detected simultaneously using FTIR. The data plotted in Figure 4.10 represents the
relationship between normalized viscosity and conversion as a function of different HS content
systems. As the HS content increases, the required conversion of isocyanate to reach a specific
viscosity is reduced. The data also indicated a transition was present during the polymerization
where viscosity was rapidly increasing with conversion then suddenly transitioned to a much lower
rate. Changes in viscosity behavior such as this has been previously reported and has been
attributed to difference in relativities between components, diffusion limitations, or the onset of
phase separation in the system. [9, 52, 53, 60, 61] Further investigation suggests the transition is
related to the magnitude of viscosity reached during the reaction. After the viscosity reaches a
critical value, the rate of viscosity increase is severely inhibited. To identify the cause of this
behavior, the complex viscosity was plotted versus the conversion normalized by the initial
concentration of isocyanate added to the system and is plotted in Figure 4.11. This normalization
allows for comparison of the viscosity of different HS compositions as a function of total

94
isocyanate consumption. Through treating the data in this manner it becomes apparent that the
viscosity differences measured were a result of a difference in reactant concentration. Since the
viscosities collapse on a master curve when accounting for the starting concentration of the
reaction, the buildup of viscosity in the system is governed by the total isocyanate consumed
throughout the reaction. This plot also suggests that at a critical normalized viscosity when of
approximately 1,000 Pa∙s marks the transition in viscosity buildup behavior However, the
transition also occurs after consuming the same total amount of isocyanate during the reaction.
This behavior was not attributed to degradation because of the viscosity measured over this time
remained stable, supporting significant degradation had not occurred. While the results clearly
indicate a transition in viscosity behavior after a specific amount of isocyanate has been consumed,
further study will be required to determine the root cause of this transition.
4.4.3 Comparison of Model Between Steady Shear and Oscillatory Shear
The normalized viscosity of the 26.4 wt. %, 36.8 wt. %, and 55.6 wt. % HS systems were
fit using the same model developed for variation in shear rate of a constant composition material
to determine if this model could be useful when varying HS composition as well. The resultant
fitting parameters are shown in Table 4.2. These parameters indicate that again, the B value
remains near one as was the case under steady shear. The value of parameter C increased as the
wt. % HS in the system was increased.
In order to further evaluate the model, the model curve of 36.8 wt.% HS under oscillation
at 100 °C was overlaid on the on the viscosity versus conversion plot of the steady shear data as
shown in Figure 4.12. The solid line represents the model of the same composition at the same
temperature under oscillation at 6.28 rad/s (1 Hz). It is interesting to note that the oscillatory curve
falls near the lower shear rate as was expected because very low strain was expected during the

95
oscillation experiment. More specifically, this curve appears to match very closely to the steady
shear experiment at 1 sec-1. While it was not expected that Cox-Merz apply to this system, the 1
Hz and 1 sec-1 data match very similarly. To further probe this relationship, further experiments
across multiple frequencies should be performed to determine the extent to frequency and shear
behavior match. If oscillatory data shows similar trends as a function of frequency as steady shear
does to shear rate, further exploring this methodology could widen the predictive scope of this
technique.
4.5 Conclusions
TPUs are complicated materials which exhibit a complex relationship between viscosity
and reaction behavior, particularly during bulk polymerizations. In this work the influence of both
shear rate and composition on bulk polymerization were studied to determine the connection
between changes in melt viscosity and the progress of the reaction itself. The results indicated that
while maintaining a constant composition and reaction temperature, the conversion behavior was
sensitive to the shear rate applied. As the shear rate was increased, the system increased viscosity
more rapidly. While the viscosity was sensitive to shear rate throughout the reaction due to shear-
thinning, it was determined that the FTIR data collected provided a master curve when plotted
against the total strain applied to the system. This dependence demonstrated that when under flow,
the conversion of isocyanate to urethane bonds was directly related to the strain in the system.
Through this relationship the viscosity versus conversion data collected could be fit with a simple
model allowing the prediction of viscosity from conversion or vice versa. This relationship also
indicated a critical strain below which the reaction progresses under diffusion controlled behavior.
After sufficient strain was applied the viscosity then increased rapidly as it moved toward a
scenario where mixing of the reaction interfaces dominated the reaction behavior.

96
The concept applied to steady shear experiments was then expanded upon and applied to
oscillatory experiments using 26.4 wt. % HS, 36.8 wt. % HS, and 55.6 wt.% HS compositions
under isothermal conditions. First the polymerization was compared at 100 °C and the viscosity
behavior was documented. In order to provide a more comprehensive understanding of the
relationship between reaction progress and viscosity of the system, the different compositions were
compared under isothermal conditions at 200 °C. Using the increased temperature allowed
complete or nearly complete conversion to be reached. These results determined that varying
composition indicated the presence of a critical conversion where viscosity begins increasing
rapidly. Increasing the HS content of the system shifted this increase to earlier overall conversion
during the reaction. The results also detected a transition in reaction behavior after reaching a
critical viscosity. Once normalized by the initial concentration of isocyanate present in the system,
a master curve was developed based on composition. The ability to create a master curve through
this normalization determined that the most important factor in buildup of viscosity, regardless of
composition, was the total amount of isocyanate consumed up to any specific point in the reaction.
Finally, the model developed in this work shows good agreement between steady shear
experiments and SAOS experiments. This provides a promising base as a predictive technique
across different compositions and shear rates that is relevant to these bulk polymerizations in
continuous processes.
While these polymerizations on a rheometer are oversimplified from a production
standpoint due to the relatively low shear rates applied, this information could be quite useful for
understanding critical factors which should be carefully controlled in the process. The relationship
developed suggests adequate mixing in the system and control of total reactants consumed are of
the utmost importance. This information was only achievable due to the unique combination of

97
rheometry coupled with in situ FTIR. Through tracking the initial concentration of a process and
approximate shear conditions the relationship determined here provides an avenue to tune a
process to ensure the reaction is completed efficiently and to the desired specification. These
relationships also provide potential for future use in in-line or on-line measurement techniques for
process control applications.
4.6 References
[1] V. W. A. Verhoeven, A. D. Padsalgikar, K. J. Ganzeveld, and L. P. B. M. Janssen, "A
Kinetic Investigation of Polyurethane Polymerization for Reactive Extrusion Purposes,"
Journal of Applied Polymer Science, vol. 101, pp. 370-382, 2006.
[9] A. H. Navarchian, F. Picchioni, and L. P. B. M. Janssen, "Rheokinetics and effect of
shear rate on the kinetics of linear polyurethane formation," Polymer Engineering and
Science, vol. 45, pp. 279-287, Mar 2005.
[11] S. Ajithkumar, S. S. Kansara, and N. K. Patel, "Kinetics of Castor Oil Based Polyol-
Toluene Diisocyanate Reactions," European Polymer Journal, vol. 34, pp. 1273-1276,
1998.
[12] I. Yilgor, B. D. Mather, S. Unal, E. Yilgor, and T. E. Long, "Preparation of segemented,
high molecular weight, aliphatic poly(ether-urea) copolymers in isopropanol. In-situ
FTIR studies and polymer synthesis," Polymer, vol. 45, pp. 5829-5836, 2004.
[22] R. G. Pearson and E. L. Williams, "Interfacial Polymerization of an Isocyanate and a
Diol," Journal of Polymer Science Part a-Polymer Chemistry, vol. 23, pp. 9-18, 1985.
[32] C. Dubois, S. Desilets, A. Aitkadi, and P. Tanguy, "Bulk-Polymerization of Hydroxyl
Terminated Polybutadiene (Htpb) with Tolylene Diisocyanate (Tdi) - a Kinetics Study
Using C-13-Nmr Spectroscopy," Journal of Applied Polymer Science, vol. 58, pp. 827-
834, Oct 24 1995.
[33] D. Kincal and S. Ozkar, "Kinetic study of the reaction between hydroxyl-terminated
polybutadiene and isophorone diisocyanate in bulk by quantitative FTIR spectroscopy,"
Journal of Applied Polymer Science, vol. 66, pp. 1979-1983, Dec 5 1997.
[37] H. Madra, S. B. Tantekin-Ersolmaz, and F. S. Guner, "Monitoring of oil-based
polyurethane synthesis by FTIR-ATR," Polymer Testing, vol. 28, pp. 773-779, Oct 2009.
[38] E. B. Richter and C. W. Macosko, "Kinetics of Fast (Rim) Urethane Polymerization,"
Polymer Engineering and Science, vol. 18, pp. 1012-1018, 1978.
[52] A. Y. Malkin, "Rheology in polymerization processes," Polymer Engineering & Science,
vol. 20, pp. 1035-1044, 1980.
[53] A. Y. Malkin, S. G. Kulichikhin, D. N. Emel'yanov, and I. E. Smetanina, "Rheokinetics
of free-radical polymerization," Polymer, vol. 25, pp. 778-784, 1984.
[54] V. W. A. Verhoeven, M. P. Y. Van Vondel, K. J. Ganzeveld, and L. P. B. M. Janssen,
"Rheo-kinetic measurement of thermoplastic polyurethane polymerization in a
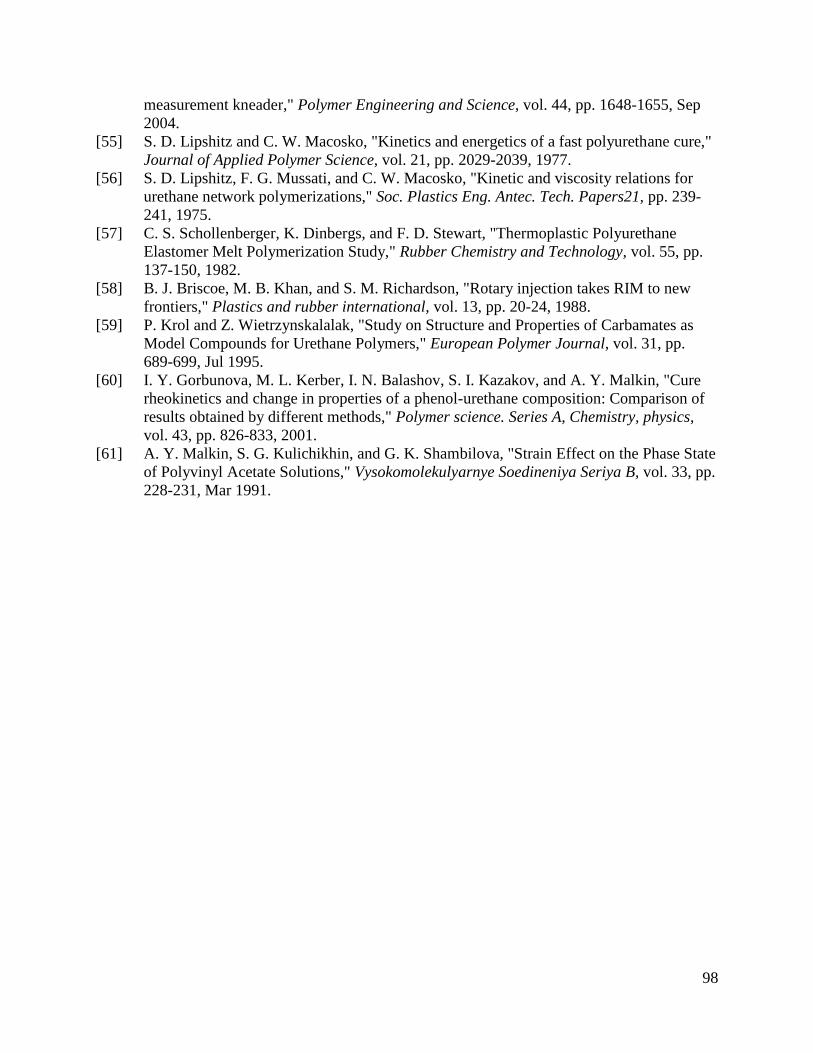
98
measurement kneader," Polymer Engineering and Science, vol. 44, pp. 1648-1655, Sep
2004.
[55] S. D. Lipshitz and C. W. Macosko, "Kinetics and energetics of a fast polyurethane cure,"
Journal of Applied Polymer Science, vol. 21, pp. 2029-2039, 1977.
[56] S. D. Lipshitz, F. G. Mussati, and C. W. Macosko, "Kinetic and viscosity relations for
urethane network polymerizations," Soc. Plastics Eng. Antec. Tech. Papers21, pp. 239-
241, 1975.
[57] C. S. Schollenberger, K. Dinbergs, and F. D. Stewart, "Thermoplastic Polyurethane
Elastomer Melt Polymerization Study," Rubber Chemistry and Technology, vol. 55, pp.
137-150, 1982.
[58] B. J. Briscoe, M. B. Khan, and S. M. Richardson, "Rotary injection takes RIM to new
frontiers," Plastics and rubber international, vol. 13, pp. 20-24, 1988.
[59] P. Krol and Z. Wietrzynskalalak, "Study on Structure and Properties of Carbamates as
Model Compounds for Urethane Polymers," European Polymer Journal, vol. 31, pp.
689-699, Jul 1995.
[60] I. Y. Gorbunova, M. L. Kerber, I. N. Balashov, S. I. Kazakov, and A. Y. Malkin, "Cure
rheokinetics and change in properties of a phenol-urethane composition: Comparison of
results obtained by different methods," Polymer science. Series A, Chemistry, physics,
vol. 43, pp. 826-833, 2001.
[61] A. Y. Malkin, S. G. Kulichikhin, and G. K. Shambilova, "Strain Effect on the Phase State
of Polyvinyl Acetate Solutions," Vysokomolekulyarnye Soedineniya Seriya B, vol. 33, pp.
228-231, Mar 1991.

99
4.7 Figures
0 200 400 600 80010
-3
10-2
10-1
100
101
102
103
104
105
106
0.1 sec-1
1.0 sec-1
5.0 sec-1
10.0 sec-1
15.0 sec-1
20.0 sec-1
Vis
co
sity
Time (sec)
Figure 4.1 - Viscosity versus time of 36.8 wt.% HS across a range of shear rates varying
from 0.1 sec-1 to 20 sec-1.
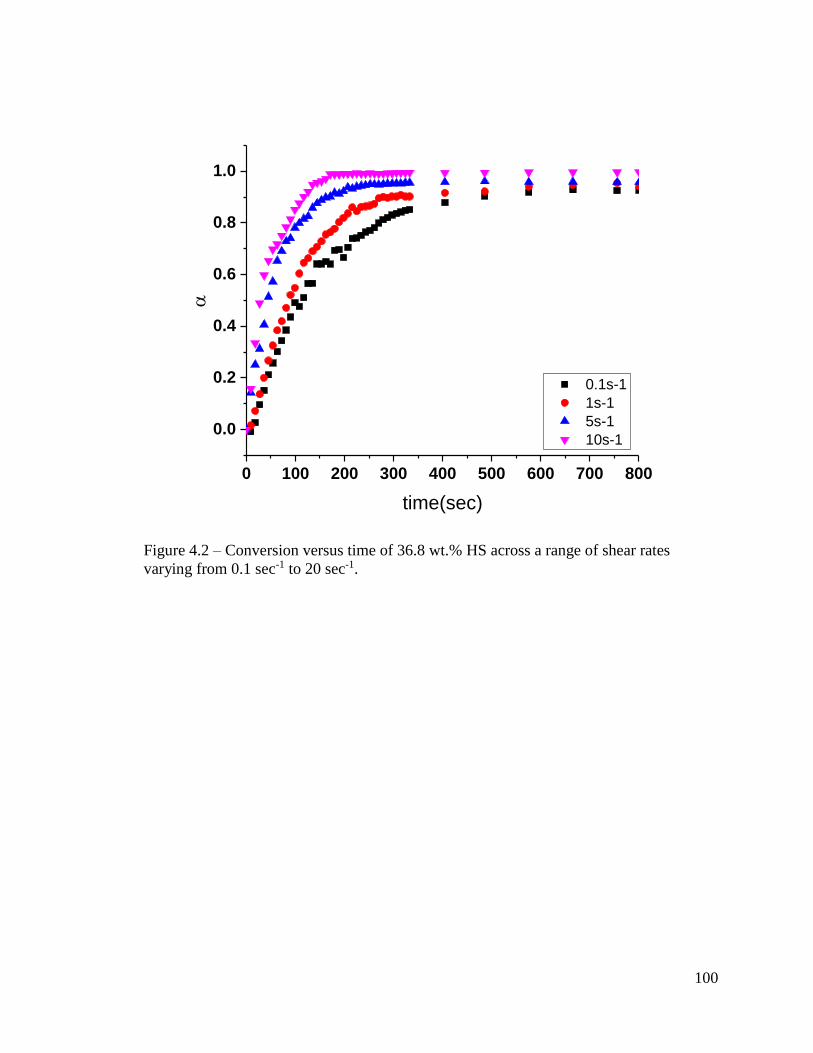
100
0 100 200 300 400 500 600 700 800
0.0
0.2
0.4
0.6
0.8
1.0
0.1s-1
1s-1
5s-1
10s-1
time(sec)
Figure 4.2 – Conversion versus time of 36.8 wt.% HS across a range of shear rates
varying from 0.1 sec-1 to 20 sec-1.

101
0.1 1 10 100 1000 1000010
-3
10-2
10-1
100
101
102
103
104
105
106
Vis
co
sity
Strain
0.1 sec-1
1.0 sec-1
5.0 sec-1
10.0 sec-1
15.0 sec-1
20.0 sec-1
Figure 4.3 Viscosity versus strain of 36.8 wt.% HS across a range of shear rates varying
from 0.1 sec-1 to 20 sec-1.
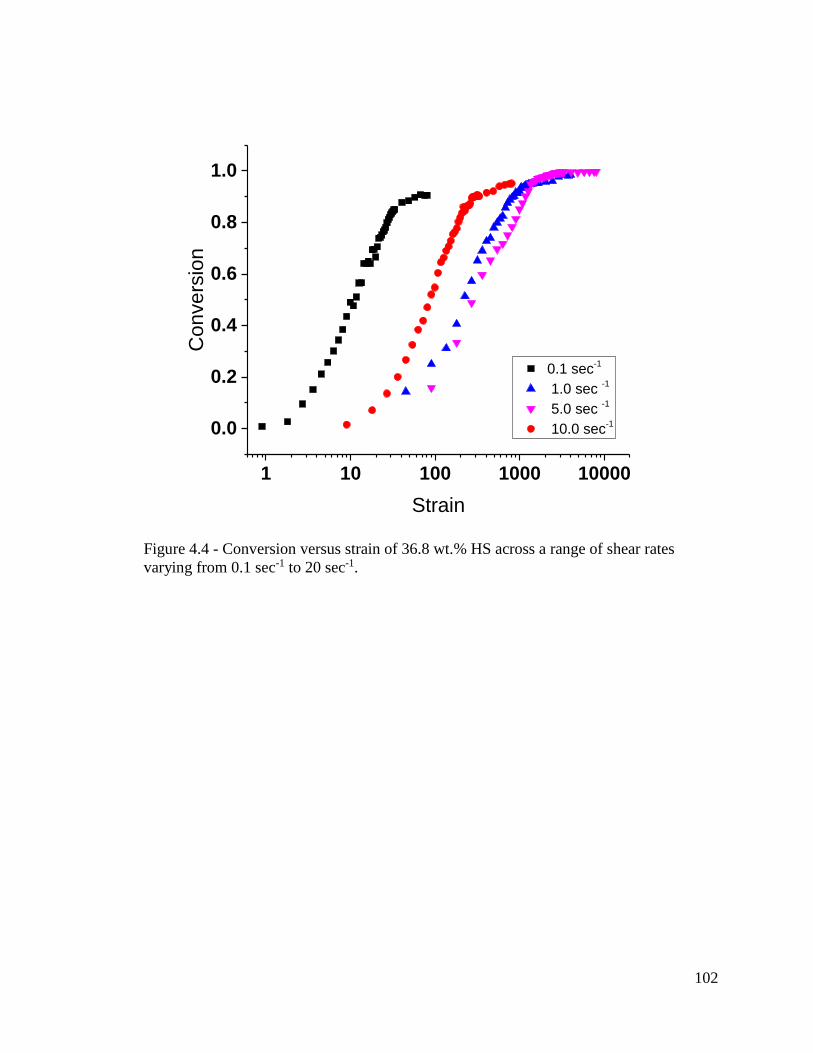
102
1 10 100 1000 10000
0.0
0.2
0.4
0.6
0.8
1.0
0.1 sec-1
1.0 sec -1
5.0 sec -1
10.0 sec-1
Co
nve
rsio
n
Strain
Figure 4.4 - Conversion versus strain of 36.8 wt.% HS across a range of shear rates
varying from 0.1 sec-1 to 20 sec-1.
103
0.0 0.2 0.4 0.6 0.8 1.0
200
400
600
800
1000
/
0
Conversion
Viscosity (0.1)
Viscosity (1)
Viscosity (5)
Viscosity (10)
Viscosity-Fit (0.1)
Viscosity-Fit (1)
Viscosity-Fit (5.0)
Viscosity-Fit (10.0)
Figure 4.5 – Normalized viscosity versus conversion with fit using Equation 4.7.
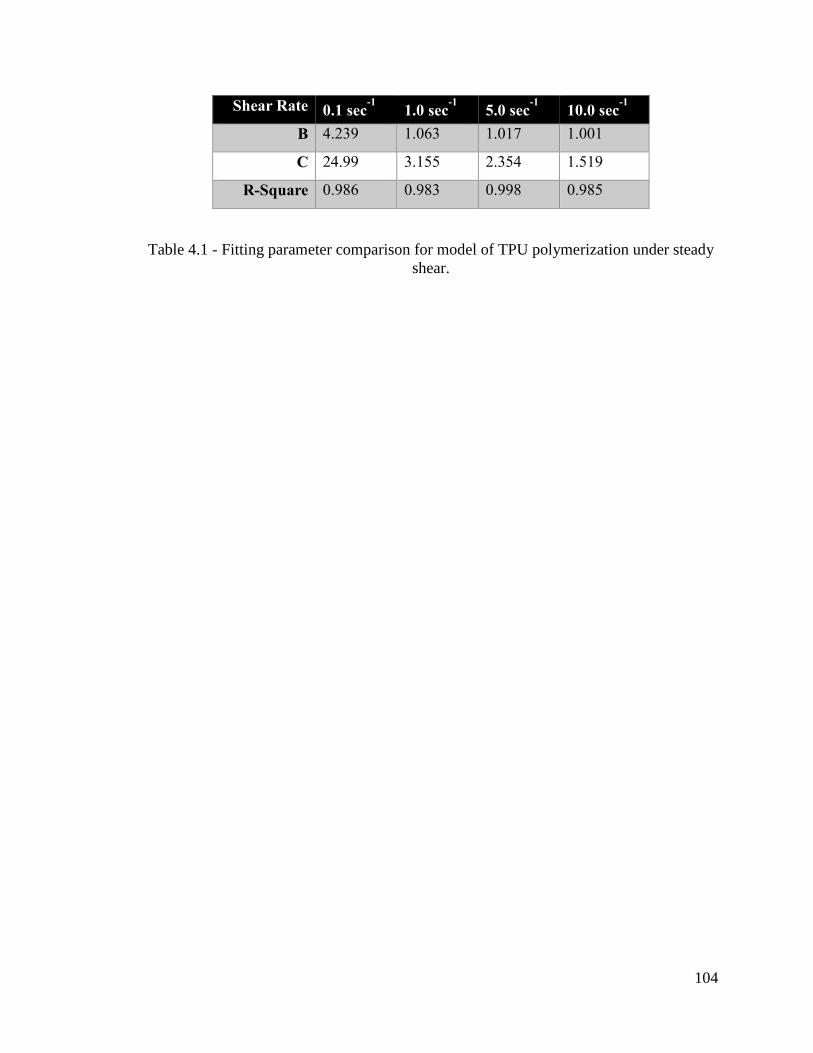
104
Shear Rate 0.1 sec-1 1.0 sec
-1 5.0 sec-1 10.0 sec
-1 B 4.239 1.063 1.017 1.001
C 24.99 3.155 2.354 1.519
R-Square 0.986 0.983 0.998 0.985
Table 4.1 - Fitting parameter comparison for model of TPU polymerization under steady
shear.
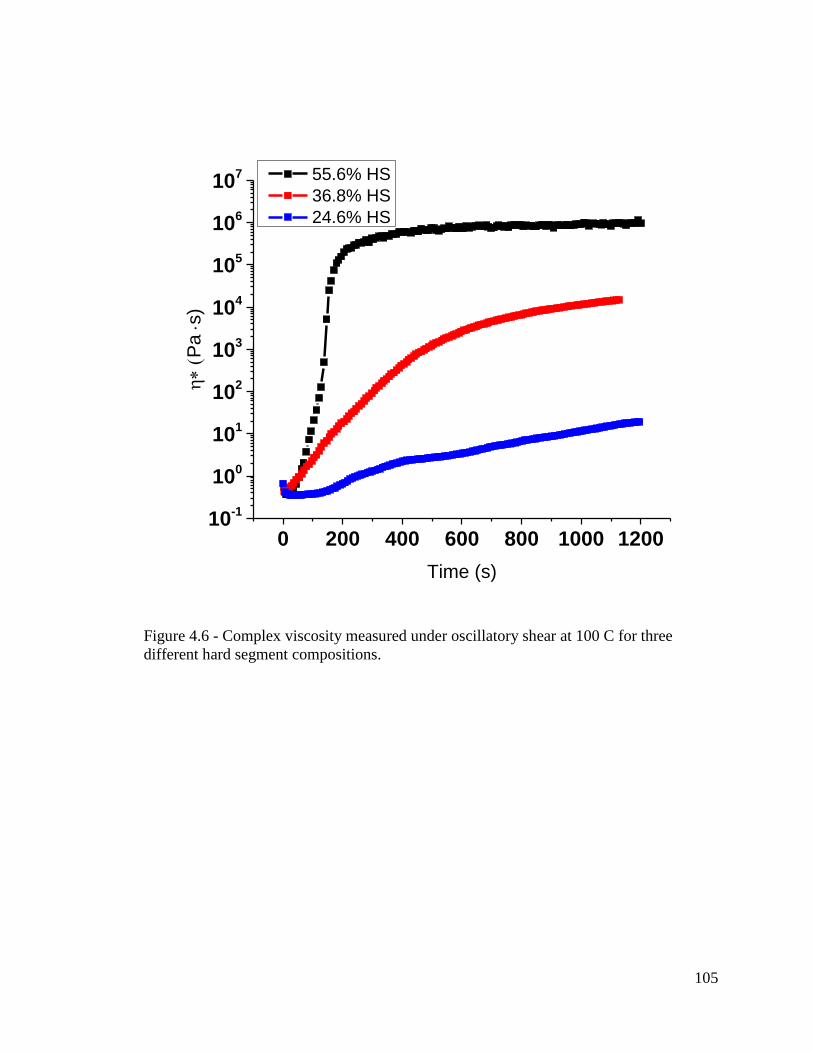
105
0 200 400 600 800 1000 120010
-1
100
101
102
103
104
105
106
107
(
Pa s)
Time (s)
55.6% HS
36.8% HS
24.6% HS
Figure 4.6 - Complex viscosity measured under oscillatory shear at 100 C for three
different hard segment compositions.

106
0.0 0.2 0.4 0.6 0.8 1.010
-1
100
101
102
103
104
105
106
107
26.4 wt. %HS
36.8 wt.% HS
55.6 wt. % HS
Conversion
Figure 4.7 – Normalized complex viscosity versus conversion for oscillatory shear
experiment at 100 °C.
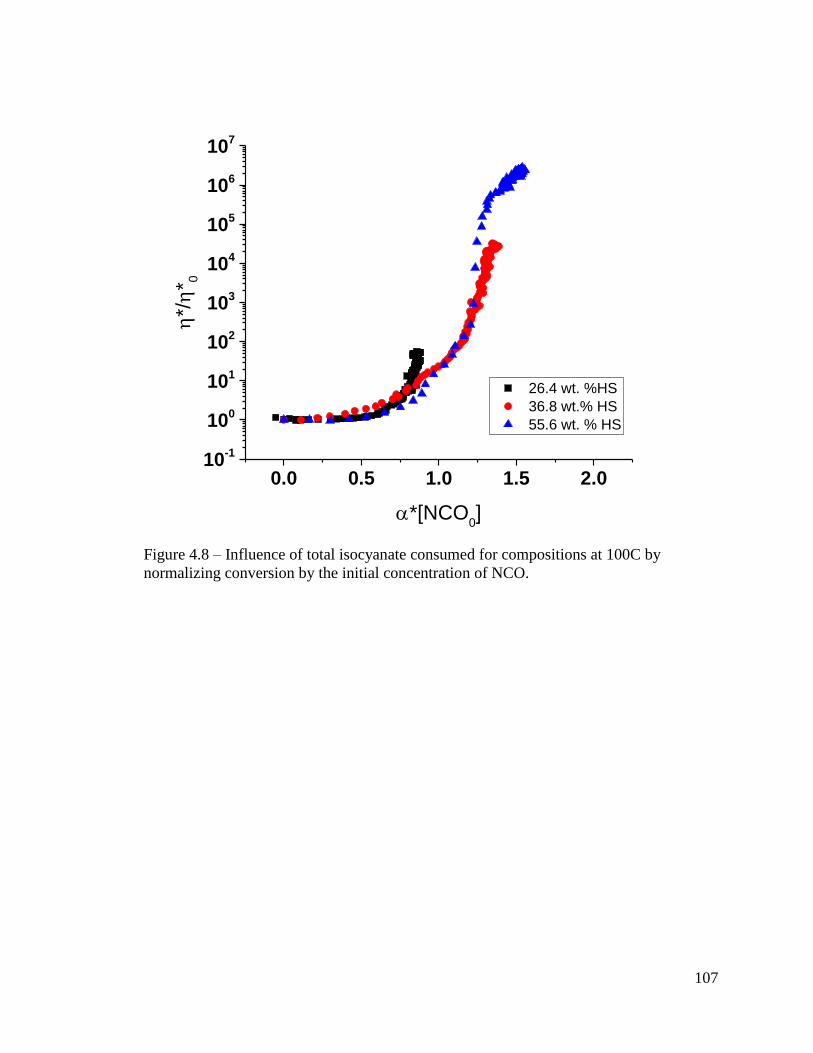
107
0.0 0.5 1.0 1.5 2.010
-1
100
101
102
103
104
105
106
107
26.4 wt. %HS
36.8 wt.% HS
55.6 wt. % HS
*/
* 0
*[NCO0]
Figure 4.8 – Influence of total isocyanate consumed for compositions at 100C by
normalizing conversion by the initial concentration of NCO.

108
0 500 1000 1500 2000 2500 300010
-1
100
101
102
103
104
105
55.6 wt. % HS
36.8 wt. % HS
26.4 wt. % HS
(
Pas
)
Time (s)
Figure 4.9 - Viscosity versus time plot of polymerization under isothermal conditions at
200 C.
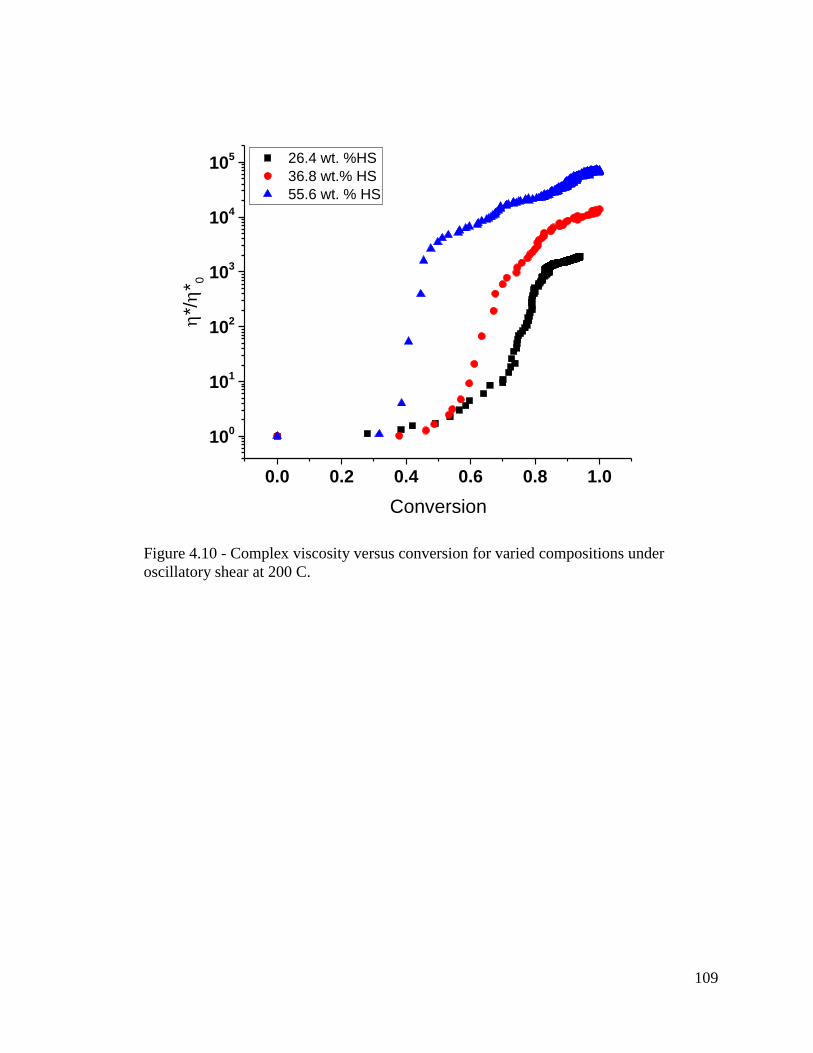
109
0.0 0.2 0.4 0.6 0.8 1.0
100
101
102
103
104
105 26.4 wt. %HS
36.8 wt.% HS
55.6 wt. % HS
*/
* 0
Conversion
Figure 4.10 - Complex viscosity versus conversion for varied compositions under
oscillatory shear at 200 C.

110
0.0 0.5 1.0 1.5 2.0
100
101
102
103
104
55.6 wt. %HS
36.8 wt. %HS
26.4 wt. % HS
*/
* 0
*[NCO0]
Figure 4.11 - Master curve of complex viscosity versus conversion normalized by the
initial concentration of NCO in the system.

111
Composition 26.4 wt. % HS 36.8 wt. % HS 55.6 wt. % HS
B 1.000 1.037 1.000
C 1.372 3.096 6.740
R-Square 0.975 0.984 0.958
Table 4.2 - Fitting parameter comparison for model of TPU polymerization of varied HS
content under oscillatory shear.

112
0.0 0.2 0.4 0.6 0.8 1.010
-1
100
101
102
103
104
105
106
0.1 sec-1
1.0 sec-1
5.0 sec-1
10.0 sec-1
OSC
Vis
cosity
Conversion
Figure 4.12 - Comparison of viscosity versus conversion behavior between oscillatory
and steady shear experiments of 36.8 wt. % HS TPU.
113
Chapter 5 : Effect of Soft-to-Hard Segment Ratio on
Viscoelastic Behavior of Model Thermoplastic
Polyurethanes During Phase Transitions
This chapter is partially based on:
Journal article:
J. L. Gadley, R. J. Andrade, and J. M. Maia, Macromolecular Materials and Engineering,
2016, DOI: 10.1002/mame.201500450
114
5.1 Abstract
Model thermoplastic polyurethanes were prepared with the aim of investigating the
effect of soft-to-hard segment ratio on the phase transition and the resulting structure that
forms upon isothermal exposure to temperatures near their phase transition temperature.
The dynamic rheological properties of TPUs before exposure to these isothermal
conditions show a phase transition at high temperatures that is directly related to the content
of hard segments. The extensional viscosity data indicates a strain-hardening behavior that
becomes less pronounced with the increase of hard segments.
After isothermal treatment, the DSC results show that the high temperature endotherm peak
narrowed and shifted to higher temperatures, suggesting a transition in structure. SAXS,
WAXS, and AFM results indicate a phase-separated system in which the hard domain sizes
and crystallinity change during this process. The rheological data collected after
recrystallization shows a significant increase in both moduli, transitioning from
viscoelastic fluid-like to glassy behavior. Concurrently, the uniaxial elongation viscosity
presents a significant increase in absolute values, but with a shift from strain-hardening to
strain-softening behavior for all strain rates. A transition from traditional phase separated
viscoelastic melt behavior to more brittle rupture is also observed, marking a significant
fundamental difference in properties before and after recrystallization.
115
5.2 Introduction
Thermoplastic polyurethanes (TPU) are multi-block copolymers typically constructed
of alternating hard and soft segments and have been the subject of a relatively strong effort
from both scientific and industrial communities due to their wide range of applications,
including coatings, fibers, films, footwear, wire and flexible tubing.[6, 62, 63] Hard
segments (HS) are composed of diisocyanate (e.g. 4,4’-methylenediphenyl diisocyanate
(MDI)) and short-chain diols (e.g. 1-4 butanediol (BDO)) as chain extenders, while soft
segments (SS) are composed of long-chain polyols, commonly polyesters or polyethers.
Through varying soft and hard segment chemistry and relative composition, a broad range
of physical properties are achievable, ranging from soft elastomers to hard plastics. The
wide property range of TPUs, specifically abrasion resistance, toughness, and flexibility,
is due to their high degree of chemical tunability. This allows TPUs to bridge the gap
between traditional rubber materials and plastics.
The structure and subsequent physical properties of TPUs are strongly affected by the
synthesis and processing conditions. These systems gain their mechanical property
versatility from the phase separation between hard and soft segments. Phase separation
occurs due to thermodynamically unfavorable phase-mixing conditions. A phase-separated
configuration reduces the enthalpic penalty of the system resulting in a more stable
configuration consisting of hard and soft domains. [64-66] While entropy is reduced when
phase separation occurs, this effect is primarily driven by the molecular weight of the SS
within the system. However, chemical compatibility of the HS and SS within the TPU leads
to an enthalpic driving force to generate phase separation where in most cases mixing the
SS and HS is energetically unfavorable. The ultimate properties of TPUs are strongly
116
influenced by the different morphologies which result from the phase separation character
of the system. These morphologies, while complex, commonly adopt a disordered globule
or fibrillar structure. At room temperature, TPUs offer a relatively high modulus and
extensibility, due to hydrogen bonding between HS acting as physical cross-links, while
preserving mobility of the flexible chains within the soft domains. When these systems are
heated above the melting temperature of the HS, phase mixing becomes more entropically
favorable over the phase separated morphology present at lower temperatures. The original
structure is recovered after cooling below the melting point of the HS. However, the rate
at which these materials traverse thermal transitions has a significant impact on the final
structure of the system.[48, 67, 68] This becomes particularly important when processing
TPUs or performing post-processing operations when specific final properties are desired.
In the past, extensive experimental studies have proven that a variety of thermal
transitions exist in TPUs that greatly influence the morphology of the system.[69-78] It is
well known that differential scanning calorimetry (DSC) experiments detect the existence
of multiple endothermic peaks during the melting process, particularly in multi-block
copolymers. Depending on the initial thermal and mechanical processing conditions, and
annealing conditions, up to three distinct peaks can be observed in DSC experiments: i)
Endotherm I at 60-80 °C, which is the glass transition of either the hard or soft segments;
ii) Endotherm II at 120-180 °C, influenced by the annealing on the hard segments; iii)
Endotherm III at temperatures around 200 ºC, associated to the microcrystalline peak. The
actual origins of the multiple endotherms have been attributed to different phase transitions,
such as phase separation, crystallization of the hard segments, and local restructuring of
the hard micro-domains.[79] In particular, studies show that in some systems, hard domains

117
may remain amorphous and exhibit only phase separation, while in other systems hard
domains can achieve high levels of crystallinity resulting in a wide range of potential
configurations.[80, 81]
The final structure, and consequently the rheological behavior, are affected by the
chemical structure of hard and soft segments, hydrogen bonding, molecular weight,
molecular weight distribution, thermal history, and ratio of hard and soft blocks.[26, 28,
30] Most of the studies that investigate the phase transition behavior of TPUs were
conducted by DSC, small angle X-ray scattering (SAXS) wide angle X-ray scattering
(WAXS), infrared spectroscopy (IR), and atomic force microcopy (AFM).[82-89] While
the understanding of phase transition behaviors are important to understanding thermal
post-processing conditions, these techniques leave a gap in the relationship between
exposure conditions and the physical performance of the system.
In order to further understand the physical implications of phase transitions, rheological
measurements can also be used as an experimental tool to monitor the behavior.[90-92]
Recently, it was shown that investigating the evolution of the viscoelastic moduli allows
significant insights to be gained into the kinetics of phase transition in a commercial
TPU.[88] The micro-phase separation between hard and soft segments and the
crystallization of hard phase domains originates at a solution to gel (sol-to-gel) transition.
The thermal history that the TPU was exposed to directly relates to the microstructure at
the critical gel point; an increase in HS content induces the shift of phase transition kinetics
to higher temperatures, due to an enhancement in the tendency for phase mixing to occur
during the phase transition of the TPU.[88, 92]
118
The aforementioned characteristics of TPUs demonstrate that both the phase separated
structure and rheological properties of the materials are affected by thermal history during
both synthesis and processing. However, very few investigations report on the influence of
thermal history on the shear and extensional rheology measurements at elevated
temperatures, where intermixing of the hard and soft domains occur.[87, 91-93] The effect
of thermal history on the evolution of the viscoelasticity of commercial TPUs were
investigated and proved to be very influential.[93] These changes in the rheological
character of the materials were attributed to either an order-to-disorder transition or
reconfiguration of the micro-phase separated structure present. However, minimal results
have been published on the effect of the phase transition structure on the elongational
viscosity. In one study, the effect of the molecular aggregation structure on the rheological
properties of TPUs was investigated and an increase in the micro-phase separation with the
increase of annealing temperature was observed.[87] These changes strongly influenced
the sol-to-gel transition temperature and the strain hardening of uniaxial elongational
viscosity. Recently, we reported the effect of uniaxial flow on the structural development
of commercial TPUs by showing a transition from strain-softening to strain-hardening at
strain rates above 1s-1.[94]
The purpose of this work is to further study the rheological behavior and related
structure development during the phase transition of TPUs upon their exposure to
temperatures near where phase transitions occur. In particular, we aim to understand the
effect of soft-to-hard segment ratio on the phase transition and structural and
morphological changes of well-characterized model thermoplastic polyurethanes upon
recrystallization at high temperatures. Downstream, from the applications point of view,
119
this knowledge can be very relevant when trying to understand how post-processing these
complex systems can alter performance.
Experimental
Materials
The TPUs used in this work were synthesized through bulk polymerization of a three
part system. The reactants used were 4,4’-methylenediphenyl diisocyanate (MDI), 1,4-
butanediol, and a 1,014 g/mol molecular weight polyester polyol (poly(butylene adipate))
was obtained from an industrial production source. The hydroxyl and isocyante ratio
remained 1:1, while adjustments in the chain extender and polyol were used to give three
different compositions, 26.4 wt. %, 36.8 wt. %, and 55.6 wt. % HS. The compositions were
achieved by adding mole ratios of 1.0 MDI:0.25 BDO :0.75 Polyol (26.4 wt. % HS), 1.0
MDI: 0.50 BDO: 0.50 Polyol (36.8 wt. % HS), and 1.0 MDI: 0.75 BDO: 0.25 Polyol (55.6
wt. % HS). Preparation of the samples were performed under bulk polymerization using
only heat to drive the polymerization. These components were added to an insulated vessel,
which was allowed to equilibrate to 200°C. The appropriate mass for the desired
composition of each component was carefully weighed to achieve a 50 g sample of the
desired HS content while maintaining proper stoichiometry. The polyol, which was stored
in a sealed container, was added to the vessel and allowed to melt (60 sec). Once the polyol
was fully melted the liquid BDO was added to the vessel. These components were mixed
briefly using a mechanical mixer at 20 rotations per minute (RPM). The MDI remained
frozen at -20 °C until immediately before use and was then added to the reaction vessel.
Immediately after adding the MDI the mechanical mixer was set to 100 RPM and allowed
120
to stir for 600 sec. The vessel was then covered and allowed to cool under ambient
conditions.
Thermal Analysis
The thermal properties of the TPU samples were investigated through the use of
differential scanning calorimetry (DSC). A TA Instruments Q100 DSC was used to
determine the enthalpy of melting of the various compositions. The samples used were 3-
5 mg of the TPU as reacted after remaining at ambient conditions for 24 h. The post small
angle oscillatory shear (SAOS) samples were also allowed to remain at ambient conditions
for 24 h before testing. The enthalpy of melting on the first heating was determined by
performing a heat/cool/heat experiment through integration of the endotherm bound by
deviation and return to the experimental baseline. DSC experiments used a lower
temperature of -80 °C, an upper temperature of 230 °C at a heating (and cooling) rate of
10 °C/min. This analysis was performed under continuous nitrogen purge at a flow rate of
50 ml/min.
X-ray diffraction
Two-dimensional (2D) small-angle X-ray scattering (SAXS) was used to investigate
morphological features of the TPU and 2D wide-angle X-ray scattering (WAXS) was used
to probe the crystallinity of the samples. The experiments were performed on the X27C
Advanced Polymers beamline (wavelength λ = 0.1371 nm) at Brookhaven National
Laboratory (BNL) National Synchrotron National Light Source – I (NSLS-I). A 2D Brüker
Smart 1500 X-ray CCD detector (1024 x 1024 pixels) The SAXS setup was calibrated
using a silver behenate (AgBe) standard with a 001 scattering vector (q) at 1.076 nm-1 to
calculate the sample-to-detector distance and calibrate the scattering vector. The sample-

121
to-detector distance was calculated to be 1783 mm. The WAXS setup was calibrated using
an aluminum oxide (Al2O3) standard with a 104 reflection at q = 18.6 nm-1 (2θ = 31.1°). A
sample-to-collector distance of 113.5 mm was calculated. For all experiments, plaque
samples were placed with their face perpendicular to the beam for an exposure time of 120
sec. The dark-field baseline and background scattering were collected for an exposure time
of 120 sec as well for consistency. The collected scattering images were then processed
using the software POLAR (Precision Works NY, Inc.) through correction with
background scattering and dark-field images. The corrected SAXS and WAXS data was
integrated to attain a one dimensional (1-D) intensity profile. The resulting 1-D WAXS
profiles were processed using peak fitting software assuming the amorphous region fit a
Gaussian distribution while the crystalline region fit a Lorentzian distribution. The
integrated difference of the amorphous and crystalline regions were used to determine the
percent crystallinity of the samples.
Atomic Force Microscopy (AFM)
The domain size and spacing in the TPUs was analyzed using AFM. Specifically, a
Veeco Multinode AFM was used with a NanoScope controller operating in tapping mode
under ambient conditions. The tips used for this work were Veeco antimony doped Si with
a spring constant of 20-80 N/m, an oscillating frequency of 327-383 kHz and a 3.5-4.5 μm
tip. The samples were prepared by cutting a small sample from a melt pressed disc prior
to performing rheological experiments. After the rheological experiments the disc was then
removed from the rheometer and a sample was prepared in the same manner. The samples
were placed on the stage face up by applying force to the edges to ensure adhesion to the

122
stage without damaging the test surface. The images were then analyzed using NanoScope
and ImageJ software.
Gel Permeation Chromatography (GPC)
The molecular weight and molecular weight distribution of the TPU before and after
annealing was measured using a Varian ProStar 210/215 GPC. Dimethylformamide (DMF)
was used as the eluent at a flow rate of 0.7 mL/min. Polymer laboratories PLGel columns
were used in conjunction with a Viscotek 270 Dual Dector multi-angle light scattering
(MALS) detector and a Varian ProStar Model 350 refractive index detector. The GPC
samples were prepared by creating a solution with a concentration of approximately 3
mg/mL in DMF for the analysis.
Rheology
A MARS III rheometer (Thermo Fisher Scientific), operated with a 20 mm parallel
plate setup was used to measure the dynamic rheological properties of the TPUs. Disk-
shaped TPU samples with 26.4 wt. %, 36.8 wt. %, and 55.6 wt. % hard segment of 20 mm
diameter and 1 mm thickness were molded in a compression molder at 140, 175, 225º C,
respectively. The melt pressing temperature was chosen at temperature above the
endothermic transition in the system in order to mitigate changes near the transition which
would be studied. The specimens were subject the respective temperature for 5 min during
molding. The system in the rheometer was first heated and kept at the desired temperature
for 2 min to reach equilibrium. All rheological experiments were performed under a
nitrogen atmosphere. Prior to the experiments, all samples were vacuum dried for 12 h at
70 C.
123
Time sweep experiments were conducted at different temperatures for each TPU. These
experiments were performed at constant frequency at 1 Hz. Frequency sweeps at constant
temperature with oscillatory shear frequency between 1 and 100 rad/s were also carried
out. Storage modulus (G’), loss modulus (G’’), and damping factor (tan δ) were measured
in all rheological experiments described above. All experiments were performed in the
linear viscoelastic regime, confirmed independently by stress sweeps.
Uniaxial elongation viscosity was measured on a SER fixture mounted on the same
rheometer, under different constant strain rates. Samples with length, width, and height
dimensions of 12.7 x 10.0 x 0.80 mm (L x W x H) were compression molded following the
same conditions for the disk-shaped samples. Sample preparation and loading followed the
procedures recommended by Barroso et al.[95] The extensional samples were allowed to
equilibrate for the same two-minute time period as was used in the oscillatory experiments
to ensure identical thermal history was applied to all rheology samples. In addition, this
established a uniform start time (t = 0) and mitigated any structural changes which may
occur during equilibration time and testing.
Results and Discussion
Thermal analyses of the TPUs with different ratios of hard and soft segments are shown
in Figure 5.1. The DSC thermograms of the TPUs exhibit endothermic peaks, which
become more pronounced and shift to higher temperatures with increasing HS content.
These results indicate that increasing HS content leads to a system with a higher affinity
toward developing a crystallized structure or at least a more robust structure that requires
greater energy input requirements for dissociation. This behavior exemplifies the
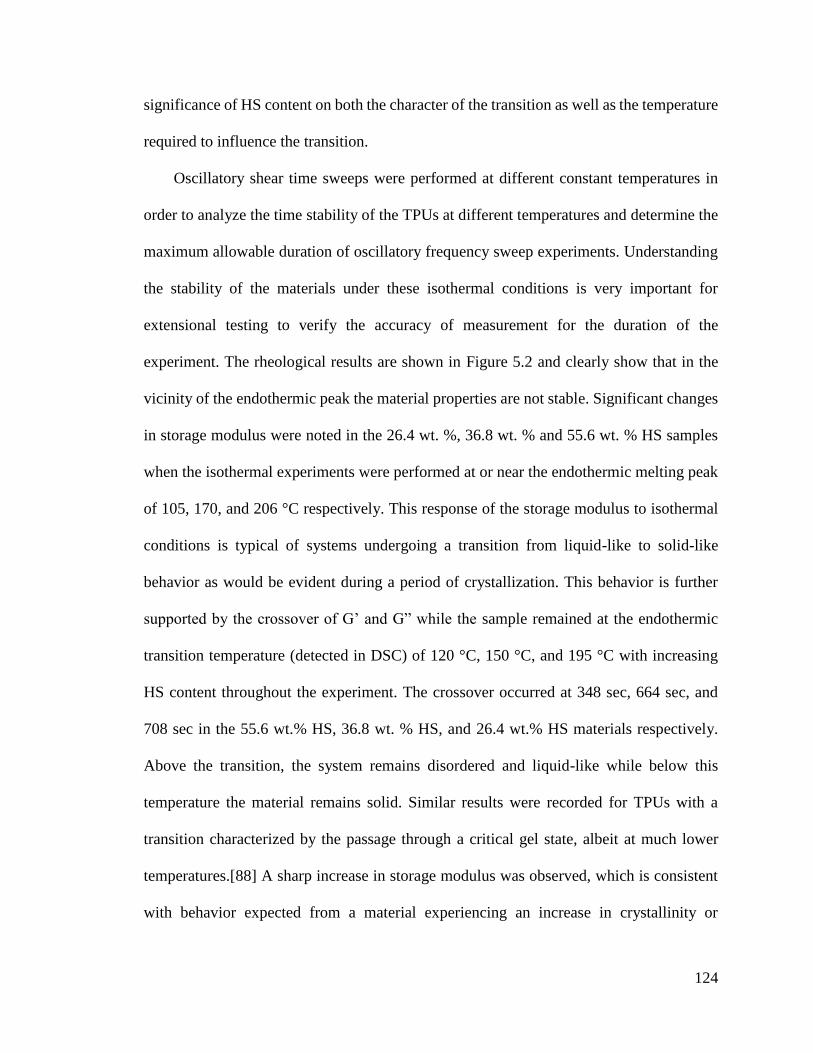
124
significance of HS content on both the character of the transition as well as the temperature
required to influence the transition.
Oscillatory shear time sweeps were performed at different constant temperatures in
order to analyze the time stability of the TPUs at different temperatures and determine the
maximum allowable duration of oscillatory frequency sweep experiments. Understanding
the stability of the materials under these isothermal conditions is very important for
extensional testing to verify the accuracy of measurement for the duration of the
experiment. The rheological results are shown in Figure 5.2 and clearly show that in the
vicinity of the endothermic peak the material properties are not stable. Significant changes
in storage modulus were noted in the 26.4 wt. %, 36.8 wt. % and 55.6 wt. % HS samples
when the isothermal experiments were performed at or near the endothermic melting peak
of 105, 170, and 206 °C respectively. This response of the storage modulus to isothermal
conditions is typical of systems undergoing a transition from liquid-like to solid-like
behavior as would be evident during a period of crystallization. This behavior is further
supported by the crossover of G’ and G” while the sample remained at the endothermic
transition temperature (detected in DSC) of 120 °C, 150 °C, and 195 °C with increasing
HS content throughout the experiment. The crossover occurred at 348 sec, 664 sec, and
708 sec in the 55.6 wt.% HS, 36.8 wt. % HS, and 26.4 wt.% HS materials respectively.
Above the transition, the system remains disordered and liquid-like while below this
temperature the material remains solid. Similar results were recorded for TPUs with a
transition characterized by the passage through a critical gel state, albeit at much lower
temperatures.[88] A sharp increase in storage modulus was observed, which is consistent
with behavior expected from a material experiencing an increase in crystallinity or
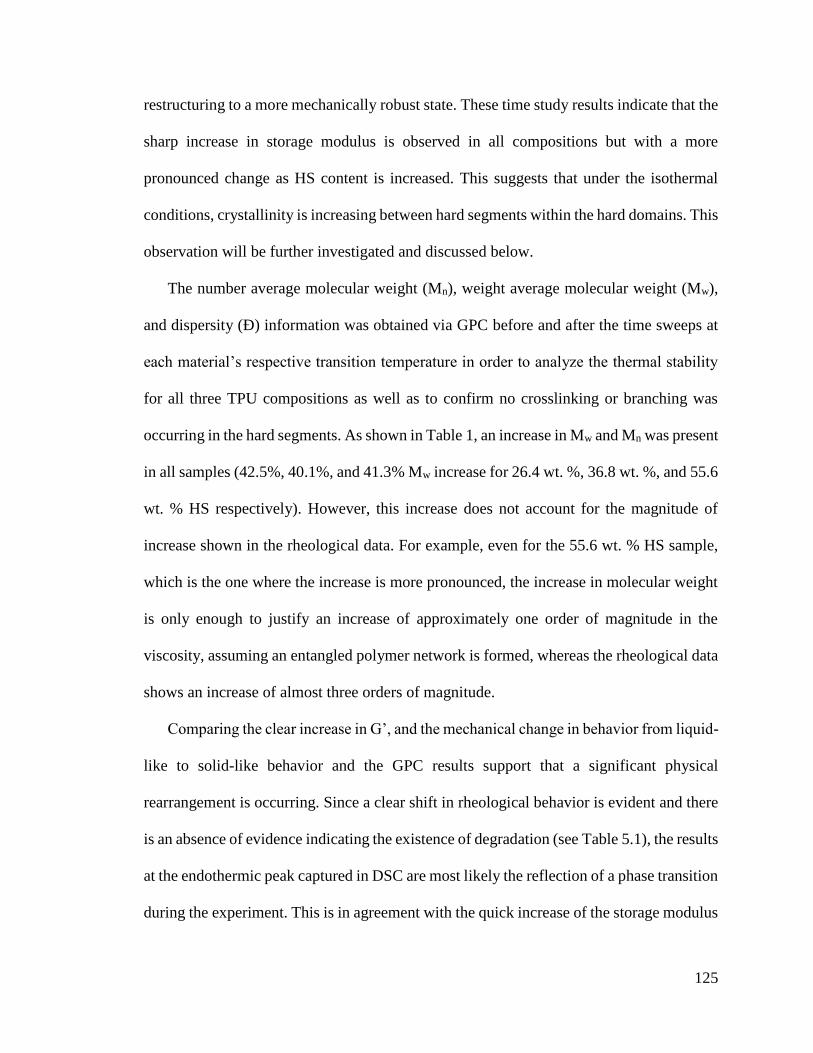
125
restructuring to a more mechanically robust state. These time study results indicate that the
sharp increase in storage modulus is observed in all compositions but with a more
pronounced change as HS content is increased. This suggests that under the isothermal
conditions, crystallinity is increasing between hard segments within the hard domains. This
observation will be further investigated and discussed below.
The number average molecular weight (Mn), weight average molecular weight (Mw),
and dispersity (Ð) information was obtained via GPC before and after the time sweeps at
each material’s respective transition temperature in order to analyze the thermal stability
for all three TPU compositions as well as to confirm no crosslinking or branching was
occurring in the hard segments. As shown in Table 1, an increase in Mw and Mn was present
in all samples (42.5%, 40.1%, and 41.3% Mw increase for 26.4 wt. %, 36.8 wt. %, and 55.6
wt. % HS respectively). However, this increase does not account for the magnitude of
increase shown in the rheological data. For example, even for the 55.6 wt. % HS sample,
which is the one where the increase is more pronounced, the increase in molecular weight
is only enough to justify an increase of approximately one order of magnitude in the
viscosity, assuming an entangled polymer network is formed, whereas the rheological data
shows an increase of almost three orders of magnitude.
Comparing the clear increase in G’, and the mechanical change in behavior from liquid-
like to solid-like behavior and the GPC results support that a significant physical
rearrangement is occurring. Since a clear shift in rheological behavior is evident and there
is an absence of evidence indicating the existence of degradation (see Table 5.1), the results
at the endothermic peak captured in DSC are most likely the reflection of a phase transition
during the experiment. This is in agreement with the quick increase of the storage modulus
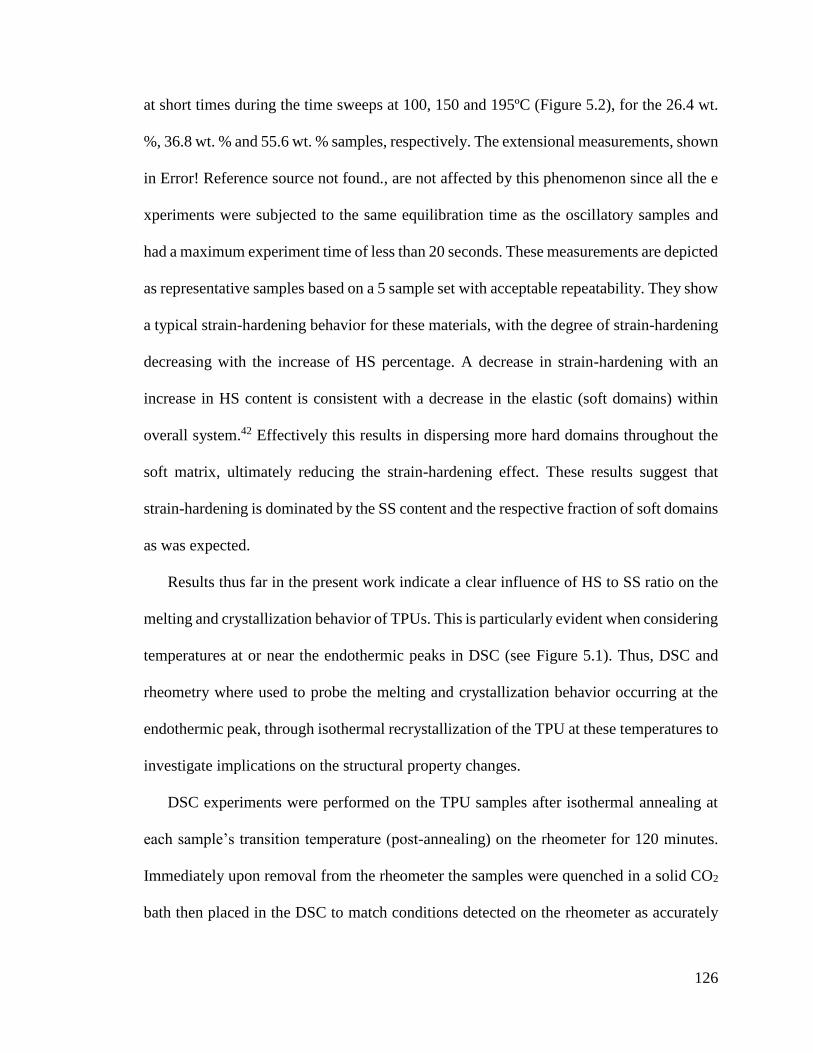
126
at short times during the time sweeps at 100, 150 and 195ºC (Figure 5.2), for the 26.4 wt.
%, 36.8 wt. % and 55.6 wt. % samples, respectively. The extensional measurements, shown
in Error! Reference source not found., are not affected by this phenomenon since all the e
xperiments were subjected to the same equilibration time as the oscillatory samples and
had a maximum experiment time of less than 20 seconds. These measurements are depicted
as representative samples based on a 5 sample set with acceptable repeatability. They show
a typical strain-hardening behavior for these materials, with the degree of strain-hardening
decreasing with the increase of HS percentage. A decrease in strain-hardening with an
increase in HS content is consistent with a decrease in the elastic (soft domains) within
overall system.42 Effectively this results in dispersing more hard domains throughout the
soft matrix, ultimately reducing the strain-hardening effect. These results suggest that
strain-hardening is dominated by the SS content and the respective fraction of soft domains
as was expected.
Results thus far in the present work indicate a clear influence of HS to SS ratio on the
melting and crystallization behavior of TPUs. This is particularly evident when considering
temperatures at or near the endothermic peaks in DSC (see Figure 5.1). Thus, DSC and
rheometry where used to probe the melting and crystallization behavior occurring at the
endothermic peak, through isothermal recrystallization of the TPU at these temperatures to
investigate implications on the structural property changes.
DSC experiments were performed on the TPU samples after isothermal annealing at
each sample’s transition temperature (post-annealing) on the rheometer for 120 minutes.
Immediately upon removal from the rheometer the samples were quenched in a solid CO2
bath then placed in the DSC to match conditions detected on the rheometer as accurately
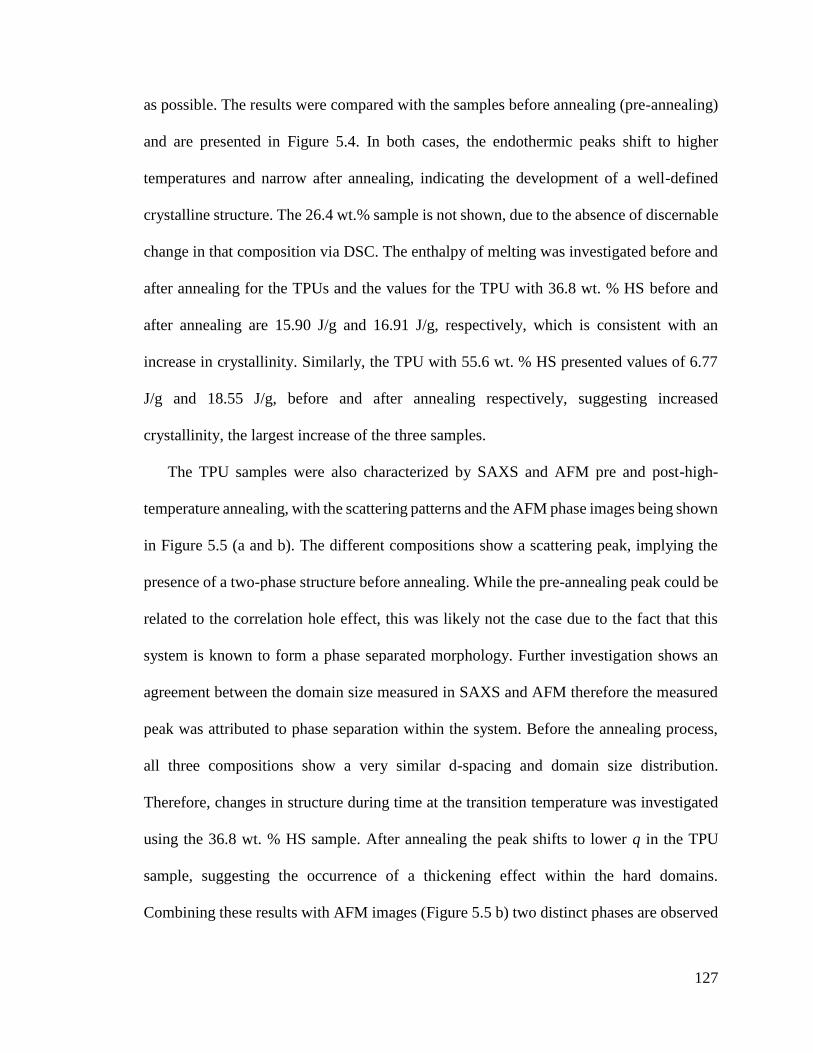
127
as possible. The results were compared with the samples before annealing (pre-annealing)
and are presented in Figure 5.4. In both cases, the endothermic peaks shift to higher
temperatures and narrow after annealing, indicating the development of a well-defined
crystalline structure. The 26.4 wt.% sample is not shown, due to the absence of discernable
change in that composition via DSC. The enthalpy of melting was investigated before and
after annealing for the TPUs and the values for the TPU with 36.8 wt. % HS before and
after annealing are 15.90 J/g and 16.91 J/g, respectively, which is consistent with an
increase in crystallinity. Similarly, the TPU with 55.6 wt. % HS presented values of 6.77
J/g and 18.55 J/g, before and after annealing respectively, suggesting increased
crystallinity, the largest increase of the three samples.
The TPU samples were also characterized by SAXS and AFM pre and post-high-
temperature annealing, with the scattering patterns and the AFM phase images being shown
in Figure 5.5 (a and b). The different compositions show a scattering peak, implying the
presence of a two-phase structure before annealing. While the pre-annealing peak could be
related to the correlation hole effect, this was likely not the case due to the fact that this
system is known to form a phase separated morphology. Further investigation shows an
agreement between the domain size measured in SAXS and AFM therefore the measured
peak was attributed to phase separation within the system. Before the annealing process,
all three compositions show a very similar d-spacing and domain size distribution.
Therefore, changes in structure during time at the transition temperature was investigated
using the 36.8 wt. % HS sample. After annealing the peak shifts to lower q in the TPU
sample, suggesting the occurrence of a thickening effect within the hard domains.
Combining these results with AFM images (Figure 5.5 b) two distinct phases are observed

128
before annealing, with HS and SS appearing as light and dark regions respectively. After
annealing, the AFM image suggests that the HS have grown and become less uniform in
size supporting the observations in SAXS. The 1D SAXS curve appears to show no long
range ordering in both the pre-recrystallization and post-recrystallization meaning little to
no periodicity of the hard segments exist but that the domains have simply thickened by
remaining isothermal at the transition temperature (Figure 5.5b). The corresponding AFM
images indicate an increase in HS domains during annealing, which suggests that a further
increase of the hard segment concentration results in an increase in the size of hard domains
during annealing. This is likely due to coalescence of some of these domains into longer,
irregular domains. The result is a broad distribution of hard domain sizes, which is reflected
as smaller angles and less pronounced SAXS pattern peak. Similar results showing the
effect of increasing the HS content in SAXS behavior were also observed in earlier
investigations.[77, 96]
Analysis of data collected from WAXS experiments (exemplified in Figure 5.6 for the
36.8 wt. % sample) indicates a transition from an amorphous material to a crystalline
material during the isothermal cycle and thus gives further support to changes occurring
during the phase transition. In fact, all three compositions were initially amorphous and
transitioned to a crystallinity value of 7.4%, 16.2%, and 39.3% (samples containing 26.4
wt. %, 36.8 wt. %, and 55.6 wt. % respectively).
These findings are confirmed by the rheological data collected after 120 minutes of
isothermal annealing for TPUs with 36.8 and 55.6 wt. % HS, which is shown in Figure 5.7.
By analyzing the frequency sweeps before and after the isothermal annealing, it is possible
to observe a significant increase in both moduli. Furthermore, the storage modulus is

129
almost independent of the frequency after the isothermal annealing, which is indicative of
a structural change. The effect of the annealing on the uniaxial elongational viscosity was
also investigated (Figure 5.8).
The results indicate an increase in base extensional viscosity of 10-20 times and strain-
softening behavior for all strain rates. The behavior was classified as true strain softening
since the effect happened prior to the observation of any rupture through real-time video.
Any data collected after any evidence of rupture onset was disregarded. A brittle solid like
rupture is observed in Figure 5.9 (still image from video during experiment) when
compared to the typical of phase-separated viscoelastic melt. The results shown for the
55.6 wt. % HS TPU indicated more pronounced strain-softening behavior than the TPUs
containing 26.4 wt. % and 36.8 wt. % HS which suggests a higher degree of embrittlement.
This was also observed in the frequency sweep with the higher modulus values as well. It
was also observed that increasing the HS content caused the transition to shift to higher
temperatures, which affected the viscoelastic properties of the amorphous phase for lower
HS percentages. The change in behavior to strain-softening has been attributed in studies
relating uniaxial flow and SAXS to a complex rearrangement and disordering of micro
domain structures during deformation.[96] While this behavior is likely the root cause of
the drastic extensional transition observed in this work, many factors related to
morphology, increased phase separation, crystal size and type, to name a few, are present
in these systems. Therefore, further studies are necessary to determine the specific origin
observed within this work. When exposed to temperatures near this transition range the
physical properties of the material changes drastically and transitions to entirely different
130
viscoelastic behavior which could be detrimental to the function of these systems in
application.
Our results reveal a direct influence of the HS content in the rheological properties
before, during, and after exposure to isothermal conditions near the phase transition
temperature. This effect is attributed to changes in crystallinity over time while maintaining
a temperature near the endothermic transition noted in DSC, which became more
pronounced as HS content was increased. The isothermal study demonstrated that these
TPUs go through a transition from the melt state to solid-like behavior at the same
temperature, which is attributed to crystallization and is enhanced with increasing HS
content. The resulting highly crystalline hard domains (as opposed to the amorphous hard
domains before melting and recrystallization) gave rise to very different rheological
behavior under both shear and extensional conditions. DSC results support the shift in
crystallinity as well as a shift of the melting point to higher temperatures, suggesting a new
ordered and more uniform hard domain structure. This transition is more pronounced with
the increase of HS content due to the increased amount of crystallizable material present
in the system. SAXS and AFM results indicate a phase separation for pre-crystallized
TPUs. After melting and recrystallization have occurred, the hard domains grow in size
further supporting the drastic changes in behavior stem from these changes. The structures
formed and the differences in HS content suggest that as the fraction of HS within the
system increases the drastic increase in crystallinity strongly affect rheological properties
and overall material behavior.
Conclusions

131
In this work, the effect soft-to-hard segment ratio on the phase transition of model
thermoplastic polyurethanes and its influence on the structure and rheological properties
before and after isothermal recrystallization at temperatures near the material’s transition
temperature was investigated.
The rheological properties of TPUs after polymerization show a phase transition at high
temperatures that is directly related to the content of hard segments. The extensional
viscosity data indicates a strain-hardening behavior that becomes less pronounced with the
increase of hard segment content, suggesting this specific extensional behavior is governed
by the soft segments, as expected.
In order to study the phase transition occurring at the dissociation point, isothermal
experiments, i.e., recrystallization, were conducted near the phase transition temperatures
of each material. The results from DSC present significant changes in the thermograms,
which show that the high-temperature endotherm peak narrowed and shifted to higher
temperatures over time, suggesting a more ordered and crystalline-like structure. SAXS
and AFM results indicate a phase separated system for the recrystallized TPUs, which
confirms the DSC findings. After exposure to isothermal conditions the hard domain sizes
increased, supporting that the increase in crystallinity was occurring in the hard domains
rather than the soft domains. The AFM data even indicated that at the highest HS
percentage (> 50 wt. %) the system appears to move toward a more phase mixed scenario.
The rheological behavior after recrystallization shows a significant increase in both
moduli, with a transition from a viscoelastic fluid behavior to a gel-like behavior, i.e., much
higher storage modulus than loss modulus, with the former showing almost no dependence
on frequency. The uniaxial elongation viscosity increases between 10 and 20 times
132
relatively to the non-crystallized samples, and the behavior changed to strain-softening at
all strain rates. Brittle rupture was observed when compared to the expected rupture mode
typical of a phase-separated viscoelastic melt as observed in the samples before
recrystallization.
Overall, the structural development of TPUs annealed at temperatures near their
dissociation temperature has been shown to significantly alter the crystallinity of the
system and ultimately the properties of the TPUs. Understanding this relationship provides
an avenue to tailor TPU performance through post-processing and expands the broad range
of structure and properties available within these complex systems.

133
References
[6] C. Hepburn, Polyurethane elastomers, 2nd ed. London ; New York
New York, NY, USA: Elsevier Applied Science ;
Sole distributed in the USA and Canada, Elsevier Science Pub. Co., 1992.
[26] H. D. Kim, J. H. Huh, E. Y. Kim, and C. C. Park, "Comparison of properties of
thermoplastic polyurethane elastomers with two different soft segments," Journal
of Applied Polymer Science, vol. 69, pp. 1349-1355, Aug 15 1998.
[28] S. Velankar and S. L. Cooper, "Microphase separation and rheological properties
of polyurethane melts. 3. Effect of block incompatibility on the viscoelastic
properties," Macromolecules, vol. 33, pp. 395-403, Jan 25 2000.
[30] L. M. Leung and J. T. Koberstein, "Dsc Annealing Study of Microphase
Separation and Multiple Endothermic Behavior in Polyether-Based Polyurethane
Block Copolymers," Macromolecules, vol. 19, pp. 706-713, Mar 1986.
[48] K. Kojio, M. Furukawa, Y. Nonaka, and S. Nakamura, "Control of Mechanical
Properties of Thermoplastic Polyurethane Elastomers by Restriction of
Crystallization of Soft Segment," Materials, vol. 3, pp. 5097-5110, Dec 2010.
[62] N. G. Gaylord and N. V. Seeger, "Polyurethanes: chemistry and technology, Part
I. (High Polymers, Vol. XVI). J. H. SAUNDERS and K. C. FRISCH,
Interscience, New York, 1962. ," Journal of Applied Polymer Science, vol. 8, pp.
1498-1499, 1964.
[63] G. n. Oertel and L. Abele, Polyurethane handbook : chemistry, raw materials,
processing, application, properties, 2nd ed. Munich ; New York
Cincinnati: Hanser ;
Hanser/Gardner distributor, 1994.
[64] S. B. Clough and N. S. Schneider, "Structural studies on urethane elastomers,"
Journal of Macromolecular Science, Part B, vol. 2, pp. 553-566, 1968/12/01
1968.
[65] G. M. Estes, R. W. Seymour, and S. L. Cooper, "Infrared Dichroism of
Segmented Polyurethane Elastomers - Poly," Abstracts of Papers of the American
Chemical Society, pp. 26-&, 1970.
[66] J. A. Koutsky, N. V. Hien, and S. L. Cooper, "Some Results on Electron
Microscope Investigations of Polyether-Urethane and Polyester-Urethane Block
Copolymers," Journal of Polymer Science Part B-Polymer Letters, vol. 8, pp.
353-&, 1970.
[67] A. Frick and A. Rochman, "Characterization of TPU-elastomers by thermal
analysis (DSC)," Polymer Testing, vol. 23, pp. 413-417, 6// 2004.
[68] M. A. Hood, B. Wang, J. M. Sands, J. J. La Scala, F. L. Beyer, and C. Y. Li,
"Morphology control of segmented polyurethanes by crystallization of hard and
soft segments," Polymer, vol. 51, pp. 2191-2198, 5/4/ 2010.
[69] T. R. Hesketh, J. W. C. Van Bogart, and S. L. Cooper, "Differential scanning
calorimetry analysis of morphological changes in segmented elastomers,"
Polymer Engineering & Science, vol. 20, pp. 190-197, 1980.

134
[70] H. N. Ng, A. E. Allegrezza, R. W. Seymour, and S. L. Cooper, "Effect of segment
size and polydispersity on the properties of polyurethane block polymers,"
Polymer, vol. 14, pp. 255-261, 1973/06/01 1973.
[71] S. L. Samuels and G. L. Wilkes, "Comments on the multiple endothermic
behavior observed in segmented urethane systems," Journal of Polymer Science:
Polymer Physics Edition, vol. 11, pp. 807-811, 1973.
[72] R. W. Seymour and S. L. Cooper, "DSC studies of polyurethane block polymers,"
Journal of Polymer Science Part B: Polymer Letters, vol. 9, pp. 689-694, 1971.
[73] R. W. Seymour and S. L. Cooper, "Thermal Analysis of Polyurethane Block
Polymers," Macromolecules, vol. 6, pp. 48-53, 1973/01/01 1973.
[74] J. W. C. Van Bogart, D. A. Bluemke, and S. L. Cooper, "Annealing-induced
morphological changes in segmented elastomers," Polymer, vol. 22, pp. 1428-
1438, 1981/10/01 1981.
[75] G. L. Wilkes, S. Bagrodia, W. Humphries, and R. Wildnauer, "The time
dependence of the thermal and mechanical properties of segmented urethanes
following thermal treatment," Journal of Polymer Science: Polymer Letters
Edition, vol. 13, pp. 321-327, 1975.
[76] G. L. Wilkes and J. A. Emerson, "Time dependence of small‐angle x‐ray
measurements on segmented polyurethanes following thermal treatment," Journal
of Applied Physics, vol. 47, pp. 4261-4264, 1976.
[77] G. L. Wilkes and R. Wildnauer, "Kinetic behavior of the thermal and mechanical
properties of segmented urethanes," Journal of Applied Physics, vol. 46, pp.
4148-4152, 1975.
[78] J. T. Koberstein and A. F. Galambos, "Multiple melting in segmented
polyurethane block copolymers," Macromolecules, vol. 25, pp. 5618-5624, 1992.
[79] A. J. Ryan, C. W. Macosko, and W. Bras, "Order-disorder transition in a block
copolyurethane," Macromolecules, vol. 25, pp. 6277-6283, 1992.
[80] B. Chu, T. Gao, Y. Li, J. Wang, C. R. Desper, and C. A. Byrne, "Microphase
separation kinetics in segmented polyurethanes: effects of soft segment length and
structure," Macromolecules, vol. 25, pp. 5724-5729, 1992.
[81] J. T. Koberstein and T. P. Russell, "Simultaneous SAXS-DSC study of multiple
endothermic behavior in polyether-based polyurethane block copolymers,"
Macromolecules, vol. 19, pp. 714-720, 1986.
[82] W. Hu and J. T. Koberstein, "The effect of thermal annealing on the thermal
properties and molecular weight of a segmented polyurethane copolymer,"
Journal of Polymer Science Part B: Polymer Physics, vol. 32, pp. 437-446, 1994.
[83] J. T. Koberstein, I. Gancarz, and T. C. Clarke, "The effects of morphological
transitions on hydrogen bonding in polyurethanes: Preliminary results of
simultaneous DSC–FTIR experiments," Journal of Polymer Science Part B:
Polymer Physics, vol. 24, pp. 2487-2498, 1986.
[84] L. M. Leung and J. T. Koberstein, "Small‐angle scattering analysis of hard‐microdomain structure and microphase mixing in polyurethane elastomers,"
Journal of Polymer Science: Polymer Physics Edition, vol. 23, pp. 1883-1913,
1985.
135
[85] D. Nichetti and N. Grizzuti, "Determination of the phase transition behavior of
thermoplastic polyurethanes from coupled rheology/DSC measurements,"
Polymer Engineering & Science, vol. 44, pp. 1514-1521, 2004.
[86] R. A. Phillips and S. L. Cooper, "Morphology development during solid‐state
annealing of poly (ether‐ester) multiblock copolymers," Journal of Polymer
Science Part B: Polymer Physics, vol. 34, pp. 737-749, 1996.
[87] J. Silva, R. Andrade, R. Huang, J. Liu, M. Cox, and J. M. Maia, "Rheological
behavior and structure development in thermoplastic polyurethanes under uniaxial
extensional flow," Journal of Non-Newtonian Fluid Mechanics, vol. 222, pp. 96-
103, 2015.
[88] J. Silva, D. Meltzer, J. Liu, M. Cox, and J. Maia, "The influence of thermo‐mechanical history on structure development of elastomeric and amorphous glass
thermoplastic polyurethanes," Polymer Engineering & Science, vol. 54, pp. 1383-
1393, 2014.
[89] Y. Xu, Z. Petrovic, S. Das, and G. L. Wilkes, "Morphology and properties of
thermoplastic polyurethanes with dangling chains in ricinoleate-based soft
segments," Polymer, vol. 49, pp. 4248-4258, 2008.
[90] S. Cossar, D. Nichetti, and N. Grizzuti, "A rheological study of the phase
transition in thermoplastic polyurethanes. Critical gel behavior and microstructure
development," Journal of Rheology (1978-present), vol. 48, pp. 691-703, 2004.
[91] D. Nichetti, S. Cossar, and N. Grizzuti, "Effects of molecular weight and
chemical structure on phase transition of thermoplastic polyurethanes," Journal of
Rheology (1978-present), vol. 49, pp. 1361-1376, 2005.
[92] P. J. Yoon and C. D. Han, "Effect of thermal history on the rheological behavior
of thermoplastic polyurethanes," Macromolecules, vol. 33, pp. 2171-2183, 2000.
[93] S. Yamasaki, D. Nishiguchi, K. Kojio, and M. Furukawa, "Effects of aggregation
structure on rheological properties of thermoplastic polyurethanes," Polymer, vol.
48, pp. 4793-4803, 2007.
[94] M. L. Sentmanat, "Miniature universal testing platform: from extensional melt
rheology to solid-state deformation behavior," Rheologica Acta, vol. 43, pp. 657-
669, 2004.
[95] V. C. Barroso, J. A. Covas, and J. M. Maia, "Sources of error and other
difficulties in extensional rheometry revisited: commenting and complementing a
recent paper by T. Schweizer," Rheologica acta, vol. 41, pp. 154-161, 2002.
[96] R. Mao, E. M. McCready, and W. R. Burghardt, "Structural response of an
ordered block copolymer melt to uniaxial extensional flow," Soft matter, vol. 10,
pp. 6198-6207, 2014.
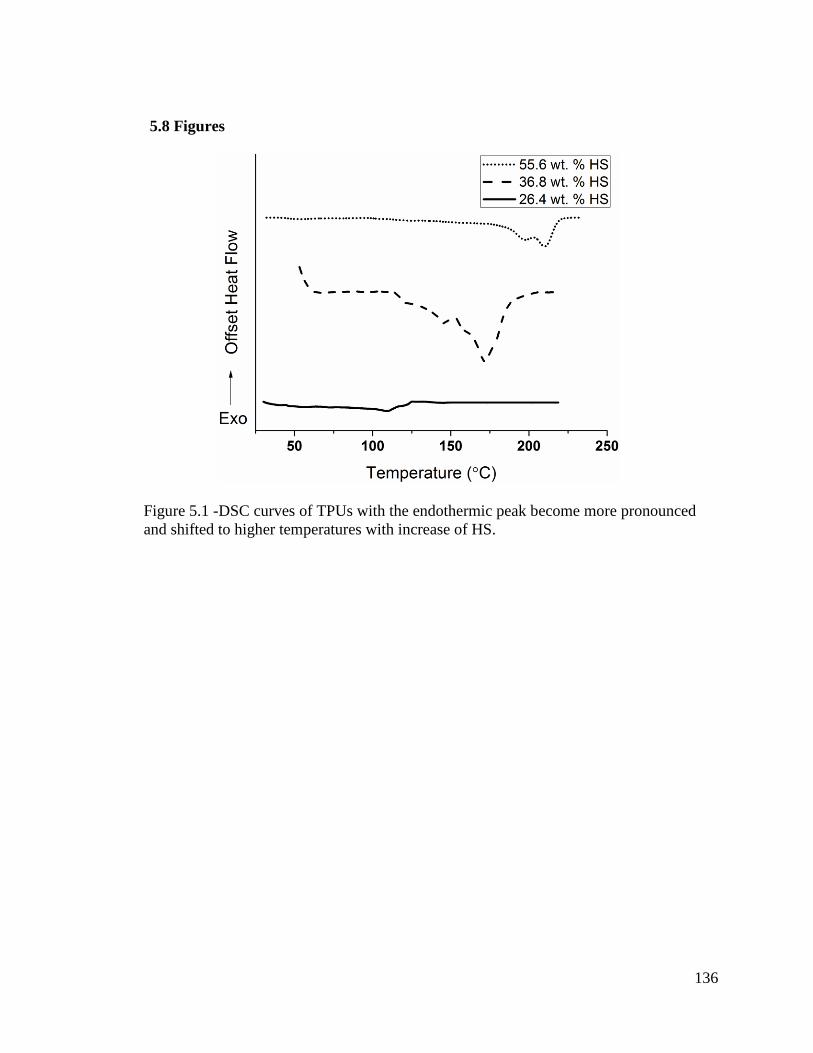
136
5.8 Figures
Figure 5.1 -DSC curves of TPUs with the endothermic peak become more pronounced
and shifted to higher temperatures with increase of HS.
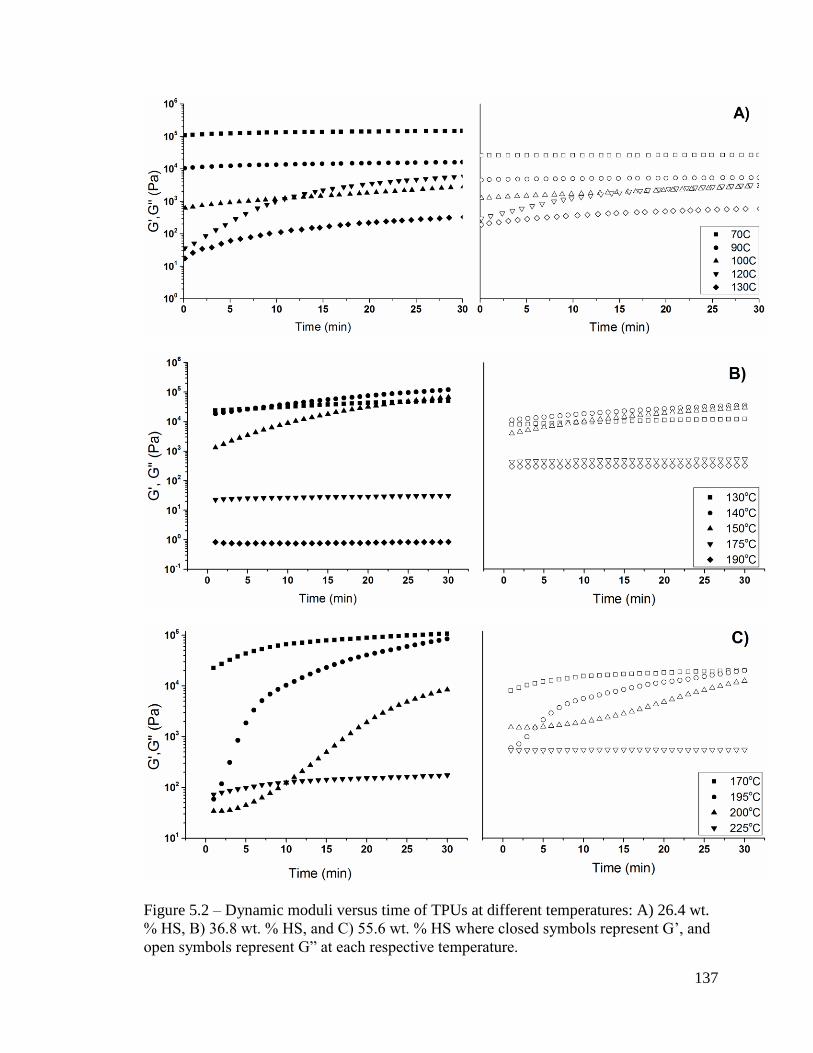
137
Figure 5.2 – Dynamic moduli versus time of TPUs at different temperatures: A) 26.4 wt.
% HS, B) 36.8 wt. % HS, and C) 55.6 wt. % HS where closed symbols represent G’, and
open symbols represent G” at each respective temperature.

138

139
Figure 5.3 - Transient elongational viscosity pre-annealing data for A) TPU with 26.4%
HB at 100 °C, B) TPU with 36.8% HB at 150 °C, and C) TPU with 55.6% HB at 195 °C.
The dashed lines represent the linear viscoelastic envelope.
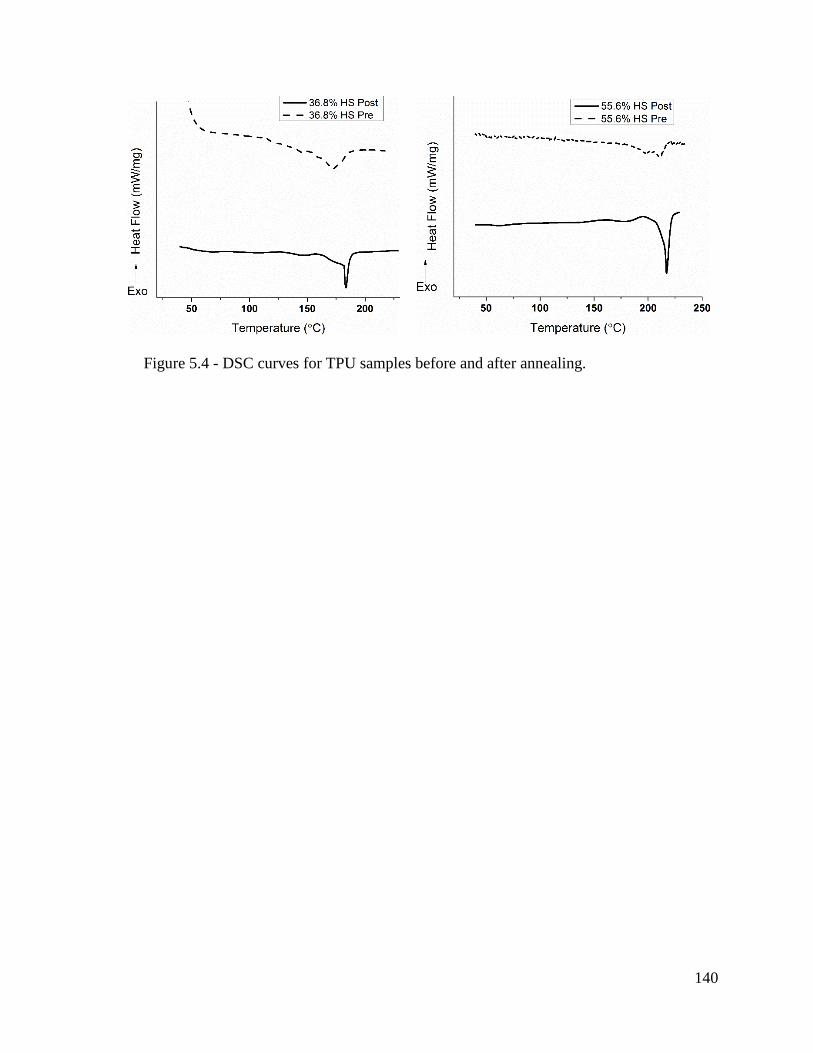
140
Figure 5.4 - DSC curves for TPU samples before and after annealing.

141
Figure 5.5- SAXS patterns a) Comparison of differernt HS contentment and b) 36.8% HS
before and after annealing.
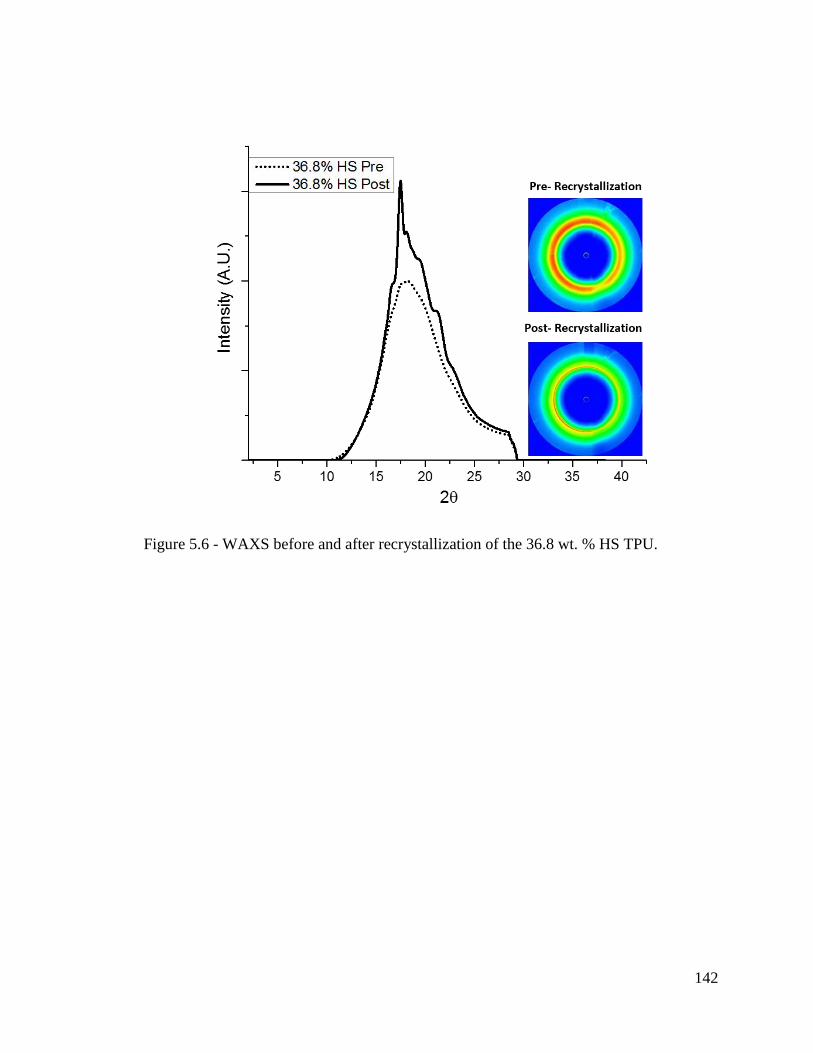
142
Figure 5.6 - WAXS before and after recrystallization of the 36.8 wt. % HS TPU.

143
Figure 5.7 - Frequency sweep data after isothermal annealing for A) TPU with 26.4% HS
at 70 °C B) TPU with 36.8% HS at 150 °C, and C) TPU with 55.6% HS at 195 °C.
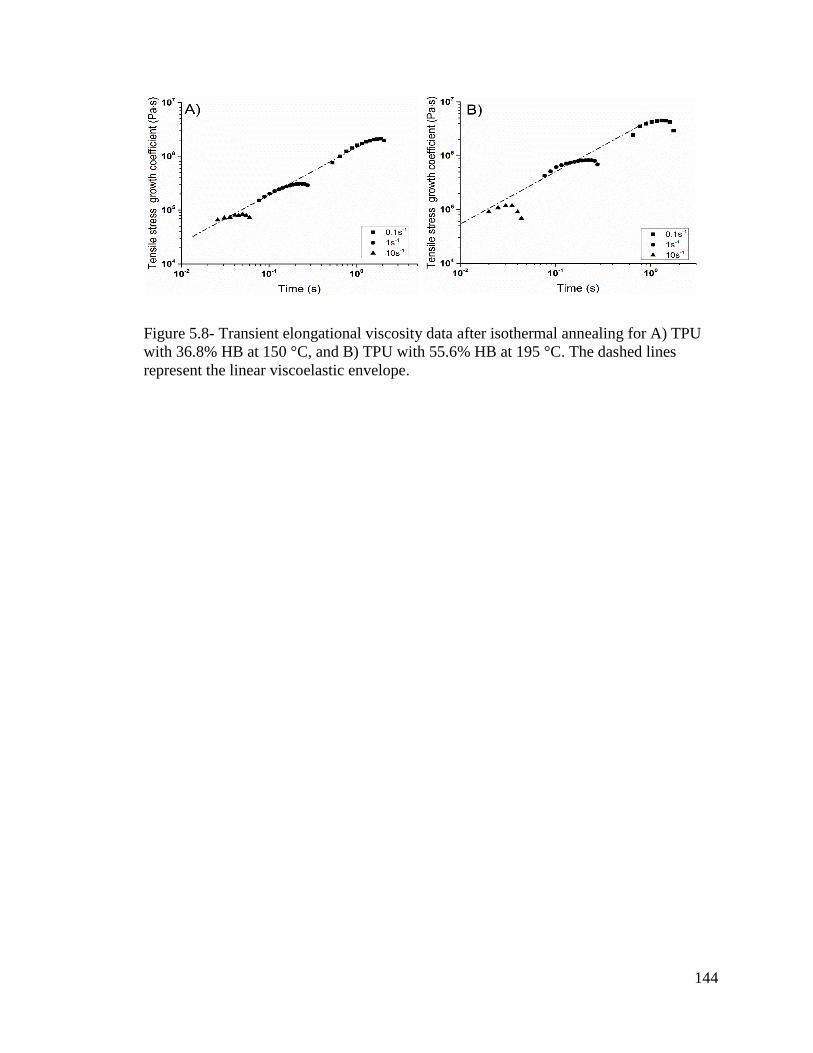
144
Figure 5.8- Transient elongational viscosity data after isothermal annealing for A) TPU
with 36.8% HB at 150 °C, and B) TPU with 55.6% HB at 195 °C. The dashed lines
represent the linear viscoelastic envelope.

145
Figure 5.9- Top: Images of viscoelastic rupture under extensional flow (left) and a brittle-
like (right) for TPU with 36.8% HS. Bottom: Images of TPU with 36.8% after cessation
of flow before recrystallization (right) and after (left).
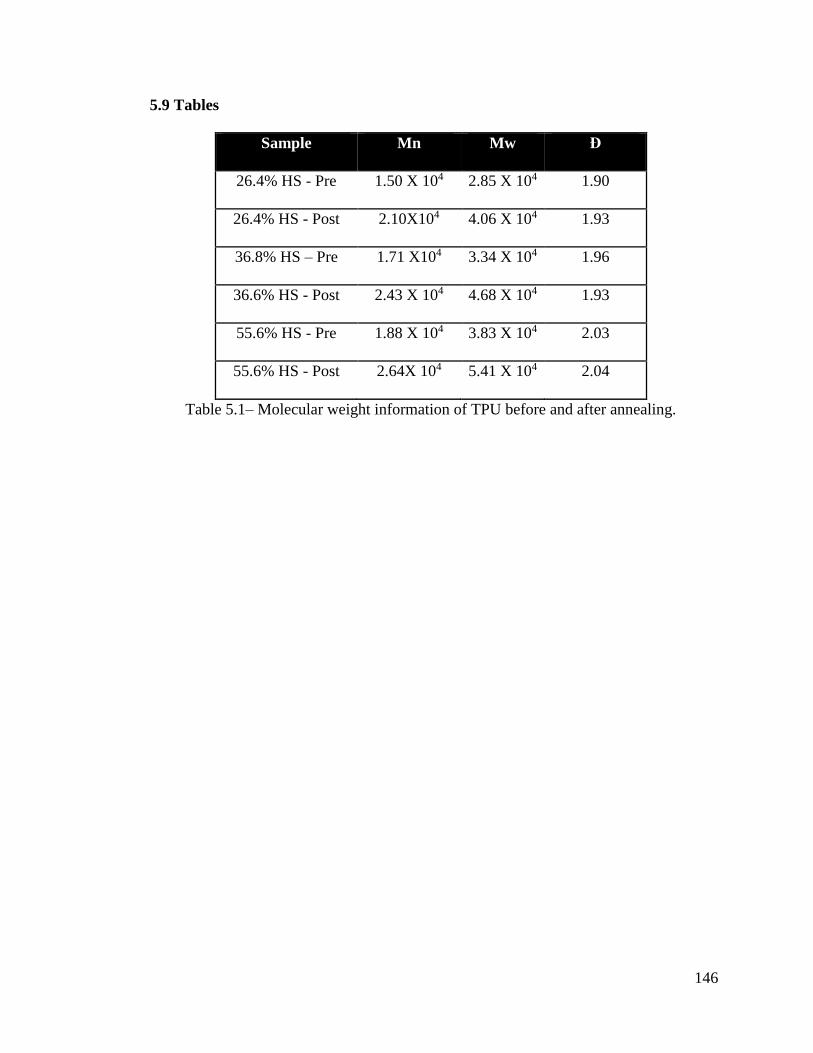
146
5.9 Tables
Sample Mn Mw Đ
26.4% HS - Pre 1.50 X 10⁴ 2.85 X 10⁴ 1.90
26.4% HS - Post 2.10X10⁴ 4.06 X 10⁴ 1.93
36.8% HS – Pre 1.71 X10⁴ 3.34 X 10⁴ 1.96
36.6% HS - Post 2.43 X 10⁴ 4.68 X 10⁴ 1.93
55.6% HS - Pre 1.88 X 10⁴ 3.83 X 10⁴ 2.03
55.6% HS - Post 2.64X 10⁴ 5.41 X 10⁴ 2.04
Table 5.1– Molecular weight information of TPU before and after annealing.

147
Chapter 6 : Contribution of Inflow Conditions on
Residence Time Output in Extrusion Adapter Analysis
This chapter is partially based on:
Journal article:
J. L. Gadley and J. M. Maia To Be Submitted (Journal of Polymer Engineering)
148
6.1 Abstract
Simulations using finite element methods (FEM) are commonly used when
designing extrusion components and processes. However, oversimplification of these
techniques provides a significant potential for generating misleading information. These
techniques are most commonly applied to extrusion dies and have also been used to study
flow within extruder barrels. This work focuses on the adapter located between these
components which is commonly over looked. The focus of this study was to understand
the effect of inflow conditions into the adapter on the residence time within the adapter. To
accomplish this, a symmetric adapter was designed and studied with different inflow
boundary conditions. Through using a fully developed inflow, an inflow condition with
rotational flow, and an imbalanced inflow condition, this work indicated a drastic change
in the residence time predicted. These results demonstrate the potential for misleading
information from simulation and that careful considerations must be made depending on
the system of interest.

149
6.2 Introduction
Understanding the influence of industrial processing conditions on the final product
characteristics is crucial to efficient conversion of polymeric materials into a useful form.
In order to bridge the gap between processing conditions, processing stability, and product
quality computational studies are commonly used. Many simulations have been performed
for a multitude of reasons to troubleshoot and optimize the extrusion process. Even with
the aid of powerful computing techniques, simulating the entire process of extrusion is
impractical therefore these efforts are generally focused on a specific extrusion
component.[97, 98] Optimizing the flow within the die of an extruder for example is
commonly performed to meet the requirements of a particular product goal and is utilized
to troubleshoot the cause of defects within an extrudate.[99-102] There are many different
variables which effect the material forming process during extrusion. The thermal history
and flow conditions to which polymers are exposed vary drastically between different
stages of the extrusion process. For example, the pressures and shear rates present within
the extruder barrel affect the material much differently than flowing through the die and
forming into the final product. However, the flow behavior in any specific portion of the
extrusion process is dependent on all these factors occurring simultaneously throughout all
regions of the equipment, adding to the complexity of accurately treating simulation of
these systems. Since extrusion is very commonly used in industry to continually produce
products at high throughput, increasing efficiency of the process and reducing the number
of defects produced provides potential to drastically reduce cost. Because of the high
throughput potential of industrial extrusion processes, using experience based trial and
error techniques to optimize the process is a very time and resource intensive endeavor. In

150
order to alleviate these difficulties, simulation techniques are commonly used to aid in
identifying and avoiding processing inefficiencies.
Computational investigation of many different aspects of a twin screw extruder
have been carried out under a multitude of conditions and studies seeking the most accurate
technique for capturing realistic behavior in these systems. Of these studies, many have
been focused on understanding the complex flow behavior which exists within the barrel
of the extruder itself. [103-112] These studies have been performed across a wide array of
approaches and complexity but have shown that the capturing of proper flow characteristics
is very important to understanding the process albeit a difficult endeavor. Understanding
how these flow conditions develop and influence material characterizations have been
approximated many different ways particularly concerning the mixing characteristics
within kneading sections of the screw. [103-108, 110-114] While understanding how
materials are affected by processing conditions within the barrel is very important
information, these simulations alone are insufficient for many product issues due to flow
through other downstream influences on the material. It is well known that proper design
of an extrusion die is crucial to achieving the desired results within an extrusion process.
Properly balancing flow behavior and mitigating stagnant areas has been subjected to a
plethora of simulation studies depending on particular goals. Previous studies have shown
a significant influence of die design on the characteristics of the extrudate. However, die
design remains more of an art tailored to a specific need. [115] Through experience and
more recent simulation work, many die design guidelines have been implemented to
excellent effect in order to produce the targeted extrudate characteristics. Through the
simulations of screw elements and dies for thermally sensitive material, residence time and

151
thermal history to which the material is exposed are generally the primary focus. While
finite element methods (FEM) have been used extensively to model flow behavior in the
barrel and die of extrusion equipment, less effort has been focused on understanding how
flow between the extruder screws and entrance into the die affects the process, particularly
in thermally sensitive materials.
The focus of this particular work was to utilize FEM simulation to understand how
the flow through an adapter between the extruder barrel and the die itself could promote
degradation in thermally sensitive materials. When performing any FEM simulation as
previously noted, achieving a result which is physically representative of the actual process
is of the utmost importance. Capturing this behavior presents a challenge when dealing
with transient behavior which exists when material exits from the tips of the screws. While
every type of extrusion process would require a different treatment of this flow depending
on the flow characteristics of the system, this work focused on a low speed counter-rotating
twin screw extruder. Under these conditions, the melt in the extruder barrel tends to
preferentially travel along the top of the screws which results in entering the adapter under
unbalanced conditions. Most commonly a setup such as this would be used with an adapter
which symmetrically contracts the flow of the material down from the size of the extruder
barrel at the exit to the inflow geometry of the die for profile extrusion. The primary scope
of this work was to understand how altering these inflow conditions affected the residence
time within the adapter and to help understand the most feasible approach to capturing this
type of inflow condition within the FEM software. Specifically, this investigation was
focused on detecting the presence of stagnation zones within a die adapter under flow
conditions consistent with counter rotating twin screw extruders. In order to accomplish
152
this task, simulations were performed on the same adapter model using the same material
conditions. While these parameters were kept constant, the treatment of the inflow
boundary conditions were changed to investigate the influence of different adapter entry
flows on stagnation points within the adapter.
6.3 Experimental
6.3.1 Simulation Setup and Parameters
The simulations in this work were performed using ANSYS® POLYFLOW® CFD
(computational fluid dynamics) FEM software. Initially the desired flow channel
dimensions were modeled using computer-aided design (CAD) software (SolidWorks).
The imported flow geometry was then meshed using tetrahedral elements in order to
generate a 3D model of the extrusion adapter. This particular adapter geometry shown in
Figure 6.1, was utilized to eliminate the potential for introducing geometric imbalances
into the simulation through maintaining a symmetric design. The adapter geometry was
specifically designed as symmetric in order to eliminate any unnecessary complex behavior
resulting from geometric influences. The adapter contraction was also designed
representative of what would be used in practice to transfer polymer melt from an extruder
barrel to an extrusion die. Using this geometry, the mesh was generated through using
POLYFLOW® and was refined to ensure adequate resolution was attainable through the
simulation without creating too high of a mesh density which would lead to prohibitively
high computational cost as shown in Figure 6.2A. These simulations consisted of using
identical geometry for all conditions through only varying boundary conditions at the
(6.1)

153
inflow boundary. Across all simulation iterations performed, the mesh was generated using
identical conditions and resulted dividing the model into approximately 300,000 elements.
A gradient was applied to the mesh density to ensure the inflow boundary and thinner flow
channel regions contained adequate resolution during the simulations. Utilizing this
computational mesh, isothermal flow simulations were carried out under the assumption
that the fluid within the channel was incompressible. In order to accurately capture the
material behavior within the flow channel, the polymer was assumed to adhere to the Phan-
Thien-Tanner (PTT) model. Generally, Newtonian conditions were used initially to
troubleshoot these simulations and in the case of more complex inflow conditions, these
Newtonian conditions were used as comparison to aid in understanding the effect of the
inflow conditions on different in-channel material behaviors. A single mode PTT model
was used as shown in Equation 6.1. The PTT representation was used because the model
incorporates an exponential relaxation coefficient which enables the prediction of biaxial
elongation and step shear during flow while maintaining accuracy near startup values and
is known to reliably fit experimental data. [116] Specifically, this equation is represented
in POLYFLOW® using the form shown in Equation 6.2.
Evaluating this form the total extra stress tensor, τ, is divided into two separate components
representing viscous and extensional behavior. The first term of Equation 6.2 contains the
material parameter, ξ, which represents the shear thinning characteristics of a fluid. The
second term in the equation represents the contribution of extensional stress in the system.
This exponential term was chosen due to the known agreement with experimental results
which contains the material parameter, ε. This material parameter is used to correct for the
(6.2)

154
extensional stress component during flow of complex materials such as the polymers used
in this case. Through treating the materials with the PTT model in this manner, the
influence of flow on the material behavior was accounted for in the most realistic way
possible for the simulations in this work.
The boundary conditions were applied to the model as shown in Figure 6.2 B-D.
The inflow boundary condition was maintained at an industrially relevant flow rate of 360
kg/hr which was applied across the face of the inflow surface of the adapter. These inflow
conditions were adjusted to include different inflow behavior to mimic material exiting
from the extruder screws. Configurations used to help understand this effect included a
fully developed inflow along the entire inflow face, rotational inner walls with fully
developed inflow, and a systematically imbalanced inflow surface. Using these inflow
conditions, generic PTT parameters were selected and are shown in Table 6.1
Relaxation Time (sec)
Viscosity (Pa s)
ξ ε Flow Rate Kg/hour
1.0 50,000 0.30 0.20 360
Table 6.1 - PTT Input Parameters for Simulations
The PTT parameters used for this study were selected as generic values which are
synonymous with processing amorphous polymers which would act as a representative
model for industrially processed materials with high thermal sensitivity such as poly(vinyl
chloride) (PVC). [98, 117]
6.4 Results and Discussion
The overall scope of this work was to use FEM to understand the importance of
capturing the complex conditions present as polymeric material exits the extruder screws
and enters a production component, namely a die adapter. More specifically the goal was
155
to understand the effect of varying these conditions on the residence time within the adapter
and to determine which inflow conditions most accurately mimic the production
conditions. The first simulation was performed under the condition which assumes the
material enters the adapter equally across the whole surface and under fully developed
conditions. While these assumptions are highly simplified, these types of assumptions are
often made when simulating industrial processes and in many cases turn out to adequately
predict behavior and troubleshoot simple issues. This method also holds the advantage of
requiring minimal computational load.
The initial part of this study focused on a simple inflow condition where the
material was assumed to be flowing under fully developed flow conditions from between
the tip of the extruder screws and the outside wall of the barrel and adapter. The images
shown in Figure 6.3 demonstrate the inflow boundary which was used with an evenly
disturbed flow rate and the resultant residence time and velocity plots. Through
examination of the velocity plots, the observation was made that the highest velocity
regions are in the center where all the entering material passes the screw tips and travels
throughout the remainder of the adapter as would be expected. The lowest velocity regions
are mainly focused at the contraction to the smallest channel dimension for entry into a die
downstream. These low velocity regions are confirmed by the residence time plots through
showing the material dwells longest in these areas. Through comparison of the velocity
and residence time plots it becomes immediately apparent that the contraction is having the
largest effect coupled with the flow length, where the longest flow length passes near the
walls at the contraction, contributing to the increased residence time. However, under these
conditions there was no evidence of recirculation which would lead to a stagnation zone
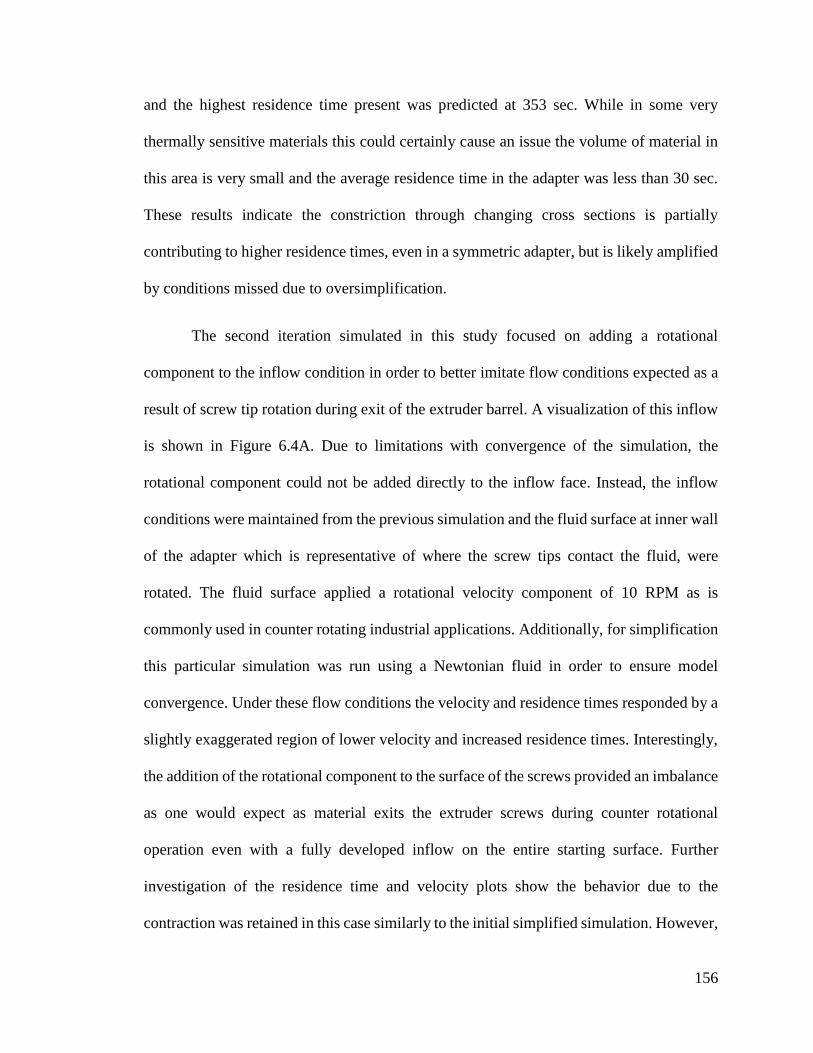
156
and the highest residence time present was predicted at 353 sec. While in some very
thermally sensitive materials this could certainly cause an issue the volume of material in
this area is very small and the average residence time in the adapter was less than 30 sec.
These results indicate the constriction through changing cross sections is partially
contributing to higher residence times, even in a symmetric adapter, but is likely amplified
by conditions missed due to oversimplification.
The second iteration simulated in this study focused on adding a rotational
component to the inflow condition in order to better imitate flow conditions expected as a
result of screw tip rotation during exit of the extruder barrel. A visualization of this inflow
is shown in Figure 6.4A. Due to limitations with convergence of the simulation, the
rotational component could not be added directly to the inflow face. Instead, the inflow
conditions were maintained from the previous simulation and the fluid surface at inner wall
of the adapter which is representative of where the screw tips contact the fluid, were
rotated. The fluid surface applied a rotational velocity component of 10 RPM as is
commonly used in counter rotating industrial applications. Additionally, for simplification
this particular simulation was run using a Newtonian fluid in order to ensure model
convergence. Under these flow conditions the velocity and residence times responded by a
slightly exaggerated region of lower velocity and increased residence times. Interestingly,
the addition of the rotational component to the surface of the screws provided an imbalance
as one would expect as material exits the extruder screws during counter rotational
operation even with a fully developed inflow on the entire starting surface. Further
investigation of the residence time and velocity plots show the behavior due to the
contraction was retained in this case similarly to the initial simplified simulation. However,
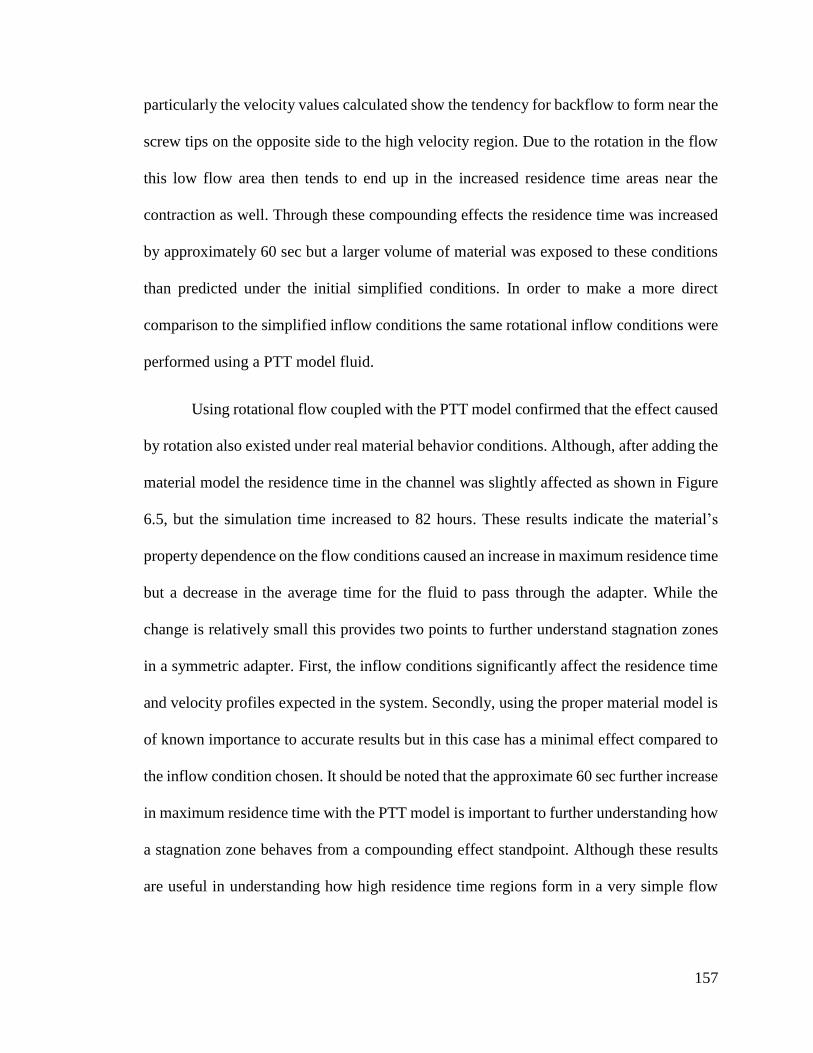
157
particularly the velocity values calculated show the tendency for backflow to form near the
screw tips on the opposite side to the high velocity region. Due to the rotation in the flow
this low flow area then tends to end up in the increased residence time areas near the
contraction as well. Through these compounding effects the residence time was increased
by approximately 60 sec but a larger volume of material was exposed to these conditions
than predicted under the initial simplified conditions. In order to make a more direct
comparison to the simplified inflow conditions the same rotational inflow conditions were
performed using a PTT model fluid.
Using rotational flow coupled with the PTT model confirmed that the effect caused
by rotation also existed under real material behavior conditions. Although, after adding the
material model the residence time in the channel was slightly affected as shown in Figure
6.5, but the simulation time increased to 82 hours. These results indicate the material’s
property dependence on the flow conditions caused an increase in maximum residence time
but a decrease in the average time for the fluid to pass through the adapter. While the
change is relatively small this provides two points to further understand stagnation zones
in a symmetric adapter. First, the inflow conditions significantly affect the residence time
and velocity profiles expected in the system. Secondly, using the proper material model is
of known importance to accurate results but in this case has a minimal effect compared to
the inflow condition chosen. It should be noted that the approximate 60 sec further increase
in maximum residence time with the PTT model is important to further understanding how
a stagnation zone behaves from a compounding effect standpoint. Although these results
are useful in understanding how high residence time regions form in a very simple flow
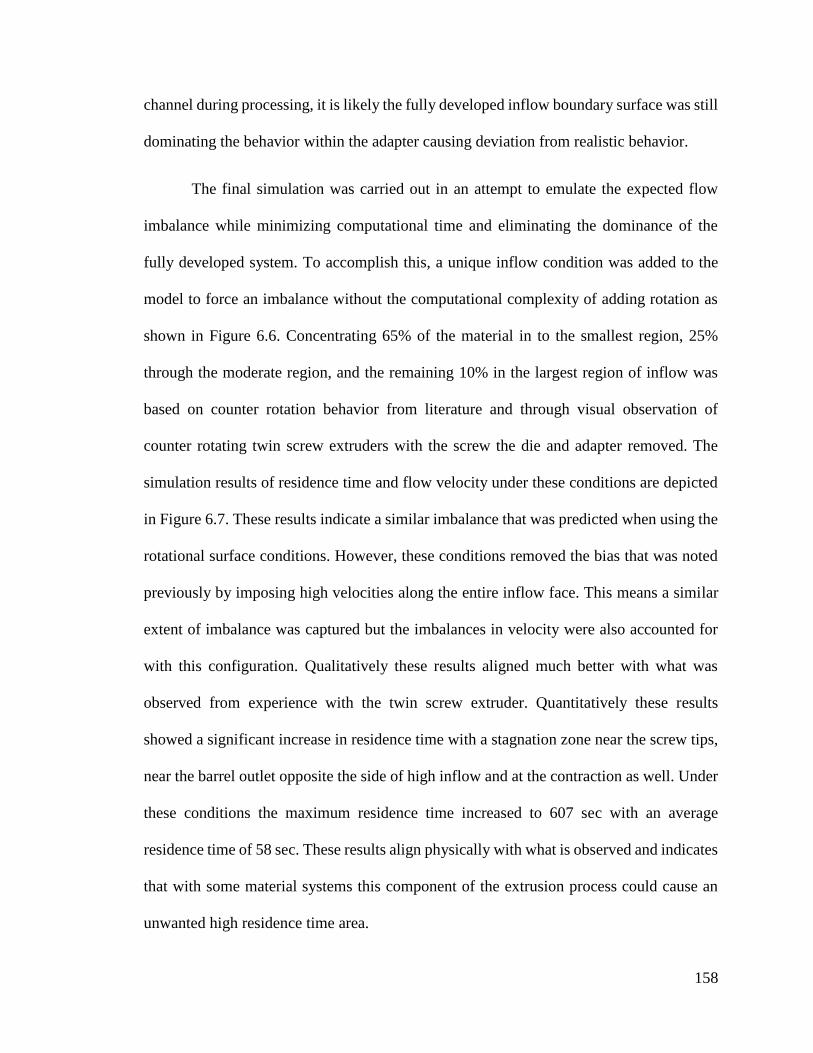
158
channel during processing, it is likely the fully developed inflow boundary surface was still
dominating the behavior within the adapter causing deviation from realistic behavior.
The final simulation was carried out in an attempt to emulate the expected flow
imbalance while minimizing computational time and eliminating the dominance of the
fully developed system. To accomplish this, a unique inflow condition was added to the
model to force an imbalance without the computational complexity of adding rotation as
shown in Figure 6.6. Concentrating 65% of the material in to the smallest region, 25%
through the moderate region, and the remaining 10% in the largest region of inflow was
based on counter rotation behavior from literature and through visual observation of
counter rotating twin screw extruders with the screw the die and adapter removed. The
simulation results of residence time and flow velocity under these conditions are depicted
in Figure 6.7. These results indicate a similar imbalance that was predicted when using the
rotational surface conditions. However, these conditions removed the bias that was noted
previously by imposing high velocities along the entire inflow face. This means a similar
extent of imbalance was captured but the imbalances in velocity were also accounted for
with this configuration. Qualitatively these results aligned much better with what was
observed from experience with the twin screw extruder. Quantitatively these results
showed a significant increase in residence time with a stagnation zone near the screw tips,
near the barrel outlet opposite the side of high inflow and at the contraction as well. Under
these conditions the maximum residence time increased to 607 sec with an average
residence time of 58 sec. These results align physically with what is observed and indicates
that with some material systems this component of the extrusion process could cause an
unwanted high residence time area.

159
Overall, a comparison was formed between the different inflow approaches which
could potentially be used to simulate an extrusion adapter and is displayed in Figure 6.8.
The plot shown here indicates that a generic fully developed inflow surface under predicts
the total residence time in the system, even with a realistic material model. While adding
rotation to the system moved towards more realistic behavior, the residence time
distribution shown in Figure 6.9 suggests the presence of the fully developed inflow surface
still had a dominant effect on the results. In order to capture the results nearest to those
experienced in industry the imbalanced inflow approach appeared to provide the most
useful insight to flow though the adapter. It is apparent that regardless of the simulation
setup, the first 70% of the material passes through the adapter very similarly. However,
when considering stagnation regions, particularly for thermally sensitive systems, the few
percent remaining for extremely long times would be the most troublesome. Through
providing an observation based imbalance the maximum expected residence time increased
from 363 sec to 607 sec and the average residence time increased from 28 sec to 58 sec.
Additional, 95% of the adapter volume cleared the channel in 140 sec in the simplified case
versus 249 sec in the most complex case. This work showcases the importance of looking
at every component of the extrusion process, not only the flow behavior in the screws and
die as is commonly done. Furthermore, while it is well known that accurate simulation
results are highly dependent on all simulation inputs, this work specifically shows how
important matching inflow conditions with realistic behavior could affect results and
ultimately design decisions.
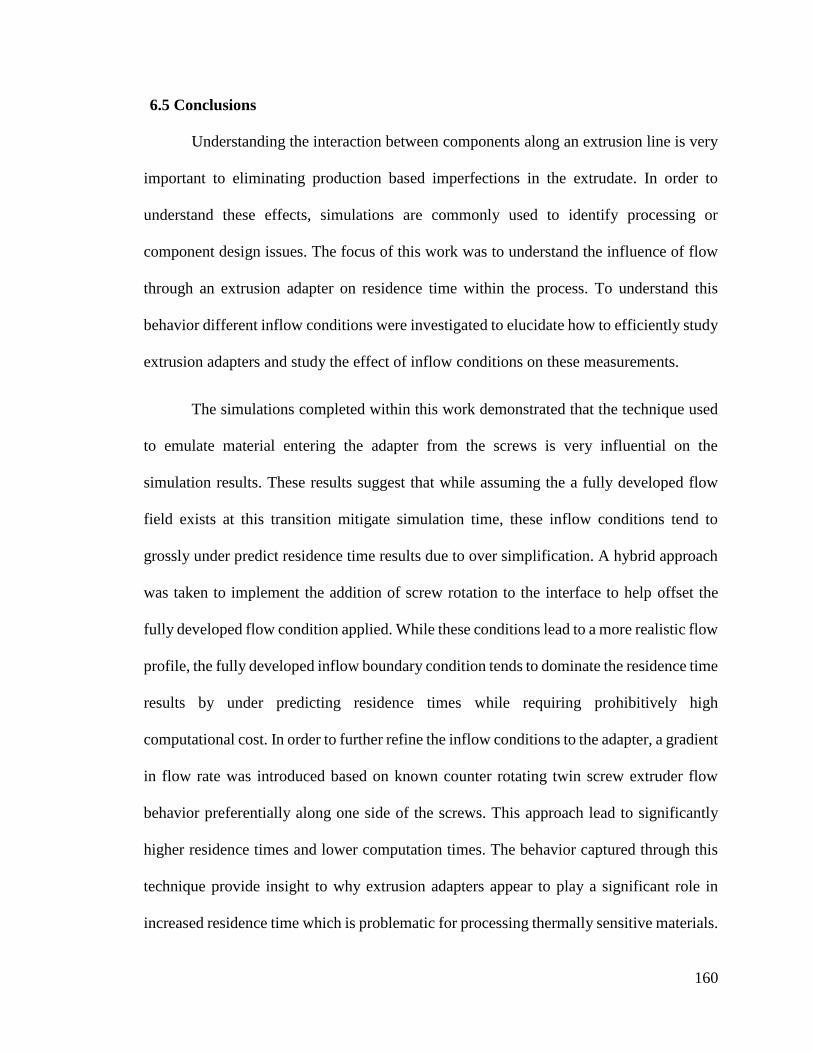
160
6.5 Conclusions
Understanding the interaction between components along an extrusion line is very
important to eliminating production based imperfections in the extrudate. In order to
understand these effects, simulations are commonly used to identify processing or
component design issues. The focus of this work was to understand the influence of flow
through an extrusion adapter on residence time within the process. To understand this
behavior different inflow conditions were investigated to elucidate how to efficiently study
extrusion adapters and study the effect of inflow conditions on these measurements.
The simulations completed within this work demonstrated that the technique used
to emulate material entering the adapter from the screws is very influential on the
simulation results. These results suggest that while assuming the a fully developed flow
field exists at this transition mitigate simulation time, these inflow conditions tend to
grossly under predict residence time results due to over simplification. A hybrid approach
was taken to implement the addition of screw rotation to the interface to help offset the
fully developed flow condition applied. While these conditions lead to a more realistic flow
profile, the fully developed inflow boundary condition tends to dominate the residence time
results by under predicting residence times while requiring prohibitively high
computational cost. In order to further refine the inflow conditions to the adapter, a gradient
in flow rate was introduced based on known counter rotating twin screw extruder flow
behavior preferentially along one side of the screws. This approach lead to significantly
higher residence times and lower computation times. The behavior captured through this
technique provide insight to why extrusion adapters appear to play a significant role in
increased residence time which is problematic for processing thermally sensitive materials.
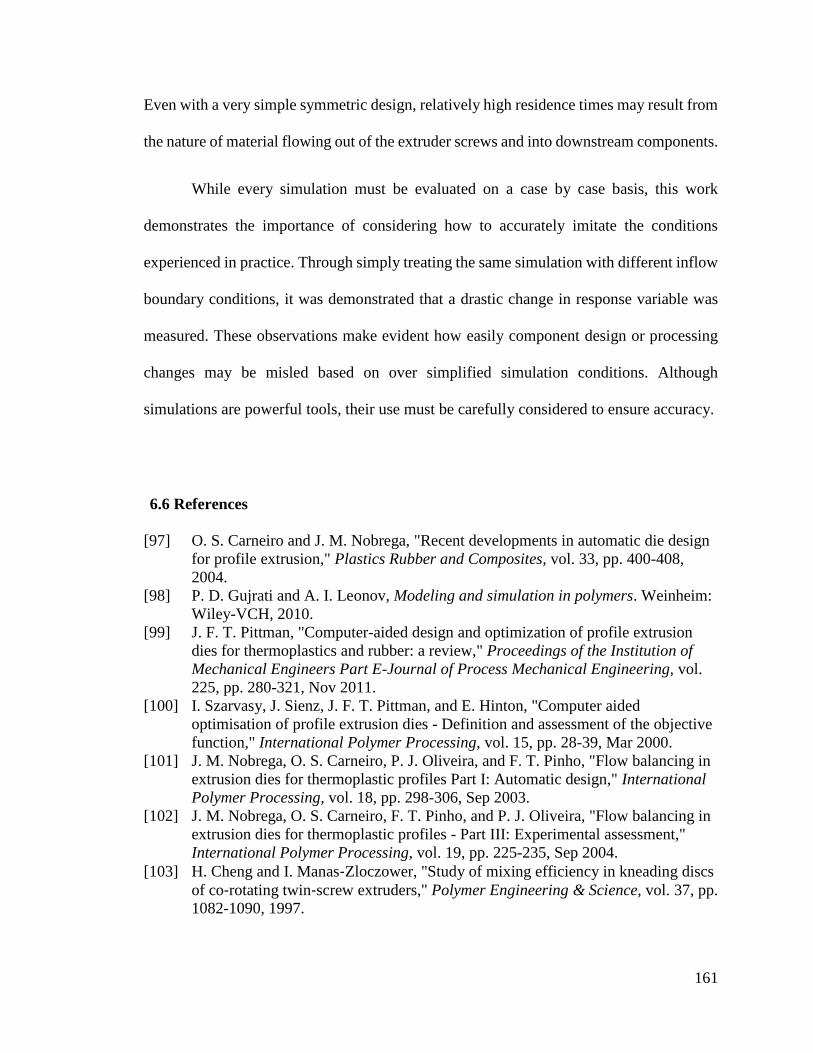
161
Even with a very simple symmetric design, relatively high residence times may result from
the nature of material flowing out of the extruder screws and into downstream components.
While every simulation must be evaluated on a case by case basis, this work
demonstrates the importance of considering how to accurately imitate the conditions
experienced in practice. Through simply treating the same simulation with different inflow
boundary conditions, it was demonstrated that a drastic change in response variable was
measured. These observations make evident how easily component design or processing
changes may be misled based on over simplified simulation conditions. Although
simulations are powerful tools, their use must be carefully considered to ensure accuracy.
6.6 References
[97] O. S. Carneiro and J. M. Nobrega, "Recent developments in automatic die design
for profile extrusion," Plastics Rubber and Composites, vol. 33, pp. 400-408,
2004.
[98] P. D. Gujrati and A. I. Leonov, Modeling and simulation in polymers. Weinheim:
Wiley-VCH, 2010.
[99] J. F. T. Pittman, "Computer-aided design and optimization of profile extrusion
dies for thermoplastics and rubber: a review," Proceedings of the Institution of
Mechanical Engineers Part E-Journal of Process Mechanical Engineering, vol.
225, pp. 280-321, Nov 2011.
[100] I. Szarvasy, J. Sienz, J. F. T. Pittman, and E. Hinton, "Computer aided
optimisation of profile extrusion dies - Definition and assessment of the objective
function," International Polymer Processing, vol. 15, pp. 28-39, Mar 2000.
[101] J. M. Nobrega, O. S. Carneiro, P. J. Oliveira, and F. T. Pinho, "Flow balancing in
extrusion dies for thermoplastic profiles Part I: Automatic design," International
Polymer Processing, vol. 18, pp. 298-306, Sep 2003.
[102] J. M. Nobrega, O. S. Carneiro, F. T. Pinho, and P. J. Oliveira, "Flow balancing in
extrusion dies for thermoplastic profiles - Part III: Experimental assessment,"
International Polymer Processing, vol. 19, pp. 225-235, Sep 2004.
[103] H. Cheng and I. Manas‐Zloczower, "Study of mixing efficiency in kneading discs
of co‐rotating twin‐screw extruders," Polymer Engineering & Science, vol. 37, pp.
1082-1090, 1997.
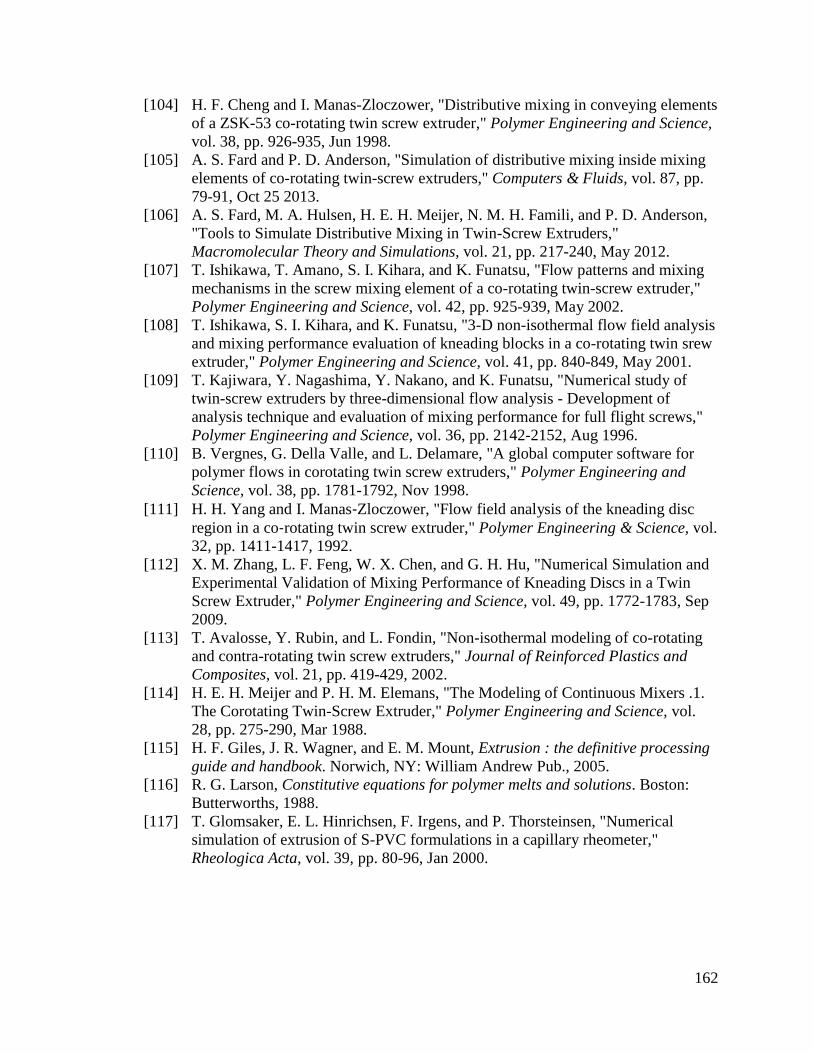
162
[104] H. F. Cheng and I. Manas-Zloczower, "Distributive mixing in conveying elements
of a ZSK-53 co-rotating twin screw extruder," Polymer Engineering and Science,
vol. 38, pp. 926-935, Jun 1998.
[105] A. S. Fard and P. D. Anderson, "Simulation of distributive mixing inside mixing
elements of co-rotating twin-screw extruders," Computers & Fluids, vol. 87, pp.
79-91, Oct 25 2013.
[106] A. S. Fard, M. A. Hulsen, H. E. H. Meijer, N. M. H. Famili, and P. D. Anderson,
"Tools to Simulate Distributive Mixing in Twin-Screw Extruders,"
Macromolecular Theory and Simulations, vol. 21, pp. 217-240, May 2012.
[107] T. Ishikawa, T. Amano, S. I. Kihara, and K. Funatsu, "Flow patterns and mixing
mechanisms in the screw mixing element of a co-rotating twin-screw extruder,"
Polymer Engineering and Science, vol. 42, pp. 925-939, May 2002.
[108] T. Ishikawa, S. I. Kihara, and K. Funatsu, "3-D non-isothermal flow field analysis
and mixing performance evaluation of kneading blocks in a co-rotating twin srew
extruder," Polymer Engineering and Science, vol. 41, pp. 840-849, May 2001.
[109] T. Kajiwara, Y. Nagashima, Y. Nakano, and K. Funatsu, "Numerical study of
twin-screw extruders by three-dimensional flow analysis - Development of
analysis technique and evaluation of mixing performance for full flight screws,"
Polymer Engineering and Science, vol. 36, pp. 2142-2152, Aug 1996.
[110] B. Vergnes, G. Della Valle, and L. Delamare, "A global computer software for
polymer flows in corotating twin screw extruders," Polymer Engineering and
Science, vol. 38, pp. 1781-1792, Nov 1998.
[111] H. H. Yang and I. Manas‐Zloczower, "Flow field analysis of the kneading disc
region in a co‐rotating twin screw extruder," Polymer Engineering & Science, vol.
32, pp. 1411-1417, 1992.
[112] X. M. Zhang, L. F. Feng, W. X. Chen, and G. H. Hu, "Numerical Simulation and
Experimental Validation of Mixing Performance of Kneading Discs in a Twin
Screw Extruder," Polymer Engineering and Science, vol. 49, pp. 1772-1783, Sep
2009.
[113] T. Avalosse, Y. Rubin, and L. Fondin, "Non-isothermal modeling of co-rotating
and contra-rotating twin screw extruders," Journal of Reinforced Plastics and
Composites, vol. 21, pp. 419-429, 2002.
[114] H. E. H. Meijer and P. H. M. Elemans, "The Modeling of Continuous Mixers .1.
The Corotating Twin-Screw Extruder," Polymer Engineering and Science, vol.
28, pp. 275-290, Mar 1988.
[115] H. F. Giles, J. R. Wagner, and E. M. Mount, Extrusion : the definitive processing
guide and handbook. Norwich, NY: William Andrew Pub., 2005.
[116] R. G. Larson, Constitutive equations for polymer melts and solutions. Boston:
Butterworths, 1988.
[117] T. Glomsaker, E. L. Hinrichsen, F. Irgens, and P. Thorsteinsen, "Numerical
simulation of extrusion of S-PVC formulations in a capillary rheometer,"
Rheologica Acta, vol. 39, pp. 80-96, Jan 2000.

163
6.7 Figures
Figure 6.1 – 3D Model rendering of extrusion adapter used in simulation studies.

164
Figure 6.2 – Extrusion adapter geometry showing meshed flow channel (A), inflow
boundary condition (B), zero wall velocity boundary surface (C), and outflow boundary
surface (D).
165
Figure 6.3 – Volume rendering of residence time (A), simplified inflow condition (B),
and velocity streamline plot (C).

166
Figure 6.4 – Helical inflow condition with Newtonian material characteristics (A) used to
generate a volume rendering of residence time (B), and velocity streamline plot (C).
167
Figure 6.5 - Helical inflow condition with PTT model material (A) used to generate a
volume rendering of residence time (B), and velocity streamline plot (C).
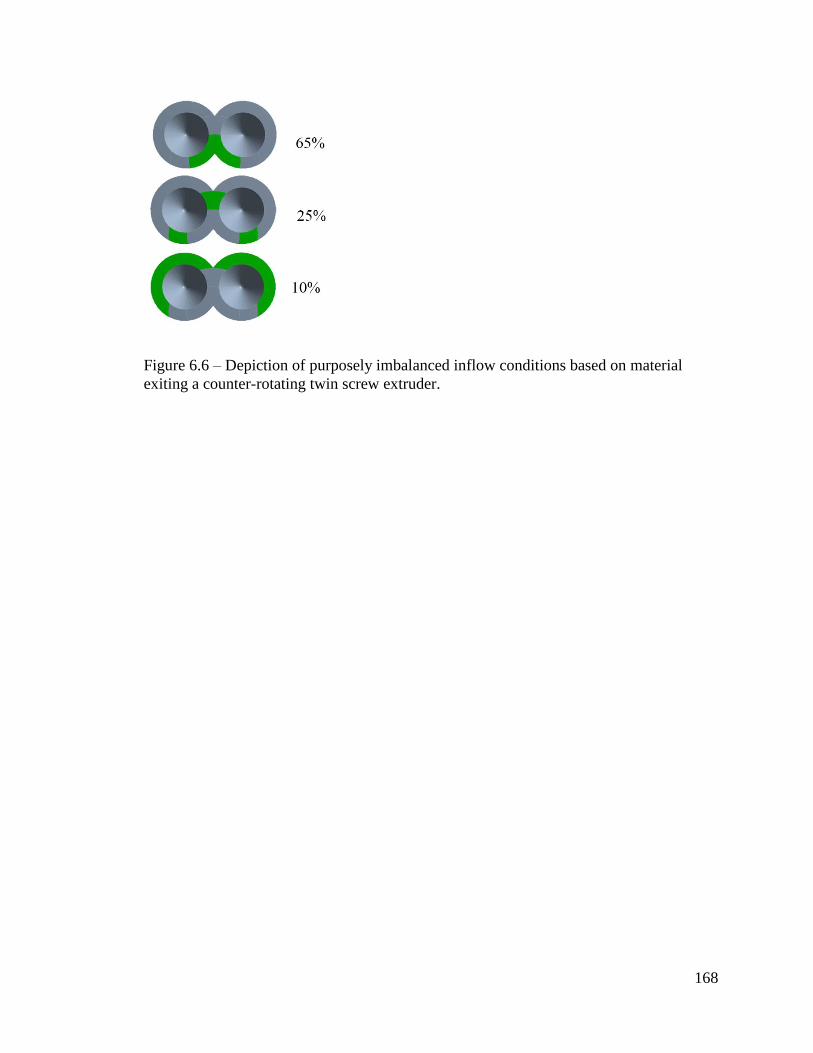
168
Figure 6.6 – Depiction of purposely imbalanced inflow conditions based on material
exiting a counter-rotating twin screw extruder.

169
Figure 6.7 – Residence time volume rendering plot (A) shown with velocity streamline
plot (B) of an adapter with imbalanced inflow boundary conditions.

170
Figure 6.8– Comparison plot of material volume remaining versus residence time
between different adapter inflow boundary conditions.
0 100 200 300 400 500 6000
20
40
60
80
100
Vo
lum
e %
Re
ma
inin
g
Time (sec)
Simple Inflow
Complex Inflow
Rotational
Rotational PTT

171
1E-4 0.001 0.01 0.1 1-50
0
50
100
150
200
250
300
350
Volu
me
Ele
me
nt
Co
unts
t/tmax
Simple-PTT
Rot-Newtonian
Rot-PTT
Complex-PTT
1E-4 0.001 0.01 0.1 1
Offset V
olu
me E
lem
ent C
ount
t/tmax
Complex-PTT
Rot-PTT
Rot-Newtonian
Simple-PTT
Figure 6.9 - Residence time distribution plots of various inflow conditions and material
models.

172
Bibliography
[1] V. W. A. Verhoeven, A. D. Padsalgikar, K. J. Ganzeveld, and L. P. B. M. Janssen,
"A Kinetic Investigation of Polyurethane Polymerization for Reactive Extrusion
Purposes," Journal of Applied Polymer Science, vol. 101, pp. 370-382, 2006.
[2] J.-P. Puaux, P. Cassagnau, G. Bozga, and I. Nagy, "Modeling of Polyurethane
Synthesis by Reactive Extrusion," Chemical Engineering and Processing, vol. 45,
pp. 481-487, 2006.
[3] H. Madra, S. B. Tantekin-Ersolmaz, and F. S. Guner, "Monitoring of oil-based
polyurethane synthesis by FTIR-ATR," Polymer Testing, vol. 28, pp. 773-779,
2009.
[4] M. Szycher, Szycher's Handbook of Polyurethanes. Boca Raton: CRC Press,
1999.
[5] W. Michaeli, A. Greefenstein, and U. Berghaus, "Twin-Screw Extruders for
Reactive Extrusion," Polymer Engineering and Science, vol. 35, pp. 1485-1504,
1995.
[6] C. Hepburn, Polyurethane elastomers, 2nd ed. London ; New York
New York, NY, USA: Elsevier Applied Science ;
Sole distributed in the USA and Canada, Elsevier Science Pub. Co., 1992.
[7] G. G. Odian, Principles of polymerization, 4th ed ed. Hoboken, N.J.: Wiley, 2004.
[8] Z. Wirpsza and T. J. Kemp, Polyurethanes : chemistry, technology, and
applications. Chichester ; New York: E. Horwood, 1993.
[9] A. H. Navarchian, F. Picchioni, and L. P. B. M. Janssen, "Rheokinetics and effect
of shear rate on the kinetics of linear polyurethane formation," Polymer
Engineering and Science, vol. 45, pp. 279-287, Mar 2005.
[10] V. Sekkar, K. A. Devi, and K. N. Ninan, "Rheo-kinetic evaluation on the
formation of urethane networks based on hydroxyl-terminated polybutadiene,"
Journal of Applied Polymer Science, vol. 79, pp. 1869-1876, Mar 7 2001.
[11] S. Ajithkumar, S. S. Kansara, and N. K. Patel, "Kinetics of Castor Oil Based
Polyol-Toluene Diisocyanate Reactions," European Polymer Journal, vol. 34, pp.
1273-1276, 1998.
[12] I. Yilgor, B. D. Mather, S. Unal, E. Yilgor, and T. E. Long, "Preparation of
segemented, high molecular weight, aliphatic poly(ether-urea) copolymers in
isopropanol. In-situ FTIR studies and polymer synthesis," Polymer, vol. 45, pp.
5829-5836, 2004.
[13] S. Parnell, K. Min, and M. Cakmak, "Kinetic Studies of Polyurethane
Polymerization with Raman Spectroscopy," Polymer, vol. 44, pp. 5137-5144,
2003.
[14] C. Dubois, S. Desilets, A. Ait-Kadi, and P. Tanguy, "Bulk Polymerization of
Hydroxyl Terminated Polyubutadiene (HTPB) with Toluene Diisocyanate (TD):
A Kinetics Study using 13C-NMR," Journal of Applied Polymer Science, vol. 58,
pp. 827-834, 1995.
[15] D. Kincal and S. Ozkar, "Kinetic Study of the Reaction Between Hydroxyl-
Terminated Polybutadiene and Isophorone Diisocyanate in Bulk by Quantitative
FTIR Spectroscopy," Journal of Applied Polymer Science, vol. 66, pp. 1979-
1983, 1997.
173
[16] V. Sekkar, K. Ambika, and K. Ninan, "Rheo-kinetic Evaluation on the Formation
of Urethane Networks Based on Hydroxyl-Terminated Polybutadiene," Journal of
Applied Polymer Science, vol. 79, pp. 1869-1876, 2001.
[17] O. Gunter, Polyurethane Handbook. Munich: Hanser Publishers, 1985.
[18] L. L. Ferstandig and R. A. Scherrer, "Mechanism of Isocyanate Reactions with
Ethanol," Journal of American Chemical Society, vol. 81, pp. 4838-4842, 1959.
[19] H. G. Wissman, L. Rand, and K. C. Frisch, "Kinetics of Polyether Polyols-
Diisocyanate Reactions," Journal of Applied Polymer Science, vol. 8, pp. 2971-
2978, 1964.
[20] M. Gambiroza-jukic, Z. Gomzi, and H. J. Mencer, "Kinetic Analysis of Bulk
Polymerizatio of Diisocyanate and Polyol," Journal of Applied Polymer Science,
vol. 47, pp. 513-519, 1993.
[21] A. H. Navarchian, F. Picchioni, and L. P. B. M. Janssen, "Rheokinetics and Effect
of Shear Rate on the Kinetics of Linear Polyurethane Formation," Polym. Eng.
Sci., vol. 45, pp. 279-287, 2005.
[22] R. G. Pearson and E. L. Williams, "Interfacial Polymerization of an Isocyanate
and a Diol," Journal of Polymer Science Part a-Polymer Chemistry, vol. 23, pp.
9-18, 1985.
[23] R. G. Pearson and E. L. Williams, "A Comparison of Heterogeneous and
Homogeneous Kinetics in the Formation of a Polyurethane," Journal of Polymer
Science Part a-Polymer Chemistry, vol. 25, pp. 565-573, Feb 1987.
[24] R. W. Seymour, G. M. Estes, and S. L. Cooper, "Infrared Studies of Segmented
Polyurethan Elastomers .1. Hydrogen Bonding," Macromolecules, vol. 3, pp. 579-
&, 1970.
[25] G. M. Estes, S. L. Cooper, and A. V. Tobolsky, "Block Polymers and Related
Heterophase Elastomers," Journal of Macromolecular Science-Reviews in
Macromolecular Chemistry, vol. C 4, pp. 313-&, 1970.
[26] H. D. Kim, J. H. Huh, E. Y. Kim, and C. C. Park, "Comparison of properties of
thermoplastic polyurethane elastomers with two different soft segments," Journal
of Applied Polymer Science, vol. 69, pp. 1349-1355, Aug 15 1998.
[27] S. Velankar and S. L. Cooper, "Microphase separation and rheological properties
of polyurethane melts. 2. Effect of block incompatibility on the microstructure,"
Macromolecules, vol. 33, pp. 382-394, Jan 25 2000.
[28] S. Velankar and S. L. Cooper, "Microphase separation and rheological properties
of polyurethane melts. 3. Effect of block incompatibility on the viscoelastic
properties," Macromolecules, vol. 33, pp. 395-403, Jan 25 2000.
[29] A. Kintanar, L. W. Jelinski, I. Gancarz, and J. T. Koberstein, "Complex
Molecular Motions in Bulk Hard-Segment Polyurethanes - a Deuterium Nmr-
Study," Macromolecules, vol. 19, pp. 1876-1884, Jul 1986.
[30] L. M. Leung and J. T. Koberstein, "Dsc Annealing Study of Microphase
Separation and Multiple Endothermic Behavior in Polyether-Based Polyurethane
Block Copolymers," Macromolecules, vol. 19, pp. 706-713, Mar 1986.
[31] S. Yamasaki, D. Nishiguchi, K. Kojio, and M. Furukawa, "Effects of
polymerization method on structure and properties of thermoplastic
polyurethanes," Journal of Polymer Science Part B-Polymer Physics, vol. 45, pp.
800-814, Apr 1 2007.

174
[32] C. Dubois, S. Desilets, A. Aitkadi, and P. Tanguy, "Bulk-Polymerization of
Hydroxyl Terminated Polybutadiene (Htpb) with Tolylene Diisocyanate (Tdi) - a
Kinetics Study Using C-13-Nmr Spectroscopy," Journal of Applied Polymer
Science, vol. 58, pp. 827-834, Oct 24 1995.
[33] D. Kincal and S. Ozkar, "Kinetic study of the reaction between hydroxyl-
terminated polybutadiene and isophorone diisocyanate in bulk by quantitative
FTIR spectroscopy," Journal of Applied Polymer Science, vol. 66, pp. 1979-1983,
Dec 5 1997.
[34] H. Kothandaraman and A. S. Nasar, "The Kinetics of the Polymerization Reaction
of Toluene Diisocyanate with Polyether Polyols," Journal of Macromolecular
Science-Pure and Applied Chemistry, vol. A31, pp. 339-350, 1994.
[35] S. Parnell, K. Min, and M. Cakmak, "Kinetic studies of polyurethane
polymerization with Raman spectroscopy," Polymer, vol. 44, pp. 5137-5144, Aug
2003.
[36] I. Yilgor, B. D. Mather, S. Unal, E. Yilgor, and T. E. Long, "Preparation of
segmented, high molecular weight, aliphatic poly(ether-urea) copolymers in
isopropanol. In-situ FTIR studies and polymer synthesis," Polymer, vol. 45, pp.
5829-5836, Aug 5 2004.
[37] H. Madra, S. B. Tantekin-Ersolmaz, and F. S. Guner, "Monitoring of oil-based
polyurethane synthesis by FTIR-ATR," Polymer Testing, vol. 28, pp. 773-779,
Oct 2009.
[38] E. B. Richter and C. W. Macosko, "Kinetics of Fast (Rim) Urethane
Polymerization," Polymer Engineering and Science, vol. 18, pp. 1012-1018,
1978.
[39] G. Anzuino, A. Pirro, O. Rossi, and L. P. Friz, "Reaction of Diisocyanates with
Alcohols .1. Uncatalyzed Reactions," Journal of Polymer Science Part a-Polymer
Chemistry, vol. 13, pp. 1657-1666, 1975.
[40] M. Cioffi, K. J. Ganzeveld, A. C. Hoffmann, and L. P. B. M. Janssen,
"Rheokinetics of linear polymerization. A literature review," Polymer
Engineering and Science, vol. 42, pp. 2383-2392, Dec 2002.
[41] E. Papadopoulos, M. Ginic-Markovic, and S. Clarke, "Reaction Kinetics of
Polyurethane Formation Using a Commercial Oligomeric Diisocyanate Resin
Studied by Calorimetric and Rheological Methods," Macromolecular Chemistry
and Physics, vol. 209, pp. 2302-2311, Nov 24 2008.
[42] J. S. Martin, J. M. Laza, M. L. Morras, M. Rodriguez, and L. M. Leon, "Study of
the curing process of a vinyl ester resin by means of TSR and DMTA," Polymer,
vol. 41, pp. 4203-4211, May 2000.
[43] A. Y. Malkin and S. G. Kulichikhin, "Rheokinetics of Curing," Advances in
Polymer Science, vol. 101, pp. 217-257, 1991.
[44] J. M. Laza, J. L. Vilas, F. Mijangos, M. Rodriguez, and L. M. Leon, "Analysis of
the crosslinking process of epoxy-phenolic mixtures by thermal scanning
rheometry," Journal of Applied Polymer Science, vol. 98, pp. 818-824, Oct 15
2005.
[45] M. M. Coleman, K. H. Lee, D. J. Skrovanek, and P. C. Painter, "Hydrogen-
Bonding in Polymers .4. Infrared Temperature Studies of a Simple Polyurethane,"
Macromolecules, vol. 19, pp. 2149-2157, Aug 1986.

175
[46] J. Blackwell and K. H. Gardner, "Structure of the Hard Segments in Polyurethane
Elastomers," Polymer, vol. 20, pp. 13-17, 1979.
[47] M. Furukawa, Y. Mitsui, T. Fukumaru, and K. Kojio, "Microphase-separated
structure and mechanical properties of novel polyurethane elastomers prepared
with ether based diisocyanate," Polymer, vol. 46, pp. 10817-10822, Nov 21 2005.
[48] K. Kojio, M. Furukawa, Y. Nonaka, and S. Nakamura, "Control of Mechanical
Properties of Thermoplastic Polyurethane Elastomers by Restriction of
Crystallization of Soft Segment," Materials, vol. 3, pp. 5097-5110, Dec 2010.
[49] M. S. Sanchez-Adsuar, E. Papon, and J. J. Villenave, "Influence of the synthesis
conditions on the properties of thermoplastic polyurethane elastomers," Journal of
Applied Polymer Science, vol. 76, pp. 1590-1595, Jun 6 2000.
[50] M. S. Sanchez-Adsuar, E. Papon, and J. J. Villenave, "Influence of the
prepolymerization on the properties of thermoplastic polyurethane elastomers.
Part II. Relationship between the prepolymer and polyurethane properties,"
Journal of Applied Polymer Science, vol. 76, pp. 1602-1607, Jun 6 2000.
[51] M. S. Sanchez-Adsuar, E. Papon, and J. J. Villenave, "Influence of the
prepolymerization on the properties of thermoplastic polyurethane elastomers.
Part 1. Prepolymer characterization," Journal of Applied Polymer Science, vol.
76, pp. 1596-1601, Jun 6 2000.
[52] A. Y. Malkin, "Rheology in polymerization processes," Polymer Engineering &
Science, vol. 20, pp. 1035-1044, 1980.
[53] A. Y. Malkin, S. G. Kulichikhin, D. N. Emel'yanov, and I. E. Smetanina,
"Rheokinetics of free-radical polymerization," Polymer, vol. 25, pp. 778-784,
1984.
[54] V. W. A. Verhoeven, M. P. Y. Van Vondel, K. J. Ganzeveld, and L. P. B. M.
Janssen, "Rheo-kinetic measurement of thermoplastic polyurethane
polymerization in a measurement kneader," Polymer Engineering and Science,
vol. 44, pp. 1648-1655, Sep 2004.
[55] S. D. Lipshitz and C. W. Macosko, "Kinetics and energetics of a fast polyurethane
cure," Journal of Applied Polymer Science, vol. 21, pp. 2029-2039, 1977.
[56] S. D. Lipshitz, F. G. Mussati, and C. W. Macosko, "Kinetic and viscosity
relations for urethane network polymerizations," Soc. Plastics Eng. Antec. Tech.
Papers21, pp. 239-241, 1975.
[57] C. S. Schollenberger, K. Dinbergs, and F. D. Stewart, "Thermoplastic
Polyurethane Elastomer Melt Polymerization Study," Rubber Chemistry and
Technology, vol. 55, pp. 137-150, 1982.
[58] B. J. Briscoe, M. B. Khan, and S. M. Richardson, "Rotary injection takes RIM to
new frontiers," Plastics and rubber international, vol. 13, pp. 20-24, 1988.
[59] P. Krol and Z. Wietrzynskalalak, "Study on Structure and Properties of
Carbamates as Model Compounds for Urethane Polymers," European Polymer
Journal, vol. 31, pp. 689-699, Jul 1995.
[60] I. Y. Gorbunova, M. L. Kerber, I. N. Balashov, S. I. Kazakov, and A. Y. Malkin,
"Cure rheokinetics and change in properties of a phenol-urethane composition:
Comparison of results obtained by different methods," Polymer science. Series A,
Chemistry, physics, vol. 43, pp. 826-833, 2001.

176
[61] A. Y. Malkin, S. G. Kulichikhin, and G. K. Shambilova, "Strain Effect on the
Phase State of Polyvinyl Acetate Solutions," Vysokomolekulyarnye Soedineniya
Seriya B, vol. 33, pp. 228-231, Mar 1991.
[62] N. G. Gaylord and N. V. Seeger, "Polyurethanes: chemistry and technology, Part
I. (High Polymers, Vol. XVI). J. H. SAUNDERS and K. C. FRISCH,
Interscience, New York, 1962. ," Journal of Applied Polymer Science, vol. 8, pp.
1498-1499, 1964.
[63] G. n. Oertel and L. Abele, Polyurethane handbook : chemistry, raw materials,
processing, application, properties, 2nd ed. Munich ; New York
Cincinnati: Hanser ;
Hanser/Gardner distributor, 1994.
[64] S. B. Clough and N. S. Schneider, "Structural studies on urethane elastomers,"
Journal of Macromolecular Science, Part B, vol. 2, pp. 553-566, 1968/12/01
1968.
[65] G. M. Estes, R. W. Seymour, and S. L. Cooper, "Infrared Dichroism of
Segmented Polyurethane Elastomers - Poly," Abstracts of Papers of the American
Chemical Society, pp. 26-&, 1970.
[66] J. A. Koutsky, N. V. Hien, and S. L. Cooper, "Some Results on Electron
Microscope Investigations of Polyether-Urethane and Polyester-Urethane Block
Copolymers," Journal of Polymer Science Part B-Polymer Letters, vol. 8, pp.
353-&, 1970.
[67] A. Frick and A. Rochman, "Characterization of TPU-elastomers by thermal
analysis (DSC)," Polymer Testing, vol. 23, pp. 413-417, 6// 2004.
[68] M. A. Hood, B. Wang, J. M. Sands, J. J. La Scala, F. L. Beyer, and C. Y. Li,
"Morphology control of segmented polyurethanes by crystallization of hard and
soft segments," Polymer, vol. 51, pp. 2191-2198, 5/4/ 2010.
[69] T. R. Hesketh, J. W. C. Van Bogart, and S. L. Cooper, "Differential scanning
calorimetry analysis of morphological changes in segmented elastomers,"
Polymer Engineering & Science, vol. 20, pp. 190-197, 1980.
[70] H. N. Ng, A. E. Allegrezza, R. W. Seymour, and S. L. Cooper, "Effect of segment
size and polydispersity on the properties of polyurethane block polymers,"
Polymer, vol. 14, pp. 255-261, 1973/06/01 1973.
[71] S. L. Samuels and G. L. Wilkes, "Comments on the multiple endothermic
behavior observed in segmented urethane systems," Journal of Polymer Science:
Polymer Physics Edition, vol. 11, pp. 807-811, 1973.
[72] R. W. Seymour and S. L. Cooper, "DSC studies of polyurethane block polymers,"
Journal of Polymer Science Part B: Polymer Letters, vol. 9, pp. 689-694, 1971.
[73] R. W. Seymour and S. L. Cooper, "Thermal Analysis of Polyurethane Block
Polymers," Macromolecules, vol. 6, pp. 48-53, 1973/01/01 1973.
[74] J. W. C. Van Bogart, D. A. Bluemke, and S. L. Cooper, "Annealing-induced
morphological changes in segmented elastomers," Polymer, vol. 22, pp. 1428-
1438, 1981/10/01 1981.
[75] G. L. Wilkes, S. Bagrodia, W. Humphries, and R. Wildnauer, "The time
dependence of the thermal and mechanical properties of segmented urethanes

177
following thermal treatment," Journal of Polymer Science: Polymer Letters
Edition, vol. 13, pp. 321-327, 1975.
[76] G. L. Wilkes and J. A. Emerson, "Time dependence of small‐angle x‐ray
measurements on segmented polyurethanes following thermal treatment," Journal
of Applied Physics, vol. 47, pp. 4261-4264, 1976.
[77] G. L. Wilkes and R. Wildnauer, "Kinetic behavior of the thermal and mechanical
properties of segmented urethanes," Journal of Applied Physics, vol. 46, pp.
4148-4152, 1975.
[78] J. T. Koberstein and A. F. Galambos, "Multiple melting in segmented
polyurethane block copolymers," Macromolecules, vol. 25, pp. 5618-5624, 1992.
[79] A. J. Ryan, C. W. Macosko, and W. Bras, "Order-disorder transition in a block
copolyurethane," Macromolecules, vol. 25, pp. 6277-6283, 1992.
[80] B. Chu, T. Gao, Y. Li, J. Wang, C. R. Desper, and C. A. Byrne, "Microphase
separation kinetics in segmented polyurethanes: effects of soft segment length and
structure," Macromolecules, vol. 25, pp. 5724-5729, 1992.
[81] J. T. Koberstein and T. P. Russell, "Simultaneous SAXS-DSC study of multiple
endothermic behavior in polyether-based polyurethane block copolymers,"
Macromolecules, vol. 19, pp. 714-720, 1986.
[82] W. Hu and J. T. Koberstein, "The effect of thermal annealing on the thermal
properties and molecular weight of a segmented polyurethane copolymer,"
Journal of Polymer Science Part B: Polymer Physics, vol. 32, pp. 437-446, 1994.
[83] J. T. Koberstein, I. Gancarz, and T. C. Clarke, "The effects of morphological
transitions on hydrogen bonding in polyurethanes: Preliminary results of
simultaneous DSC–FTIR experiments," Journal of Polymer Science Part B:
Polymer Physics, vol. 24, pp. 2487-2498, 1986.
[84] L. M. Leung and J. T. Koberstein, "Small‐angle scattering analysis of hard‐microdomain structure and microphase mixing in polyurethane elastomers,"
Journal of Polymer Science: Polymer Physics Edition, vol. 23, pp. 1883-1913,
1985.
[85] D. Nichetti and N. Grizzuti, "Determination of the phase transition behavior of
thermoplastic polyurethanes from coupled rheology/DSC measurements,"
Polymer Engineering & Science, vol. 44, pp. 1514-1521, 2004.
[86] R. A. Phillips and S. L. Cooper, "Morphology development during solid‐state
annealing of poly (ether‐ester) multiblock copolymers," Journal of Polymer
Science Part B: Polymer Physics, vol. 34, pp. 737-749, 1996.
[87] J. Silva, R. Andrade, R. Huang, J. Liu, M. Cox, and J. M. Maia, "Rheological
behavior and structure development in thermoplastic polyurethanes under uniaxial
extensional flow," Journal of Non-Newtonian Fluid Mechanics, vol. 222, pp. 96-
103, 2015.
[88] J. Silva, D. Meltzer, J. Liu, M. Cox, and J. Maia, "The influence of thermo‐mechanical history on structure development of elastomeric and amorphous glass
thermoplastic polyurethanes," Polymer Engineering & Science, vol. 54, pp. 1383-
1393, 2014.
[89] Y. Xu, Z. Petrovic, S. Das, and G. L. Wilkes, "Morphology and properties of
thermoplastic polyurethanes with dangling chains in ricinoleate-based soft
segments," Polymer, vol. 49, pp. 4248-4258, 2008.
178
[90] S. Cossar, D. Nichetti, and N. Grizzuti, "A rheological study of the phase
transition in thermoplastic polyurethanes. Critical gel behavior and microstructure
development," Journal of Rheology (1978-present), vol. 48, pp. 691-703, 2004.
[91] D. Nichetti, S. Cossar, and N. Grizzuti, "Effects of molecular weight and
chemical structure on phase transition of thermoplastic polyurethanes," Journal of
Rheology (1978-present), vol. 49, pp. 1361-1376, 2005.
[92] P. J. Yoon and C. D. Han, "Effect of thermal history on the rheological behavior
of thermoplastic polyurethanes," Macromolecules, vol. 33, pp. 2171-2183, 2000.
[93] S. Yamasaki, D. Nishiguchi, K. Kojio, and M. Furukawa, "Effects of aggregation
structure on rheological properties of thermoplastic polyurethanes," Polymer, vol.
48, pp. 4793-4803, 2007.
[94] M. L. Sentmanat, "Miniature universal testing platform: from extensional melt
rheology to solid-state deformation behavior," Rheologica Acta, vol. 43, pp. 657-
669, 2004.
[95] V. C. Barroso, J. A. Covas, and J. M. Maia, "Sources of error and other
difficulties in extensional rheometry revisited: commenting and complementing a
recent paper by T. Schweizer," Rheologica acta, vol. 41, pp. 154-161, 2002.
[96] R. Mao, E. M. McCready, and W. R. Burghardt, "Structural response of an
ordered block copolymer melt to uniaxial extensional flow," Soft matter, vol. 10,
pp. 6198-6207, 2014.
[97] O. S. Carneiro and J. M. Nobrega, "Recent developments in automatic die design
for profile extrusion," Plastics Rubber and Composites, vol. 33, pp. 400-408,
2004.
[98] P. D. Gujrati and A. I. Leonov, Modeling and simulation in polymers. Weinheim:
Wiley-VCH, 2010.
[99] J. F. T. Pittman, "Computer-aided design and optimization of profile extrusion
dies for thermoplastics and rubber: a review," Proceedings of the Institution of
Mechanical Engineers Part E-Journal of Process Mechanical Engineering, vol.
225, pp. 280-321, Nov 2011.
[100] I. Szarvasy, J. Sienz, J. F. T. Pittman, and E. Hinton, "Computer aided
optimisation of profile extrusion dies - Definition and assessment of the objective
function," International Polymer Processing, vol. 15, pp. 28-39, Mar 2000.
[101] J. M. Nobrega, O. S. Carneiro, P. J. Oliveira, and F. T. Pinho, "Flow balancing in
extrusion dies for thermoplastic profiles Part I: Automatic design," International
Polymer Processing, vol. 18, pp. 298-306, Sep 2003.
[102] J. M. Nobrega, O. S. Carneiro, F. T. Pinho, and P. J. Oliveira, "Flow balancing in
extrusion dies for thermoplastic profiles - Part III: Experimental assessment,"
International Polymer Processing, vol. 19, pp. 225-235, Sep 2004.
[103] H. Cheng and I. Manas‐Zloczower, "Study of mixing efficiency in kneading discs
of co‐rotating twin‐screw extruders," Polymer Engineering & Science, vol. 37, pp.
1082-1090, 1997.
[104] H. F. Cheng and I. Manas-Zloczower, "Distributive mixing in conveying elements
of a ZSK-53 co-rotating twin screw extruder," Polymer Engineering and Science,
vol. 38, pp. 926-935, Jun 1998.

179
[105] A. S. Fard and P. D. Anderson, "Simulation of distributive mixing inside mixing
elements of co-rotating twin-screw extruders," Computers & Fluids, vol. 87, pp.
79-91, Oct 25 2013.
[106] A. S. Fard, M. A. Hulsen, H. E. H. Meijer, N. M. H. Famili, and P. D. Anderson,
"Tools to Simulate Distributive Mixing in Twin-Screw Extruders,"
Macromolecular Theory and Simulations, vol. 21, pp. 217-240, May 2012.
[107] T. Ishikawa, T. Amano, S. I. Kihara, and K. Funatsu, "Flow patterns and mixing
mechanisms in the screw mixing element of a co-rotating twin-screw extruder,"
Polymer Engineering and Science, vol. 42, pp. 925-939, May 2002.
[108] T. Ishikawa, S. I. Kihara, and K. Funatsu, "3-D non-isothermal flow field analysis
and mixing performance evaluation of kneading blocks in a co-rotating twin srew
extruder," Polymer Engineering and Science, vol. 41, pp. 840-849, May 2001.
[109] T. Kajiwara, Y. Nagashima, Y. Nakano, and K. Funatsu, "Numerical study of
twin-screw extruders by three-dimensional flow analysis - Development of
analysis technique and evaluation of mixing performance for full flight screws,"
Polymer Engineering and Science, vol. 36, pp. 2142-2152, Aug 1996.
[110] B. Vergnes, G. Della Valle, and L. Delamare, "A global computer software for
polymer flows in corotating twin screw extruders," Polymer Engineering and
Science, vol. 38, pp. 1781-1792, Nov 1998.
[111] H. H. Yang and I. Manas‐Zloczower, "Flow field analysis of the kneading disc
region in a co‐rotating twin screw extruder," Polymer Engineering & Science, vol.
32, pp. 1411-1417, 1992.
[112] X. M. Zhang, L. F. Feng, W. X. Chen, and G. H. Hu, "Numerical Simulation and
Experimental Validation of Mixing Performance of Kneading Discs in a Twin
Screw Extruder," Polymer Engineering and Science, vol. 49, pp. 1772-1783, Sep
2009.
[113] T. Avalosse, Y. Rubin, and L. Fondin, "Non-isothermal modeling of co-rotating
and contra-rotating twin screw extruders," Journal of Reinforced Plastics and
Composites, vol. 21, pp. 419-429, 2002.
[114] H. E. H. Meijer and P. H. M. Elemans, "The Modeling of Continuous Mixers .1.
The Corotating Twin-Screw Extruder," Polymer Engineering and Science, vol.
28, pp. 275-290, Mar 1988.
[115] H. F. Giles, J. R. Wagner, and E. M. Mount, Extrusion : the definitive processing
guide and handbook. Norwich, NY: William Andrew Pub., 2005.
[116] R. G. Larson, Constitutive equations for polymer melts and solutions. Boston:
Butterworths, 1988.
[117] T. Glomsaker, E. L. Hinrichsen, F. Irgens, and P. Thorsteinsen, "Numerical
simulation of extrusion of S-PVC formulations in a capillary rheometer,"
Rheologica Acta, vol. 39, pp. 80-96, Jan 2000.