ATR-FTIR Kretschmann spectroscopy for interfacial studies of a hidden aluminum surface coated with a...
11
133 Research article Received: 23 November 2010 Revised: 23 March 2011 Accepted: 28 March 2011 Published online in Wiley Online Library: 28 June 2011 (wileyonlinelibrary.com) DOI 10.1002/sia.3779 ATR-FTIR Kretschmann spectroscopy for interfacial studies of a hidden aluminum surface coated with a silane film and epoxy I. Characterization by IRRAS and ATR-FTIR Maria ¨ Ohman ∗ and Dan Persson Interfacial analysis is essential in many areas of interest, for instance within the ongoing research on environmentally friendly pretreatments of metal surfaces. While studies of the hidden interface between a metal and polymer top-coat are of great importance, properties of a surface confined between two media are difficult to analyze in detail. Within the two parts of this study, ATR-FTIR spectroscopy in the Kretschmann geometry is employed as the main analytical tool to study the interface between a thermo-cured epoxy and aluminum pretreated with a silane film. The technique requires model systems based on thin metal films, but in contrast to most analytical techniques it permits the analysis of a hidden interface. Initial characterization of the silane film formed from a pH-regulated γ -APS and BTSE solution was conducted by both ATR-FTIR Kretschmann and IRRAS spectroscopy. Absorption bands were obtained at 1250 – 900 cm −1 , assigned to Si – O functionalities, and at ∼1570 and ∼1410 cm −1 assigned to acetate existing as a counter-ion to γ -APS. After application of the epoxy film, interfacial alterations were detected upon thermal curing including the densification of the epoxy film, the dehydration of aluminum and the formation of molecular epoxy reaction products. Few alterations could be assigned to the silane film. Calculated spectra derived from optical data can verify experimental results and aid data interpretation, and effects of metal oxidation of aluminum were confirmed by introducing gold as an additional substrate. The results showed that ATR-FTIR Kretschmann spectroscopy is clearly a valuable tool for the study of hidden interfaces of stratified media. Copyright c 2011 John Wiley & Sons, Ltd. Keywords: ATR-FTIR Kretschmann; IRRAS; interface; aluminum; organic coating; silane Introduction Despite great efforts made to understand the stability of a metal/polymer structure, there is still a lack of knowledge regarding mechanisms that destabilize the interfaces of such structures upon exposure to corrosive conditions. Using FTIR spectroscopy as the main analytical tool, the two parts of this study [1] seek to determine what kind of information may be obtained from the hidden interface between an organic coating and aluminum treated with a silane film. The environmental stability of buried metal/polymer interfaces is essential for many applications such as painted constructions and structures in automotive and packaging applications. This makes the analysis of any hidden interface of utmost importance in order to assess the interfacial stability, but processes at the interface are difficult to analyze with the polymer film being impermeable to most probing particles used in analytical techniques. Several methods exist to describe separate parts of the process, but the transport of water and ions to a metal/polymer interface and the subsequent processes at the metal surface are complicated to analyze in detail. A common method of improving the hydrolytic stability of a polymer-coated metal intended for environmental exposure is to apply a chemical pretreatment to the metal. Conversion coatings based on hexavalent chromium provide excellent protection, but hexavalent chromium is being phased out from industrial applications due to environmental concerns and work health issues. Also the insulating surfaces formed by phosphating are of concern due to the high costs of waste treatment in the phosphating process. Today, there is intense ongoing research regarding the mechanisms and performance of novel environmentally friendly pretreatments, such as the nature of bonding to the metal, the interactions with the organic coating, the water-induced changes of the surface films, and the role of corrosive constituents on the interfacial stability. This makes the analysis of the confined metal/polymer interface crucial for the development of these new ‘green’ systems. Conversion coatings with a low environmental impact can be based on titanium and zirconium which form thin oxide/hydroxide layers with the metal substrate. Another environmentally accept- able route is to apply an adhesion promotor to the metal substrate. In the 1940s, organofunctional silanes received attention as cou- pling agents to improve the adhesion between glass fibres and their organic resins, [2,3] and they were soon also considered for metal substrates. In contrast to the case with conversion systems, the metal does not participate electrochemically in the film de- position mechanism. Instead, the silane forms an interfacial layer of covalent bridges at the interface between the alkali-cleaned metal substrate and an organic coating. The silanol groups of the hydrolyzed organosilane solution coordinate with metal hydroxyl ∗ Correspondence to: Maria ¨ Ohman, Swerea-KIMAB AB, Stockholm, Sweden. E-mail: [email protected] Swerea-KIMAB AB, Stockholm, Sweden Surf. Interface Anal. 2012, 44, 133–143 Copyright c 2011 John Wiley & Sons, Ltd.
-
Upload
independent -
Category
Documents
-
view
0 -
download
0
Transcript of ATR-FTIR Kretschmann spectroscopy for interfacial studies of a hidden aluminum surface coated with a...

13
3
Research articleReceived: 23 November 2010 Revised: 23 March 2011 Accepted: 28 March 2011 Published online in Wiley Online Library: 28 June 2011
(wileyonlinelibrary.com) DOI 10.1002/sia.3779
ATR-FTIR Kretschmann spectroscopy forinterfacial studies of a hidden aluminumsurface coated with a silane film and epoxy I.Characterization by IRRAS and ATR-FTIRMaria Ohman∗ and Dan Persson
Interfacial analysis is essential in many areas of interest, for instance within the ongoing research on environmentally friendlypretreatments of metal surfaces. While studies of the hidden interface between a metal and polymer top-coat are of greatimportance, properties of a surface confined between two media are difficult to analyze in detail. Within the two parts of thisstudy, ATR-FTIR spectroscopy in the Kretschmann geometry is employed as the main analytical tool to study the interfacebetween a thermo-cured epoxy and aluminum pretreated with a silane film. The technique requires model systems based onthin metal films, but in contrast to most analytical techniques it permits the analysis of a hidden interface. Initial characterizationof the silane film formed from a pH-regulated γ -APS and BTSE solution was conducted by both ATR-FTIR Kretschmann andIRRAS spectroscopy. Absorption bands were obtained at 1250–900 cm−1, assigned to Si–O functionalities, and at ∼1570 and∼1410 cm−1 assigned to acetate existing as a counter-ion to γ -APS. After application of the epoxy film, interfacial alterationswere detected upon thermal curing including the densification of the epoxy film, the dehydration of aluminum and theformation of molecular epoxy reaction products. Few alterations could be assigned to the silane film. Calculated spectra derivedfrom optical data can verify experimental results and aid data interpretation, and effects of metal oxidation of aluminum wereconfirmed by introducing gold as an additional substrate. The results showed that ATR-FTIR Kretschmann spectroscopy isclearly a valuable tool for the study of hidden interfaces of stratified media. Copyright c© 2011 John Wiley & Sons, Ltd.
Keywords: ATR-FTIR Kretschmann; IRRAS; interface; aluminum; organic coating; silane
Introduction
Despite great efforts made to understand the stability of ametal/polymer structure, there is still a lack of knowledgeregarding mechanisms that destabilize the interfaces of suchstructures upon exposure to corrosive conditions. Using FTIRspectroscopy as the main analytical tool, the two parts of thisstudy[1] seek to determine what kind of information may beobtained from the hidden interface between an organic coatingand aluminum treated with a silane film.
The environmental stability of buried metal/polymer interfacesis essential for many applications such as painted constructionsand structures in automotive and packaging applications. Thismakes the analysis of any hidden interface of utmost importancein order to assess the interfacial stability, but processes atthe interface are difficult to analyze with the polymer filmbeing impermeable to most probing particles used in analyticaltechniques. Several methods exist to describe separate parts of theprocess, but the transport of water and ions to a metal/polymerinterface and the subsequent processes at the metal surface arecomplicated to analyze in detail.
A common method of improving the hydrolytic stability of apolymer-coated metal intended for environmental exposure is toapply a chemical pretreatment to the metal. Conversion coatingsbased on hexavalent chromium provide excellent protection,but hexavalent chromium is being phased out from industrialapplications due to environmental concerns and work healthissues. Also the insulating surfaces formed by phosphating
are of concern due to the high costs of waste treatmentin the phosphating process. Today, there is intense ongoingresearch regarding the mechanisms and performance of novelenvironmentally friendly pretreatments, such as the nature ofbonding to the metal, the interactions with the organic coating,the water-induced changes of the surface films, and the role ofcorrosive constituents on the interfacial stability. This makes theanalysis of the confined metal/polymer interface crucial for thedevelopment of these new ‘green’ systems.
Conversion coatings with a low environmental impact can bebased on titanium and zirconium which form thin oxide/hydroxidelayers with the metal substrate. Another environmentally accept-able route is to apply an adhesion promotor to the metal substrate.In the 1940s, organofunctional silanes received attention as cou-pling agents to improve the adhesion between glass fibres andtheir organic resins,[2,3] and they were soon also considered formetal substrates. In contrast to the case with conversion systems,the metal does not participate electrochemically in the film de-position mechanism. Instead, the silane forms an interfacial layerof covalent bridges at the interface between the alkali-cleanedmetal substrate and an organic coating. The silanol groups of thehydrolyzed organosilane solution coordinate with metal hydroxyl
∗ Correspondence to: Maria Ohman, Swerea-KIMAB AB, Stockholm, Sweden.E-mail: [email protected]
Swerea-KIMAB AB, Stockholm, Sweden
Surf. Interface Anal. 2012, 44, 133–143 Copyright c© 2011 John Wiley & Sons, Ltd.
13
4
M. Ohman and D. Persson
groups. Residual silanols form a densely cross-linked siloxanemultilayer that is aimed to provide further protection againsthydration and the action of aggressive species. The adhesion be-tween a metal surface and a polymer top-coat could be the resultof physical interactions and/or chemical bonding through a func-tional end group. A mixture of two silanes may be more effectivethan a single silane[3] and several commercial products currentlycombine silanes with both inorganic components and organicadditives within the same products. Owing to regulations and re-strictions regarding the use of solvents for industrial applications,commercial products are nowadays delivered as water-based pre-hydrolyzed solutions. This study used a water-based silane mixturebased on prehydrolyzed γ -aminopropylsilane (γ -APS) and bis-1,2-(triethoxysilyl)ethane (BTSE). BTSE has a high density of hydroxylsand may form a dense, highly cross-linked interfacial layer with arelatively low porosity and high hydrophobicity.[4] The γ -APS con-tains amino functionalities that may further increase the adhesionto a polymer top-coat.
The present study uses both attenuated total reflection Fouriertransform infrared spectroscopy (ATR-FTIR) and infrared reflectionabsorption spectroscopy (IRRAS) for characterization of the system.IRRAS is a well established technique for IR analysis of thin filmson metal surfaces and may provide information about both thecomposition of the surface film and the bonding to the metalsurface. The technique is based on the reflection of IR radiationwith a grazing angle of incidence on the metal surface. Owing tothe enhancement of the electric field strength perpendicular to theplane of the metal surface, the technique is highly surface-sensitiveand permits the analysis of very thin surface films. Furthermore,the thickness of the surface film can be evaluated by comparisonwith simulated IRRAS spectra based on optical data for the metaland the surface film. ATR-FTIR spectroscopy is employed in theKretschmann geometry[5] for both surface characterization of thesurface film and for analysis of the hidden interface betweenthe surface-treated metal and the polymer top-coat. ATR-FTIR isbased on the total reflection of the incident infrared radiationat the surface of an internal reflection element (IRE), wherean evanescent wave passes into any optically thinner materialattached to the IRE. The electric field of this evanescent wavedecays exponentially with increasing distance from the IRE surface,while sample excitation results in characteristic absorption spectra.The depth of penetration, dp, is defined as the distance from the IREelement where the electric field amplitude has decreased to 1/e ofits initial value at the surface and depends on the wavelength ofthe infrared radiation, the angle of incidence of the IR radiation andthe refractive indices of the media involved.[5,6] A value of dp canbe estimated for media with no (or negligible) imaginary refractiveindex.[6] For a ZnSe element covered with a polymer film andradiation incident at 75◦, the value of dp within the spectral regionof interest ranges from ∼0.2 to 1.4 µm (4000–600 cm−1). Despitethe strongly absorbing character of metals, an electric field can passthrough a thin metal film of tens of nanometer thickness depositedonto the IRE. This is ATR-FTIR in the Kretschmann configuration,[3,4]
and allows the detection of an absorption spectrum close to themetal surface. If the metal is further coated with a polymer film andexposed to a medium, the transport of species to the interface andchanges in the interfacial region can be studied.[7 – 14] While theactual value of dp is independent of the thickness of the metal film,the electric field amplitude at the metal surface will be significantlyless than at the surface of the IRE. This means that the magnitudeof the absorption bands is strongly related to the thickness andoptical properties of the metal film.[15,16]
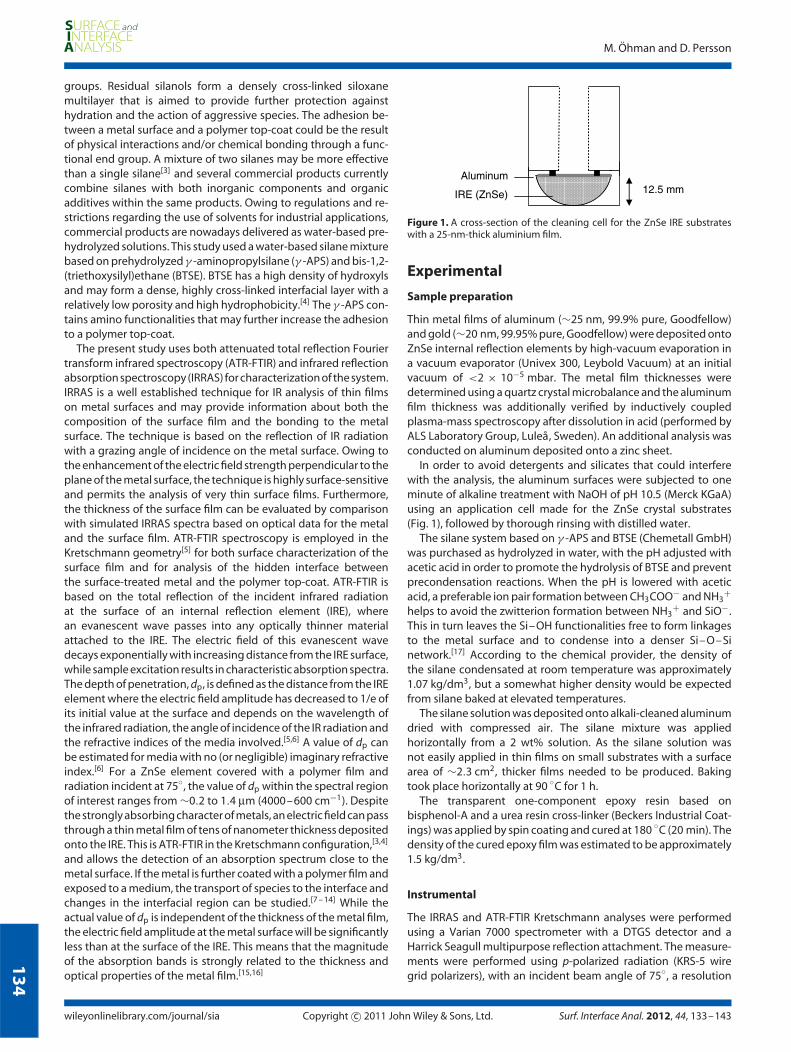
12.5 mmIRE (ZnSe)
Aluminum
Figure 1. A cross-section of the cleaning cell for the ZnSe IRE substrateswith a 25-nm-thick aluminium film.
Experimental
Sample preparation
Thin metal films of aluminum (∼25 nm, 99.9% pure, Goodfellow)and gold (∼20 nm, 99.95% pure, Goodfellow) were deposited ontoZnSe internal reflection elements by high-vacuum evaporation ina vacuum evaporator (Univex 300, Leybold Vacuum) at an initialvacuum of <2 × 10⁻⁵ mbar. The metal film thicknesses weredetermined using a quartz crystal microbalance and the aluminumfilm thickness was additionally verified by inductively coupledplasma-mass spectroscopy after dissolution in acid (performed byALS Laboratory Group, Luleå, Sweden). An additional analysis wasconducted on aluminum deposited onto a zinc sheet.
In order to avoid detergents and silicates that could interferewith the analysis, the aluminum surfaces were subjected to oneminute of alkaline treatment with NaOH of pH 10.5 (Merck KGaA)using an application cell made for the ZnSe crystal substrates(Fig. 1), followed by thorough rinsing with distilled water.
The silane system based on γ -APS and BTSE (Chemetall GmbH)was purchased as hydrolyzed in water, with the pH adjusted withacetic acid in order to promote the hydrolysis of BTSE and preventprecondensation reactions. When the pH is lowered with aceticacid, a preferable ion pair formation between CH3COO− and NH3
+
helps to avoid the zwitterion formation between NH3+ and SiO−.
This in turn leaves the Si–OH functionalities free to form linkagesto the metal surface and to condense into a denser Si–O–Sinetwork.[17] According to the chemical provider, the density ofthe silane condensated at room temperature was approximately1.07 kg/dm3, but a somewhat higher density would be expectedfrom silane baked at elevated temperatures.
The silane solution was deposited onto alkali-cleaned aluminumdried with compressed air. The silane mixture was appliedhorizontally from a 2 wt% solution. As the silane solution wasnot easily applied in thin films on small substrates with a surfacearea of ∼2.3 cm2, thicker films needed to be produced. Bakingtook place horizontally at 90 ◦C for 1 h.
The transparent one-component epoxy resin based onbisphenol-A and a urea resin cross-linker (Beckers Industrial Coat-ings) was applied by spin coating and cured at 180 ◦C (20 min). Thedensity of the cured epoxy film was estimated to be approximately1.5 kg/dm3.
Instrumental
The IRRAS and ATR-FTIR Kretschmann analyses were performedusing a Varian 7000 spectrometer with a DTGS detector and aHarrick Seagull multipurpose reflection attachment. The measure-ments were performed using p-polarized radiation (KRS-5 wiregrid polarizers), with an incident beam angle of 75◦, a resolution
wileyonlinelibrary.com/journal/sia Copyright c© 2011 John Wiley & Sons, Ltd. Surf. Interface Anal. 2012, 44, 133–143
13
5
ATR-FTIR Kretschmann Studies of a hidden aluminum surface coated with silane film (I)
4000 3000 2000 1000
0.00
0.01
0.02
0.031120
2930
Abs
orba
nce,
–lo
g(R
/R0)
Wavenumber (cm–1) 1500 1200 900
0.00
0.01
0.02
1160
765
830
915
1120
1275
1410
1460
4000 3000 2000 1000
0.00
0.02
0.04
0.06 1010
2930
Abs
orba
nce,
–lo
g(R
/R0)
Wavenumber (cm–1) 1500 1200 900
0.00
0.02
0.04
12001470
750
15401635
(a)
(b)
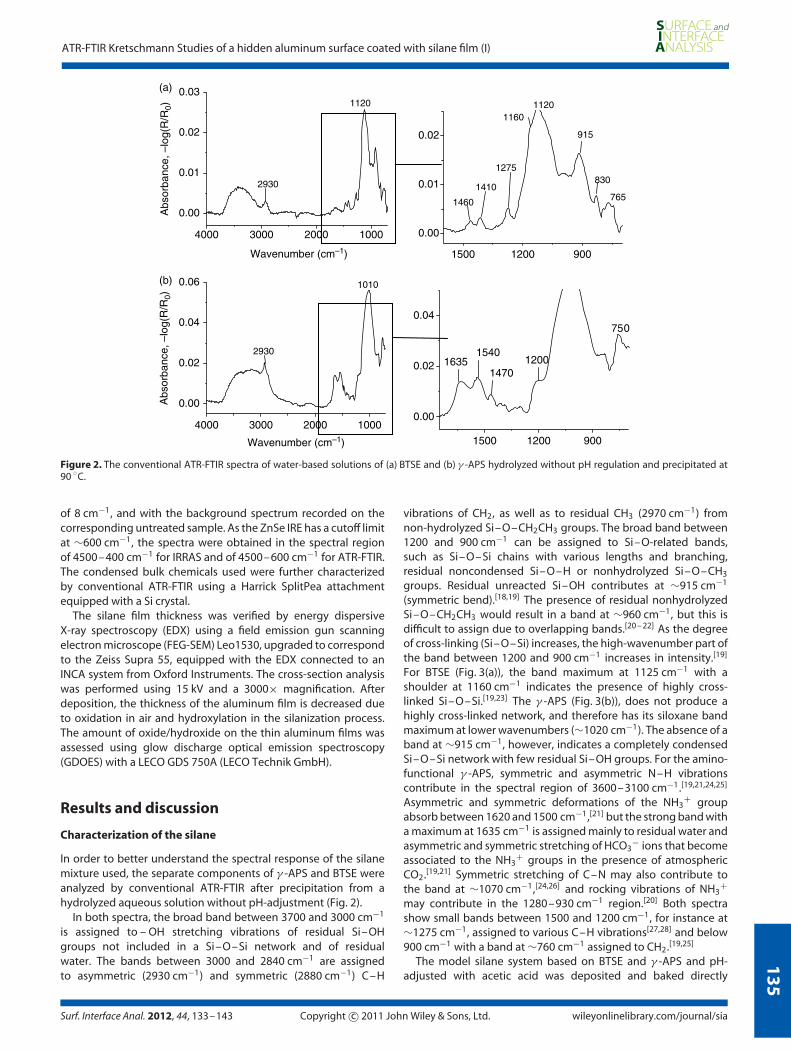
Figure 2. The conventional ATR-FTIR spectra of water-based solutions of (a) BTSE and (b) γ -APS hydrolyzed without pH regulation and precipitated at90 ◦C.
of 8 cm−1, and with the background spectrum recorded on thecorresponding untreated sample. As the ZnSe IRE has a cutoff limitat ∼600 cm−1, the spectra were obtained in the spectral regionof 4500–400 cm−1 for IRRAS and of 4500–600 cm−1 for ATR-FTIR.The condensed bulk chemicals used were further characterizedby conventional ATR-FTIR using a Harrick SplitPea attachmentequipped with a Si crystal.
The silane film thickness was verified by energy dispersiveX-ray spectroscopy (EDX) using a field emission gun scanningelectron microscope (FEG-SEM) Leo1530, upgraded to correspondto the Zeiss Supra 55, equipped with the EDX connected to anINCA system from Oxford Instruments. The cross-section analysiswas performed using 15 kV and a 3000× magnification. Afterdeposition, the thickness of the aluminum film is decreased dueto oxidation in air and hydroxylation in the silanization process.The amount of oxide/hydroxide on the thin aluminum films wasassessed using glow discharge optical emission spectroscopy(GDOES) with a LECO GDS 750A (LECO Technik GmbH).
Results and discussion
Characterization of the silane
In order to better understand the spectral response of the silanemixture used, the separate components of γ -APS and BTSE wereanalyzed by conventional ATR-FTIR after precipitation from ahydrolyzed aqueous solution without pH-adjustment (Fig. 2).
In both spectra, the broad band between 3700 and 3000 cm−1
is assigned to – OH stretching vibrations of residual Si–OHgroups not included in a Si–O–Si network and of residualwater. The bands between 3000 and 2840 cm−1 are assignedto asymmetric (2930 cm−1) and symmetric (2880 cm−1) C–H
vibrations of CH2, as well as to residual CH3 (2970 cm−1) fromnon-hydrolyzed Si–O–CH2CH3 groups. The broad band between1200 and 900 cm−1 can be assigned to Si–O-related bands,such as Si–O–Si chains with various lengths and branching,residual noncondensed Si–O–H or nonhydrolyzed Si–O–CH3
groups. Residual unreacted Si–OH contributes at ∼915 cm−1
(symmetric bend).[18,19] The presence of residual nonhydrolyzedSi–O–CH2CH3 would result in a band at ∼960 cm−1, but this isdifficult to assign due to overlapping bands.[20 – 22] As the degreeof cross-linking (Si–O–Si) increases, the high-wavenumber part ofthe band between 1200 and 900 cm−1 increases in intensity.[19]
For BTSE (Fig. 3(a)), the band maximum at 1125 cm−1 with ashoulder at 1160 cm−1 indicates the presence of highly cross-linked Si–O–Si.[19,23] The γ -APS (Fig. 3(b)), does not produce ahighly cross-linked network, and therefore has its siloxane bandmaximum at lower wavenumbers (∼1020 cm−1). The absence of aband at ∼915 cm−1, however, indicates a completely condensedSi–O–Si network with few residual Si–OH groups. For the amino-functional γ -APS, symmetric and asymmetric N–H vibrationscontribute in the spectral region of 3600–3100 cm−1.[19,21,24,25]
Asymmetric and symmetric deformations of the NH3+ group
absorb between 1620 and 1500 cm−1,[21] but the strong band witha maximum at 1635 cm−1 is assigned mainly to residual water andasymmetric and symmetric stretching of HCO3
− ions that becomeassociated to the NH3
+ groups in the presence of atmosphericCO2.[19,21] Symmetric stretching of C–N may also contribute tothe band at ∼1070 cm−1,[24,26] and rocking vibrations of NH3
+may contribute in the 1280–930 cm−1 region.[20] Both spectrashow small bands between 1500 and 1200 cm−1, for instance at∼1275 cm−1, assigned to various C–H vibrations[27,28] and below900 cm−1 with a band at ∼760 cm−1 assigned to CH2.[19,25]
The model silane system based on BTSE and γ -APS and pH-adjusted with acetic acid was deposited and baked directly
Surf. Interface Anal. 2012, 44, 133–143 Copyright c© 2011 John Wiley & Sons, Ltd. wileyonlinelibrary.com/journal/sia
13
6
M. Ohman and D. Persson
4000 3000 2000 1000
0.00
0.02
0.041160
1030
Wavenumber (cm–1)
Abs
orba
nce,
–lo
g(R
/R0)
2920
1800 1500 1200 900 600
0.00
0.01
0.02
1640
690770
925
12801330
1405
1560
(a) (b)
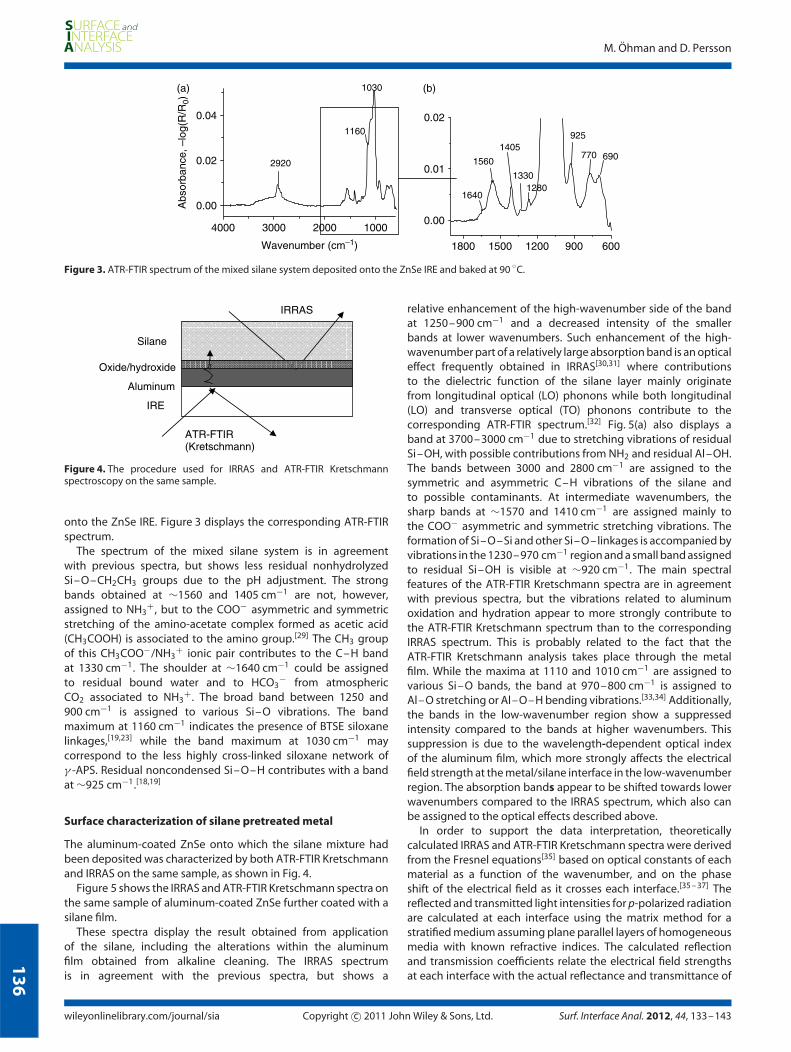
Figure 3. ATR-FTIR spectrum of the mixed silane system deposited onto the ZnSe IRE and baked at 90 ◦C.
IRRAS
ATR-FTIR(Kretschmann)
Silane
Aluminum
IRE
Oxide/hydroxide
Figure 4. The procedure used for IRRAS and ATR-FTIR Kretschmannspectroscopy on the same sample.
onto the ZnSe IRE. Figure 3 displays the corresponding ATR-FTIRspectrum.
The spectrum of the mixed silane system is in agreementwith previous spectra, but shows less residual nonhydrolyzedSi–O–CH2CH3 groups due to the pH adjustment. The strongbands obtained at ∼1560 and 1405 cm−1 are not, however,assigned to NH3
+, but to the COO− asymmetric and symmetricstretching of the amino-acetate complex formed as acetic acid(CH3COOH) is associated to the amino group.[29] The CH3 groupof this CH3COO−/NH3
+ ionic pair contributes to the C–H bandat 1330 cm−1. The shoulder at ∼1640 cm−1 could be assignedto residual bound water and to HCO3
− from atmosphericCO2 associated to NH3
+. The broad band between 1250 and900 cm−1 is assigned to various Si–O vibrations. The bandmaximum at 1160 cm−1 indicates the presence of BTSE siloxanelinkages,[19,23] while the band maximum at 1030 cm−1 maycorrespond to the less highly cross-linked siloxane network ofγ -APS. Residual noncondensed Si–O–H contributes with a bandat ∼925 cm−1.[18,19]
Surface characterization of silane pretreated metal
The aluminum-coated ZnSe onto which the silane mixture hadbeen deposited was characterized by both ATR-FTIR Kretschmannand IRRAS on the same sample, as shown in Fig. 4.
Figure 5 shows the IRRAS and ATR-FTIR Kretschmann spectra onthe same sample of aluminum-coated ZnSe further coated with asilane film.
These spectra display the result obtained from applicationof the silane, including the alterations within the aluminumfilm obtained from alkaline cleaning. The IRRAS spectrumis in agreement with the previous spectra, but shows a
relative enhancement of the high-wavenumber side of the bandat 1250–900 cm−1 and a decreased intensity of the smallerbands at lower wavenumbers. Such enhancement of the high-wavenumber part of a relatively large absorption band is an opticaleffect frequently obtained in IRRAS[30,31] where contributionsto the dielectric function of the silane layer mainly originatefrom longitudinal optical (LO) phonons while both longitudinal(LO) and transverse optical (TO) phonons contribute to thecorresponding ATR-FTIR spectrum.[32] Fig. 5(a) also displays aband at 3700–3000 cm−1 due to stretching vibrations of residualSi–OH, with possible contributions from NH2 and residual Al–OH.The bands between 3000 and 2800 cm−1 are assigned to thesymmetric and asymmetric C–H vibrations of the silane andto possible contaminants. At intermediate wavenumbers, thesharp bands at ∼1570 and 1410 cm−1 are assigned mainly tothe COO− asymmetric and symmetric stretching vibrations. Theformation of Si–O–Si and other Si–O–linkages is accompanied byvibrations in the 1230–970 cm−1 region and a small band assignedto residual Si–OH is visible at ∼920 cm−1. The main spectralfeatures of the ATR-FTIR Kretschmann spectra are in agreementwith previous spectra, but the vibrations related to aluminumoxidation and hydration appear to more strongly contribute tothe ATR-FTIR Kretschmann spectrum than to the correspondingIRRAS spectrum. This is probably related to the fact that theATR-FTIR Kretschmann analysis takes place through the metalfilm. While the maxima at 1110 and 1010 cm−1 are assigned tovarious Si–O bands, the band at 970–800 cm−1 is assigned toAl–O stretching or Al–O–H bending vibrations.[33,34] Additionally,the bands in the low-wavenumber region show a suppressedintensity compared to the bands at higher wavenumbers. Thissuppression is due to the wavelength-dependent optical indexof the aluminum film, which more strongly affects the electricalfield strength at the metal/silane interface in the low-wavenumberregion. The absorption bands appear to be shifted towards lowerwavenumbers compared to the IRRAS spectrum, which also canbe assigned to the optical effects described above.
In order to support the data interpretation, theoreticallycalculated IRRAS and ATR-FTIR Kretschmann spectra were derivedfrom the Fresnel equations[35] based on optical constants of eachmaterial as a function of the wavenumber, and on the phaseshift of the electrical field as it crosses each interface.[35 – 37] Thereflected and transmitted light intensities for p-polarized radiationare calculated at each interface using the matrix method for astratified medium assuming plane parallel layers of homogeneousmedia with known refractive indices. The calculated reflectionand transmission coefficients relate the electrical field strengthsat each interface with the actual reflectance and transmittance of
wileyonlinelibrary.com/journal/sia Copyright c© 2011 John Wiley & Sons, Ltd. Surf. Interface Anal. 2012, 44, 133–143

13
7
ATR-FTIR Kretschmann Studies of a hidden aluminum surface coated with silane film (I)
4000 3000 2000 1000
0.00
0.05
0.10
0.15
0.20
–OHN–H C–H
Abs
orba
nce,
–lo
g(R
/R0)
Wavenumber (cm–1) 1800 1500 1200 900 600
0.00
0.05
0.10
0.15
0.20
N–H
(1410)COO–
C–HSi–OH
Si–O–Si
1050
(920)
COO–
(1570)
1160
4000 3000 2000 1000
0.000
0.002
0.004
0.006
0.008
Abs
orba
nce,
–lo
g(R
/R0)
Wavenumber (cm–1) 1800 1500 1200 900
0.000
0.002
0.004
0.006
0.008
Si–O–Si
Al–O
COO–
COO–
~1110)
1010
(1405)
(1560)
(a)
(b)
Figure 5. The (a) IRRAS and (b) ATR-FTIR Kretschmann spectra of aluminium-coated ZnSe onto which silane had been deposited.
the whole stratified system. The optical data of ZnSe (n∞ ∼2.42),aluminum and gold were found in the literature.[38] The opticalindex of the aluminum film was taken from optical data of filmsprepared with similar high-vacuum evaporation conditions asin this work.[38] Owing to the presence of surface oxidation,the optical constants of a certain fraction of the aluminumfilm were based on an assumption that the oxide/hydroxidelayers can be represented by the constant oxide refraction index(n∞ ∼1.9).[37] Approximate optical data for the silane were derivedexperimentally from FTIR transmission data.
The approximate depth of the aluminum oxide and hydroxidelayer formed during the process was obtained by depth profilingby GDOES. The material densities used in the estimation of thisdepth profile from the time-dependant profile were obtained byadding the volumes of each atomic species at each data point. Thesputtering time of the different elements was not constant, but theintersections of each element may still be used as an estimate ofthe layer thickness. This depth of altered material appeared to besimilar also for the spontaneously oxidized aluminum used for theFTIR background spectra and for the aluminum surfaces exposedto alkaline cleaning or elevated temperatures. The estimated depthof oxidized aluminum was ∼12% of the total aluminum film, i.e.∼3 nm for an initial aluminum film thickness of 25 nm.
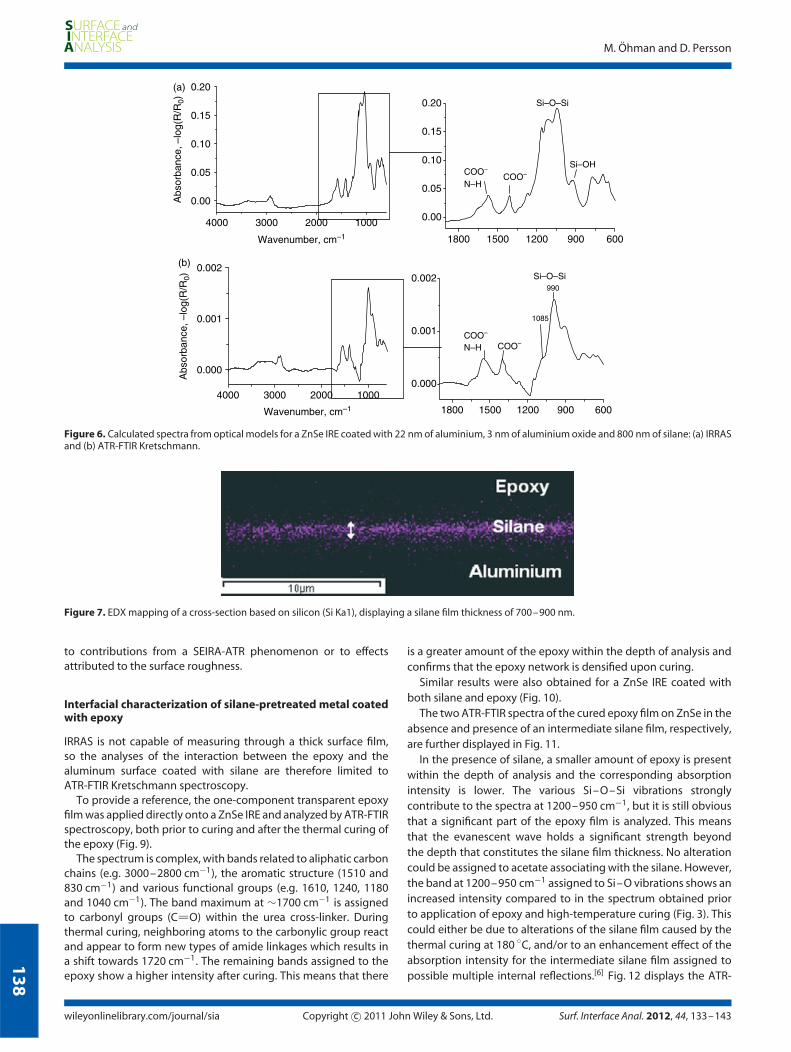
Figure 6 shows the calculated IRRAS and ATR-FTIR Kretschmannspectra based on a 22-nm-thick aluminum film coated with 3 nmof a simplified aluminum oxide and 800 nm of silane.
Both calculated spectra show spectral features similar tothe experimental spectra (Fig. 5), but the calculated ATR-FTIRKretschmann spectrum shows about 3 times lower absorptionintensity of the band assigned to Si–O–Si than the experimentalspectrum. This may be explained by an incorrect value of the opticalindex for the silane film whose density is difficult to verify. Anotherfactor that is not taken into account in these calculations is thesurface roughness of the underlying ZnSe substrate. Yet a possible
reason for the lower band intensities obtained in the calculatedATR-FTIR Kretschmann spectrum could be the enhancementphenomenon observed by other authors for thin deposited metalfilms.[39 – 46] Such surface-enhanced ATR-spectroscopy (SEIRA-ATR)has been ascribed to an enhanced localized electromagnetic fielddeveloped around the small particles that comprize very thin metalfilms and/or to contributions from chemical effects between theadsorbate and the metal. Such effects are not taken into accountin the calculations performed.
The calculated IRRAS spectrum was also used to estimate themean film thickness of the silane in the experimental spectrum(Fig 5(a)). This estimation is based on the absorption intensity ofthe Si–O–Si band maximum at ∼1160 cm−1 and assumes an evenfilm thickness and a constant density of the samples analyzed.The silane film thickness was estimated to ∼800 nm, but as therelationship between absorption band intensity and film thicknessis not linear for thicker surface films, the estimation is subjected tosome uncertainty. A thickness of 700–900 nm was also confirmedby EDX imaging (Fig. 7) of a cross-section of an aluminum sheetcoated with a silane film and an epoxy top-coat.
In order to deduce the effect of metal oxidation on the ATR-FTIR Kretschmann spectrum, gold was introduced as an additionalmetal substrate. Figure 8 shows both the experimental and thecalculated ATR-FTIR Kretschmann spectra of gold-coated ZnSe onwhich the silane was deposited.
In the absence of metal oxidation, the calculated spectrumon gold shows a reasonable agreement with the experimentaldata, except that the absorption bands show a lower intensity.The band assigned to Si–O–Si shows approximately 3 timeslower absorption intensity than the experimental spectrum. Thisis in agreement with the corresponding results on aluminum andimplies that the difference is not caused by incorrect values ofthe effective refractive index of the thin aluminum film, but ratherby incorrect values of the optical index of the silane film, or due
Surf. Interface Anal. 2012, 44, 133–143 Copyright c© 2011 John Wiley & Sons, Ltd. wileyonlinelibrary.com/journal/sia
13
8
M. Ohman and D. Persson
4000 3000 2000 1000
0.00
0.05
0.10
0.15
0.20
Abs
orba
nce,
–lo
g(R
/R0)
Wavenumber, cm–1 1800 1500 1200 900 600
0.00
0.05
0.10
0.15
0.20
COO–
N–HCOO–
Si–O–Si
Si–OH
4000 3000 2000 1000
0.000
0.001
0.002
Wavenumber, cm–1
Abs
orba
nce,
–lo
g(R
/R0)
1800 1500 1200 900 600
0.000
0.001
0.002990
Si–O–Si
COO–COO–
N–H
1085
(a)
(b)
Figure 6. Calculated spectra from optical models for a ZnSe IRE coated with 22 nm of aluminium, 3 nm of aluminium oxide and 800 nm of silane: (a) IRRASand (b) ATR-FTIR Kretschmann.
Figure 7. EDX mapping of a cross-section based on silicon (Si Ka1), displaying a silane film thickness of 700–900 nm.
to contributions from a SEIRA-ATR phenomenon or to effectsattributed to the surface roughness.
Interfacial characterization of silane-pretreated metal coatedwith epoxy
IRRAS is not capable of measuring through a thick surface film,so the analyses of the interaction between the epoxy and thealuminum surface coated with silane are therefore limited toATR-FTIR Kretschmann spectroscopy.
To provide a reference, the one-component transparent epoxyfilm was applied directly onto a ZnSe IRE and analyzed by ATR-FTIRspectroscopy, both prior to curing and after the thermal curing ofthe epoxy (Fig. 9).
The spectrum is complex, with bands related to aliphatic carbonchains (e.g. 3000–2800 cm−1), the aromatic structure (1510 and830 cm−1) and various functional groups (e.g. 1610, 1240, 1180and 1040 cm−1). The band maximum at ∼1700 cm−1 is assignedto carbonyl groups (C O) within the urea cross-linker. Duringthermal curing, neighboring atoms to the carbonylic group reactand appear to form new types of amide linkages which results ina shift towards 1720 cm−1. The remaining bands assigned to theepoxy show a higher intensity after curing. This means that there
is a greater amount of the epoxy within the depth of analysis andconfirms that the epoxy network is densified upon curing.
Similar results were also obtained for a ZnSe IRE coated withboth silane and epoxy (Fig. 10).
The two ATR-FTIR spectra of the cured epoxy film on ZnSe in theabsence and presence of an intermediate silane film, respectively,are further displayed in Fig. 11.
In the presence of silane, a smaller amount of epoxy is presentwithin the depth of analysis and the corresponding absorptionintensity is lower. The various Si–O–Si vibrations stronglycontribute to the spectra at 1200–950 cm−1, but it is still obviousthat a significant part of the epoxy film is analyzed. This meansthat the evanescent wave holds a significant strength beyondthe depth that constitutes the silane film thickness. No alterationcould be assigned to acetate associating with the silane. However,the band at 1200–950 cm−1 assigned to Si–O vibrations shows anincreased intensity compared to in the spectrum obtained priorto application of epoxy and high-temperature curing (Fig. 3). Thiscould either be due to alterations of the silane film caused by thethermal curing at 180 ◦C, and/or to an enhancement effect of theabsorption intensity for the intermediate silane film assigned topossible multiple internal reflections.[6] Fig. 12 displays the ATR-
wileyonlinelibrary.com/journal/sia Copyright c© 2011 John Wiley & Sons, Ltd. Surf. Interface Anal. 2012, 44, 133–143

13
9
ATR-FTIR Kretschmann Studies of a hidden aluminum surface coated with silane film (I)
4000 3000 2000 1000
0.000
0.002
0.004Experimental
Abs
orba
nce,
–lo
g(R
/R0)
Wavenumber, cm–1 1800 1500 1200 900 600
0.000
0.002
0.004
COO–
(N–H)
Si–O–Si
Si–OH
CH3
4000 3000 2000 1000
0.0000
0.0005
0.0010 Calculated
Abs
orba
nce,
–lo
g(R
/R0)
Wavenumber, cm–1 1800 1500 1200 900 600
0.0000
0.0005
0.0010
CH3
Si–OH
Si–O–Si
COO–
(N–H)
(a)
(b)
Figure 8. The ATR-FTIR Kretschmann spectra of ZnSe coated with gold after deposition of the silane (a) based on experimental results, and (b) calculatedfrom optical models based on gold (20 nm) and silane (800 nm).
FTIR spectra of ZnSe only coated with silane after initial baking at90 ◦C and after a subsequent curing at 180 ◦C, respectively.
The acetate-related bands with maxima at ∼1560 and1410 cm−1 decrease significantly due to a proton donation frome.g. postcondensation of the silane and/or dehydration of thealuminum surface, which in turn results in the evaporation ofacetic acid. The small remaining spectral contributions to thespectrum between ∼1700 and 1300 cm−1 can be assigned to theamino-functionalities of the γ -APS. However, the alterations in the1200–900 cm−1 region are small and could not explain the appar-ent increased intensity observed in this spectral region in Fig. 11compared to that in Fig. 3, not subjected to high-temperature cur-ing. The remaining explanation could be an enhancement of theabsorption signals of an intermediate layer beneath an opticallydenser film, resulting from a larger number of internal reflectionswithin this layer.[6]
Furthermore, the interactions between the polymer film and athin aluminum film were analyzed by ATR-FTIR Kretschmann priorto and after thermal curing (Fig. 13).
In the absence of silane, all the bands are assigned to theepoxy network or to the alkali-cleaned aluminum. Prior to curing,bands assigned to the epoxy backbone are visible at ∼1700,1610, 1510, 1240 and 1180 cm−1. The broad strong band below1100 cm−1 is assigned to Al–O-related vibrations after the alkalinecleaning, with the aromatic backbone of the epoxy contributingto the sharp maximum at ∼830 cm−1. After curing, a decrease inintensity at 3700–3000 cm−1 and 1100–950 cm−1 and an increaseat 950–700 cm−1 can be assigned to the reformation of Al–O fromAl–OH. In agreement with Fig. 9, the decrease in absorbance of theband at 1700 cm−1 with a corresponding increase at 1720 cm−1 isassigned to structural changes in the epoxy network. The increasein intensity at 1610, 1510, 1240, 1180 and 830 cm−1 is assigned
4000 3000 2000 10000.00
0.05
0.10
0.15
Abs
orba
nce,
–lo
g(R
/R0)
Wavenumber (cm–1)1800 1500 1200 900
0.00
0.05
0.10
0.15830
1510
1700
1720
Figure 9. ATR-FTIR spectrum of a pure ZnSe IRE coated with epoxy, both prior to curing (red) and after curing of the epoxy (black).
Surf. Interface Anal. 2012, 44, 133–143 Copyright c© 2011 John Wiley & Sons, Ltd. wileyonlinelibrary.com/journal/sia
14
0
M. Ohman and D. Persson
4000 3000 2000 10000.00
0.05
0.10
0.15
Wavenumber, cm–1
Abs
orba
nce,
–lo
g(R
/R0)
1800 1500 1200 900 600
0.00
0.05
0.10
0.15
Epoxy
EpoxyEpoxy
Si–O–Si
(820)(1505)
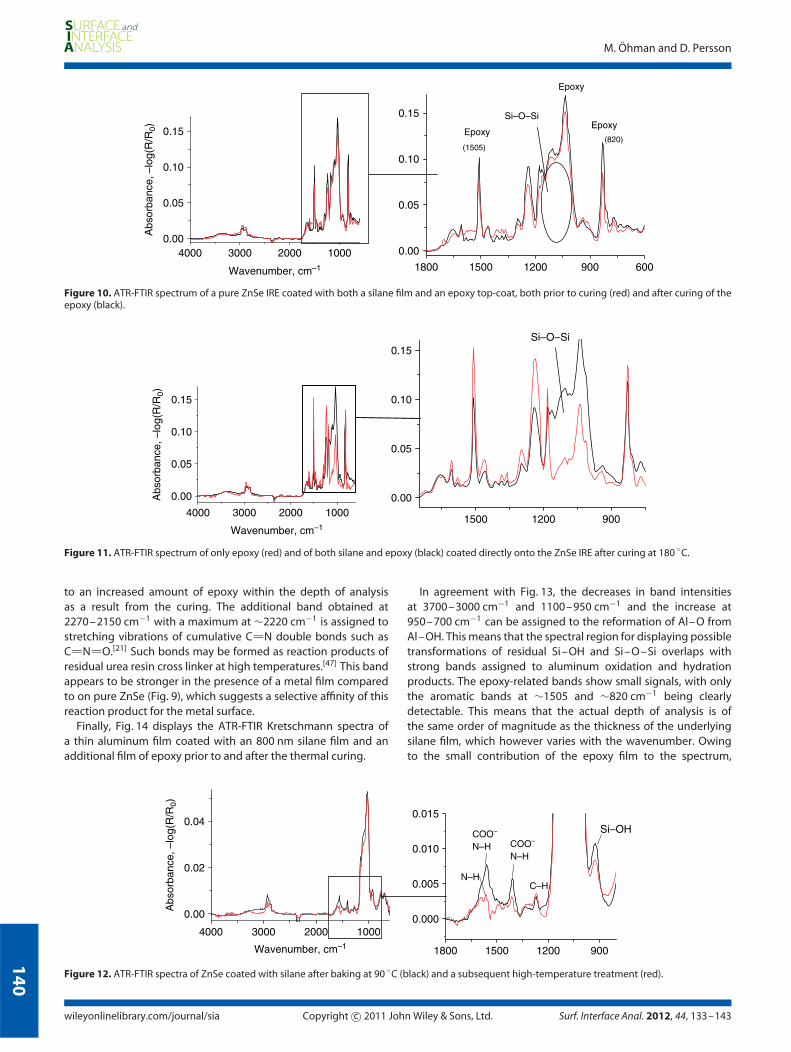
Figure 10. ATR-FTIR spectrum of a pure ZnSe IRE coated with both a silane film and an epoxy top-coat, both prior to curing (red) and after curing of theepoxy (black).
4000 3000 2000 1000
0.00
0.05
0.10
0.15
Wavenumber, cm–1
Abs
orba
nce,
–lo
g(R
/R0)
1500 1200 900
0.00
0.05
0.10
0.15Si–O–Si
Figure 11. ATR-FTIR spectrum of only epoxy (red) and of both silane and epoxy (black) coated directly onto the ZnSe IRE after curing at 180 ◦C.
to an increased amount of epoxy within the depth of analysisas a result from the curing. The additional band obtained at2270–2150 cm−1 with a maximum at ∼2220 cm−1 is assigned tostretching vibrations of cumulative C N double bonds such asC N O.[21] Such bonds may be formed as reaction products ofresidual urea resin cross linker at high temperatures.[47] This bandappears to be stronger in the presence of a metal film comparedto on pure ZnSe (Fig. 9), which suggests a selective affinity of thisreaction product for the metal surface.
Finally, Fig. 14 displays the ATR-FTIR Kretschmann spectra ofa thin aluminum film coated with an 800 nm silane film and anadditional film of epoxy prior to and after the thermal curing.
In agreement with Fig. 13, the decreases in band intensitiesat 3700–3000 cm−1 and 1100–950 cm−1 and the increase at950–700 cm−1 can be assigned to the reformation of Al–O fromAl–OH. This means that the spectral region for displaying possibletransformations of residual Si–OH and Si–O–Si overlaps withstrong bands assigned to aluminum oxidation and hydrationproducts. The epoxy-related bands show small signals, with onlythe aromatic bands at ∼1505 and ∼820 cm−1 being clearlydetectable. This means that the actual depth of analysis is ofthe same order of magnitude as the thickness of the underlyingsilane film, which however varies with the wavenumber. Owingto the small contribution of the epoxy film to the spectrum,
4000 3000 2000 1000
0.00
0.02
0.04
Abs
orba
nce,
–lo
g(R
/R0)
Wavenumber, cm–1 1800 1500 1200 900
0.000
0.005
0.010
0.015Si–OH
C–H
COO–
N–H
N–H
COO–
N–H
Figure 12. ATR-FTIR spectra of ZnSe coated with silane after baking at 90 ◦C (black) and a subsequent high-temperature treatment (red).
wileyonlinelibrary.com/journal/sia Copyright c© 2011 John Wiley & Sons, Ltd. Surf. Interface Anal. 2012, 44, 133–143

14
1
ATR-FTIR Kretschmann Studies of a hidden aluminum surface coated with silane film (I)
4000 3000 2000 1000–0.003
0.000
0.003
0.006
0.009
"epoxy"A
bsor
banc
e, –
log(
R/R
0)
Al–OH
After curing
Prior to curing
Wavenumber, cm–1 1800 1500 1200 900 600
0.000
0.003
0.006
0.009
(830)
(1510)
(1720)
(1700)
epoxy
epoxy
epoxy
epoxy
Al–OH
Al–O
Figure 13. ATR-FTIR Kretschmann spectra of ZnSe coated with aluminium and an epoxy film, prior to curing of the epoxy (red) and after thermal curingof the epoxy (black).
4000 3000 2000 1000
0.000
0.004
0.008
0.012
Abs
orba
nce,
–lo
g(R
/R0)
"epoxy"Al–OH
After curing
Prior to curing
Wavenumber, cm–1 1800 1500 1200 900 600
0.000
0.004
0.008
0.012 Si–O–Si
COO–
epoxy
COO–
epoxy
epoxy
Al–O
Al–OH
Figure 14. ATR-FTIR Kretschmann spectra of ZnSe coated with aluminium (25 nm) and after deposition of a silane pretreatment and an epoxy film, bothprior to curing of the epoxy (red) and after curing (black).
any alterations during the curing process are difficult to deduce.However, a further densification of the siloxane network wouldalso result in an increase in the epoxy content within the depth ofanalysis.[48] This makes it reasonable to assume that no significantdensification takes place within the silane film upon thermalcuring at 180 ◦C. In agreement with Fig. 13, the band observedat ∼2220 cm−1 is assigned to cumulative C N double bonds,possibly reaction products of the urea crosslinker. However, theaccumulation of these species at the metal surface requirespenetration through the silane film. The bands at ∼1570 cm−1
and ∼1410 cm−1 are assigned to the COO− groups of the acetatemolecules that are associated with the amino groups of the silane.While acetate may be released as acetic acid during prolongedcuring,[23,49] the absorption intensity shows no significant decreaseas a result of the high-temperature curing step. This indicates thatevaporation of acetic acid may be limited in the presence theepoxy top-coat.
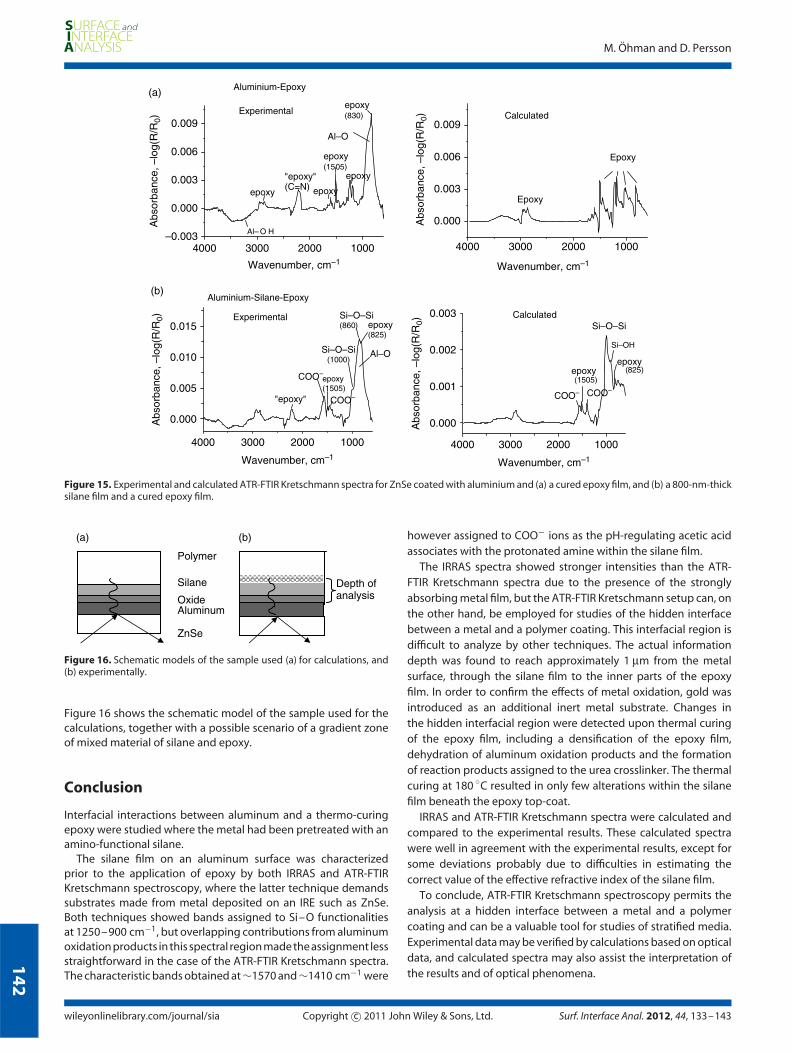
To support the results obtained, ATR-FTIR Kretschmann spectrawere calculated both for aluminum coated with epoxy and foraluminum coated with both silane and epoxy, based on a substratewith 22 nm of pure aluminum and 3 nm of aluminum oxide ontop. Figure 15 shows these calculated spectra together with theexperimental results for the thermo-cured samples.
These calculated spectra do not take into account any spectralalterations due to oxidation or dehydration during the thermalcuring, with resulting spectral contributions assigned to aluminumoxidation products in the experimental spectra above 3000 cm−1
and below 1000 cm−1. The calculations do also not account forspectral alterations due to postcondensation of the silane, or from
any chemical reaction or physical mixture within the silane andepoxy films. The anomalies observed in the calculated spectrumin the absence of silane (Fig. 15(a)), with sharp spikes of derivativeshape at the high-wavenumber side of the larger bands, aredistortions due to the optical properties of the thin metal filmand the epoxy film.[50] Apart from this, the calculated absorptionintensity of epoxy is well in agreement with the experimentalspectrum. This suggests that any SEIRA-ATR phenomenon canbe excluded as well as possible effects attributed to the surfaceroughness. As in previous calculations in the presence of silane,the calculated absorbances are lower than for the correspondingexperimental results. This deviation between experimental andcalculated results in the presence of silane is therefore mostprobably due to errors in the estimation of the optical indexof the silane film itself, possibly due to underestimation of thedensity of the silane film. However, the deviation in absorptionintensity between calculated and experimental results are actuallysmaller in the presence of the epoxy top-coat, and the differenceis only of a factor of about 1.5. This is in agreement with theresults obtained for the silane and epoxy coated directly ontothe pure ZnSe (Fig. 11), where the intensity of the Si–O-relatedbands was stronger in the presence of an epoxy top-coat (Fig. 11)than for the silane film alone (Fig. 3). This effect is not observedfor the experimental spectra in Fig. 15, possibly due to the lowerabsorption level experienced in the presence of a metal film. Therelatively weak bands assigned to the epoxy film support thepresumption that the signal reaches through the silane film andonly shallowly into the epoxy film. This implies an actual depth ofanalysis of ∼1 µm into the sample at intermediate wavenumbers.
Surf. Interface Anal. 2012, 44, 133–143 Copyright c© 2011 John Wiley & Sons, Ltd. wileyonlinelibrary.com/journal/sia
14
2
M. Ohman and D. Persson
4000 3000 2000 1000–0.003
0.000
0.003
0.006
0.009
Al– O H
epoxy
epoxyepoxy
epoxy(1505)
Experimentalepoxy(830)
"epoxy"(C=N)
Aluminium-Epoxy
Abs
orba
nce,
–lo
g(R
/R0)
Al–O
Wavenumber, cm–1
4000 3000 2000 1000
0.000
0.003
0.006
0.009
Epoxy
Epoxy
Calculated
Wavenumber, cm–1
Abs
orba
nce,
–lo
g(R
/R0)
4000 3000 2000 1000
0.000
0.005
0.010
0.015
Abs
orba
nce,
–lo
g(R
/R0) Experimental
Si–O–Si(1000)
Al–O
Aluminium-Silane-Epoxy
COO–
Si–O–Si(860) epoxy
(825)
epoxy(1505)
COO–
"epoxy"
Wavenumber, cm–1
4000 3000 2000 1000
0.000
0.001
0.002
0.003
Si–OH
(1505)(825)
COO–COO–
Si–O–Si
epoxyepoxy
Calculated
Wavenumber, cm–1
Abs
orba
nce,
–lo
g(R
/R0)
(a)
(b)
Figure 15. Experimental and calculated ATR-FTIR Kretschmann spectra for ZnSe coated with aluminium and (a) a cured epoxy film, and (b) a 800-nm-thicksilane film and a cured epoxy film.
(a) (b)
Polymer
Silane Depth ofanalysis
AluminumOxide
ZnSe
Figure 16. Schematic models of the sample used (a) for calculations, and(b) experimentally.
Figure 16 shows the schematic model of the sample used for thecalculations, together with a possible scenario of a gradient zoneof mixed material of silane and epoxy.
Conclusion
Interfacial interactions between aluminum and a thermo-curingepoxy were studied where the metal had been pretreated with anamino-functional silane.
The silane film on an aluminum surface was characterizedprior to the application of epoxy by both IRRAS and ATR-FTIRKretschmann spectroscopy, where the latter technique demandssubstrates made from metal deposited on an IRE such as ZnSe.Both techniques showed bands assigned to Si–O functionalitiesat 1250–900 cm−1, but overlapping contributions from aluminumoxidation products in this spectral region made the assignment lessstraightforward in the case of the ATR-FTIR Kretschmann spectra.The characteristic bands obtained at ∼1570 and ∼1410 cm−1 were
however assigned to COO− ions as the pH-regulating acetic acidassociates with the protonated amine within the silane film.
The IRRAS spectra showed stronger intensities than the ATR-FTIR Kretschmann spectra due to the presence of the stronglyabsorbing metal film, but the ATR-FTIR Kretschmann setup can, onthe other hand, be employed for studies of the hidden interfacebetween a metal and a polymer coating. This interfacial region isdifficult to analyze by other techniques. The actual informationdepth was found to reach approximately 1 µm from the metalsurface, through the silane film to the inner parts of the epoxyfilm. In order to confirm the effects of metal oxidation, gold wasintroduced as an additional inert metal substrate. Changes inthe hidden interfacial region were detected upon thermal curingof the epoxy film, including a densification of the epoxy film,dehydration of aluminum oxidation products and the formationof reaction products assigned to the urea crosslinker. The thermalcuring at 180 ◦C resulted in only few alterations within the silanefilm beneath the epoxy top-coat.
IRRAS and ATR-FTIR Kretschmann spectra were calculated andcompared to the experimental results. These calculated spectrawere well in agreement with the experimental results, except forsome deviations probably due to difficulties in estimating thecorrect value of the effective refractive index of the silane film.
To conclude, ATR-FTIR Kretschmann spectroscopy permits theanalysis at a hidden interface between a metal and a polymercoating and can be a valuable tool for studies of stratified media.Experimental data may be verified by calculations based on opticaldata, and calculated spectra may also assist the interpretation ofthe results and of optical phenomena.
wileyonlinelibrary.com/journal/sia Copyright c© 2011 John Wiley & Sons, Ltd. Surf. Interface Anal. 2012, 44, 133–143
14
3
ATR-FTIR Kretschmann Studies of a hidden aluminum surface coated with silane film (I)
Acknowledgements
The following companies are acknowledged for financing thiswork: BMW AG, Chemetall GmbH, Novelis Switzerland SA, SAPATechnology, Scania CV AB, SSAB Strip Product, Tata Steel ResearchDevelopment and Technology and Volvo Car Corporation. Theauthors also acknowledge Oskar Karlsson and Mats Randelius atSwerea KIMAB AB for performing the EDX and GDOES analysis,respectively.
References
[1] M. Ohman, D. Persson, Manuscript submitted to Surface and InterfaceAnalysis 2010.
[2] S. Sterman, J. G. Marsden, Reinforced plastics symposium 1966, 58,33.
[3] E. P. Plueddemann, J. Adhes. Sci. Technol. 1970, 2, 184.[4] V. Subramanian, W. J. van Ooij, Corrosion 1998, 54, 204.[5] E. Kretschmann, H. Raether, Zeitschrift fur Naturforschung 1968, 23A,
2135.[6] N. J. Harrick, Internal Reflection Spectroscopy. Harrick Scientific
Corporation: NY 1987.[7] M. Ohman, D. Persson, C. Leygraf, Prog. Org. Coat. 2006, 57, 78.[8] M. Ohman, D. Persson, C. Leygraf, Electrochem. Solid-State Lett.
2007, 10, C27.[9] M. Ohman, D. Persson, C. Leygraf, Electrochim. Acta 2007, 52, 5159.
[10] M. Ohman, D. Persson, D. Jacobsson, Prog. Org. Coat. 2010, in press.[11] E. Matheisen, PhD Thesis, 1993, der Universitat Dort-
mund, Dusseldorf.[12] M. Stratmann, R. Feser, A. Leng, Electrochim. Acta 1994, 39, 1207.[13] T. Nguyen, E. Byrd, D. Bentz, L. Changjian, Prog. Org. Coat. 1996, 27,
181.[14] K. Wapner, M. Stratmann, G. Grundmeier, Electrochim. Acta 2006,
51, 3303.[15] K. P. Ishida, P. R. Griffiths, Anal. Chem. 1994, 66, 522.[16] W. M. Hansen, T. Kuwana, R. A. Osteryoung, Anal. Chem. 1966, 38,
1810.[17] H. Azour, J. Derouault, P. Lauroua, G. Vezon, Spectrochim. Acta 2000,
A56, 1627.[18] Z. Pu, W. J. van Ooij, J. E. Mark, J. Adhes. Sci. Technol. 1997, 11, 29.[19] J. Song, W. J. van Ooij, J. Adhes. Sci. Technol. 2003, 17, 2191.[20] G. Socrates, Infrared Characteristic Group Frequencies. John Wiley &
Sons Inc.: 1997.
[21] N. B. Colthup, L. H. Daly, S. E. Wiberley, in Introduction to Infraredand Raman Spectroscopy (3rd edn) Academic Press Ltd: 1990.
[22] P.H. Launer, R. Anderson, G.L Larson, Silicone compounds Registerand Review (Eds: B. Arkles), Petrarch Systems: 1987.
[23] V. W. J. Ooij, D. Zhu, A. Lamar, M. Stacy, A. Seth, V. Palanivel,in SINTEF Seminar on Chromium-free Pretreatments 2002,Holmenkollen, Norway.
[24] C.-H. Chiang, H. Ishida, J. L. Koenig, J. Colloid Interface Sci. 1980, 74,396.
[25] W. Yuan, v. W. Ooij, J. Colloid Interface Sci. 1997, 185, 197.[26] H. Ishida, C. Chiang, J. L. Koenig, Polymer 1982, 23, 251.[27] J. R. Durig, C. Pan, G. A. Guirgis, Spectrochim. Acta 2003, A59, 979.[28] C. Weigel, R. Kellner, Fresenius Z. Anal. Chem. 1989, 335, 663.[29] K. Nakamoto, Infrared and Raman Spectra of Inorganic and
Coordination Combounds, Part B, John Wiley & Sons, Inc.: 1997.[30] R. G. Greenler, R. R. Rahn, J. P. Schwartz, J. Catal. 1971, 23, 42.[31] D. L. Allara, A. Baca, C. A. Pryde, Macromolecules 1978, 11, 1215.[32] P. Grosse, V. Offermann, Vib. Spectrosc. 1995, 8, 121.[33] V. D. Farmer, The Infrared Spectra of Minerals. Series, vol. 4.
Mineralogical Society: London, 1974.[34] P. A. Thiel, T. E. Madey, Surf. Sci. Rep. 1987, 7, 211.[35] M. V. Klein, T. E. Furtak, Optics. John Wiley & Sons: 1986.[36] W. N. Hansen, J, Opt. Soc. Am. 1968, 58, 380.[37] D. Persson, M. Ohman, Swerea-KIMAB, Stockholm, (Manuscript in
preparation), 2010.[38] D. Y. Smith, E. Shiles, M. Inokuti, in The optical properties of metallic
aluminum in: Handbook of optical constants of solids (ed: D. P. Palik),Academic Press, Inc.: 1985.
[39] M. Osawa, M. Kuramitsu, A. Hatta, W. Suetaka, H. Seki, Surf. Sci.,1986, 175, L787.
[40] A. Hartstein, J. R. Kirtley, J. C. Tsang, Phys. Rev. Lett. 1980, 45, 201.[41] W. Suetaka, J. T. J. Yates, Surface Infrared and Raman spectroscopy.
Plenum Press: New York, London, 1995.[42] G. T. Merklin, P. G. Griffiths, Langmuir 1997, 13, 6159.[43] Y. Nishikawa, T. Nagasawa, K. Fujiwara, Vib. Spectrosc. 1993, 6, 43.[44] G. Grundmeier, M. Stratman, Annu. Rev. Mater. Res. 2005, 35, 571.[45] Y. Nakao, H. Yamada, Surf. Sci. 1986, 176, 578.[46] M. Osawa, K. Yoshii, Applied Spectroscopy 1997, 51, 512.[47] H. Westberg, H. Lofstedt, A. Selden, B.-G. Lilja, P. Naystrom, Ann.
Occup. Hyg. 2005, 49, 719.[48] M. S. Kent, H. Yim, Interaction of water with bis(triethoxysilyl)ethane
films studied by neutron reflection, in Silanes and other couplingagents, vol 2, (ed: K. Mittal), 2000.
[49] T. Bayer, K.-J. Eichhorn, K. Grundke, H.-J. Jacobasch, Macromol.Chem. Phys. 1999, 200, 852.
[50] T. Burgi, Phys. Chem. Chem. Phys. 2001, 3, 2124.
Surf. Interface Anal. 2012, 44, 133–143 Copyright c© 2011 John Wiley & Sons, Ltd. wileyonlinelibrary.com/journal/sia


![[ATR] Harmony In Turkana: A Case Of Faith Suffix gg Faith Root](https://static.fdokumen.com/doc/165x107/6325a4ed852a7313b70e9908/atr-harmony-in-turkana-a-case-of-faith-suffix-gg-faith-root.jpg)