Remanent Si–H Interactions in Late Transition Metal Silane Complexes [a
9
ARTICLE DOI: 10.1002/zaac.201200525 Remanent Si–H Interactions in Late Transition Metal Silane Complexes Christoph Hauf, [a] José E. Barquera-Lozada, [a] Petra Meixner, [a] Georg Eickerling, [a] Sandra Altmannshofer, [b] Dietmar Stalke, [b] Thomas Zell, [c] David Schmidt, [c] Udo Radius,* [c] and Wolfgang Scherer* [a] Keywords: Si–H bond activation; σ-Silane complexes; Transition metal compounds; Topology of the charge density Abstract. In general, it is assumed that the reaction between silanes and late transition metal fragments yields silyl hydride species as oxidative addition products. However, the silane complex Ni(iPr 2 Im) 2 (SiHMePh 2 )(iPr 2 Im = 1,3-diisopropylimidazolin-2-ylid- ene) (3a), might represent one of the rare systems where a stable η 2 -(Si–H)Ni intermediate of the oxidative addition process has been isolated. Indeed, 3a is characterized by an acute Si–Ni–H angle of Introduction The three-membered (Si,H,M) molecular moieties of transi- tion metal (M) silane complexes are characterized by a unique spectrum of various bonding types (Scheme 1) ranging from nonclassical σ-silane complexes (Structure A, Scheme 1) to classical silyl hydride species (Structure E, Scheme 1). [1] Only the classical silyl hydride species (E) displays two-electron two-center (2e2c) bonds while the nonclassical systems (A–D) form three- or multi-center bonds where the bridging hydrido ligand interacts simultaneously with the metal and silicon atom. Benchmark systems of these nonclassical silane com- plexes have been successfully isolated in the meantime and can be considered in many cases as key-intermediates of metal- catalyzed Si–H bond activation processes like hydrosilylation, silane dehydrocoupling, or related metal-mediated transforma- tions. [1] A better understanding of the electronic control pa- rameters and chemical nature of the various nonclassical bond- ing scenarios displayed by these η 2 -(Si-H)M moieties may thus * Prof. Dr. U. Radius, Fax: +49-821-598-3327 E-Mail: [email protected] * Prof. Dr. W. Scherer [email protected] [a] Institut für Physik Universität Augsburg Universitätsstrasse 1 86179 Augsburg, Germany [b] Institut für Anorganische Chemie Georg-August-Universität Göttingen Tammannstraße 4 37077 Göttingen, Germany [c] Institut für Anorganische Chemie Julius Maximilians Universität Würzburg Am Hubland 97074 Würzburg, Germany Supporting information for this article is available on the WWW under http://dx.doi.org/10.1002/zaac.201200525 or from the au- thor. © 2013 WILEY-VCH Verlag GmbH & Co. KGaA, Weinheim Z. Anorg. Allg. Chem. 2013, 639, (11), 1996–2004 1996 62.0(2)°, a rather short Si–H bond length of 1.992(6) Å and displays a silicon-hydride cross peak in Si-H-HMQC 2D-NMR studies. We therefore selected the latter system for a combined experimental and theoretical charge density study to explore the electronic prerequisites which hinder the full completion of the oxidative addition step in tran- sition metal silane complexes and cause the presence of remanent Si–H interactions in these species. assist in choice of suitable metal fragments and substrates in catalytic processes. [2] Besides σ-type transition metal com- plexes (A) also numerous other nonclassical interactions have been characterized during the past decade. These include α- agostic silyl complexes (B) [3] , silane complexes characterized as asymmetric (ASOAP, C) [2,4] and symmetric oxidation ad- dition products (SOAP, D) with remanent Si–H interactions, complexes displaying interligand hypervalent interactions (IHI) [5a, 6] or secondary interactions between a silicon and a hydrogen atom (SISHA). [7] Scheme 1. Classical and nonclassical bonding scenarios displayed by silane complexes. Typical Si–M–H angles are listed for scenarios D and E, and delocalization indices of Si–H moieties are given for sce- narios C–E. However, recent experimental and theoretical charge density studies [8] on the nonclassical σ-complex Cp 2 Ti(PMe 3 )(SiH 2 Ph 2 ) (1a) [9] and the IHI model system Cp 2 Ti(PMe 3 )(SiHCl 3 )(1b) [5a] could not identify significant differences in their respective electronic structures (Figure 1). Indeed, detailed molecular orbital analyses and careful inspec- tion of the topology of the charge density distribution of the metal silane moieties in 1a and 1b questioned the significance of interligand hypervalent interactions (IHI) in transition metal silane complexes. [8] Alternatively, a unifying concept was pro- posed to account for the various bonding scenarios illustrated
-
Upload
uni-augsburg -
Category
Documents
-
view
2 -
download
0
Transcript of Remanent Si–H Interactions in Late Transition Metal Silane Complexes [a
ARTICLE
DOI: 10.1002/zaac.201200525
Remanent Si–H Interactions in Late Transition Metal Silane Complexes
Christoph Hauf,[a] José E. Barquera-Lozada,[a] Petra Meixner,[a] Georg Eickerling,[a]
Sandra Altmannshofer,[b] Dietmar Stalke,[b] Thomas Zell,[c] David Schmidt,[c]
Udo Radius,*[c] and Wolfgang Scherer*[a]
Keywords: Si–H bond activation; σ-Silane complexes; Transition metal compounds; Topology of the charge density
Abstract. In general, it is assumed that the reaction betweensilanes and late transition metal fragments yields silyl hydridespecies as oxidative addition products. However, the silane complexNi(iPr2Im)2(SiHMePh2) (iPr2Im = 1,3-diisopropylimidazolin-2-ylid-ene) (3a), might represent one of the rare systems where a stableη2-(Si–H)Ni intermediate of the oxidative addition process has beenisolated. Indeed, 3a is characterized by an acute �Si–Ni–H angle of
Introduction
The three-membered (Si,H,M) molecular moieties of transi-tion metal (M) silane complexes are characterized by a uniquespectrum of various bonding types (Scheme 1) ranging fromnonclassical σ-silane complexes (Structure A, Scheme 1) toclassical silyl hydride species (Structure E, Scheme 1).[1] Onlythe classical silyl hydride species (E) displays two-electrontwo-center (2e2c) bonds while the nonclassical systems (A–D)form three- or multi-center bonds where the bridging hydridoligand interacts simultaneously with the metal and siliconatom. Benchmark systems of these nonclassical silane com-plexes have been successfully isolated in the meantime and canbe considered in many cases as key-intermediates of metal-catalyzed Si–H bond activation processes like hydrosilylation,silane dehydrocoupling, or related metal-mediated transforma-tions.[1] A better understanding of the electronic control pa-rameters and chemical nature of the various nonclassical bond-ing scenarios displayed by these η2-(Si-H)M moieties may thus
* Prof. Dr. U. Radius,Fax: +49-821-598-3327E-Mail: [email protected]
* Prof. Dr. W. [email protected]
[a] Institut für PhysikUniversität AugsburgUniversitätsstrasse 186179 Augsburg, Germany
[b] Institut für Anorganische ChemieGeorg-August-Universität GöttingenTammannstraße 437077 Göttingen, Germany
[c] Institut für Anorganische ChemieJulius Maximilians Universität WürzburgAm Hubland97074 Würzburg, GermanySupporting information for this article is available on the WWWunder http://dx.doi.org/10.1002/zaac.201200525 or from the au-thor.
© 2013 WILEY-VCH Verlag GmbH & Co. KGaA, Weinheim Z. Anorg. Allg. Chem. 2013, 639, (11), 1996–20041996
62.0(2)°, a rather short Si–H bond length of 1.992(6) Å and displaysa silicon-hydride cross peak in Si-H-HMQC 2D-NMR studies. Wetherefore selected the latter system for a combined experimental andtheoretical charge density study to explore the electronic prerequisiteswhich hinder the full completion of the oxidative addition step in tran-sition metal silane complexes and cause the presence of remanentSi–H interactions in these species.
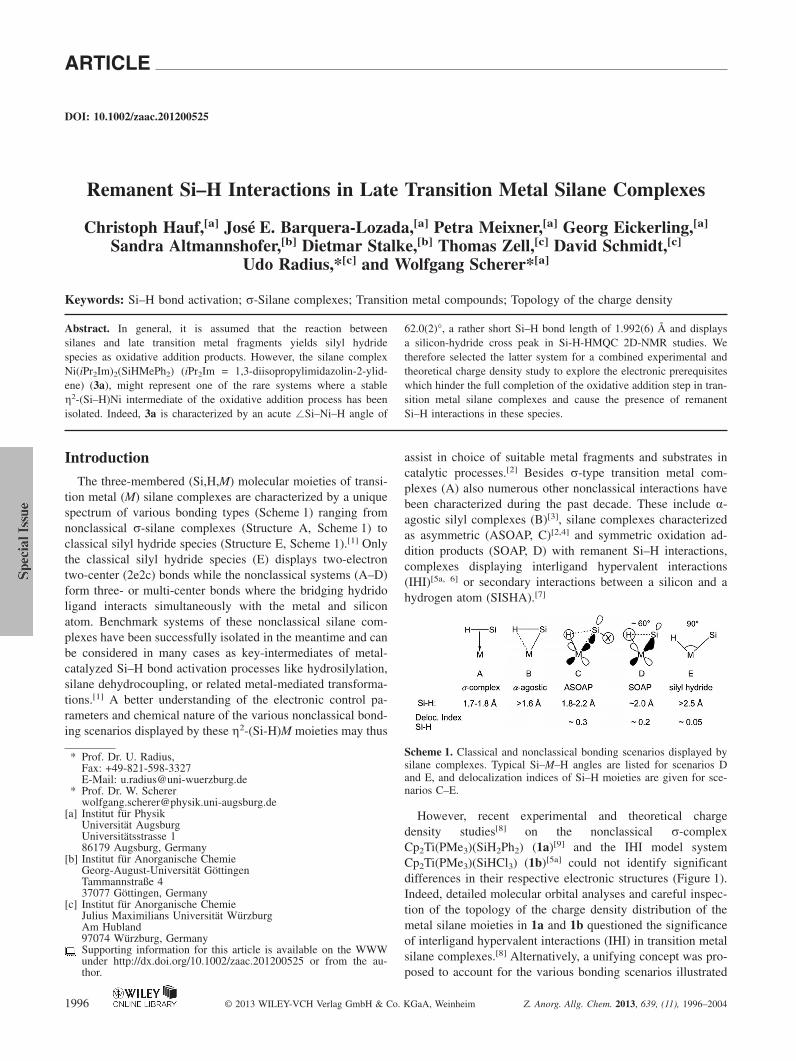
assist in choice of suitable metal fragments and substrates incatalytic processes.[2] Besides σ-type transition metal com-plexes (A) also numerous other nonclassical interactions havebeen characterized during the past decade. These include α-agostic silyl complexes (B)[3], silane complexes characterizedas asymmetric (ASOAP, C)[2,4] and symmetric oxidation ad-dition products (SOAP, D) with remanent Si–H interactions,complexes displaying interligand hypervalent interactions(IHI)[5a, 6] or secondary interactions between a silicon and ahydrogen atom (SISHA).[7]
Scheme 1. Classical and nonclassical bonding scenarios displayed bysilane complexes. Typical Si–M–H angles are listed for scenarios Dand E, and delocalization indices of Si–H moieties are given for sce-narios C–E.
However, recent experimental and theoretical chargedensity studies[8] on the nonclassical σ-complexCp2Ti(PMe3)(SiH2Ph2) (1a)[9] and the IHI model systemCp2Ti(PMe3)(SiHCl3) (1b)[5a] could not identify significantdifferences in their respective electronic structures (Figure 1).Indeed, detailed molecular orbital analyses and careful inspec-tion of the topology of the charge density distribution of themetal silane moieties in 1a and 1b questioned the significanceof interligand hypervalent interactions (IHI) in transition metalsilane complexes.[8] Alternatively, a unifying concept was pro-posed to account for the various bonding scenarios illustrated
Remanent Si–H Interactions in Late Transition Metal Silane Complexes
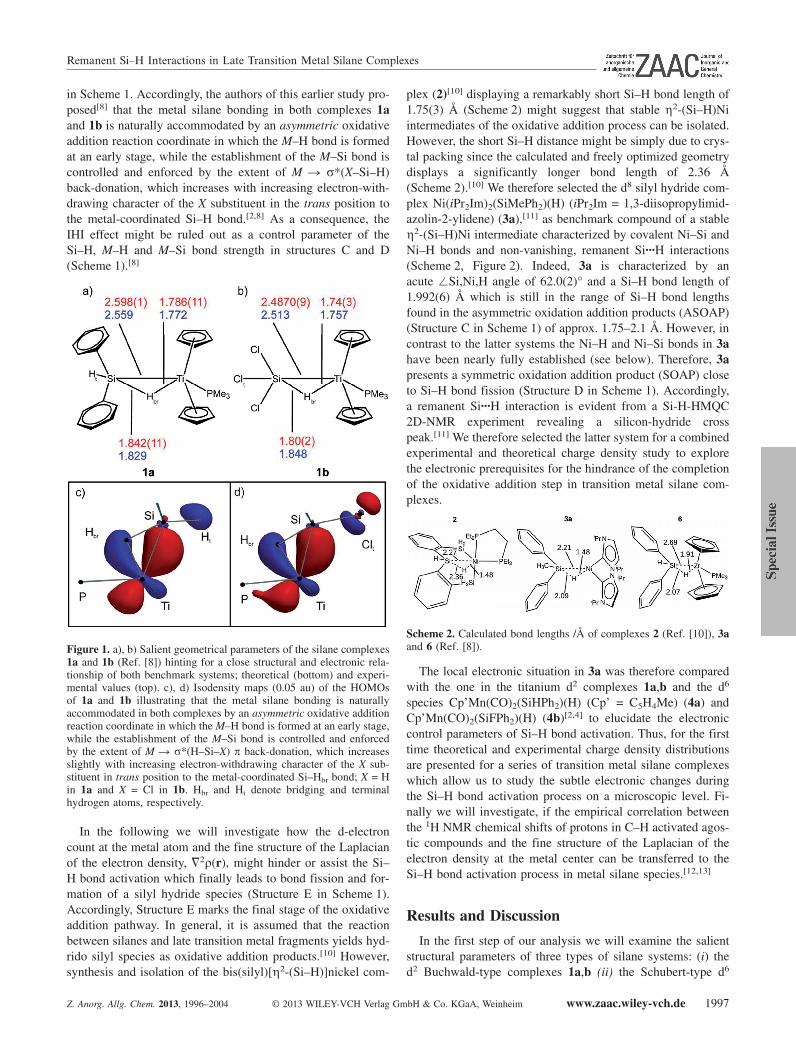
in Scheme 1. Accordingly, the authors of this earlier study pro-posed[8] that the metal silane bonding in both complexes 1aand 1b is naturally accommodated by an asymmetric oxidativeaddition reaction coordinate in which the M–H bond is formedat an early stage, while the establishment of the M–Si bond iscontrolled and enforced by the extent of M � σ*(X–Si–H)back-donation, which increases with increasing electron-with-drawing character of the X substituent in the trans position tothe metal-coordinated Si–H bond.[2,8] As a consequence, theIHI effect might be ruled out as a control parameter of theSi–H, M–H and M–Si bond strength in structures C and D(Scheme 1).[8]
Figure 1. a), b) Salient geometrical parameters of the silane complexes1a and 1b (Ref. [8]) hinting for a close structural and electronic rela-tionship of both benchmark systems; theoretical (bottom) and experi-mental values (top). c), d) Isodensity maps (0.05 au) of the HOMOsof 1a and 1b illustrating that the metal silane bonding is naturallyaccommodated in both complexes by an asymmetric oxidative additionreaction coordinate in which the M–H bond is formed at an early stage,while the establishment of the M–Si bond is controlled and enforcedby the extent of M � σ*(H–Si–X) π back-donation, which increasesslightly with increasing electron-withdrawing character of the X sub-stituent in trans position to the metal-coordinated Si–Hbr bond; X = Hin 1a and X = Cl in 1b. Hbr and Ht denote bridging and terminalhydrogen atoms, respectively.
In the following we will investigate how the d-electroncount at the metal atom and the fine structure of the Laplacianof the electron density, �2ρ(r), might hinder or assist the Si–H bond activation which finally leads to bond fission and for-mation of a silyl hydride species (Structure E in Scheme 1).Accordingly, Structure E marks the final stage of the oxidativeaddition pathway. In general, it is assumed that the reactionbetween silanes and late transition metal fragments yields hyd-rido silyl species as oxidative addition products.[10] However,synthesis and isolation of the bis(silyl)[η2-(Si–H)]nickel com-
Z. Anorg. Allg. Chem. 2013, 1996–2004 © 2013 WILEY-VCH Verlag GmbH & Co. KGaA, Weinheim www.zaac.wiley-vch.de 1997
plex (2)[10] displaying a remarkably short Si–H bond length of1.75(3) Å (Scheme 2) might suggest that stable η2-(Si–H)Niintermediates of the oxidative addition process can be isolated.However, the short Si–H distance might be simply due to crys-tal packing since the calculated and freely optimized geometrydisplays a significantly longer bond length of 2.36 Å(Scheme 2).[10] We therefore selected the d8 silyl hydride com-plex Ni(iPr2Im)2(SiMePh2)(H) (iPr2Im = 1,3-diisopropylimid-azolin-2-ylidene) (3a),[11] as benchmark compound of a stableη2-(Si–H)Ni intermediate characterized by covalent Ni–Si andNi–H bonds and non-vanishing, remanent Si···H interactions(Scheme 2, Figure 2). Indeed, 3a is characterized by anacute �Si,Ni,H angle of 62.0(2)° and a Si–H bond length of1.992(6) Å which is still in the range of Si–H bond lengthsfound in the asymmetric oxidation addition products (ASOAP)(Structure C in Scheme 1) of approx. 1.75–2.1 Å. However, incontrast to the latter systems the Ni–H and Ni–Si bonds in 3ahave been nearly fully established (see below). Therefore, 3apresents a symmetric oxidation addition product (SOAP) closeto Si–H bond fission (Structure D in Scheme 1). Accordingly,a remanent Si···H interaction is evident from a Si-H-HMQC2D-NMR experiment revealing a silicon-hydride crosspeak.[11] We therefore selected the latter system for a combinedexperimental and theoretical charge density study to explorethe electronic prerequisites for the hindrance of the completionof the oxidative addition step in transition metal silane com-plexes.
Scheme 2. Calculated bond lengths /Å of complexes 2 (Ref. [10]), 3aand 6 (Ref. [8]).
The local electronic situation in 3a was therefore comparedwith the one in the titanium d2 complexes 1a,b and the d6
species Cp’Mn(CO)2(SiHPh2)(H) (Cp’ = C5H4Me) (4a) andCp’Mn(CO)2(SiFPh2)(H) (4b)[2,4] to elucidate the electroniccontrol parameters of Si–H bond activation. Thus, for the firsttime theoretical and experimental charge density distributionsare presented for a series of transition metal silane complexeswhich allow us to study the subtle electronic changes duringthe Si–H bond activation process on a microscopic level. Fi-nally we will investigate, if the empirical correlation betweenthe 1H NMR chemical shifts of protons in C–H activated agos-tic compounds and the fine structure of the Laplacian of theelectron density at the metal center can be transferred to theSi–H bond activation process in metal silane species.[12,13]
Results and Discussion
In the first step of our analysis we will examine the salientstructural parameters of three types of silane systems: (i) thed2 Buchwald-type complexes 1a,b (ii) the Schubert-type d6
U. Radius, W. Scherer et al.ARTICLE
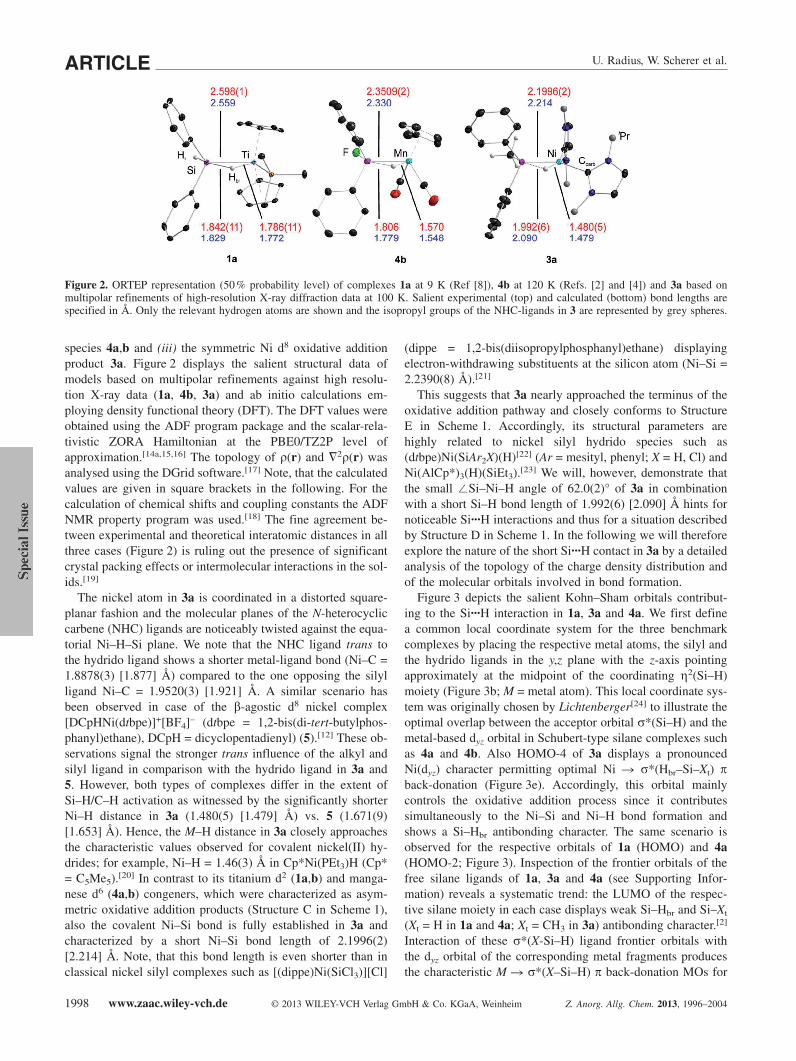
Figure 2. ORTEP representation (50% probability level) of complexes 1a at 9 K (Ref [8]), 4b at 120 K (Refs. [2] and [4]) and 3a based onmultipolar refinements of high-resolution X-ray diffraction data at 100 K. Salient experimental (top) and calculated (bottom) bond lengths arespecified in Å. Only the relevant hydrogen atoms are shown and the isopropyl groups of the NHC-ligands in 3 are represented by grey spheres.
species 4a,b and (iii) the symmetric Ni d8 oxidative additionproduct 3a. Figure 2 displays the salient structural data ofmodels based on multipolar refinements against high resolu-tion X-ray data (1a, 4b, 3a) and ab initio calculations em-ploying density functional theory (DFT). The DFT values wereobtained using the ADF program package and the scalar-rela-tivistic ZORA Hamiltonian at the PBE0/TZ2P level ofapproximation.[14a,15,16] The topology of ρ(r) and �2ρ(r) wasanalysed using the DGrid software.[17] Note, that the calculatedvalues are given in square brackets in the following. For thecalculation of chemical shifts and coupling constants the ADFNMR property program was used.[18] The fine agreement be-tween experimental and theoretical interatomic distances in allthree cases (Figure 2) is ruling out the presence of significantcrystal packing effects or intermolecular interactions in the sol-ids.[19]
The nickel atom in 3a is coordinated in a distorted square-planar fashion and the molecular planes of the N-heterocycliccarbene (NHC) ligands are noticeably twisted against the equa-torial Ni–H–Si plane. We note that the NHC ligand trans tothe hydrido ligand shows a shorter metal-ligand bond (Ni–C =1.8878(3) [1.877] Å) compared to the one opposing the silylligand Ni–C = 1.9520(3) [1.921] Å. A similar scenario hasbeen observed in case of the β-agostic d8 nickel complex[DCpHNi(dtbpe)]+[BF4]– (dtbpe = 1,2-bis(di-tert-butylphos-phanyl)ethane), DCpH = dicyclopentadienyl) (5).[12] These ob-servations signal the stronger trans influence of the alkyl andsilyl ligand in comparison with the hydrido ligand in 3a and5. However, both types of complexes differ in the extent ofSi–H/C–H activation as witnessed by the significantly shorterNi–H distance in 3a (1.480(5) [1.479] Å) vs. 5 (1.671(9)[1.653] Å). Hence, the M–H distance in 3a closely approachesthe characteristic values observed for covalent nickel(II) hy-drides; for example, Ni–H = 1.46(3) Å in Cp*Ni(PEt3)H (Cp*= C5Me5).[20] In contrast to its titanium d2 (1a,b) and manga-nese d6 (4a,b) congeners, which were characterized as asym-metric oxidative addition products (Structure C in Scheme 1),also the covalent Ni–Si bond is fully established in 3a andcharacterized by a short Ni–Si bond length of 2.1996(2)[2.214] Å. Note, that this bond length is even shorter than inclassical nickel silyl complexes such as [(dippe)Ni(SiCl3)][Cl]
www.zaac.wiley-vch.de © 2013 WILEY-VCH Verlag GmbH & Co. KGaA, Weinheim Z. Anorg. Allg. Chem. 2013, 1996–20041998
(dippe = 1,2-bis(diisopropylphosphanyl)ethane) displayingelectron-withdrawing substituents at the silicon atom (Ni–Si =2.2390(8) Å).[21]
This suggests that 3a nearly approached the terminus of theoxidative addition pathway and closely conforms to StructureE in Scheme 1. Accordingly, its structural parameters arehighly related to nickel silyl hydrido species such as(dtbpe)Ni(SiAr2X)(H)[22] (Ar = mesityl, phenyl; X = H, Cl) andNi(AlCp*)3(H)(SiEt3).[23] We will, however, demonstrate thatthe small �Si–Ni–H angle of 62.0(2)° of 3a in combinationwith a short Si–H bond length of 1.992(6) [2.090] Å hints fornoticeable Si···H interactions and thus for a situation describedby Structure D in Scheme 1. In the following we will thereforeexplore the nature of the short Si···H contact in 3a by a detailedanalysis of the topology of the charge density distribution andof the molecular orbitals involved in bond formation.
Figure 3 depicts the salient Kohn–Sham orbitals contribut-ing to the Si···H interaction in 1a, 3a and 4a. We first definea common local coordinate system for the three benchmarkcomplexes by placing the respective metal atoms, the silyl andthe hydrido ligands in the y,z plane with the z-axis pointingapproximately at the midpoint of the coordinating η2(Si–H)moiety (Figure 3b; M = metal atom). This local coordinate sys-tem was originally chosen by Lichtenberger[24] to illustrate theoptimal overlap between the acceptor orbital σ*(Si–H) and themetal-based dyz orbital in Schubert-type silane complexes suchas 4a and 4b. Also HOMO-4 of 3a displays a pronouncedNi(dyz) character permitting optimal Ni � σ*(Hbr–Si–Xt) πback-donation (Figure 3e). Accordingly, this orbital mainlycontrols the oxidative addition process since it contributessimultaneously to the Ni–Si and Ni–H bond formation andshows a Si–Hbr antibonding character. The same scenario isobserved for the respective orbitals of 1a (HOMO) and 4a(HOMO-2; Figure 3). Inspection of the frontier orbitals of thefree silane ligands of 1a, 3a and 4a (see Supporting Infor-mation) reveals a systematic trend: the LUMO of the respec-tive silane moiety in each case displays weak Si–Hbr and Si–Xt
(Xt = H in 1a and 4a; Xt = CH3 in 3a) antibonding character.[2]
Interaction of these σ*(X-Si–H) ligand frontier orbitals withthe dyz orbital of the corresponding metal fragments producesthe characteristic M � σ*(X–Si–H) π back-donation MOs for
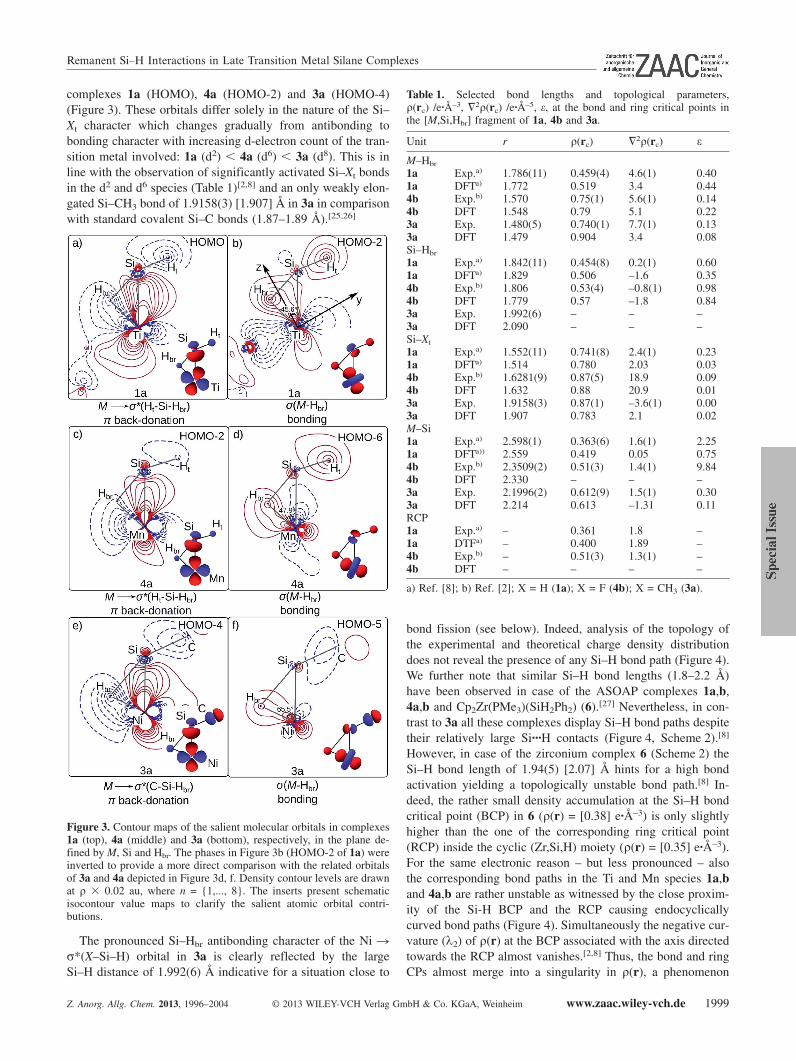
Remanent Si–H Interactions in Late Transition Metal Silane Complexes
complexes 1a (HOMO), 4a (HOMO-2) and 3a (HOMO-4)(Figure 3). These orbitals differ solely in the nature of the Si–Xt character which changes gradually from antibonding tobonding character with increasing d-electron count of the tran-sition metal involved: 1a (d2) � 4a (d6) � 3a (d8). This is inline with the observation of significantly activated Si–Xt bondsin the d2 and d6 species (Table 1)[2,8] and an only weakly elon-gated Si–CH3 bond of 1.9158(3) [1.907] Å in 3a in comparisonwith standard covalent Si–C bonds (1.87–1.89 Å).[25,26]
Figure 3. Contour maps of the salient molecular orbitals in complexes1a (top), 4a (middle) and 3a (bottom), respectively, in the plane de-fined by M, Si and Hbr. The phases in Figure 3b (HOMO-2 of 1a) wereinverted to provide a more direct comparison with the related orbitalsof 3a and 4a depicted in Figure 3d, f. Density contour levels are drawnat ρ � 0.02 au, where n = {1,..., 8}. The inserts present schematicisocontour value maps to clarify the salient atomic orbital contri-butions.
The pronounced Si–Hbr antibonding character of the Ni �σ*(X–Si–H) orbital in 3a is clearly reflected by the largeSi–H distance of 1.992(6) Å indicative for a situation close to
Z. Anorg. Allg. Chem. 2013, 1996–2004 © 2013 WILEY-VCH Verlag GmbH & Co. KGaA, Weinheim www.zaac.wiley-vch.de 1999
Table 1. Selected bond lengths and topological parameters,ρ(rc) /e·Å–3, �2ρ(rc) /e·Å–5, ε, at the bond and ring critical points inthe [M,Si,Hbr] fragment of 1a, 4b and 3a.
Unit r ρ(rc) �2ρ(rc) ε
M–Hbr
1a Exp.a) 1.786(11) 0.459(4) 4.6(1) 0.401a DFTa) 1.772 0.519 3.4 0.444b Exp.b) 1.570 0.75(1) 5.6(1) 0.144b DFT 1.548 0.79 5.1 0.223a Exp. 1.480(5) 0.740(1) 7.7(1) 0.133a DFT 1.479 0.904 3.4 0.08Si–Hbr
1a Exp.a) 1.842(11) 0.454(8) 0.2(1) 0.601a DFTa) 1.829 0.506 –1.6 0.354b Exp.b) 1.806 0.53(4) –0.8(1) 0.984b DFT 1.779 0.57 –1.8 0.843a Exp. 1.992(6) – – –3a DFT 2.090 – – –Si–Xt
1a Exp.a) 1.552(11) 0.741(8) 2.4(1) 0.231a DFTa) 1.514 0.780 2.03 0.034b Exp.b) 1.6281(9) 0.87(5) 18.9 0.094b DFT 1.632 0.88 20.9 0.013a Exp. 1.9158(3) 0.87(1) –3.6(1) 0.003a DFT 1.907 0.783 2.1 0.02M–Si1a Exp.a) 2.598(1) 0.363(6) 1.6(1) 2.251a DFTa)) 2.559 0.419 0.05 0.754b Exp.b) 2.3509(2) 0.51(3) 1.4(1) 9.844b DFT 2.330 – – –3a Exp. 2.1996(2) 0.612(9) 1.5(1) 0.303a DFT 2.214 0.613 –1.31 0.11RCP1a Exp.a) – 0.361 1.8 –1a DTFa) – 0.400 1.89 –4b Exp.b) – 0.51(3) 1.3(1) –4b DFT – – – –
a) Ref. [8]; b) Ref. [2]; X = H (1a); X = F (4b); X = CH3 (3a).
bond fission (see below). Indeed, analysis of the topology ofthe experimental and theoretical charge density distributiondoes not reveal the presence of any Si–H bond path (Figure 4).We further note that similar Si–H bond lengths (1.8–2.2 Å)have been observed in case of the ASOAP complexes 1a,b,4a,b and Cp2Zr(PMe3)(SiH2Ph2) (6).[27] Nevertheless, in con-trast to 3a all these complexes display Si–H bond paths despitetheir relatively large Si···H contacts (Figure 4, Scheme 2).[8]
However, in case of the zirconium complex 6 (Scheme 2) theSi–H bond length of 1.94(5) [2.07] Å hints for a high bondactivation yielding a topologically unstable bond path.[8] In-deed, the rather small density accumulation at the Si–H bondcritical point (BCP) in 6 (ρ(r) = [0.38] e·Å–3) is only slightlyhigher than the one of the corresponding ring critical point(RCP) inside the cyclic (Zr,Si,H) moiety (ρ(r) = [0.35] e·Å–3).For the same electronic reason – but less pronounced – alsothe corresponding bond paths in the Ti and Mn species 1a,band 4a,b are rather unstable as witnessed by the close proxim-ity of the Si-H BCP and the RCP causing endocyclicallycurved bond paths (Figure 4). Simultaneously the negative cur-vature (λ2) of ρ(r) at the BCP associated with the axis directedtowards the RCP almost vanishes.[2,8] Thus, the bond and ringCPs almost merge into a singularity in ρ(r), a phenomenon

U. Radius, W. Scherer et al.ARTICLE
Figure 4. Experimental (top) and theoretical (bottom) L(r) = –�2ρ(r) maps of 1a (left), 4b (middle) and 3a (right) in the plane defined by M,Si and Hbr; positive (solid) and negative (dashed) contour lines were drawn at 0, �2.0 � 10n, �4.0 � 10n, �8.0 � 10n e·Å–5 with n = �3,�2, �1, 0. Extra lines were drawn at 100 (1a), 500 (4b), 1100 and 1400 e·Å–5 and the contour line at + 800 was removed in 3a. Bond pathsare displayed as black solid lines. Bond critical points and ring critical points are drawn as black filled circles and open squares, respectively;ρ(rc) /e·Å–3, and �2ρ(rc) /e·Å5 values at salient BCPs are reported in the specified sequence; averaged values of the charge concentrations (CC)and depletions (CD) in the VSCC of the M atoms in the molecular planes of 1a and 4b are specified in e·Å–5 (selected CCs and CDs are markedby green and red arrows respectively). The corresponding critical points of 4b are not located in the drawing plane and listed separately in theSupporting Information. The local coordinate system of the bridging hydrogen atom in 3a used during the multipolar refinements is specifiedin Figure 4f.
characteristic of bond fission. We therefore suggest that thelacking bond path in 3a is simply the result of a bond catastro-phe scenario due to the merging of the Si–H BCP and therespective RCP inside the cyclic (Ni,Si,H) moiety. Indeed, ourexperimental charge density study observes a density mini-mum along the interatomic Si–H vector of ρ(r) = 0.39[0.38] e·Å–3 in 3a which is as high as the density at the Si–HBCP in the Zr complex 6 [ρ(r) = 0.38 e·Å–3].[8] Hence, 3aand 6 are just borderline cases of a Si–H bond catastrophescenario.[28] Accordingly, 3a is characterized by a rather smallJ(Si,H) coupling constant of 11 Hz (absolute value).[11] Some-what larger coupling constants (absolute values) were observedin case of 1a (28 Hz),[9] 1b (34 Hz),[5a] 4a (64 Hz)[29] andCp’Mn(CO)2(SiCl3)(H) (4c; 54.8[29]/57.7[24] Hz). However, asdemonstrated by Nikonov and co-worker, the magnitude of theJ(Si,H) coupling constant is no reliable measure of the Si–Hbond strength or of the stability of the Si–H bond path.[5b,c] Incontrast, the calculated delocalization indices[30,31] δ(Si,H) in1a/1b (δ = 0.33/0.34) � 4a/4b (δ = 0.28/0.28)[2] � 6 (δ =0.27) � 3a (δ = 0.18) suggest a decreasing Si–H bond strengthalong this series of selected benchmark systems (see theSupporting Information). In our benchmark model fora hydrido silyl species[32] (Structure E in Scheme 1),(dhpe)Pt(SiHMe(SiH3))(H) (7) (dhpe = 1,2-bis(dihydridophos-
www.zaac.wiley-vch.de © 2013 WILEY-VCH Verlag GmbH & Co. KGaA, Weinheim Z. Anorg. Allg. Chem. 2013, 1996–20042000
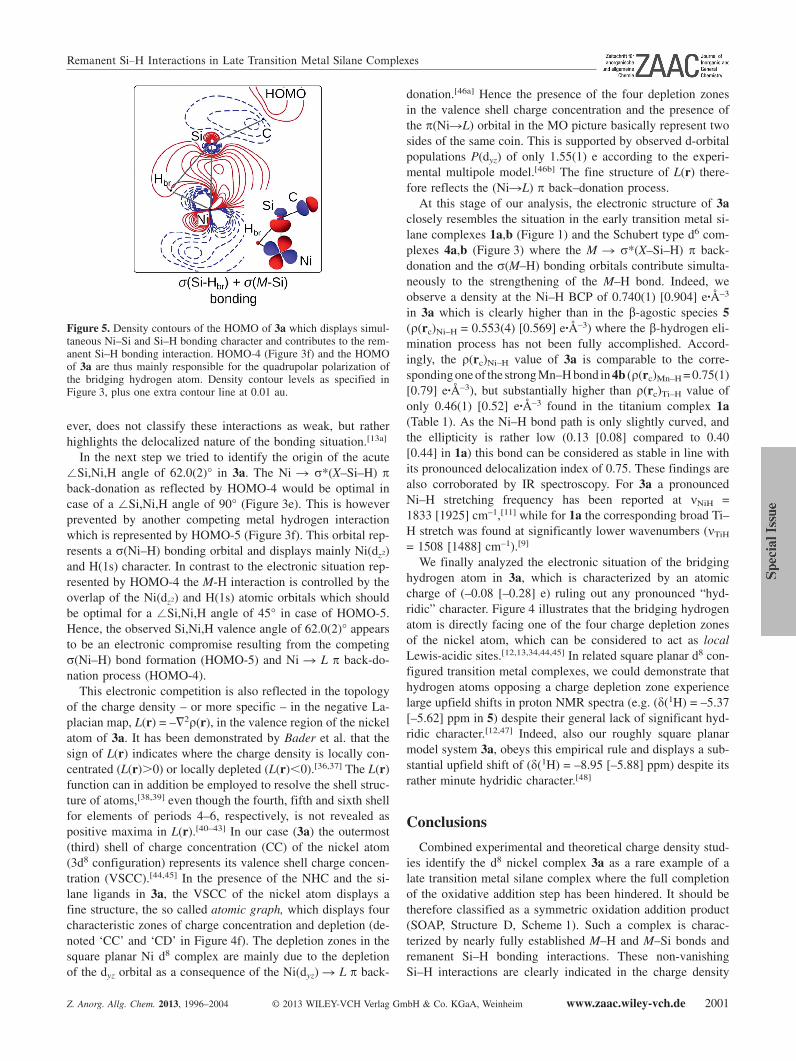
phanyl)ethane)), only a marginal delocalization index of 0.04is computed instead. Accordingly, the magnitude of the delo-calization indices might be helpful to classify the electronicstructures of transition metal silane complexes as suggested inScheme 1. Furthermore, the remanent Si–H bonding interac-tion in 3a is directly revealed by the characteristic polarisationof the electron density distribution of the bridging hydrogenatom. Indeed, the calculated L(r) map of 3a (Figure 4f) revealsthe polarization of the hydrogen atom’s valence density ap-proximately along the Ni–Hbr and Si–Hbr bond vectors. Thisquadrupolar polarization is characteristic for bridging hydro-gen atoms in transition metal hydrides[33] and agostic alk-yls.[34b] The origin of the quadrupolar polarization is connectedwith the nature of the HOMO of 3a (Figure 5) which displayssimultaneous Ni-Si and Si–H bonding character. Accordingly,this orbital interaction competes with the M � σ*(X–Si–H) πback-donation process and hinders the completion of the oxi-dative addition step and is therefore responsible for the reman-ent Si–H bonding interaction.
We finally note that similar topologically unstable situationsas displayed by Structures C and D (Scheme 1) have been alsofound in β-agostic transition metal complexes, where either nostable bond path was detected, or the respective BCPs andRCPs were on the verge of annihilation.[12,13a,34,35] This, how-
Remanent Si–H Interactions in Late Transition Metal Silane Complexes
Figure 5. Density contours of the HOMO of 3a which displays simul-taneous Ni–Si and Si–H bonding character and contributes to the rem-anent Si–H bonding interaction. HOMO-4 (Figure 3f) and the HOMOof 3a are thus mainly responsible for the quadrupolar polarization ofthe bridging hydrogen atom. Density contour levels as specified inFigure 3, plus one extra contour line at 0.01 au.
ever, does not classify these interactions as weak, but ratherhighlights the delocalized nature of the bonding situation.[13a]
In the next step we tried to identify the origin of the acute�Si,Ni,H angle of 62.0(2)° in 3a. The Ni � σ*(X–Si–H) πback-donation as reflected by HOMO-4 would be optimal incase of a �Si,Ni,H angle of 90° (Figure 3e). This is howeverprevented by another competing metal hydrogen interactionwhich is represented by HOMO-5 (Figure 3f). This orbital rep-resents a σ(Ni–H) bonding orbital and displays mainly Ni(dz2)and H(1s) character. In contrast to the electronic situation rep-resented by HOMO-4 the M-H interaction is controlled by theoverlap of the Ni(dz2) and H(1s) atomic orbitals which shouldbe optimal for a �Si,Ni,H angle of 45° in case of HOMO-5.Hence, the observed Si,Ni,H valence angle of 62.0(2)° appearsto be an electronic compromise resulting from the competingσ(Ni–H) bond formation (HOMO-5) and Ni � L π back-do-nation process (HOMO-4).
This electronic competition is also reflected in the topologyof the charge density – or more specific – in the negative La-placian map, L(r) = –�2ρ(r), in the valence region of the nickelatom of 3a. It has been demonstrated by Bader et al. that thesign of L(r) indicates where the charge density is locally con-centrated (L(r)�0) or locally depleted (L(r)�0).[36,37] The L(r)function can in addition be employed to resolve the shell struc-ture of atoms,[38,39] even though the fourth, fifth and sixth shellfor elements of periods 4–6, respectively, is not revealed aspositive maxima in L(r).[40–43] In our case (3a) the outermost(third) shell of charge concentration (CC) of the nickel atom(3d8 configuration) represents its valence shell charge concen-tration (VSCC).[44,45] In the presence of the NHC and the si-lane ligands in 3a, the VSCC of the nickel atom displays afine structure, the so called atomic graph, which displays fourcharacteristic zones of charge concentration and depletion (de-noted ‘CC’ and ‘CD’ in Figure 4f). The depletion zones in thesquare planar Ni d8 complex are mainly due to the depletionof the dyz orbital as a consequence of the Ni(dyz) � L π back-
Z. Anorg. Allg. Chem. 2013, 1996–2004 © 2013 WILEY-VCH Verlag GmbH & Co. KGaA, Weinheim www.zaac.wiley-vch.de 2001
donation.[46a] Hence the presence of the four depletion zonesin the valence shell charge concentration and the presence ofthe π(Ni�L) orbital in the MO picture basically represent twosides of the same coin. This is supported by observed d-orbitalpopulations P(dyz) of only 1.55(1) e according to the experi-mental multipole model.[46b] The fine structure of L(r) there-fore reflects the (Ni�L) π back–donation process.
At this stage of our analysis, the electronic structure of 3aclosely resembles the situation in the early transition metal si-lane complexes 1a,b (Figure 1) and the Schubert type d6 com-plexes 4a,b (Figure 3) where the M � σ*(X–Si–H) π back-donation and the σ(M–H) bonding orbitals contribute simulta-neously to the strengthening of the M–H bond. Indeed, weobserve a density at the Ni–H BCP of 0.740(1) [0.904] e·Å–3
in 3a which is clearly higher than in the β-agostic species 5(ρ(rc)Ni–H = 0.553(4) [0.569] e·Å–3) where the β-hydrogen eli-mination process has not been fully accomplished. Accord-ingly, the ρ(rc)Ni–H value of 3a is comparable to the corre-sponding one of the strong Mn–H bond in 4b (ρ(rc)Mn–H = 0.75(1)[0.79] e·Å–3), but substantially higher than ρ(rc)Ti–H value ofonly 0.46(1) [0.52] e·Å–3 found in the titanium complex 1a(Table 1). As the Ni–H bond path is only slightly curved, andthe ellipticity is rather low (0.13 [0.08] compared to 0.40[0.44] in 1a) this bond can be considered as stable in line withits pronounced delocalization index of 0.75. These findings arealso corroborated by IR spectroscopy. For 3a a pronouncedNi–H stretching frequency has been reported at νNiH =1833 [1925] cm–1,[11] while for 1a the corresponding broad Ti–H stretch was found at significantly lower wavenumbers (νTiH
= 1508 [1488] cm–1).[9]
We finally analyzed the electronic situation of the bridginghydrogen atom in 3a, which is characterized by an atomiccharge of (–0.08 [–0.28] e) ruling out any pronounced “hyd-ridic” character. Figure 4 illustrates that the bridging hydrogenatom is directly facing one of the four charge depletion zonesof the nickel atom, which can be considered to act as localLewis-acidic sites.[12,13,34,44,45] In related square planar d8 con-figured transition metal complexes, we could demonstrate thathydrogen atoms opposing a charge depletion zone experiencelarge upfield shifts in proton NMR spectra (e.g. (δ(1H) = –5.37[–5.62] ppm in 5) despite their general lack of significant hyd-ridic character.[12,47] Indeed, also our roughly square planarmodel system 3a, obeys this empirical rule and displays a sub-stantial upfield shift of (δ(1H) = –8.95 [–5.88] ppm) despite itsrather minute hydridic character.[48]
Conclusions
Combined experimental and theoretical charge density stud-ies identify the d8 nickel complex 3a as a rare example of alate transition metal silane complex where the full completionof the oxidative addition step has been hindered. It should betherefore classified as a symmetric oxidation addition product(SOAP, Structure D, Scheme 1). Such a complex is charac-terized by nearly fully established M–H and M–Si bonds andremanent Si–H bonding interactions. These non-vanishingSi–H interactions are clearly indicated in the charge density
U. Radius, W. Scherer et al.ARTICLEpicture by a quadrupolar charge polarization of the bridginghydrogen atoms and a delocalization index δ(Si,H) � 0.15.The origin of the quadrupolar polarization in 3a is connectedwith the nature of the HOMO of 3a (Figure 5) which displayssimultaneous Ni-Si and Si–H bonding character. Accordingly,this orbital interaction competes with the M � σ*(X–Si–H) πback-donation process and hinders the completion of the oxi-dative addition step and is therefore mainly responsible for theremanent Si–H bonding interaction. Furthermore, the observedacute Si,Ni,H valence angle of 62.0(2)° appears to be an elec-tronic compromise resulting from the competing σ(Ni–H)bond formation (HOMO-5) and the Ni � σ*(X–Si–H) π back-donation process (HOMO-4). The competition of all threebonding interactions is reflected in a rather flat electron densitydistribution inside the Ni,Si,H moiety in 3a causing a Si–Hbond catastrophe scenario. The lack of the Si–H bond path isthus a natural consequence of these competing interactions andhighlights the delocalized nature of the bonding situation in3a.
The differences between the other d2 and d6 silane bench-mark complexes of our study and the d8 complex 3a mainlyarise from (i) the different extent of the M � σ*(X–Si–H) πback-donation and (ii) the strength of the M–Si bond whichstepwise increases with growing d-electron count in our d2 �d6 � d8 benchmark systems. Hence, all these model systemscan be described by the same unifying bonding concept.[8]
Experimental SectionComplex 3a was synthesized according to literature methods.[11]
Crystal data for 3a: orange, block-shaped crystal, monoclinic, spacegroup P21/n, a = 9.8715(5), b = 28.3159(15), c = 11.4967(6) Å, α =105.0960(10)°, V = 3102.7(3) Å3; T = 100(2) K, Z = 4, Mr = 561.52,F(000) = 1208, Dcalc = 1.202 g·cm–3, µ = 0.69 mm–1 using Mo-Kα
radiation (λ = 0.71073 Å); 215197 reflections measured yielding 31274unique reflections after a numerical absorption correction (Tmin =0.88765; Tmax = 0.93391; Rint = 0.0257). The data set provided99.3% completeness in the measuring range 1.44° � 2θ � 98.52°(sinθmax/λ = 1.066 Å–1). The deformation density was described by amultipole model[49a] employing spherical harmonics multiplied withSlater-type radial functions with energy-optimized exponents[49b,c] asimplemented in the XD program.[49d] The refinement of 558 param-eters against 28356 reflections (Fo�3σ(Fo), sinθmax/λ = 1.066 Å–1)converged to R1 = 0.020, wR2 = 0.036 showing a flat and featurelessresidual density map with min./max. values of –0.298/0.291 e·Å–3
(sinθmax/ = 1.0 Å–1). Topological analyses of the experimental densitywere accomplished in the framework of the Quantum Theory of Atomsin Molecules (QTAIM).[49e] (For detailed discussion see the ElectronicSupporting Information).
Supporting Information (see footnote on the first page of this article):Full details of the data collection, multipolar refinements, and compu-tational details are given in the Supporting Information, which alsocontains drawings of the frontier orbitals of the free silane ligands of1a, 3a and 4a and detailed information on their atomic graphs. Inaddition, topological parameters of 6 were also listed. Crystallographicdata is also available in CIF format. CCDC-911612 contains the sup-plementary crystallographic data for this paper. These data can be ob-tained free of charge from The Cambridge Crystallographic Data Cen-tre via www.ccdc.cam.ac.uk/data_request/cif.
www.zaac.wiley-vch.de © 2013 WILEY-VCH Verlag GmbH & Co. KGaA, Weinheim Z. Anorg. Allg. Chem. 2013, 1996–20042002
Acknowledgments
This work was supported by the Deutsche Forschungsgemeinschaft(DFG) within the special priority program SPP1178.
References
[1] J. Y. Corey, Chem. Rev. 2011, 111, 863–1071.[2] G. S. McGrady, P. Sirsch, N. P. Chatterton, A. Ostermann, C.
Gatti, S. Altmannshofer, V. Herz, G. Eickerling, W. Scherer, In-org. Chem. 2009, 48, 1588–1598.
[3] A. D. Sadow, T. D. Tilley, J. Am. Chem. Soc. 2003, 125, 9462–9475.
[4] W. Scherer, G. Eickerling, M. Tafipolsky, G. S. McGrady, P.Sirsch, N. P. Chatterton, Chem. Commun. 2006, 28, 2986–2988.
[5] a) S. K. Ignatov, N. H. Rees, B. R. Tyrrell, S. R. Dubberley, A. G.Razuvaev, P. Mountford, G. I. Nikonov, Chem. Eur. J. 2004, 10,4991–4999; b) The values and signs of the calculated J(Si,Hbr)values are –24 Hz (1a) and +59 Hz (1b). Apparently, the sign ofthe J(Si,Hbr) coupling constant appears to be influenced by thenature of the ligand trans to the bridging Si–H moiety. This isremarkable, since the topological density parameters at the Si–Hbr bond critical points of 1a and 1b are strikingly similar – aswell as their delocalization indices (Ref. [8]). We note, that incontrast to our theoretical study a negative J(Si,Hbr) coupling con-stant of 1b (–34 Hz) was identified by an experimental NMRstudy (Ref. [5a]). The origin of this discrepancy between experi-ment and theory warrants further exploration; c) S. R. Dubberley,S. K. Ignatov, N. H. Rees, A. G. Razuvaev, P. Mountford, G. I.Nikonov, J. Am. Chem. Soc. 2003, 125, 642–643.
[6] a) V. I. Bakhmutov, J. A. K. Howard, D. A. Keen, L. G. Kuzmina,M. A. Leech, G. I. Nikonov, E. V. Vorontsov, C. C. Wilson, J.Chem. Soc., Dalton Trans. 2000, 1631–1635; b) G. I. Nikonov,Adv. Organomet. Chem. 2005, 53, 217–309.
[7] S. Lachaize, S. Sabo-Etienne, Eur. J. Inorg. Chem. 2006, 2115–2127.
[8] W. Scherer, P. Meixner, J. E. Barquera-Lozada, C. Hauf, A. Oben-huber, A. Brück, D. J. Wolstenholme, K. Ruhland, D. Leusser, D.Stalke, Angew. Chem. Int. Ed. 2013, 52, 6092–6096.
[9] E. Spaltenstein, P. Palma, K. A. Kreutzer, C. A. Willoughby,W. M. Davis, S. L. Buchwald, J. Am. Chem. Soc. 1994, 116,10308–10309.
[10] W. Chen, S. Shimada, M. Tanaka, Y. Kobayashi, K. Saigo, J. Am.Chem. Soc. 2004, 126, 8072–8073.
[11] T. Zell, T. Schaub, K. Radacki, U. Radius, Dalton Trans. 2011,40, 1852–1854.
[12] W. Scherer, V. Herz, A. Brück, C. Hauf, F. Reiner, S. Altmannsh-ofer, D. Leusser, D. Stalke, Angew. Chem. Int. Ed. 2011, 50,2845–2849.
[13] a) W. Scherer, V. Herz, C. Hauf, Struct. Bonding (Berlin) 2012,146, 159–208; b) W. Scherer, D. J. Wolstenholme, V. Herz, G.Eickerling, A. Brück, P. Benndorf, P. W. Roesky, Angew. Chem.Int. Ed. 2010, 49, 2242–2246.
[14] a) ADF2010.02, SCM, Theoretical Chemistry, Vrije Universiteit,Amsterdam, The Netherlands, http://www.scm.com, G. te Velde,F. M. Bickelhaupt, E. J. Baerends, C. Fonseca Guerra, S. J. A.van Gisbergen, J. G. Snijders, T. Ziegler, J. Comput. Chem. 2001,22, 931–967; b) A. Volkov, T. Koritsanszky, M. Chodkiewicz,H. F. King, J. Comput. Chem. 2009, 30, 1379–1391.
[15] E. van Lenthe, A. Ehlers, E.-J. Baerends, J. Chem. Phys. 1999,110, 8943–8953.
[16] C. Adamo, V. Barone, J. Chem. Phys. 1999, 110, 6158–6170.[17] M. Kohout, DGrid Version 4.6, Radebeul, 2011.[18] M. Krykunov, T. Ziegler, E. van Lenthe, J. Phys. Chem. A 2009,
113, 11495–11500.[19] We note that the Si–H bond lengths in 3a seem to be significantly
shorter in experiment (1.992(6) Å) than in theory (2.090 Å). How-
Remanent Si–H Interactions in Late Transition Metal Silane Complexes
ever, in case of BP86/TZ2P calculations the calculated Si···H sep-aration (Si···H = 1.981 Å) agrees well with the experimentalvalue. This puzzling discrepancy in the theoretical results is, how-ever, just due to a rather flat potential energy surface (PES) withrespect to the �Si,Ni,H bending potential. Hence, small changesof the level of approximation such as the replacement of the PBE0hybrid DFT functional by the BP86 method yields a large changeof the �Si,Ni,H angle from 65.0° (PBE0) to 60.1° (BP86). Ac-cordingly, the theoretical findings are in line with the presence ofa rather weak Si···H interaction in 3a.
[20] P. L. Holland, M. E. Smith, R. A. Andersen, R. G. Bergman, J.Am. Chem. Soc. 1997, 119, 12815–12823.
[21] E. E. Smith, G. Du, P. E. Fanwick, M. M. Abu-Omar, Organome-tallics 2010, 29, 6527–6533.
[22] V. M. Iluc, G. L. Hillhouse, Tetrahedron 2006, 62, 7577–7582.[23] T. Steinke, C. Gemel, M. Cokoja, M. Winter, R. A. Fischer, An-
gew. Chem. Int. Ed. 2004, 43, 2299–2302.[24] D. L. Lichtenberger, Organometallics 2003, 22, 1599–1602; for
alternative choices of local coordinates (e. g. in case of 1a) seeRef. [8].
[25] W. Scherer, P. Sirsch, D. Shorokhov, G. S. McGrady, S. A. Ma-son, M. G. Gardiner, Chem. Eur. J. 2002, 8, 2324–2334.
[26] W. Scherer, P. Sirsch, M. Grosche, M. Spiegler, S. A. Mason,M. G. Gardiner, Chem. Commun. 2001, 2072–2073.
[27] K. A. Kreutzer, R. A. Fisher, W. M. Davis, E. Spaltenstein, S. L.Buchwald, Organometallics 1991, 10, 4031–4035.
[28] The substantial Si–H bond activation causing a significantly re-duced density in the bonding region facilitated the free refinementof the bridging hydrogen positions in the (M,Si,H) moiety of 3a.This is similar to the case of the β-agostic Ni complex 5 wherethe Cβ–Hβ bond is highly activated and accompanied by a sub-stantially reduced bonding density ρ(rc) of only 1.33(3) e·Å–3 atthe BCP. Consequently, also in this case the position of the protoncould be freely refined (Ref. [12]).
[29] U. Schubert, G. Scholz, J. Müller, K. Ackermann, B. Wörle,R. F. D. Stansfield, J. Organomet. Chem. 1986, 306, 303–326.
[30] A. Todd, T. Keith, AIMALL (Version 12.11.09),(aim.tkgristmill.com), Gristmill Software Overland Park KS,USA, 2012.
[31] The delocalization indices δ(Si,H) are related to the correlationbetween electrons in the atomic basins of the silicon and hydrogenatoms and were obtained from single point calculations performedwith Gaussian09 (for full reference, see Supporting Information)at the PBE0/6-311G(d,p) level of theory. In the case of 4d and 5delements, the basis sets proposed by Jorge et al. were used; a)C. L. Barros, P. J. P. de Oliveira, F. E. Jorge, A. Canal Neto, M.Campos, Mol. Phys. 2010, 108, 1965–1972; b) R. C. de Berrêdo,F. E. Jorge, THEOCHEM 2010, 961, 107–112) For the integrationof the overlap matrices the AIMALL (Ref. [30]) software wasused. According to Poater et al. (J. Poater, M. Solà, M. Duran,X. Fradera, Theor. Chem. Acc. 2002, 107, 362–371), the delocal-ization indices δ(Ω, Ω’) of DFT wavefunctions can be calculatedusing an approximate formula that makes use of an HF-like sec-ond order exchange density matrix. According to a recent studyby Gatti et al. (C. Gatti, D. Lasi, Faraday Discuss. 2007, 135,55–78) this approximation affords δ(Ω, Ω’) values which are veryclose to the HF ones if the HF and DFT optimized geometriesare similar, although it erroneously implies that the electron-pairdensity matrix can be constructed, within DFT, using the samesimple formalism valid for the HF method.
[32] H. Arii, M. Takahashi, M. Nanjo, K. Mochida, Dalton Trans.2010, 39, 6434–6440.
[33] a) P. Macchi, D. Donghi, A. Sironi, J. Am. Chem. Soc. 2005, 127,16494–16504; b) The typical quadrupolar density deformation ofthe bridging hydrogen atom in 3a can be quantified by multipolarrefinements of its theoretical structure factors obtained from ADFand DENPROP calculations (Ref. [14]). Employing the local co-ordinate system as specified in Figure 4f yields the following non-zero quadrupole populations at the bridging hydrogen atom: P20
= –0.015; P22 = 0.12 P2–2 = –0.034. These are causing a charge
Z. Anorg. Allg. Chem. 2013, 1996–2004 © 2013 WILEY-VCH Verlag GmbH & Co. KGaA, Weinheim www.zaac.wiley-vch.de 2003
accumulation inside the Ni–Hbr–Si plane and approximately alongthe Si–Hbr and Ni–Hbr bond vectors. These subtle but noticeablefeatures were however not refineable during multipolar refine-ments of the experimental data.
[34] a) W. Scherer, G. S. McGrady, Angew. Chem. Int. Ed. 2004, 43,1782–1806; b) W. Scherer, P. Sirsch, D. Shorokhov, M. Tafipol-sky, G. S. McGrady, E. Gullo, Chem. Eur. J. 2003, 9, 6057–6070.
[35] P. L. A. Popelier, G. Logothetis, J. Organomet. Chem. 1998, 555,101–111.
[36] P. Morse, H. Feshbach, Methods of Theoretical Physics, McGraw-Hill, 1953.
[37] R. F. W. Bader, P. J. MacDougall, C. D. H. Lau, J. Am. Chem.Soc. 1984, 106, 1594–1605.
[38] R. F. W. Bader, P. M. Beddall, J. Chem. Phys. 1972, 56, 3320–3329.
[39] R. F. W. Bader, H. Essén, J. Chem. Phys. 1984, 80, 1943–1960.[40] R. P. Sagar, A. C. T. Ku, V. H. Smith, A. M. Simas, J. Chem.
Phys. 1988, 88, 4367–4374.[41] Z. Shi, R. J. Boyd, J. Chem. Phys. 1988, 88, 4375–4377.[42] W.-T. Chan, I. P. Hamilton, J. Chem. Phys. 1998, 108, 2473–2485.[43] Furthermore, four component calculations on spherical symmetric
atoms (Au) by Kohout et al. showed that the outermost shell ofelements of Period 6 might not be resolved in the second deriva-tive of the radial density: M. Kohout, A. Savin, H. Preuss, J.Chem. Phys. 1991, 95, 1928–1942. For further information, see:G. Eickerling, M. Reiher, J. Chem. Theory Comput. 2008, 4, 286–296; N. Hebben, H.-J. Himmel, G. Eickerling, C. Herrmann, M.Reiher, V. Herz, M. Presnitz, W. Scherer, Chem. Eur. J. 2007, 13,10078–10087; Ch. Vogt, R.-D. Hoffmann, U. Ch. Rodewald, G.Eickerling, M. Presnitz, V. Eyert, W. Scherer, R. Pöttgen, Inorg.Chem. 2009, 48, 6436–6451.
[44] R. F. W. Bader, R. J. Gillespie, F. Martin, Chem. Phys. Lett. 1998,290, 488–494.
[45] G. S. McGrady, A. Haaland, H. P. Verne, H. V. Volden, A. J.Downs, D. Shorokhov, G. Eickerling, W. Scherer, Chem. Eur. J.2005, 11, 4921–4934.
[46] a) We note, that the L(r) polarization pattern at the Ti atom in thed2 complex 1a appears to be rotated by 90° relative to the L(r)fine structure at the Ni atom in the d8 species 3a. However, alsoin 1a the polarization pattern is a direct consequence of the M(dyz)� L π back-donation process causing a depletion of the dyz or-bital. However, since the M(dyz) �L π back-donation process isstill incomplete in 1a, the remaining Ti dyz-electron density iscausing the presence of local charge concentrations in x,y direc-tions in the valence shell of the titanium atom. Hence, the dif-ferent (rotated) L(r) polarization pattern at the d2 and d8 config-ured metal atoms in 1a and 3a are still due to the same M(d) �L back-donation process. We further note, that the magnitudes ofthe individual local charge concentrations and depletions at themetal atoms show a systematic increase along the series 1a (d2)� 4a (d6) � 3a (d8). This is due to the fact, that the individualpolarization pattern becomes more pronounced with the (for-mally) increasing number of free d-electrons at the metal (see theSupporting Information); b) A. Holladay, P. Leung, P. Coppens,Acta Crystallogr., Sect. A 1983, 39, 377–380.
[47] J. E. Barquera-Lozada, A. Obenhuber, C. Hauf, W. Scherer, J.Phys. Chem. A 2013, 117, 4304–43015.
[48] These empirical findings could in the meantime also be rational-ized by a correlation between the (i) topology of L(r), (ii) thecurrent density J(r) and the (iii) proton NMR shifts in square-planar d8 complexes (Ref. [47]) This systematic study showedthat in cases where the metal coordinating hydrogen atom is situ-ated in the molecular plane, the δ(1H) chemical shifts are indeedcontrolled by the relative orientation of the hydrogen ligand withrespect to the polarization pattern of L(r). In cases where the hy-drogen ligand is situated above or below the plane, the out-of-plane angle θ between the molecular plane and the M–H vectorbecomes the leading control parameter, causing pronounceddownfield 1H shifts, as θ approaches 90° (Ref. [47]).
U. Radius, W. Scherer et al.ARTICLE[49] a) N. K. Hansen, P. Coppens, Acta Crystallogr., Sect. A 1978, 34,
909–921; b) Z. Su, P. Coppens, Acta Crystallogr., Sect. A 1998,54, 646–652; c) E. Clementi, D. L. Raimondi, J. Chem. Phys.1963, 38, 2686–2689; d) A. Volkov, P. Macchi, L. J. Farrugia, C.Gatti, P. Mallinson, T. Richter, T. Koritsanszky, XD2006 (version5.42) - A Computer Program for Multipole Refinement, Topologi-
www.zaac.wiley-vch.de © 2013 WILEY-VCH Verlag GmbH & Co. KGaA, Weinheim Z. Anorg. Allg. Chem. 2013, 1996–20042004
cal Analysis of Charge Densities and Evaluation of Intermo-lecular Energies from Experimental or Theoretical Structure Fac-tors, 2006; e) R. F. W. Bader, Atoms in Molecules: A QuantumTheory, Clarendon Press, Oxford, 1994.
Received: November 30, 2012Published Online: June 19, 2013