Protein secondary structure content in solution, films and tissues: Redundancy and complementarity...
12
Protein secondary structure content in solution, films and tissues: Redundancy and complementarity of the information content in circular dichroism, transmission and ATR FTIR spectra Erik Goormaghtigh ⁎ , 1 , Régis Gasper, Audrey Bénard, Andréa Goldsztein, Vincent Raussens 1 Center for Structural Biology and Bioinformatics, Laboratory for the Structure and Function of Biological Membranes, Campus Plaine CP206/02; Université Libre de Bruxelles, Bld du Triomphe 2, CP206/2, B1050 Brussels, Belgium abstract article info Article history: Received 7 February 2009 Received in revised form 25 May 2009 Accepted 3 June 2009 Available online 18 June 2009 Keywords: Secondary structure IR spectroscopy Circular dichroism Protein film FTIR imaging FTIR sensors The paper presents a simple and robust method to determine protein secondary structure from circular dichroism, transmission and attenuated total reflection (ATR) Fourier transform infrared spectra. It is found that the different spectroscopic methods bring valuable but roughly identical information on the secondary structure of proteins. ATR and transmission FTIR spectra display distinct differences, yet the secondary structure can be predicted from their spectra with roughly the same success. It is also found that one wavenumber or wavelength includes the large majority of the information correlated with secondary structure content and no more than 3 significant independent wavenumbers/wavelengths could be found for any of the spectroscopic data. This finding indicates that more complex linear combinations of the absorbance or ellipticities will not further improve secondary structure predictions. Furthermore, the information content in CD, transmission and ATR FTIR spectra is largely redundant. If combining CD and FTIR results in some improvement of structure prediction quality, the improvement is too modest to prompt spectroscopists to collect different spectroscopic data for structure prediction purposes. On the other hand, the data collected show that the quality of the FTIR spectrometers is such that biosensors or imaging methods sampling from 10 −9 to 10 −15 g yield spectra of sufficient quality to analyze protein secondary structure. These new techniques open the way to a new area of research, both in protein conformational response to ligand and imaging at sub-cellular scales. © 2009 Elsevier B.V. All rights reserved. 1. Introduction There is an increasing need for protein structure evaluation in native-like environments. In particular modulation of pH, ligand binding [1–6] and lipid composition for membrane proteins [7, 8] induce specific conformational changes that are relevant for the understanding of protein function. Spectroscopies such as infrared and circular dichroism play a major role in this area. Until the nineties, the quality of circular dichroism (CD) and Fourier Transform infrared (FTIR) spectrometers increased gradually to reach extremely good signal-to-noise ratios. Two major developments followed, first in data processing and second in sample preparation. The goal of this paper is to present a simple and robust secondary structure determination method and compare the different spectroscopic techniques. In a second step the question of protein structure for sampling of minute amounts of proteins recorded by novel techniques will be addressed. The number of data processing and treatments tested to retrieve structural information from spectroscopic data, mainly circular dichroism (CD) [9–19] and Fourier transform infrared spectroscopy (FTIR) [9, 20–37] has dramatically increased in recent years. Even though some methods appear to bring significant improvement, the actual improvement is usually difficult to assess because different protein sets are used by the different authors. In addition, a sig- nificant number of studies report FTIR spectra recorded on protein films by attenuated total reflection (ATR FTIR). Such a recording method presents a number of advantages for the study of minute amounts of materials as well as for the study of membrane proteins as reviewed before [38] but, even though this approach has been successfully used in a number of cases, there has never been a systematic comparison of spectra recorded by transmission and ATR FTIR on a large number of proteins. We have previously built a protein database that covers as well as possible the α/β secondary structure space, the fold space as described by CATH (Class, Architecture, Topology and homology) classification of proteins [39] as well as other structural features such as helix length, and number of strands in a sheet. We identified a set of commercially available proteins that can be obtained with sufficient purity and for which we assessed the quality of the crystal-derived structure [40, 41]. Using that database it Biochimica et Biophysica Acta 1794 (2009) 1332–1343 ⁎ Corresponding author. Tel.: +32 2 650 53 86; fax: +32 2 650 53 82. E-mail address: [email protected] (E. Goormaghtigh). 1 VR is Senior Research Associate and EG is Director of Research with the Fonds National de la Recherche Scientifique (FNRS, Belgium). 1570-9639/$ – see front matter © 2009 Elsevier B.V. All rights reserved. doi:10.1016/j.bbapap.2009.06.007 Contents lists available at ScienceDirect Biochimica et Biophysica Acta journal homepage: www.elsevier.com/locate/bbapap
Transcript of Protein secondary structure content in solution, films and tissues: Redundancy and complementarity...
Biochimica et Biophysica Acta 1794 (2009) 1332–1343
Contents lists available at ScienceDirect
Biochimica et Biophysica Acta
j ourna l homepage: www.e lsev ie r.com/ locate /bbapap
Protein secondary structure content in solution, films and tissues: Redundancy andcomplementarity of the information content in circular dichroism, transmissionand ATR FTIR spectra
Erik Goormaghtigh ⁎,1, Régis Gasper, Audrey Bénard, Andréa Goldsztein, Vincent Raussens 1
Center for Structural Biology and Bioinformatics, Laboratory for the Structure and Function of Biological Membranes, Campus Plaine CP206/02; Université Libre de Bruxelles,Bld du Triomphe 2, CP206/2, B1050 Brussels, Belgium
⁎ Corresponding author. Tel.: +32 2 650 53 86; fax: +E-mail address: [email protected] (E. Goormaghtigh).
1 VR is Senior Research Associate and EG is DirectoNational de la Recherche Scientifique (FNRS, Belgium).
1570-9639/$ – see front matter © 2009 Elsevier B.V. Aldoi:10.1016/j.bbapap.2009.06.007
a b s t r a c t
a r t i c l e i n f oArticle history:Received 7 February 2009Received in revised form 25 May 2009Accepted 3 June 2009Available online 18 June 2009
Keywords:Secondary structureIR spectroscopyCircular dichroismProtein filmFTIR imagingFTIR sensors
The paper presents a simple and robust method to determine protein secondary structure from circulardichroism, transmission and attenuated total reflection (ATR) Fourier transform infrared spectra. It is foundthat the different spectroscopic methods bring valuable but roughly identical information on the secondarystructure of proteins. ATR and transmission FTIR spectra display distinct differences, yet the secondarystructure can be predicted from their spectra with roughly the same success. It is also found that onewavenumber or wavelength includes the large majority of the information correlated with secondarystructure content and no more than 3 significant independent wavenumbers/wavelengths could be foundfor any of the spectroscopic data. This finding indicates that more complex linear combinations of theabsorbance or ellipticities will not further improve secondary structure predictions. Furthermore, theinformation content in CD, transmission and ATR FTIR spectra is largely redundant. If combining CD and FTIRresults in some improvement of structure prediction quality, the improvement is too modest to promptspectroscopists to collect different spectroscopic data for structure prediction purposes. On the other hand,the data collected show that the quality of the FTIR spectrometers is such that biosensors or imagingmethods sampling from 10−9 to 10−15 g yield spectra of sufficient quality to analyze protein secondarystructure. These new techniques open the way to a new area of research, both in protein conformationalresponse to ligand and imaging at sub-cellular scales.
© 2009 Elsevier B.V. All rights reserved.
1. Introduction
There is an increasing need for protein structure evaluation innative-like environments. In particular modulation of pH, ligandbinding [1–6] and lipid composition for membrane proteins [7, 8]induce specific conformational changes that are relevant for theunderstanding of protein function. Spectroscopies such as infraredand circular dichroism play a major role in this area. Until the nineties,the quality of circular dichroism (CD) and Fourier Transform infrared(FTIR) spectrometers increased gradually to reach extremely goodsignal-to-noise ratios. Two major developments followed, first in dataprocessing and second in sample preparation. The goal of this paper isto present a simple and robust secondary structure determinationmethod and compare the different spectroscopic techniques. In asecond step the question of protein structure for sampling of minuteamounts of proteins recorded by novel techniques will be addressed.
32 2 650 53 82.
r of Research with the Fonds
l rights reserved.
The number of data processing and treatments tested to retrievestructural information from spectroscopic data, mainly circulardichroism (CD) [9–19] and Fourier transform infrared spectroscopy(FTIR) [9, 20–37] has dramatically increased in recent years. Eventhough some methods appear to bring significant improvement,the actual improvement is usually difficult to assess because differentprotein sets are used by the different authors. In addition, a sig-nificant number of studies report FTIR spectra recorded on proteinfilms by attenuated total reflection (ATR FTIR). Such a recordingmethod presents a number of advantages for the study of minuteamounts of materials as well as for the study of membrane proteinsas reviewed before [38] but, even though this approach has beensuccessfully used in a number of cases, there has never been asystematic comparison of spectra recorded by transmission and ATRFTIR on a large number of proteins. We have previously built a proteindatabase that covers as well as possible the α/β secondary structurespace, the fold space as described by CATH (Class, Architecture,Topology and homology) classification of proteins [39] as well asother structural features such as helix length, and number of strandsin a sheet. We identified a set of commercially available proteins thatcan be obtained with sufficient purity and for which we assessed thequality of the crystal-derived structure [40, 41]. Using that database it

1333E. Goormaghtigh et al. / Biochimica et Biophysica Acta 1794 (2009) 1332–1343
becomes possible to compare the secondary structure informationcontent present in CD, transmission and ATR FTIR spectra. In a pre-vious study we addressed the question of wavenumber selection andof the number of independent structure-related features present inATR FTIR spectra of proteins for the prediction of secondary structurecontents [35]. Interestingly, the ascending stepwise method pro-posed identified the relevance of every wavenumber in the IRspectrum for the prediction of a given secondary structure and yieldsa particularly simple method for computing the secondary structurecontent. In the present paper we propose a comparison of circulardichroism, transmission and ATR FTIRmethods for a set of 45 proteinsselected to cover as well as possible the conformational space. Anevaluation of the information content at every wavelength or wave-number will be provided. In additionwe shall address the question ofthe complementary information present in the three spectroscopictechniques.
Classical protein sample preparation includes protein solutionsand protein films, the latter being used mainly for ATR FTIR, and to aless extent, for oriented CD for membrane proteins [42]. Recently anew type of biosensors based on an ATR FTIR detection, so-calledBIA-ATR, has been described [43–46]. A “receptor” molecule is che-mically grafted on an ATR crystal and a solution containing poten-tial ligands at the desired concentration is flown over the crystal.Because the pentration depth of the evanescent wave in the outermedium is limited to μm range, the free ligand is basically un-detected up to mM concentrations. Once the ligand binds to the“receptor”, its concentration close to the interface becomes huge andthe spectrum is easily detected. With the development of the BIA-ATR technology, proteins can be covalently attached to the germ-anium crystal as a monomolecular layer and studied as their envi-ronment is being modified [46]. Such an approach was previouslyrestricted to membrane proteins [47–51] or required the use of“caged” compounds released in the solution upon illumination [52].Sensor devices sample only a few ng of proteins. Simultaneously thedevelopment of imaging paved the way to the study of isolated cellsand tissues. In imaging, several thousands of spectra are recordedsimultaneously over a very small area (a few μm2). Individual pixelsrepresent a few fg of proteins. We address here the question ofprotein conformation in these newmethods. So far FTIR-based sensordevices as well as imaging have essentially used the FTIR spectrum asa signature of the binding molecules or of the cells that are beingimaged. We show in this paper that both applications can providefurther molecular information upon including secondary structureanalyses developed for pure protein samples in the first part of thepaper.
2. Materials and methods
The set of reference proteins used for this study is an optimizedbasis set that is described in another paper [40]. It represents a widerange of helix and sheet fractional content values as well as 60different protein domain folds. The final selectionwas based on othercriteria including available purity as checked by densitometry of SDS-PAGE analyses, crystal structure quality, non-protein contaminants,sufficient solubility and stability. The final set fully spans severaldifferent ‘conformational spaces’ as described by CATH [53, 54],fractional content in the different secondary structures, and has dis-tributions of structures that reflect the natural abundances found inthe PDB. Briefly, the proteins used in the present study are: 1, Avidin;2, Erabutoxin b; 3, Concavalin A; 4, Metallothionein II; 5,α-hemolysin(alpha-toxin); 6, Lectin (lentil); 7, Superoxide dismutase (Cu, Zn); 8,Immunoglobulin gamma; 9, Trypsinogen; 10, α-ChymotrypsinogenA; 11, Carbonic anhydrase; 12, Thaumatin; 13, Pepsinogen; 14, Rennin(chymosin b); 15, Pepsin; 16, Ubiquitin; 17, Monellin; 18, Ribo-nuclease A; 19, Ricin; 20, Papain; 21, Alcohol dehydrogenase; 22,Glucose oxidase; 23, Ovalbumin; 24, α-Lactalbumin; 25, Lysozyme;
26, Penicillin amidohydrolase; 27, DD-transpeptidase; 28, Lipoxy-genase; 29, Phosphoglyceric kinase; 30, Peroxidase; 31, Dihydropter-idine reductase; 32, Triose phosphate isomerase; 33, Insulin; 34,Cytochrome C; 35, Phospholipase A2; 36, Superoxide dismutase (Fe);37, Glutathione S-transferase; 38, Parvalbumin; 39, Citrate synthetase;40, Troponin; 41, Apolipoprotein E3, N-terminal domain (residues 1–183); 42, Hemoglobin; 43, Ferritin (apo); 44, Colicin A, C-terminaldomain; and 45, Myoglobin. The proteins are sorted by increasing α-helix content. More information on these proteins can be found in theoriginal paper [40].
Proteins were dissolved directly in 2 mM HEPES (1H2O) pH 7.2,0.1% NaN3. The initial protein solutions were made at a concentrationof 4% (w/v). Small molecules from the commercial preparations wereremoved by extensive dialysis against HEPES buffer (2 mM, pH 7.2,0.02% NaN3) at 4 °C, or by passing the sample through a 0.7×4 cmSephadex G-25 (Pharmacia) size-exclusion centrifuge column equili-brated with this buffer. The high NaN3 concentration in the initialsolution allowed the effectiveness of desalting to be verified for eachsample since the N3
− ion has a characteristic IR band at 2048 cm−1.The secondary structures of the 45 proteins used here were
determined using their crystallographic coordinates with the DSSPprogram [55] and have been listed elsewhere [40].
The human prostate cancer PC-3 (CRL-1435) cell line was obtainedfrom the American Type Culture Collection (ATCC, Manassas, VA) andwas maintained according to the supplier's instructions. The cellswere incubated at 37 °C in sealed (airtight) Falcon plastic dishes(Nunc, Invitrogen SA, Merelbeke, Belgium) in a humidified atmo-sphere of 5% CO2. The cells were kept in exponential growth in RPMImedium supplemented with 10% fetal bovine serum, 1% penicillin/streptomycin (an antibiotic/antimycotic solution), and 1% kanamycinto prevent mycoplasms. Medium and serum were purchased fromGibco, Invitrogen, Merelbeke, Belgium. Penicillin/streptomycin andkanamycin solutions came from Sigma-Aldrich SA, Bornem, Belgium.For FTIR spectroscopy, cells were suspended bymeans of a five-minutetreatment with 1 ml trypsin/EDTA buffer (Gibco, Invitrogen SA,Merelbeke, Belgium). The reaction was stopped by adding 1 ml ofculture medium. The cells were pelleted by a 2-minute centrifugation(300g), and washed three times in isotonic solution (NaCl, 0.9%) toensure complete removal of trypsin and culture medium. They werethen suspended in 30 μl of 0.9% NaCl solution.
Breast tumor biopsies were fixed in formalin and embedded inparaffin using standard formalin-fixed paraffin embedding procedure.3 μm thick slices were cut with a microtome, slices were placed on aBaF2 window and dried at 37 °C for 10 min. Paraffin was removed byrinsing for 7 min with xylene, then ethanol for 4 min.
2.1. Spectroscopic data collection and processing
2.1.1. CD spectraFor CD measurements the stock solution was diluted to ∼0.01%
with 2 mM HEPES (1H2O) pH 7.2, without NaN3, since NaN3 absorbsstrongly at low wavelengths. All protein preparations were furtherdesalted by dialysis or size-exclusion chromatography. CD spectrawere collected on a JASCO J-710 CD spectrometer using filtered proteinsolutions in 2 mM HEPES pH 7.2 with an absorbance of ∼0.5–0.8 at192 nm (∼0.1 mg/ml) in a 0.1 cm cell. Each CD spectrum was theaccumulation of 8 scans at 50 nm/min with a 1 nm slit width and atime constant of 0.5 s for a nominal resolution of 1.7 nm. Data werecollected from 185 to 260 nm. After background subtraction, the CDsamples typically had an absorbance of ∼0.7 AU at 192 nm, and gaveraw CD intensities larger than −5 mdeg in the 200–230 nm region.For analysis, background-corrected spectra were converted to meanresidue ellipticity (deg dmol−1 cm2) using a concentration deter-mined from the absorbance at 205 nm as previously described. Theywere then divided by 800 to provide intensities and variance similar tothose of the scaled infrared spectra.
1334 E. Goormaghtigh et al. / Biochimica et Biophysica Acta 1794 (2009) 1332–1343
2.1.2. FTIR spectraAttenuated total reflection infrared (ATR FTIR) spectra were
obtained on a Bruker IFS55 FTIR spectrophotometer (Ettlingen,Germany) equipped with a MCT detector (broad band 120,000–420 cm−1, liquid N2 cooled, 24 h hold time) at a resolution of 2 cm−1
with an aperture of 3.5 mm and acquired in the double-sided,forward-backward mode. The spectrometer was placed on vibration-absorbing sorbothane mounts (Edmund Industrial Optics, Barrington,NJ, USA). Two level of zero filling of the interferogram prior to Fouriertransform allowed encoding the data every 1 cm−1. The spectrometerwas continuously purged with dry air (Whatman 75-62, Haverhill,MA, USA). For a better stability, the purging of the spectrometer opticcompartment (50 l/min) and of the sample compartment (100 l/min)were dissociated and controlled independently by flowmeters (FisherBioblock Scientific, Illkirch, France). Except for imaging, all infraredspectra were normalized by rescaling the spectra so that the areabetween the spectra and the baseline drawn between the spectrumpoint at 1725 and 1481 cm−1 was 10,000. The contribution of watervapor from infrared spectra was subtracted using a scaling factordetermined from the integrated absorbance of the 1562 or 1555 cm−1
bands [56]. Correction for water vapor is necessary as water vaporregions of the spectrum investigated here. The problem of watervapor subtraction has attracted the attention of several groups in thepast [56, 57] and elaborated strategies have been designed, includingmultiple subtractions with curve fitting for taking into account theslight shifts that may occur between the sample, background andreference water vapor spectra. Principal components extracted froma large library of water vapor spectra could also be used [58]. Theadjustments of the subtraction method described by Bruun et al. [57]bring another refinement for elimination of water vapor peaks. Yet,for the present work a simple subtraction scaled on the area of the1562–1555 cm−1 band was found to be sufficient for proteins studies(2 cm−1 resolution) and a similar scaling on the area of the 1956–1935 cm−1 water vapor band was similarly found to be satisfactoryfor imaging (8 cm−1 resolution). 2 cm−1 resolution spectra werefinally apodized to a final resolution of 4 cm−1 by a Gaussian lineshape.
Anywhere secondary structure is evaluated, including in imaging,spectra are preprocessed by subtracting a baseline and scaling on thearea between 1725 and 1485 cm−1 before applying the equations suchas described in Table 1.
Table 1Equations for the prediction of the secondary structure from the absorbance of thetransmission or ATR infrared spectra or from the ellipticity for the CD spectra.
SD
ATR FTIRα-helix (%)=−209.33+2.50⁎A1545+0.50⁎A1655+1.31⁎A1608 6.5%β-sheet (%)=26.87−0.59⁎A1656+0.59⁎A1634 7.9%β-turns (%)=−32.73+0.54⁎A1679+0.38⁎A1528 3.5%random (%)=153.75−1.43⁎A1547−1.13⁎A1611 8.3%
Transmission FTIRα-helix (%)=−148.10+0.98⁎A1654+1.49⁎A1588+0.66⁎A1546 6.5%β-sheet (%)=35.53−0.56⁎A1657+0.60⁎A1629 7.5%β-turns (%)=−14.25+0.36⁎A1678+0.85⁎A1501 3.6%random (%)=−40.65+1.08⁎A1523+0.62⁎A1679 7.5%
CDα-helix (%)=0.0108−0.0030⁎E225 8.5%β-sheet (%)=42.17+0.018⁎E240−0.023⁎E248 10.0%β-turns (%)=12.52+0.029⁎E253−0.024⁎E252 3.5%random (%)=40.40+0.000912⁎E220+0.0157⁎E256 8.3%
For instance, once the ellipticity at 225 is measured, e.g. −25,615 for myoglobin, theequation for the α-helix structure is 0.0108−0.0030⁎(−25,600)=77%. For theinfrared spectra, a baseline must be subtracted between 1725 and 1481 cm−1 andthe spectra must be rescaled to an area of 10,000 using the same limits. The standarddeviation (SD) is reported for each prediction in cross-validation mode.
2.1.3. ATR FTIR spectraThe internal reflection element was a 52×20×2 mm3 trapezoidal
germanium ATR plate (ACM, Villiers St Frédéric, France) with anaperture angle of 45° yielding 25 internal reflections. The germa-nium crystals were washed in Superdecontamine (Intersciences, AS,Brussels, Belgium), a lab detergent solution at pH 13, rinsed with dis-tilled water, washed with methanol, then with chloroform and finallyplaced for 2 min in a plasma cleaner PDC23G (Harrick, Ossining, NY,USA)working under reduced air pressure.Measurementswere carriedout at room temperature. Thin films were obtained by slowly eva-porating a sample solution containing 100 μg of protein on one side ofthe ATR plate under a stream of nitrogen.
2.1.4. Transmission FTIR spectraSpectra were collected using 3% (w/w) protein stock solutions
(1H2O) placed between CaF2 windows separated with a 5 μm Teflonspacer. The buffer spectrum was subtracted, the subtraction scalingfactor was adjusted so that the slopes of the baselines from 1990 to1900 and 1850 to 1740 cm−1 were the same [59].
2.1.5. BIA-ATR FTIRThe internal reflection element was triangular-shaped germanium
crystals (4.8×4.8×45 mm3). It was purchased from Biosentech(Naninne, Belgium) and accommodated on the beam condenserfrom a Golden Gate Micro-ATR from Specac. A top plate with a groovefitting the crystal was used in replacement of the diamond-bearingplate (WOW Company, Belgium). With this geometry a single re-flection occurs and more than 10 lanes can be used on a crystal.Cleaning and grafting the germanium surface was obtained asdescribed elsewhere [46]. The basic construction is terminated by aspacer arms containing a succinimidyl ester able to bind proteins bytheir free –NH2 groups.
2.1.6. Imaging — FTIRIR spectroscopic images were recorded using a Bruker FTIR
spectrometer equinox coupled to a Hyperion 3000 imaging systemequipped with a mercury cadmium telluride (MCT)-based focalplane array (FPA) detector of 64×64 pixels (Bruker Optik, Ettlingen,Germany). Images of 4096 IR spectra at 8-cm−1 spectral resolutionwere acquired by coadding 256 interferograms by the OPUSsoftware (Bruker) operating the FPA in continuous scan mode.This was obtained in ca 5 min. The small size of every one of the4096 detectors required some accumulation of the data to getdecent signal/noise. Signal/noise was systematically checked onimages. It was required to be N500 when noise was defined as thestandard deviation in the 2200–2100 cm−1 region of the spectrumand the signal is the maximum of the curve found between 1725and 1480 cm−1 after a baseline passing through these two pointshas been subtracted. 64×64 pixels are recorded at a magnificationof 15× on a 2560×2560 μm2 detector. In turn, the size of the imagewas 170×170 μm2 and the pixels 2.7×2.7 μm2. It must be notedthat the real resolution is significantly lower, depending on thewavelength, i.e. 5 μm at 2000 cm−1 and 10 μm at 1000 cm−1. Ittakes about 5 min to record 256 scans, which is quite manage-able. The resolution used for imaging, 8 cm−1, is still largely suf-ficient for secondary structure determination. We tested this on aseries of spectra of proteins of known structure and the predictionof the secondary structure content is not significantly degraded (notshown).
2.2. Model and standard deviation on secondary structure prediction
As explained in details in [35], model relating the absorbance atevery wavenumber to one secondary structure content were built.Briefly, for one given secondary structure, a linear model relating theabsorbance Aj, wi
(after rescaling) to a secondary structure fractional
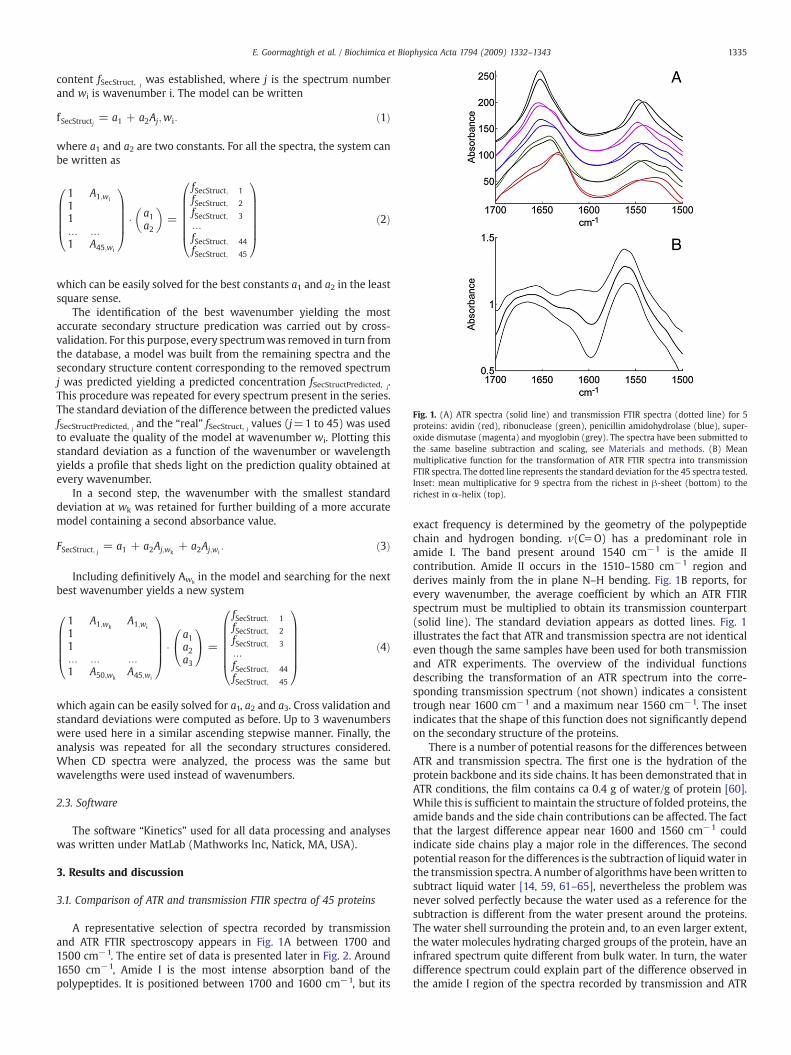
Fig. 1. (A) ATR spectra (solid line) and transmission FTIR spectra (dotted line) for 5proteins: avidin (red), ribonuclease (green), penicillin amidohydrolase (blue), super-oxide dismutase (magenta) and myoglobin (grey). The spectra have been submitted tothe same baseline subtraction and scaling, see Materials and methods. (B) Meanmultiplicative function for the transformation of ATR FTIR spectra into transmissionFTIR spectra. The dotted line represents the standard deviation for the 45 spectra tested.Inset: mean multiplicative for 9 spectra from the richest in β-sheet (bottom) to therichest in α-helix (top).
1335E. Goormaghtigh et al. / Biochimica et Biophysica Acta 1794 (2009) 1332–1343
content fSecStruct, jwas established, where j is the spectrum number
and wi is wavenumber i. The model can be written
fSecStructj = a1 + a2Aj;wi: ð1Þ
where a1 and a2 are two constants. For all the spectra, the system canbe written as
1 A1;wi
11N N1 A45;wi
0BBBB@
1CCCCA � a1
a2
� �=
fSecStruct; 1fSecStruct; 2fSecStruct; 3NfSecStruct; 44fSecStruct; 45
0BBBBBB@
1CCCCCCA
ð2Þ
which can be easily solved for the best constants a1 and a2 in the leastsquare sense.
The identification of the best wavenumber yielding the mostaccurate secondary structure predication was carried out by cross-validation. For this purpose, every spectrumwas removed in turn fromthe database, a model was built from the remaining spectra and thesecondary structure content corresponding to the removed spectrumj was predicted yielding a predicted concentration fSecStructPredicted, j
.This procedure was repeated for every spectrum present in the series.The standard deviation of the difference between the predicted valuesfSecStructPredicted, j
and the “real” fSecStruct, jvalues (j=1 to 45) was used
to evaluate the quality of the model at wavenumber wi. Plotting thisstandard deviation as a function of the wavenumber or wavelengthyields a profile that sheds light on the prediction quality obtained atevery wavenumber.
In a second step, the wavenumber with the smallest standarddeviation at wk was retained for further building of a more accuratemodel containing a second absorbance value.
FSecStruct; j = a1 + a2Aj;wk+ a2Aj;wi
: ð3Þ
Including definitively Awkin the model and searching for the next
best wavenumber yields a new system
1 A1;wkA1;wi
11N N N1 A50;wk
A45;wi
0BBBB@
1CCCCA �
a1a2a3
0@
1A =
fSecStruct; 1fSecStruct; 2fSecStruct; 3NfSecStruct; 44fSecStruct; 45
0BBBBBB@
1CCCCCCA
ð4Þ
which again can be easily solved for a1, a2 and a3. Cross validation andstandard deviations were computed as before. Up to 3 wavenumberswere used here in a similar ascending stepwise manner. Finally, theanalysis was repeated for all the secondary structures considered.When CD spectra were analyzed, the process was the same butwavelengths were used instead of wavenumbers.
2.3. Software
The software “Kinetics” used for all data processing and analyseswas written under MatLab (Mathworks Inc, Natick, MA, USA).
3. Results and discussion
3.1. Comparison of ATR and transmission FTIR spectra of 45 proteins
A representative selection of spectra recorded by transmissionand ATR FTIR spectroscopy appears in Fig. 1A between 1700 and1500 cm−1. The entire set of data is presented later in Fig. 2. Around1650 cm−1, Amide I is the most intense absorption band of thepolypeptides. It is positioned between 1700 and 1600 cm−1, but its
exact frequency is determined by the geometry of the polypeptidechain and hydrogen bonding. ν(Cf O) has a predominant role inamide I. The band present around 1540 cm−1 is the amide IIcontribution. Amide II occurs in the 1510–1580 cm−1 region andderives mainly from the in plane N–H bending. Fig. 1B reports, forevery wavenumber, the average coefficient by which an ATR FTIRspectrum must be multiplied to obtain its transmission counterpart(solid line). The standard deviation appears as dotted lines. Fig. 1illustrates the fact that ATR and transmission spectra are not identicaleven though the same samples have been used for both transmissionand ATR experiments. The overview of the individual functionsdescribing the transformation of an ATR spectrum into the corre-sponding transmission spectrum (not shown) indicates a consistenttrough near 1600 cm−1 and a maximum near 1560 cm−1. The insetindicates that the shape of this function does not significantly dependon the secondary structure of the proteins.
There is a number of potential reasons for the differences betweenATR and transmission spectra. The first one is the hydration of theprotein backbone and its side chains. It has been demonstrated that inATR conditions, the film contains ca 0.4 g of water/g of protein [60].While this is sufficient to maintain the structure of folded proteins, theamide bands and the side chain contributions can be affected. The factthat the largest difference appear near 1600 and 1560 cm−1 couldindicate side chains play a major role in the differences. The secondpotential reason for the differences is the subtraction of liquidwater inthe transmission spectra. A number of algorithms have beenwritten tosubtract liquid water [14, 59, 61–65], nevertheless the problem wasnever solved perfectly because the water used as a reference for thesubtraction is different from the water present around the proteins.The water shell surrounding the protein and, to an even larger extent,the water molecules hydrating charged groups of the protein, have aninfrared spectrum quite different from bulk water. In turn, the waterdifference spectrum could explain part of the difference observed inthe amide I region of the spectra recorded by transmission and ATR

Fig. 2. Top: information content in transmission and ATR FTIR and in CD spectra withrespect to α-helix content in the 45 proteins. (A) Evolution of the standard error ofprediction for the α-helix content for a 1-wavenumber/wavelength model. The smallervalues indicate where the model is the most accurate. (B) Evolution of the standarderror of prediction for the α-helix content for a 2-wavenumber/wavelength model.Curves C was obtained by addition of a third wavenumber/wavelength. The modelspredicting the fraction of helix fhelix and the standard deviation of the prediction (SD)are reported in Table 1. Bottom: concatenated CD (186–260 nm), ATR FTIR (1700–1500 cm−1) and transmission FTIR (1700–1500 cm−1) spectra of 45 proteins, afterdivision by 800 of the CD spectra for a better display. Proteins have been sortedaccording to their α-helix content as described in Materials and methods. The α-helixcontent increases from blue to red.
1336 E. Goormaghtigh et al. / Biochimica et Biophysica Acta 1794 (2009) 1332–1343
FTIR spectroscopy. The only way around this problem is to use heavywater as solvent but it raises other problems such as the extent ofdeuteration which can be completed in seconds, months or years,depending on the protein [51, 66–77]. The third potential reason for adifference resides in the optical particularities of the ATR experiment.Because of the refractive index variation in the absorbance band, it hasbeen shown that in some conditions a significant difference canappear [38]. Here, because the ATR IRE used is made of germaniumwith a high refractive index, at 45° incidence we are far away from thecritical angle (22°) and this effect can be discarded. For a moredetailed discussion the reader is referred to our previous review [38].It must be noted here that the “standard correction” for ATR spectraprovided my spectrometer manufacturers was not applied here. Thereason is that the standard correction takes into account the expo-nential decay of the evanescent wave, which depends on thewavelength. When the protein film is not thick enough to beconsidered as of “infinite” thickness, the correction does not apply.A number of approximate [38, 78] or more rigorous [79–81] solutionshave been developed for intermediate thickness films but, as thethickness of the film is probably not homogenous, practically nosatisfactory theoretical solution can be used. In the present case, thewavenumber range (amide I – amide II) investigated is rather limited.In turn, the distortions related to the wavelength dependence of thepenetration depth are also of small amplitude. Examination of thetransfer function presented in Fig. 1B indicates that it is dominated byfactors unrelated to the wavelength.
3.2. The information content in ATR FTIR, transmission FTIR andCD spectra
The fact that spectra are different when recorded by ATR or trans-mission FTIR does not mean one of them is less powerful to predictprotein secondary structures. It is also is interesting to compare the
capability of CD to compete with both FTIR methods. A very simpleand efficient way to extract information correlated with secondarystructure content is to scan, wavenumber by wavenumber or wave-length by wavelength, the quality of the correlation betweenabsorbance and secondary structure content [35]. The correlationprovides a tool that allows the prediction secondary structure fromabsorbance at any wavenumber/wavelength. The difference betweenprediction and crystallographic data consistently evaluated was ex-pressed for all the spectra as a standard deviation (see Materials andmethods). The standard deviation was plotted as a function of thewavenumber for ATR and transmission FTIR spectra and of the wave-length for CD spectra in Fig. 2 for the case of theα-helix structure. Themaximum value of the standard deviation is near 24%. It describes thespread of the structure in the 45 proteins used. In other words itcharacterizes the accuracy that is expected in the absence of anyexperimental information. Using the absorbance at a single wave-number makes the standard deviation drop to less than 12% when theabsorbance at 1654 cm−1 is considered for transmission FTIR and to ca8% for the absorbance at 1545 cm−1 for ATR FTIR spectra. For CDspectra, the standard deviation falls to a lower at ca 8% when theellipticity at 225 nm is used. The profile plotted on Fig. 2 sheds light onwhere in the spectrum the spectroscopic signal is best correlated tothe α-helix content. Not surprisingly, the minima on curves A appearat positions ofα-helix contributions (1654 and 1545 cm−1) and of theβ-sheet contributions (1692, 1630 and 1525 cm−1). The fact that β-sheet contributions also bring important information on the α-helixcontent simply reflects the inverse correlation between both structurecontents in the protein database, as discussed earlier [35].
When the best wavenumber or wavelength was included in themodel, we obtained
α1helix content = − 86:18 + 1:11:A1654; ð5Þ
with a standard deviation of 12.5% for the transmission spectrum. Asecond wavenumber could then be added by screening again all thewavenumbers [35]. Keeping 1654 cm−1, the second wavenumberyielding the smallest error of predictionwas found to be 1588 cm−1. Asecond equation that described the α-helix content was:
α1helix content = − 126:89 + 1:20:A1654 + 1:56:A1588 ð6Þ
with a standard deviation of 9.9%.It can be observed in Fig. 2 for transmission FTIR that once
1654 cm−1 was included in the model; there remained some infor-mation pertinent to the α-helix content that was not completelycorrelated to the 1654 cm−1 information. This second profile appearsin Fig. 2, (curve B) just under the first one discussed above. The gainis important for transmission FTIR spectra, moderate for ATR FTIRspectra and negligible for CD spectra. It must be noted that addingmore wavenumbers or wavelengths results in some more gains fortransmission FTIR spectra, smaller gains for ATR FTIR spectra and nosignificant gain for CD spectra. It is also interesting to notice thatwhere awavenumber had been selected the standard deviation profileof the next wavenumber usually appears to be slightly above the pre-vious standard deviation profile. This is an effect of the cross-valid-ation mode used in this work where structure prediction is based on amodel built in the absence of the protein whose structure is to bepredicted. Wavenumbers/wavelengths were added until the gain wasless than 0.5%. The equations allowing the prediction of theα-helix, β-sheet, β-turn and random content were established in a similar wayand are presented in Table 1.
It appeared that 2 wavenumbers/wavelengths describe most of theinformation pertinent for the prediction of the other secondarystructures (Table 1). For the α-helix structure 3 wavenumbers wereused for transmission FTIR but in the particular case of CD, it demons-trates that once the ellipticity at 225 nm was known, there was no
1337E. Goormaghtigh et al. / Biochimica et Biophysica Acta 1794 (2009) 1332–1343
other significant information present between 186 and 260 nm (seeFig. 2). It is worth noting here that untypical side chain compositioncan affect the prediction of the secondary structure and require aspecific correction for the side chain contribution. Arginine rich toxins(e.g. [82]) provide such an example. Yet, with the present set ofproteins, subtracting their own side chain contributions as describedelsewhere [83] did not improve the quality of the prediction (data notshown).
3.3. Redundant and complementary information in FTIR and CD spectra
Combining several different spectroscopies could conceivably re-sult in an improvement of structure prediction if the informationcontained in each is complementary. In order to address this issueCD, ATR FTIR and transmission FTIR spectra were concatenated toform a single hybrid spectrum (Fig. 2). As described above, a linearmodel was built to relate theα-helix content to the signal by scanningnanometer by nanometer or wavenumber by wavenumber to deter-mine the best position for the prediction. The results of this scanexpressed as the standard deviation of the prediction in cross-validation appears in the upper part of Fig. 2, along with the resultsobtained for the a second and a third point.
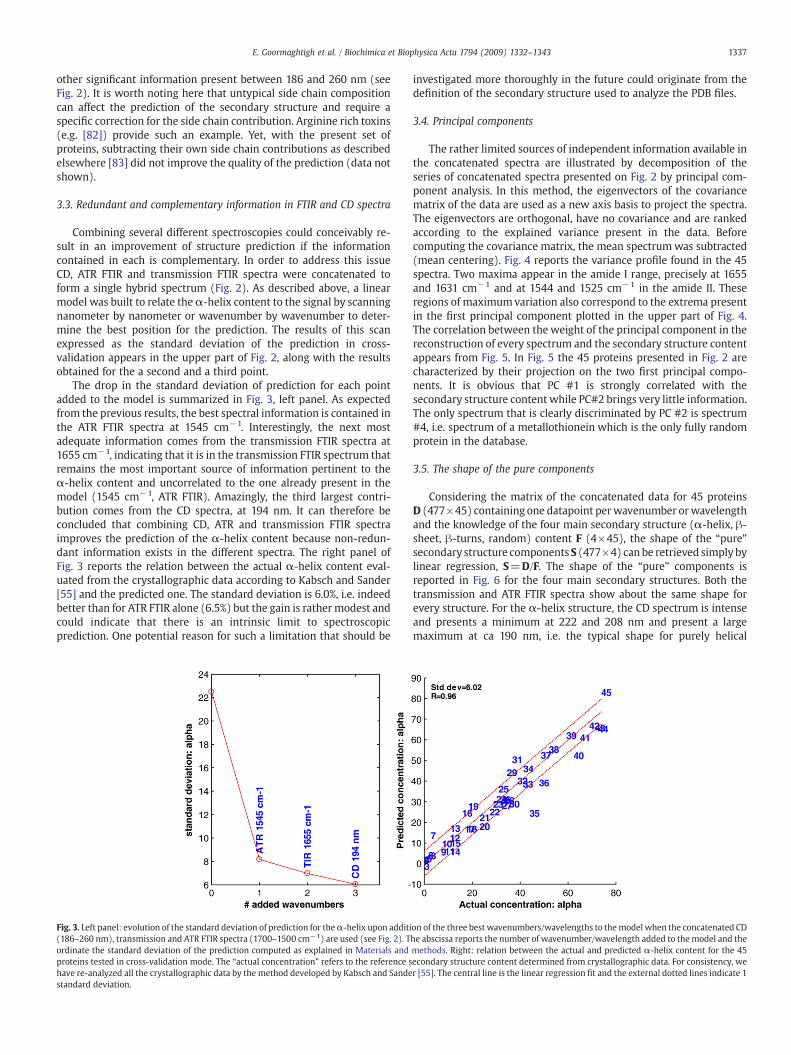
The drop in the standard deviation of prediction for each pointadded to the model is summarized in Fig. 3, left panel. As expectedfrom the previous results, the best spectral information is contained inthe ATR FTIR spectra at 1545 cm−1. Interestingly, the next mostadequate information comes from the transmission FTIR spectra at1655 cm−1, indicating that it is in the transmission FTIR spectrum thatremains the most important source of information pertinent to theα-helix content and uncorrelated to the one already present in themodel (1545 cm−1, ATR FTIR). Amazingly, the third largest contri-bution comes from the CD spectra, at 194 nm. It can therefore beconcluded that combining CD, ATR and transmission FTIR spectraimproves the prediction of the α-helix content because non-redun-dant information exists in the different spectra. The right panel ofFig. 3 reports the relation between the actual α-helix content eval-uated from the crystallographic data according to Kabsch and Sander[55] and the predicted one. The standard deviation is 6.0%, i.e. indeedbetter than for ATR FTIR alone (6.5%) but the gain is rathermodest andcould indicate that there is an intrinsic limit to spectroscopicprediction. One potential reason for such a limitation that should be
Fig. 3. Left panel: evolution of the standard deviation of prediction for theα-helix upon additi(186–260 nm), transmission and ATR FTIR spectra (1700–1500 cm−1) are used (see Fig. 2). Tordinate the standard deviation of the prediction computed as explained in Materials andproteins tested in cross-validation mode. The “actual concentration” refers to the reference shave re-analyzed all the crystallographic data by the method developed by Kabsch and Sandestandard deviation.
investigated more thoroughly in the future could originate from thedefinition of the secondary structure used to analyze the PDB files.
3.4. Principal components
The rather limited sources of independent information available inthe concatenated spectra are illustrated by decomposition of theseries of concatenated spectra presented on Fig. 2 by principal com-ponent analysis. In this method, the eigenvectors of the covariancematrix of the data are used as a new axis basis to project the spectra.The eigenvectors are orthogonal, have no covariance and are rankedaccording to the explained variance present in the data. Beforecomputing the covariance matrix, the mean spectrumwas subtracted(mean centering). Fig. 4 reports the variance profile found in the 45spectra. Two maxima appear in the amide I range, precisely at 1655and 1631 cm−1 and at 1544 and 1525 cm−1 in the amide II. Theseregions of maximumvariation also correspond to the extrema presentin the first principal component plotted in the upper part of Fig. 4.The correlation between the weight of the principal component in thereconstruction of every spectrum and the secondary structure contentappears from Fig. 5. In Fig. 5 the 45 proteins presented in Fig. 2 arecharacterized by their projection on the two first principal compo-nents. It is obvious that PC #1 is strongly correlated with thesecondary structure content while PC#2 brings very little information.The only spectrum that is clearly discriminated by PC #2 is spectrum#4, i.e. spectrum of a metallothionein which is the only fully randomprotein in the database.
3.5. The shape of the pure components
Considering the matrix of the concatenated data for 45 proteinsD (477×45) containing one datapoint perwavenumber orwavelengthand the knowledge of the four main secondary structure (α-helix, β-sheet, β-turns, random) content F (4×45), the shape of the “pure”secondary structure components S (477×4) canbe retrieved simplybylinear regression, S=D/F. The shape of the “pure” components isreported in Fig. 6 for the four main secondary structures. Both thetransmission and ATR FTIR spectra show about the same shape forevery structure. For the α-helix structure, the CD spectrum is intenseand presents a minimum at 222 and 208 nm and present a largemaximum at ca 190 nm, i.e. the typical shape for purely helical
on of the three best wavenumbers/wavelengths to themodel when the concatenated CDhe abscissa reports the number of wavenumber/wavelength added to the model and themethods. Right: relation between the actual and predicted α-helix content for the 45econdary structure content determined from crystallographic data. For consistency, wer [55]. The central line is the linear regression fit and the external dotted lines indicate 1
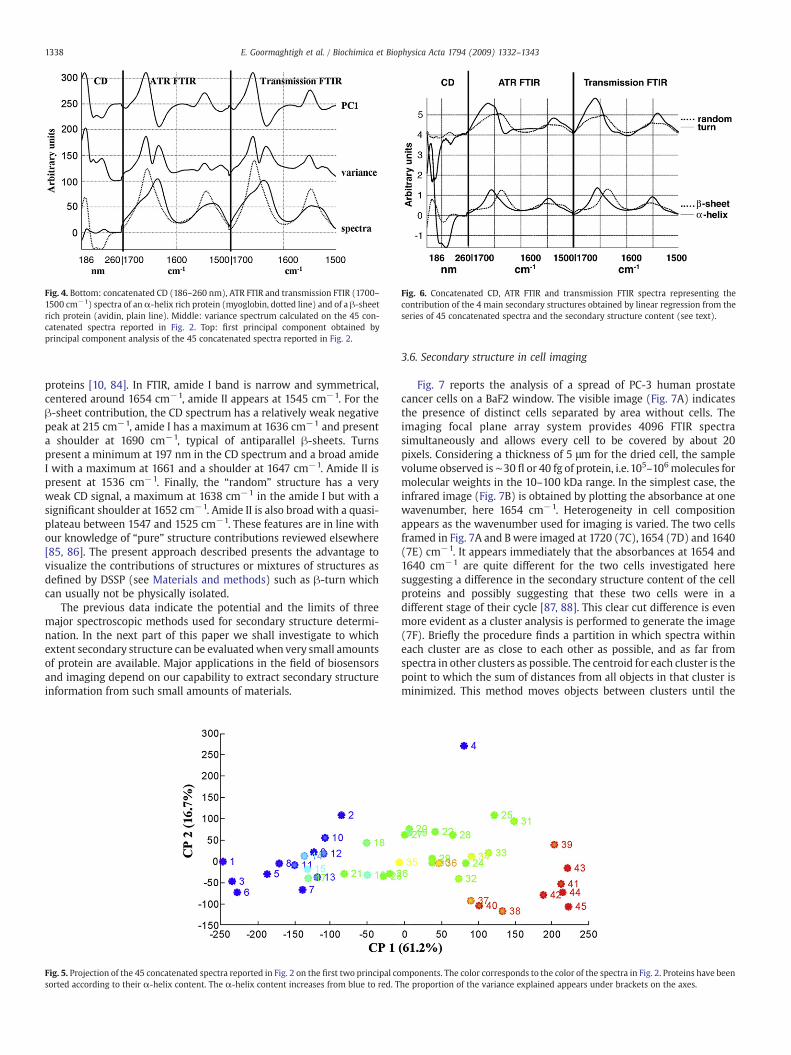
Fig. 6. Concatenated CD, ATR FTIR and transmission FTIR spectra representing thecontribution of the 4 main secondary structures obtained by linear regression from theseries of 45 concatenated spectra and the secondary structure content (see text).
Fig. 4. Bottom: concatenated CD (186–260 nm), ATR FTIR and transmission FTIR (1700–1500 cm−1) spectra of anα-helix rich protein (myoglobin, dotted line) and of a β-sheetrich protein (avidin, plain line). Middle: variance spectrum calculated on the 45 con-catenated spectra reported in Fig. 2. Top: first principal component obtained byprincipal component analysis of the 45 concatenated spectra reported in Fig. 2.
1338 E. Goormaghtigh et al. / Biochimica et Biophysica Acta 1794 (2009) 1332–1343
proteins [10, 84]. In FTIR, amide I band is narrow and symmetrical,centered around 1654 cm−1, amide II appears at 1545 cm−1. For theβ-sheet contribution, the CD spectrum has a relatively weak negativepeak at 215 cm−1, amide I has a maximum at 1636 cm−1 and presenta shoulder at 1690 cm−1, typical of antiparallel β-sheets. Turnspresent a minimum at 197 nm in the CD spectrum and a broad amideI with a maximum at 1661 and a shoulder at 1647 cm−1. Amide II ispresent at 1536 cm−1. Finally, the “random” structure has a veryweak CD signal, a maximum at 1638 cm−1 in the amide I but with asignificant shoulder at 1652 cm−1. Amide II is also broad with a quasi-plateau between 1547 and 1525 cm−1. These features are in line withour knowledge of “pure” structure contributions reviewed elsewhere[85, 86]. The present approach described presents the advantage tovisualize the contributions of structures or mixtures of structures asdefined by DSSP (see Materials and methods) such as β-turn whichcan usually not be physically isolated.
The previous data indicate the potential and the limits of threemajor spectroscopic methods used for secondary structure determi-nation. In the next part of this paper we shall investigate to whichextent secondary structure can be evaluatedwhen very small amountsof protein are available. Major applications in the field of biosensorsand imaging depend on our capability to extract secondary structureinformation from such small amounts of materials.
Fig. 5. Projection of the 45 concatenated spectra reported in Fig. 2 on the first two principal cosorted according to their α-helix content. The α-helix content increases from blue to red. T
3.6. Secondary structure in cell imaging
Fig. 7 reports the analysis of a spread of PC-3 human prostatecancer cells on a BaF2 window. The visible image (Fig. 7A) indicatesthe presence of distinct cells separated by area without cells. Theimaging focal plane array system provides 4096 FTIR spectrasimultaneously and allows every cell to be covered by about 20pixels. Considering a thickness of 5 μm for the dried cell, the samplevolume observed is ∼30 fl or 40 fg of protein, i.e.105–106molecules formolecular weights in the 10–100 kDa range. In the simplest case, theinfrared image (Fig. 7B) is obtained by plotting the absorbance at onewavenumber, here 1654 cm−1. Heterogeneity in cell compositionappears as the wavenumber used for imaging is varied. The two cellsframed in Fig. 7A and B were imaged at 1720 (7C), 1654 (7D) and 1640(7E) cm−1. It appears immediately that the absorbances at 1654 and1640 cm−1 are quite different for the two cells investigated heresuggesting a difference in the secondary structure content of the cellproteins and possibly suggesting that these two cells were in adifferent stage of their cycle [87, 88]. This clear cut difference is evenmore evident as a cluster analysis is performed to generate the image(7F). Briefly the procedure finds a partition in which spectra withineach cluster are as close to each other as possible, and as far fromspectra in other clusters as possible. The centroid for each cluster is thepoint to which the sum of distances from all objects in that cluster isminimized. This method moves objects between clusters until the
mponents. The color corresponds to the color of the spectra in Fig. 2. Proteins have beenhe proportion of the variance explained appears under brackets on the axes.
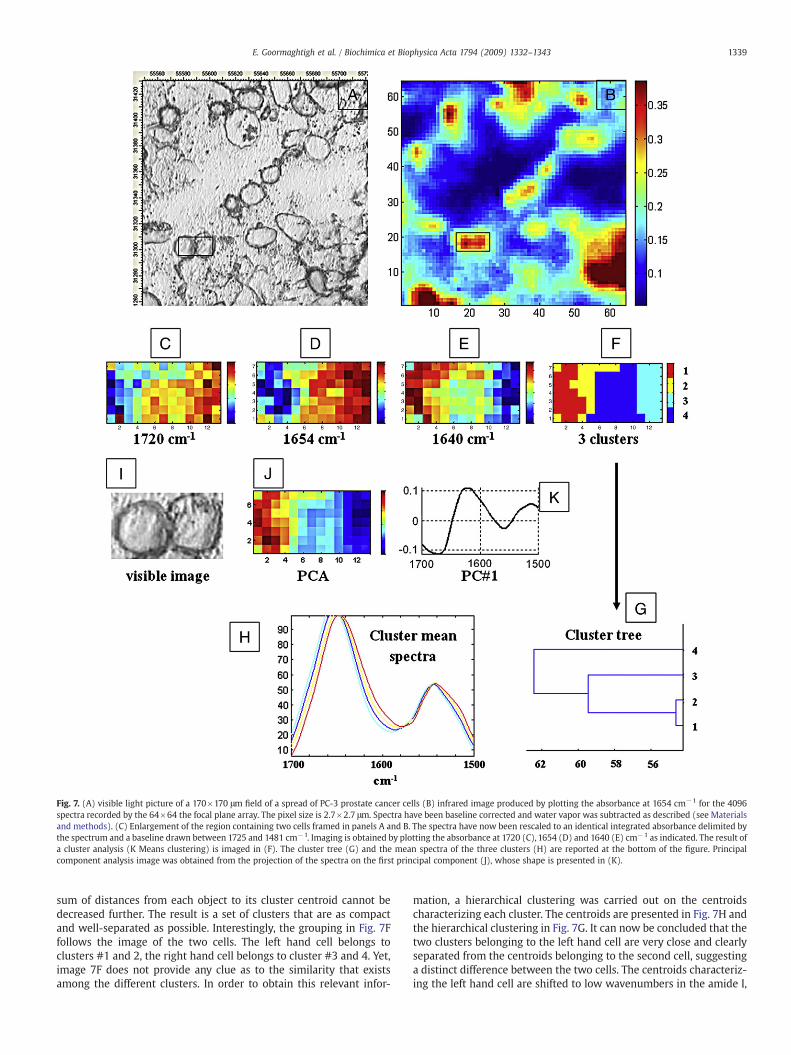
Fig. 7. (A) visible light picture of a 170×170 μm field of a spread of PC-3 prostate cancer cells (B) infrared image produced by plotting the absorbance at 1654 cm−1 for the 4096spectra recorded by the 64×64 the focal plane array. The pixel size is 2.7×2.7 μm. Spectra have been baseline corrected and water vapor was subtracted as described (see Materialsand methods). (C) Enlargement of the region containing two cells framed in panels A and B. The spectra have now been rescaled to an identical integrated absorbance delimited bythe spectrum and a baseline drawn between 1725 and 1481 cm−1. Imaging is obtained by plotting the absorbance at 1720 (C), 1654 (D) and 1640 (E) cm−1 as indicated. The result ofa cluster analysis (K Means clustering) is imaged in (F). The cluster tree (G) and the mean spectra of the three clusters (H) are reported at the bottom of the figure. Principalcomponent analysis image was obtained from the projection of the spectra on the first principal component (J), whose shape is presented in (K).
1339E. Goormaghtigh et al. / Biochimica et Biophysica Acta 1794 (2009) 1332–1343
sum of distances from each object to its cluster centroid cannot bedecreased further. The result is a set of clusters that are as compactand well-separated as possible. Interestingly, the grouping in Fig. 7Ffollows the image of the two cells. The left hand cell belongs toclusters #1 and 2, the right hand cell belongs to cluster #3 and 4. Yet,image 7F does not provide any clue as to the similarity that existsamong the different clusters. In order to obtain this relevant infor-
mation, a hierarchical clustering was carried out on the centroidscharacterizing each cluster. The centroids are presented in Fig. 7H andthe hierarchical clustering in Fig. 7G. It can now be concluded that thetwo clusters belonging to the left hand cell are very close and clearlyseparated from the centroids belonging to the second cell, suggestinga distinct difference between the two cells. The centroids characteriz-ing the left hand cell are shifted to low wavenumbers in the amide I,
1340 E. Goormaghtigh et al. / Biochimica et Biophysica Acta 1794 (2009) 1332–1343
i.e. from 1654 to 1647 cm−1 while amide II is not significantly affected.Such a shift could be interpreted as resulting from a decrease in theα-helix content and an increase in random structures. Quantitativeanalysis of the secondary structure content according to the equationsreported in Table 1 indicates that the helix content dropped from 32 to28% while the random structure content increased from 39 to 47%.Principal component analysis performed on the 1700–1500 cm−1
wavenumber range (7J) confirms the segregation observed and theshape of the first principal component (7K) confirms that most of thevariance (87.5%) present in the data is due to that conformationalvariation. Furthermore, if PCA is performed on a much broader area,the first principal component is again dominated by the samevariation in the amide I region of the spectrum (data not shown),strongly suggesting that spectra variation between the two cells isrelated to protein conformation. In conclusion, structural analysis ofproteins at a sub-cellular scale is possible and could yield unantici-pated insight in cell population analysis.
3.7. Secondary structure in tissue imaging
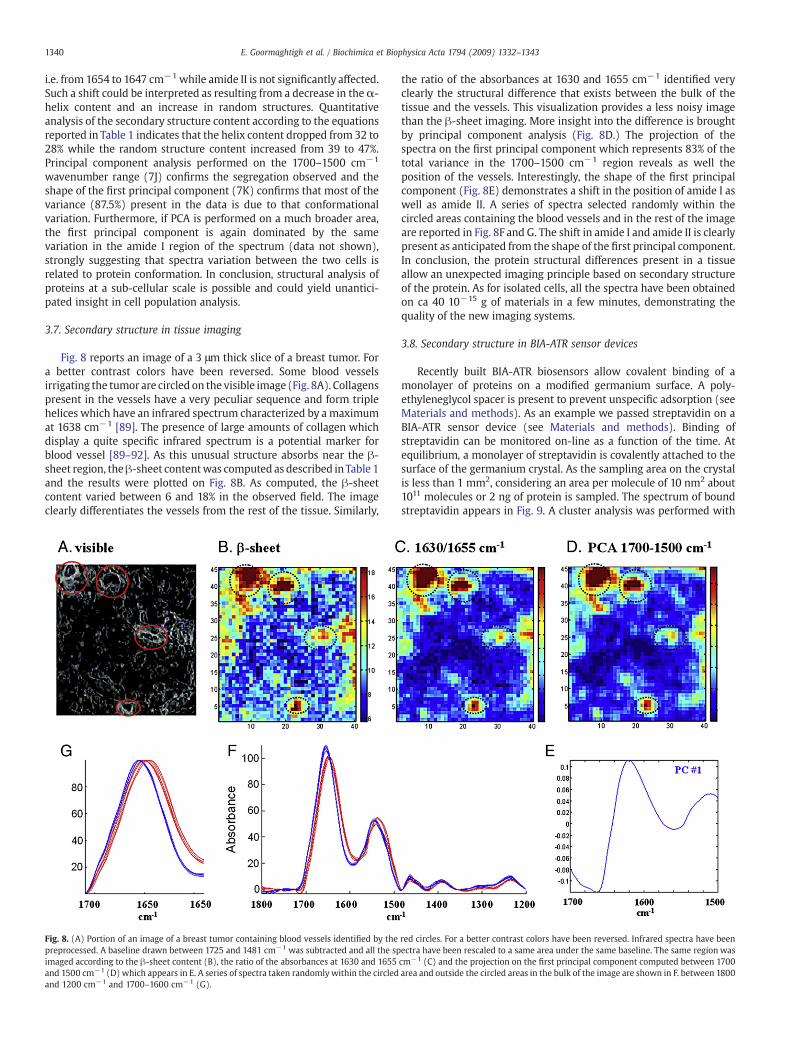
Fig. 8 reports an image of a 3 μm thick slice of a breast tumor. Fora better contrast colors have been reversed. Some blood vesselsirrigating the tumor are circled on the visible image (Fig. 8A). Collagenspresent in the vessels have a very peculiar sequence and form triplehelices which have an infrared spectrum characterized by a maximumat 1638 cm−1 [89]. The presence of large amounts of collagen whichdisplay a quite specific infrared spectrum is a potential marker forblood vessel [89–92]. As this unusual structure absorbs near the β-sheet region, theβ-sheet contentwas computed as described inTable 1and the results were plotted on Fig. 8B. As computed, the β-sheetcontent varied between 6 and 18% in the observed field. The imageclearly differentiates the vessels from the rest of the tissue. Similarly,
Fig. 8. (A) Portion of an image of a breast tumor containing blood vessels identified by thepreprocessed. A baseline drawn between 1725 and 1481 cm−1 was subtracted and all the spimaged according to the β-sheet content (B), the ratio of the absorbances at 1630 and 1655and 1500 cm−1 (D) which appears in E. A series of spectra taken randomly within the circledand 1200 cm−1 and 1700–1600 cm−1 (G).
the ratio of the absorbances at 1630 and 1655 cm−1 identified veryclearly the structural difference that exists between the bulk of thetissue and the vessels. This visualization provides a less noisy imagethan the β-sheet imaging. More insight into the difference is broughtby principal component analysis (Fig. 8D.) The projection of thespectra on the first principal component which represents 83% of thetotal variance in the 1700–1500 cm−1 region reveals as well theposition of the vessels. Interestingly, the shape of the first principalcomponent (Fig. 8E) demonstrates a shift in the position of amide I aswell as amide II. A series of spectra selected randomly within thecircled areas containing the blood vessels and in the rest of the imageare reported in Fig. 8F and G. The shift in amide I and amide II is clearlypresent as anticipated from the shape of the first principal component.In conclusion, the protein structural differences present in a tissueallow an unexpected imaging principle based on secondary structureof the protein. As for isolated cells, all the spectra have been obtainedon ca 40 10−15 g of materials in a few minutes, demonstrating thequality of the new imaging systems.
3.8. Secondary structure in BIA-ATR sensor devices
Recently built BIA-ATR biosensors allow covalent binding of amonolayer of proteins on a modified germanium surface. A poly-ethyleneglycol spacer is present to prevent unspecific adsorption (seeMaterials and methods). As an example we passed streptavidin on aBIA-ATR sensor device (see Materials and methods). Binding ofstreptavidin can be monitored on-line as a function of the time. Atequilibrium, a monolayer of streptavidin is covalently attached to thesurface of the germanium crystal. As the sampling area on the crystalis less than 1 mm2, considering an area per molecule of 10 nm2 about1011 molecules or 2 ng of protein is sampled. The spectrum of boundstreptavidin appears in Fig. 9. A cluster analysis was performed with
red circles. For a better contrast colors have been reversed. Infrared spectra have beenectra have been rescaled to a same area under the same baseline. The same region wascm−1 (C) and the projection on the first principal component computed between 1700area and outside the circled areas in the bulk of the image are shown in F. between 1800
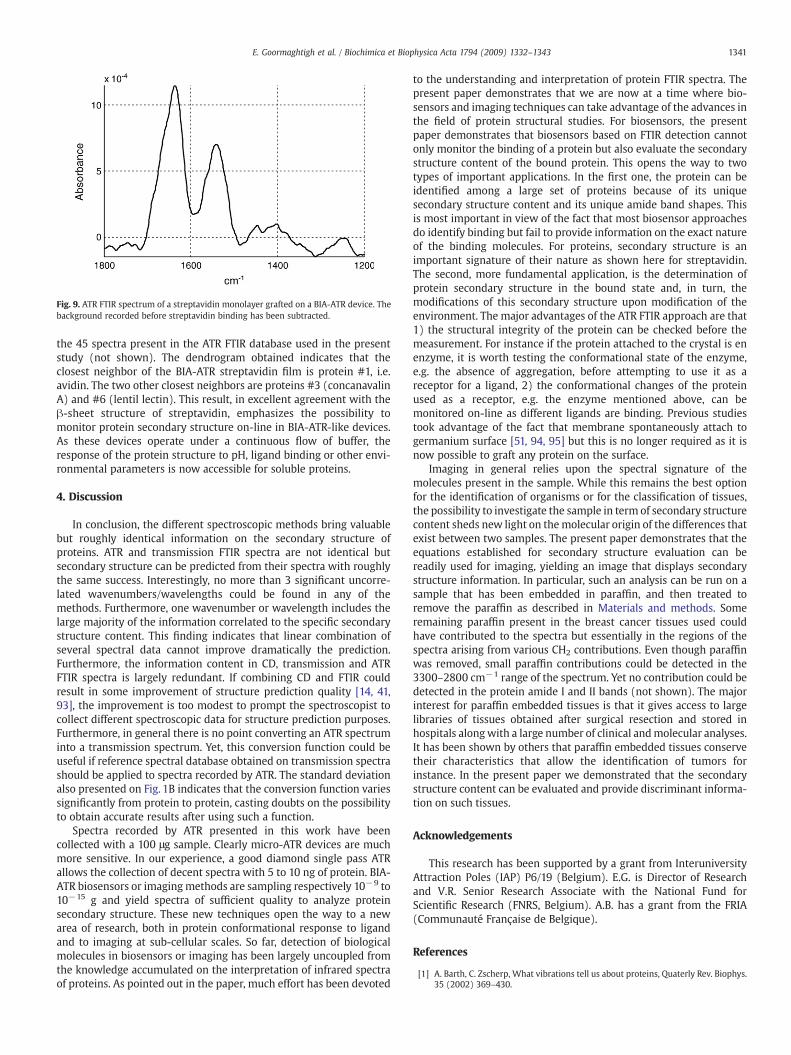
Fig. 9. ATR FTIR spectrum of a streptavidin monolayer grafted on a BIA-ATR device. Thebackground recorded before streptavidin binding has been subtracted.
1341E. Goormaghtigh et al. / Biochimica et Biophysica Acta 1794 (2009) 1332–1343
the 45 spectra present in the ATR FTIR database used in the presentstudy (not shown). The dendrogram obtained indicates that theclosest neighbor of the BIA-ATR streptavidin film is protein #1, i.e.avidin. The two other closest neighbors are proteins #3 (concanavalinA) and #6 (lentil lectin). This result, in excellent agreement with theβ-sheet structure of streptavidin, emphasizes the possibility tomonitor protein secondary structure on-line in BIA-ATR-like devices.As these devices operate under a continuous flow of buffer, theresponse of the protein structure to pH, ligand binding or other envi-ronmental parameters is now accessible for soluble proteins.
4. Discussion
In conclusion, the different spectroscopic methods bring valuablebut roughly identical information on the secondary structure ofproteins. ATR and transmission FTIR spectra are not identical butsecondary structure can be predicted from their spectra with roughlythe same success. Interestingly, no more than 3 significant uncorre-lated wavenumbers/wavelengths could be found in any of themethods. Furthermore, one wavenumber or wavelength includes thelarge majority of the information correlated to the specific secondarystructure content. This finding indicates that linear combination ofseveral spectral data cannot improve dramatically the prediction.Furthermore, the information content in CD, transmission and ATRFTIR spectra is largely redundant. If combining CD and FTIR couldresult in some improvement of structure prediction quality [14, 41,93], the improvement is too modest to prompt the spectroscopist tocollect different spectroscopic data for structure prediction purposes.Furthermore, in general there is no point converting an ATR spectruminto a transmission spectrum. Yet, this conversion function could beuseful if reference spectral database obtained on transmission spectrashould be applied to spectra recorded by ATR. The standard deviationalso presented on Fig. 1B indicates that the conversion function variessignificantly from protein to protein, casting doubts on the possibilityto obtain accurate results after using such a function.
Spectra recorded by ATR presented in this work have beencollected with a 100 μg sample. Clearly micro-ATR devices are muchmore sensitive. In our experience, a good diamond single pass ATRallows the collection of decent spectra with 5 to 10 ng of protein. BIA-ATR biosensors or imagingmethods are sampling respectively 10−9 to10−15 g and yield spectra of sufficient quality to analyze proteinsecondary structure. These new techniques open the way to a newarea of research, both in protein conformational response to ligandand to imaging at sub-cellular scales. So far, detection of biologicalmolecules in biosensors or imaging has been largely uncoupled fromthe knowledge accumulated on the interpretation of infrared spectraof proteins. As pointed out in the paper, much effort has been devoted
to the understanding and interpretation of protein FTIR spectra. Thepresent paper demonstrates that we are now at a time where bio-sensors and imaging techniques can take advantage of the advances inthe field of protein structural studies. For biosensors, the presentpaper demonstrates that biosensors based on FTIR detection cannotonly monitor the binding of a protein but also evaluate the secondarystructure content of the bound protein. This opens the way to twotypes of important applications. In the first one, the protein can beidentified among a large set of proteins because of its uniquesecondary structure content and its unique amide band shapes. Thisis most important in view of the fact that most biosensor approachesdo identify binding but fail to provide information on the exact natureof the binding molecules. For proteins, secondary structure is animportant signature of their nature as shown here for streptavidin.The second, more fundamental application, is the determination ofprotein secondary structure in the bound state and, in turn, themodifications of this secondary structure upon modification of theenvironment. The major advantages of the ATR FTIR approach are that1) the structural integrity of the protein can be checked before themeasurement. For instance if the protein attached to the crystal is enenzyme, it is worth testing the conformational state of the enzyme,e.g. the absence of aggregation, before attempting to use it as areceptor for a ligand, 2) the conformational changes of the proteinused as a receptor, e.g. the enzyme mentioned above, can bemonitored on-line as different ligands are binding. Previous studiestook advantage of the fact that membrane spontaneously attach togermanium surface [51, 94, 95] but this is no longer required as it isnow possible to graft any protein on the surface.
Imaging in general relies upon the spectral signature of themolecules present in the sample. While this remains the best optionfor the identification of organisms or for the classification of tissues,the possibility to investigate the sample in term of secondary structurecontent sheds new light on themolecular origin of the differences thatexist between two samples. The present paper demonstrates that theequations established for secondary structure evaluation can bereadily used for imaging, yielding an image that displays secondarystructure information. In particular, such an analysis can be run on asample that has been embedded in paraffin, and then treated toremove the paraffin as described in Materials and methods. Someremaining paraffin present in the breast cancer tissues used couldhave contributed to the spectra but essentially in the regions of thespectra arising from various CH2 contributions. Even though paraffinwas removed, small paraffin contributions could be detected in the3300–2800 cm−1 range of the spectrum. Yet no contribution could bedetected in the protein amide I and II bands (not shown). The majorinterest for paraffin embedded tissues is that it gives access to largelibraries of tissues obtained after surgical resection and stored inhospitals alongwith a large number of clinical andmolecular analyses.It has been shown by others that paraffin embedded tissues conservetheir characteristics that allow the identification of tumors forinstance. In the present paper we demonstrated that the secondarystructure content can be evaluated and provide discriminant informa-tion on such tissues.
Acknowledgements
This research has been supported by a grant from InteruniversityAttraction Poles (IAP) P6/19 (Belgium). E.G. is Director of Researchand V.R. Senior Research Associate with the National Fund forScientific Research (FNRS, Belgium). A.B. has a grant from the FRIA(Communauté Française de Belgique).
References
[1] A. Barth, C. Zscherp, What vibrations tell us about proteins, Quaterly Rev. Biophys.35 (2002) 369–430.

1342 E. Goormaghtigh et al. / Biochimica et Biophysica Acta 1794 (2009) 1332–1343
[2] M. Liu, M. Krasteva, A. Barth, Interactions of phosphate groups of ATP and aspartylphosphate with the sarcoplasmic reticulum Ca2+-ATPase: an FTIR study, Biophys.J. 89 (2005) 4352–4363.
[3] M. Stolz, E. Lewitzki, D. Thoenges, W. Mantele, A. Barth, E. Grell, FTIR differencespectroscopy of Na, K-ATPase, J. Gen. Physiol. 126 (2005) 32A.
[4] D. Thoenges, A. Barth, Direct measurement of enzyme activity with infraredspectroscopy, J. Biomol. Screen. 7 (2002) 353–357.
[5] C. Zscherp, A. Barth, Reaction-induced infrared difference spectroscopy for thestudy of protein reaction mechanisms, Biochemistry 40 (2001) 1875–1883.
[6] P. Hakizimana, M. Masureel, B. Gbaguidi, J.M. Ruysschaert, C. Govaerts, Inter-actions between phosphatidylethanolamine headgroup and LmrP, a multidrugtransporter, J. Biol. Chem. 283 (2008) 9369–9376.
[7] B. Gbaguidi, J.M. Ruysschaert, C. Vigano, Requirement of phosphatidyletha-nolamine for the normal structure and activity of the multidrug transporter LmrP,FEBS J. 272 (2005) 232.
[8] B. Gbaguidi, P. Hakizimana, G. Vandenbussche, J.M. Ruysschaert, Conformationalchanges in a bacterial multidrug transporter are phosphatidylethanolamine-dependent, Cell. Mol. Life Sci. 64 (2007) 1571–1582.
[9] V. Baumruk, P. Pancoska, T.A. Keiderling, Predictions of secondary structure usingstatistical analyses of electronic and vibrational circular dichroism and Fouriertransform infrared spectra of proteins in H2O, J. Mol. Biol. 259 (1996) 774–791.
[10] Y.H. Chen, J.T. Yang, H.M. Martinez, Determination of the secondary structures ofproteins by circular dichroism and optical rotatory dispersion, Biochemistry 11(1972) 4120–4131.
[11] G.D. Fasman, Differentiation between transmembrane helices and peripheralhelices by the deconvolution of circular dichroism spectra of membrane proteins,in: G.D. Fasman (Ed.), Circular Dichroism and The Conformation of Biomolecules,Plenum, New York and London, 1996, pp. 381–412.
[12] P. McPhie, Circular dichroism studies on proteins in films and in solution:estimation of secondary structure by g-factor analysis, Anal. Biochem. 293 (2001)109–119.
[13] K. Park, A. Perczel, G.D. Fasman, Differentiation between transmembrane helicesand peripheral helices by the deconvolution of circular dichroism spectra ofmembrane proteins, Prot. Sci. 1 (1992) 1032–1049.
[14] R.W. Sarver Jr., W.C. Krueger, An infrared and circular dichroism combinedapproach to the analysis of protein secondary structure, Anal. Biochem.199 (1991)61–67.
[15] N. Sreerama, R.W. Woody, A self-consistent method for the analysis of proteinsecondary structure from circular-dichroism, Anal. Biochem. 209 (1993) 32–44.
[16] N. Sreerama, S.Y. Venyaminov, R.W. Woody, Estimation of protein secondarystructure from circular dichroism spectra: inclusion of denatured proteins withnative proteins in the analysis, Anal. Biochem. 287 (2000) 243–251.
[17] N. Sreerama, R.W. Woody, Estimation of protein secondary structure from circulardichroism spectra: comparison of CONTIN, SELCON, and CDSSTR methods with anexpanded reference set, Anal. Biochem. 287 (2000) 252–260.
[18] B.A. Wallace, J.G. Lees, A.J.W. Orry, A. Lobley, R.W. Janes, Analyses of circulardichroism spectra of membrane proteins, Prot. Sci. 12 (2003) 875–884.
[19] V. Raussens, J.M. Ruysschaert, E. Goormaghtigh, Protein concentration is not anabsolute prerequisite for the determination of secondary structure from circulardichroism spectra: a new scaling method, Anal. Biochem. 319 (2003) 114–121.
[20] J.L. Arrondo, I. Etxabe, U. Dornberger, F.M. Goni, Probing protein conformation byinfrared spectroscopy, Biochem. Soc. Trans. 22 (1994) 380S.
[21] B.I. Baello, P. Pancoska, T.A. Keiderling, Enhanced prediction accuracy of proteinsecondary structure using hydrogen exchange Fourier transform infrared spectro-scopy, Anal. Biochem. 280 (2000) 46–57.
[22] D.M. Byler, H. Susi, Examination of the secondary structure of proteins bydeconvolved FTIR spectra, Biopolymers 25 (1986) 469–487.
[23] F. Dousseau, M. Pezolet, Determination of the secondary structure content ofproteins in aqueous solutions from their amide I and amide II infrared bands.Comparison between classical and partial least-squaresmethods, Biochemistry 29(1990) 8771–8779.
[24] P.I. Haris, D. Chapman, G. Benga, A Fourier-transform infrared spectroscopicinvestigation of the hydrogen–deuterium exchange and secondary structure of the28-kDa channel-forming integral membrane protein (CHIP28), Eur. J. Biochem.233 (1995) 659–664.
[25] J.A. Hering, P.R. Innocent, P.I. Haris, An alternative method for rapid quantifica-tion of protein secondary structure from FTIR spectra using neural networks,Spectroscopy-An Int. J. 16 (2002) 53–69.
[26] M. Jackson, H.H. Mantsch, The use and misuse of FTIR spectroscopy in the deter-mination of protein structure, Crit. Rev. Biochem. Mol. Biol. 30 (1995) 95–120.
[27] D.C. Lee, P.I. Haris, D. Chapman, R.C. Mitchell, Determination of protein secon-dary structure using factor analysis of infrared spectra, Biochemistry 29 (1990)9185–9193.
[28] S. Navea, R. Tauler, A. de Juan, Application of the local regression method intervalpartial least-squares to the elucidation of protein secondary structure, Anal.Biochem. 336 (2005) 231–242.
[29] K. Rahmelow, W. Hubner, Secondary structure determination of proteins inaqueous solution by infrared spectroscopy: a comparison of multivariate dataanalysis methods, Anal. Biochem 241 (1996) 5–13.
[30] W.K. Surewicz, H.H. Mantsch, New insight into protein secondary structure fromresolution-enhanced infrared spectra, Biochim. Biophys. Acta 952 (1988) 115–130.
[31] G. Vedantham, H.G. Sparks, S.U. Sane, S. Tzannis, T.M. Przybycien, A holisticapproach for protein secondary structure estimation from infrared spectra in H(2)O solutions, Anal. Biochem. 285 (2000) 33–49.
[32] S. Navea, R. Tauler, E. Goormaghtigh, A. de Juan, Chemometric tools for classi-fication and elucidation of protein secondary structure from infrared and circular
dichroism spectroscopic measurements, Proteins-Struct. Funct. Bioinformatics 63(2006) 527–541.
[33] V. Cabiaux, R. Brasseur, R.Wattiez, P. Falmagne, J.M. Ruysschaert, E. Goormaghtigh,Secondary structure of diphtheria toxin and its fragments interacting with acidicliposomes studied by polarized infrared spectroscopy, J. Biol. Chem. 264 (1989)4928–4938.
[34] E. Goormaghtigh, V. Cabiaux, J.M. Ruysschaert, Secondary structure and dosage ofsoluble and membrane proteins by attenuated total reflection Fourier-transforminfrared spectroscopy on hydrated films, Eur. J. Biochem. 193 (1990) 409–420.
[35] E. Goormaghtigh, J.M. Ruysschaert, V. Raussens, Evaluation of the informationcontent in infrared spectra for protein secondary structure determination,Biophys. J. 90 (2006) 2946–2957.
[36] T.L.C. Jansen, J. Knoester, Two-dimensional infrared population transfer spec-troscopy for enhancing structural markers of proteins, Biophys. J. 94 (2008)1818–1825.
[37] A. Barth, Infrared spectroscopy of proteins, Biochim. Biophys. Acta 1767 (2007)1073–1101.
[38] E. Goormaghtigh, V. Raussens, J.M. Ruysschaert, Attenuated total reflectioninfrared spectroscopy of proteins and lipids in biological membranes, Biochim.Biophys. Acta 1422 (1999) 105–185.
[39] C.A. Orengo, A.D. Michie, S. Jones, D.T. Jones, M.B. Swindells, J.M. Thornton,CATH - a hierarchic classification of protein domain structures, Structure 5(1997) 1093–1108.
[40] K.A. Oberg, J.M. Ruysschaert, E. Goormaghtigh, Rationally selected basis proteins:a new approach to selecting proteins for spectroscopic secondary structureanalysis, Prot. Sci. 12 (2003) 2015–2031.
[41] K.A. Oberg, J.M. Ruysschaert, E. Goormaghtigh, The optimization of proteinsecondary structure determination with infrared and CD spectra, Eur. J. Biochem.271 (2004) 2937–2948.
[42] H.H. de-Jongh, E. Goormaghtigh, J.A. Killian, Analysis of circular dichroism spectraof oriented protein-lipid complexes: toward a general application, Biochemistry33 (1994) 14521–14528.
[43] S. Devouge, J. Conti, A. Goldsztein, E. Gosselin, A. Brans, M. Voué, J. De Coninck, F.Homblé, E. Goormaghtigh, J. Marchand-Brynaert, Surface functionalization ofgermanium ATR devices for use in FTIR-biosensors, J. Colloid Interface Sci. in press(2008).
[44] A. Goldzstein, A. Aamouche, F. Homblé, M. Voué, J. Conti, J. De Coninck, S. Devouge,J. Marchand-Brynaert, E. Goormaghtigh, Ligand-receptor interactions in complexmedia: a new type of biosensors for the detection of coagulation factor VIII,Biosens Bioelectron (2008) in press.
[45] C. Vigano, J.M. Ruyssehaert, E. Goormaghtigh, Sensor applications of attenuatedtotal reflection infrared spectroscopy, Talanta 65 (2005) 1132–1142.
[46] M. Voue, E. Goormaghtigh, F. Homble, J. Marchand-Brynaert, J. Conti, S. Devouge, J.De Coninck, Biochemical interaction analysis on ATR devices: a wet chemistryapproach for surface functionalization, Langmuir 23 (2007) 949–955.
[47] J.E. Baenziger, J.P. Chew, Desensitization of the nicotinic acetylcholine receptormainly involves a structural change in solvent-accessible regions of the poly-peptide backbone, Biochemistry 36 (1997) 3617–3624.
[48] J.E. Baenziger, K.W. Miller, K.J. Rothschild, Incorporation of the nicotinic acetyl-choline receptor into planar multilamellar films: characterization by fluorescenceand Fourier transform infrared difference spectroscopy, Biophys. J. 61 (1992)983–992.
[49] N. Methot, C.N. Demers, J.E. Baenziger, Structure of both the ligand- and lipid-dependent channel-inactive states of the nicotinic acetylcholine receptor probedby FTIR spectroscopy and hydrogen exchange, Biochemistry 34 (1995)15142–15149.
[50] S.E. Ryan, C.N. Demers, J.P. Chew, J.E. Baenziger, Structural effects of neutral andanionic lipids on the nicotinic acetylcholine receptor. An infrared differencespectroscopy study, J. Biol. Chem. 271 (1996) 24590–24597.
[51] F. Scheirlinckx, V. Raussens, J.M. Ruysschaert, E. Goormaghtigh, Conformationalchanges in gastric H+/K+-ATPase monitored by difference Fourier-transforminfrared spectroscopy and hydrogen/deuterium exchange, Biochem. J. 382 (2004)121–129.
[52] F. Scheirlinckx, R. Buchet, J.M. Ruysschaert, E. Goormaghtigh, Monitoring ofsecondary and tertiary structure changes in the gastric H+/K+-ATPase byinfrared spectroscopy, Eur. J. Biochem. 268 (2001) 3644–3653.
[53] A. Harrison, F. Pearl, I. Sillitoe, T. Slidel, R. Mott, J. Thornton, C. Orengo, Recognizingthe fold of a protein structure, Bioinformatics 19 (2003) 1748–1759.
[54] C.A. Orengo, A.M. Martin, G. Hutchinson, S. Jones, D.T. Jones, A.D. Michie, M.B.Swindells, J.M. Thornton, Classifying a protein in the CATH database of domainstructures, Acta Crystallogr., D Biol. Crystallogr. 54 (1998) 1155–1167.
[55] W. Kabsch, S. Sander, Dictionary of protein secondary structure: pattern re-cognition of hydrogen-bonded and geometrical features, Biopolymers 22 (1983)2577–2637.
[56] E. Goormaghtigh, J.M. Ruysschaert, Subtraction of atmospheric water contributionin Fourier transform infrared spectroscopy of biological membranes and proteins.Spectrochim. Acta 50A (1994) 2137–2144.
[57] S.W. Bruun, A. Kohler, I. Adt, G.D. Sockalingum, M. Manfait, H. Martens, Correctingattenuated total reflection-Fourier transform infrared spectra for water vapor andcarbon dioxide, Appl. Spectrosc. 60 (2006) 1029–1039.
[58] E. Goormaghtigh, 2009. FTIR Data Processing and Analysis Tools. In Advances inBiomedical Spectroscopy. A. Barth, editor. in press
[59] J.R. Powell, F.M. Wasacz, R.J. Jakobsen, An algorithm for the reproducible spectralsubtraction of water from the FTIR spectra of proteins in dilute solutions andadsorbed monolayers. Appl. Spectrosc. 40 (1986) 339–344.
[60] H.H. de-Jongh, E. Goormaghtigh, J.M. Ruysschaert, The different molar absorptiv-

1343E. Goormaghtigh et al. / Biochimica et Biophysica Acta 1794 (2009) 1332–1343
ities of the secondary structure types in the amide I region: an attenuated totalreflection infrared study on globular proteins, Anal. Biochem. 242 (1996) 95–103.
[61] D. Chapman, J.C. Gomez Fernandez, F.M. Goni, M. Barnard, Difference infraredspectroscopy of aqueous model and biological membranes using an infrared datastation, Can J. Biochem. 2 (1980) 315–323.
[62] S.S. Vincent, C. Star, I.W. Levin, Infrared spectroscopic study of the pH-dependentsecondary structure of brain clathrin. Biochemistry 23 (1984) 625–631.
[63] A. Dong, P. Huang, W.S. Caughey, Protein secondary structures in water fromsecond-derivative amide I infrared spectra, Biochemistry 29 (1990) 3303–3308.
[64] P.I. Haris, D.C. Lee, D. Chapman, A Fourier transform infrared investigation of thestructural differences between ribonuclease A and ribonuclease S, Biochim.Biophys. Acta 874 (1986) 255–265.
[65] F. Dousseau, M. Therrien, M. Pezolet, Appl. Spectrosc. 40 (1989) 538–542.[66] V. Vasilescu, E. Katona, Deuteration as a tool in investigating the role of water in
the structure and function of excitable membranes, Methods Enzymol. 127 (1986)662–678.
[67] A. Barth, W. Mantele, ATP-induced phosphorylation of the sarcoplasmic reticulumCa2+ ATPase: molecular interpretation of infrared difference spectra, Biophys. J.75 (1998) 538–544.
[68] T. Heimburg, D. Marsh, Investigation of secondary and tertiary structural changesof cytochrome c in complexes with anionic lipids using amide hydrogen exchangemeasurements: an FTIR study, Biophys. J. 65 (1993) 2408–2417.
[69] V. Raussens, V. Narayanaswami, E. Goormaghtigh, R.O. Ryan, J.M. Ruysschaert,Hydrogen/deuterium exchange kinetics of apolipophorin-III in lipid-free andphospholipid-bound states. An analysis by Fourier transform infrared spectro-scopy, J. Biol. Chem. 271 (1996) 23089–23095.
[70] S. Meskers, J.M. Ruysschaert, E. Goormaghtigh, Hydrogen–deuterium exchange ofstreptavidin and its complex with biotin studied by 2D-Attenuated total reflectionFourier transform infrared spectroscopy, J. Am. Chem. Soc. 121 (1999) 5115–5122.
[71] E.A. Bryson, S.E. Rankin, E. Goormaghtigh, J.M. Ruysschaert, A. Watts, T.J. Pinheiro,Structure and dynamics of lipid-associated states of apocytochrome c, Eur. J.Biochem. 267 (2000) 1390–1396.
[72] V. Grimard, C. Vigano, A. Margolles, R. Wattiez, H.W. van-Veen, W.N. Konings, J.M.Ruysschaert, E. Goormaghtigh, Structure and dynamics of the membrane-embedded domain of LmrA investigated by coupling polarized ATR-FTIR spectro-scopy and (1)H/(2)H exchange, Biochemistry 40 (2001) 11876–11886.
[73] C. Vigano, E. Goormaghtigh, J.M. Ruysschaert, Detection of structural andfunctional asymmetries in P-glycoprotein by combining mutagenesis and H/Dexchange measurements, Chem. Phys. Lipids 122 (2003) 121–135.
[74] V. Raussens, J.M. Ruysschaert, E. Goormaghtigh, Analysis of H-1/H-2 exchangekinetics using model infrared spectra, Appl. Spectrosc. 58 (2004) 68–82.
[75] C. Vigano, M. Smeyers, V. Raussens, F. Scheirlinckx, J.M. Ruysschaert, E.Goormaghtigh, Hydrogen-deuterium exchange in membrane proteins monitoredby IR spectroscopy: a new tool to resolve protein structure and dynamics,Biopolymers 74 (2004) 19–26.
[76] J. Alegre-Cebollada, A.M. del Pozo, J.G. Gavilanes, E. Goormaghtigh, Infraredspectroscopy study on the conformational changes leading to pore formation ofthe toxin sticholysin II, Biophts. J. 93 (2007) 3191–3201.
[77] A. Krisko, G. Stjepanovic, G. Pifat, J.M. Ruysschaert, E. Goormaghtigh, Detection ofapolipoprotein B100 early conformational changes during oxidation, Biochim.Biophys. Acta (Biomembranes) 1768 (2007) 2923–2930.
[78] U.P. Fringeli, In situ infrared attenuated total reflection (IR ATR) spectroscopy: acomplementary analytical tool for drug design and drug delivery, Chimia 46(1992) 200–214.
[79] M.J. Citra, P.H. Axelsen, Determination of molecular order in supported lipidmembranes by internal reflection Fourier transform infrared spectroscopy,Biophys. J. 71 (1996) 1796–1805.
[80] W.H.J. Hansen, Opt. Soc. Am. 58 (1968) 380–390.[81] W.H. Hansen, Adv. Electrochem. Electrochem. Eng. 9 (1973) 1–60.[82] V. Cabiaux, B. Agerberth, J. Johansson, F. Homble, E. Goormaghtigh, J.M. Ruysschaert,
Secondary structure and membrane interaction of PR-39, a Pro+Arg-rich anti-bacterial peptide, Eur. J. Biochem. 224 (1994) 1019–1027.
[83] E. Goormaghtigh, V. Cabiaux, J.M. Ruysschaert, Determination of soluble andmembrane protein structure by Fourier transform infrared spectroscopy. II. Expe-rimental aspects, side chain structure, and H/D exchange, Subcell. Biochem. 23(1994) 363–403.
[84] Y.-H. Chen, J.T. Yang, K.H. Chau, Determination of the helix and beta formof proteins in aqueous solution by circular dichroism, Biochemistry 13 (1974)3350–3359.
[85] E. Goormaghtigh, V. Cabiaux, J.M. Ruysschaert, Determination of soluble andmembrane protein structure by Fourier transform infrared spectroscopy. III.Secondary structures, Subcell. Biochem. 23 (1994) 405–450.
[86] E. Goormaghtigh, V. Cabiaux, J.M. Ruysschaert, Determination of soluble andmembrane protein structure by Fourier transform infrared spectroscopy. I.Assignments and model compounds, Subcell. Biochem. 23 (1994) 329–362.
[87] M. Diem, S. Boydston-White, L. Chiriboga, Infrared spectroscopy of cells andtissues: shining light onto a novel subject, Appl. Spectrosc. 53 (1999) 148A–161A.
[88] A. Pacifico, L.A. Chiriboga, P. Lasch, M. Diem, Infrared spectroscopy of culturedcells — II. Spectra of exponentially growing, serum-deprived and confluent cells,Vibr. Spectrosc. 32 (2003) 107–115.
[89] K. Wehbe, R. Pinneau, M. Moenner, G. Deleris, C. Petibois, FT-IR spectral imaging ofblood vessels reveals protein secondary structure deviations induced by tumorgrowth, Anal. Bioanal. Chem. 392 (2008) 129–135.
[90] C. Petibois, G. Gouspillou, K. Wehbe, J.P. Delage, G. Deleris, Analysis of type Iand IV collagens by FT-IR spectroscopy and imaging for a molecular inves-tigation of skeletal muscle connective tissue, Anal. Bioanal. Chem. 386 (2006)1961–1966.
[91] C. Petibois, G. Deleris, Chemical mapping of tumor progression by FT-IR imaging:towards molecular histopathology, Trends Biotech. 24 (2006) 455–462.
[92] C. Petibois, B. Drogat, A. Bikfalvi, G. Deleris, M. Moenner, Histological mapping ofbiochemical changes in solid tumors by FT-IR spectral imaging, FEBS Lett. 581(2007) 5469–5474.
[93] R. Pribic, I.H. van Stokkum, D. Chapman, P.I. Haris, M. Bloemendal, Proteinsecondary structure from Fourier transform infrared and/or circular dichroismspectra, Anal. Biochem. 214 (1993) 366–378.
[94] J.E. Baenziger, K.W. Miller, M.P. McCarthy, K.J. Rothschild, Probing conformationalchanges in the nicotinic acetylcholine receptor by Fourier transform infrareddifference spectroscopy, Biophys. J. 62 (1992) 64–66.
[95] J.E. Baenziger, K.W. Miller, K.J. Rothschild, Fourier transform infrared diffe-rence spectroscopy of the nicotinic acetylcholine receptor: evidence for specificprotein structural changes upon desensitization, Biochemistry 32 (1993)5448–5454.


![[ATR] Harmony In Turkana: A Case Of Faith Suffix gg Faith Root](https://static.fdokumen.com/doc/165x107/6325a4ed852a7313b70e9908/atr-harmony-in-turkana-a-case-of-faith-suffix-gg-faith-root.jpg)