Application of ATR-far-infrared spectroscopy to the analysis of natural resins
11
ORIGINAL PAPER Application of ATR-far-infrared spectroscopy to the analysis of natural resins Silvia Prati & Giorgia Sciutto & Rocco Mazzeo & Cristian Torri & Daniele Fabbri Received: 28 July 2010 / Revised: 18 October 2010 / Accepted: 25 October 2010 / Published online: 11 November 2010 # Springer-Verlag 2010 Abstract This study proposes FTIR spectroscopy in the far- infrared region (FarIR) as an alternative method for the characterisation of natural resins. To this purpose, standards of natural resins belonging to four different categories (sesquiterpenic, i.e. elemi, shellac; diterpenic, i.e. colophony, Venice turpentine; diterpenic with polymerised components, i.e. copal, sandarac; triterpenic, i.e. mastic and dammar) used as paint varnishes have been analysed by FarIR spectroscopy in ATR mode. Discrimination between spectral data and repeat- ability of measurements have been magnified and verified using principal component analysis, in order to verify the effectiveness of the method in distinguishing the four resin categories. The same samples were analysed in the MidIR range, but the spectral differences between the different categories were not evident. Moreover, the method has been tested on historical samples from the painting “La Battaglia di Cialdiran” (sixteenth century) and from a gilded leather (seventeenth century). In the first case, FarIR spectroscopy allowed confirmation of the results obtained by analytical pyrolysis. In the latter, FarIR spectroscopy proved successfully, effective in the identification of the superficial resin layer that could not be detected with the bulk chromatographic analyses. Keywords Cultural heritage . ATR FIR spectroscopy . Natural resins . PCA Introduction In the past, tree and insect secretions have been extensively employed in art, as well as in conservation and preservation of art works, thanks to their useful chemical and physical behaviour, including water insolubility, adhesive and coating properties. Different natural resins were mainly used for decorative and varnish purposes since very ancient times for their excellent glasslike capability. A great number of recipes and preparation procedures are docu- mented in literature [1, 2]. Resins mixed with a drying oil were the earliest type of varnish blend, whereas spirit varnishes were introduced only in the sixteenth century. In addition, such biopolymers were mixed with different organic compounds and additives in order to obtain a suitable binding medium [3]. Resins are composed of complex mixtures of terpenoids derived by isoprene. They can be distinguished by their carbon atom numbers into sesqiterpenic (terpenic compounds with 15 carbon atoms), diterpenic (terpenic compounds with 20 carbon atoms) and triterpenic (terpenic compounds with 30 carbon atoms). Shellac is a sesquiterpenic resin secreted by an insect (Kerria lacca, Keriidae family, Hemiptera order) that infects host trees. The raw lac is scratched from branches and purified through crushing, sieving and water-washing pro- cedures. It is mainly composed of polyesters of oxy acids, which can be dissolved in alcohol, low percentages of waxy substances and low molecular polymers derived from poly hydroxyl acids. Elemi is a malleable material containing a considerable amount of liquid sesquiterpenes and a Published in the special issue Analytical Chemistry for Cultural Heritage with Guest Editors Rocco Mazzeo, Silvia Prati, and Aldo Roda. S. Prati : G. Sciutto : R. Mazzeo (*) Microchemistry and Microscopy Art Diagnostic Laboratory, University of Bologna, Via Guaccimanni 42, 48123, Ravenna, Italy e-mail: [email protected] C. Torri : D. Fabbri University of Bologna, CIRSA, via S. Alberto 163, 48123, Ravenna, Italy Anal Bioanal Chem (2011) 399:3081–3091 DOI 10.1007/s00216-010-4388-y
-
Upload
independent -
Category
Documents
-
view
3 -
download
0
Transcript of Application of ATR-far-infrared spectroscopy to the analysis of natural resins

ORIGINAL PAPER
Application of ATR-far-infrared spectroscopyto the analysis of natural resins
Silvia Prati & Giorgia Sciutto & Rocco Mazzeo &
Cristian Torri & Daniele Fabbri
Received: 28 July 2010 /Revised: 18 October 2010 /Accepted: 25 October 2010 /Published online: 11 November 2010# Springer-Verlag 2010
Abstract This study proposes FTIR spectroscopy in the far-infrared region (FarIR) as an alternative method for thecharacterisation of natural resins. To this purpose, standardsof natural resins belonging to four different categories(sesquiterpenic, i.e. elemi, shellac; diterpenic, i.e. colophony,Venice turpentine; diterpenic with polymerised components,i.e. copal, sandarac; triterpenic, i.e. mastic and dammar) used aspaint varnishes have been analysed by FarIR spectroscopy inATR mode. Discrimination between spectral data and repeat-ability of measurements have been magnified and verifiedusing principal component analysis, in order to verify theeffectiveness of the method in distinguishing the four resincategories. The same samples were analysed in the MidIRrange, but the spectral differences between the differentcategories were not evident. Moreover, the method has beentested on historical samples from the painting “La Battaglia diCialdiran” (sixteenth century) and from a gilded leather(seventeenth century). In the first case, FarIR spectroscopyallowed confirmation of the results obtained by analyticalpyrolysis. In the latter, FarIR spectroscopy proved successfully,effective in the identification of the superficial resin layer thatcould not be detected with the bulk chromatographic analyses.
Keywords Cultural heritage . ATR FIR spectroscopy .
Natural resins . PCA
Introduction
In the past, tree and insect secretions have been extensivelyemployed in art, as well as in conservation and preservationof art works, thanks to their useful chemical and physicalbehaviour, including water insolubility, adhesive andcoating properties. Different natural resins were mainlyused for decorative and varnish purposes since very ancienttimes for their excellent glasslike capability. A greatnumber of recipes and preparation procedures are docu-mented in literature [1, 2]. Resins mixed with a drying oilwere the earliest type of varnish blend, whereas spiritvarnishes were introduced only in the sixteenth century. Inaddition, such biopolymers were mixed with differentorganic compounds and additives in order to obtain asuitable binding medium [3].
Resins are composed of complex mixtures of terpenoidsderived by isoprene. They can be distinguished by theircarbon atom numbers into sesqiterpenic (terpenic compoundswith 15 carbon atoms), diterpenic (terpenic compounds with20 carbon atoms) and triterpenic (terpenic compounds with 30carbon atoms).
Shellac is a sesquiterpenic resin secreted by an insect(Kerria lacca, Keriidae family, Hemiptera order) that infectshost trees. The raw lac is scratched from branches andpurified through crushing, sieving and water-washing pro-cedures. It is mainly composed of polyesters of oxy acids,which can be dissolved in alcohol, low percentages of waxysubstances and low molecular polymers derived from polyhydroxyl acids. Elemi is a malleable material containinga considerable amount of liquid sesquiterpenes and a
Published in the special issue Analytical Chemistry for Cultural Heritagewith Guest Editors Rocco Mazzeo, Silvia Prati, and Aldo Roda.
S. Prati :G. Sciutto : R. Mazzeo (*)Microchemistry and Microscopy Art Diagnostic Laboratory,University of Bologna,Via Guaccimanni 42,48123, Ravenna, Italye-mail: [email protected]
C. Torri :D. FabbriUniversity of Bologna, CIRSA,via S. Alberto 163,48123, Ravenna, Italy
Anal Bioanal Chem (2011) 399:3081–3091DOI 10.1007/s00216-010-4388-y

fraction of triterpenic components. The most common typeof elemi is obtained from species of the Bursaceae family,growing in the Philippines. Diterpenic resins belong mainlyto the Coniferae class (Pinaceae, Cupressaceae, Auracaria-ceae). Pinaceae resins (i.e. colophony, Venice turpentine,Strasbourg turpentine) are characterised mainly by thepresence of abietane and pimarane acids. Cupressaceae (i.e.sandarac) and Auracariaceae (i.e. Manila copal) are composedby labdane acids, in particular by a polymerised fractionderived by communic acids. Triterpenic resins (i.e. dammarand mastic) contain C30 isoprene derivatives showingdifferent basic skeletons, mostly tri- or pentacyclic. Monoric,oleononic, masticadienonic and dammararolic acids are someof the most important triterpenoid components. Mastic can befound onmanyMediterranean coasts since it is secreted by thePistacea lentiscus shrub, while dammar is derived from treesof the Dipterocarpaceae family, growing in the Far East [3].
Several analytical techniques have been so far employedfor the identification of resins and the characterisation oftheir degradation pathway. In particular, GC/MS [4–6] canprovide specific information on molecular composition,biological source and degradation effects. However, it is adestructive technique, not allowing the possibility to repeatthe analysis and confirm the result.
Py-GC/MS has been widely employed for the character-isation of natural resins [6–10]. This technique is actually lesstime consuming than GC/MS because no sample pre-treatment is required. It also allows to overcome the problemrelated to the solubility decrease in long time aged resins.
In the last decades, vibrational spectroscopic methods(infrared and Raman) have been optimised to overcome thedrawbacks related to bulk analyses, developing portableinstruments (for in situ analyses) and microscope-basedtechniques (for stratigraphical investigations). In particular,infrared spectroscopy has been widely used thanks to itsversatility and ability to provide information on bothorganic and inorganic materials [11]. Since its first intro-duction, IR spectroscopy has been applied to the examinationof paintings and artefacts mainly in the MidIR range 4,000–600 cm−1 [12]. When micro-sampling accessories forFourier-transform infrared (FTIR) spectroscopy were intro-duced in the early 1980s, the following development ofFTIR microscopy became an essential tool in the micro-destructive analysis of small samples [13]. Moreover, therecent introduction of mapping and imaging equipmentsallows to collect a large number of FTIR spectra on asurface, producing a distribution map of the identifiedcompounds. FTIR spectroscopy can also be used for non-destructive analyses in form of portable instrument. In recenttimes, fibre optics have been employed for the developmentof portable instruments both in the VIS–NearIR and in theMidIR range [14, 15]. Even though FTIR spectroscopyappears to be particularly flexible, only IR-active compounds
can be detected. Moreover, the characterisation of theorganic substances is a difficult task and only the main classcan often be distinguished.
In the field of resinous materials, for instance, FTIRtechniques are mainly helpful in recognising their presence,thanks to the presence of both the acid stretching band ataround 1,690 cm−1 and the ester triplet due to C–O stretchingvibrations at around 1,230, 1,160, and 1,090 cm−1 (charac-teristic also of drying oils) [16, 17]. Even though thedifferent resins show some particular features [18], FTIR ismainly applied as a preliminary and non-destructive tech-nique to detect the presence of resinous materials. Thesubsequent identification of the resins may be accomplishedby other techniques, such as GC/MS [19]. FTIR spectroscopyhas also been employed to study the ageing effects on naturalresins [20, 21], which leads to oxidation cross linkingreactions or hydrolysis, depending on the resin typology.
Raman spectroscopy and microscopy have been succes-sively employed for resins characterisation [22–31]. Inparticular, high wavelengths laser excitation (i.e., 1,064,780, 785 nm) has been applied to reduce the fluorescenceeffects. Despite inherently weaker Raman effect in the near-infrared region (signal is almost 350 times lower thanspectra obtained by using a 250 nm laser, because of theinverse dependence between molecular scattering intensityand excitation wavelength), the strong reduction of fluo-rescence effects allows the determination of different resinspecimens [22, 26]. A specific protocol based on theinterpretation of the FT-Raman spectra has been developedfor the discrimination of diterpenoid and triterpenoid resins[22], considering ageing processes such as oxidation andhydrolysis. The discrimination protocol takes into accountthe entire spectrum with particular attention to bands fromabout 3,000 to 500 cm−1. The region from 1,200 to200 cm−1 is typical of the vibrations of v(CC), ρ(CH),δ(CCH) and δ (CCO) groups. However, the comparison ofresin samples in this region may be difficult because of theinherent weakness of the spectra [24]. Moreover, in somecases, the resins specimen shows fluorescence emissionseven in these conditions, which may invalidate their correctclassification [22].
In order to avoid a sensible reduction of the Ramansignal due to the use of FT lasers, Lau et al. have proposedto employ SERS Raman spectroscopy [31] with theapplication, on a metal surface ad hoc prepared, of a dropof a solution containing the extracted resin.
This research is aimed at evaluating the use of FTIRspectroscopy in the far-infrared region (FarIR) to proposean alternative and complementary technique for thecharacterisation of natural resins. FarIR spectroscopy iswidely employed in different fields, such as astrophysics,cation exchange and interactions in ceramics, as well aslattice vibrations in the field of polymer crystallisation.
3082 S. Prati et al.

Since 1969, several studies have highlighted the analyticalpotential of FarIR spectroscopy for the investigation ofminerals in the 200–50 cm−1 region [32]. Furthermore,recent studies document the application of FarIR spectros-copy in both transmission [33] and attenuated total
reflectance (ATR) modes [34–37] as a valid alternativemethod for the characterization of the compounds inactivein the MidIR (different inorganic pigments and corrosionproducts). As far as the authors know, the application ofFTIR spectroscopy in the FarIR region for the investigation
Table 1 Natural resins signals in the FarIR region obtained in ATR
Elemi Shellac Colophony Venice turpentine Sandarac Copal Dammar Mastic Approx assignement
696 (m) 695 (m) 692 (w)
685 (m)
675 (m)
658 (s) 652 (s) 658 (m)
663 (s) υ CC 25
646 (m) 646 (m) δ CCC 25
638 (w, sh) 638 (m) δ CCC 25
611 (w) 610 (w, sh) 617 (m)
601 (w)
590 (m)
581 (m) 583 (m) 580 (s) 583 (s)
572 (m)
562 (m) 561 (m, sh) 560 (m, sh) 556 (m) 563 (m) δ CCO 31
540 (s) 538 (m) δ CCO 25
528 (m) 530 (s) 526 (m) δ CCO, δ CCC 24
520 (m) 520 (m)
518 (s)
498 (m, sh) 491 (w)
478 (w) 475 (w) 471 (m) δ CCC 27
460 (m) 460 (m) 458 (m) δ CO 31
449 (w) 449 (m) 447 (m) 451 (w) δ CCO 26,27
433 (m) 431 (w)
417 (m) 422 (w)
411 (m)
397 (s) 395 (s)
393 (m) 387 (m)
367 (m) 363 (m, sh) 362 (m, sh) δ CCC 31
356 (w) 351 (m)
345 (m) 347 (w)
340 (m) 341 (w) 338 (s)
313 (w) 310 (w) 318 (w) τ (CCC), τ (CCO) 24
294 (m) 195 (w) 290 (m) 286 (m)
269 (w)
265 (w) 265 (m) 260 (m) 265(m) τ (CH3)26, 27
253 (w) 252 (m)
243 (m)
229 (m)
212 (m) 212 (m)
199 (m) 199 (w)
189 (m)
169 (w) 169 (m) 170 (m)
s strong, m medium, w weak, sh shoulder
ATR-FarIR spectroscopy for the analysis of natural resins 3083

of organic substances has not yet been carried out. To thispurpose, standards of natural resins used as paint varnisheshave been analysed by FarIR spectroscopy in ATR mode,obtaining promising results. Moreover, the discriminationbetween spectral data was magnified and verified usingprincipal component analysis (PCA).
The ability of the method for identification purposesin real matrices was tested by the analysis of historicalsamples. The results were compared to those obtainedfrom a complementary methodology based on analyticalpyrolysis.
Experimental
Materials
All the standard materials (see Table 1) were purchasedfrom Kremer. Solid resins were analysed as samples in apowder form, collected from the bulk specimen. Veniceturpentine (which is in the liquid form) was analysed onlyafter preparing a resin film obtained by its solubilisation inethyl alcohol and application on a glass slide support.
Two historical samples have been examined. One (BP)was collected from a yellow area of the “La Battaglia diCialdiran”, an oil painting on canvas dated back to thesixteenth century, the work of an unknown artist conservedin the Regional Museum of Mirto Palace, Palermo, Italy.
Fig. 1 ATR Smart Orbit™ mounted on a Thermo Nicolet Nexus 5700spectrometer
Fig. 2 MidIR spectra obtained in ATR of a elemi, b shellac, c colophony, d Venice turpentine, e sandarac, f copal, g dammar, h mastic
3084 S. Prati et al.
The second (PMB7) was a gilded leather sampled from apainted wall hanging dated to the seventeenth century.
FarIR spectroscopy
A Thermo Nicolet Nexus 5,700 spectrometer, using asolid-substrate beamsplitter operating in the FarIR regionof 700–90 cm−1, was employed. A Parker/Balston self-contained purge gas generator was used to minimiseinterference bands generated from ambient moisture.During the collection of spectra the outlet pressure wasset at 30 psi/bar, while the outlet flow control at 9(dimensionless).
The ATR spectra were registered by a diamond ATRSmart Orbit™ accessory (from Thermo Optec) both in theMidIR (DTGS detector with a KBr window) and in theFarIR (DTGS detector with a polyethylene window) region(Fig. 1). The diamond crystal has a refractive index of 2.4,with a single bouncing refractive infrared beam at 45° angleof incidence. Analyses were performed on samples in apowder form by grinding the bulk resins, or in small
fragments after sampling thin films from resin. Measure-ments were carried out at a spectral resolution of 4 cm−1,with a physical mirror rate of 0.6329 cm s−1. Approximately,less than 0.5 mg of material was required for eachmeasurement. Several replicate spectra were collected foreach resin specimen.
The historical samples were analysed placing theexternal surface of the fragments on the macro ATR crystal,simply applying a pressure to optimise the contact.
Chemometric analysis
Spectral data were processed by PCA and employing thechemometric package V-PARVUS. Matrix dataset was com-posed with intensity values of peaks as variables (columns)and spectra in the range 670–150 cm−1 as objects (rows).Standard normal variate (SNV) transformation and columncentering were applied as a row pre-treatment on the matrixdataset. SNV was specially applied in order to remove slopevariation and to correct both baseline shifts and globalintensity variations [38].
Fig. 3 FarIR spectra obtained in ATR of a elemi, b shellac, c colophony, d Venice turpentine, e sandarac, f copal, g dammar, h mastic
ATR-FarIR spectroscopy for the analysis of natural resins 3085

Analytical pyrolysis
The historical samples BP and PBM7 were analysed by off-line pyrolysis with a CDS 1,000 Pyroprobe (Platinumfilament coil) following the procedure proposed by Torriand Fabbri [39]. Shortly, samples were pyrolysed at 700 °Cfor 60 s, evolved pyrolysis products were sampled by solid-phase microextraction with a carboxen-PDMS fibre. Thefibre was inserted into the injector port kept at 280 °C of a6850 Agilent HP gas chromatograph connected to a 5975Agilent HP quadrupole mass spectrometer. Analytes wereseparated by a HP-5MS fused-silica capillary column(stationary phase poly[5% diphenyl/95% dimethyl]silox-ane, 30 m, 0.25 mm i.d., 0.25 μm film thickness) usinghelium as carrier gas. Mass spectra were recorded underelectron ionisation (70 eV) at a frequency of 1 scan s−1
within the 12–450 m/z range. The following thermalprogramme was used: 35 °C for 5 min, then 10 °C/minuntil 310 °C followed by a column cleaning at 310 °C for3 min. GC/MS traces of real samples were compared tothose derived from analytical pyrolysis of standard resins.
Results and discussions
The use of a macro diamond accessory had three mainadvantages: no sample manipulation was required; theamount of sample was reduced, according with conserva-tion purposes; the varnish applied as external layer onhistorical samples could be directly analysed just position-ing the external sample surface onto the ATR crystal.
Standard resins
The different resin specimens have been analysed both inthe MidIR and in the FarIR region. The ATR-MidIR spectra(Fig. 2) showed extremely similar profiles. In fact it isdifficult to identify not only the different resins but alsomore generic categories such as: (a) sesquiterpenic resins,(b) diterpenic resins containing abietane compounds, (c)diterpenic resins containing polymerised communic acid,(d) triterpenic resins.
On the other hand, FarIR analyses allowed the identifi-cation of specific bands for each investigated category asshown in Table 1.
Elemi and shellac show characteristic FarIR spectra(Fig. 3a–b) allowing a clear distinction between them.Some similarities, in terms of frequency values, can beobserved comparing the elemi spectrum with the mastic anddammar ones, even though the resins specimens can beeasily distinguished (Table 1).
Diterpenic resins have a common peak at around395 cm−1 but they also show particular features allowing
to distinguish Pinacea resins, such as colophony and Veniceturpentine (Fig. 3c–d), from diterpenic resins containingpolymerised communic acid, such as sandarac and copal(Fig. 3e–f). Colophony and Venice turpentine are charac-terised by the presence of peaks at around 540 and475 cm−1, while sandarac and copal have peaks at 520and 260 cm−1 (Fig. 3c–f).
Triterpenic resins show significant similarities in all thecollected spectra having common features, such as the peakat about 580 cm−1. Some differences can be noticedbetween the two triterpenic resins which can be used todiscriminate them, such as the band at 658, 638, and351 cm−1 typical of dammar and bands at 646 and338 cm−1 mainly present in mastic resin (Fig. 3g–h).
Previous studies on the characterization of natural resinsperformed by Raman spectroscopy allowed the approxi-mate assignment of frequency values in the vibrationalmode [22–31]. A comparison with the data reported inliterature was made to identify possible transitions, whichare active both in infrared and Raman spectroscopy. FarIRspectra are indeed different from Raman ones, but there arecommon absorptions. In particular the following vibrations υCC 25, δ CCC 24–25,27, δ CCO 23–27, 31, δ CCC 24, 31, δ CO 31,τ (CCC)24, τ (CCO) 24 and τ (CH3)
26, 27 have beententatively assigned in Table 1. The presence of vibrationalmodes active only in the FarIR region further confirms thatthe two techniques may complement each other in thecharacterisation of natural resins.
Fig. 4 Cross-section photomicrographs under a visible and b UVlight of the KBr embedded BP cross-section (layer 2 varnish; layer 1pigmented layer composed by yellow ochre, lead white, calcite,siccative oil; layer 0 preparation composed by gypsum)
3086 S. Prati et al.

Historical samples
The cross-section photomicrographs of the BP sampleshown in Fig. 4 allows to clearly identify the presence ofan organic protective applied as external layer. This may be
revealed by the strong whitish fluorescence visible underUV light, which is not influenced by the pollution of theembedding material because the sample was embedded inKBr [40].
Figure 5a shows the BP spectrum in the FarIR regionobtained in macro ATR on the external surface(corresponding to layer 2 in Fig. 4). From the MidIRspectrum (not reported) the carboxylic acids band(1,716 cm−1) suggests the presence of a natural resin, butits identification resulted rather difficult. The FarIR spec-trum was more informative and when comparing it with thedammar profile (Fig. 5b) different analogies can be noticedin the position and shape of the bands (i.e. bands at 638,580, 530, 458, 351 cm−1). The occurrence of dammar inthis sample suggested by FarIR data was supported byanalytical pyrolysis. Chromatograms in full scan obtainedfrom off-line pyrolysis of sample BP and dammar areshown in Fig. 6a and b, respectively. A cluster of peakswith retention times and mass spectra corresponding tothose of dehydrogenated sesquiterpenes C15H22 specific of
Fig. 6 GC/MS of pyrolysatefrom a sample BP and b dam-mar resin; mass chromatogramsat m/z 159 expanded in elutionregion of dammar markers(C15H22 bicyclic sesquiterpe-noids) of c sample BP and ddammar resin, e mass spectrumof the GC peak at 19.3 mintentatively identified ascalamenene
Fig. 5 FarIR spectra obtained in ATR of a BP sample, b dammar (D)c yellow ochre (YO): C calcium carbonate
ATR-FarIR spectroscopy for the analysis of natural resins 3087
dammar [8] were revealed in both samples. In particular,the mass chromatograms at m/z 159 in Fig. 6c and d show apeak at 19.3 min tentatively identified from its massspectrum (Fig. 6e) as calamenene (4-isopropyl-1,6-dimeth-yl-1,2,3,4-tetrahydro-naphthalene), a distinctive marker ofdammar resin [41].
The interpretation of FarIR spectrum was complicatedby signals arising from the matrix, in particular, silicate-based pigments (Fig. 5c), such as a yellow earth (595 and397 cm−1), and calcium carbonate (307 cm−1) [36]. Thesecompounds derived from the underlying yellow layer (layer1 in Fig. 4) after the sample squeezing due to the contactwith the ATR crystal, as it was confirmed by micro FTIR inATR in the MidIR range directly on the stratigraphy.
This represents a limitation of the method because inorder to obtain meaningful spectra, it is necessary to applypressure which might partially disaggregate the sample.Moreover, strong absorbent inorganic salts may overlapwith the signal arising from the resins. In this case, the resinlayer, as shown in the stratigraphy (Fig. 4b) is homoge-neously present and, although very thin, its spectrum canstill be detected. To overcome this problem, a new systemis being developed, aimed at analysing small particles,sampled under the stereomicroscope from the externallayer, in transmission mode using an IR condenser.
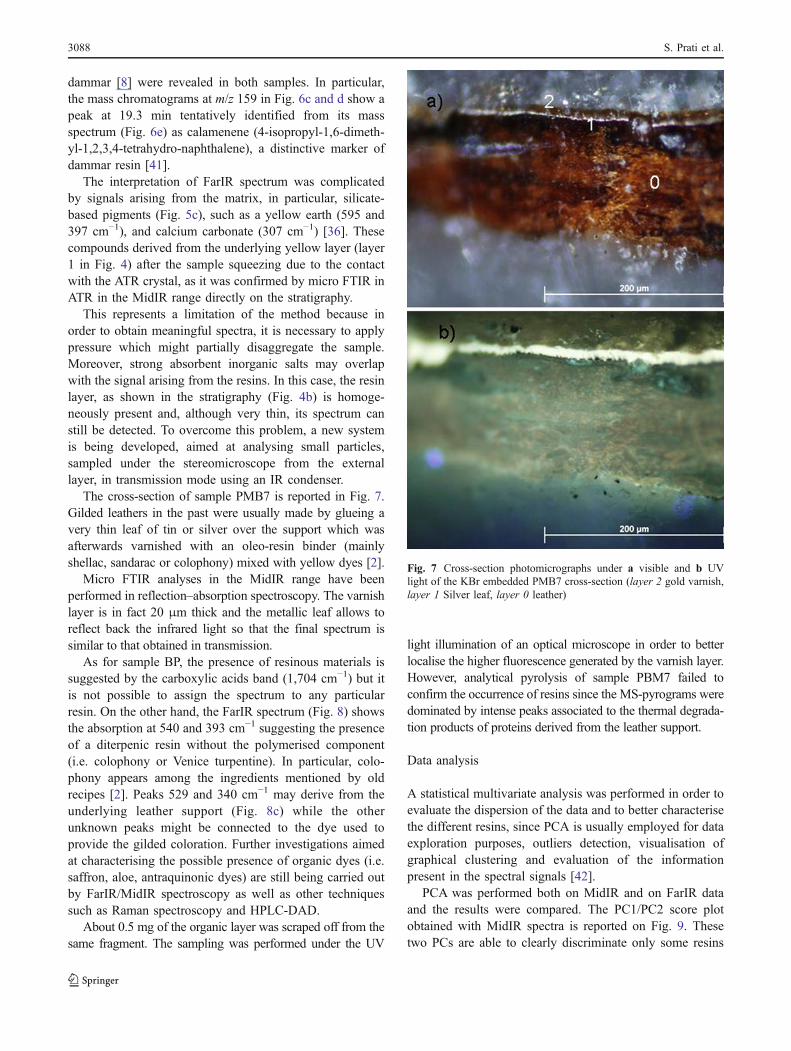
The cross-section of sample PMB7 is reported in Fig. 7.Gilded leathers in the past were usually made by glueing avery thin leaf of tin or silver over the support which wasafterwards varnished with an oleo-resin binder (mainlyshellac, sandarac or colophony) mixed with yellow dyes [2].
Micro FTIR analyses in the MidIR range have beenperformed in reflection–absorption spectroscopy. The varnishlayer is in fact 20 μm thick and the metallic leaf allows toreflect back the infrared light so that the final spectrum issimilar to that obtained in transmission.
As for sample BP, the presence of resinous materials issuggested by the carboxylic acids band (1,704 cm−1) but itis not possible to assign the spectrum to any particularresin. On the other hand, the FarIR spectrum (Fig. 8) showsthe absorption at 540 and 393 cm−1 suggesting the presenceof a diterpenic resin without the polymerised component(i.e. colophony or Venice turpentine). In particular, colo-phony appears among the ingredients mentioned by oldrecipes [2]. Peaks 529 and 340 cm−1 may derive from theunderlying leather support (Fig. 8c) while the otherunknown peaks might be connected to the dye used toprovide the gilded coloration. Further investigations aimedat characterising the possible presence of organic dyes (i.e.saffron, aloe, antraquinonic dyes) are still being carried outby FarIR/MidIR spectroscopy as well as other techniquessuch as Raman spectroscopy and HPLC-DAD.
About 0.5 mg of the organic layer was scraped off from thesame fragment. The sampling was performed under the UV
light illumination of an optical microscope in order to betterlocalise the higher fluorescence generated by the varnish layer.However, analytical pyrolysis of sample PBM7 failed toconfirm the occurrence of resins since the MS-pyrograms weredominated by intense peaks associated to the thermal degrada-tion products of proteins derived from the leather support.
Data analysis
A statistical multivariate analysis was performed in order toevaluate the dispersion of the data and to better characterisethe different resins, since PCA is usually employed for dataexploration purposes, outliers detection, visualisation ofgraphical clustering and evaluation of the informationpresent in the spectral signals [42].
PCA was performed both on MidIR and on FarIR dataand the results were compared. The PC1/PC2 score plotobtained with MidIR spectra is reported on Fig. 9. Thesetwo PCs are able to clearly discriminate only some resins
Fig. 7 Cross-section photomicrographs under a visible and b UVlight of the KBr embedded PMB7 cross-section (layer 2 gold varnish,layer 1 Silver leaf, layer 0 leather)
3088 S. Prati et al.

such as dammar, mastic, shellac and elemi, while are noteffective for the diterpenic resins with or without thepolymerised fraction. Moreover, the resins dispersionbetween the replicated spectra is in some cases comparablewith the dispersion between different standards (i.e. masticand Venice turpentine dispersions). Furthermore, PCA isnot able to correctly identify which resin is present in thehistorical sample BP. Indeed, the two available replicatesare positioned in a region far from all the analysed resins.This may suggest that the MidIR region is more influenced
by the presence of other specimens present in the historicalsample, which affect the PCA results.
PC1/PC2 score plot obtained with FarIR spectra isreported in Fig. 10. These two PCs are able to well-identify four clustered groups, thanks to the lower variabil-ity of replicated spectra compared with the dispersionbetween the different standards. It can be noted that the fourdescribed categories are clearly separated. The statisticalmultivariate approach allowed to distinguish resins belong-ing to the same categories (i.e. mastic from dammar, shellacfrom elemi). That was not true when considering diterpenicresins and diterpenic with the polymerised fraction:although copal and sandarac appeared separated, thespectral profiles resulted extremely similar and the differ-ences might become even less evident when analysinghistorical/aged samples.
PCA confirmed the interpretation also in the case of thehistorical sample BP. Even though the FarIR spectra containother compounds, the four replicates are positioned in thedammar region. One replicate is a bit shifted, probablybecause of a greater influence by the other compounds arisingfor the underlying layer. It was not possible to apply PCA onsample PMB7 because the small fragment available allowedjust one FarIR and Py-GC/MS analysis.
The Fisher weights (FW) [43, 44] were calculated inorder to provide an estimation of the discriminative abilityof each PC in terms of separation between two categories(Tables 2 and 3).
For MidIR data, the FW (Table 2) were generally lowerthan those obtained with the FarIR spectra (Table 3). Thissuggests that the resins are less discriminated. It isinteresting to notice the high FW values calculated betweenthe BP classes and all the resin classes, suggesting that, in
Fig. 10 PC1/PC2 plot resulting from PCA of the resins FarIR spectra(minimum eight replicates for standards, four replicates for the BPsample); BP historical sample, CF colophony, CP copal, D dammar, Eelemi, M mastic, SA sandarac, SH shellac, VE Venice turpentine
Fig. 9 PC1/PC2 plot resulting from PCA of the resins MidIR spectra(minimum nine replicates for standards, two replicates for the BPsample); BP historical sample, CF colophony, CP copal, D dammar, Eelemi, M mastic, SA sandarac, SH shellac, VE Venice turpentine
Fig. 8 FarIR spectra obtained in ATR of a PMB7 sample, bcolophony c leather (DIT diterpenic resin without a polymerisedcomponent; L leather)
ATR-FarIR spectroscopy for the analysis of natural resins 3089

this case, PCA is unable to identify the historical samplecomposition.
Fisher Weights referred to the FirIR spectra highlightedthe discriminative ability of PC1 and PC2 in the distinctionof the resin specimens under investigation, according totheir chemical nature and to the information achieved fromthe observation of the spectra. In particular, the highervalues of FW were related to the separation between
clusters of different terpenic categories, while the FW ofboth PC1 and PC2 showed still significant but lower valueswithin classes of resins belonging to the same category,except for colophony and Venice turpentine. Moreover, itwas extremely interesting to find out that the low FWvalues (PC1, 1.1; PC2, 1.2) between the BP sample and thedammar spectra confirm the characterization of the unknownvarnish as dammar.
Table 3 Fisher weights calculated as between classes variance towithin class variance ratio for FarIR spectra; BP historical sample; CFcolophony; CP copal, D dammar; E elemi; M mastic; SA sandarac; SHshellac; VE Venice turpentine
PC1 FW PC2 FW
CP-E 812.8 21.5
CP-M 316.7 45.2
CP-CF 18.7 75.0
CP-D 55.9 14.4
CP-SH 138.4 1.5
CP-VE 28.9 44.3
CP-SA 2.5 3.3
CP-BP 35.5 1.2
E-M 81.2 81.55
E-CF 18.9 26.4
E-D 10.9 50.24
E-SH 12.9 6.22
E-VE 11.6 12.9
E-SA 420 6.3
E-BP 22.18 10.3
M-CF 0.9 133
M-D 0.7 13.6
M-SH 4.5 47.7
M – VE 0.0 103.7
M-SA 146.4 56.3
M-BP 0.3 14.3
CF-D 1.7 104.8
CF-SH 4.2 44.2
CF-VE 0.5 0.7
CF-SA 13.6 48.56
CF-BP 0.1 37.3
D-SH 0.3 17.7
D-VE 0.3 71.7
D-SA 42.5 24.5
D-BP 1.1 1.2
SH -VE 1.3 26.2
SH-SA 96.9 0.0
SH-BP 3.3 2.7
VE-SA 22.1 27.5
VE-BP 0.15 26.7
SA-BP 25.7 3.7
Table 2 Fisher weights calculated as between classes variance towithin class variance ratio for MidIR spectra; BP historical sample;CF colophony; CP copal, D dammar; E elemi; M mastic; SA sandarac;SH shellac; VE Venice turpentine
PC1 FW PC2 FW
CP-E 33.0 6.8
CP-M 27.4 0.0
CP-CF 40.2 2.8
CP-D 3.2 28.0
CP-SH 172.9 6.9
CP-VE 5.5 0.0
CP-SA 13.2 6.3
CP-BP 164.3 4.5
E-M 0.2 4.3
E-CF 2.3 12.8
E-D 22.0 32.0
E-SH 5.3 0.9
E-VE 2.6 6.7
E-SA 8.2 16.3
E-BP 17.4 2.9
M-CF 0.9 1.2
M-D 17.2 12.4
M-SH 8.7 2.8
M – VE 1.6 0.0
M-SA 5.5 2.7
M-BP 22.6 1.2
CF-D 25.0 17.8
CF-SH 60.4 19.2
CF-VE 0.6 1.4
CF-SA 4.5 1.0
CF-BP 69.9 22.1
D-SH 167.3 55.9
D-VE 2.1 19.0
D-SA 4.8 10.2
D-BP 148.5 72.2
SH -VE 11.6 6.2
SH-SA 67.2 25.9
SH-BP 15.0 1.5
VE-SA 0.1 3.6
VE-BP 22.5 3.7
SA-BP 81.9 31.4
3090 S. Prati et al.
Conclusion
This paper allowed to propose FarIR-ATR spectroscopy as acomplementary tool for the identification of natural resins.Compared with MidIR spectroscopy, FarIR analyses allow tobetter distinguish sesquiterpenic, diterpenic, diterpenic withpolymerised communic acid and triterpenic resins. Moreover,PCA of spectral data permits sometimes (i.e. dammar andmastic, shellac and elemi) to distinguish between resinsbelonging to the same category, although an evaluation ofthe spectral changes in resin derived by the oxidation andhydrolysis process occurring with ageing is being carried outto better understand the technique diagnostic performances.
Even though ageing effect has not been evaluated yet, themethod has been tested on historical case studies. In the firstcase (sample BP) this method allowed to confirm the resultsobtained with analytical pyrolysis. On sample PMB7, the bulkanalyses approach was not effective in the identification of theresin due to the strong signals arising from the leather support.In this case, FarIR spectroscopy allowed the identification ofthe resin. Actually, thanks to its flexibility PMB7 sample didnot disaggregate after the contact with the crystal and theanalyses could be specifically focused on the external surface,even though a small influence of the leather support is present.
FIR spectroscopy has the disadvantage of producing lessintense spectra and of being difficult to perform on amicroscopic scale. It can be therefore used as a complemen-tary technique of Raman spectroscopy and of the traditionalFTIR spectroscopy in the MidIR region.
A particularly interesting field of application may be thecontrol of the cleaning procedures during restoration.
Acknowledgements Part of this research has been funded by thenational project PRIN 08 “Setting up of diagnostic methodologies for thestratigraphical characterisation and spatial location of the organiccomponents in artistic and archaeological polychrome works of art” andby the European project “CHARISMA” Cultural heritage AdvancedResearch Infrastructures: Synergy for a Multidisciplinary Approach toConservation/Restoration, FP7 INFRASTRUCTURE n.228330.
References
1. Thompson DV Jr (1954) Il libro dell’arte, the craftsman’shandbook of Cennino d’Andrea Cennini. Dover, New York
2. Thomson R. (2005) In Conservation of leather and relatedmaterials, Buttherworth Heinemann, 88–91
3. Mills J, White R (1999) Organic material in museum objects, 2dthedn. Butterworth Heinemann, Oxford, pp 95–129
4. Andreotti A, Bonaduce I, Colombini MP, Gautier G, Modugno F,Ribechini E (2006) Anal Chem 78:4490–4500
5. Domènech-Carbò MT, Kuckova S, de la Cruz-Canizares J, Osete-Cortina L (2006) J Chrom A 1121:248–258
6. Doménech-Carbò MT (2008) Anal Chim Acta 621:109–1397. van den Berg JDJ, Boon JJ, van den Berg KJ, Fiedler I, Miller
MA (1998) Anal Chem 70:1823–1830
8. Chiavari G, Fabbri D, Prati S (2002) Chromatographia 55:611–6169. Shedrinsky SM, Wampler TP, Baer NS (1987) Wiene Berichte
veber Naturwissenschaft in der Kunst 4:12–2510. Osete-Cortina L, Domènech-Carbò MT (2005) J Chromatogr A
1065:265–27811. Manso M, Carvalho ML (2009) Spectr Acta B 64:48212. Casadio F, Toniolo L (2001) J Cult Heritag 2:71–7813. Messerschmidt RG, Harthcock MA (1988) Infrared microspectro-
scopy. Theory and applications. Marcel Dekker, New York14. Ricci C, Miliani C, Brunetti BG, Sgamellotti A (2006) Talanta
69:1221–122615. Bacci M (1995) Sens Actuat B 29(1–3):190–19616. Katsibiri O, Howe RF (2010) Microchem J 14–2317. Feller RL (1954) Science 120:1069–107018. Low MJD, Baer NS (1978) In: Conference Proceedings ICOM
Committee for Conservation. 5th Triennial Meeting, Zagreb,1–8 Oct. 1978., Paris 1978
19. Cartoni G, Russo MV, Spinelli F, Talarico F (2003) Annali diChimica 93:849–861
20. Scalarone D, Lazzari M, Chiantore O (2003) J Anal Appl Pyrol68–69:115–136
21. Nevin A, Comelli D, Osticioli I, Toniolo T, Valentini G, CubedduR (2009) Anal Bioanal Chem 395:2139–2149
22. Edwards HGM, David AR, Brody RH (2008) J Raman Spectr39:966–971
23. Edwards HGM, Falk MJ, Quye A (1997) J Raman Spectrosc28:243–249
24. Edwards HGM, Sibley MG, Heron C (1997) Spectrochim ActaPart A 53:2373–2382
25. Edwards HGM, Farwel DW, Daffner PL (1996) Spectrochim ActaA 52:1639–1648
26. Brody RH, Edwards HGM, Pollard AM (2002) Biospectr 67:129–14127. Brody RH, Edwards HGM, Pollard AM (2001) Spectrochim Acta
A 57:1325–133828. Vandenabeele P, Ortega-Aviles M, Castilleros DT, Moens L
(2007) Spectrochim Acta A 68:1085–108829. Vandenabeele P, Grimaldi DM, Edwards HGM, Moens L (2003)
Spectrochim Acta A 59:2221–222930. Vandenabeele P, Wehling B, Monees L, Edwards E, de Rev M,
van Hooydonk G (2000) Anal Chim Acta 407:261–27431. Lau D, Livett M, Prawer S (2008) J Raman Spectr 39:545–55232. Karr C, Kovach JJ (1969) Appl Spectrosc 23:219–22333. Kendix E, Moscardi G, Mazzeo R, Baraldi P, Prati S, Joseph E,
Capelli (2008) J Raman Spectrosc 39:1104–111234. Kendix EL, Prati S, Joseph E, Sciutto G, Mazzeo R (2009) Anal
Bioanal Chem 394:1023–103235. Vahur S, Knuutinen U, Leito I (2009) Spectrochim Acta A
73:764–77136. Vahur S, Knuutinen U, Leito I (2010) Spectrochim Acta A
75:1061–107237. Prati S, Joseph E, Sciutto G, Mazzeo R (2010) Acc Chem Res
43:792–80138. Barnes J, Dhanoa MS, Lister SJ (1989) App Spectrosc 43:772–77739. Torri C, Fabbri D (2009) Microchem J 93:133–13940. Mazzeo R, Joseph E, Prati S, Millemaggi A (2007) Anal Chim
Acta 599:107–11741. Dutta S, Mallick M, Bertram N, Greenwood PF, Mathews RP
(2009) Intern J Coal Geol 80:44–5042. Esteban M, Arino C, Diaz-Cruz JM (2006) Trends Anal Chem
25:86–9243. Harper AM, Duewer DL, Kowalski BR, Fashing JL (1977) In
Kowalski BR (ed) Chemometrics: Theory and Application, ACSSymposium
44. Oliveri P, Baldo MA, Daniele S, Forina M (2009) Anal BioanalChem 395:1135–1143
ATR-FarIR spectroscopy for the analysis of natural resins 3091