The Characterisation of Plant Fibres by ATR Infra-Red ...
15
Identification of Cellulosic Fibres by FTIR Spectroscopy I: Thread and Single Fibre Analysis by Attenuated Total Reflectance Paul Garside 1 and Paul Wyeth 1,2 1 Research Centre for Textile Conservation and Textile Studies, Textile Conservation Centre, University of Southampton Winchester Campus, Park Avenue, Winchester, SO23 8DL. 2 Department of Chemistry, University of Southampton, Highfield, Southampton, SO17 1BJ. Summary The ability to accurately identify fibres is of importance to conservators, allowing the most appropriate methods of treatment to be employed. Our research has concentrated on the development of an ATR FT-IR spectroscopic technique for the characterisation of cellulosic (plant) fibres. Six species of fibre were examined, taken largely from the bast group (flax, hemp, jute and ramie), along with cotton and sisal. Initially, unprocessed fibres were considered; subsequently, processed fibres from a variety of sources were examined. Peak intensity ratio techniques were employed to differentiate the fibre types on the basis of relative lignin content with respect to other cellular components. It was found that for each of the species of fibre, the ratios fell within characteristic ranges. 1
-
Upload
khangminh22 -
Category
Documents
-
view
2 -
download
0
Transcript of The Characterisation of Plant Fibres by ATR Infra-Red ...
Identification of Cellulosic Fibres by FTIR Spectroscopy I: Thread and Single Fibre Analysis by
Attenuated Total Reflectance
Paul Garside1 and Paul Wyeth1,2
1 Research Centre for Textile Conservation and Textile Studies, Textile Conservation Centre,
University of Southampton Winchester Campus, Park Avenue, Winchester, SO23 8DL.
2 Department of Chemistry, University of Southampton, Highfield, Southampton, SO17 1BJ.
Summary
The ability to accurately identify fibres is of importance to conservators, allowing the most
appropriate methods of treatment to be employed. Our research has concentrated on the development
of an ATR FT-IR spectroscopic technique for the characterisation of cellulosic (plant) fibres.
Six species of fibre were examined, taken largely from the bast group (flax, hemp, jute and
ramie), along with cotton and sisal. Initially, unprocessed fibres were considered; subsequently,
processed fibres from a variety of sources were examined. Peak intensity ratio techniques were
employed to differentiate the fibre types on the basis of relative lignin content with respect to other
cellular components.
It was found that for each of the species of fibre, the ratios fell within characteristic ranges.
1

Authors’ Biographies Paul Wyeth received a BA (Hons) from Cambridge, where he remained to study for a PhD. He joined
the Chemistry Department at the University of Southampton in 1978 and currently holds a joint
appointment as lecturer in the Chemistry Department and lecturer in Conservation Science at the
Textile Conservation Centre. He is a Fellow of the Royal Society of Chemistry and a member of the
United Kingdom Institute for Conservation and of the recently constituted Institute for Conservation
Science. He has helped to establish the Southern Conservation Network, which supports heritage
conservators and curators in the South of England. His research interests encompass applications of
microstructural and microspectroscopic analysis in the areas of conservation science and natural
technology.
Paul Garside studied for his Master of Chemistry degree at Southampton, graduating in 1998. He
stayed on for doctoral research with Paul Wyeth on the characterisation of natural polymer fibres in
historic textiles. He has developed significant expertise in applying analytical methodology to
conservation science problems and is now extending this through postdoctoral studies at the Research
Centre for Textile Conservation and Textile Studies, University of Southampton.
2

Identification of Cellulosic Fibres by FTIR Spectroscopy I: Thread and Single Fibre Analysis by
Attenuated Total Reflectance
Paul Garside1 and Paul Wyeth1,2
1 Research Centre for Textile Conservation and Textile Studies, Textile Conservation Centre,
University of Southampton Winchester Campus, Park Avenue, Winchester, SO23 8DL.
2 Department of Chemistry, University of Southampton, Highfield, Southampton, SO17 1BJ.
Introduction
Cellulosic (plant) fibres have been used to produce textiles for thousands of years, and the
treatment of such artefacts represents an important aspect of heritage conservation. The identification
of the fibres may not only adduce the origin of an artefact, for example, but can also serve as a
predictor of behaviour and so is essential in allowing an informed decision on conservation protocol.
Conventional approaches to the characterisation of these fibres, such as microscopy and
staining techniques have several limitations: The methods rely heavily on experience as they generally
produce qualitative data and may require the subjective comparison of results. In addition, degradation
and physical damage can often conceal or destroy the characteristic fibre morphology necessary to an
unambiguous identification. A routine, objective method, not reliant on such visual clues, would be of
value. The aim of the research described below was to assess the suitability of vibrational
spectroscopy, as a reliable, reproducible and relatively simple technique, for the differentiation of plant
fibres. This builds on previous work carried out by our group [1] and the seminal contributions of
others, as described below.
Vibrational spectroscopy covers a range of techniques, including conventional Fourier
transform infrared (FTIR), Raman and attenuated total reflectance (ATR) spectroscopy. These
methods have been variously employed for the study of textile fibres, not only to identify the fibres
themselves and their state of deterioration, but also to confirm processing and dye treatments
[2],[3],[4],[5],[6].
3

Spectroscopic approaches have been widely used to distinguish the broad categories of
cellulosic, proteinaceous and regenerated natural fibres and the many different types of synthetic fibre
[7],[4],[8],[9]. The marked chemical differences between these groups of materials means that they are
often readily distinguished. In general, however, there have been few reports on the differentiation of
the chemically similar fibres within a group, such as the cellulosic plant fibres. Edwards has employed
Raman spectroscopy to discriminate amongst untreated plant fibres (ramie, jute, flax, cotton, kapok,
sisal and coir) on the basis of peak ratios derived from the associated C-H and glycosidic C-O-C
vibrations [10]. However, the Raman technique is not routine for many conservation science
laboratories and, in any case, we have found that luminescence can prove problematic even when
excitation is performed at longer, near infrared wavelengths, particularly with historic materials.
Infrared spectroscopy would seem the more appropriate choice, but, to date, a similarly comprehensive
analysis of cellulosic materials has not appeared, although there have been several reports in which
band assignments are presented for the various constituents [11],[12],[13] and in which degradation has
been assessed. In the latter case, the loss of identifiable chemical components and the accumulation of
distinctive degradation products (such as carbonyl containing species produced by oxidative processes)
have been followed, and changes in microstructure deduced from spectroscopically-derived
crystallinity indices [14],[15],[16].
In the research presented below, we have used ATR spectroscopy, a refinement of
conventional FTIR spectroscopy [17],[18],[19], to characterise cellulosic plant fibres. Infrared
radiation will excite molecular vibrations within a material; the frequencies of these vibrations, and
hence the absorption peaks in the spectrum, are characteristic of the chemical composition of the
specimen. In the ATR technique, the fibre sample is just pressed against a crystal ‘window’ (typically
diamond) and the infrared beam interacts with the sample at the interface. While the radiation
undergoes total internal reflection at the crystal surface, an evanescent wave penetrates the sample to a
shallow depth (typically of the order of the radiation wavelength, i.e. a few microns), and it is
absorption of this component which produces the infrared spectrum. The technique offers a number of
advantages over conventional or micro-spectroscopy: relatively small sample sizes can be employed,
little preparation is required, and, after brief practice, due to the controlled presentation of the sample to
the radiation by the ATR anvil, the data is highly reproducible; a portable ATR set-up, or one with an
4
optical fibre probe, may preclude the need to sample at all. In addition, the technique is simple to use
and reasonably widely available, considerations which are of importance if the approach is to become
routine.
Six species of fibre were considered in the study, chosen to represent the types of fibre
typically encountered in textile artefacts: cotton (a seed fibre); flax, hemp, jute and ramie (bast - or
stem - fibres); and sisal (a leaf fibre). Initially, raw unprocessed fibres were analysed. Subsequently,
processed fibres from yarns and textiles were examined, from both modern and historic sources.
All plant fibres have a cellular structure and are largely composed of cellulose, along with
hemicelluloses, pectins, lignin (see Figure 1), and other minor components, which may include bound
water, residual protein, waxes and pigments, and inorganic materials. Cellulose is found primarily in
the cell walls and adopts a crystalline, fibrillar structure interspersed with amorphous regions.
Hemicelluloses are branched polysaccharides (primarily with xylan and mannan monomers) that adopt
an amorphous structure, and form a matrix in which the cellulose microfibrils are embedded. Pectins
are jelly-like acidic polymers of galacturonic acid, incorporating some arabinose and galactose units.
Lignin is an amorphous phenolic polymer with a poorly characterised structure, which is also found
within the natural composite matrix.
Typical compositions of the various fibre types are given in Table 1, though as the fibres are
natural products, these values will vary along the fibre length and between samples [20],[21].
Nonetheless, the relative proportion of lignin with respect to other cellular components seems
distinctive and, indeed, the qualitative assessment of lignin content by staining (such as the
phloroglucinol test or the use of the Herzberg reagent) is an accepted method of fibre characterisation
[9],[22].
We have applied ATR spectroscopy to the comparison of the lignin to cellulose content of the
plant fibres. As the predominant component of these fibres is cellulose, and other major constituents
(hemicelluloses and pectins) are also polysaccharides, the spectra of the samples are superficially
similar (Figure 2); band assignments are presented in Table 2. As a result they cannot be readily
distinguished by eye, and we have found that library search techniques are also of limited value.
However, there are certain ‘signatures’ that can be assigned to specific components; the relative
5
intensity of each can be considered as representative of the proportion of that component within the
fibre: the C=O ester band at ~1735 cm-1, from pectin (however, this band can also be strengthened by
the carbonyl groups of oxycelluloses found in degraded materials); the C=C in plane aromatic
vibrations at ~1595 cm-1 and ~1505 cm-1, from lignin; the C-C ring breathing band at ~1155 cm-1 and
the C-O-C glycosidic ether band at ~1105 cm-1, both of which arise from the polysaccharide
components (that is, largely cellulose). The intensity of the C-H stretching vibration at ~2900 cm-1 was
taken as a measure of the general organic material content of the fibre.
The fibres were characterised by calculating ratios based on the intensities of the bands at
2900, 1595 and 1105 cm-1; these bands were taken to represent the overall organic content, the lignin
content and the cellulose content, respectively. (The pectin derived band at ~1735 cm-1 was also
considered, but was found not to provide consistent data.) Two ratios were calculated as it was found
that this was a more reliable means of distinguishing the different fibre types than the use of a single
ratio. (We have found that the ratios presented here form a better basis for differentiation than those
employed in our earlier work [1].)
Experimental Method
Initially, unprocessed fibres were studied; the spectra of ten samples of each of the six fibre
types (cotton, flax, hemp, jute, ramie and sisal) were obtained. Subsequently, processed fibres (in the
form of yarns or textiles) from a variety of sources were assessed, although fewer samples were
available: cotton, 5; flax, 8; hemp, 4; jute, 11; ramie, 3; and sisal, 5. These processed materials were
taken from the Textile Conservation Centre’s reference collection, and included several examples of
aged historic textiles (generally dating from the early part of the twentieth century). The samples were
not subjected to any preparative treatment, and were analysed under ambient conditions, no attempt
being made to control the temperature or humidity.
Absorbance spectra were acquired using a BioRad ‘FTS 135’ FTIR spectrometer equipped
with a Specac ‘Golden Gate’ ATR accessory. The latter was fitted with a diamond crystal, and
operated with single reflection optics at an interaction angle of 45 º and a probe area of 0.6 mm
diameter; the sampling depth (at 1000 cm-1) was calculated to be approximately 3 µm. The spectra
were recorded over the range 4000 - 750 cm-1, with a resolution of 4 cm-1, and averaged over 32 scans.
Subsequent manipulation was carried out with Galactic Industries ‘GRAMS/32’ software. Base-line
6

corrections were applied at 3680, 2630, 1780, 1185 and 765 cm-1, and the intensities of the bands at
2900, 1595 and 1105 cm-1 measured above local baselines imposed between 3000 – 2630, 1780 – 1485
and 1185 – 765 cm-1 respectively. [The derivation of intensities from deconvoluted spectra was
considered, but gave inconsistent results].
The following ratios were then calculated:
R1 = I1595 / I1105
R2 = I1595 / I2900
Results and Discussion
Typical spectra for each of the six fibre types are shown in Figure 2, demonstrating their
superficial similarity and domination by the contribution from the cellulosic component; the spectrum
of pure cellulose is given for comparison.
For the native fibres, the average values of the two ratios, R1 and R2, and their standard
deviations, σ1 and σ2, are presented in Table 3.a; these ratios are plotted against each other in Figure
3.a. The corresponding data for the processed fibres are presented in Table 3.b and Figure 3.b. The
envelopes shown on these graphs denote the regions into which the data for the various species of fibre
fall.
As can be seen, whilst a single measurement of lignin content, based on either the lignin to
cellulose ratio (R1) or the lignin to organic material ratio (R2), does allow a certain degree of
differentiation between the fibre types, it is more useful to consider both values. A unique region for
each fibre type can be defined in a plot of the two ratios. The native fibres appear to be the more
readily differentiated in the graphs, with the lignin content often being somewhat lower for the
processed ones. Even so, there is little overlap of the mapped regions suggesting that the method may
have general utility. Furthermore, the ratios were found to be quite insensitive to the age of the
samples, both early and late twentieth century specimens complying with the analysis.
There is a general trend for the data points to fall along a diagonal axis on the plots, with the
more highly lignified materials found at higher values of the two ratios. However, this trend does not
7
strictly follow the literature data for fibre composition (see Table 1), as sisal has higher values of R1
and R2 than jute (with lignin contents of 9.9 and 11.8 % respectively), and a similar discrepancy is
observed for cotton and ramie. There may be two explanations for this apparent anomaly:
1. Lignin is a poorly characterised material and its exact properties vary depending on both the
species of the plant and its location within the plant [21]. The fact that cotton is a seed fibre,
sisal a leaf fibre, whilst the other four are stem fibres may have some bearing, with differences
in the chemical composition of the lignin possibly accounting for the discrepancy.
2. In the ‘fingerprint’ regions of the spectra, which contain the cellulose and lignin bands,
numerous overlapping peaks are observed. As intensities were derived by direct measurement
from the spectra, rather than from deconvoluted peak data, there will be contributions from the
underlying bands. For example, the shoulder of the water deformation band at 1635 cm−1 may
augment the 1595 cm−1 lignin absorbance, although we have found that spectra which
evidence significantly different amounts of adsorbed water nonetheless give consistent R1 and
R2 ratios. (However, the precision of the data might improve if it was possible to maintain
environmental conditions constant.)
Despite their ostensible similarity, it is apparent that just minor differences in the composition
of the various cellulosic plant fibres allow them to be distinguished by ATR FT-IR spectroscopy,
whether the fibres are presented unprocessed or in textile threads. Preliminary investigations also
suggest that this technique is applicable to the characterisation of such fibres in paper. (There may be
some ambiguity though when dyes or other finishing agents contribute overlapping infrared bands, or
where there is marked fibre deterioration.)
Since the polarised infrared spectroscopic technique is also applicable to ATR, the oriented
crystallinity of cellulose within natural fibres may also be probed. The value of this to the further
differentiation of bast fibres (and particularly the potentially problematic species flax and hemp) will
be the subject of a subsequent publication.
Acknowledgements
While this work was completed PG was supported by an Engineering and Physical Sciences
Research Council (EPSRC) studentship. PW would like to thank Nell Hoare, Director, Textile
8
Conservation Centre, University of Southampton, for permission to publish, and other colleagues at the
TCC for their support.
References
[1] P. GARSIDE and P. WYETH, ‘Characterisation of Plant Fibres By Infra-Red Spectroscopy’,
Polymer Preprints 41(2) (2000) 1792-1793.
[2] D.H. ABRAHAMS and S.M. EDELSTEIN, ‘A New Method for the Analysis of Ancient Dyed
Textiles’ in M. LEVEY, Archaeological Chemistry, University of Pennsylvania Press,
Philadelphia (1967) 15-27.
[3] C-S CHEN, C.W. BROWN and M.J. BIDE, ‘Non-destructive Near-IR Analysis for the
Identification of Dyes on Textiles’, Journal of the Society of Dyers and Colourists 110
(1994) 196-199.
[4] T. GÁL, I. AMBRUS and S. URSZU, ‘Forensic Analysis of Textile Fibres by Fourier Transform
Infrared Diamond Cell Technique’, Acta Chimica Hungarica 128(6) (1991) 919-928.
[5] P.A. MARTOGLIO, S.P. BOUFFARD, A.J. SOMMER, J.E. KATON and K.A. JAKES, ‘Unlocking the
Secrets of the Past - The Analysis of Archaeological Textiles and Dyes’, Analytical
Chemistry 62 (1990) 1123A-1128A.
[6] S.D. WRIGHTMAN, A. MURRAY and H.F. SHURVELL, ‘The Identification of Pigments in Paper
Coatings by Infrared Spectroscopy’, Internet Journal of Vibrational Spectroscopy 3(3)
(1999) 3 www.ijvs.com.
[7] P.L. LANG, J.E. KATON, J.F. O’KEEFE, D.W. SCHIERING, ‘The Identification of Fibers by
Infrared and Raman Microspectroscopy’, Microchemical Journal 34 (1986) 319-331.
[8] H.E. HOWELL and J.R. DAVIS, ‘Qualitative Identification of Fibers Using NIR Spectroscopy’,
Textile Chemist and Colorist 23 (1991) 69-73.
[9] D.R. PERRY, Identification of Textile Materials (7th Edition), The Textile Institute, Manchester
(1985).
[10] H.G.M. EDWARDS, D.W. FARWELL and D. WEBSTER, ‘FT-Raman Microscopy of Untreated
Natural Plant Fibres’, Spectrochimica Act - Part A 53 (1997) 2383-2392.
9
[11] J. BLACKWELL, P.D. VASKO and J.L. KOENIG, ‘Infrared and Raman Spectra of cellulose from
the Cell Wall of Valonia Ventricosa’, Journal of Applied Physics 41(11) (1970) 4375-4379.
[12] H.G.M. EDWARDS, D.W. FARWELL and A.C. WILLIAMS, ‘FT-Raman Spectrum of Cotton: A
Polymeric Biomolecular Analysis’ Spectrochimica Acta 50A(4) (1994) 807-811.
[13] M.L. NELSON and R.T. O’CONNOR, ‘Relation of Certain Infrared Bands to Cellulose
Crystallinity and Crystal Lattice Type. Part I. Spectra of Lattice Types I, II, III and of
Amorphous Cellulose’, Journal of Applied Polymer Science 8 (1964) 1311-1324.
[14] M. MASCARENHAS, J. DIGHTON and G.A. ARBUCKLE, ‘Characterisation of Plant Carbohydrates
and Changes in Leaf Carbohydrate Chemistry Due to Chemical and Enzymatic Degradation
Measured by Microscopic ATR FT-IR Spectroscopy’, Applied Spectroscopy 54(4) 2000
681-686.
[15] J.E. MILLER and B.M. REAGAN, ‘Degradation in Weighted and Unweighted Historic Silks’,
Journal of the American Institute for Conservation 28 (1989) 79-96.
[16] M.L. NELSON and R.T. O’CONNOR, ‘Relation of Certain Infrared Bands to Cellulose
Crystallinity and Crystal Lattice Type. Part II. A New Infrared Ratio for Estimation of
Crystallinity in Celluloses I and II’, Journal of Applied Polymer Science 8 (1964) 1325-
1341.
[17] J. COATES and A. SANDERS, ‘A Universal Sample Handling System for FT-IR Spectroscopy’
Infrared Spectroscopy 12(5) 2000 12-22.
[18] D. COOMBS, ‘The Use of Diamond as an ATR Material’ Internet Journal of Vibrational
Spectroscopy 2(2) 1998 3 www.ijvs.com.
[19] SPECTRA-TECH, ‘Introduction to Attenuated Total Reflection (ATR) Spectroscopy’, Spectra-
Tech Inc. (2000) www.thermospectra-tech.com/resource/theory.pdf .
[20] M. LEWIN and E.M. PEARCE (EDITORS), Handbook of Fiber Chemistry (2nd Edition), Marcel
Dekker, Inc., New York (1998).
[21] A. TÍMÁR-BALÁSZY and D. EASTOP, Chemical Principles of Textile Conservation, Butterworth-
Heinemann, Oxford (1998).
[22] J.A. MARSHALL, ‘The Identification of Flax, Hemp, Jute and Ramie in Textile Artefacts’, MSc
Dissertation, The University of Alberta, Edmonton (1992).
10
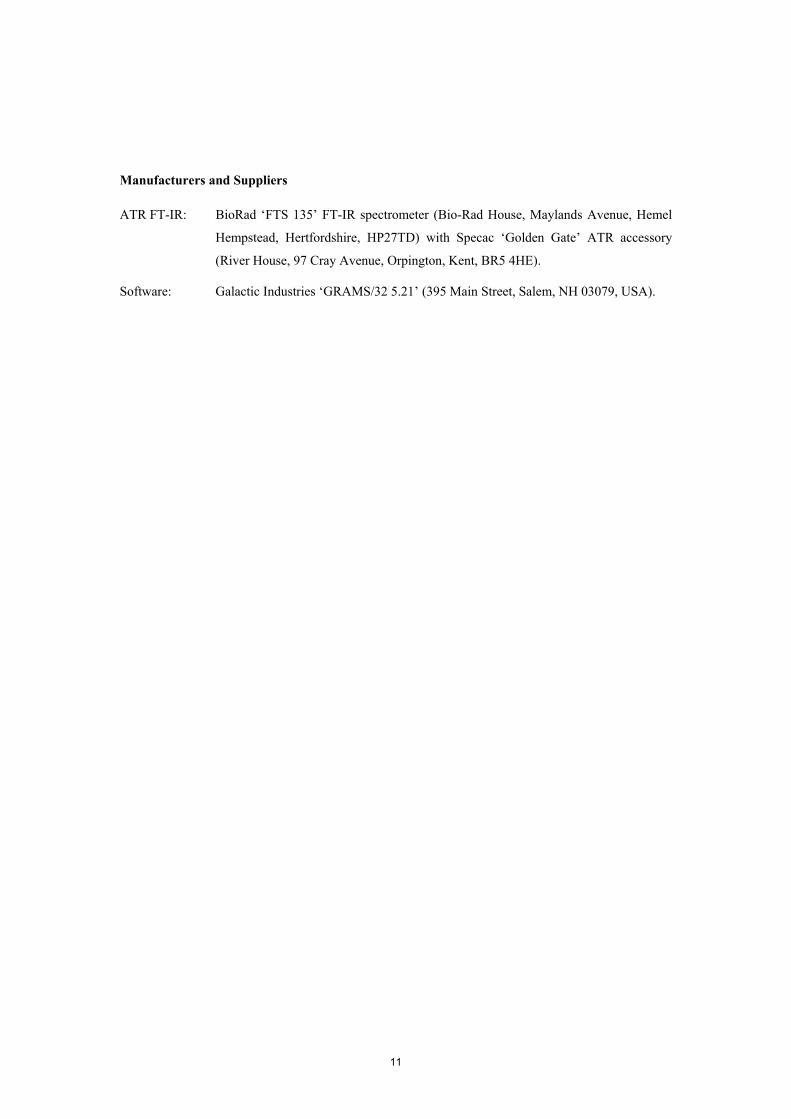
Manufacturers and Suppliers ATR FT-IR: BioRad ‘FTS 135’ FT-IR spectrometer (Bio-Rad House, Maylands Avenue, Hemel
Hempstead, Hertfordshire, HP27TD) with Specac ‘Golden Gate’ ATR accessory
(River House, 97 Cray Avenue, Orpington, Kent, BR5 4HE).
Software: Galactic Industries ‘GRAMS/32 5.21’ (395 Main Street, Salem, NH 03079, USA).
11

Table Legends
Table 1. The composition of cellulosic fibres [20],[21]. In addition to the listed components, bound
water, residual waxes, pigments, protein and inorganic material will also be found.
Table 2. Infrared band assignments for the cellulosic fibres [11],[10],[12],[13].
Table 3. The average values of the band intensity ratios R1 (I1595 / I1105) and R2 (I1595 / I2900) and their
standard deviations, σ1 and σ2, are tabulated for (a) native and (b) processed fibres.
Figure Captions
Fig. 1. Structures of the momomeric units for the major polymeric constituents of cellulosic plant
fibres. Typical monomers are shown for hemicellulose, pectin and lignin.
Fig. 2. Infrared absorbance ATR spectra of the plant fibres and pure cellulose recorded over the range
4000 – 750 cm−1.
Fig. 3. Plots of the intensity ratios, R1 versus R2 for (a) native fibres and (b) processed fibres. The
envelopes denote the regions into which the combined data for the various species of fibre fall.
12
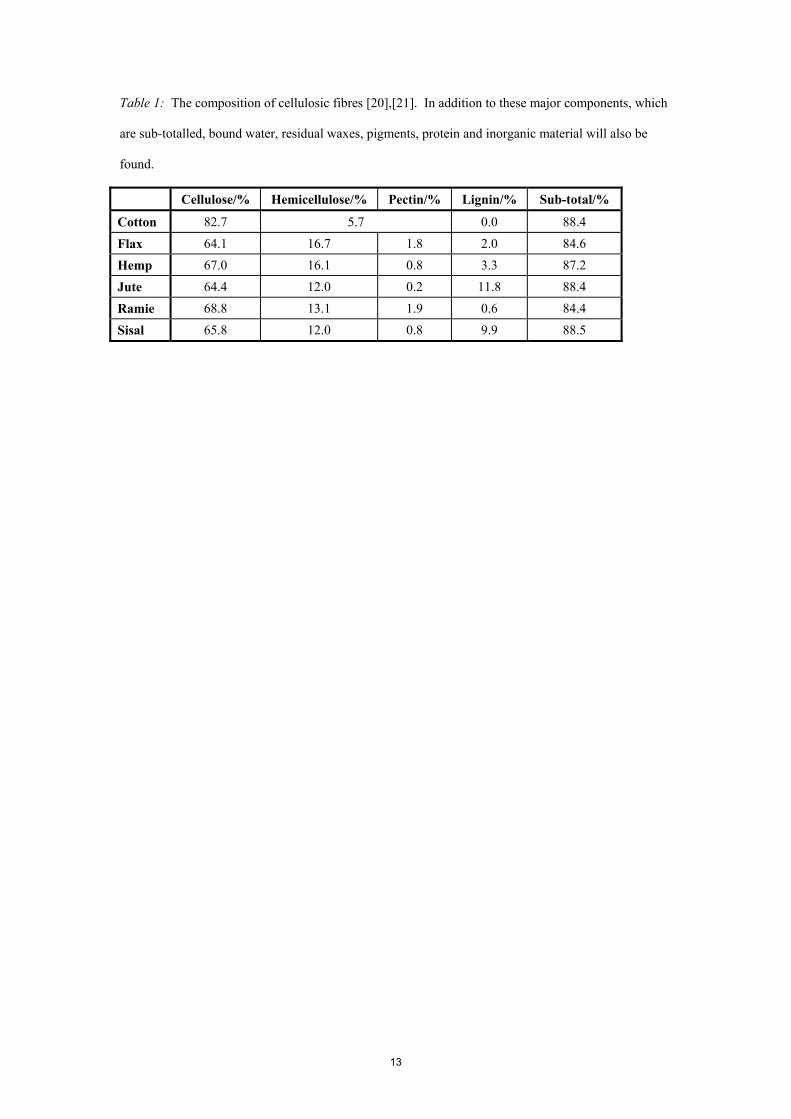
Table 1: The composition of cellulosic fibres [20],[21]. In addition to these major components, which
are sub-totalled, bound water, residual waxes, pigments, protein and inorganic material will also be
found.
Cellulose/% Hemicellulose/% Pectin/% Lignin/% Sub-total/%
Cotton 82.7 5.7 0.0 88.4
Flax 64.1 16.7 1.8 2.0 84.6 Hemp 67.0 16.1 0.8 3.3 87.2 Jute 64.4 12.0 0.2 11.8 88.4 Ramie 68.8 13.1 1.9 0.6 84.4 Sisal 65.8 12.0 0.8 9.9 88.5
13

Table 2: Infrared band assignments for the cellulosic fibres [11],[10],[12],[13].
Position / cm-1 Assignment
~ 3335 ν(OH) free ~ 2900 ν(C-H) ~ 2850 ν(CH2) symmetrical stretching ~ 1735 ν(C=O) ester ~ 1635 adsorbed water ~ 1595 ν(C=C) aromatic in-plane ~ 1505 ν(C=C) aromatic in-plane ~ 1475 δ(CH2) scissoring
~ 1455 δ(C-H); δ(C-OH) 1° & 2° alcohol ~ 1420 δ(C-H) ~ 1365 δ(C-H) ~ 1335 δ(CH2) wagging
~ 1315 δ(C-H) ~ 1280 δ(CH2) twisting
~ 1235 δ(C-OH) out-of-plane
~ 1200 δ(C-OH); δ(C-CH) ~ 1155 ν(C-C) ring breathing, asymmetric
~ 1105 ν(C-O-C) glycosidic
~ 1050 ν(C-OH) 2º alcohol ~ 1025 ν(C-OH) 1º alcohol ~ 1005 ρ(-CH-) ~ 985 ρ(-CH-) ~ 895 ν(C-O-C) in plane, symmetric
14
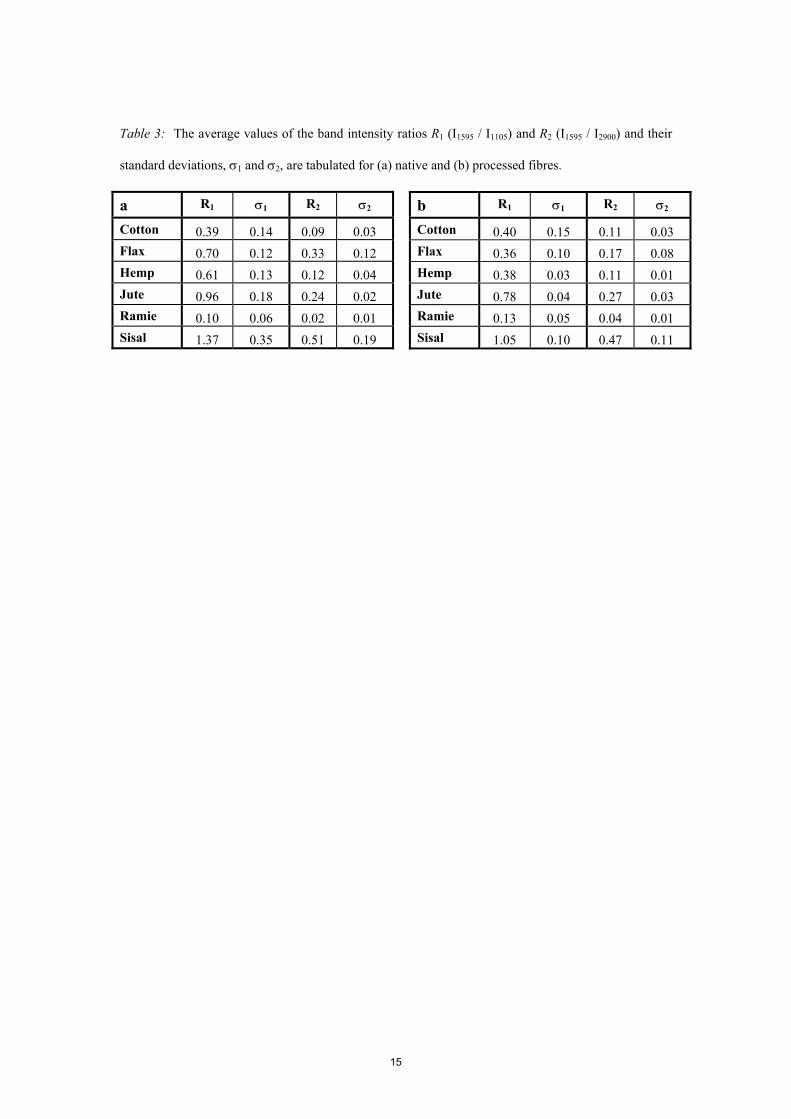
Table 3: The average values of the band intensity ratios R1 (I1595 / I1105) and R2 (I1595 / I2900) and their
standard deviations, σ1 and σ2, are tabulated for (a) native and (b) processed fibres.
15
a R1 σ1 R2 σ2
Cotton 0.39 0.14 0.09 0.03 Flax 0.70 0.12 0.33 0.12 Hemp 0.61 0.13 0.12 0.04 Jute 0.96 0.18 0.24 0.02 Ramie 0.10 0.06 0.02 0.01 Sisal 1.37 0.35 0.51 0.19
b R1 σ1 R2 σ2
Cotton 0.40 0.15 0.11 0.03 Flax 0.36 0.10 0.17 0.08 Hemp 0.38 0.03 0.11 0.01 Jute 0.78 0.04 0.27 0.03 Ramie 0.13 0.05 0.04 0.01 Sisal 1.05 0.10 0.47 0.11