Sequential injection ATR-FTIR spectroscopy for taste analysis in tomato
7
Please cite this article in press as: S. Vermeir, et al., Sequential injection ATR-FTIR spectroscopy for taste analysis in tomato, Sens. Actuators B: Chem. (2009), doi:10.1016/j.snb.2009.01.056 ARTICLE IN PRESS G Model SNB-11310; No. of Pages 7 Sensors and Actuators B xxx (2009) xxx–xxx Contents lists available at ScienceDirect Sensors and Actuators B: Chemical journal homepage: www.elsevier.com/locate/snb Sequential injection ATR-FTIR spectroscopy for taste analysis in tomato Steven Vermeir a,1 , Katrien Beullens a,1 , Péter Mészáros a,b , Evgeny Polshin a , Bart M. Nicolaï a , Jeroen Lammertyn a,∗ a Biosystems/MeBioS, Catholic University of Leuven, W. De Croylaan 42, B-3001 Leuven, Belgium b Physics-Control Department, Corvinus University of Budapest, Somloi Street 14-16, H-1118 Budapest, Hungary article info Article history: Received 17 October 2008 Received in revised form 19 January 2009 Accepted 28 January 2009 Available online xxx Keywords: Sequential injection analysis ATR-FTIR Tomato Central composite design Multivariate data analysis Taste abstract The potential of attenuated total reflectance Fourier transform infrared spectroscopy (ATR-FTIR) for food analysis has been demonstrated in many publications. Most applications, however, deal with the major disadvantage of extensive sample manipulation and cleaning of the ATR sampling compartment, which greatly reduces the sampling rate. To address this problem, in this paper, the potential of sequential injection analysis (SIA) in combination with ATR-FTIR has been studied for sugar and organic acid analysis of Belgian tomato samples. SIA allows automation of the sampling and measurement protocol. The SIA- ATR-FTIR system is optimized for measurement performance accuracy using a central composite design. The four important operational parameters studied are spectral resolution, number of co-added scans, flow rate, and sample temperature. A clear optimum is found for the number of scans (256 co-added scans) and resolution (16 cm −1 ) while sample temperature and flow rate are found not to significantly influence the measurement performance on the most important taste components in fruit. Hence, a stopped flow analysis – to save sample – at room temperature with 256 co-added scans at a resolution of 16 cm −1 is selected as optimal for tomato juice measurements. This setup results in a sample throughput of 24 samples/h. Different tomato cultivars were discriminated based on their acid and sugar content, which are the most important chemical components determining tomato taste. Prediction models for d-glucose, d-fructose, citric acid and l-glutamic acid concentrations in tomato samples were successful for the measured tomato cultivars with RMSEP-values of 1.81 g L −1 , 1.63 g L −1 , 0.41 g L −1 and 0.35 g L −1 respectively. However, the prediction model for l-malic acid, which is present in very small concentrations in tomato fruit, was not successful. © 2009 Elsevier B.V. All rights reserved. 1. Introduction Traditionally, sensory and instrumental techniques are used to determine the taste of food products. Although sensory panel analysis is by far the most realistic technique to obtain informa- tion on human taste and aroma perception, it has some serious drawbacks, being the correctness of training, standardization of measurements, reproducibility, high cost and taste saturation of the panelist [1]. Instrumental techniques such as high pressure liquid chromatography (HPLC), gas chromatography (GC), soluble solids content (SSC), titratable acidity (TA) and pH give informa- tion on the chemical composition of the sample and could be used to describe the taste of a food product. These traditional tech- niques, however, often require a laborious and time-consuming ∗ Corresponding author at: Biosystems/MeBioS, Catholic University of Leuven, W. De Croylaan 42, box 2428, B-3001 Heverlee, Belgium. Tel.: +32 16 32 14 59; fax: +32 16 32 29 55. E-mail address: [email protected] (J. Lammertyn). 1 Both authors contributed in equal parts to this article. sample preparation and skilled people to operate the equipment [2]. In food research there is a need for objective high throughput taste profiling to complement sensory panels. Fourier transformed infrared spectroscopy (FTIR) has proven to be a good alternative for traditional chromatographic techniques in the analysis of individual chemical components in food. Using FTIR with advanced optics and a high signal-to-noise ratio, detection of individual components as well as small compositional differences between complex samples is possible [3–5]. Attenuated total reflectance (ATR) as a sampling technique for FTIR measurements offers interesting possibilities for the analysis of liquid and solid foods. Examples of the use of this technique in food analysis are the determination of sucrose in beet- root [6], organic acids and sugars in tomato [2] and apple juices [7,8], caffeine in soft drinks [9] and alcohol in distilled liquors and wines [10]. In the last decade there has been a shift towards automa- tion of FTIR-measurements by implementing peristaltic pumps, or flow injection (FIA) and sequential injection analysis (SIA) sys- tems which results in an increased throughput. Compared to FIA, SIA is considered as more robust, versatile and better adapted for multiparametric and stopped-flow techniques [11]. Many sample 0925-4005/$ – see front matter © 2009 Elsevier B.V. All rights reserved. doi:10.1016/j.snb.2009.01.056
-
Upload
independent -
Category
Documents
-
view
0 -
download
0
Transcript of Sequential injection ATR-FTIR spectroscopy for taste analysis in tomato

S
S
SJa
b
a
ARRAA
KSTCMT
1
tatdmtlsttn
Df
0d
ARTICLE IN PRESSG ModelNB-11310; No. of Pages 7
Sensors and Actuators B xxx (2009) xxx–xxx
Contents lists available at ScienceDirect
Sensors and Actuators B: Chemical
journa l homepage: www.e lsev ier .com/ locate /snb
equential injection ATR-FTIR spectroscopy for taste analysis in tomato
teven Vermeira,1, Katrien Beullensa,1, Péter Mészárosa,b, Evgeny Polshina, Bart M. Nicolaï a,eroen Lammertyna,∗
Biosystems/MeBioS, Catholic University of Leuven, W. De Croylaan 42, B-3001 Leuven, BelgiumPhysics-Control Department, Corvinus University of Budapest, Somloi Street 14-16, H-1118 Budapest, Hungary
r t i c l e i n f o
rticle history:eceived 17 October 2008eceived in revised form 19 January 2009ccepted 28 January 2009vailable online xxx
eywords:equential injection analysis ATR-FTIRomatoentral composite designultivariate data analysis
aste
a b s t r a c t
The potential of attenuated total reflectance Fourier transform infrared spectroscopy (ATR-FTIR) for foodanalysis has been demonstrated in many publications. Most applications, however, deal with the majordisadvantage of extensive sample manipulation and cleaning of the ATR sampling compartment, whichgreatly reduces the sampling rate. To address this problem, in this paper, the potential of sequentialinjection analysis (SIA) in combination with ATR-FTIR has been studied for sugar and organic acid analysisof Belgian tomato samples. SIA allows automation of the sampling and measurement protocol. The SIA-ATR-FTIR system is optimized for measurement performance accuracy using a central composite design.The four important operational parameters studied are spectral resolution, number of co-added scans,flow rate, and sample temperature. A clear optimum is found for the number of scans (256 co-addedscans) and resolution (16 cm−1) while sample temperature and flow rate are found not to significantlyinfluence the measurement performance on the most important taste components in fruit. Hence, astopped flow analysis – to save sample – at room temperature with 256 co-added scans at a resolution of
−1
16 cm is selected as optimal for tomato juice measurements. This setup results in a sample throughputof 24 samples/h. Different tomato cultivars were discriminated based on their acid and sugar content,which are the most important chemical components determining tomato taste. Prediction models ford-glucose, d-fructose, citric acid and l-glutamic acid concentrations in tomato samples were successfulfor the measured tomato cultivars with RMSEP-values of 1.81 g L−1, 1.63 g L−1, 0.41 g L−1 and 0.35 g L−1respectively. However, the prediction model for l-malic acid, which is present in very small concentrationsucces
in tomato fruit, was not s. Introduction
Traditionally, sensory and instrumental techniques are usedo determine the taste of food products. Although sensory panelnalysis is by far the most realistic technique to obtain informa-ion on human taste and aroma perception, it has some seriousrawbacks, being the correctness of training, standardization ofeasurements, reproducibility, high cost and taste saturation of
he panelist [1]. Instrumental techniques such as high pressureiquid chromatography (HPLC), gas chromatography (GC), soluble
Please cite this article in press as: S. Vermeir, et al., Sequential injection AB: Chem. (2009), doi:10.1016/j.snb.2009.01.056
olids content (SSC), titratable acidity (TA) and pH give informa-ion on the chemical composition of the sample and could be usedo describe the taste of a food product. These traditional tech-iques, however, often require a laborious and time-consuming
∗ Corresponding author at: Biosystems/MeBioS, Catholic University of Leuven, W.e Croylaan 42, box 2428, B-3001 Heverlee, Belgium. Tel.: +32 16 32 14 59;
ax: +32 16 32 29 55.E-mail address: [email protected] (J. Lammertyn).
1 Both authors contributed in equal parts to this article.
925-4005/$ – see front matter © 2009 Elsevier B.V. All rights reserved.oi:10.1016/j.snb.2009.01.056
sful.© 2009 Elsevier B.V. All rights reserved.
sample preparation and skilled people to operate the equipment[2].
In food research there is a need for objective high throughputtaste profiling to complement sensory panels. Fourier transformedinfrared spectroscopy (FTIR) has proven to be a good alternative fortraditional chromatographic techniques in the analysis of individualchemical components in food. Using FTIR with advanced optics anda high signal-to-noise ratio, detection of individual components aswell as small compositional differences between complex samplesis possible [3–5]. Attenuated total reflectance (ATR) as a samplingtechnique for FTIR measurements offers interesting possibilities forthe analysis of liquid and solid foods. Examples of the use of thistechnique in food analysis are the determination of sucrose in beet-root [6], organic acids and sugars in tomato [2] and apple juices[7,8], caffeine in soft drinks [9] and alcohol in distilled liquors andwines [10]. In the last decade there has been a shift towards automa-
TR-FTIR spectroscopy for taste analysis in tomato, Sens. Actuators
tion of FTIR-measurements by implementing peristaltic pumps,or flow injection (FIA) and sequential injection analysis (SIA) sys-tems which results in an increased throughput. Compared to FIA,SIA is considered as more robust, versatile and better adapted formultiparametric and stopped-flow techniques [11]. Many sample

ARTICLE IN PRESSG ModelSNB-11310; No. of Pages 7
2 S. Vermeir et al. / Sensors and Actuators B xxx (2009) xxx–xxx
Table 1Composition of four mixtures used for the optimization of the SIA-ATR-FTIR system. Concentrations are given in g L−1.
d-Glucose d-Fructose Sucrose Citric acid l-Malic acid Tartaric acid Quinic acid
a.Mixture 1 20 20 5 10 30 10 15Mixture 2 40 40 20 5 15 15 10Mixture 3 10 10 30 30 10 5 5Mixture 4 30 30 10 20 5 2 2b.M 1MM 3M 2
amomorota
Algbcsooastanmatfm
2
2
2
sstATppt
Ssfw
2
s
ixture 1 20 20 5ixture 2 40 40 20ixture 3 10 10 30ixture 4 30 30 10
nd instrumental parameters determine the measurement perfor-ance and accuracy of this technology. It is therefore important to
ptimize the operational parameters for the quantification of theain taste components. Different flow systems have been devel-
ped and reported successful for the discrimination of foodstuff, e.g.ed wines, edible oils and beer [12–14] or the rapid quality controlf spirit drinks and beer [15]. Special interest has been shown forhe determination of individual taste components such as sucrosend glucose [16,17] and sugars in soft drinks [18].
The objective of this study is to develop and optimize an SIA-TR-FTIR measurement technique for high throughput analysis in
arge scale experiments such as the taste screening of new Bel-ian tomato cultivars. Hereto firstly, a SIA-ATR-FTIR system wille developed and optimized for quantification of the main tasteomponents in fruit samples, which include D-glucose, D-fructose,ucrose, citric acid, l-malic acid, tartaric acid, and quinic acid. Sec-ndly, using the set of optimal operational parameters, the abilityf SIA-ATR-FTIR as an optical tongue to classify tomato cultivarsccording to their taste profile will be studied. Finally, the mea-urement performance to quantify the concentrations of the mainaste components, specifically for tomato fruit, will be evaluatednd validated with the results of an enzyme based reference tech-ique. These components include d-glucose and d-fructose as theost important sugars and citric acid, l-glutamic acid and l-malic
cid as the most important organic acids [19,20]. With respect toomato fruit, vibrational spectroscopy has been used in the pastor the measurement of lycopene and carotene content [21] or for
etabolic fingerprinting of salt-stressed tomatoes [22].
. Experimental
.1. Development and optimization of the SIA-ATR-FTIR system
.1.1. MixturesFour mixtures, composed of the main taste components in fruit
amples [23], including three sugars (d-glucose, d-fructose anducrose) and four acids (citric acid, l-malic acid, quinic acid andartaric acid) were prepared in triplicate for analysis with the SIA-TR-FTIR system. The composition of the mixtures is shown inable 1a and covers the concentration range of the different com-onents in the fruit samples. Stock solutions of the mixtures wererepared and stored at −80 ◦C until measurement. As such calibra-ion in the optimization study is based on 12 measurements.
In an extra experiment to complete the optimization of theIA-ATR-FTIR system four (slightly) different mixtures of the sameugars and acids were prepared in triplicate. The composition of theour mixtures is shown in Table 1b. Stock solutions of the mixtures
◦
Please cite this article in press as: S. Vermeir, et al., Sequential injection AB: Chem. (2009), doi:10.1016/j.snb.2009.01.056
ere prepared and also stored at −80 C until measurement.
.1.2. ATR-FTIRThe ATR-FTIR measurements were performed on a Bruker Ten-
or 27 spectrometer (Bruker, Karlsruhe, Germany) equipped with a
0 20 5 55 15 10 100 10 2 70 5 7 2
mid-infrared source and a mercury-telluride detector (MCT). Thesampling station was equipped with a flow-through horizontalattenuated total reflectance (ATR) accessory with multiple reflec-tions (9 reflections) (PIKE Technologies, Madison, USA). A closedAMTIR (amorphous material transmitting infrared light) with achannel for sample containment (0.5 mL) was used. Backgroundspectra were created between every measurement using distilledwater. The number of co-added scans and the resolution wereoptimized in the flow system. Single beam spectra in the rangeof 1800–800 cm−1 were obtained and corrected against the back-ground to present the spectra in absorbance units. Opus softwareversion 5.5 (Bruker, Karlsruhe, Germany) was used to operate theFTIR spectrometer and collect all the data. Measurements were per-formed on the mixtures of pure components and on the centrifugedand filtered tomato juices. During ATR-FTIR measurement the sam-ples were placed in a temperature controlled water bath (JulaboTW8, VWR, Belgium).
2.1.3. Flow systemThe flow injection system was constructed with a milliGAT®
pump, combined with a Microlynx-4 micro-electric controller(Global FIA Inc., Fox Island, USA). A large advantage of the pump isthe redundancy of refill cycles or syringe changes unlike traditionalsyringe pumps. The stepper motor of the pump is fully computercontrollable. The milliGAT® pump was connected through Teflontubing (1/16“OD 0.030”ID, Alltech Associates Inc., Deerfield, USA)to the ATR cell. A valve (Cheminert, C22Z-2180D, Valco InstrumentsCo. Inc., Houston, USA) was introduced in the system to switchbetween sample and cleaning reservoir. The valve position, flowrate and direction were controlled by a homemade program writ-ten in Labview 8.0 (National Instruments Co., Austin, USA). Initially,distilled water is pumped through the cell for about 60 secondsat a flow rate of 6 mL min−1. Subsequently the sample is pumpedthrough the crystal for 30 seconds at the flow rate of interest.After scanning the sample (30 seconds), distilled water is pumpedthrough the system during 90 seconds to clean the crystal and toobtain the background spectra. The use of this sequence results ina throughput of 24 samples/h.
2.1.4. Optimization designFour parameters were selected for optimization of the SIA-ATR-
FTIR system: spectral resolution, number of co-added scans, flowrate and sample temperature. The first three instrumental param-eters determine the measurement accuracy, the sample volumeand the measurement time, while the fourth one might influencethe repeatability of the measurements as influenced by environ-mental factors. A central composite design (CCD) was used for the
TR-FTIR spectroscopy for taste analysis in tomato, Sens. Actuators
optimization of the four factors. This type of design has a hyperspherical symmetry and requires five levels for each factor [24].An overview of the levels per factor is given in Table 2. The num-ber of co-added scans was expressed as a power of two to obtainequidistant levels for this factor. Compared to a full factorial design,
ARTICLE ING ModelSNB-11310; No. of Pages 7
S. Vermeir et al. / Sensors and Actu
Table 2Factors which were optimized in the SIA-ATR-FTIR system and the correspondinglevels used in the central composite design.
Resolution (cm−1) 20 21 22 23 24
Number of co-added scans 24 25 26 27 28
Flow (mL min−1) 0 0.9 1.8 2.7 3.6T
Tt
t3smpo(c
R
cb
R
s
citrimiacdaacI
2
2
sbiMoHroioo1idi1(s
emperature (◦C) 10 15 20 25 30
he resolution and the number of co-added scans was expressed as a power of twoo obtain equidistant levels for these factors.
he number of design points in the CCD was reduced from 625 to0. For each combination of design factors in the CCD the wholeet of mixtures was measured in triplicate. Next, joint calibrationodels were calculated for all components in the mixtures using
artial least squares regression (PLS2). The root mean square errorf cross validation (RMSECV) and ratio of prediction to deviationRPD) values were used to assess the model performance for eachomponent individually:
MSECV =√
1n
∑n
i=1(ci − ci)
2
i: known concentration; ci: predicted concentration; n: total num-er of samples
PD = St.Dev.RMSECV
St.Dev.: standard deviation of all samples for the componenttudied.
Response surfaces of these two values per component wereonstructed as a function of the four factors and their first ordernteractions. Optimal factor levels were defined at the minima inhe response surfaces of the RMSECV values and the maxima in theesponse surfaces of the RPD values. When the RPD value of a models equal to or higher than 2 it can be accepted as a good prediction
odel. Although the absolute values of RMSECV and RPD are lessmportant in this optimization study, these values are used in a rel-tive way to find an optimal set of operational parameters whichan be used in real practical experiments. Since the optimal set ofesign factors should be representative for all components jointly,lso an average RPD value was calculated over all sugars and organiccids in the mixtures, and used for optimization. The CCD and theorresponding data analysis were performed in SAS version 9.1 (SASnstitute Inc., Cary, USA).
.2. Measurement of tomato samples
.2.1. Tomato samplesSix tomato cultivars (Lycopersicon esculentum Mill.) were
elected based on their difference in taste, which is mainly definedy the difference in sweetness and sourness, to assure a broad rangen acid and sugar content. The selected cultivars were: Admiro,
acarena, Sunstream, Amoroso, Tricia and Clotilde. The fruits werebtained at the fruit- and vegetable Auctions of Mechelen andoogstraten in Belgium in 2006. All tomatoes were picked at
ipeness stage 6 (breaker class) [25]. The fruits were stored duringne day at ambient atmosphere, 18 ◦C and 80% relative humid-ty. The day after purchase 10 L of tomato juice was collected inne recipient by mixing approximately 60 individual tomatoes. Thebtained juice was aliquoted in 2 falcon tubes with a volume of0 mL for instrumental analysis and frozen in liquid nitrogen. Tomprove the robustness and stability of the prediction models the
Please cite this article in press as: S. Vermeir, et al., Sequential injection AB: Chem. (2009), doi:10.1016/j.snb.2009.01.056
ataset was extended with 30 individual tomato samples originat-ng from three different cultivars (Tricia, Clotilde and Macarena,0 samples per cultivar), collected in a different growing season2007). The samples were prepared similarly as described above. Allamples were stored at −80 ◦C until measurement. Before analysis
PRESSators B xxx (2009) xxx–xxx 3
the tomato juices were centrifuged for 5 min at 25000 g at 4 ◦C (MSEHAWK 15/05R centrifuge, Sanyo, Bensenville, USA) after which thesupernatant was used directly for further analysis.
2.2.2. Enzymatic high throughput analysisA high throughput bioanalytical method (EHT) was used as a ref-
erence technique to evaluate sugar and acid content of the tomatosamples. An automated liquid handling system (Multiprobe® II Plus,PerkinElmer, Boston, USA) with four channels was programmed todispense all the reagents in the wells of the microplates. 96-well(NUNC, Roskilde, Denmark) and 384-well (Corning, New York, USA)flat-bottomed non-treated polystyrene microplates were used. Theabsorbances at the specified wavelengths were read with a Spectra-max M2e microplate reader (Molecular devices, Sunnyvale, USA).The enzymatic assays for the analysis of d-glucose, d-fructose, cit-ric acid, l-malic acid and l-glutamic acid were purchased fromR-Biopharm (Darmstadt, Germany). The assays are based on anincrease/decrease in absorbance at specific wavelengths caused bya change in NAD(P)H (340 nm). The absorbance of the chromogenicmolecules was measured before and after the addition of the sub-strate specific enzyme and was corrected for the delta absorbance ofthe blank values. The tomato samples were centrifuged for 5 min at25000 g at 4 ◦C (MSE HAWK 15/05R centrifuge, Sanyo, Bensenville,USA) and filtered using a 0.45 �m pore filter (Alltech Associates Inc.,Deerfield, USA) preceding the analysis. All samples were analyzed induplicate together with a calibration curve on the same microplate.Since the concentrations of the acids and sugars in the samples weretoo high to be analyzed directly, dilution with distilled water wasnecessary to obtain concentrations that were in the linear range ofthe calibration curve. For a detailed description of this technologythe reader is referred to [20]. Four samples of each cultivar wereanalyzed using this high throughput reference technique.
2.2.3. Data analysisThe results of the reference technique were explored with a uni-
variate analysis of variance (ANOVA). A Tukey test was performedin SAS (vs. 9.1, SAS Institute Inc., Cary, USA) to look for significant(˛ = 0.05) differences in the content of sugars and acids as measuredby EHT.
The SIA-ATR-FTIR spectral data were preprocessed by takingthe first derivative of the absorption spectra with the methodof Savitsky–Golay. Multivariate data analysis was applied forqualitative (discrimination between cultivars) and quantitative(prediction) analysis. Partial least squares discriminant analysis(PLS-DA), a supervised technique, was performed to discriminatethe different cultivars. The PLS-DA was performed on the covariancematrices [26]. Partial least squares regression (PLS2) was performedto study the predictive performance of the SIA-ATR-FTIR system.The concentrations of d-glucose and d-fructose, citric acid, l-malicacid and l-glutamic acid, were predicted in the tomato samplesusing PLS2. Calibration was executed on 40 samples whereas val-idation was executed on an external validation set, composed of20 samples. The data for calibration and validation were chosenrandomly out of the 60 samples. The EHT results were used as a ref-erence to which the SIA-ATR-FTIR results were compared. RMSEPand RPD for the different individual concentrations were calculatedaccording to the definitions in section 2.1.4. Multivariate data anal-ysis was carried out using Unscrambler (vs. 9.0, CAMO TechnologiesInc., Woodbridge, USA) software.
3. Results and discussion
TR-FTIR spectroscopy for taste analysis in tomato, Sens. Actuators
3.1. SIA-ATR-FTIR optimization
For every design point in the CCD design a PLS2 calibrationmodel was built for which the calibration performance character-

ARTICLE IN PRESSG ModelSNB-11310; No. of Pages 7
4 S. Vermeir et al. / Sensors and Actuators B xxx (2009) xxx–xxx
imizat
imrftcffloposeaiors
oPapdRTta2caTN(iI(
TAc
AMSATC
S
Fig. 1. Optimization of resolution and number of scans (A) and opt
stics were calculated for each sugar and acid. In this study the fourixtures from Table 1a were analyzed in triplicate. An RMSECV
esponse surface was constructed as a function of the design factorsor each component. Based on the levels in the design, a resolu-ion of 16 cm−1 is optimal for all components but l-malic acid. 256o-added scans result in a significantly improved prediction per-ormance for sucrose, citric acid, tartaric acid and quinic acid. Aow of 0 mL min−1 (stopped flow) and a temperature of 10 ◦C isptimal in case of sucrose. However, the values for the flow and tem-erature do not significantly affect the model performance for thether components. Since the resolution, the number of co-addedcans and the flow rate all show optimal values at one of theirxtreme values, it was decided to use these values together withstopped-flow as optimal conditions to minimize RMSECV values
n the PLS2 models. Similar results were found in the optimizationf the RPD values. The maximum RPD values were obtained for aesolution of 16 cm−1, 256 co-added scans, a stopped flow and aample temperature of 10 ◦C.
Since RPD values are dimensionless they can be easily averagedut over all components resulting in one RPD value for the wholeLS2 model. The important design factors in this optimization wereresolution of 16 cm−1, 256 co-added scans (Fig. 1(A)) and a tem-erature of 25 ◦C. For the factor temperature, these results slightlyiffered from the previous analysis using RMSECV and individualPD values. Hence, an extra experiment with the mixtures fromable 1b was performed to find the optimal level of temperature. Inhis second experiment the resolution, number of co-added scansnd flow rate were taken as optimal, which corresponds to 16 cm−1,56 co-added scans and 0 mL min−1 respectively. PLS2 calibrationurves were made for four mixtures of sugars and acids (Table 1)t five different temperatures: 10 ◦C, 20 ◦C, 30 ◦C, 40 ◦C and 50 ◦C.he overall RPD value was used to find the optimal temperature.
Please cite this article in press as: S. Vermeir, et al., Sequential injection AB: Chem. (2009), doi:10.1016/j.snb.2009.01.056
o significant differences were found between the five RPD valuesFig. 1(B)). Temperature plays no significant role in the range stud-ed in the SIA-ATR-FTIR system to analyze sugars and organic acids.t was chosen to carry out all measurements at room temperature±20 ◦C).
able 3NOVA results (average ± standard deviation) of EHT analysis of d-glucose, d-fructose,oncentrations in g L−1). Four samples per cultivar were analyzed in duplicate.
d-Glucose d-Fructose C
dmiro 11.2 ± 0.3 e 11.3 + 0.3 eacarena 15.6 ± 0.2 c 14.4 ± 0.2 c
unstream 17.7 ± 0.4 b 17.4 ± 0.3 bmoroso 23.7 ± 0.3 a 23.5 ± 0.5 aricia 10.0 ± 0.1 f 10.8 + 0.1 elotilde 13.3 ± 0.2 d 13.4 ± 0.2 d
ignificant differences (˛ = 0.05) between cultivars are given by different letters; they sho
ion of temperature (B) using average RPD values (all components).
3.2. SIA-ATR-FTIR measurements on tomato samples
3.2.1. Enzymatic high throughput reference dataThe data measured by the enzymatic high throughput refer-
ence technique were analyzed using ANOVA. Significant differencesbetween cultivars based on individual sugars and acids are shownin Table 3. Amoroso, which is a cherry cluster tomato, has high con-centrations of both sugars, citric acid and l-glutamic acid and a lowconcentration of l-malic acid. This cherry tomato is known for itsspecific sweet and sour taste. Sunstream, another cocktail clustertomato, also shows high concentrations of both sugars, but signif-icantly lower than Amoroso. Tricia has low concentrations of allcomponents. This cultivar is known for having a less pronouncedtaste. Admiro, Macarena and Clotilde all have intermediate concen-trations of sugars and acids.
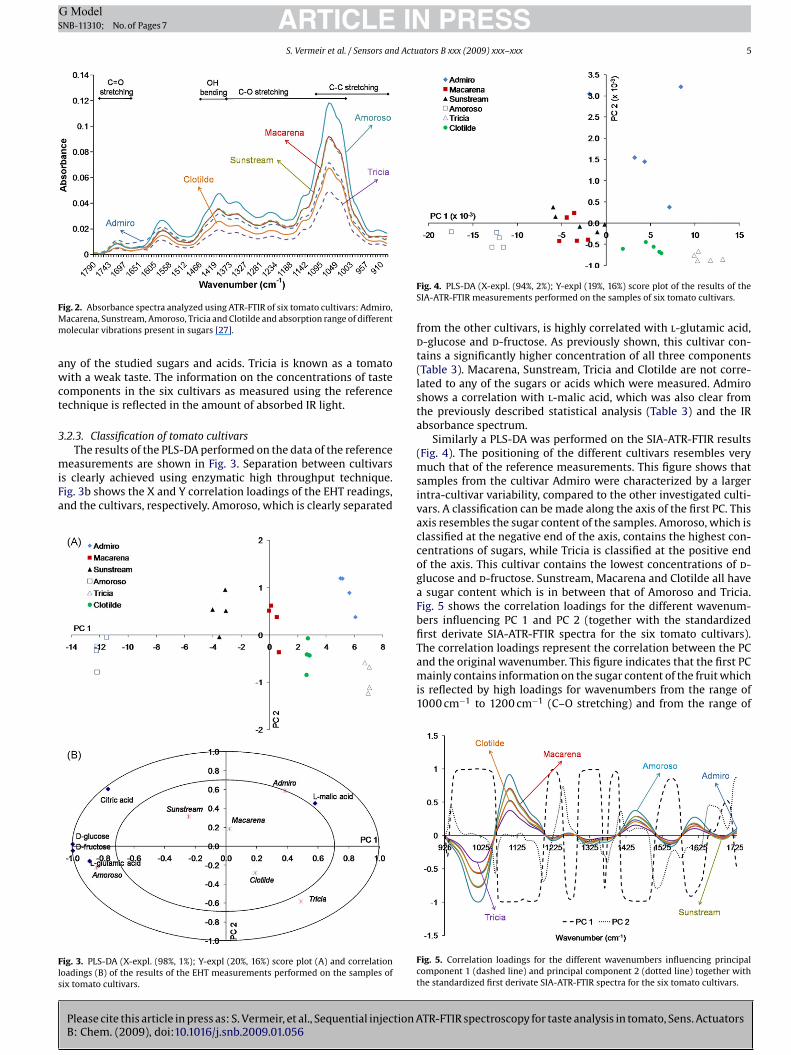
3.2.2. Spectral dataFig. 2 shows the differences in average absorbance spectra for
the six tomato cultivars together with the absorption range ofdifferent molecular vibrations present in sugars and acids (C Ostretching, OH bending, C–O stretching, and C-C stretching) [27].Amoroso displays a higher absorbance at almost all wavenum-bers, compared to the other cultivars. In the spectral area between1140 cm−1 and 950 cm−1, absorption of light mainly occurs due tostrong stretching vibrations of the C–O bonds present in sugars.Amoroso is known as a tasty fruit with high sugar concentrations.The ANOVA results of the reference measurements (Table 3) con-firm that Amoroso contains the highest concentrations for sugars(d-glucose and d-fructose). Admiro, however, absorbs (slightly)more light than Amoroso and the four other cultivars between1720 cm−1 and 1620 cm−1. This wavenumber range in the spectrumis related to the absorbance of infrared light by the C O stretching
TR-FTIR spectroscopy for taste analysis in tomato, Sens. Actuators
bonds of the –COOH group present in organic acids. This corre-sponds to the ANOVA results that Admiro is characterized by highcitric acid and l-malic acid concentrations (Table 3). Tricia absorbsless IR light than the other five cultivars at all wavenumbers, whichreflects that this cultivar does not contain high concentrations of
citric acid, l-malic acid and l-glutamic acid content of six tomato cultivars (all
itric acid l-Malic acid l-Glutamic acid
4.83 ± 0.47 be 0.721 ± 0.006 b 0.952 ± 0.028 d4.27 ± 0.49 cd 0.883 ± 0.017 a 0.638 ± 0.021 e5.42 ± 0.41 ab 0.514 ± 0.009 d 1.449 ± 0.018 b5.84 ± 0.34 a 0.273 ± 0.008 e 2.823 ± 0.798 a2.87 ± 0.36 e 0.509 ± 0.012 d 0.878 ± 0.034 d3.72 ± 0.29 de 0.548 ± 0.006 c 1.065 + 0.011 c
uld be read per chemical component.
ARTICLE IN PRESSG ModelSNB-11310; No. of Pages 7
S. Vermeir et al. / Sensors and Actuators B xxx (2009) xxx–xxx 5
FMm
awct
3
miFa
Fls
ig. 2. Absorbance spectra analyzed using ATR-FTIR of six tomato cultivars: Admiro,acarena, Sunstream, Amoroso, Tricia and Clotilde and absorption range of differentolecular vibrations present in sugars [27].
ny of the studied sugars and acids. Tricia is known as a tomatoith a weak taste. The information on the concentrations of taste
omponents in the six cultivars as measured using the referenceechnique is reflected in the amount of absorbed IR light.
.2.3. Classification of tomato cultivarsThe results of the PLS-DA performed on the data of the reference
Please cite this article in press as: S. Vermeir, et al., Sequential injection AB: Chem. (2009), doi:10.1016/j.snb.2009.01.056
easurements are shown in Fig. 3. Separation between cultivarss clearly achieved using enzymatic high throughput technique.ig. 3b shows the X and Y correlation loadings of the EHT readings,nd the cultivars, respectively. Amoroso, which is clearly separated
ig. 3. PLS-DA (X-expl. (98%, 1%); Y-expl (20%, 16%) score plot (A) and correlationoadings (B) of the results of the EHT measurements performed on the samples ofix tomato cultivars.
Fig. 4. PLS-DA (X-expl. (94%, 2%); Y-expl (19%, 16%) score plot of the results of theSIA-ATR-FTIR measurements performed on the samples of six tomato cultivars.
from the other cultivars, is highly correlated with l-glutamic acid,d-glucose and d-fructose. As previously shown, this cultivar con-tains a significantly higher concentration of all three components(Table 3). Macarena, Sunstream, Tricia and Clotilde are not corre-lated to any of the sugars or acids which were measured. Admiroshows a correlation with l-malic acid, which was also clear fromthe previously described statistical analysis (Table 3) and the IRabsorbance spectrum.
Similarly a PLS-DA was performed on the SIA-ATR-FTIR results(Fig. 4). The positioning of the different cultivars resembles verymuch that of the reference measurements. This figure shows thatsamples from the cultivar Admiro were characterized by a largerintra-cultivar variability, compared to the other investigated culti-vars. A classification can be made along the axis of the first PC. Thisaxis resembles the sugar content of the samples. Amoroso, which isclassified at the negative end of the axis, contains the highest con-centrations of sugars, while Tricia is classified at the positive endof the axis. This cultivar contains the lowest concentrations of d-glucose and d-fructose. Sunstream, Macarena and Clotilde all havea sugar content which is in between that of Amoroso and Tricia.Fig. 5 shows the correlation loadings for the different wavenum-bers influencing PC 1 and PC 2 (together with the standardizedfirst derivate SIA-ATR-FTIR spectra for the six tomato cultivars).
TR-FTIR spectroscopy for taste analysis in tomato, Sens. Actuators
The correlation loadings represent the correlation between the PCand the original wavenumber. This figure indicates that the first PCmainly contains information on the sugar content of the fruit whichis reflected by high loadings for wavenumbers from the range of1000 cm−1 to 1200 cm−1 (C–O stretching) and from the range of
Fig. 5. Correlation loadings for the different wavenumbers influencing principalcomponent 1 (dashed line) and principal component 2 (dotted line) together withthe standardized first derivate SIA-ATR-FTIR spectra for the six tomato cultivars.

ARTICLE IN PRESSG ModelSNB-11310; No. of Pages 7
6 S. Vermeir et al. / Sensors and Actuators B xxx (2009) xxx–xxx
Table 4PLS2 calibration models using 8 PCs to predict individual components built on the results of the SIA-ATR-FTIR measurements. n indicates the number of samples in thedifferent datasets.
n Slope Offset Correlation RMSEC/RMSEP RPD
d-Glucose Calibration 40 0.93 0.98 0.96 0.94Validation 20 0.89 2.43 0.94 1.81 2.60
d-Fructose Calibration 40 0.91 1.21 0.95 0.92Validation 20 0.84 3.03 0.94 1.63 2.65
Citric acid Calibration 40 0.92 0.28 0.96 0.35Validation 20 0.93 0.43 0.96 0.41 3.17
l-Malic acid Calibration 40 0.89 0.07 0.94 0.08
l
1tutfnicSeEbaf1iah
3
tbaiamasg2FsclitaTcSpoct1ctt0
Validation 20 0.46
-Glutamic acid Calibration 40 0.90Validation 20 0.71
370–1480 cm−1 (OH bending). Macarena and Sunstream are closeogether in the score plot of the PLS-DA and are not separated bysing two principal components. Both cultivars are also close tohe origin in the correlation loadings plot. Admiro can be separatedrom the other cultivars along the axis of the second PC. This compo-ent is characterized by high correlation loadings for wavenumbers
n the range of 1720–1750 cm−1 (C O stretching) which is an indi-ation for an elevated acid content. As such the PLS-DA results of theIA-ATR-FTIR spectra show a good correspondence with the pres-nce of the different taste components, measured by the referenceHT measurements. The correlation loadings plot (Data not shown)etween the chemical components, as analyzed using EHT and thebsorption at the wavenumbers, indicate that bothd-glucose andd-ructose show a large correlation with wavenumbers 1103 cm−1 and018 cm−1. As mentioned before, stretching vibrations of C–O bondsn sugars appear at these wavenumbers. l-glutamic acid also showscorrelation with these wavenumbers and citric acid appears to beighly correlated with 1542 cm−1.
.2.4. Quantification of taste componentsA PLS2 analysis, with an external validation set, was performed
o predict the sugar and acid concentrations in the tomato samplesased on the SIA-ATR-FTIR absorption spectra. The results of thisnalysis are presented in Table 4. With eight principal componentsn the models, the concentrations ofd-glucose,d-fructose and citriccid are predicted well using SIA-ATR-FTIR. Correlations betweeneasured by EHT and predicted concentrations by SIA-ATR-FTIR
re high for both the calibration set (n = 40) and the validationet (n = 20). RPD values of 2.60, 2.65 and 3.17 are found for d-lucose, d-fructose, and citric acid respectively with values above.5 being considered as good [28]. It can be concluded that SIA-ATR-TIR technology is suited for predicting the concentrations of bothugars and the most important acid in tomato fruit [19,20]. Theorrelation of the validation model for l-glutamic acid is slightlyower, but the RMSEP value is sufficiently low and the RPD values higher than 2 (2.11) which indicates that approximate quantita-ive prediction is possible. The correlation between the measurednd predicted l-malic acid concentration reaches a values of 0.65.he RPD value of the prediction model of l-malic acid is 1.26, indi-ating that this component cannot be predicted accurately usingIA-ATR-FTIR. The difference in correlation between measured andredicted concentrations of the two sugars and citric acid on thene hand and l-glutamic acid and l-malic acid on the other handan be explained by the concentration range which is present inhe calibration dataset. d-glucose and d-fructose have a range from
Please cite this article in press as: S. Vermeir, et al., Sequential injection AB: Chem. (2009), doi:10.1016/j.snb.2009.01.056
0.0 g L−1 to 23.7 g L−1 and 10.8 g L−1 to 23.5 g L−1, respectively. Theoncentration ranges of citric acid and l-glutamic acid are 2.9 g L−1
o 5.8 g L−1 and 0.6 g L−1 to 2.8 g L−1, respectively. The concentra-ion of l-malic acid in the samples is very small, from 0.3 g L−1 to.9 g L−1. With the very small range in the tomato used for calibra-
0.23 0.65 0.21 1.26
0.12 0.95 0.170.47 0.89 0.35 2.11
tion it is impossible to build an accurate prediction model for thistaste component using SIA-ATR-FTIR.
4. Conclusions
A flow through system was developed and optimized to enableand facilitate high throughput measurements of tomato samplesusing ATR-FTIR. Firstly, using a central composite design the optimalsettings were determined to maximize the RPD values of the cali-bration curves built for the most abundant sugars and acids in fruitsamples. A resolution of 16 cm−1, 256 co-added scans and a stoppedflow were found to be the optimal settings. Temperature was notsignificant, which allowed working at room temperature. Secondly,the potential of the SIA-ATR-FTIR system as a high throughput toolwas studied in an experiment with different tomato cultivars. Thetechnique allows discriminating between the investigated tomatocultivars based on their sugar and acid content. As such the tech-nique has a high potential to be implemented for the screeningof new cultivars, for follow up of taste during fruit processing, fordetecting food fraud and finally for product innovation and design.The spectral data were coupled to an enzymatic high throughputreference technique. Thirdly, ATR-FTIR is perfectly suited to pre-dict the concentration of the sugars d-glucose and d-fructose andcitric acid in tomato juices for the cultivars in this study. It is alsopossible to predict the l-glutamic acid content in tomato; howevercorrelations between measured and predicted values are lower.The concentration of l-malic acid cannot be predicted well dueto the small concentration range of this component in the mea-sured tomatoes. Using SIA-ATR-FTIR it is possible to make accuratepredictions on the major taste components in tomatoes, with theexception of l-malic acid. This allows the implementation of SIA-ATR-FTIR as a high throughput screening technique to analyze thetaste of large amounts of samples in a short time period.
Acknowledgements
This research has been supported by the Institute for thePromotion of Innovation by Science and Technology in Flan-ders (IWT-Vlaanderen, project CLO/IWT/040726 and a PhD Grant),a bilateral scientific cooperation (Bijzonder Onderzoeksfonds,project BIL/05/47), EU COST action 924 and the Fund for ScientificResearch Flanders (FWO G.0298.06; FWO 1.5.136.05).
References
TR-FTIR spectroscopy for taste analysis in tomato, Sens. Actuators
[1] A.Z. Berna, J. Lammertyn, S. Saevels, C. Di Natale, B.M. Nicolaï, Electronic nosesystems to study shelf life and cultivar effect on tomato aroma profile, Sens.Actuators, B Chem. 97 (2004) 324–333.
[2] K. Beullens, D. Kirsanov, J. Irudayaraj, A. Rudnitskaya, A. Legin, B.M. Nicolaï, J.Lammertyn, The electronic tongue and ATR-FTIR for rapid detection of sugarsand acids in tomatoes, Sens. Actuators B Chem. 116 (2006) 107–115.

INS
d Actu
[
[
[
[
[
[
[
[
[
[
[
[
[
[
[
[
[
[
[
Jeroen Lammertyn is MSc in applied biological sciences and MSc in biostatistics.He obtained his PhD in applied biological engineering at the Catholic University
ARTICLEG ModelNB-11310; No. of Pages 7
S. Vermeir et al. / Sensors an
[3] R.H. Wilson, B.G. Goodfellow, Spectroscopic Techniques for Food Analysis, VCHPublishers, New York, 1994.
[4] S. Armenta, S. Garrigues, M. de la Guardia, FTIR determination of aspartameand acesulfame-k in tabletop sweeteners, J. Agric. Food Chem. 52 (2004)7798–7803.
[5] M.M. Paradkar, S. Sakhamuri, J. Irudayaraj, Comparison of FTIR, FT-Raman, andNIR spectroscopy in a maple syrup adulteration study, J. Food Sci. 67 (2002)2009–2015.
[6] J.M. Garrigues, M. Akssira, F.J. Rambla, S. Garrigues, M. de la Guardia, DirectATR-FTIR determination of sucrose in beet root, Talanta 51 (2000) 247–255.
[7] J. Irudayaraj, J. Tewari, Simultaneous monitoring of organic acids and sugars infresh and processed apple juice by Fourier transform infrared-attenuated totalreflection spectroscopy, Appl. Spectrosc. 57 (2003) 1599–1604.
[8] A. Rudnitskaya, D. Kirsanov, A. Legin, K. Beullens, J. Lammertyn, B.M. Nico-laï, J. Irudayaraj, Analysis of apples varieties—comparison of electronic tonguewith different analytical techniques, Sens. Actuators B Chem. 116 (2006) 23–28.
[9] M.M. Paradkar, J. Irudayaraj, Rapid determination of caffeine content in softdrinks using FTIR-ATR spectroscopy, Food Chem. 78 (2002) 261–266.
10] R.A. Cocciadri, A.A. Ismail, J. Sedman, Investigation of the potential of single-bounce attenuated total reflectance Fourier transform infrared spectroscopyin the analysis of distilled liquors and wines, J. Agric. Food Chem. 53 (2005)2803–2809.
11] V. Cerda, A. Cerda, A. Cladera, M.T. Oms, F. Mas, E. Gomez, F. Bauza, M. Miro,R. Forteza, J.M. Estela, Monitoring of environmental parameters by sequentialinjection analysis, TRAC-Trend Anal. Chem. 20 (2001) 407–418.
12] A. Edelmann, J. Diewok, K.C. Schuster, B. Lendl, Rapid method for the discrim-ination of red wine cultivars based on mid-infrared spectroscopy of phenolicwine extracts, J. Agric. Food Chem. 49 (2001) 1139–1145.
13] M.J. Ayora-Canada, A. Ruiz-Medina, B. Lendl, Determination of free fatty acidsin edible oils by continuous-flow analysis with FTIR spectroscopic detection,Appl. Spectrosc. 55 (2001) 356–360.
14] M. Haberkorn, P. Hinsmann, B. Lendl, A mid-IR flow-through sensor for directmonitoring of enzyme catalysed reactions. Case study: measurement of carbo-hydrates in beer, Analyst 127 (2002) 109–113.
15] D.W. Lachenmeier, Rapid quality control of spirit drinks and beer using mul-tivariate data analysis of Fourier transform infrared spectra, Food Chem. 101(2007) 825–832.
16] B. Lendl, R. Kellner, Determination of sucrose by flow injection analysis withFourier transform infrared detection, Mikrochim. Acta 119 (1995) 73–79.
17] H. Abderrazak, B. Lendl, R. Kellner, Determination of glucose by enzymatic FIA-FTIR, Quim. Anal. 16 (Suppl. 1) (1997) S27–S30.
18] R. Schindler, M. Watkins, R. Vonach, B. Lendl, R. Kellner, R. Sara, Automatedmultivariate calibration in sequential injection Fourier transform infrared spec-troscopy for sugar analysis, Anal. Chem. 70 (1998) 226–231.
19] C. Salles, S. Nicklaus, C. Septier, Determination and gustatory propertiesof taste-active compounds in tomato juice, Food Chem. 81 (2003) 395–402.
20] S. Vermeir, B.M. Nicolaï, K. Jans, G. Maes, J. Lammertyn, High-throughputmicroplate enzymatic assays for fast sugar and acid quantification in apple and
Please cite this article in press as: S. Vermeir, et al., Sequential injection AB: Chem. (2009), doi:10.1016/j.snb.2009.01.056
tomato, J. Agric. Food Chem. 55 (2007) 3240–3248.21] M. Baranska, W. Schutz, H. Schulz, Determination of lycopene and beta-carotene
content in tomato fruits and related products: comparison of FT-Raman, ATR-IR,and NIR spectroscopy, Anal. Chem. 78 (2006) 8456–8461.
22] H.E. Johnson, D. Broadhurst, R. Goodacre, A.R. Smith, Metabolic fingerprintingof salt-stressed tomatoes, Phytochemistry 62 (2003) 919–928.
PRESSators B xxx (2009) xxx–xxx 7
23] S.S. Kadam, D.K. Salunkhe (Eds.), Handbook of Fruit Science and Technology, 5,2nd ed., CRC press, Boca Raton, Florida, 1995, pp. 91–122.
24] NIST/SEMATECH e-Handbook of Statistical Methods, http://www.itl.nist.gov/div898/handbook/pri/section3/pri3361.htm, 7/2007.
25] USDA AGR, Mkt. Svc. Colour classification requirements in tomatoes. USDAVisual Aid TM-L-1, The John Henry Co., Lansing, Michigan, 1975.
26] R.A. Johnson, D.W. Wichern, Applied Multivariate Statistical Analysis, 3rd ed.,Prentice Hall Inc., New Jersey, 1992.
27] P. Griffiths, J. de Haseth, Fourier transform infrared spectrometry, 2nd ed., JohnWiley and Sons Inc., Hoboken, NJ, USA.
28] W. Saeys, A. Mouazen, H. Ramon, Potential for onsite and online analysis of pigmanure using visible and near infrared spectroscopy, Biosyst. Eng. 91 (2005)393–402.
Biographies
Steven Vermeir is MSc in biological engineering from the Catholic University ofLeuven. He received his PhD in Bioscience Engineering in 2008 at the Catholic Uni-versity of Leuven (Belgium). His research interests involve biosensors, food qualityand safety, and micro- and nanofluidics.
Katrien Beullens received her MSc degree in biological engineering from theCatholic University of Leuven in 2002. Currently she is in the final year of her doctoralstudies at the Catholic University of Leuven. Her work is focused on Fourier trans-form infrared spectroscopy, multisensor systems and sensory panels to evaluatetaste profiles.
Péter Mészáros is MSc in food engineering (Corvinus University of Budapest, Hun-gary). He received his PhD in Food Sciences in 2007 at the Corvinus University ofBudapest. His research interests are different spectroscopic techniques, electronicsensing of food taste and smell, dielectric grain moisture determination and electri-cal impedance measurements of horticultural products.
Evgeny Polshin received his MSc degree in chemistry at the Saint-Petersburg Uni-versity (Russia) in 2006. Currently he is a doctoral student at Faculty of BioscienceEngineering of Catholic University of Leuven (Belgium). His work is mainly focusedon multisensor systems (electronic tongue), Fourier transform infrared spectroscopyand multivariate statistical analysis.
Bart M. Nicolaï is MSc in agricultural engineering (State University Ghent, Bel-gium) and MSc in Applied Mathematics (Catholic University of Leuven, Belgium).He received his PhD in Applied Biological Sciences in 1994 at the Catholic Univer-sity of Leuven and is now associate professor with the latter institute. His researchinterests are post-harvest physiology, transport of heat, gasses and moisture duringstorage, and quality of horticultural produce.
TR-FTIR spectroscopy for taste analysis in tomato, Sens. Actuators
of Leuven in 2001. In 2002–2003 he was research associate at the PennsylvaniaState University, USA. Since October 2003 he is an assistant professor at the CatholicUniversity of Leuven. His main research interests involve (bio-) sensor technologyfor quality control of the biological production chain and biostatistics.