Organic geochemistry and petrography of Tertiary coals and carbonaceous shales from Argentina

Fuel 158 (2015) 779–792
Contents lists available at ScienceDirect
Fuel
journal homepage: www.elsevier .com/locate / fuel
Chemical–structural properties of South African bituminous coals:Insights from wide angle XRD–carbon fraction analysis, ATR–FTIR,solid state 13C NMR, and HRTEM techniques
http://dx.doi.org/10.1016/j.fuel.2015.06.0270016-2361/� 2015 Elsevier Ltd. All rights reserved.
⇑ Corresponding author. Tel.: +27 18 299 1986; fax: +27 18 299 1535.E-mail address: [email protected] (R.C. Everson).
Gregory N. Okolo a, Hein W.J.P. Neomagus a, Raymond C. Everson a,⇑, Mokone J. Roberts a, John R. Bunt a,Richard Sakurovs b, Jonathan P. Mathews c
a Coal Research Group, Unit for Energy Systems, School of Chemical and Minerals Engineering, North-West University, Potchefstroom Campus, Private Bag X6001, Potchefstroom2520, South Africab CSIRO Energy, 11 Julius Avenue, North Ryde 2113, NSW, Australiac John and Willie Leone Family Department of Energy and Mineral Engineering & The EMS Energy Institute, The Pennsylvania State University, University Park, PA 16802, USA
h i g h l i g h t s
� Chemical–structural properties of coal investigated using various techniques.� Crystallite height, Lc, increases with increasing coalification.� Intact bridges and cross-links increase with increasing rank.� Greater preferential alignment of fringes was observed for the higher ranked coal.� Agreement and consistency was found between different techniques.
a r t i c l e i n f o
Article history:Received 11 December 2014Received in revised form 4 June 2015Accepted 8 June 2015Available online 15 June 2015
Keywords:Chemical–structural propertiesWAXRD–CFAATR–FTIRSolid state 13C NMRHRTEM
a b s t r a c t
The chemical–structural properties of four South African bituminous coals were investigated using wideangle X-ray diffraction–carbon fraction analysis (WAXRD–CFA), attenuated total reflection Fourier trans-form infra-red spectroscopy (ATR–FTIR), solid state 13C nuclear magnetic resonance spectroscopy (ss 13CNMR), and high resolution transmission electron microscopy (HRTEM). The aromaticity of the samplesdetermined by solid state 13C NMR ranged from 0.74 to 0.87 and compared well with the WAXRD–CFAresults (0.73–0.86). WAXRD–CFA, ATR–FTIR and 13C NMR data showed that the lower iso-rank coal sam-ples contained more aliphatic moieties; while the higher rank sample contained higher fractions of pol-yaromatic moieties and saturated long chain hydrocarbons. The lattice parameters determined fromWAXRD–CFA show that lower rank coals investigated are structurally less well-ordered than the higherrank coal. Also, its fringes were quantified as having the greatest preferential alignment of the coalsexamined. HRTEM aromatic fringe image analysis revealed that the carbon lattice of the samples consistof aromatic fringes of varying lengths, L (3 Å 6 L 6 95 Å), which corresponded to a molecular weight dis-tribution ranging from 75 to 1925 amu, assuming circular catenation. The coal with the highest volatilematter yield was found to exhibit a higher frequency of lower molecular weight fringes; while the higherrank coal possessed the most higher molecular weight fringes. The average molecular weights deter-mined for the samples from 13C NMR varied between 504 and 544 amu; and compared well with the val-ues from HRTEM aromatic fringe image analysis data. Thus, there was good agreement and consistencybetween the different techniques. It was demonstrated that, for the characterisation methods used in thisstudy; that vitrinite reflectance impacts more on the chemical–structural properties of these coals thanmaceral composition does.
� 2015 Elsevier Ltd. All rights reserved.
1. Introduction
Coal has a highly complex chemical structure, consisting ofmacerals and minerals that reflect the depositional environment
780 G.N. Okolo et al. / Fuel 158 (2015) 779–792
and the nature of the organic precursors [1]. The resulting hetero-geneity complicates the characterisation of coal samples, and thusa wider variety of techniques is necessary to provide the greatestinsight into the structure of coal. Conventional analytical methodsthat give the bulk properties of the samples, often give poor predic-tions of coal behaviour for most of its utilisation processes [1–3].Moreover, outliers that do not conform to the prediction equationsare common [4]. It is well known that these processes follow dif-ferent reaction routes or reaction mechanisms, whose study is fur-ther compounded due to the heterogeneity of coal. While coalutilisation processes such as combustion and gasification requirechemical bond breaking and bond formation, other utilisation sys-tems such as liquefaction and solvent extraction may require thatthe coals swell and or solubilise in a solvent, either in part or inwhole. In response to global climate change mitigation, carbondioxide sequestration and or storage in ‘‘unmineable’’ or unprof-itable deep-seated coal seams, has further emerged as an utilityof coal resources [5–7]. This coal utilisation process may involve:physical adsorption, where no chemical bond breaking and bondformation is envisaged; chemical adsorption and absorption; min-eralisation, where the super-critical liquid CO2 reacts with theinorganic chemical species within the coal matrix; swelling; andsolubilisation; or a combination of these processes. Carbon dioxidesequestration in deep unmineable coal seams has been identifiedas one of the geological storage options for captured CO2 and hasbeen found to be an attractive CO2 storage sink as the CO2 can bestored in the adsorbed super-critical fluid state, which is expectedto be stable for a geologically significant period [5,7]. This may alsoenable the synergy of enhanced coal bed methane production thatwill add to the energy resource and generate income to offset someof the capital expenditure of the sequestration infrastructure [5].
In coal utilisation processes, the fundamental understanding ofthe coal’s chemical, physical, and structural properties remainsparamount and often challenging to coal scientists and engineers[1–3]. However, the variety of analytical techniques employed byresearchers is greatly dependent on problem description, intendedcoal use or motive, and availability of the desired technique. Therecent increase in software development and technical advanceshas allowed a number of new analytical techniques to proliferate.These include: solid state 13C nuclear magnetic resonance spec-troscopy (ss 13C NMR), attenuated total reflection Fourier transforminfra-red spectroscopy (ATR–FTIR), wide angle X-ray diffraction–carbon fraction analysis (WAXRD–CFA), high resolution transmis-sion electron microscopy (HRTEM), matrix-assisted laser desorptionionization-time-of-flight mass spectrometry (MALDI-TOF) and com-puter controlled scanning electron microscopy (CCSEM). These tech-niques have been used to examine coals with varying degrees ofsuccess [3,8–29], but, overall, have enabled a better understandingof coal molecular chemical structure. Some of these methods pro-vide average values, while others provide vital distribution data.Hence, when used in combination, these can be more informativeand can also be used as a means of checking consistency to somedegree. Results from these techniques have shown that the molecu-lar skeleton of bituminous, and higher rank coals consist mainly ofaromatic sheets or layers [9–14,17–19,24,27,30,31].
The improved understanding of the chemical structure of coalat the molecular level that has resulted from these new investiga-tions has led to the development of refined coal molecular struc-tures, so that they could be more effectively used in theprediction of coal behaviour (reactivity and reaction mechanisms)in its various utilisation processes [27,32–40]. Understanding thestructural properties of coal is necessary in identifying the chemi-cal and physical interactions between coal and various reactantsduring its utilisation [33]. For CO2 storage in coal seams, this is nec-essary to determine the suitability of the coal seams and thestability of the adsorbed CO2 in the geological disposal site.
In this paper, the chemical–structural properties of four SouthAfrican bituminous coals determined from WAXRD–CFA, ATR–FTIR, solid state 13C NMR, and HRTEM techniques are reported.Results obtained from these techniques were compared to validatetheir consistency. These data will be used for the development ofthe molecular models of these South African coals, which will beutilised for further studies, including numerical and molecularmodelling of various coal utilisation systems.
2. Experimental
2.1. Origin of coal samples
The four run-of-mine bituminous coal samples examined in thisinvestigation were collected from actively mined underground coalseams within the Highveld, Witbank, and Tshipise-Pafuri coalfieldsof South Africa. The coal samples are identified henceforth as coals:DEN, FOZ, OGS and TKD. DEN and OGS originate from the Highveldcoalfields, while FOZ and TKD are from the Witbank andTshipise-Pafuri coalfields respectively.
2.2. Sample preparation
The coal samples were received as �50 mm particles.Representative samples were obtained by cone and quartering andpacked in units of 1 kg in polyethylene plastic bags, flushed withnitrogen, vacuum-sealed; and stored in a climate controlled coalstorage chamber. To obtain the size ranges for characterisation pur-poses and analyses, the whole 1 kg bag of sample was crushed andscreened to required size; either as �75 lm or 1 mm size; and fur-ther processed if necessary. Samples were screened as necessary toremove the required size fraction and crushing continued until thewhole 1 kg unit of sample has been crushed to the needed size. Forthe 1 mm size fraction, the samples were crushed in a jaw-crusher(Samuel Osborne (SA) LTD, Model: 66YROLL) set at a jaw openingof 1.12 mm and screened with 850 lm and 1180 lm screens to thesize: 0.85 mm < dp < 1.18 mm (dp is the particle size). In this case,the small amount of fines generated (<10 wt.%) were discarded.For the �75 lm size fraction, crushing was initially carried out onthe jaw-crusher at a jaw opening of 1.0 mm and further crushedon a Fritsch P-14 rotary mill (R-mill) with a mounted280 � 230 mm ceramic macro crusher (Model No. 46-126) contain-ing 10 mm ceramic balls and screened with a 75 lm screen. Thespeed setting of 600 rpm (rpm) was used and allowed to run for30 min. It should be noted that the mills were cleaned properly withcompressed air prior to use to avoid any contamination with previ-ously crushed samples. As South African coals can be relatively highin mineral matter (>20%), the�75 lm (200 mesh) [41] size fractionsof the coals were further demineralised to reduce the influence of theinorganic mineral matter content of the coals on the analyses. Thiswas accomplished using a three step HCl–HF–HCl demineralisationprocedure detailed elsewhere [19,27,42]. After demineralisation,the samples were further washed in excess distilled water untilthe pH of the filtrate was neutral. The effectiveness of demineralisa-tion, Ed (Eq. (1)), was introduced to quantify the extent of deminer-alisation; described as the ratio of the mineral matter removed or‘demineralised’ to the original ash yield of the sample on air drybasis, expressed as a percentage [2].
Ed ¼Ai � Ad
Ai
� �� 100% ð1Þ
where Ai is original ash yield of the sample (wt.%, adb) and Ad is theash yield of the demineralised sample.
Solid state 13C NMR signals are influenced by paramagneticorganic free radical and residual paramagnetic mineral matter

G.N. Okolo et al. / Fuel 158 (2015) 779–792 781
[43,44]; to reduce this effect the samples were further treated with0.1 M samarium (II) iodide (SmI2) in tetrahydrofuran (THF), follow-ing the method adapted from other investigators [17,27,43–45].SmI2 is a powerful one-electron reducing agent for organic radicalswith high chemo-selectivity amongst organic functional groups[45]. About 10 g of demineralised coal was added to 50 ml of0.1 M SmI2 in THF and stirred in a glass beaker, agitated with apolyethylene coated magnetic stirrer at a mild rotational speedof 200 rpm for 24 h in an inert atmosphere glove box assembly.The reaction was quenched with distilled water and then, theTHF was evaporated off. The coal samples were washed with 2 MHCl to leach out the remaining lanthanide ions, and further washedand filtered with excess distilled water to remove the HCl, until thepH was neutral. The residual demineralised and SmI2-treated coalsamples were dried in a vacuum oven at 60 �C until constant mass.
Petrographic analysis was conducted on the raw coals of 1 mmaverage particle size (�1180 + 850 lm); proximate and ultimateanalyses were conducted on both raw and demineralised samples(�75 lm particle size). The 1 mm average particle size fraction ofthe samples was used for petrographic analysis as it is difficult todistinguish visualised maceral entities and lithotypes under thepetrographic microscope, when fines (<500 lm) are used [27,46].The WAXRD–CFA, ATR–FTIR, and HRTEM utilised demineralisedsamples of �75 lm particle size, whereas demineralised andSmI2-treated samples of �75 lm particle size were used for solidstate 13C NMR analysis.
2.3. Sample characterisation
2.3.1. Conventional analysesThe proximate and carbon, hydrogen, nitrogen and sulphur
(CHNS) elemental analyses of the coal samples were carried outat the laboratory of Advanced Coal Technology (ACT), Pretoria;using the standard methods given in Table 1 [47–51]. Fixed carbonand elemental oxygen contents were determined by difference.
2.3.2. Petrographic analysisPetrographic analysis of the samples was conducted by
Petrographics SA, Pretoria. Petrographic block preparation of thesamples using epoxy resin was done according to ISO7404-2:2009 [52]. The resulting sample blocks were grinded, pol-ished; and then examined under a Leica DM4500P microscope fit-ted with a 50� lens and a 10� internal reflected light oilimmersion lens [2,27,46]; giving a total of 500� magnification.The mean vitrinite random reflectance of the samples was deter-mined in accordance with ISO 7404-5:2009 standard [53]. Thecoal’s rank classification based on the mean vitrinite randomreflectance was done following the ISO 11760:2005 [54]. The group
Table 1Proximate, ultimate and total sulphur content analyses results of coal samples.
Sample ID/properties Analysis method FOZ
Raw coal Dem.a coal
Proximate Analysis (wt.%, adb)Inherent moisture ISO 11722: 2013 3.3 1.8Ash yield ISO 1171: 2010 22.0 1.3Volatile matter yield ISO 562: 2010 26.6 29.1Fixed carbon By difference 48.1 67.8Demineralisation efficiency (%) Calculated from Eq. (1) 94.1
Ultimate Analysis (wt.%, dafb)Carbon ISO 17247:2013 78.5 79.4Hydrogen ISO 17247:2013 4.9 4.4Nitrogen ISO 17247:2013 2.0 2.1Total sulphur content ISO 19579:2006 1.4 1.2Oxygen By difference 13.2 13.0
a Demineralised coal sample.
macerals were quantified by a 500 point-count technique follow-ing the ISO standard 7404-3:2009 [55]. A total maceral reflectancescan was also undertaken on each coal. 250 random reflectancereadings were taken on all macerals over the polished surface ofeach petrographic block. The reactive inertinite macerals (reactivesemifusinite and reactive inertodetrinite) were distinguished fromthe inert inertinite macerals and quantified according to the pro-posed method of Smith et al. [2,56,57] for South African coals.
2.3.3. Chemical–structural propertiesThe chemical–structural properties were investigated using
various analytical techniques including: WAXRD–CFA, ATR–FTIR,solid state 13C NMR, and HRTEM.
2.3.3.1. WAXRD–CFA. WAXRD–CFA was conducted at theLaboratory of XRD Consulting, Pretoria. The samples were scannedon a PANalytical X’Pert Pro equipment with cobalt target at ambi-ent temperature. The X-ray intensities were measured in the rangeof 10� 6 2h 6 110� with a step size of 0.017� 2h and a scan steptime of 13.3 s [58,59]. The X-ray diffractograms were acquiredautomatically by the X’Pert Pro Highscore Plus™ software. Theresulting diffractograms were further smoothened andbackground-subtracted to reduce noise, using in-built functionsof the X’Pert Pro Highscore Plus™ software.
The average carbon crystallite lattice parameters: inter-layerspacing (d002), crystallite height (Lc), crystallite diameter (La) andthe average number of aromatic layers per carbon crystallite(Nave) were determined using the empirical Braggs and Scherrerequations (Eqs. 2–5) [2,3,13,17,19,27,31,58–60].
d002 ¼k
2 sin h002ð2Þ
Lc ¼Kck
b002 � cos h002ð3Þ
La ¼Kak
b10 � cos h10ð4Þ
Nave ¼Lc
d002þ 1 ð5Þ
where k is the wavelength of the incident X-ray (in this case1.78901 Å for cobalt Ka radiation); h002,10 is the peak position of(002) or (10) band (�); b002,10 is the full width at half maximum(FWHM) of the corresponding peak or band (�); Kc,a is a constantdepending on X-ray refection plane (0.89 for the (002) band and1.84 for the (10) band.
DEN OGS TKD
Raw coal Dem. coal Raw coal Dem. coal Raw coal Dem. coal
4.0 1.6 2.7 1.5 0.7 0.825.9 1.9 24.5 1.0 16.8 0.421.5 25.2 22.4 25.6 22.0 23.248.6 71.3 50.4 71.9 60.5 75.692.7 95.9 97.6
78.7 79.5 81.3 81.1 86.9 86.24.4 3.9 4.7 4.1 5.1 4.72.2 2.3 2.0 2.0 2.1 2.11.7 1.4 1.3 1.0 1.0 0.9
13.0 12.9 10.6 11.8 4.8 6.1

782 G.N. Okolo et al. / Fuel 158 (2015) 779–792
If it is assumed that the area under the (002) band the c band(A002 and Ac) is equivalent to the number of aromatic and aliphaticcarbons respectively, then the aromaticity (fa) of the samples canbe calculated using Eq. (6) [2,3,19,27,28,60].
f a ¼A002
A002 þ Acð6Þ
where A002 and Ac are the area under the (002) and the c-bandrespectively.
The fraction of amorphous carbon (XA) of the samples weredetermined from the (002) of the sample’s diffractograms fromthe reduced X-ray intensity profile of the (002) band (I002)[2,13,18,19,28,29,61]. By considering that the scattered X-ray inten-sity is a combination of intensities contributed by the crystallineand amorphous carbon structures [2,13,18,61], the reduced inten-sity of the coal and other carbon materials (I002 or I0) can be relatedto these two separate contributions. Furthermore, it has beenshown that the intensity contributed by the fraction of amorphouscarbon contained in the sample is constant over the whole scatter-ing region and does not contribute to the peak intensity, butreflected only in the background [13,18,61]. The reduced intensityof the (002) band of the samples were determined using Eq. (7)and the modified form (Eq. (8)) originally proposed by Franklin[18] and used regularly by other investigators [13,19,28,29,61].
I002 ¼0:0606
s2
� ��X
n
pn �sin2ðpNaved002sÞNave sin2ðpd002sÞ
!ð7Þ
I0 ¼ s2
0:0606� I � XA
1� XAð8Þ
where I002 is the theoretical reduced intensity due to (002) reflec-tion (atomic units); I0 is the experimentally observed (002) profileof the samples incorporating the regressed value of XA; I is theobserved reduced intensity; s = 2sinh/k (�1); Pn is the fraction ofaromatic carbons within the (002) band (since all the carbon withinthe (002) band are completely crystalline and aromatic, RPn = 1).
The I002 is symmetrical about the maximum point (Imax), whichis highly dependent on the proper choice of the Nave. To determinethe most symmetrical I002 profile, different values of Nave (integers)was inserted into Eq. (7) and the profile that is most symmetricalwas equated to the experimental reduced intensity (Eq. (8)) andregressed linearly to obtain the fraction of amorphous carbon, XA.The interlayer spacing can also be calculated from the I002 profileusing the expression (Eq. (9)) [2,13,18,29,61,62]:
d002 ¼1
smaxð9Þ
Alternatively, XA can be determined by Gaussian curve deconvo-lution of the (002) band into the amorphous carbon and the crys-talline carbon peaks, and the fraction of amorphous carbon of thesamples can be calculated using Eq. (10) [3,19,27,62,63].
XA ¼SA
SA þ SCð10Þ
where SA is the calculated peak areas for the amorphous carbonfraction, and SC is the calculated peak area of the crystalline carbonfraction from the Gaussian deconvoluted (002) band.
The index of disorder (IOD) of the samples was calculated fromthe aromaticity, fa, and the fraction of amorphous carbon, XA, usingthe relation [2,3,19,27,28,62]:
IOD ¼ XA þ ð1� XAÞð1� f aÞ ð11Þ
It should be noted that the WAXRD–CFA was repeated in tripli-cate for each of the samples and reported results are averageresults from the three independent analyses with the observeduncertainty at 95% confidence interval.
2.3.3.2. ATR–FTIR. The ATR–FTIR spectra of the demineralised coalsamples were acquired from a Bruker Alpha-P FTIR spectrometerin the absorbance mode, using the attenuated total reflection(ATR) platinum–diamond coupling. The samples were analysed atambient temperature, from a collection of 32 scans per spectrum(interferograms), at a resolution of 4 cm�1 in the frequency rangeof 4000–500 cm�1. Prior to analysis, the samples were dried in avacuum oven at 60 �C for 60 min to minimise the influence ofadsorbed moisture on the surface of the samples. FTIR spec-troscopy has the advantage of elucidating the functional groupspresent in coals as a function of the type of hydrogen bonding pre-sent [17,46,64,65]. The qualitative analyses of the spectra and peakassignments followed the procedures described previously[20,22,23,64–70]. It is worthy to note that there has been somesuccess in obtaining semi-quantitative and quantitative data fromFTIR spectra [23,66,70].
2.3.3.3. Solid state 13C NMR. Solid state 13C NMR was performed atthe Central Analytical Facility of Stellenbosch University,Stellenbosch, South Africa, using a combination of cross polariza-tion magic angle spinning (CP–MAS) and dipolar dephasing magicangle spinning (DD–MAS) methods [8,16,27,71]. The solid state 13CNMR spectra were acquired from a Varian VN MRS 500 MHztwo-channel spectrometer using 4 mm zirconia rotors and a4 mm Chemagnetics™ T3 HX MAS probe. The cross-polarization(CP) experiments were conducted at ambient temperature withproton decoupling using a relaxation or recycle delay of 3 s. Thepower parameters were optimized for the Hartmann-Hahn match;with the radio frequency fields: cHB1C = cHB1H � 56 kHz. The con-tact time for cross-polarization was 2.0 ms. A total of 4000 scansper spectrum was collected for increased signal to noise resolution.Magic-angle-spinning (MAS) was performed at 12 kHz andHydroxy methyl butyrate (HMB) was used as an external chemicalshift standard where the methyl peak was referenced to 17.5 ppm.DD–MAS experiments (CP–MAS with interrupted 1H decoupling)were carried out under similar conditions with the interrupteddecoupling time constant (t1Xidref) set to 40 ls, after evaluating dif-ferent time constants [71].
Previous investigations have demonstrated the quantificationchallenges with 13C NMR technique with respect to coals and othercarbon-rich materials [8,15–17,26,27,44,71,72]. Generally, the CP–MAS experiment is dependent on the strength of the dipolar cou-pling between proton and carbons, and thus, the proton densityand spatial proximity to the carbon nucleus is important [16].Factors that decrease the strength of the dipolar coupling i.e. dis-tance and or motion will reduce the CP efficiency and thus reducethe peak intensity in the spectrum. It is important to note that theCP efficiency is mainly influenced by two factors: the CP rate (TCH)and the proton relaxation time in the rotating frame (TH
1P) [71].Supaluknari et al. [15] found that the proton relaxation time ofthe main carbon types present in coals are of similar range, whilethe CP rates decrease in the order: aliphatic- > aromatic- >carbonyl-carbons. Consequently, the aromatic and carbonyl carbonswill be discriminated against the aliphatic carbons, leading tosystematic errors in the calculated structural parameters[8,15,17,26,44]. In contrast to the CP–MAS, the single-pulse excita-tion MAS (SPE–MAS) experiment has been identified as a betterquantitative method, because it provides the best approximationof the actual aromatic to aliphatic ratio [14,15,17,25,71]. However,the low natural abundance and long relaxation times of 13C resultsin long measurement times (typically > 48 h per coal sample) inSPE MAS experiments [3,8,15,17,44,71]; while CP–MAS spectra ofcoals can be typically acquired within 2–6 h [71]. The CP–MAS incombination with DD–MAS is, therefore, widely used for coal char-acterisations [15,16,71]. The DD–MAS experiment is used to
G.N. Okolo et al. / Fuel 158 (2015) 779–792 783
distinguish strongly proton-coupled carbons from weakly coupledor non-protonated carbons. The DD technique is based on the princi-ple that in the absence of 1H decoupling, that the 13C magnetisation(corresponding to strongly 1H coupled carbons) will de-phase muchfaster than those corresponding to weak coupled carbons [16]. As aresult of this, a DD–MAS spectrum measured with long de-phasingdelays (40 ls) is dominated by signals of non-protonated or weaklycoupled carbons [15]. The DD–MAS method, therefore, allows theobservation of weakly coupled carbons present in bridgehead aro-matics, which gives a better approximation of the ss 13C NMR param-eters. In this paper, a combination of CP–MAS and DD–MASexperiments were used to determine the structural parameters ofthe coal samples [71]. Using the spectrum integral of these experi-
ments, the fraction of bridgehead carbons, f Ba , the mole fraction of
bridgehead carbons, Xb, and the average number of aromatic carbonsper cluster, C, were calculated [14,25].
However, it has been shown that CP–MAS underestimates thearomaticity of coals by 10–15% [43,44,71], due mainly to the influ-ence of inherent paramagnetic organic free radical and residualparamagnetic mineral matter after coal demineralisation; whichcan be reduced by treatment with SmI2 [43,44].
For data processing, each spectrum was phased andbaseline-corrected before integration. Integration reset pointswere set according to Solum et al. [14,25]. All spectra were pro-cessed in the same manner to minimise operator bias.
2.3.3.4. HRTEM. The molecular structural features of coals havebeen studied by HRTEM image analysis technique, using theacquired high resolution fringe images [3,9–12,17,24,27,30]. TheHRTEM images of the coal samples were acquired from a 200 kVTecnai F20 FEGTEM and captured using a Gatan Inc. ORIUS™ CCDcamera (Model 895). Image analyses were performed on theHRTEM micrographs to extract lattice fringes, using AdobePhotoshop CS5 in combination with an image processing tool kit(IPTK 5.0) plug-in (developed by Reindeer Graphics, USA). HRTEMimage analysis was achieved following the procedure proposedby Sharma et al. [12].
The aromatic fringe features (including the length and momentangle) of each of the fringes in the final image were extracted auto-matically, using the built-in functions of IPTK 5.0 plug-in on thePhotoshop CS5 platform and exported to Microsoft Excel 2010for further processing. The moment angle is the angle betweenan aromatic fringe and an arbitrary bedding plane, usually between0� and 180�. The aromatic fringe lengths were quantified followingthe procedures used by Mathews et al. [10,24,27]. This procedureassumes that the aromatic fringes consist of polyaromatic struc-tures of parallel catenation (i.e. the fringe is assumed to be as deepas it is wide). The assumed parallelograms’ minimum (minL) andmaximum (maxL) lengths for a series of aromatic fringes weremeasured ranging from perylene (2 � 2) to 19 � 19 aromatic rings;and using Eqs. (12) and (13) [10,24], the minimum (Cmin) and max-imum (Cmax) carbon atoms in the parallelogram-shape aromaticfringes was calculated. The average number of carbon atoms,Cave, was determined by averaging the sum of Cmin and Cmax andthe average molecular weight of each of the aromatic fringes wasestimated from the Cave, using Eq. (14) [24].
Cmin ¼ 0:4312� ðmin LÞ1:7132 ð12Þ
Cmax ¼ 0:7981� ðmax LÞ1:7964 ð13Þ
MW ¼ ð12:106� CaveÞ þ ðð0:1806� CaveÞ þ 8:98Þ ð14Þ
Mathews and co-workers [24] however noted that, although theassignment of the HRTEM fringe lengths to the number of carbonatoms is not ‘absolute’, it is a good approximation of the molecular
feature of the assigned aromatic component. On this basis, somecut-offs were made for small molecules. Molecules with Cave:<3 Å were assigned to benzene; <4.4 Å to naphthalene and <5.9 Åto anthracene. Both the individual average molecular weight ofthe fringes and the overall average molecular weight of the sam-ples’ fringes were evaluated using this technique. Demineralisedcoal samples were used for this analysis.
3. Results and discussions
3.1. Conventional properties
Table 1 shows the proximate and ultimate analyses results ofthe raw and demineralised (acid-washed) samples. These valuesare typical of South African coals [3,17,19,27,46,57]. The effective-ness of demineralisation, Ed, of the samples is also presented inTable 1, and ranged from 92.7% for sample DEN to 97.6% for sampleTKD. The raw coals were found to have fixed carbon contents in therange of 49–61 wt.%, adb and relatively high ash yields (22–26 wt.%, adb); with relatively low volatile matter yields(�22 wt.%, adb), except for the raw coal FOZ (26.6 wt.%, adb). Thedemineralised coal samples were found to exhibit low ash yields(<2%) with corresponding increases in both the volatile matteryields and fixed carbon contents. Table 1 shows that elemental car-bon contents ranged between 78.5% and 86.9% (daf); while the ele-mental oxygen contents were comparatively lower for sample TKDthan for the other samples. Both elemental nitrogen and total sul-phur contents were low at approximately <2% for both the raw anddemineralised samples. These results compare well to the reportedresults of other investigators on other bituminous coals of SouthAfrica [3,17,19,27].
3.2. Petrographic properties
Petrographic analysis results (Table 2) show that coals DEN, FOZand OGS were of bituminous medium rank C; while coal TKD wasof bituminous medium rank B; with mean vitrinite random reflec-tance (Rr%) and mean total maceral reflectance (Rsc%) ranging from0.65–1.2 and 1.05–1.5 respectively. Coal TKD was relativelyvitrinite-rich; while the other three coal samples wereinertinite-rich. All four coal samples were low in liptinite maceralabundance. The inert inertinite macerals (TINS) accounts for over70% of the total inertinite macerals observed in all the four coalsamples. However, the total reactive macerals abundance in allthe four coal samples ranged from 50 vol.%, mmfb for coal DENto 78.3 vol.%, mmfb for the vitrinite-rich coal TKD. The petro-graphic properties of these samples compare well with reportedpetrographic data on South African coals by other researchers[3,17,19,27,57].
3.3. Chemical–structural properties
3.3.1. WAXRD–CFAThe background-subtracted wide angle X-ray diffractograms of
the demineralised coal samples are presented in Fig. 1 and exhib-ited features characteristic of coal: the (002), (10), (11) and c-sidebands [13,17–19,27,31]. Minor peaks, occurring mainly in coalsFOZ, DEN and OGS, were due to residual pyrite. From Fig. 1, itcan be seen that the intensity of the (002) peak of the samplesincreased (indicating a decreasing full width at half maximum(FWHM)), while the (002) peak angle shifted to the lower angleside with increasing vitrinite reflectance; consistent with transfor-mations due to increasing coalification in the bituminous coalrange [2,3,19]. From Fig. 1, the observed (002) peak positions(�2h) used to determine d002 and Lc was: 29.679� for coal FOZ;

Table 2Petrographic properties of coal samples.
Sample ID/properties FOZ DEN OGS TDK
Reflectance properties (%)
Mean vitrinite random reflectance (Rr, %) 0.63 (0.06)a 0.65 (0.08) 0.69 (0.08) 1.20 (0.18)Mean total maceral reflectance (Rsc, %) 1.05 (0.54) 1.24 (0.51) 1.19 (0.51) 1.50 (0.46)
Rank (Bituminous) Medium Rank C Medium Rank C Medium Rank C Medium Rank B
Maceral analysis (% volume, mineral matter free basis (vol.%, mmfb))
Vitrinite (VIT) 39.5 23.2 24.1 71.7Pseudovitrinite (PV) 2.3 1.2 1.2 2.2
Total vitrinite (TV = VIT + PV) 41.9 24.4 25.3 73.9
Sporinite/resinite/cutinite (S/R/C) 5.8 3.7 6.0 1.1Alginite (ALG) – – – –
Total liptinite (TL = S/R/C + ALG) 5.8 3.7 6.0 1.1
Reactive semifusinite (RSF) 7.0 13.4 13.3 2.2Inert semifusinite (ISF) 18.6 22.0 20.5 10.9Reactive inertodetrinite (RINT) 8.1 8.5 6.0 1.1Inert inertodetrinite (IINT) 11.6 17.1 20.5 4.3Fusinite/secretinite (F/SEC) 5.8 9.8 7.2 5.4Micrinite (MIC) 1.2 1.2 1.2 1.1
Total inertinite (TI = RSF + ISF + F/SEC + MIC + RINT + IINT) 52.3 72.0 68.7 25
Total inerts (TINS = ISF + F/SEC + MIC IINT) 37.2 50.1 49.4 21.7
Total reactives (TR = TV + TL + RSF + RINT) 62.8 50.0 50.6 78.3
a Standard deviation of determined results in parenthesis.
Fig. 1. Background-subtracted wide angle X-ray (WAX) diffractograms of thedemineralised coal samples.
Fig. 3. Determination of the fraction of amorphous carbon of coal FOZ from the(002) reduced intensity profile.
784 G.N. Okolo et al. / Fuel 158 (2015) 779–792
29.871� for coal DEN; 29.711� for coal OGS, and 29.216� for coalTKD. The identified (10) peak position used to evaluate La were:50.535�, 51.234�, 51.103�, and 51.207� for coals FOZ, DEN, OGS,and TKD respectively.
Fig. 2. Theoretical (002) reduced intensity profiles of coal FOZ for 6 discrete valuesof Nave.
The (002) reduced X-ray intensity profiles used to determinethe value of Nave for which the (002) profile is most symmetricabout y = 0 for coal FOZ is given in Fig. 2. This was achieved by plot-ting I002 against Ds = s � smax. The (002) reduced intensity profileswas found to be most symmetrical for Nave = 5 for coals FOZ, DENand OGS. However, the (002) reduced intensity profile was mostsymmetrical for Nave = 6 for coal TKD; which is consistent withthe determined Nave data using the Scherrer equations. Theregressed fitting of the (002) reduced intensity profiles of coalFOZ used to determine the fraction of amorphous carbon is pre-sented in Fig. 3 with the resulting standard residuals plot indicat-ing an excellent fit. The residual sum of squares was 5.338(R2 = 0.997) for coal FOZ; 4.580 (R2 = 0.997) for coal DEN; 3.637(R2 = 0.998) for coal OGS; and 5.3875 (R2 = 0.997) for coal TKD.The Gaussian deconvoluted (002) band used to determine the frac-tion of amorphous carbon using Eq. (10) is given in Fig. 4.

Fig. 4. Determination of XA by Gaussian curve deconvolution of the (002) for coalFOZ.
G.N. Okolo et al. / Fuel 158 (2015) 779–792 785
A summary of the of the structural properties and the latticeparameters of the samples determined from WAXRD–CFA are pre-sented in Table 3, and the reported values agree very well withdata on coals [2,13,17,19,27,31]. It is note-worthy that the d002
and XA determined from the empirical equations and the (002)reduced X-ray intensity profile (values in parenthesis) are quitesimilar within the limits of experimental uncertainty, with discrep-ancies in reported average values < ±2%. The relationships betweenthe WAXRD–CFA results and the vitrinite reflectance of the coalsamples are shown in Fig. 5.
The aromaticity and the fraction of crystalline carbon of thesamples determined from WAXRD–CFA decreased from coal TKDto coal FOZ, similar to the trend exhibited by the aromaticity fromsolid state 13C NMR analysis (Table 5 and Fig. 8). The fraction ofamorphous carbon and the index of disorder (IOD) exhibited theopposite trend, increasing from coal TKD to coal FOZ. From Fig. 5and Table 3, the lattice parameters (d002, Lc, and Nave) of the sam-ples were found to relatively increase with increasing vitrinitereflectance, from coal FOZ (Rr% = 0.63) to coal TKD (Rr% = 1.2); sug-gesting crystallite growth with increasing vitrinite reflectance forthis range of bituminous coals. However, the lattice parameter,La, did not show a systematic trend, in agreement with the previ-ous findings of Lu and co-workers [13]. These parameters followedthe transformation trends expected for coalification in the bitumi-nous coal range [2,13,19,27,31], despite the small range of themean random vitrinite reflectance of the investigated samples.The carbon crystallites present in lower rank coals in this sequenceare structurally less well-ordered than the higher rank coal TKD,which agrees with trends observed in the HRTEM study. The biggercarbon crystallites in coal TKD (in the vertical direction) comparedwith those of the other three lower rank coals may also explain its
Table 3WAXRD–CFA lattice parameters and chemical structural properties of the samples.
Sample ID FOZ
WAXRD–CFA determined structurAromaticity, fa (–) 0.73 ± 0.005Fraction of amorphous carbon, XA (–) 0.614 ± 0.005
(0.607 ± 0.010)a
Fraction of crystalline carbon, XC (–) 0.39 ± 0.005Index of disorder, IOD (–) 0.72 ± 0.006
WAXRD–CFA determined latticeInter-layer spacing, d002 (Å) 3.493 ± 0.003
(3.504 ± 0.008)b
Crystallite height, Lc (Å) 13.74 ± 0.2Average number of aromatic layers, Nave (–) 4.934 ± 0.03Crystallite diameter, La (Å) 17.59 ± 0.3
a XA determined from the (002) reduced intensity profile of the samples.b d002 determined from the (002) reduced intensity profile of the samples using Eq. (
lower skeletal density observed in our earlier work [73], althoughits higher vitrinite maceral content may be a major contributor.
3.3.2. Attenuated total reflection–Fourier transform infra-redspectroscopy (ATR–FTIR)
The ATR–FTIR spectra of the demineralised coal samples arepresented in Fig. 6, and exhibited well-resolved peaks and bandsand flat baselines. The three lower iso-rank coals (coals DEN, FOZand OGS; Rr% 0.63–0.69) possessed similar spectral features andfunctional groups compared with the spectral properties and func-tional groups of the higher rank coal TKD (Rr% 1.2).
The broad region, 3700–3100 cm�1, was observed in all the foursamples and was assigned to –OH stretching vibrations.Absorbance in this region has been attributed to intermolecularH bonds, free OH groups and associated OH groups at the terminalof the aromatic clusters of coal [17,46]. The three lower iso-rankcoals showed stronger IR absorbance in this region than the higherrank coal TKD. This observation compared well with the inherentmoisture contents of the samples determined from proximateanalysis (Table 1). A peak observed in the region 3100–3000 cm�1 was assigned to the aromatic CAH stretching vibration,and was higher for coal TKD, and significantly weak or absent inthe other three coals. Spectra peaks observed in the region 3000–2800 cm�1 was assigned to CAH stretching mode due to aliphaticside chains. This region consists of two distinct peaks at2850 cm�1 and 2920 cm�1 assigned to aliphatic symmetric CH2
and CH3, and asymmetric CH2 aliphatic stretching vibrationsrespectively; while the shoulder peak at 2960 cm�1 was assignedto asymmetric aliphatic CH3 stretching vibration. Thevitrinite-rich and higher rank coal TKD exhibited stronger absor-bance in this region compared with the three lower iso-rank coals.This is in good agreement with the reported findings of otherinvestigators [17,23,65,70]. The observed peak at 1700 cm�1 wasassigned to the aliphatic C@O and ACOOH stretching vibrationsdue to the presence of acids, ketones and aldehydes [23,64,65].
Fig. 6 shows that the vitrinite-rich and higher rank coal TKD haslower absorbance at 1700 cm�1 than the three other samples richin inertinite macerals and lower in rank. The spectral region,1680–1500 cm�1, was assigned to aromatic stretching modes.The peak at�1600 cm�1 was assigned to the C@C aromatic stretch-ing vibrations of aromatic rings or aromatic nucleus[17,22,23,64,67]. A shoulder observed on the left-hand side of theC@C stretching vibration of the aromatic nucleus at 1650 cm�1
was assigned to C@O aromatic stretching vibrations. The presenceof these peaks (1700 cm�1 and 1650 cm�1) suggests carbonylgroups are present. [17,23,65,66]. It can be seen from Fig. 6 thatthe three inertinite-rich coals exhibited higher absorbance in boththe aliphatic C@O and ACOOH stretching vibrations; and aromatic
DEN OGS TKD
al properties of the samples0.81 ± 0.006 0.83 ± 0.008 0.86 ± 0.004
0.543 ± 0.006 0.514 ± 0.005 0.503 ± 0.004(0.534 ± 0.013) (0.509 ± 0.017) (0.496 ± 0.012)
0.46 ± 0.007 0.49 ± 0.004 0.50 ± 0.0070.62 ± 0.005 0.59 ± 0.006 0.57 ± 0.004
parameters of the samples3.471 ± 0.004 3.489 ± 0.002 3.547 ± 0.003
(3.465 ± 0.007) (3.494 ± 0.009) (3.551 ± 0.006)15.87 ± 0.2 15.94 ± 0.1 17.44 ± 0.2
5.572 ± 0.04 5.570 ± 0.04 5.917 ± 0.0416.91 ± 0.2 17.40 ± 0.3 17.62 ± 0.2
9).

Fig. 5. Relationships between the WAXRD–CFA determined properties and the vitrinite reflectance (Rr%) of the coal samples.
786 G.N. Okolo et al. / Fuel 158 (2015) 779–792
C@C and C@O stretching modes than for the vitrinite-rich coalTKD; which is in agreement with published results [17,23]. An ali-phatic bending vibration due to CH2 and CH3 was observed at�1435 cm�1 of the spectra in all the four samples, with a strongerabsorbance exhibited by the vitrinite-rich coal TKD. At around1460 cm�1, a shoulder was observed on the left-hand side of thepeak at 1435 cm�1 on the spectra of the coal samples which wasattributed to the aromatic C@C stretching vibration [17,64]. Theintensity of this shoulder was found to be stronger for thevitrinite-rich and higher rank coal TKD and very weak or almostabsent for the three inertinite-rich lower iso-rank coals. A lowabsorbance peak was observed at 1373 cm�1 that was assignedto CH3 groups in aliphatic chains; it was found to be strongerand sharper in the vitrinite-rich coal TKD compared to the othersamples. Visual inspection shows that coal FOZ exhibited strongerabsorbance at this peak than the other two iso-rank inertinite-richcoals, which may be due to its higher volatile matter yield com-pared to the other two lower iso-rank inertinite-rich coals(Table 1). At 1312 cm�1, a small peak due to aliphatic CHin-plane bending vibration [64], was found on the spectrum of coalTKD which was very diffuse or entirely absent in the spectra of theother three coal samples. In the wavenumber region, 1280 to1000 cm�1, multiple peaks assigned to saturated aliphatic skeletalCAC vibration; CAO stretching vibration of ether groups; and OAHbending vibrations in phenolic, phenoxy and hydroxybenzenestructures were observed in the spectra of all the four coals[17,23,64–66,70]. The three lower iso-rank coals were found toexhibit higher absorbance in this region compared with the higherrank coal TKD. Out-of-plane aromatic CAH bending vibrationsindicating the presence of substituted aromatic species in aromaticrings; and trans- and cis-CH2 in long saturated aromatic ACHACHchains were observed in the 900 to 700 cm�1 region of the spectraof the entire coal sample [17,23,46,64,65]. The peaks at 866 cm�1,805 cm�1, and 745 cm�1 were assigned to aromatic nucleus CH
bending vibration involving one adjacent H deformation, two adja-cent H deformation and three to four adjacent H deformations inlong CH2 chains respectively, in the aromatic cluster of the coals.The ATR–FTIR spectra of the samples (Fig. 6) showed that thehigher rank coal TKD had higher absorbance in the 900–700 cm�1 aromatic region, than for the three other coals.Shoulder peaks present in the region 720–680 cm�1 on the righthand side of the 745 cm�1 peak were attributed to long aromaticalkanes ((CH2)n, n > 4) side rings [23,46,64], and stronger absor-bance was observed in this region for coal TKD when comparedwith the other three coal samples. The absorbance intensity pat-terns of the three lower iso-rank coals were similar in the region1500–680 cm�1, but were entirely different to that of coal TKD.The differences in absorbance at these peaks may indicate thatthe vitrinite-rich coal TKD and the other three inertinite-rich coalshave different substitution patterns in their aliphatic and aromaticring structures [17] and aromatic chain substitutions [65]. A sum-mary of the peak assignment from the FTIR spectra and the charac-teristic absorbance intensity with respect to rank and maceralabundance compiled from the results from this work and thereported findings of Speight [65], Van Niekerk et al. [17], andMalumbazo et al. [46] is given in Table 4.
3.3.3. Solid state 13C NMRFig. 7 shows the 13C CP–MAS with interrupted 1H decoupling
(DD–MAS) NMR spectra of the four demineralised andSmI2-treated bituminous coal samples. All four coals were foundto exhibit two distinct peaks: an aromatic region occurring from100 to 200 ppm and an aliphatic peak (0–60 ppm). The signal(around 225 ppm) is a spinning sideband (SSB1) arising from thechemical shift anisotropy (CSA) associated with aromatic carbons[71]. Since SSB’s arise in distances of the spinning frequency apartfrom the isotropic line (the aromatic signal about 120 ppm), a sec-ond spinning sideband (SSB2) will overlap with the aliphatic signal

Fig. 6. ATR–FTIR spectra of coal demineralised coal samples.
Fig. 7. 13C CP–MAS with interrupted 1H decoupling (DD–MAS) NMR spectra ofdemineralised and SmI2-treated coal samples.
Fig. 8. Correlation of some solid state 13C NMR determined prope
G.N. Okolo et al. / Fuel 158 (2015) 779–792 787
in the region, 0–60 ppm. The signal contribution of SSB2 is consid-ered in the calculation of the 13C NMR determined structuralparameters, by subtracting the SSB2 integral from the aliphaticregion and adding it to the total aromatic integral. SSB2 is assumedto be of similar intensity as SSB1 (note that SSB1 and SSB2 anno-tated in Fig. 7 are not drawn to scale). The coal samples’ structuralparameters were determined from the integral values of 13C NMRspectra, while the lattice parameters were calculated; accordingto the methods proposed by Solum and co-workers [14,25].These results are summarised in Table 5.
The aromaticity, fa, ranges from 74% for coal FOZ (0.63 Rr%) to87% for coal TKD (1.2 Rr%), in agreement with published resultson South African coals [3,17,19,27]. These values showed a satis-factory comparison with the aromaticity of the samples deter-mined from WAXRD–CFA (Table 3), which ranged from 0.73 to0.86; and exhibited the same trend with the vitrinite reflectance.
The fraction of phenolic aromatic carbons, f Pa , was observed to
be low (4%) in coal TKD; and higher and fairly similar values ofaround 7–8% for the other three coals. The fraction of aliphatic car-
bons bonded to oxygen, f Oal, was found to be significantly low (0.2–
1.8%) in the three lower iso-rank coals, and completely absent inthe higher rank coal TKD. The carbonyl, carboxyl and amide car-
bons fraction, f COa , was also found to be very low in coal TKD
(<0.1%), but comparatively higher (0.6–2.3%) in the other three
rties with the vitrinite reflectance (Rr%) of the coal samples.

Table 4Peak assignment from FTIR spectra and characteristic absorbance intensity with respect to rank and maceral abundance.
Wavenumber(cm�1)
Band/peak Assignment Characteristic IR absorbance intensitya
Lowrank
Highrank
Inertinite-rich
Vitrinite-rich
3600–3100 AOH stretching vibration s, b w, b s, b w, b3100–3000 Aromatic CAH stretching vibration w s w-m s3000–2800 Aromatic CAH stretching vibration w-m m-s w s2960 Asymmetric aliphatic CH3 stretching vibration w-m m-s w s2920 Symmetric aliphatic CH3 stretching vibration w-m m-s w s2850 Symmetric aliphatic CH2 stretching vibration w-m m-s w s1700 Aliphatic C@O and ACOOH stretching vibrations m-s m-w s w1680–1500 Aromatic C@C stretching modes s m-w v v1650 Aromatic C@O stretching vibration s m-w v v1600 Aromatic C@C stretching vibrations of aromatic rings s w v v1460 Aromatic C@C stretching vibration w s m-w m-s1435 Aliphatic CH2 and CH3 bending vibration v v m-w m-s1373 CH3 groups in aliphatic chains v v m-w m-s1312 Aliphatic CH in-plane bending vibration w m w m1280–1000 Aliphatic skeletal CAC; CAO stretching; and AOH bending vibrations s m-w s m-w900–700 Out-of-plane aromatic CAH bending vibrations w s m-w m-s866 Aromatic nucleus CH bending vibration (one adjacent H deformation) w s m-w m-s805 Aromatic nucleus CH bending vibration (two adjacent H deformation) w s m-w m-s745 Aromatic nucleus CH bending vibration (three to four adjacent H deformations in long CH2
chainsw s m-w m-s
720–680 Long aromatic alkanes ((CH2)n; n > 4) side rings w s m-w m-s
a s – strong; b – broad; w – weak; m – medium; v – variable.
Table 5Solid state 13C NMR structural and derived lattice parameters of the coal samples.
Sample ID FOZ DEN OGS TKD
Solid state 13C NMR structural parametersAromatic carbons, fa 0.74 0.79 0.79 0.87Aliphatic carbons, fal 0.26 0.21 0.21 0.13
Aliphatic carbons bonded to oxygen, f Oal
0.008 0.018 0.002 0.00
Carbonyl/carboxyl and amide carbons, f COa
0.023 0.020 0.006 <0.001
Phenolics fraction, f Pa
0.08 0.08 0.07 0.04
Alkylated aromatic carbons, f Sa
0.17 0.18 0.17 0.20
Non-protonated aromatic carbons, f Na
0.59 0.63 0.64 0.70
Protonated aromatic carbons, f Ha
0.09 0.11 0.11 0.10
Aromatic bridgehead carbons, f Ba
0.34 0.37 0.39 0.45
Aliphatic CH and CH2, f Hal
0.26 0.21 0.21 0.13
Solid state 13C NMR derived lattice parametersAverage number of intact bridges, P0 0.33 0.63 0.60 0.90Average number of bridges and loop per cluster (cross-links), B.L 2.97 5.47 5.23 8.42Average number of side chains per cluster, S.C 6.10 3.19 3.48 0.96Mole fraction of aromatic bridgehead carbons, Xb 0.50 0.50 0.53 0.57Average number of aromatic carbons per cluster, C 24.67 24.83 26.65 30.84Average number of clusters per 100 carbon atoms 2.78 3.00 2.81 2.60Ave. number of attachments (bridges, loops, side chains) per cluster, r + 1 9.07 8.65 8.71 9.39Fraction of aromatic ring carbons with a directly attached proton, MG 0.13 0.15 0.15 0.13Average molecular weight of side chain or half of bridge mass, Md 27.01 23.41 23.38 17.30Average molecular weight per cluster, MW 544.4 504.1 527.2 536.4
788 G.N. Okolo et al. / Fuel 158 (2015) 779–792
lower iso-rank coals. It was observed that coal FOZ, with the lowestvitrinite reflectance amongst the four samples, contained greatest
amount of the oxygen functionalities f Oal; f
COa ; f P
a
� �, while the higher
rank coal TKD possessed the least amount of oxygen functionalgroups. These results followed the trend of the qualitative ATR–FTIR analysis results (Table 4 and Fig. 6), where coal TKD showedlower absorbance in the regions, bands or peaks assigned to differ-ent oxygen functionalities (AOH, CAO, C@O, ACOOH). Theseresults also agreed with the lower moisture content from proxi-mate analysis and the lower elemental oxygen content from ulti-mate analysis of coal TKD relative to the other three loweriso-rank coal samples (Table 1), and highlight the rank dependencyof the chemical–structural features of the examined coals. Similar
results have been reported for a suite of South African bituminouscoals with vitrinite reflectance ranging from 0.61 to 1.23 Rr% [3].
The three lower iso-rank coals did not exhibit significant differ-
ences with regard to their fraction of alkylated aromatic carbons, f Sa
contents (17–18%), but coal TKD contained more alkylated aro-matic carbons (20%). This was consistent with the greater absor-bance observed for the ATR–FTIR of coal TKD in the out-of-planearomatic CAH bending vibrations region (900–700 cm�1) and thelong aromatic alkanes region (720–680 cm�1), and corroboratesthe higher aromaticity value of coal TKD from both WAXRD–CFAand 13C NMR. The fraction of non-protonated carbons in the aro-
matic region, f Na , was found to increase with increasing vitrinite
reflectance of the coals. Thus, f Na was observed to be lower in coal
Fig. 9. HRTEM aromatic fringe image analysis sequence of demineralised coal TKD.
Table 6Structural assignments, frequency and average molecular weight contributions based on HRTEM fringes image analysis.
Sample ID FOZ DEN OGS TKD
Grouping by fringe lengthrange (Å)
Grouping by MW range(amu)
%Freq.
MWcontribution
%Freq.
MWcontribution
%Freq.
MWcontribution
%Freq.
MWcontribution
Benzene (<3 Å) 50–99 3.8 0.9 1 0.3 1.1 0.3 0.7 0.7Naphthalene (<4.4 Å) 100–149 3.4 4.2 1.6 2 2.3 2.8 1.6 5Anthracene (<5.9 Å) 150–199 5.5 9.6 2.4 4.1 3.1 5.3 2.2 8.25.9–9.9 (2 � 2) 200–249 13.2 29.6 8 18 12.3 27.7 10.1 23.810.0–14.9 (3 � 3) 300–349 14.4 46.7 10.5 34.1 13.1 42.6 10.3 38.215.0–19.9 (4 � 4) 400–449 14.6 62.1 11.1 47.2 13 55.2 9.8 53.920.0–24.9 (5 � 5) 500–549 10.5 54.8 10.8 56.7 14.9 77.9 9.4 51.825.0–29.9 (6 � 6) 600–649 8.8 54.7 9.9 62 12.5 77.9 7.6 5030.0–34.9 (7 � 7) 700–749 7.5 54 10.2 74.1 9.2 66.3 6.7 51.135.0–39.9 (8 � 8) 800–849 5.8 47.4 7.7 63.5 6.2 51.4 7.2 54.340.0–44.9 (9 � 9) 900–949 3.9 36.3 7.4 68.5 3.8 35.6 6.3 5045.0–49.9 (10 � 10) 1000–1049 2.5 25.4 6.2 63.7 3.8 39.4 6.3 45.850.0–54.9 (11 � 11) 1100–1149 2.4 26.5 4.3 48.3 1.1 11.9 5.4 3755.0–59.9 (12 � 12) 1200–1249 1.3 16 3.6 43.5 1.5 17.9 4.3 25.960.0–64.9 (13 � 13) 1300–1349 0.9 12.1 2.5 33.4 0.9 12.3 3.1 24.965.0–69.9 (14 � 14) 1400–1449 0.7 9.3 1.6 23.2 0.5 7.6 2.5 20.170.0–74.9 (15 � 15) 1500–1549 0.5 8 0.4 6.8 0.3 4 2 17.975.0–79.9 (16 � 16) 1600–1649 0.1 2.1 0.3 4.8 0.3 4.3 1.8 11.580.0–84.9 (17 � 17) 1700–1749 0.1 2.3 0.1 2.6 0.1 2.3 1.1 8.185.0–89.9 (18 � 18) 1800–1849 0.1 2.4 0.1 2.7 0.1 2.4 0.9 8.690.0–94.9 (19 � 19) 1900–1949 0.1 2.5 0 0 0 0 0.4 4.595.0–99.9 (20 � 20) 2000–2049 0 0 0 0 0 0 0 0
Average molecular weight of aromatic fringes (amu) 506.9 659.5 545.1 591.3
G.N. Okolo et al. / Fuel 158 (2015) 779–792 789
FOZ (59%) with 0.63 Rr%, and maximum in coal TKD (70%) with Rr%
of 1.2. The fraction of aromatic bridgehead carbons, f Ba , was found
to be higher in coal TKD (45%) than in the other samples (34–39%) and was lowest in coal FOZ (34%). However, the fraction ofprotonated aromatic carbons remains fairly constant in all the four
coals (9–11%). The fraction of aliphatic CH and CH2, f Hal, was also
found to be higher in coal FOZ (26%) and least for coal TKD(13%). These results may explain the higher volatile matter yieldof coal FOZ (Table 1), compared to the other three samples.Furthermore, Coal FOZ also exhibited a higher content of aliphaticcarbons, which are more easily affected by heat [2,19,27], as mea-sured by both the WAXRD–CFA and solid state 13C NMR
spectroscopy analysis; and confirms the higher aromaticity fromboth WAXRD–CFA and 13C NMR and the lower index of disorder,IOD, of coal TKD from WAXRD–CFA. It is worthy to note that thearomaticity of the samples determined from both 13C NMR andWAXRD–CFA are quite similar (Tables 3 and 5).
A structural comparison of the four coals with respect to the lat-tice parameters determined by 13C NMR show that the higher rankcoal TKD exhibited higher contents of most likely intact bridges, P0
(90%); average number of cross-links per cluster, B.L (8.4); molefraction of aromatic bridgehead carbon or aromatic skeleton, Xb
(57%); and average number of carbons per cluster, C (31), thanthe other coal samples; the lowest rank coal FOZ showed the
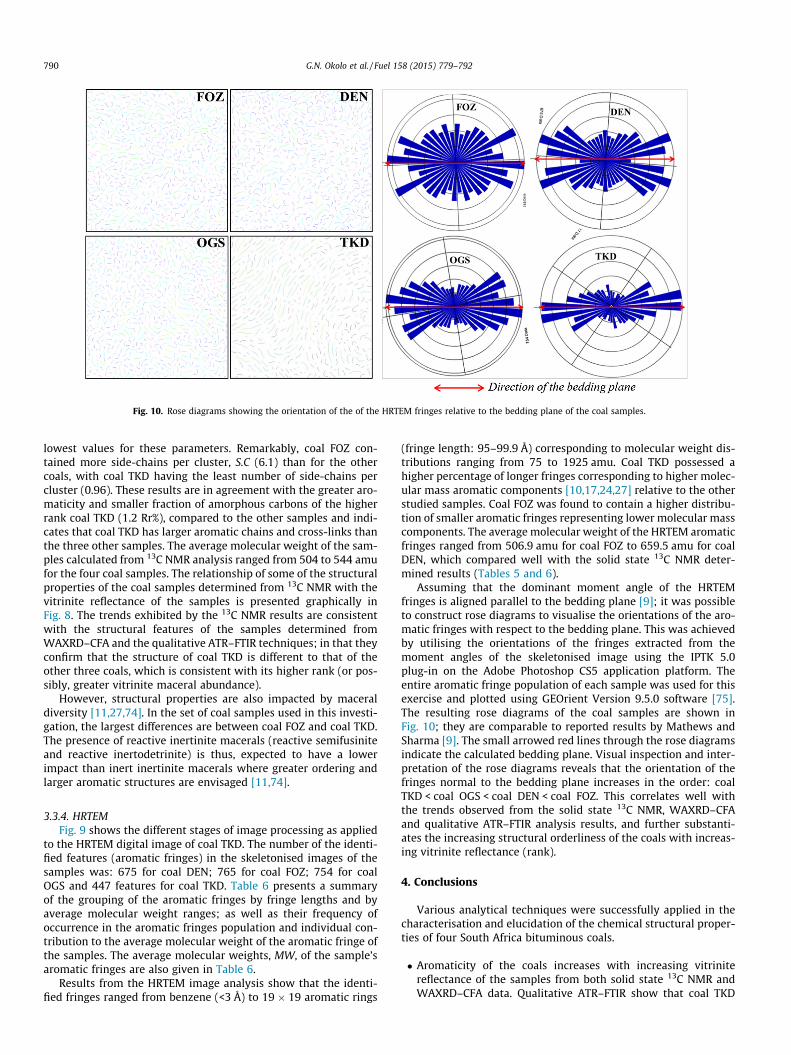
Fig. 10. Rose diagrams showing the orientation of the of the HRTEM fringes relative to the bedding plane of the coal samples.
790 G.N. Okolo et al. / Fuel 158 (2015) 779–792
lowest values for these parameters. Remarkably, coal FOZ con-tained more side-chains per cluster, S.C (6.1) than for the othercoals, with coal TKD having the least number of side-chains percluster (0.96). These results are in agreement with the greater aro-maticity and smaller fraction of amorphous carbons of the higherrank coal TKD (1.2 Rr%), compared to the other samples and indi-cates that coal TKD has larger aromatic chains and cross-links thanthe three other samples. The average molecular weight of the sam-ples calculated from 13C NMR analysis ranged from 504 to 544 amufor the four coal samples. The relationship of some of the structuralproperties of the coal samples determined from 13C NMR with thevitrinite reflectance of the samples is presented graphically inFig. 8. The trends exhibited by the 13C NMR results are consistentwith the structural features of the samples determined fromWAXRD–CFA and the qualitative ATR–FTIR techniques; in that theyconfirm that the structure of coal TKD is different to that of theother three coals, which is consistent with its higher rank (or pos-sibly, greater vitrinite maceral abundance).
However, structural properties are also impacted by maceraldiversity [11,27,74]. In the set of coal samples used in this investi-gation, the largest differences are between coal FOZ and coal TKD.The presence of reactive inertinite macerals (reactive semifusiniteand reactive inertodetrinite) is thus, expected to have a lowerimpact than inert inertinite macerals where greater ordering andlarger aromatic structures are envisaged [11,74].
3.3.4. HRTEMFig. 9 shows the different stages of image processing as applied
to the HRTEM digital image of coal TKD. The number of the identi-fied features (aromatic fringes) in the skeletonised images of thesamples was: 675 for coal DEN; 765 for coal FOZ; 754 for coalOGS and 447 features for coal TKD. Table 6 presents a summaryof the grouping of the aromatic fringes by fringe lengths and byaverage molecular weight ranges; as well as their frequency ofoccurrence in the aromatic fringes population and individual con-tribution to the average molecular weight of the aromatic fringe ofthe samples. The average molecular weights, MW, of the sample’saromatic fringes are also given in Table 6.
Results from the HRTEM image analysis show that the identi-fied fringes ranged from benzene (<3 Å) to 19 � 19 aromatic rings
(fringe length: 95–99.9 Å) corresponding to molecular weight dis-tributions ranging from 75 to 1925 amu. Coal TKD possessed ahigher percentage of longer fringes corresponding to higher molec-ular mass aromatic components [10,17,24,27] relative to the otherstudied samples. Coal FOZ was found to contain a higher distribu-tion of smaller aromatic fringes representing lower molecular masscomponents. The average molecular weight of the HRTEM aromaticfringes ranged from 506.9 amu for coal FOZ to 659.5 amu for coalDEN, which compared well with the solid state 13C NMR deter-mined results (Tables 5 and 6).
Assuming that the dominant moment angle of the HRTEMfringes is aligned parallel to the bedding plane [9]; it was possibleto construct rose diagrams to visualise the orientations of the aro-matic fringes with respect to the bedding plane. This was achievedby utilising the orientations of the fringes extracted from themoment angles of the skeletonised image using the IPTK 5.0plug-in on the Adobe Photoshop CS5 application platform. Theentire aromatic fringe population of each sample was used for thisexercise and plotted using GEOrient Version 9.5.0 software [75].The resulting rose diagrams of the coal samples are shown inFig. 10; they are comparable to reported results by Mathews andSharma [9]. The small arrowed red lines through the rose diagramsindicate the calculated bedding plane. Visual inspection and inter-pretation of the rose diagrams reveals that the orientation of thefringes normal to the bedding plane increases in the order: coalTKD < coal OGS < coal DEN < coal FOZ. This correlates well withthe trends observed from the solid state 13C NMR, WAXRD–CFAand qualitative ATR–FTIR analysis results, and further substanti-ates the increasing structural orderliness of the coals with increas-ing vitrinite reflectance (rank).
4. Conclusions
Various analytical techniques were successfully applied in thecharacterisation and elucidation of the chemical structural proper-ties of four South Africa bituminous coals.
� Aromaticity of the coals increases with increasing vitrinitereflectance of the samples from both solid state 13C NMR andWAXRD–CFA data. Qualitative ATR–FTIR show that coal TKD
G.N. Okolo et al. / Fuel 158 (2015) 779–792 791
(with greatest vitrinite reflectance of the samples investigated)contained greater amounts of polyaromatic moieties and longerchains of saturated aromatic hydrocarbons than the other sam-ples, and these increase with increasing Rr%.� HRTEM image analysis revealed that the aromatic fringe length
of the coals increases with increasing vitrinite reflectance of thesamples. Thus, coal TKD (with higher Rr%) consists of longerchains of polyaromatic hydrocarbon compared with the otherthree lower iso-rank coals. The average number of aromatic car-bons per cluster determined from solid state 13C NMR analysiswas higher for coal TKD which is consistent with WAXRD–CFA, ATR–FTIR and HRTEM analyses results.� The lattice parameters determined from WAXRD–CFA show
that the three lower rank coals investigated are structurally lesswell-ordered than the higher rank coal TKD, even though itexhibited a higher d002, Lc values.� Crystallite height, Lc, relatively increased with increasing coali-
fication; while crystallite diameter, La, remains fairly constantacross the coal ranks.� The rose diagrams constructed from the moment angle of the
aromatic fringes from the HRTEM image analysis shows thatthe aromatic fringes become more strongly aligned as rankincreases.� There is a good agreement between average molecular weight
of the aromatic fringes determined from HRTEM and solid state13C NMR data. The aromaticity of the samples as measured byWAXRD–CFA was very similar to the solid state 13C NMR deter-mined values. Both the fraction of amorphous carbon and theindex of disorder were found to correlate well with the aro-maticity of the samples, and decreases with increasing Rr%.� It has been demonstrated that, for the four South African bitu-
minous coals studied in this investigation, that vitrinite reflec-tance impacted more on the chemical–structural properties ofthe samples than maceral compositions.
Acknowledgements
This work is based on the research financially supported by theSouth African Research Chairs Initiative of the Department ofScience and Technology and National Research Foundation ofSouth Africa (Chair Grant No.: 86880, UID 85643, Grant No.:85632). Any opinion, finding or conclusion or recommendationexpressed in this material is that of the author(s) and the NRF doesnot accept any liability in this regard. Dr Sabine Verryn (XRDAnalytical and Consulting cc, Pretoria, South Africa) and DrBurgert Hattingh (Sasol Technology (Pty) Ltd., Sasolburg, SouthAfrica) are acknowledged for their help and support in theWAXRD–CFA and HRTEM image analysis respectively. The critiqueof Dr Mihaela Grigore of CSIRO Energy, North Ryde, NSW, Australiais highly appreciated.
References
[1] Gupta R. Advanced coal characterization: a review. Energy Fuels2007;21(2):451–60.
[2] Okolo GN. The effects of chemical and physical properties of chars derivedfrom inertinite-rich, high ash coals on gasification reactionkinetics. Potchefstroom, South Africa: North-West University; 2010. 275p.
[3] Hattingh BB, Everson RC, Neomagus HWJP, Bunt JR, van Niekerk D, Jordaan JHL,et al. Elucidation of the structural and molecular properties of typical SouthAfrican coals. Energy Fuels 2013;27(6):3161–72.
[4] Mathews JP, Krishnamoorthy V, Louw E, Tchapda AHN, Castro-Marcano F, KarriV, et al. A review of the correlations of coal properties with elementalcomposition. Fuel Process Technol 2014;121:104–13.
[5] White CM, Smith DH, Jones KL, Goodman AL, Jikich SA, LaCount RB, et al.Sequestration of carbon dioxide in coal with enhanced coalbed methanerecovery – a review. Energy Fuels 2005;19(3):659–724.
[6] Bachu S. Carbon dioxide storage capacity in uneconomic coal beds in Alberta,Canada: Methodology, potential and site identification. Int J Greenhouse GasControl 2007;1(3):374–85.
[7] Benson SM, Surles T. Carbon dioxide capture and storage: an overview withemphasis on capture and storage in deep geological formations. Proc IEEE2006;94(10):1795–805.
[8] Miknis FP, Sullivan M, Bartuska VJ, Maciel GE. Cross-polarization magic-anglespinning 13C NMR spectra of coals of varying rank. Org Geochem1981;3(1):19–28.
[9] Mathews JP, Sharma A. The structural alignment of coal and the analogous caseof Argonne Upper Freeport coal. Fuel 2012;95:19–24.
[10] Mathews J, Jones A, Pappano P, Hurt R, Schobert H. New insights into coalstructure from the combination of HRTEM and laser desorption ionizationmass spectrometry. In: 11th International conference on coal science, SanFrancisco, CA; 2001.
[11] Sharma A, Kyotani T, Tomita A. Direct observation of raw coals in lattice fringemode using high-resolution transmission electron microscopy. Energy Fuels2000;14(6):1219–25.
[12] Sharma A, Kyotani T, Tomita A. A new quantitative approach formicrostructural analysis of coal char using HRTEM images. Fuel1999;78(10):1203–12.
[13] Lu L, Sahajwalla V, Kong C, Harris D. Quantitative X-ray diffraction analysis andits application to various coals. Carbon 2001;39(12):1821–33.
[14] Solum MS, Pugmire RJ, Grant DM. Carbon-13 solid-state NMR of argonne-premium coals. Energy Fuels 1989;3(2):187–93.
[15] Supaluknari S, Burgar I, Larkins FP. High-resolution solid-state 13C NMRstudies of Australian coals. Org Geochem 1990;15(5):509–19.
[16] Yannoni CS. High-resolution NMR in solids: the CPMAS experiment. Acc ChemRes 1982;15(7):201–8.
[17] Van Niekerk D, Pugmire RJ, Solum MS, Painter PC, Mathews JP. Structuralcharacterization of vitrinite-rich and inertinite-rich Permian-aged SouthAfrican bituminous coals. Int J Coal Geol 2008;76(4):290–300.
[18] Franklin RE. The interpretation of diffuse X-ray diagrams of carbon. ActaCrystallogr A 1950;3(2):107–21.
[19] Everson RC, Okolo GN, Neomagus HW, dos Santos J-M. X-ray diffractionparameters and reaction rate modeling for gasification and combustion ofchars derived from inertinite-rich coals. Fuel 2013;109:148–56.
[20] Mielczarski JA, Denca A, Strojek JW. Application of attenuated total reflectioninfrared spectroscopy to the characterization of coal. Appl Spectrosc1986;40(7):998–1004.
[21] Painter PC, Snyder R. The application of Fourier transform infraredspectroscopy to the characterization of coal structure. Am Chem Soc, DivFuel Chem, Prepr 1980;25:46–57.
[22] Painter PC, Snyder RW, Starsinic M, Coleman MM, Kuehn DW, Davis A.Concerning the application of FT-IR to the study of coal: a critical assessmentof band assignments and the application of spectral analysis programs. ApplSpectrosc 1981;35(5):475–85.
[23] Xuguang S. The investigation of chemical structure of coal macerals viatransmitted-light FT-IR microspectroscopy. Spectrochim Acta Part A MolBiomol Spectrosc 2005;62(1–3):557–64.
[24] Mathews JP, Fernandez-Also V, Daniel Jones A, Schobert HH. Determining themolecular weight distribution of Pocahontas No. 3 low-volatile bituminouscoal utilizing HRTEM and laser desorption ionization mass spectra data. Fuel2010;89(7):1461–9.
[25] Solum MS, Sarofim AF, Pugmire RJ, Fletcher TH, Zhang H. 13C NMR analysis ofsoot produced from model compounds and a coal. Energy Fuels2001;15(4):961–71.
[26] Wemmer DE, Pines A, Whitehurst DD, Ladner WR, 13C n. 13C n.m.r. studies ofcoal and coal extracts [and discussion]. Philos Trans R Soc Lond. Ser A, MathPhys Sci 1981;300(1453):15–41.
[27] Roberts MJ, Everson RC, Neomagus HWJP, Van Niekerk D, Mathews JP,Branken DJ. Influence of maceral composition on the structure, propertiesand behaviour of chars derived from South African coals. Fuel 2015;142:9–20.
[28] Lu L, Kong C, Sahajwalla V, Harris D. Char structural ordering during pyrolysisand combustion and its influence on char reactivity. Fuel 2002;81(9):1215–25.
[29] Tran KN, Berkovich AJ, Tomsett A, Bhatia SK. Crystalline structuretransformation of carbon anodes during gasification. Energy Fuels 2008;22(3):1902–10.
[30] Shim H-S, Hurt RH, Yang NYC. A methodology for analysis of 002 lattice fringeimages and its application to combustion-derived carbons. Carbon2000;38(1):29–45.
[31] Takagi H, Maruyama K, Yoshizawa N, Yamada Y, Sato Y. XRD analysis of carbonstacking structure in coal during heat treatment. Fuel 2004;83(17–18):2427–33.
[32] Castro-Marcano F, Kamat AM, Russo Jr MF, van Duin ACT, Mathews JP.Combustion of an Illinois No. 6 coal char simulated using an atomistic charrepresentation and the ReaxFF reactive force field. Combust Flame2012;159(3):1272–85.
[33] Roberts MJ, Everson RC, Domazetis G, Neomagus HWJP, Jones JM, VanSittert CGCE, et al. Density functional theory molecular modelling andexperimental particle kinetics for CO2–char gasification. Carbon 2015;93:295–314.
[34] Pou JO, Alvarez YE, Watson JK, Mathews JP, Pisupati S. Co-primary thermolysismolecular modeling simulation of lignin and subbituminous coal via a reactivecoarse-grained simplification. J Anal Appl Pyrol 2012;95:101–11.

792 G.N. Okolo et al. / Fuel 158 (2015) 779–792
[35] Evanseck JD, Madura JD, Mathews JP. Use of molecular modeling to determinethe interaction and competition of gases within coal for carbon dioxidesequestration. Duquesne University; 2003. 19p.
[36] Mathews JP, Chaffee AL. The molecular representations of coal – a review. Fuel2012;96:1–14.
[37] Mathews JP, van Duin ACT, Chaffee AL. The utility of coal molecular models.Fuel Process Technol 2011;92(4):718–28.
[38] Narkiewicz MR, Mathews JP. Visual representation of carbon dioxideadsorption in a low-volatile bituminous coal molecular model. Energy Fuels2009;23(10):5236–46.
[39] Van Niekerk D, Mathews JP. Molecular dynamic simulation of coal–solventinteractions in Permian-aged South African coals. Fuel Process Technol2011;92(4):729–34.
[40] Van Niekerk D, Mathews JP. Molecular representations of Permian-agedvitrinite-rich and inertinite-rich South African coals. Fuel 2010;89(1):73–82.
[41] Janovac SJ. Multi-dimensional screen, in United States Patent No. 4491517,4491517 USPN. WS Tyler Incorporated, Ohio, US; 1985. 3p.
[42] Strydom CA, Bunt JR, Schobert HH, Raghoo M. Changes to the organicfunctional groups of an inertinite rich medium rank bituminous coal duringacid treatment processes. Fuel Process Technol 2011;92(4):764–70.
[43] Muntean JV, Stock LM. Bloch decay solid-state carbon-13 NMR spectroscopy ofthe samarium iodide-treated Argonne Premium coals. Energy Fuels1991;5(5):765–7.
[44] Muntean JV, Stock LM, Botto RE. Improving the reliability of quantitative solid-state 13C NMR analysis of coal. Energy Fuels 1988;2(1):108–10.
[45] Molander GA. Reductions with Samarium (II) Iodide. Org React2004;46(3):211–367.
[46] Malumbazo N, Wagner NJ, Bunt JR, Van Niekerk D, Assumption H. Structuralanalysis of chars generated from South African inertinite coals in a pipe-reactor combustion unit. Fuel Process Technol 2011;92(4):743–9.
[47] ISO. Solid mineral fuels. Hard coal – determination of moisture in the generalanalysis test sample by drying in nitrogen, in ISO 11722:2013. InternationalOrganisation for Standardisation, Geneva, Switzerland; 2013. 5p.
[48] ISO. Solid mineral fuels: determination of ash, in ISO 1171:2010. InternationalOrganisation for Standardisation, Geneva, Switzerland; 2010. 4p.
[49] ISO. Hard coal and coke- Determination of volatile matter, in ISO 562:2010.International Organisation for Standardisation, Geneva, Switzerland; 2010. 8p.
[50] ISO. Coal Ultimate analysis, in ISO 17247:2013. International Organisation forStandardisation, Geneva, Switzerland; 2013. 5p.
[51] ISO. Solid mineral fuels – determination of sulfur by IR spectrometry, in ISO19579:2006. International Organisation for Standardisation, Geneva,Switzerland; 2006. 4p.
[52] ISO. Methods for the petrographic analysis of coals. Part 2: Methods ofpreparing coal samples, in ISO 7404-2:2009. International Organisation forStandardisation, Geneva, Switzerland; 2009. 12p.
[53] ISO. Methods for the petrographic analysis of coals. Part 5: Method ofdetermining microscopically the reflectance of vitrinite, in ISO 7404-5:2009.International Organisation for Standardisation: Geneva, Switzerland; 2009.14p.
[54] ISO. Classification of coals, in ISO 11760:2005. International Organisation forStandardisation, Geneva, Switzerland; 2005. 9p.
[55] ISO. Methods for the petrographic analysis of coals. Part 3: Method ofdetermining maceral group composition, in ISO 7404-3:2009. InternationalOrganisation for Standardisation, Geneva, Switzerland; 2009. 7p.
[56] Smith WH, Roux HJ, Steyn JGH. The classification of coal macerals and theirrelation to certain chemical and physical parameters of coal. Spec Publ GeolSoc S Afr 1983;7:111–5.
[57] Everson RC, Neomagus HWJP, Kaitano R, Falcon R, van Alphen C, du Cann VM.Properties of high ash char particles derived from inertinite-rich coal: 1.Chemical, structural and petrographic characteristics. Fuel 2008;87(13-14):3082–90.
[58] Iwashita N, Park CR, Fujimoto H, Shiraishi M, Inagaki M. Specification for astandard procedure of X-ray diffraction measurements on carbon materials.Carbon 2004;42(4):701–14.
[59] ASTM International, standard test method for determination of crystallite size(Lc) of calcined petroleum coke by X-ray diffraction, in ASTM D-5187:1997.ASTM International; 1997. p. 180–2.
[60] Trejo F, Ancheyta J, Morgan TJ, Herod AA, Kandiyoti R. Characterization ofasphaltenes from hydrotreated products by SEC, LDMS, MALDI, NMR, and XRD.Energy Fuels 2007;21(4):2121–8.
[61] Alexander LE, Sommer EC. Systematic analysis of carbon black structures. JPhys Chem 1956;60(12):1646–9.
[62] Wang J, Morishita K, Takarada T. High-temperature interactions between coalchar and mixtures of calcium oxide, quartz, and kaolinite. Energy Fuels2001;15(5):1145–52.
[63] Wu S, Gu J, Zhang X, Wu Y, Gao J. Variation of carbon crystalline structures andCO2 gasification reactivity of Shenfu coal chars at elevated temperatures.Energy Fuels 2008;22(1):199–206.
[64] Coates J. Interpretation of infrared spectra, a practical approach, inencyclopedia of analytical chemistry. In: Meyers RA, editor, John Wiley &Sons Ltd, Chichester, UK; 2000. p. 10815–37.
[65] Speight JG. Application of spectroscopic techniques to the structural analysisof coal. Appl Spectrosc Rev 1994;29(2):117–69.
[66] Orrego J, Cabanzo Hernández R, Mejía-Ospino E. Structural study of Colombiancoal by fourier transform infrared spectroscopy coupled to attenuated totalreflectance (FTIR–ATR). Revista Mexicana de Física 2010;56(3):251–4.
[67] Painter PC, Starsinic M, Squires E, Davis AA. Concerning the 1600 cm�1 regionin the IR spectrum of coal. Fuel 1983;62(6):742–4.
[68] Painter P, Sobkowiak M, Youtcheff J. FT-IR study of hydrogen bonding in coal.Fuel 1987;66(7):973–8.
[69] Machnikowska H, Krzton A, Machnikowski J. The characterization of coalmacerals by diffuse reflectance infrared spectroscopy. Fuel2002;81(2):245–52.
[70] Mastalerz M, Bustin RM. Variation in maceral chemistry within and betweencoals of varying rank: an electron microprobe and micro-Fourier transforminfra-red investigation. J Microsc 1993;171(2):153–66.
[71] Causemann S. Report on ss 13C NMR characterisation of four coal samples.Central Analytical Facility (CAF), Stellenbosch University; 2012. 6p.
[72] Brewer CE, Schmidt-Rohr K, Satrio JA, Brown RC. Characterization of biocharfrom fast pyrolysis and gasification systems. Environ Progr Sustain Energy2009;28(3):386–96.
[73] Okolo GN, Everson RC, Neomagus HWJP, Roberts MJ, Sakurovs R. Comparingthe porosity and surface areas of coal as measured by gas adsorption, mercuryintrusion and SAXS techniques. Fuel 2015;141:293–304.
[74] Crelling JC, Skorupska NM, Marsh H. Reactivity of coal macerals and lithotypes.Fuel 1988;67(6):781–5.
[75] GEOrient Version 9.5.0. Available from: http://www.holcombe.net.au.software(assessed 30.11.12).
Copyright © 2022 FDOKUMEN