HRTEM characterization of the nanostructural features formed in highly active Ni–Nb–O catalysts...
7
HRTEM characterization of the nanostructural features formed in highly active Ni–Nb–O catalysts for ethane ODH E. Heracleous a , A. Delimitis b , L. Nalbandian b , A.A. Lemonidou a, * a Department of Chemical Engineering, Aristotle University of Thessaloniki and CERTH/CPERI, P.O. Box 1517, University Campus, GR-54006 Thessaloniki, Greece b Laboratory of Analysis & Characterization of Solids, Chemical Process Engineering Research Institute (CPERI/CERTH), P.O. Box 361, GR-57001 Thessaloniki, Greece Received 21 July 2006; accepted 7 February 2007 Available online 3 March 2007 Abstract In this work, we report an in-depth structural characterization of pure NiO and Ni–Nb–O mixed oxide catalysts (Nb/Ni = 0–0.25), highly active and selective materials for ethylene production via ethane ODH, using high resolution transmission electron microscopy (HRTEM) coupled with energy dispersive X-ray analysis (EDS). This study led to the identification and investigation of the nanostructural features formed in the Nb-doped NiO catalysts and their relation with the excellent catalytic functionality of the Ni–Nb–O materials. It was found that low-temperature treatment of pure NiO leads to the formation of a non-stoichiometric oxidic phase with characteristic structural defects due to cationic deficiency, as demonstrated by microscopy results. On the Nb-doped oxides, two distinct structural phases, formed via the reaction of the Nb cations with the cationic vacancies, were identified: a NiO phase having Nb cations incorporated in the host lattice, which retains its initial cubic structure (Ni–Nb solid solution), and a highly distorted Nb-rich phase, precursor for the formation of the mixed NiNb 2 O 6 crystal compound. The reduction of the structural defects in NiO via their interaction with the niobium ions was correlated with the extremely high selectivity of the Ni–Nb–O catalysts to ethylene in the ethane ODH reaction, since these vacancies lead to the formation of strong oxidizing electrophilic oxygen species (O ), responsible for the total oxidation of ethane to CO 2 . # 2007 Elsevier B.V. All rights reserved. Keywords: Non-stoichiometric NiO; Ni–Nb–O mixed metal oxides; High-resolution transmission electron microscopy (HRTEM); Ethane oxidative dehydrogenation; Ethylene 1. Introduction Ethylene, one of the most important bulk petrochemicals, is exclusively produced via steam cracking of various petroleum fractions, mainly naphtha and ethane. With ethylene demands constantly rising and the general claim for industry to convert to clean energetically balanced processes in the frame of environment protection and preservation of non-renewable energy sources, the development of an alternative process for ethylene production is becoming an increasingly urgent task. Catalytic oxidative dehydrogenation (ODH) of ethane is an attractive alternative route for the production of ethylene, which overcomes the main disadvantages of the current conventional method [1–5]. The key for a viable industrial application of this process is the development of a highly active and selective catalytic material, able to activate and convert the relatively inert alkane to olefin at low temperature and minimize the parallel and consecutive side reactions of both the alkane and alkene to carbon oxides. Our group has performed extensive investigations on transition metal oxides catalysts for the oxidative dehydro- genation of C 2 –C 4 alkanes [6–12]. Recently, we have reported [10–12] the high potential of a new class of catalytic materials based on nickel for the oxidative dehydrogenation of ethane to ethylene. The developed bulk Ni–Nb–O mixed nano-oxides [11] exhibit high activity in ethane ODH at low reaction temperature and very high selectivity, resulting in an overall ethene yield of 46% at 400 8C. Varying the Nb/Ni atomic ratio led to an optimum catalytic performance for catalysts with Nb/ Ni ratio in the range 0.11–0.18. Detailed characterization of the www.elsevier.com/locate/apcata Applied Catalysis A: General 325 (2007) 220–226 * Corresponding author. Tel.: +30 2310 996273; fax: +30 2310 996184. E-mail address: [email protected] (A.A. Lemonidou). 0926-860X/$ – see front matter # 2007 Elsevier B.V. All rights reserved. doi:10.1016/j.apcata.2007.02.030
Transcript of HRTEM characterization of the nanostructural features formed in highly active Ni–Nb–O catalysts...

www.elsevier.com/locate/apcata
Applied Catalysis A: General 325 (2007) 220–226
HRTEM characterization of the nanostructural features formed in
highly active Ni–Nb–O catalysts for ethane ODH
E. Heracleous a, A. Delimitis b, L. Nalbandian b, A.A. Lemonidou a,*a Department of Chemical Engineering, Aristotle University of Thessaloniki and CERTH/CPERI, P.O. Box 1517,
University Campus, GR-54006 Thessaloniki, Greeceb Laboratory of Analysis & Characterization of Solids, Chemical Process Engineering Research Institute (CPERI/CERTH),
P.O. Box 361, GR-57001 Thessaloniki, Greece
Received 21 July 2006; accepted 7 February 2007
Available online 3 March 2007
Abstract
In this work, we report an in-depth structural characterization of pure NiO and Ni–Nb–O mixed oxide catalysts (Nb/Ni = 0–0.25), highly active
and selective materials for ethylene production via ethane ODH, using high resolution transmission electron microscopy (HRTEM) coupled with
energy dispersive X-ray analysis (EDS). This study led to the identification and investigation of the nanostructural features formed in the Nb-doped
NiO catalysts and their relation with the excellent catalytic functionality of the Ni–Nb–O materials. It was found that low-temperature treatment of
pure NiO leads to the formation of a non-stoichiometric oxidic phase with characteristic structural defects due to cationic deficiency, as
demonstrated by microscopy results. On the Nb-doped oxides, two distinct structural phases, formed via the reaction of the Nb cations with the
cationic vacancies, were identified: a NiO phase having Nb cations incorporated in the host lattice, which retains its initial cubic structure (Ni–Nb
solid solution), and a highly distorted Nb-rich phase, precursor for the formation of the mixed NiNb2O6 crystal compound. The reduction of the
structural defects in NiO via their interaction with the niobium ions was correlated with the extremely high selectivity of the Ni–Nb–O catalysts to
ethylene in the ethane ODH reaction, since these vacancies lead to the formation of strong oxidizing electrophilic oxygen species (O�), responsible
for the total oxidation of ethane to CO2.
# 2007 Elsevier B.V. All rights reserved.
Keywords: Non-stoichiometric NiO; Ni–Nb–O mixed metal oxides; High-resolution transmission electron microscopy (HRTEM); Ethane oxidative
dehydrogenation; Ethylene
1. Introduction
Ethylene, one of the most important bulk petrochemicals, is
exclusively produced via steam cracking of various petroleum
fractions, mainly naphtha and ethane. With ethylene demands
constantly rising and the general claim for industry to convert to
clean energetically balanced processes in the frame of
environment protection and preservation of non-renewable
energy sources, the development of an alternative process for
ethylene production is becoming an increasingly urgent task.
Catalytic oxidative dehydrogenation (ODH) of ethane is an
attractive alternative route for the production of ethylene, which
overcomes the main disadvantages of the current conventional
* Corresponding author. Tel.: +30 2310 996273; fax: +30 2310 996184.
E-mail address: [email protected] (A.A. Lemonidou).
0926-860X/$ – see front matter # 2007 Elsevier B.V. All rights reserved.
doi:10.1016/j.apcata.2007.02.030
method [1–5]. The key for a viable industrial application of this
process is the development of a highly active and selective
catalytic material, able to activate and convert the relatively
inert alkane to olefin at low temperature and minimize the
parallel and consecutive side reactions of both the alkane and
alkene to carbon oxides.
Our group has performed extensive investigations on
transition metal oxides catalysts for the oxidative dehydro-
genation of C2–C4 alkanes [6–12]. Recently, we have reported
[10–12] the high potential of a new class of catalytic materials
based on nickel for the oxidative dehydrogenation of ethane to
ethylene. The developed bulk Ni–Nb–O mixed nano-oxides
[11] exhibit high activity in ethane ODH at low reaction
temperature and very high selectivity, resulting in an overall
ethene yield of 46% at 400 8C. Varying the Nb/Ni atomic ratio
led to an optimum catalytic performance for catalysts with Nb/
Ni ratio in the range 0.11–0.18. Detailed characterization of the
E. Heracleous et al. / Applied Catalysis A: General 325 (2007) 220–226 221
as-synthesized materials with several techniques [11] showed
that the key component for the excellent catalytic behavior is
the Ni–Nb solid solution formed upon the introduction of
niobium in NiO, evidenced by the contraction of the NiO lattice
constant, since even small amounts of Nb effectively converted
NiO from a total oxidation catalyst (80% selectivity to CO2) to
a very efficient ethane ODH material. An upper maximum
dissolution of Nb5+ cations in the NiO lattice was attained for
Nb/Ni ratios �0.18, with higher Nb contents leading to
inhomogeneity and segregation of the NiO and Nb2O5 phases.
The incorporation of Nb in the NiO lattice, by substitution of
nickel atoms and/or filling of the cationic vacancies in the
defective non-stoichiometric NiO surface structure, led to a
reduction of the materials non-stoichiometry, as indicated by
TPD-O2, electrical conductivity measurements [11] and
isotopic oxygen (18O2) exchange [12] and consequently of
the electrophilic oxygen species (O�), which are abundant in
NiO and responsible for the total oxidation of ethane to carbon
dioxide. The Nb-induced effects were related to charge
compensation phenomena, as a consequence of the Ni2+
substitution by Nb5+ and due to the difference of ionic charge,
as discussed in detail in Ref. [11].
Therefore, the excellent catalytic behavior of the Ni–Nb–O
nano-oxides in ethane ODH is related to the electronic and
structural rearrangement induced by the incorporation of
niobium cations in the NiO lattice. This substitution-induced
enhancement in catalytic activity has been observed for several
mixed-metal oxides with different structures [13–15], with
however no concerted efforts to explore how the morphological
changes arising from cationic substitution, such as changes in
size, shape, surface area etc., are related or contribute to the
observed catalytic performance. In this work, we report an in-
depth characterization of the developed Ni–Nb–O mixed oxides
for ethane ODH (with Nb/Ni atomic ratios ranging from 0 to
0.25) using HRTEM observations, coupled with chemical
analysis by EDS, in order to study the nanostructural features
formed in the materials and their relation with the improved
catalytic results.
2. Experimental part
2.1. Catalyst preparation
The series of mixed Ni–Nb–O oxides with varying Nb/Ni
atomic ratio from 0 to 0.25 was prepared by the evaporation
method. Details on the preparation procedure followed can be
found in Ref. [11]. The catalysts are referred to as NixNby,
Table 1
Nomenclature and physicochemical characteristics of the catalysts [11]
Sample Nb/Ni atomic
ratio
% wt. NiO
loading
Surface area
(m2/g)
Crystalli
S–NiO 0 100 9.4 NiO
NS–NiO 0 100 16.7 NiO
Ni0.9Nb0.1 0.111 83.49 55.9 ‘‘NiO-lik
Ni0.85Nb0.15 0.176 76.10 85.1 ‘‘NiO-lik
Ni0.8Nb0.2 0.250 69.21 58.6 ‘‘NiO-lik
where x and y indicate the atomic content of Ni and Nb,
respectively, relative to the total metal content of the materials.
Non-stoichiometric (black) and stoichiometric (green) pure
nickel oxides phases (denoted as NS–NiO and S–NiO), used in
this study to explore the effect of non-stoichiometry, were
prepared by decomposition of Ni(NO3)2�6H2O (nickel nitrate
hexahydrate, >99%, Merck) precursor at 450 8C and 700 8C,
respectively, for 5 h in synthetic air.
2.2. HRTEM characterization
Samples for electron microscopy observations were
prepared by gently grinding the catalyst powders in high-
purity ethanol using an agate pestle and mortar. A drop of the
solution was subsequently deposited onto a lacey C-film
supported on a Cu grid and allowed to evaporate under
ambience conditions. Electron microscopy experiments were
carried out in a JEOL 2011 high resolution transmission
electron microscope, operating at 200 kV, with a point
resolution of 0.23 nm and Cs = 1.0 mm. The microscope is
also fitted with an Oxford Instruments INCAx-sight liquid
nitrogen cooled EDS detector with an Si(Li) window for
detailed elemental analysis of the catalysts. Processing of the
spectra was accomplished using the INCA Microanalysis Suite
version 4.02 software.
3. Results
The composition and main physicochemical characteristics
of the nickel oxide phases and the Ni–Nb–O mixed oxides, as
determined in Ref. [11], as well as the corresponding XRD
patterns are repeated in Table 1 and Fig. 1, respectively for the
reader’s convenience. A summary of the catalytic results of a
series of Ni–Nb–O mixed oxides with a Nb/Ni atomic ratio
ranging from 0 to 0.67, is presented in Table 2. The study of the
materials’ catalytic performance clearly demonstrated that
introducing even small amounts of Nb in NiO convert nickel
oxide from an effective total oxidation catalyst to an efficient
low-temperature with very high selectivity ODH catalyst [11].
Characterization of the high-temperature treated NiO
sample (S–NiO) by HRTEM indicates that pure NiO calcined
at high temperature is structurally uniform and consists of well-
defined crystallites [Fig. 2(a)] in the 50–200 nm range, with
average size at �60 nm. The inset shows a selected area
electron diffraction (SAD) pattern, obtained from the single
crystalline particle in Fig. 2(a). SAD analysis reveals that it can
be indexed to a fcc NiO structure along its [1 1 0] zone axis,
ne phases NiO average crystal
size (by XRD) (nm)
NiO lattice constant
(by XRD) (A´
)
61.7 4.1760
31.8 4.1762
e’’ phase, Nb-rich phase 21.4 4.1751
e’’ phase, Nb-rich phase 16.7 4.1725
e’’ phase, NiNb2O6 14.3 4.1722

Fig. 1. X-ray diffraction patterns of the Ni–Nb–O catalysts (Nb/Ni atomic ratio:
0–0.25) and pure stoichiometric and non-stoichiometric NiO [11].
Fig. 2. (a) Bright field (BF) TEM image of a platelet in the S–NiO catalyst,
viewed slightly off its [1 1 0] projection, as shown in the SAD pattern inset. (b)
HRTEM image of the same platelet near the surface area, revealing that the S–
NiO catalyst is free from any extended structural defects. The (1 1 1) lattice
fringes of NiO are clearly resolved.
E. Heracleous et al. / Applied Catalysis A: General 325 (2007) 220–226222
with a lattice parameter of a = 0.4176 nm, in agreement with
reported data (JCPDS 4-0835) and the analysis of the X-ray
diffraction pattern of the above-mentioned sample (see
Table 1). The clearly visible (1 1 1) lattice planes of the NiO
phase, illustrated in the HRTEM image of Fig. 2(b), confirm the
long-range order crystallization of the stoichiometric sample.
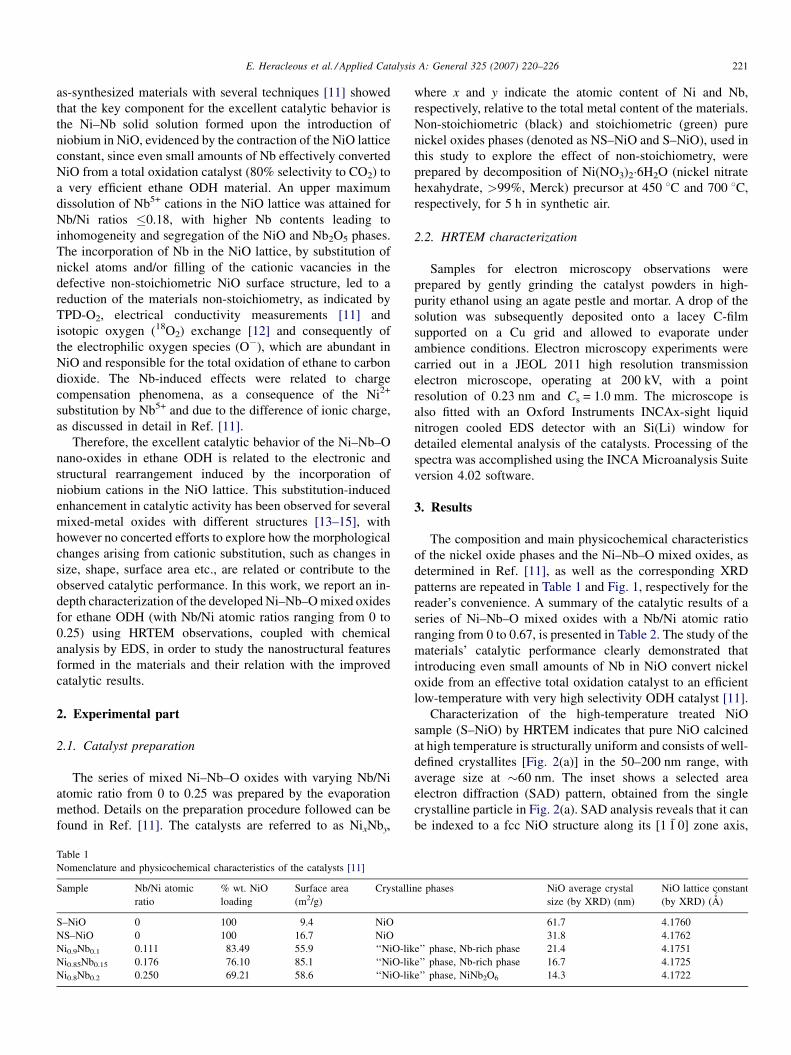
Investigation of the non-stoichiometric NiO sample (NS–
NiO) shows that as the calcination temperature decreases to
450 8C, a morphological change and a distortion of the nickel
oxide crystal structure occurs. The HRTEM image in Fig. 3
demonstrates the presence of extended structural defects
(arrowed), which are identified as stacking faults (SFs), while
the distorted lattice planes can be clearly seen in the same
image. The inset [1 1 0] SAD pattern confirms that the SFs run
along the two (1 1 1) and (1 1 1) crystal planes, which is
commonly found for cubic structures. Energy-dispersive X-ray
(EDS) analysis on several parts of the investigated sample
reveals a systematic excess of oxygen compared to the nickel
content, in contrast to the S–NiO sample where the atomic ratio
of Ni:O was always in the range of 1:1. The detected planar
defects (SFs) are homogeneously distributed in the individual
mono-crystallites, however it should be pointed out that the
amount of defects differs throughout the sample with areas of
Table 2
Catalytic performance of the Ni–Nb–O mixed oxides in the ethane oxidative dehy
Sample Reaction temperature = 300 8Ca
C2H6 conversion (%) C2H4 selectivity (%) CO2 selectivity
NS–NiO 3.5 12.4 87.6
Ni0.9Nb0.1 7.3 77.8 22.2
Ni0.85Nb0.15 10.5 86.2 13.8
Ni0.8Nb0.2 7.0 80.9 19.1
Ni0.7Nb0.3 5.8 77.2 22.8
Ni0.6Nb0.4 2.0 80.2 19.8
a Reaction conditions: W/F = 0.54 g s/cm3, C2H6/O2 = 1/1.
higher and lower density of cationic vacancies. Consequently,
characterization by transmission electron microscopy provides
clear evidence that NiO calcined at low temperatures is a highly
defective, non-stoichiometric oxide with cationic deficiency
(Ni1�xO), in accordance with the general consensus in literature
about the non-stoichiometric nature of NiO [16,17].
Doping NiO with niobium results in significant changes in
the crystalline morphology. The HRTEM image of the sample
Ni0.9Nb0.1 (Nb/Ni ratio = 0.111) in Fig. 4 demonstrates a clear
reduction of the crystallite size, while two relatively well-
defined areas are recognized: a well-crystallized cubic phase of
ordered structure (marked as I on Fig. 4) and a highly distorted
phase II, which appears in small concentration throughout the
drogenation reaction [11]
Reaction temperature = 400 8Ca
(%) C2H6 conversion (%) C2H4 selectivity (%) CO2 selectivity (%)
28.6 22.7 77.3
55.1 66.9 33.1
66.7 67.8 32.2
61.1 64.0 36.0
45.3 64.7 35.3
25.3 73.8 26.2
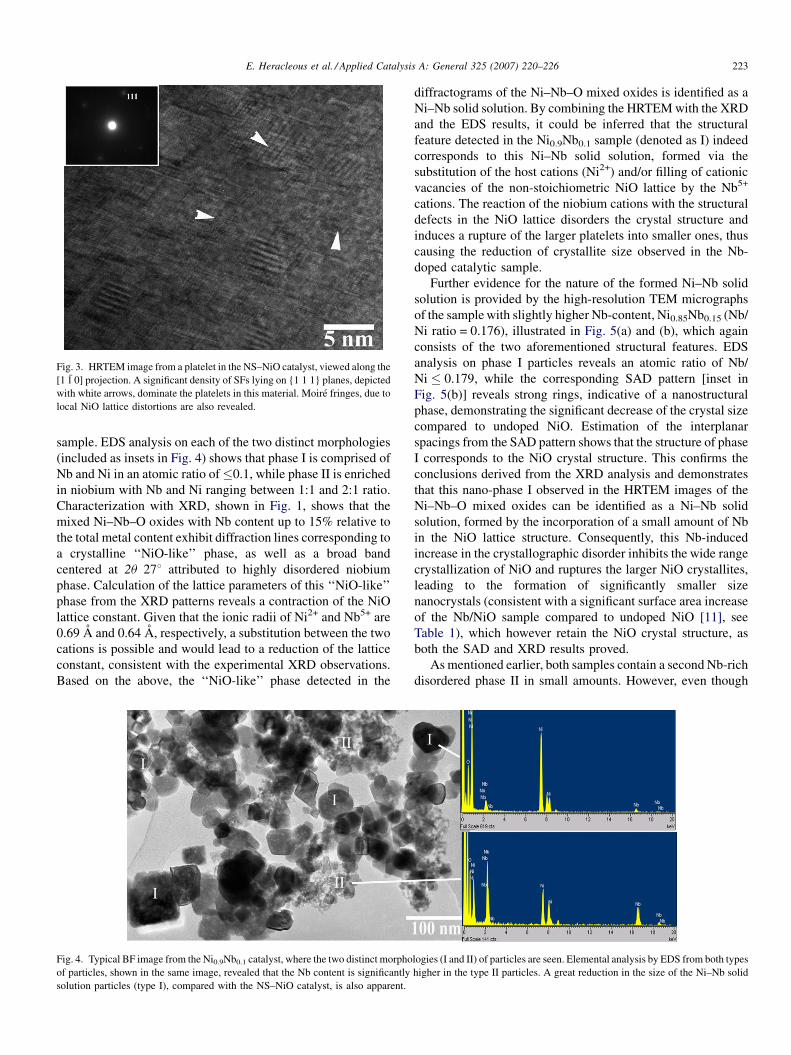
Fig. 3. HRTEM image from a platelet in the NS–NiO catalyst, viewed along the
[1 1 0] projection. A significant density of SFs lying on {1 1 1} planes, depicted
with white arrows, dominate the platelets in this material. Moire fringes, due to
local NiO lattice distortions are also revealed.
E. Heracleous et al. / Applied Catalysis A: General 325 (2007) 220–226 223
sample. EDS analysis on each of the two distinct morphologies
(included as insets in Fig. 4) shows that phase I is comprised of
Nb and Ni in an atomic ratio of�0.1, while phase II is enriched
in niobium with Nb and Ni ranging between 1:1 and 2:1 ratio.
Characterization with XRD, shown in Fig. 1, shows that the
mixed Ni–Nb–O oxides with Nb content up to 15% relative to
the total metal content exhibit diffraction lines corresponding to
a crystalline ‘‘NiO-like’’ phase, as well as a broad band
centered at 2u 278 attributed to highly disordered niobium
phase. Calculation of the lattice parameters of this ‘‘NiO-like’’
phase from the XRD patterns reveals a contraction of the NiO
lattice constant. Given that the ionic radii of Ni2+ and Nb5+ are
0.69 A and 0.64 A, respectively, a substitution between the two
cations is possible and would lead to a reduction of the lattice
constant, consistent with the experimental XRD observations.
Based on the above, the ‘‘NiO-like’’ phase detected in the
Fig. 4. Typical BF image from the Ni0.9Nb0.1 catalyst, where the two distinct morpho
of particles, shown in the same image, revealed that the Nb content is significantly
solution particles (type I), compared with the NS–NiO catalyst, is also apparent.
diffractograms of the Ni–Nb–O mixed oxides is identified as a
Ni–Nb solid solution. By combining the HRTEM with the XRD
and the EDS results, it could be inferred that the structural
feature detected in the Ni0.9Nb0.1 sample (denoted as I) indeed
corresponds to this Ni–Nb solid solution, formed via the
substitution of the host cations (Ni2+) and/or filling of cationic
vacancies of the non-stoichiometric NiO lattice by the Nb5+
cations. The reaction of the niobium cations with the structural
defects in the NiO lattice disorders the crystal structure and
induces a rupture of the larger platelets into smaller ones, thus
causing the reduction of crystallite size observed in the Nb-
doped catalytic sample.
Further evidence for the nature of the formed Ni–Nb solid
solution is provided by the high-resolution TEM micrographs
of the sample with slightly higher Nb-content, Ni0.85Nb0.15 (Nb/
Ni ratio = 0.176), illustrated in Fig. 5(a) and (b), which again
consists of the two aforementioned structural features. EDS
analysis on phase I particles reveals an atomic ratio of Nb/
Ni � 0.179, while the corresponding SAD pattern [inset in
Fig. 5(b)] reveals strong rings, indicative of a nanostructural
phase, demonstrating the significant decrease of the crystal size
compared to undoped NiO. Estimation of the interplanar
spacings from the SAD pattern shows that the structure of phase
I corresponds to the NiO crystal structure. This confirms the
conclusions derived from the XRD analysis and demonstrates
that this nano-phase I observed in the HRTEM images of the
Ni–Nb–O mixed oxides can be identified as a Ni–Nb solid
solution, formed by the incorporation of a small amount of Nb
in the NiO lattice structure. Consequently, this Nb-induced
increase in the crystallographic disorder inhibits the wide range
crystallization of NiO and ruptures the larger NiO crystallites,
leading to the formation of significantly smaller size
nanocrystals (consistent with a significant surface area increase
of the Nb/NiO sample compared to undoped NiO [11], see
Table 1), which however retain the NiO crystal structure, as
both the SAD and XRD results proved.
As mentioned earlier, both samples contain a second Nb-rich
disordered phase II in small amounts. However, even though
logies (I and II) of particles are seen. Elemental analysis by EDS from both types
higher in the type II particles. A great reduction in the size of the Ni–Nb solid
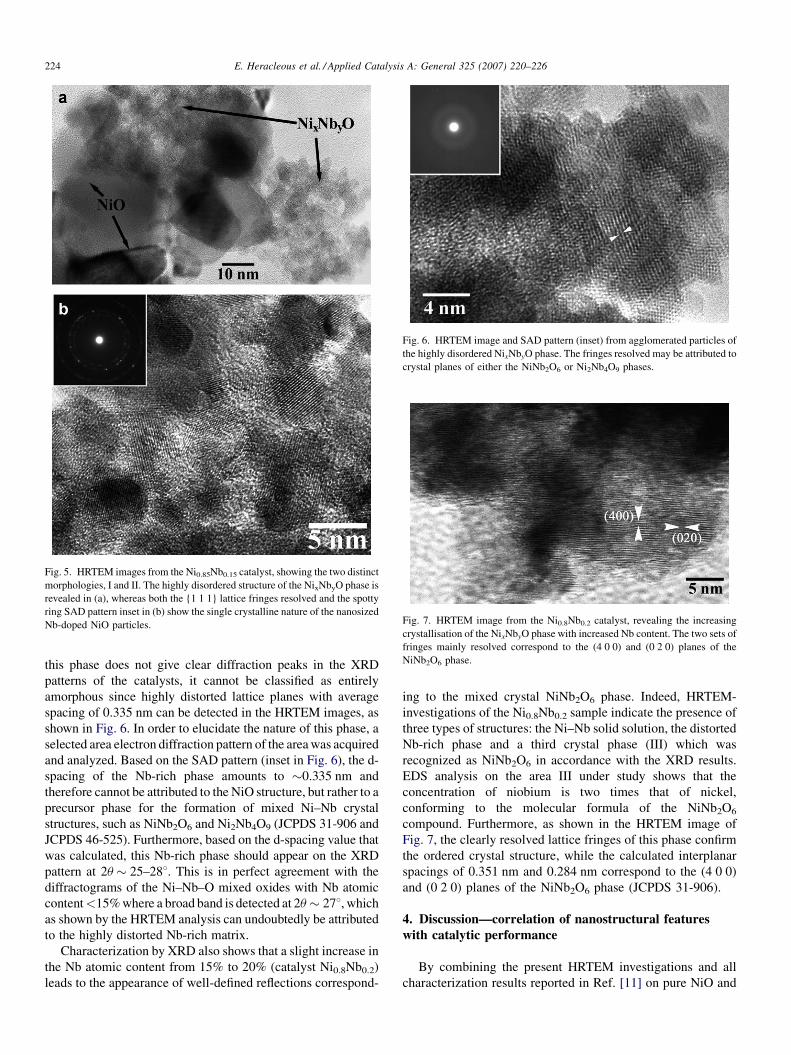
Fig. 5. HRTEM images from the Ni0.85Nb0.15 catalyst, showing the two distinct
morphologies, I and II. The highly disordered structure of the NixNbyO phase is
revealed in (a), whereas both the {1 1 1} lattice fringes resolved and the spotty
ring SAD pattern inset in (b) show the single crystalline nature of the nanosized
Nb-doped NiO particles.
Fig. 6. HRTEM image and SAD pattern (inset) from agglomerated particles of
the highly disordered NixNbyO phase. The fringes resolved may be attributed to
crystal planes of either the NiNb2O6 or Ni2Nb4O9 phases.
Fig. 7. HRTEM image from the Ni0.8Nb0.2 catalyst, revealing the increasing
crystallisation of the NixNbyO phase with increased Nb content. The two sets of
fringes mainly resolved correspond to the (4 0 0) and (0 2 0) planes of the
NiNb2O6 phase.
E. Heracleous et al. / Applied Catalysis A: General 325 (2007) 220–226224
this phase does not give clear diffraction peaks in the XRD
patterns of the catalysts, it cannot be classified as entirely
amorphous since highly distorted lattice planes with average
spacing of 0.335 nm can be detected in the HRTEM images, as
shown in Fig. 6. In order to elucidate the nature of this phase, a
selected area electron diffraction pattern of the area was acquired
and analyzed. Based on the SAD pattern (inset in Fig. 6), the d-
spacing of the Nb-rich phase amounts to �0.335 nm and
therefore cannot be attributed to the NiO structure, but rather to a
precursor phase for the formation of mixed Ni–Nb crystal
structures, such as NiNb2O6 and Ni2Nb4O9 (JCPDS 31-906 and
JCPDS 46-525). Furthermore, based on the d-spacing value that
was calculated, this Nb-rich phase should appear on the XRD
pattern at 2u � 25–288. This is in perfect agreement with the
diffractograms of the Ni–Nb–O mixed oxides with Nb atomic
content<15% where a broad band is detected at 2u � 278, which
as shown by the HRTEM analysis can undoubtedly be attributed
to the highly distorted Nb-rich matrix.
Characterization by XRD also shows that a slight increase in
the Nb atomic content from 15% to 20% (catalyst Ni0.8Nb0.2)
leads to the appearance of well-defined reflections correspond-
ing to the mixed crystal NiNb2O6 phase. Indeed, HRTEM-
investigations of the Ni0.8Nb0.2 sample indicate the presence of
three types of structures: the Ni–Nb solid solution, the distorted
Nb-rich phase and a third crystal phase (III) which was
recognized as NiNb2O6 in accordance with the XRD results.
EDS analysis on the area III under study shows that the
concentration of niobium is two times that of nickel,
conforming to the molecular formula of the NiNb2O6
compound. Furthermore, as shown in the HRTEM image of
Fig. 7, the clearly resolved lattice fringes of this phase confirm
the ordered crystal structure, while the calculated interplanar
spacings of 0.351 nm and 0.284 nm correspond to the (4 0 0)
and (0 2 0) planes of the NiNb2O6 phase (JCPDS 31-906).
4. Discussion—correlation of nanostructural features
with catalytic performance
By combining the present HRTEM investigations and all
characterization results reported in Ref. [11] on pure NiO and

E. Heracleous et al. / Applied Catalysis A: General 325 (2007) 220–226 225
Ni–Nb–O mixed oxides, the following can be deduced: pure
NiO calcined at high temperatures is stoichiometric, structu-
rally uniform and consists of long-range order, well-defined
cubic microcrystallites. Calcination at low temperatures leads
to the formation of a highly non-stoichiometric oxidic phase,
with visible extensive structural defects due to cationic
vacancies (i.e., nickel deficiency). These defects are inhomo-
geneously distributed throughout the sample, with areas of
higher and lower concentration of vacant sites. Addition of
niobium leads to the reaction of the foreign species (Nb5+) with
these NiO-defects leading to the formation of two distinct
structural features. On the areas of low-density population of
cationic vacancies, a small amount of Nb is incorporated in the
NiO host lattice, causing distortion of the crystallographic
planes and rupture of the larger crystallites that consequently
leads to significantly lower crystal size (in the nanorange) and
contributes to the higher surface area (see Table 1) of the Ni–
Nb–O catalysts. The SAD patterns indicate that the NiO lattice
structure is retained and therefore, this nano-phase can be
attributed to a Ni–Nb solid solution (designated as phase I). On
the areas of high-density population of defects, the amount of
Nb inserted in NiO exceeds the maximum capacity of foreign
species that nickel oxide lattice is capable of accommodating
and preserving at the same time its crystallographic structure.
Therefore, on these Nb-rich areas a non-well crystallized
structural feature forms (designated as phase II), which
however exhibits highly distorted lattice planes with interplanar
spacings that correspond to mixed Ni–Nb phases, such as
NiNb2O6 and Ni2Nb4O9, as demonstrated by the SAD, HRTEM
and EDS results. Phase II has an extremely small particle size
(less than 10 nm) and is probably the main contributor to the
high surface area recorded for the Ni–Nb–O catalysts.
Additionally, this distorted phase constitutes the precursor
for formation of the mixed NiNb2O6 crystal phase (designated
as phase III), which gives clear reflections on the XRD pattern
of the intermediate Nb-loading catalyst (Ni0.8Nb0.2) and
conforms to the observed longer-range order structure in the
HRTEM images of the sample. Further increase of the Nb/Ni
ratio results in extended segregation and separation of the pure
NiO and Nb2O5 phases [11].
Moving on to the catalysis aspects of the Ni–Nb–O mixed
oxides, this new class of catalytic materials, as recently
demonstrated in a previous work [11], exhibits high potential
for the low-temperature oxidative dehydrogenation of ethane to
ethylene (see Table 2 for a summary of catalytic performance).
This was related to the reaction of the Nb cations with the
cationic defects and their insertion in the NiO lattice, leading to
the formation of a Ni–Nb solid solution. This conclusion is
nicely confirmed and complimented by the HRTEM investiga-
tions presented in this work, where a nanostructural Ni-rich
phase, which however retains the NiO crystal structure, was
observed in the Ni–Nb–O mixed oxide catalysts. The reaction
of Nb with the cationic vacancies leads to rupture of larger
crystals into smaller ones, thus increasing the surface area and
consequently the per weight activity of the samples in the
ethane ODH reaction. The elimination and/or reduction of the
vacant sites on NiO via their reaction with the foreign cations is
responsible for the high selectivity of the catalysts to ethylene
during ethane ODH. According to literature [11,18,19], the
non-stoichiometry of NiO renders the surface able to
accommodate large amounts of excess electrophilic oxygen
species (O�) on the surface, strong oxidizing species
responsible for the total oxidation of ethane to CO2. Therefore,
the reduction of non-stoichiometry leads to elimination of the
unselective oxygen species, resulting in the high ethylene
selectivity and enhanced ethane ODH activity observed over
the Ni–Nb–O mixed oxides. The contribution of the second Nb-
rich structural feature to the catalytic performance still remains
unclear, since it is almost impossible to isolate this phase and
evaluate independently its catalytic function. The nanoparticles
of this phase certainly are the main contributors to the increased
surface area (and thus to the per weight activity) of the
catalysts, which significantly drops when the mixed NiNb2O6
phase acquires a well-crystallized structure (Ni0.8Nb0.2
sample). Further studies are in progress in order to fully
comprehend and interpret the catalytic action of the individual
structures in the ethane oxidative dehydrogenation reaction
over Ni–Nb–O mixed metal oxide catalysts.
5. Conclusions
In-depth structural characterization of pure NiO and Ni–Nb–
O mixed oxide catalysts (highly active and selective materials
for the production of ethylene via ethane oxidative dehydro-
genation) by HRTEM led to the identification of the
nanostructural features formed upon doping of NiO with Nb
cations. Low-temperature treatment of NiO causes the
formation of highly reactive stacking faults due to cationic
deficiency. The reaction of the foreign species (Nb) with these
cationic vacancies leads to the formation of two distinct
structural phases: a Ni-rich crystallized phase with Nb cations
incorporated in the NiO lattice, which retains its original
crystallographic structure, and a highly distorted Nb-rich phase,
precursor for the formation of the mixed NiNb2O6 crystal
compound. In terms of catalytic performance, the elimination
of the NiO structural defects by niobium is responsible for the
high selectivity of the Ni–Nb–O catalysts in the ethane ODH
reaction to ethylene, since these vacancies lead to the formation
of strong oxidizing electrophilic oxygen species (O�)
responsible for the total oxidation of ethane to CO2.
Furthermore, the insertion of Nb significantly reduces the
crystallite size and consequently increases the surface area and
the per weight activity of the materials.
References
[1] G. Centi, F. Cavani, F. Trifiro, Selective Oxidation by Heterogeneous
Catalysis, Kluwer Academic Publishers/Plenum Press, New York, 2001.
[2] E.A. Mamedov, V. Cortes-Corberan, Appl. Catal. A 127 (1995) 1.
[3] J. Le Bars, J.C. Vedrine, A. Auroux, Appl. Catal. A 88 (1992) 179.
[4] O.V. Buyevskaya, A. Bruckner, E.V. Kondratenko, D. Wolf, M. Baerns,
Catal. Today 67 (2001) 369.
[5] D. Creaser, B. Andersson, R.R. Hudgins, P.L. Silveston, Chem. Eng. Sci.
54 (1999) 4437.
[6] A.A. Lemonidou, Appl. Catal. A 216 (2001) 277.

E. Heracleous et al. / Applied Catalysis A: General 325 (2007) 220–226226
[7] M. Machli, E. Heracleous, A.A. Lemonidou, Appl. Catal. A 236 (2002)
23.
[8] E. Heracleous, A.F. Lee, I.A. Vasalos, A.A. Lemonidou, Catal. Lett. 88
(2003) 47.
[9] E. Heracleous, M. Machli, A.A. Lemonidou, I.A. Vasalos, J. Mol. Catal. A
232 (2005) 29.
[10] E. Heracleous, A.F. Lee, K. Wilson, A.A. Lemonidou, J. Catal. 231 (2005)
159.
[11] E. Heracleous, A.A. Lemonidou, J. Catal. 237 (2006) 162.
[12] E. Heracleous, A.A. Lemonidou, J. Catal. 237 (2006) 175.
[13] H. Tanaka, M. Misono, Curr. Opin. Sol. Stat. Mater. Sci. 5 (2001) 381.
[14] S. Varma, B.N. Wani, N.M. Gupta, Appl. Catal. A 205 (2001) 295.
[15] A. Ponchel, A. D’Huysser, C. Lamonier, L. Jalowiecki-Duhamel, PCCP 2
(2000) 303.
[16] S. Lee, H.M. Cheong, N. Park, C.E. Tracy, A. Mascarenhas, D.K. Benson,
S.K. Deb, Solid State Ionics 140 (2001) 135.
[17] P.A. Cox, Transition Metal Oxides: An Introduction to Their Electronic
Structure and Properties, Oxford University Inc., New York, 1992 , pp.
170–178.
[18] A.M. Turky, Appl. Catal. A 247 (2003) 83.
[19] A. Bielanski, J. Haber, Oxygen in Catalysis, Marcel Dekker, Inc., New
York, 1991.

![Voltammetric monitoring of Cd (II) by nano-TiO2 modified carbon paste electrode sensitized using 1,2-bis-[o-aminophenyl thio] ethane as a new ion receptor](https://static.fdokumen.com/doc/165x107/63328e4ef008040551048773/voltammetric-monitoring-of-cd-ii-by-nano-tio2-modified-carbon-paste-electrode.jpg)