EPR, FTIR, thermal and electrical properties of VO2+ doped BaCl2BaOB2O3 glasses
6
EPR, FTIR, thermal and electrical properties of VO 2+ doped BaCl 2 BaOB 2 O 3 glasses Satish Khasa a,⇑ , M.S. Dahiya a , Ashish Agarwal b , Prem Chand c a Department of Physics, Deenbandhu Chhotu Ram University of Science and Technology, Murthal 131039, Haryana, India b Department of Applied Physics, Guru Jambheshwar University of Science and Technology, Hisar 125001, Haryana, India c P.M. College of Engineering, Kami Road, Sonipat 131001, Haryana, India highlights V 4+ ion exists as VO 2+ ion. The network is modified by addition of BaCl 2 . Glass stability decreases with BaCl 2 . The ac and dc conductivities are decreasing with BaCl 2 and supports IR predictions. graphical abstract article info Article history: Received 1 July 2014 Received in revised form 25 August 2014 Accepted 3 September 2014 Available online 16 September 2014 Keywords: EPR Glass transition temperature Impedance spectroscopy Electrical conductivity Vanadyl ion abstract Glasses with composition xBaCl 2 (30-x)BaO68B 2 O 3 2V 2 O 5 (x = 0, 2, 5, 10, in mol%) were prepared by the conventional melt quenching technique. The Electron paramagnetic resonance (EPR) spectra have been recorded at room temperature and the Spin Hamiltonian Parameters (SHPs) of VO 2+ ion were calculated. It was observed that with the increase in BaCl 2 :BaO ratio, the tetragonal symmetry of the V 4+ O 6 complex was improved and there was an expansion in the 3d xy orbital. Infrared (IR) transmission spectra were recorded at room temperature using FTIR spectroscope and it was found that in glass structure, BO 3 tri- angular units are being replaced by the BO 4 tetrahedral units on addition of halide content. The glass transition temperature (T g ) and crystalline temperature (T x ) were determined using Simultaneous Ther- mal Analyzer (STA). The trends in T g and T x suggests that there is a decrease in glass stability and glass forming ability (GFA) with increasing Cl ions content. The dc conductivity & impedance spectroscopy has been analyzed in the temperature region from 353 K to 573 K and in the frequency range from 10 Hz to 7 MHz. The frequency dependence of conductivity was found in accordance with the Jonscher’s relation. Ó 2014 Elsevier B.V. All rights reserved. Introduction Glasses have always been attractive due to their versatile and fascinating properties. Alkali halide borate glasses have been stud- ied over the past few decades because of their unique behavior towards structure and other properties (specially electrical, optical, thermal etc.) as compared to the corresponding silicate and germ- anate glasses [1–10]. In recent years a number of researchers [11– 13] have devoted their works to study the structure and high ionic conductivity (10 2 X 1 m 1 ) of alkali halide borate glasses (par- ticularly lithium chloride borate glasses). These glasses due to their http://dx.doi.org/10.1016/j.molstruc.2014.09.012 0022-2860/Ó 2014 Elsevier B.V. All rights reserved. ⇑ Corresponding author. Tel.: +91 130 2484136; fax: +91 130 2484003. E-mail address: [email protected] (S. Khasa). Journal of Molecular Structure 1079 (2015) 15–20 Contents lists available at ScienceDirect Journal of Molecular Structure journal homepage: www.elsevier.com/locate/molstruc
-
Upload
dcrustmurthal -
Category
Documents
-
view
0 -
download
0
Transcript of EPR, FTIR, thermal and electrical properties of VO2+ doped BaCl2BaOB2O3 glasses
Journal of Molecular Structure 1079 (2015) 15–20
Contents lists available at ScienceDirect
Journal of Molecular Structure
journal homepage: www.elsevier .com/ locate /molst ruc
EPR, FTIR, thermal and electrical properties of VO2+ dopedBaCl2�BaO�B2O3 glasses
http://dx.doi.org/10.1016/j.molstruc.2014.09.0120022-2860/� 2014 Elsevier B.V. All rights reserved.
⇑ Corresponding author. Tel.: +91 130 2484136; fax: +91 130 2484003.E-mail address: [email protected] (S. Khasa).
Satish Khasa a,⇑, M.S. Dahiya a, Ashish Agarwal b, Prem Chand c
a Department of Physics, Deenbandhu Chhotu Ram University of Science and Technology, Murthal 131039, Haryana, Indiab Department of Applied Physics, Guru Jambheshwar University of Science and Technology, Hisar 125001, Haryana, Indiac P.M. College of Engineering, Kami Road, Sonipat 131001, Haryana, India
h i g h l i g h t s
� V4+ ion exists as VO2+ ion.� The network is modified by addition
of BaCl2.� Glass stability decreases with BaCl2.� The ac and dc conductivities are
decreasing with BaCl2 and supports IRpredictions.
g r a p h i c a l a b s t r a c t
a r t i c l e i n f o
Article history:Received 1 July 2014Received in revised form 25 August 2014Accepted 3 September 2014Available online 16 September 2014
Keywords:EPRGlass transition temperatureImpedance spectroscopyElectrical conductivityVanadyl ion
a b s t r a c t
Glasses with composition xBaCl2�(30-x)BaO�68B2O3�2V2O5 (x = 0, 2, 5, 10, in mol%) were prepared by theconventional melt quenching technique. The Electron paramagnetic resonance (EPR) spectra have beenrecorded at room temperature and the Spin Hamiltonian Parameters (SHPs) of VO2+ ion were calculated.It was observed that with the increase in BaCl2:BaO ratio, the tetragonal symmetry of the V4+O6 complexwas improved and there was an expansion in the 3dxy orbital. Infrared (IR) transmission spectra wererecorded at room temperature using FTIR spectroscope and it was found that in glass structure, BO3 tri-angular units are being replaced by the BO4 tetrahedral units on addition of halide content. The glasstransition temperature (Tg) and crystalline temperature (Tx) were determined using Simultaneous Ther-mal Analyzer (STA). The trends in Tg and Tx suggests that there is a decrease in glass stability and glassforming ability (GFA) with increasing Cl� ions content. The dc conductivity & impedance spectroscopyhas been analyzed in the temperature region from 353 K to 573 K and in the frequency range from10 Hz to 7 MHz. The frequency dependence of conductivity was found in accordance with the Jonscher’srelation.
� 2014 Elsevier B.V. All rights reserved.
Introduction ied over the past few decades because of their unique behavior
Glasses have always been attractive due to their versatile andfascinating properties. Alkali halide borate glasses have been stud-
towards structure and other properties (specially electrical, optical,thermal etc.) as compared to the corresponding silicate and germ-anate glasses [1–10]. In recent years a number of researchers [11–13] have devoted their works to study the structure and high ionicconductivity (�10�2 X�1 m�1) of alkali halide borate glasses (par-ticularly lithium chloride borate glasses). These glasses due to their

16 S. Khasa et al. / Journal of Molecular Structure 1079 (2015) 15–20
superior ionic conductivity behavior are suitable for use in solidstate batteries and in various electrochemical devices. The varia-tion in conductivity was explained by considering the hypothesisthat halogen atoms are incorporated into the network of alkaliborate glasses with the formation of [BO3/2X]� groups [14]. Insodium fluoride borate glasses, Pronkin et al. [14] suggested thatthe conductivity of fluorine-containing borate glasses is almostone & half orders of magnitude higher than the conductivity of cor-responding base glasses such as Na2O–B2O3 etc. After consideringthe fact that the [BO3/2F]– structural unit is a distorted tetrahedronin which an excess negative charge is localized on fluorine, thealkali cation is fixed on the fluorine side and the B–F bond isshorter than the B–O bond. Consequently B–F bond has a higherdegree of iconicity as suggested by Pronkin et al. [14]. Many otherresearchers [4–6] also suggested that an increase in the conductiv-ity of alkali chloro-borate glasses is due to the formation of newiono-genic groups of mixed ion composition [BO3/2Cl]–M+. The dis-sociation energy of these groups is lower than that of [BO4/2Cl]–M+
groups. Khasa et al. [15] studied MX�M2O�B2O3 (M = Na or K; X = Clor Br) glasses doped with V2O5 (2.0 mol%) and reported that withincrease in MCl:M2O ratio, the value of conductivity increased from10�6 X�1 m�1 to 10�4 X�1 m�1 in the temperatures range of 373–513 K. During the study of oxyhalide silicate glasses, Kiprianov andKarpukhina [8] concluded from IR spectroscopic results that themain features of the structural motif are retained in the networkand the chlorine atoms form bridging bonds between four-coordi-nated boron atoms.
Alkaline earth oxide glasses doped with transition metal oxideswere reported by many researchers [16–19] due to their increasingapplications in developing new potential devices like fiber opticcommunications, solar cells etc. but few work was devoted tostudy alkaline earth oxyhalide glasses [20–23]. Buddhudu andHemalatha Rudramadevi [20] studied XRD, TG-DTA and FTIR spec-tra of rare earth doped B2O3–BaO–LiF glasses to understand theirthermal and structural properties. These glasses were identifiedas potential materials for their use in the progress of glass lasersand optoelectronics. The glass formation in the BaO–BaCl2–B2O3
system has been recently studied by Brekhovskikh et al. [21] andit was observed that there is a loss of chlorine when the processis run in argon atmosphere rather than in ambient atmosphere.The super ionic properties of BaCl2 in binary alkaline-earth halideshave recently been studied by Stephen Hull et al. [22]. In view ofthis, we have extended our work to study the effect of adding BaCl2
in oxide glasses on their structural, thermal and electrical proper-ties. In previous papers [23,24] Khasa et al. studied oxy-chlorideborate glasses and found from the results of molar volume, densityand FTIR studies that the non-bridging oxygen is formed and BO3
units are converted to BO4 units. Consequently the structurebecomes open with an increase in alkaline halide contents.
In the present paper the authors have studied BaCl2�BaO�B2-
O3 + V2O5 (2.0 mol%) glasses to observe the effect of BaCl2:BaOratio on tetragonal symmetry of vanadyl ions using Electron Para-magnetic Resonance (EPR). FTIR studies have also been carried outto find the structural relaxation information of boron oxide group(i.e. BO3 and BO4). The thermal stability, dc conductivity anddielectric properties (i.e. ac conductivity) of the above mentionedglasses were also studied for change with BaCl2 contents. Theresults of these studies are presented in this paper.
Experimental details
Glass preparation
The analar grade reagents of BaCl2, BaCO3, H3BO3 and V2O5 wereused as the starting materials. The desired composition was mixed
and homogenized as a fine powder. The crushed homogeneousmixture was put in a porcelain crucible. The melting was doneby putting the mixture at 1323 K in an electrical muffle furnacefor about 40 min. Crucible was stirred regularly so as to achievehomogeneity. The melt was then rapid quenched with the helpof stainless steel quenching plates in air to obtain glass materialby melt quench technique [25]. The samples codes BB1, BB2, BB3and BB4 were assigned to the samples (Table 1).
EPR measurements
The first derivative EPR spectra were recorded at the room tem-perature (RT) in the X-band (m � 9.3 GHz) on an EPR spectrometer(Varian E-109). The magnetic field was modulated by 100 kHz. Thesample was placed at the magnetic field maxima in a TE102 cavity.Polycrystalline diphenyl picryl hydrazyl (DPPH) was used as thestandard g maker (g � 2.0036) for the calculation of the Spin Ham-iltonian Parameters. The applied magnetic field was caliberatedwith an NMR fluxmeter.
FTIR spectroscopy
To determine the main features concerning the local glass struc-ture, the FTIR spectra of samples were obtained by employing KBrPallet technique (i.e. samples were crushed to fine powder havingaverage particle size 1–2 microns in a clean mortar and mixedhomogeneously with potassium bromide (KBr) in ratio 1:100.The transparent pallets with 0.7–0.8 mm thickness were madewith the help of die set having 13 mm diameter by applying a con-stant pressure of 7–8 ton using a hydraulic press). The infraredspectra were recorded on a Perkin Elmer Frontier FTIR spectrome-ter over 400–4000 cm�1 range at RT. 8 scans with a resolution of0.4 cm�1 were averaged out to get the final FTIR spectrograph [26].
Differential scanning calorimetric (DSC)
The differential scanning calorimetric (DSC) studies of bulksamples were carried out on a Perkin Elmer STA 6000 model. Theheating rate taken was 15 K/minute over the temperature rangeof 373–1083 K. The glass transition temperature was calculatedfrom the so obtained DSC thermographs. Details of the completemethodology are available in literature [27].
DC conductivity
To measure dc conductivity, samples in the form of rectangularslices of nearly one-mm uniform thickness were polished to obtainplane surfaces. For electrode formation the plane surfaces of thesamples were coated with colloidal silver paint. Conductivity mea-surements were done over a temperature range of 373–593 K bymeasuring current (I) and voltage (V) ratio with the help of fourprobes. An instant constant voltage of 50 V was applied acrossthe sample and the circulating current was measured with the helpof a Keithley source/measure unit (Model 2401).
AC conductivity
For ac conductivity the samples were first cut into rectangularshape and polished to optical quality on both sides. For makingelectrodes colloidal silver paint was used. A constant voltage of30 mV was applied across the samples to measure the real (Z0)and imaginary (Z00) parts of complex impedance (Z*) using aninductance analyzer (QuadTech 1910) in the frequency range from10 Hz to 7 MHz. The A.C. measurements were recorded over thetemperature range of 323–623 K.
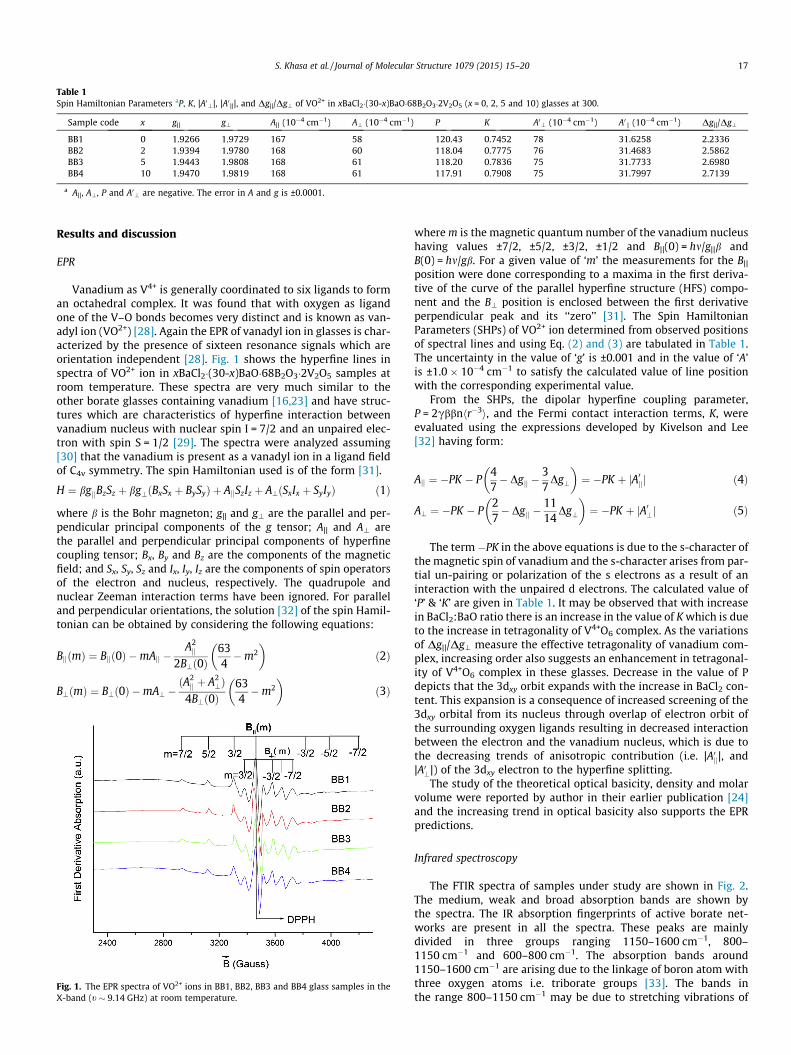
Table 1Spin Hamiltonian Parameters aP, K, |A0\|, |A0 |||, and Dg||/Dg\ of VO2+ in xBaCl2�(30-x)BaO�68B2O3�2V2O5 (x = 0, 2, 5 and 10) glasses at 300.
Sample code x g|| g\ A|| (10�4 cm�1) A\ (10�4 cm�1) P K A0\ (10�4 cm�1) A0k (10�4 cm�1) Dg||/Dg\
BB1 0 1.9266 1.9729 167 58 120.43 0.7452 78 31.6258 2.2336BB2 2 1.9394 1.9780 168 60 118.04 0.7775 76 31.4683 2.5862BB3 5 1.9443 1.9808 168 61 118.20 0.7836 75 31.7733 2.6980BB4 10 1.9470 1.9819 168 61 117.91 0.7908 75 31.7997 2.7139
a A||, A\, P and A0\ are negative. The error in A and g is ±0.0001.
S. Khasa et al. / Journal of Molecular Structure 1079 (2015) 15–20 17
Results and discussion
EPR
Vanadium as V4+ is generally coordinated to six ligands to forman octahedral complex. It was found that with oxygen as ligandone of the V–O bonds becomes very distinct and is known as van-adyl ion (VO2+) [28]. Again the EPR of vanadyl ion in glasses is char-acterized by the presence of sixteen resonance signals which areorientation independent [28]. Fig. 1 shows the hyperfine lines inspectra of VO2+ ion in xBaCl2�(30-x)BaO�68B2O3�2V2O5 samples atroom temperature. These spectra are very much similar to theother borate glasses containing vanadium [16,23] and have struc-tures which are characteristics of hyperfine interaction betweenvanadium nucleus with nuclear spin I = 7/2 and an unpaired elec-tron with spin S = 1/2 [29]. The spectra were analyzed assuming[30] that the vanadium is present as a vanadyl ion in a ligand fieldof C4v symmetry. The spin Hamiltonian used is of the form [31].
H ¼ bgjjBzSz þ bg?ðBxSx þ BySyÞ þ AjjSzIz þ A?ðSxIx þ SyIyÞ ð1Þ
where b is the Bohr magneton; g|| and g\ are the parallel and per-pendicular principal components of the g tensor; A|| and A\ arethe parallel and perpendicular principal components of hyperfinecoupling tensor; Bx, By and Bz are the components of the magneticfield; and Sx, Sy, Sz and Ix, Iy, Iz are the components of spin operatorsof the electron and nucleus, respectively. The quadrupole andnuclear Zeeman interaction terms have been ignored. For paralleland perpendicular orientations, the solution [32] of the spin Hamil-tonian can be obtained by considering the following equations:
BjjðmÞ ¼ Bjjð0Þ �mAjj �A2jj
2B?ð0Þ634�m2
� �ð2Þ
B?ðmÞ ¼ B?ð0Þ �mA? �ðA2jj þ A2
?Þ4B?ð0Þ
634�m2
� �ð3Þ
Fig. 1. The EPR spectra of VO2+ ions in BB1, BB2, BB3 and BB4 glass samples in theX-band (t � 9.14 GHz) at room temperature.
where m is the magnetic quantum number of the vanadium nucleushaving values ±7/2, ±5/2, ±3/2, ±1/2 and B||(0) = hm/g||b andB(0) = hm/gb. For a given value of ‘m’ the measurements for the B||
position were done corresponding to a maxima in the first deriva-tive of the curve of the parallel hyperfine structure (HFS) compo-nent and the B\ position is enclosed between the first derivativeperpendicular peak and its ‘‘zero’’ [31]. The Spin HamiltonianParameters (SHPs) of VO2+ ion determined from observed positionsof spectral lines and using Eq. (2) and (3) are tabulated in Table 1.The uncertainty in the value of ‘g’ is ±0.001 and in the value of ‘A’is ±1.0 � 10�4 cm�1 to satisfy the calculated value of line positionwith the corresponding experimental value.
From the SHPs, the dipolar hyperfine coupling parameter,P = 2cbbnhr�3i, and the Fermi contact interaction terms, K, wereevaluated using the expressions developed by Kivelson and Lee[32] having form:
Ajj ¼ �PK � P47� Dgjj �
37
Dg?
� �¼ �PK þ jA0jjj ð4Þ
A? ¼ �PK � P27� Dgjj �
1114
Dg?
� �¼ �PK þ jA0?j ð5Þ
The term �PK in the above equations is due to the s-character ofthe magnetic spin of vanadium and the s-character arises from par-tial un-pairing or polarization of the s electrons as a result of aninteraction with the unpaired d electrons. The calculated value of‘P’ & ‘K’ are given in Table 1. It may be observed that with increasein BaCl2:BaO ratio there is an increase in the value of K which is dueto the increase in tetragonality of V4+O6 complex. As the variationsof Dg||/Dg\ measure the effective tetragonality of vanadium com-plex, increasing order also suggests an enhancement in tetragonal-ity of V4+O6 complex in these glasses. Decrease in the value of Pdepicts that the 3dxy orbit expands with the increase in BaCl2 con-tent. This expansion is a consequence of increased screening of the3dxy orbital from its nucleus through overlap of electron orbit ofthe surrounding oxygen ligands resulting in decreased interactionbetween the electron and the vanadium nucleus, which is due tothe decreasing trends of anisotropic contribution (i.e. |A0jj|, and|A0?|) of the 3dxy electron to the hyperfine splitting.
The study of the theoretical optical basicity, density and molarvolume were reported by author in their earlier publication [24]and the increasing trend in optical basicity also supports the EPRpredictions.
Infrared spectroscopy
The FTIR spectra of samples under study are shown in Fig. 2.The medium, weak and broad absorption bands are shown bythe spectra. The IR absorption fingerprints of active borate net-works are present in all the spectra. These peaks are mainlydivided in three groups ranging 1150–1600 cm�1, 800–1150 cm�1 and 600–800 cm�1. The absorption bands around1150–1600 cm�1 are arising due to the linkage of boron atom withthree oxygen atoms i.e. triborate groups [33]. The bands inthe range 800–1150 cm�1 may be due to stretching vibrations of
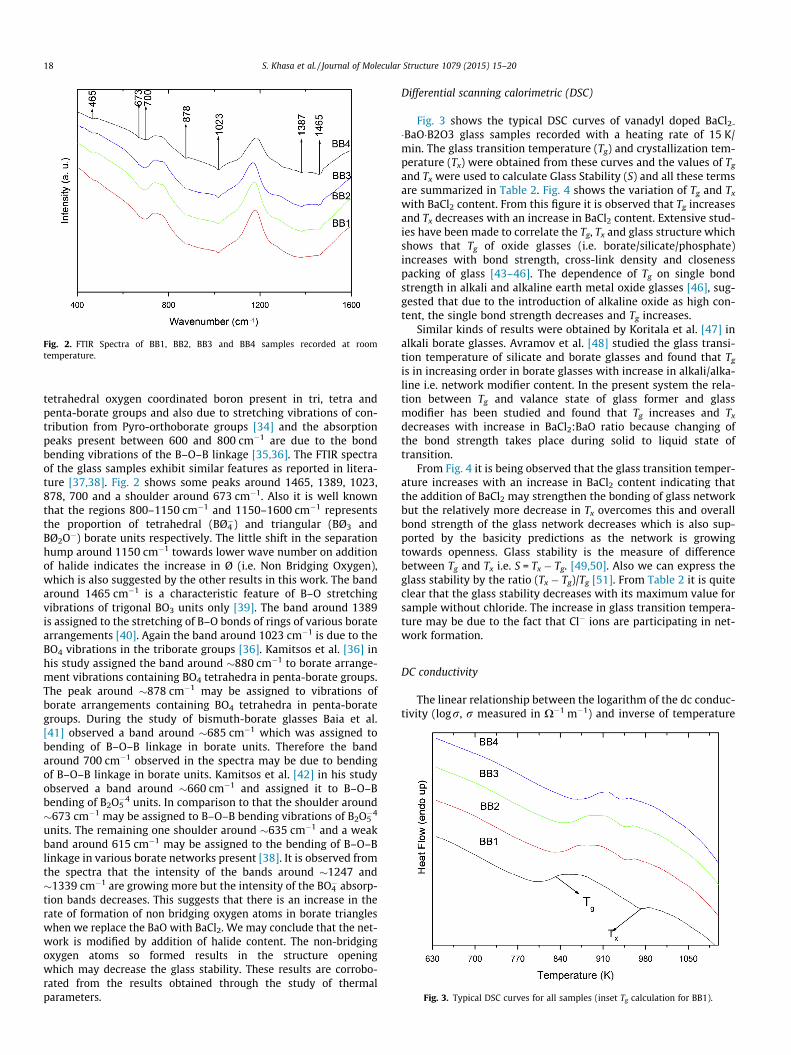
Fig. 2. FTIR Spectra of BB1, BB2, BB3 and BB4 samples recorded at roomtemperature.
Fig. 3. Typical DSC curves for all samples (inset Tg calculation for BB1).
18 S. Khasa et al. / Journal of Molecular Structure 1079 (2015) 15–20
tetrahedral oxygen coordinated boron present in tri, tetra andpenta-borate groups and also due to stretching vibrations of con-tribution from Pyro-orthoborate groups [34] and the absorptionpeaks present between 600 and 800 cm�1 are due to the bondbending vibrations of the B–O–B linkage [35,36]. The FTIR spectraof the glass samples exhibit similar features as reported in litera-ture [37,38]. Fig. 2 shows some peaks around 1465, 1389, 1023,878, 700 and a shoulder around 673 cm�1. Also it is well knownthat the regions 800–1150 cm�1 and 1150–1600 cm�1 representsthe proportion of tetrahedral (BØ4
�) and triangular (BØ3 andBØ2O�) borate units respectively. The little shift in the separationhump around 1150 cm�1 towards lower wave number on additionof halide indicates the increase in Ø (i.e. Non Bridging Oxygen),which is also suggested by the other results in this work. The bandaround 1465 cm�1 is a characteristic feature of B–O stretchingvibrations of trigonal BO3 units only [39]. The band around 1389is assigned to the stretching of B–O bonds of rings of various boratearrangements [40]. Again the band around 1023 cm�1 is due to theBO4 vibrations in the triborate groups [36]. Kamitsos et al. [36] inhis study assigned the band around �880 cm�1 to borate arrange-ment vibrations containing BO4 tetrahedra in penta-borate groups.The peak around �878 cm�1 may be assigned to vibrations ofborate arrangements containing BO4 tetrahedra in penta-borategroups. During the study of bismuth-borate glasses Baia et al.[41] observed a band around �685 cm�1 which was assigned tobending of B–O–B linkage in borate units. Therefore the bandaround 700 cm�1 observed in the spectra may be due to bendingof B–O–B linkage in borate units. Kamitsos et al. [42] in his studyobserved a band around �660 cm�1 and assigned it to B–O–Bbending of B2O5
�4 units. In comparison to that the shoulder around�673 cm�1 may be assigned to B–O–B bending vibrations of B2O5
�4
units. The remaining one shoulder around �635 cm�1 and a weakband around 615 cm�1 may be assigned to the bending of B–O–Blinkage in various borate networks present [38]. It is observed fromthe spectra that the intensity of the bands around �1247 and�1339 cm�1 are growing more but the intensity of the BO�4 absorp-tion bands decreases. This suggests that there is an increase in therate of formation of non bridging oxygen atoms in borate triangleswhen we replace the BaO with BaCl2. We may conclude that the net-work is modified by addition of halide content. The non-bridgingoxygen atoms so formed results in the structure openingwhich may decrease the glass stability. These results are corrobo-rated from the results obtained through the study of thermalparameters.
Differential scanning calorimetric (DSC)
Fig. 3 shows the typical DSC curves of vanadyl doped BaCl2-
�BaO�B2O3 glass samples recorded with a heating rate of 15 K/min. The glass transition temperature (Tg) and crystallization tem-perature (Tx) were obtained from these curves and the values of Tg
and Tx were used to calculate Glass Stability (S) and all these termsare summarized in Table 2. Fig. 4 shows the variation of Tg and Tx
with BaCl2 content. From this figure it is observed that Tg increasesand Tx decreases with an increase in BaCl2 content. Extensive stud-ies have been made to correlate the Tg, Tx and glass structure whichshows that Tg of oxide glasses (i.e. borate/silicate/phosphate)increases with bond strength, cross-link density and closenesspacking of glass [43–46]. The dependence of Tg on single bondstrength in alkali and alkaline earth metal oxide glasses [46], sug-gested that due to the introduction of alkaline oxide as high con-tent, the single bond strength decreases and Tg increases.
Similar kinds of results were obtained by Koritala et al. [47] inalkali borate glasses. Avramov et al. [48] studied the glass transi-tion temperature of silicate and borate glasses and found that Tg
is in increasing order in borate glasses with increase in alkali/alka-line i.e. network modifier content. In the present system the rela-tion between Tg and valance state of glass former and glassmodifier has been studied and found that Tg increases and Tx
decreases with increase in BaCl2:BaO ratio because changing ofthe bond strength takes place during solid to liquid state oftransition.
From Fig. 4 it is being observed that the glass transition temper-ature increases with an increase in BaCl2 content indicating thatthe addition of BaCl2 may strengthen the bonding of glass networkbut the relatively more decrease in Tx overcomes this and overallbond strength of the glass network decreases which is also sup-ported by the basicity predictions as the network is growingtowards openness. Glass stability is the measure of differencebetween Tg and Tx i.e. S = Tx � Tg. [49,50]. Also we can express theglass stability by the ratio (Tx � Tg)/Tg [51]. From Table 2 it is quiteclear that the glass stability decreases with its maximum value forsample without chloride. The increase in glass transition tempera-ture may be due to the fact that Cl� ions are participating in net-work formation.
DC conductivity
The linear relationship between the logarithm of the dc conduc-tivity (logr, r measured in X�1 m�1) and inverse of temperature

Table 2Glass transition temperature (Tg), crystalline temperature (Tx), glass stability (S), dc conductivity (r), logro, activation energy (W), ac conductivity (rac) and s parameter ofxBaCl2�(30-x)BaO�68B2O3�2V2O5 (x = 0, 2, 5 and 10) glasses.
Samplecode
Tg (±2)(K)
Tx (±2)(K)
S(K)
r573K
(X�1 m�1)r473K
(X�1 m�1)logr0
(X�1 m�1)W(eV)
rac at 573 K(X�1 m�1)
rac at 473 K(X�1 m�1)
S373K S473K
BB1 850 967 117 8.8 � 10�10 2.69 � 10�10 �6.59 0.279 4.83 � 10�5 5.3 � 10�5 1.106 0.571BB2 855 952 97 9.9 � 10�10 3.42 � 10�10 �6.65 0.271 2.87 � 10�5 3.16 � 10�5 0.747 0.525BB3 879 950 71 1.38 � 10�9 5.10 � 10�10 �5.26 0.255 2.38 � 10�5 2.56 � 10�5 1.329 0.846BB4 902 943 41 1.69 � 10�9 5.85 � 10�10 �5.16 0.250 1.05 � 10�5 1.19 � 10�5 1.211 0.452
Fig. 4. Variation of Tg and Tx with BaCl2 mol%.Fig. 5. The variation of logr(O�1 m�1) with 1000/T (K�1) in BB1, BB2, BB3 and BB4samples.
Fig. 6. Nyquist plots for BB4 glass sample at 373, 423 and 473 K.
S. Khasa et al. / Journal of Molecular Structure 1079 (2015) 15–20 19
(1000/T, T measured in Kelvin), with a negative slope indicates thationic conductivity is satisfied by the Arrhenius equation
r ¼ r0exp:�WkT
� �ð6Þ
where ‘W’ be the activation energy of conduction, r0 is the pre-exponential term which is constant and ‘k’ is the Boltzmann con-stant. W and r0 were calculated over the temperature range of453–583 K by least square fitting of the observed experimentaldata to the relation
loger ¼ loger0 �W � 10001000 � kT
ð7Þ
The values of W, r0 and rT at 473 and 573 K are included inTable 2. From Table 2 & Fig. 5 it is observed that the dc conductivityincreases with an increase in the temperature and with the contentof BaCl2 whereas activation energy decreases when BaO is replacedby BaCl2.
It has been reported by Button et al. [4] that introduction of LiClin alkali halide borate glasses results in a decrease in glass transi-tion temperature as the Cl� ions occupy the void spaces in the glassmatrix. These Cl� ions are believed to provide conduction path andconsequently generate an increase in ionic conductivity. In con-trasts to this, behavior in dc conductivity is increasing and the glasstransition temperature is increasing with the increase in Cl� con-tent in the present study. This is contradictory to the predictionsmade by Button et al. In case of oxy fluoride glasses, it has beenreported that addition of fluorides to the glass matrix results inan increased conductivity and increased Tg as the F� ions form tri-angular units like BO2F or BOF2 and directly participates in glassnetwork formation [52]. Keeping in view these observations wecan correlate our conductivity variations to the fact that Cl� ionsin the present glass matrix are directly participating in the networkformation i.e. BaCl2 is acting as the network former here.
AC conductivity
The Nyquist diagrams of the experimental data consist of singledepressed semicircle related to bulk effects. A typical Nyquist Plotfor sample BB4 at three different temperatures is shown in Fig. 6.
With the increase in the temperature the radius of the semi-cir-cular arc decreases indicating the fact that increasing temperaturemakes the sample thermally active. Also the intersection of thissemi-circular arc on the real axis tells us about the dc resistanceby which we can calculate the dc conductivity using sampledimensions. The order of dc conductivity is same as observedthrough direct measurement using Eq. (6). Similar results wereobtained with all the other samples of the glasses under study.The depression in centers of these semi-circles indicates the non-Debye nature of associated relaxation in ions.

Fig. 7. Frequency dependence of total conductivity, for BB4 glass samples at varioustemperatures.
20 S. Khasa et al. / Journal of Molecular Structure 1079 (2015) 15–20
Fig. 7 shows the frequency dependence of total conductivity forBB4 glass sample at six different temperatures. Similar patternswere observed for other glass samples also. The electrical conduc-tivity described by Jonscher [53] exhibits a power law at higher fre-quencies and terminates by constant dc conductivity at lowfrequencies which gives the empirical form of total conductivityr(x) for different temperatures as
rðxÞ ¼ rdc½1þ ðx=x0Þs� ð8Þ
where ‘s’ is a material and temperature dependent power lawexponent [54]. The values of exponent ‘s’ are calculated from theabove curve and tabulated in Table 2. From Table 2 it was foundthat ‘s’ increases with a decrease in temperature for all the sam-ples. The decrease in ac conductivity with increase in concentra-tion of BaCl2 supports the network forming role of BaCl2 aspredicted by dc results.
Conclusion
V4+ ion exists as VO2+ ion and the 3dxy orbital expands withincrease in BaCl2:BaO ratio. Glass structure is slightly become opendue to the conversion of BO3 units into BO4 units. Boroxol ring isabsent and various Borate units (penta, meta, pyro) are presentin the IR spectra. The glass transition temperature increases withincrease in BaCl2 content. The glass stability decreases as wereplace the BaO content with BaCl2. The crystallization tempera-ture decreases with increase in BaCl2 content indicating thedecrease in glass forming ability. The dc conductivity decreaseswith decrease of BaO in all the three systems indicating that Cl-
ions are participating in network formation. The ac conductivityincreases with the increase in temperature and follow Jonscher’spower law for frequency dependence.
Acknowledgements
The authors are thankful to UGC, New Delhi for providing thefinancial and experimental support under the Major Research Pro-ject F. No. 40-461/2011(SR). Author M S Dahiya is thankful to DSTNew Delhi for providing financial assistance under INSPIRE Fellow-ship. Authors are again thankful to Coordinator CIL DCRUST Mur-thal for providing Thermal and IR measurement facilities.
References
[1] D.L. Griscom, Solid State Commun. 11 (7) (1972) 899–902.[2] A.V. Nikitin, A.A. Pronkin, Glass Phys. Chem. 3 (3) (1977) 284–285.[3] T. Nishida, N. Kai, Y. Takashima, Phys. Chem. Glasses 22 (5) (1981) 107–109.
[4] D.P. Button, R.P. Tandon, C. King, M.H. Velez, H.L. Tuller, D.R. Uhlmann, J. Non-Cryst. Solids 49 (1982) 129–142.
[5] W. Müller, D. Kruschke, M. Torge, A.R. Grimmer, H.J. Schütt, Solid State Ionics23 (1987) 53–58.
[6] Yu hu Wang, Akiyoshi Osaka, Yoshinari Miura, Katsuaki Takahashi, J. Non-Cryst. Solids 95–96 (1987) 571–576.
[7] A.A. Pronkin, V.N. Naraev, Glass Phys. Chem 18 (4) (1992) 304–309.[8] A.A. Kiprianov, N.G. Karpukhina, Glass Phys. Chem 32 (1) (2006) 1–27.[9] M.S. Melkhal, I.A. Gohar, A.A. Megahed, J. Phys. D: Appl. Phys. 26 (7) (1993)
1125–1129.[10] A.H. Verhoef, H.W. den Hartog, Solid State Ionics 68 (3–4) (1994) 305–315.[11] S. Souto, M. Massot, M. Balkanski, D. Roye, Mat. Sci. Eng. B 64 (1) (1999) 33–38.[12] Shaweta Mohan, Kulwant Singh Thind, Gopi Sharma, Leif Gerward,
Spectrochimica Acta A 70 (5) (2008) 1173–1179.[13] K. Srilatha, L. Pavic, A. Moguš-Milankovic, Ch. Srinivasa Rao, G. Little Flower, V.
Ravi Kumar, N. Veeraiah, J. Non-Cryst. Solids 357 (19–20) (2011) 3538–3547.[14] A.A. Pronkin, V.N. Naraev, S.Yu. Eliseev, Glass Phys. Chem 14 (6) (1988) 926–
928.[15] S. Khasa, V.P. Seth, P.S. Gahlot, A. Agarwal, S.K. Gupta, Phys. Chem. Glasses 47
(4) (2006) 371–376.[16] M. Subhadra, P. Kistaiah, J. Non-Cryst. Solids 357 (19–20) (2011) 3442–3446.[17] B. Sumalatha, I. Omkaram, T. Rajavardhana Rao, C.h. Linga Raju, J. Mol. Struct.
1006 (1–3) (2011) 96–103.[18] A. Agarwal, A. Sheoran, S. Sanghi, V. Bhatnagar, S.K. Gupta, M. Arora,
Spectrochimica Acta A 75 (3) (2010) 964–969.[19] G. Giridhar, S. Sreehari Sastry, M. Rangacharyulu, Phys. B 406 (21) (2011)
4027–4030.[20] B. Hemalatha Rudramadevi, S. Buddhudu, Ferroelectric Letters 36 (5–6) (2009)
109–118.[21] M.N. Brekhovskikh, Yu.K. Voronko, L.N. Dmitruk, L.V. Moiseeva, O.B. Petrova,
A.V. Popov, V.A. Fedorov, Inorg. Mater. 46 (12) (2010) 1391–1395.[22] Stephen Hull, Stephen T. Norberg, Istaq Ahmed, Sten G. Eriksson, Chris E.
Mohn, Solid State Chem. 184 (11) (2011) 2925–2935.[23] S. Khasa, M.S. Dahiya, A. Agarwal, AIP Conf. Proc. 1536 (2013) 671–672.[24] S. Khasa, M.S. Dahiya, A. Agarwal, Int. J. Phys. Math. Sci. 2 (S1) (2012) 104–108.[25] R.M. Krishna, J.J. Andre, V.P. Seth, S. Khasa, S.K. Gupta, Mater. Res. Bull. 34 (7)
(1999) 1089–1097.[26] S. Khasa, M.S. Dahiya, Ashima, Shely, A. Agarwal, J. Integ. Sci. Tech. 1 (1)
(2013) 44–47.[27] S. Khasa, M.S. Dahiya, A. Agarwal, AIP Conf. Proc. 1591 (2014) 796–798.[28] P. Chand, V.K. Jain, G.C. Upreti, Magn. Reson. Rev. 14 (1988) 49–79.[29] R. Muncaster, S. Parke, J. Non-Cryst. Solids 24 (3) (1977) 399–412.[30] G. Hochstrasser, Phys. Chem. Glasses 7 (1966) 178–183.[31] H.G. Hecht, T.S. Johnston, J. Chem. Phys. 46 (1) (1967) 23–35.[32] D. Kivelson, S. Lee, J. Chem. Physics 41 (7) (1964) 1896–1904.[33] M. Maczka, A. Waskowska, A. Majchrowski, J. Kisielewski, W. Szyrski, J.
Hanuza, J. Solid State Chem. 181 (12) (2008) 3211–3216.[34] S. Sindhu, S. Sanghi, A. Agarwal, V.P. Seth, N. Kishore, Spectrochimica Acta A 64
(1) (2006) 196–204.[35] E.I. Kamitsos, G.D. Chryssikos, A.P. Patsis, M.A. Karakassides, J. Non-Cryst.
Solids 131–133 (1991) 1092–1095.[36] E.I. Kamitsos, M.A. Karakassides, G.D. Chryssikos, J. Phys. Chem. 91 (5) (1987)
1073–1079.[37] D. Singh, K. Singh, G. Singh, Manupriya, S. Mohan, M. Arora, G. Sharma, J. Phys:
Condens. Matter 20 (7) (2008) 075228.[38] A.A. Alemi, H. Sedghi, A.R. Mirmohseni, Golsanamlu, Bull. Matter. Sci. 29 (1)
(2006) 55–58.[39] H. Doweidar, A.A. Megahed, S. Abd Al Maksond, M.S. El-Shahavi, Phys. Chem.
Glasses 35 (1) (1994) 187–192.[40] U. Selvaraj, K.J. Rao, Spectrochimica Acta A 40 (11–12) (1984) 1081–1085.[41] L. Baia, R. Stefan, W. Kiefer, S. Simon, J. Raman Spectrosc. 36 (3) (2005) 262–
266.[42] E.I. Kamitsos, M.A. Karakassides, G.D. Chryssikos, Phys. Chem. Glasses 28 (1)
(1987) 203–209.[43] N.H. Ray, J. Non-Cryst. Solids 15 (3) (1974) 423–434.[44] S. Khasa, V.P. Seth, A. Agarwal, R.M. Krishna, S.K. Gupta, P. Chand, Mater. Chem.
Phys. 72 (3) (2001) 366–373.[45] Sanjay, N. Kishore, A. Agarwal, V.P. Seth, M.S. Sheoran, Indian J. Pure Appl.
Phys. 46 (10) (2008) 719–721.[46] Oleg V Mazurin, in: Handbook of Glass Data: Part B, Amsterdam: Elsevier,
1985.[47] S. Koritala, K. Farooqui, M. Affatigato, S. Feller, S. Kambeyanda, S. Ghosh, E.I.
Kamitsas, G.D. Chryssikos, A.P. Patsis, J. Non-Cryst. Solids 134 (3) (1991) 277–286.
[48] I. Avramov, Ts. Vassilev, I. Penkov, J. Non-Cryst Solids 351 (6–7) (2005) 472–476.
[49] E.B. Araujo, J.A. Eiras, E.F. de Almeida, J.A.C. de Paiva, A.S.B. Sombra, Phys.Chem. Glasses 40 (5) (1999) 273–276.
[50] R. El-Mallawany, Glass Transformation Temperature and Stability of BinarySemiconducting Vanadate Tellurite Glasses, in: Proc. Int. Cong. Glass, ExtendedAbstracts, Edinburg, Scotland, vol. 2, 2001.
[51] P. Subbalakshmi, N. Veeraiah, J. Non-Cryst. Solids 298 (1) (2002) 89–98.[52] M. Massot, M. Balkanski, A. Levasseur, in: M. Bakkanski (Ed.), Microionics:
Solid State Integrable Batteries, Elsevier, Amsterdam, 1991, p. 164.[53] A.K. Jonscher, Nature 267 (1977) 673–679.[54] S. Sanghi, S. Duhan, A. Agarwal, P. Aghamkar, Phys. B 405 (2010) 3846–3851.