assessment of extended producer responsibility (epr ... - WWF

JOURNAL OF MAGNETIC RESONANCE 40,33-45 (1980)
Simulation of EPR Spectra of Mn2+ in Glasses
J. KLIAVA AND J. PURANS
Institute of Solid State Physics, Latvian State University, Riga, USSR
Received May 15, 1979; revised October 22, 1979
The Mn2+ EPR spectra in glasses are treated by a computer simulation technique taking into account the distributions of the fine structure parameters D and E resulting from random variations in local environments of the paramagnetic ion. Simulated spectra are displayed for different values of the Do/E0 ratio and for different values of the parameter distributions, AD and AE. The good agreement observed between the simulated and experimental spectra for phosphate and silicate glasses permits deter- mination of the spin-Hamiltonian parameters and their distributions. It is concluded that Mr?+ ions with g = 2.0 in glasses form a distinct site characterized by the following spin-Hamiltonian parameters: 1 Do I/gp = 220 f 20 G, 1 IT,, i/g@ = 70 f 15 G, A/gB = -93 * 1 G (for the phosphate glass) and A/go = -87 i 1 G (for the silicate glass). The fine structure parameters have considerable distributions, AD/gp = 8Ort 20 G, AE/gp = 30* 10 G, due to the structural disorder of the glasses.
INTRODUCTION
Structural disorder is a characteristic feature of the vitreous state. Local environ- ments of paramagnetic ions in glasses are subject to random distortions. This must result in substantial distributions of the spin-Hamiltonian parameters, as has been demonstrated in (I-4).
The aim of the present work is to give a detailed analysis of Mn*+ EPR spectra in glasses. The presence of the fine structure fs (electron spin S = z) and the hyperfine structure hfs (nuclear spin I = 2) makes Mn*’ EPR spectra rather complex, especially in powders, where their interpretation is additionally obscured by the orientational disorder of the paramagnetic ions. On the other hand, due to their complexity, the Mn” EPR spectra contain much information about the local environment. There- fore Mn2+ is often used as a paramagnetic probe in structural investigations of crystals. Extending this work to disordered systems requires careful computer simulations of the spectra, in order to extract the spin-Hamiltonian parameters from the experimental data. A number of papers (5-12) have dealt with the simulations of the Mn*+ powder spectra. However, to our knowledge, no accurate Mn*+ lineshape calculations in glasses taking into account distributions of the spin-Hamiltonian parameters have been reported so far. Such calculations would be extremely useful in elucidating the structural differences between crystals and glasses. Namely, the question concerns a hypothesis advanced in some earlier publications (5) that the environments of the Mn2+ ions in glasses are characterized by a continuous and very broad distribution of crystal-field parameters, the g = 2.0 and g = 4.3 features arising
33 0022-2364/X0/100033-13$~2.oo/o CopyrIght @ 1980 by Academic Press. Inc.
All rights of reproduction in any form reserved Printed in Great Britain

34 KLIAVA AND PURANS
merely from “singularities” of a powder pattern which are stationary with respect to variations of the spin-Hamiltonian parameters.
Using a computer program developed for the Mn2+ ions in glasses, the EPR lineshapes for different cases were evaluated. By comparing the simulated spectra with the experimental ones for phosphate and silicate glasses the values of the spin-Hamiltonian parameters and their distributions were determined.
Surprisingly enough, we found that for the sharp-line portion of the g = 2.0 features the distribution of the fs parameters is far less broad than assumed previously. This result implies that these sharp features, at least in the glasses studied in the present work, correspond to a distinct, rather well-defined site.
SAMPLES AND EXPERIMENTAL
Two different types of glasses were investigated: zinc phosphate glass ZnO.PzOS and potassium silicate glass K20*4Si02. The zinc phosphate glass was prepared by fusing appropriate amounts of zinc oxide and monosubstituted ammonium phos- phate with 0.14 mol% Mnz03 in a glazed ceramic crucible. After fusing for 0.5 hr at 1200°C in an electric muffle, the sample was cooled down rapidly to room tempera- ture. The potassium silicate glass was made by fusing SiOz and K2C03 in a fused silica crucible for 1 hr in an oil furnace at 1550°C followed by quenching to room temperature. The manganese was introduced after fusing by addition of 0.1 mol% Mnz03 to the glass ground to a fine powder and heating for 1 hr at 1200°C. EPR spectra were taken at 120 K with an X-band spectrometer.
Figure 1 shows parts of the experimental spectra in the region g = 2.0 displaying a number of sharp features superimposed on a broad underlying resonance. In addition, much weaker features were observed for both glasses in the region g = 4.3, which are not discussed in the present paper. The spectra are very similar to those
I I 1 I I 2.9 3.0 3.1 3.2 3.3 3.4
MAGNETIC FIELD IkGl
FIG. 1. EPR spectra of Mn’+ observed at v = 8900 MHz in the phosphate (upper trace) and silicate (lower trace) glass.

MANGANESE ION EPR IN GLASSES 35
reported for Mn2+ in different types of glasses (5,10, 13,14). This indicates that we are really dealing with the same valence state of manganese.
CALCULATION OF SPECTRA
The correct approach to the EPR lineshape calculations for Mn2’ in glasses requires one, in principle, to use the most general form of the spin Hamiltonian, including the fourth-order fs terms. However, data available on the EPR of Mn2+ ions in different solids (see, for example, 15) permit several simplifying assumptions to be made. First, the g factor and hfs constant A may be taken as isotropic, since their anisotropy is negligible. Second, as the fourth-order fs terms as well as the quadrupole term are usually much smaller than the hyperfine term, they can be neglected for glasses. Then the spin Hamiltonian is
%‘=gpH.S-D S:-;(S+l)]+E(S:-$)+A%1 C [II
where S = 5, I = 2, and all symbols have their usual meaning. In this paper we confine ourselves to the case ] D I<< g/3H, ] E ] << g/3H, 1 A << gpH.
The resonance magnetic fields for the transitions between two states denoted by ]M, m) and [M-l, m+i>
Ho=H Mm;M-l,m+ik A D, ~5 6, CP) PI to third-order perturbation have been given in a number of papers (see, for example, those by Bir (16) and Upreti (17)). In Eq. [2], M and m are the electronic and nuclear quantum numbers; i = 0 corresponds to the allowed transitions; i = ?cl, *2, etc., correspond to the forbidden transitions; and 8 and cp are the polar and azimuthal angles formed by the magnetic field with the axes of the spin Hamiltonian. Ho depends on four spin-Hamiltonian parameters, g, A, D, and E. Moreover parameter distributions are characterized by the mean values go, Ao, Do, and E. and respective widths dg, AA, AD, and AE. Together with the linewidth AH,,, a total of nine parameters of the experimental spectrum must be determined.
In calculating the spectra the value go = 2.0 was used. The ground state of Mn2+ ions being 6S, the g factor is close to this value in all cases (15). Besides, a slight deviation from go = 2.0 would result simply in some shift of the whole spectrum. This can easily be taken into account after all other parameters have been fitted.
Now the question is which of the parameter distributions are determinant for the Mn2+ in the glasses. As these distributions arise from random variations of electric fields and strains in the glass network, some information about them can be deduced from the data concerning the effects of stresses or electric fields on the EPR of Mn2+ in crystals. It has been demonstrated by Feher (18) and Krebbs (19) that an application of uniaxial stresses or electric fields leads to a considerable linear shift of the fs parameters, leaving the g factor and hfs constant unchanged. On the basis of these facts, it can reasonably be inferred that g and A are far less sensitive to the variations of the local environment of Mn2+ as compared to the fs parameters D and E. Hence Ag and AA are supposed to be small and therefore to be reflected merely in

36 KLIAVA AND PURANS
some broadening of all the spectral features. This effect can be accounted for by choosing an appropriate value of AI&, (which also includes the spin-spin interaction as well as the broadening caused by the omitted terms of the spin Hamiltonian).
On the other hand, as much broader distributions are expected to occur for D and E in glasses, a more accurate statistical approach must be used in this case (3,4). We used the joint probability density function for D and E in the form (20)
P(D, E) = 1
TADAE(~ - r*)l’*
xexp[ --A[(+)*-2 CD -;Wg-Eol, (E;““)*]].
[31
Then the distributions of D and E are Gaussians with mean values D = Do and E = Eo, variances ADZ/2 and AE*/2, and a correlation coefficient r, -1 I r I 1. When r = 0, D and E are uncorrelated and P(D, E) becomes the product of two independent one-dimensional Gaussian distributions
P(D)=& exp[-(%)*I: P(E)=&exp[-(%)*I. [4]
When r = 1t1 there is a total correlation between D and E and Eq. [3] gives P(D, E) # 0 only for E -E. = *(D - Do)AE/AD. In this case the one-dimensional distributions, Eq. [4], should be used instead of Eq. [3] (for D or E).
Synthesis of an EPR spectrum in a glass comprises integration over all possible orientations of paramagnetic ions as well as over the distributed values of the spin-Hamiltonian parameters. Following the approach of Taylor and Bray (6) we assume that an ensemble of randomly oriented identical sites and one of randomly distorted sites are mutually independent. Then the EPR spectrum of Mn*+ in a glass is obtained as
5/* I= c M=-3/2
F m:f,2 1 dD 1 dE/daj dCc*P(D,E)*sinfi
lm+ilzsS/* -02 -cc 0 0
xw M,m;M-l,m+i(D, E, 6,401. F(F), PP
where F[(H -Ho)/AH,,] is the lineshape function which was taken in the form of either a Gaussian or Lorentzian first derivative; WM,m;M-l,m+i(D, E, 6, tp) is the transition probability between ]M, m) and ]M - 1, m + i) states averaged over different orientations of the microwave magnetic field vector. This was calculated using the method developed by Bir (16), which provides a much better approxima- tion that the usual perturbation approach (21). Application of Bir’s method to the calculation of the Mn2+ EPR spectra in powders has been described in detail (12).
As has been noticed by Aasa and VInngHrd (Z), the integrand of Eq. [5] must be multiplied by cU&/C%. However, in our case this multiplier can be omitted, as it

MANGANESE ION EPR IN GLASSES 37
differs from unity only by a few percent. In computing the spectra the limits of integration over D and E were taken, respectively, as DO f 240 and E. f 2AE.
Equation [5] takes into account all the fs transitions. However, as in powder EPR spectra the lines of the noncentral fs transitions are much less intense then those of the central one (I$, m) c) I-1, m + i)) because of a stronger angular dependence of their positions, in most cases it is sufficient to confine the calculation to the central fs transition. This is even more valid for the glasses. Indeed, the resonance magnetic fields for the noncentral fs transitions contain the terms linear in D and E which vanish for the central fs transition (16,17). Therefore the parameter distributions completely smear out all the noncentral transition lines in glasses.
RESULTS OF THE COMPUTER SIMULATIONS AND COMPARISON WITH THE EXPERIMENT
Figure 2 shows the “powder patterns” (11) computed for the central hf transition. The lower curve was calculated assuming the transition probabilities to be constant and equal to one. For the upper curve the transition probabilities were calculated as described above. The drastic discrepancy between the two curves demonstrates that no convincing fit to experimental spectra can be attained without a due account of the transition probabilities.
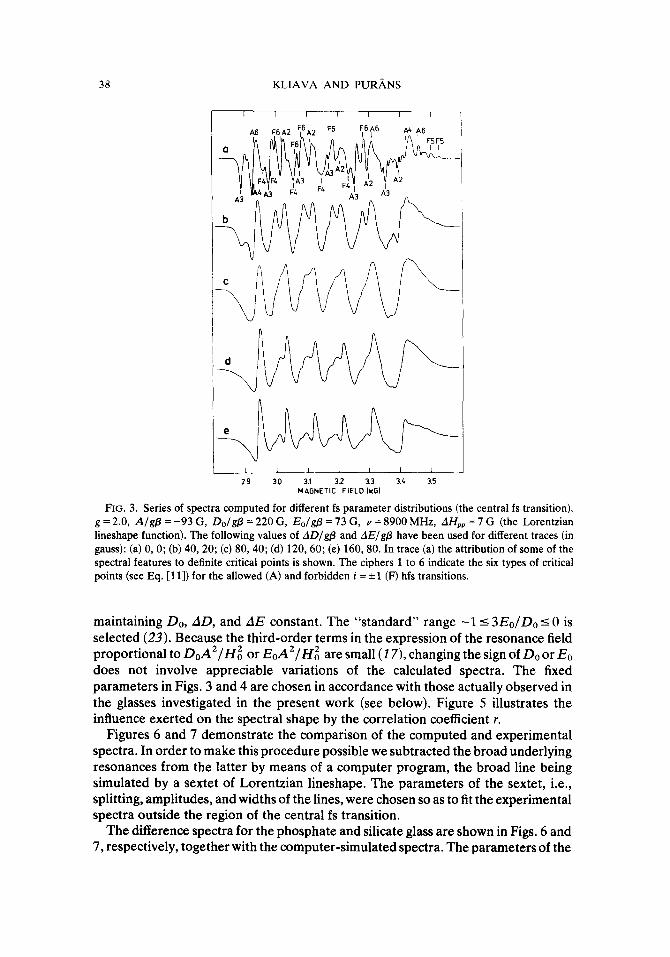
Figure 3 displays the EPR spectra of the central fs transition computed for different parameter distributions AD and AE, at constant values of D,, and Eo. Figure 4 represents a series of spectra calculated for different values of the ratio Do/E0
m=-512 m--512
,I1
m=-312 m=-32 i=o i=tl i=o i=tr
: I ,;‘I,
!&,“
,’ ,’
-2’ ““: “,,.. ),JPidTemTm
-~ 2.9 3.0 3.1
MAGNETIC FIELD Iktl 3.2
FIG. 2. Powder patterns calculated to third order for some allowed (solid lines) and forbidden (dashed lines) hfs transitions belonging to the central fs transition. g = 2.0, A/gp = -95 G, D/gf3 = 210 G, E/g@ = 70 G, v = 8900 MHz. Top, the transition probability is calculated using Bir’s method (12). Bottom, the transition probability equals one.
38 KLIAVA AND PURz&NS
d
I I I I I I 1 2.9 3.0 31 3.2 3.3 31 35
MAGNETIC FIELD IkGI
FIG. 3. Series of spectra computed for different fs parameter distributions (the central fs transition). g = 2.0, A/g$ = -93 G, Do/g/3 = 220 G, E,Jg@ = 13 G, Y = 8900 MHz, AHpp = 7 G (the Lorentzian Iineshape function). The following values of AD/g@ and AE/g@ have been used for different traces (in gauss): (a) 0,O; (b) 40,20; (c) 80,40; (d) 120,60; (e) 160,80. In trace (a) the attribution of some of the spectral features to definite critical points is shown. The ciphers 1 to 6 indicate the six types of critical points (see Eq. [ 111) for the allowed (A) and forbidden i = *l (F) hfs transitions.
maintaining Do, AD, and AE constant. The “standard” range -15 3Eo/Do I 0 is selected (23). Because the third-order terms in the expression of the resonance field proportional to &A*/& or EoA2/Hz are small (17), changing the sign of Do or EO does not involve appreciable variations of the calculated spectra. The fixed parameters in Figs. 3 and 4 are chosen in accordance with those actually observed in the glasses investigated in the present work (see below). Figure 5 illustrates the influence exerted on the spectral shape by the correlation coefficient r.
Figures 6 and 7 demonstrate the comparison of the computed and experimental spectra. In order to make this procedure possible we subtracted the broad underlying resonances from the latter by means of a computer program, the broad line being simulated by a sextet of Lorentzian lineshape. The parameters of the sextet, i.e., splitting, amplitudes, and widths of the lines, were chosen so as to fit the experimental spectra outside the region of the central fs transition.
The difference spectra for the phosphate and silicate glass are shown in Figs. 6 and 7, respectively, together with the computer-simulated spectra. The parameters of the

MANGANESE ION EPR IN GLASSES 39
I i
I , 1 1 I 29 3.0 31 I2 3.3 51 35
MAGNETIC FIELD IkGl
FIG. 4. Series of spectra computed for different values of E0 (the central fs transition). g = 2.0, A/gB = -93 G, Do/g@ = 220 G, ADlgp = 80 G, AE/gp = 30 G, v = 8900 MHz, AHpp = 6 G (the Lorentzian lineshape).
MAGNETIC FIELD IkGI
FIG 5. Series of spectra computed for different values of the correlation coefficient r (the central fs transition). g = 2.0, A/gp = -93 G, Do/g/3 =220 G, Eo/gP =73 G, AD/g@ = 80 G, AE/gp = 30 G, Y = 8900 MHz, AH,, = 6 G (the Lorentzian lineshape).

40 KLIAVA AND PURANS
I I I I 1 I
29 10 11 12 3.3 3.4 MAGNETIC FIELD Iktl
FIG 6. Comparison of the experimental and computer-simulated spectra for the zinc phosphate glass ZnO*P205. The upper trace represents the experimental spectrum after subtracting the broad underlying resonance. The lower trace is the computed best-fit spectrum (for the central fs transition) with g = 2.0, A/gP = -93 G, D,Jg/3 = 220 G, E,/g/3 = -70 G, ADjgp = 80 G, AE/g@ = 30 G, v = 8900 MHz, AH,, = 6 G (the Lorentzian lineshape).
I I 1 1 1 I 29 3n 3.1 32 33 34
MAGNETIC FIELD IkGl
FIG. 7. Comparison of the experimental and computer-simulated spectra for the potassium silicate glass Kz0.4SiOz, The upper trace represents the experimental spectrum after subtracting the broad underlying resonance. The lower trace is the computed best-fit spectrum (for the central fs transition) with g = 2.0, AI@ = -87 G, Do/#3 = 220 G, E,Jg@ = 70 G, AD/g/3 = 80 G, AEjga = 30 G, Y = 8900 MHz, AI&, = 7 G (the Lorentzian lineshape).

MANGANESE ION EPR IN GLASSES 41
latter are adjusted to obtain the best fit to the experimental difference spectra. The corresponding best-fit spin-Hamiltonian parameters for the two glasses turn out to be the same, with the exception of A: g = 2.0, IDo/ /gp = 22Ok20 G, (Eol /gp = 70*15G, AD/gp =80*20G, AE/gp =30*10G, r=0.0*0.2. The values of A/gp are -93 * 1 G for the phosphate glass and -87 f 1 G for the silicate glass. The limits of error for Do, Eo, AD, AE, and A indicate the regions outside which a variation of one parameter degrades the fit in such a way that it cannot be restored by any choice of the other parameters. For the correlation coefficient r, the limits of error are determined for fixed values of all the other parameters. It should be noted that only the absolute values of Do and E,, could be determined in glasses.
DISCUSSION
First of all, we consider the effect of the fs parameter distributions on the shape of the EPR spectra, as illustrated in Fig. 3. The spectrum calculated assuming no parameter distributions (curve a) shows a number of “lines” and “peaks.” As AD and AE are increased (curves b through e), these “lines” and “peaks” first broaden, some of them being completely smeared out. However, somewhat unexpected is the fact that, as AD and AE continue to grow, the remaining “lines” and “peaks” cease broadening and even get narrower (curves d through e).
In order to explain such behavior we rewrite Eq. [5] making use of Eq. [5] from the paper by Kneubiihl(24), in the form
[61
where d = D/AD and e = E/AE are new nondimensional variables,
p(d, e) = 1
T(l - ry exp -$-~[(d-do)z-2r(d-do)(e-eo)+(e-eo)2]], [71
and do = Do/AD and e. = Eo/AE. HO is a function of four variables d, e, 6, and cp ; hence
/gradHo~=[(grada,Ho)2+(~)2+(~)2]1’2, F31
where
Igrad~,,Hol=[(~)2+&(~)2]1’2. Bl
The integration in Eq. [6] is performed over Ho and the three-dimensional phase surface S is defined by the condition Ho(d, e, 6, cp) = const.
When AD = AE = 0, p(d, e) becomes the two-dimensional Dirac delta function S(d -do, e - eo). Then, as aHo/ad = AD l+Ho/aD = 0 and aHo/ae = AE tfHo/aE = 0, we obtain that /grad HoI = ]grad9,9 HoI. Therefore, it is seen from Eq. [6] that the

42 KLIAVA AND PURJ\NS
“lines” or “peaks” in the powder EPR spectra occur at resonance-field values for which 1 grads,, Ho I= 0, i.e.
aHo -z- -0, 1 aH0 o --=
sin 9 ap * [lOI
Such values of Ho (“critical points”) (11) are stationary with respect to the orien- tation of the paramagnetic ions and therefore the relative number of ions absorbing in the region Ho to Ho+ dHo is sharply increased. Making use of the resonance conditions developed to the third order of perturbations (16, 17), we have shown that, for each hfs transition, six different types of critical points occur at definite pairs of angles a0 and cpo, namely,
1. 60=0; 2,3. 60 = IT/~, q. = 7714 F m/4 (or 51r/4 ‘F 1r/4); 4. a0 = 7rj2, cos 2qo = aDIE, where
a:= 2-(2m +i)A/Ho+3(2m +i)(l +i)A2/DHoa
18 - 73(2m + i)A/Ho 3
5,6. cos* 190 = x, cpo = r/4 F 7~14 (or 57r/4 T 7r/4), where
1OD f 6E - (2m + i)(37D * 35E)A/Ho- 3(2m + i)(l + i)A*/Ho x=
[18 -73(2m + i)A/H&D f E) * 1111
The assignment of some of the “lines” and “peaks” to definite critical points is shown in Fig. 3, curve a. It should be noted that some of the critical points may not be present in the spectra if the conditions 1 cos 2~~ 15 1 and 0 5 cos* 60 I 1 do not hold, respectively, for the critical points 4 and 5,6. In addition, the transition probability for the values of fro and cpo corresponding to a given critical point must not be equal to zero or small.
Now let us suppose that AD # 0 and AE # 0. If the parameter distributions are small enough to satisfy the conditions
where the index c means that all the derivatives are taken in the critical point (60, cpo, Do, Eo), the values of aHo/& and aHo/sin 6 - acp increase rapidly as one moves away from the critical point. In this case in Eq. [6] the main contribution in the integral over the surface S containing a critical point occurs from the neighborhood of this point. For the latter, Eq. [8] becomes
lgradH~l,=[(~)~ c
(AD)*+(z)* (AE)*]“*. c
Cl31
Therefore the amplitudes of the “lines” and “peaks” decrease and their widths respectively increase in proportion to /grad HOI,. This broadening becomes significant when it approaches or exceeds the value of AHpp which includes all other sources of line broadening.

MANGANESE ION EPR IN GLASSES 43
Now, at very broad parameter distributions the probability density function begins to take up the values D “0, E -0. Once again, using the expression for the resonance field (16, 17), one can easily show that the point D = E = 0, co? 6 = f, cos 2~ = 0 is the only “true critical point of a glass,” for which 1 grad Ho 1 given by Eq. [8] equals zero. Hence, the ions with D = 0 and E = 0 account for the sharp features emerging in the computer simulated spectra at broad parameter distributions (Fig. 3, curves d and e).
The situation is much more complex at intermediate parameter distributions where Eq. [12] is no longer valid, but the probability of finding an ion with D = E = 0 is still small. In this case the “lines” and “peaks” do not correspond, generally speaking, to the critical points of a powder. As the “true critical point” is not involved either, positions and sharpness of the spectral features are determined by the properties of the whole integrand of Eq. [6]. Therefore, no definite statement concerning their dependence on the parameter distributions can be made without a complicated analysis.
We proceed next to the dependence of the spectra on the ratio Eo/Do. One may judge from Fig. 4 that even at rather broad parameter distributions (AD/gp = 80 G, AE/gp = 30 G) a strong variation in the spectral shape is produced by an increase of Eo/Do. Note that particularly sensitive to this value is the low-field region of the spectra corresponding to the I-$, -2) e+ If, -5) transition. At small Eo, when the relative number of ions with E = 0 is high, sharp features are present in the computed spectra which can be explained as follows. If D # 0, there is no “true critical point.” However, the point E = 0,6 = 0, which is known to be stationary with respect to the orientation of the paramagnetic ions (see Eq. [ll]) is also almost stationary with respect to the variations of the fs parameters. In fact, it can be shown that in this point f~&/dE,, equals zero and aHo/8D = -4(2m + i)(l + i)A2/Hg is small (these deriva- tives are calculated to third order of perturbations).
It should be pointed out that the behavior of the spectra in this case is entirely different from that when only Do (12) or AD and AE (see Fig. 3) are varied. It is concluded that the computer fitting to the experimental spectra permits the deter- mination of the ratio Eo/Do (or, rather, its absolute value), as well as the other spin-Hamiltonian parameters for Mn2+ in glasses in a unique way and with sufficient accuracy. Furthermore, it is clear that great caution must be exercised in “qualita- tively” interpreting the EPR spectra of Mn2+ in disordered systems, since, for example, a spectrum with broad parameter distributions can easily be mistaken for one with small values of Do and E. (IL?), some very sharp features being present in both cases. It goes without saying that such misinterpretation is impossible with a computer simulation, because the total aspect of the spectrum in each case is quite different.
Up to this point, our discussion has concerned only the sharp spectral features in the region g = 2.0. The nature of the broad underlying resonance has been discussed earlier (5,10). It was argued by Griscom and Griscom (5) that this resonance cannot arise from the noncentral fs transitions. Now this statement may be supported by direct computer simulations. Figure 8 demonstrates that the contribution of these transitions to the total EPR spectrum is indeed far too small to account for the background resonances observed. The peak-to-peak intensities of the latter relative

44 KLIAVA AND PURANS
I 2.5
I I 3.0 35
MAGNETIC FIELD IkGl
I 4.0
FIG. 8. Spectrum computed taking into account all the fs transitions. g = 2.0, A/go = -93 G, Do/gp = 220 G, E,/g@ = 70 G, AD/g@ = 80 G, AE/gp = 30 G, v = 8900 MHz, AHpp = 11 G.
to the central sharp features are about 3.3 and 4.0, respectively, for the phosphate and silicate glass (Fig. 1). In view of much broader linewidths the underlying resonances must correspond to a number of sites more than an order of magnitude greater than that of the sharp features. The frequency dependence of the Mn*+ EPR spectra, namely, the fact that the broad underlying resonances observed at the X-band collapse at the Ka-band, led Griscom and Griscom (5) to the conclusion that a broad distribution of sites with values of ID I/h ranging from near zero to as high as 7 GHz (ca. 2.5 kG) and )Eo/DoI - f is responsible for such behavior, sites with ID I/h 2 2 GHz (ca. 0.7 kG) giving rise to the background resonances. It is interes- ting to note that our computer simulations unambiguously result in the same I Eo/Do ( = 5 value for the sharp g = 2.0 features with I Do I/g/3 = 220 G (ca. 0.6 GHz). This constraint therefore seems to be of a rather general character in glasses.
However, it follows from the present investigation that, in contrast to the model suggested by Griscom and Griscom (5), the sharp g = 2.0 features in X-band spectra do not belong to this continuous broad distribution of sites. Indeed, if this were the case, these features would correspond to the “true critical point” Do = & = 0 and not to l&l /gp = 220 G, lEol /gp = 70 G, as has been found with our experimental spectra. The fact that the accurate computer fitting to these features gives such values of the fs parameters indicates that we are actually dealing with a particular, rather well-defined site. Since the fs parameter distributions which reflect random dis- tortions of the local environment of Mn*+ ions are not too large (AD/gp = 80* 20 G, AE/gp = 30* 10 G), one can conclude that the short-range ordering persists to a certain extent at these sites. Thus, a concept of two different types of Mn’+ sites in the glasses originally advanced by Tucker (25) is given support.
It follows from this result that, besides the large site-to-site distortion range, different types of sites, for which the short-range order is much better preserved, do exist in glasses.

MANGANESE ION EPR IN GLASSES 45
REFERENCES
1. D. L. GRISCOM, P. C. TAYLOR, D. A. WARE, AND P. .I. BRAY, J. Chem. Whys. 48,5158 (1968). 2. D. L. GRISCOM, 1 Chem. Whys. 55,1113 (1971). 3. G. E. PETERSON, C. R. KURKJIAN, AND A. CARNEVALE, Phys. Chem. Glasses l&52 (1974). 4. G. E. PETERSON, C. R. KURKJIAN, AND A. CARNEVALE, Phys. Chem. Glasses 17,88 (1976). 5. D. L. GRISCOM AND R. E. GRISCOM, J. Chem. Phys. 47,271l (1967). 6. P. C. TAYLOR AND P. J. BRAY, J. Magn. Reson. 2, 305 (1970). 7. P. C. TAYLOR AND P. J. BRAY, J. Am. Ceram. Sot. 55,234 (1972). 8. R. D. DOWSING, J. Magn. Reson. 2,42 (1970). 9. N. N. TIKHOMIROVA, S. N. DOBRYAKOV, AND I. V. NIKOLAEVA, Phys. Status Solidi (a) 10,593
(1972). 10. P. C. TAYLOR AND P. J. BRAY, J. Phys. Chem. Sol. 33,43 (1972). 11. P. C. TAYLOR, J. F. BAUGHER, AND H. M. KRIZ, Chem. Rev. 75,203 (1975). 12. J. G. KLIAVA AND J. J. PURANS, Phys. Stafus Solidi (a) 49, K43 (1978). 13. S. G. LUNTER, G. 0. KARAPETYAN, N. M. BOKIN, AND D. M. YUDIN, Fiz. Tverd. Tela 9,2874
(1967). 14. L. D. BOGOMOLOVA, V. A. JACHKIN, V. N. LAZUKIN, AND V. A. SHMUGLER, J. Non-Cryst.
Solids 27,427 (1978). 1.5. H. A. KUSKA AND M. T. ROGERS in “Radical Ions” (E. T. Kaiser and L. Kevan, Eds.) Interscience,
New York/London/Sydney, 1968. 16. G. L. BIR, Fir. Tverd. Tela 5,2236 (1963). (Sov. Phys. Solid State 5, 1628 (1964)) 17. G. C. UPRETI, J. Magn. Reson. 13,336 (1974). 18. E. R. FEHER, Phys. Rev. A 136,145 (1964). 19. J. J. KREBBS, Phys. Rev. 155,246 (1966). 20. G. A. KORN AND T. M. KORN, “Mathematical Handbook for Scientists and Engineers,” McGraw-
Hill, New York/Toronto/London, 1961. 21. B. BLEANEY AND R. S. RUBINS, Proc. Phys. Sot. London 77,103 (1961). 22. R. AASA AND T. VANNGARD, J. Magn. Reson. 19,308 (1975). 23. C. P. POOLE, JR., AND H. A. FARACH, J. Chem. Phys. 61,222O (1974). 24. F. K. KNEUB~HL, J. Chem. Phys. 33, 1074 (1960). 25. R. F. TUCKER, “Advances in Glass Technology,” pp. 103-114. Plenum, New York, 1962.
Copyright © 2022 FDOKUMEN