
FTIR spectroscopic and computational studies on hydrogen adsorption on the zeolite Li–FER
7
FTIR spectroscopic and computational studies on hydrogen adsorption on the zeolite Li–FER P. Nachtigall, a E. Garrone, b G. Turnes Palomino, c M. Rodrı´guez Delgado, c D. Nachtigallova´ a and C. Otero Area´n* c Received 16th February 2006, Accepted 23rd March 2006 First published as an Advance Article on the web 5th April 2006 DOI: 10.1039/b602362b The interaction, at a low temperature, between molecular hydrogen and the zeolite Li–FER was studied by means of variable temperature infrared spectroscopy and theoretical calculations using a periodic DFT model. The adsorbed dihydrogen molecule becomes infrared active, giving a characteristic IR absorption band (H–H stretching) at 4090 cm 1 . Three different Li 1 site types with respect to H 2 adsorption were found in the zeolite, two of which adsorb H 2 . Calculations showed a similar interaction energy for these two sites, which was found to agree with the experimentally determined value of standard adsorption enthalpy of DH 0 = 4.1 (0.8) kJ mol 1 . The results are discussed in the broader context of previously reported data for H 2 adsorption on Na–FER and K–FER. 1. Introduction Studies of reversible gas adsorption on zeolites and related microporous materials are relevant to several technological processes, including gas separation (based on differential adsorption of different gases), gas sensing and storage. Hence, a detailed understanding of gas–solid interactions and quanti- fication of the interaction energy is of interest, not only from the point of view of fundamental research, but also because practical applications would benefit from such studies. How- ever, reversible gas adsorption involves only weak gas–solid interactions, typically within the range of 2–20 kJ mol 1 , which pose demanding requirements on both experimental measurements and theoretical calculations. On the experimental side, it was recently shown 1,2 that variable temperature infrared spectroscopy is a convenient method to determine gas adsorption enthalpy when dealing with weak gas–solid interactions, and this method is applied here to the study of hydrogen adsorption (at low temperature) on the zeolite Li–FER. Detailed analysis of experimental data can be accomplished by means of a parallel theoretical in- vestigation on the zeolite adsorption sites, the geometry of the adsorption complex, and the corresponding interaction en- ergy. For this purpose, we have used a periodic density functional description which, by paying due consideration to the zeolite framework topology, gives a far more realistic description of the gas–solid interaction than that which can be obtained with simple cluster models. Related studies on hydrogen adsorption at low temperature on Na–FER and K–FER were reported recently, 3 so the results obtained for the H 2 –Li–FER system can be analysed in a broader context. By doing so, further insight into the gas adsorption process can be gained, which constitutes an added aim of the present work. It should also be noted that hydrogen interactions with cations in mordenite and chabazite were recently studied by means of theoretical calculations by Benco et al. 4 and Solans-Monfort et al. 5 Detailed calculations for H 2 interactions with bare alkali metal cations were reported by Vitillo et al. 6 2. Materials and methods 2.1. Experimental The ferrierite sample used in this study was supplied by the Research Institute of Inorganic Chemistry, U ´ stı´ nad Labem. It was in the ammonium form and had a nominal Si : Al ratio of 8.5 : 1. From the parent zeolite, the lithium-exchanged sample was obtained by repeated ion exchange with a 0.5 M aqueous solution of LiCl. Powder X-ray diffraction of the exchanged sample showed good crystallinity, and all diffraction lines present in the diffractogram corresponded to the FER struc- ture type. Complete ion exchange was checked by the absence of IR absorption bands corresponding to either the ammo- nium ion or the Brønsted acid Si(OH)Al group, which would be generated during thermal activation (see below) of the zeolite sample if total exchange of the alkali metal ion for ammonium did not take place in the parent NH 4 –FER material. For IR spectroscopic measurements, a thin self-supported wafer of the zeolite sample was prepared and activated (out- gassed) in a dynamic vacuum (residual pressure o10 4 Torr) for 3 h at 700 K inside an IR cell, 7 which allowed in situ sample activation, gas dosage and variable temperature IR a Institute of Organic Chemistry and Biochemistry, Academy of Sciences of the Czech Republic and Centre for Biomolecules and Complex Molecular Systems, Flemingovo n. 2, CZ-16610 Prague, Czech Republic b Dipartimento di Scienza dei Materiali ed Ingegneria Chimica, Politecnico di Torino, I-10126 Turin, Italy c Departamento de Quı´mica, Universidad de las Islas Baleares, E-07122 Palma de Mallorca, Spain. E-mail: [email protected] Fax: þ34 971 173426; Tel: þ34 971 173251 2286 | Phys. Chem. Chem. Phys., 2006, 8, 2286–2292 This journal is c the Owner Societies 2006 PAPER www.rsc.org/pccp | Physical Chemistry Chemical Physics
-
Upload
independent -
Category
Documents
-
view
3 -
download
0
Transcript of FTIR spectroscopic and computational studies on hydrogen adsorption on the zeolite Li–FER
FTIR spectroscopic and computational studies on hydrogen adsorption on
the zeolite Li–FER
P. Nachtigall,a E. Garrone,b G. Turnes Palomino,c M. Rodrıguez Delgado,c
D. Nachtigallovaaand C. Otero Arean*
c
Received 16th February 2006, Accepted 23rd March 2006
First published as an Advance Article on the web 5th April 2006
DOI: 10.1039/b602362b
The interaction, at a low temperature, between molecular hydrogen and the zeolite Li–FER was
studied by means of variable temperature infrared spectroscopy and theoretical calculations using
a periodic DFT model. The adsorbed dihydrogen molecule becomes infrared active, giving a
characteristic IR absorption band (H–H stretching) at 4090 cm�1. Three different Li1 site types
with respect to H2 adsorption were found in the zeolite, two of which adsorb H2. Calculations
showed a similar interaction energy for these two sites, which was found to agree with the
experimentally determined value of standard adsorption enthalpy of DH0 = �4.1 (�0.8) kJmol�1. The results are discussed in the broader context of previously reported data for H2
adsorption on Na–FER and K–FER.
1. Introduction
Studies of reversible gas adsorption on zeolites and related
microporous materials are relevant to several technological
processes, including gas separation (based on differential
adsorption of different gases), gas sensing and storage. Hence,
a detailed understanding of gas–solid interactions and quanti-
fication of the interaction energy is of interest, not only from
the point of view of fundamental research, but also because
practical applications would benefit from such studies. How-
ever, reversible gas adsorption involves only weak gas–solid
interactions, typically within the range of 2–20 kJ mol�1,
which pose demanding requirements on both experimental
measurements and theoretical calculations.
On the experimental side, it was recently shown1,2 that
variable temperature infrared spectroscopy is a convenient
method to determine gas adsorption enthalpy when dealing
with weak gas–solid interactions, and this method is applied
here to the study of hydrogen adsorption (at low temperature)
on the zeolite Li–FER. Detailed analysis of experimental data
can be accomplished by means of a parallel theoretical in-
vestigation on the zeolite adsorption sites, the geometry of the
adsorption complex, and the corresponding interaction en-
ergy. For this purpose, we have used a periodic density
functional description which, by paying due consideration to
the zeolite framework topology, gives a far more realistic
description of the gas–solid interaction than that which can
be obtained with simple cluster models.
Related studies on hydrogen adsorption at low temperature
on Na–FER and K–FER were reported recently,3 so the
results obtained for the H2–Li–FER system can be analysed
in a broader context. By doing so, further insight into the gas
adsorption process can be gained, which constitutes an added
aim of the present work. It should also be noted that hydrogen
interactions with cations in mordenite and chabazite were
recently studied by means of theoretical calculations by Benco
et al.4 and Solans-Monfort et al.5 Detailed calculations for H2
interactions with bare alkali metal cations were reported by
Vitillo et al.6
2. Materials and methods
2.1. Experimental
The ferrierite sample used in this study was supplied by the
Research Institute of Inorganic Chemistry, Ustı nad Labem. It
was in the ammonium form and had a nominal Si : Al ratio of
8.5 : 1. From the parent zeolite, the lithium-exchanged sample
was obtained by repeated ion exchange with a 0.5 M aqueous
solution of LiCl. Powder X-ray diffraction of the exchanged
sample showed good crystallinity, and all diffraction lines
present in the diffractogram corresponded to the FER struc-
ture type. Complete ion exchange was checked by the absence
of IR absorption bands corresponding to either the ammo-
nium ion or the Brønsted acid Si(OH)Al group, which would
be generated during thermal activation (see below) of the
zeolite sample if total exchange of the alkali metal ion for
ammonium did not take place in the parent NH4–FER
material.
For IR spectroscopic measurements, a thin self-supported
wafer of the zeolite sample was prepared and activated (out-
gassed) in a dynamic vacuum (residual pressure o10�4 Torr)
for 3 h at 700 K inside an IR cell,7 which allowed in situ
sample activation, gas dosage and variable temperature IR
a Institute of Organic Chemistry and Biochemistry, Academy ofSciences of the Czech Republic and Centre for Biomolecules andComplex Molecular Systems, Flemingovo n. 2, CZ-16610 Prague,Czech Republic
bDipartimento di Scienza dei Materiali ed Ingegneria Chimica,Politecnico di Torino, I-10126 Turin, Italy
cDepartamento de Quımica, Universidad de las Islas Baleares,E-07122 Palma de Mallorca, Spain. E-mail: [email protected]: þ34 971 173426; Tel: þ34 971 173251
2286 | Phys. Chem. Chem. Phys., 2006, 8, 2286–2292 This journal is �c the Owner Societies 2006
PAPER www.rsc.org/pccp | Physical Chemistry Chemical Physics

spectroscopy to be carried out. After running the blank
spectrum of the zeolite wafer at 77 K, the cell was dosed with
hydrogen, it was then closed and IR spectra were recorded at
several fixed temperatures within the range of 79–150 K, while
simultaneously registering sample temperature and hydrogen
equilibrium pressure inside the cell. A platinum resistance
thermometer and a capacitance pressure gauge were used for
that purpose. The precision of these measurements was about
�2 K and �2 � 10�2 Torr, respectively. Transmission FTIR
spectra were recorded at 3 cm�1 resolution using a Bruker
IFS66 spectrometer. In order to check reproducibility, and
also to improve accuracy, after completing a first series of
measurements the infrared cell was outgassed, dosed again
with hydrogen, and a second series of spectra was recorded.
2.2. Calculations
The orthorhombic unit cell of ferrierite (Immm space group)
contains 36 T atoms and 72 O atoms. The equilibrium volume
of the all-silica FER unit cell fitted previously (cell parameters
a = 19.1468, b = 14.3040 and c = 7.5763 A, volume 2076.70
A3)8 was used for all calculations on H2–Li–FER. One frame-
work Si atom was replaced by aluminium and the charge was
compensated for by a Li1 cation. Calculations of H2 adsorp-
tion enthalpies were carried out for Li1 in the vicinity of the Al
atom in the T1, T2, and T3 positions (numbering scheme of
ref. 9). Since substitution of one aluminium for one silicon
atom only causes a negligible change in the unit cell volume,
the geometries of Li–FER and H2–Li–FER were optimized
within the constraint of the unit cell parameters while all other
degrees of freedom were fully relaxed.
Calculations were performed using the periodic DFT meth-
od, employing the Perdew–Burke–Erzerhofer (PBE) exchan-
ge–correlation functional10,11 and the projector augmented
wave approximation (PAW) of Blochl, as adapted by Kresse
and Joubert.12,13 The plane wave basis set with a kinetic energy
cut-off of 400 eV was used. Brillouin-zone sampling was
restricted to the gamma-point. Calculations were performed
using the VASP program.14–17
Experimental determination of DH0 was carried out at
temperatures around 100 K. To compare the calculated inter-
action energy (electronic interaction energy) with the experi-
mental adsorption enthalpy value, it is necessary to include
several corrections: the effect of ZPE, a thermal contribution,
and the pV term. Zero-point energy (ZPE) corrections were
calculated within the harmonic approximation. The effect of
temperature (DU0(100) – DU0(0)) was evaluated from the
partition function considering six degrees of freedom (see
ref. 3 for details). Thermal excitation of vibrational degrees
of freedom was considered. The ideal gas equation was used
for the transition from internal energy change to enthalpy
change (DH0(T) = DU0(T) þ pV = DU0(T) þ RT).
The correction to the electronic interaction energy (calcu-
lated with the periodic DFT model) was evaluated for the 1-T
cluster model (Al(OH)4�M1 cluster), and this correction
(DH0(100 K) � DEel(0 K) = 4.9 kJ mol�1) was used for all
H2 adsorption sites considered in Li–FER. A detailed descrip-
tion of this approach can be found in ref. 3. Calculations on
cluster models were performed with the PBE exchange–corre-
lation functional and with the aug-cc-pVTZ basis set.18,19
Calculations with the atom-centered basis set were carried
out with the Gaussian03 program suite.20 C2v symmetry
constraints were applied in all calculations with cluster models
and interaction energies were corrected for the basis set super-
position error.21 For comparison, the Li1 bare metal cation
(0-T model) was also considered.
3. Results
3.1. Variable temperature FTIR spectroscopy
Representative variable temperature FTIR spectra (in the
H–H stretching region) of H2 adsorbed on Li–FER are
depicted in Fig. 1. A single H–H stretching band is seen,
centred at 4090 cm�1. The bathochromic frequency shift, from
the gas phase value (4163 cm�1) of the Raman-active H–H
stretching vibration of the free H2 molecule, amounts to �73cm�1 for Li–FER. For comparison, H2 adsorbed (at liquid
nitrogen temperature) on the MFI-type zeolite Li–ZSM-5 was
reported to give a single infrared absorption band at
4092 cm�1.22,23
From the integrated intensity of variable temperature IR
spectra, and by simultaneously measuring temperature and
hydrogen equilibrium pressure, the standard adsorption en-
thalpy (DH0) and entropy (DS0) involved in the adsorption
process were determined by using the VTIR method described
in detail elsewhere.1 Briefly, at any given temperature, the
integrated intensity of the IR absorption band should be
Fig. 1 Representative variable temperature FTIR spectra (zeolite
blank subtracted) of H2 adsorbed on Li–FER. Temperature, in K,
and pressure (Torr, in brackets) as shown. For clarity the spectra have
been offset on the vertical scale.
This journal is �c the Owner Societies 2006 Phys. Chem. Chem. Phys., 2006, 8, 2286–2292 | 2287

proportional to surface coverage, y, thus giving information
on the activity (in the thermodynamic sense) of both the
adsorbed species and the empty adsorbing sites; simulta-
neously, the equilibrium pressure does the same for the gas
phase. Hence, the corresponding adsorption equilibrium con-
stant, k, can be determined, and the variation of k with
temperature leads to the corresponding values of adsorption
enthalpy and entropy. For deriving these values, integrated
band intensity, A, temperature, T, and hydrogen equilibrium
pressure, p, were considered to be interrelated by the Lang-
muir-type equation
y = A/AM = k(T) p/[1 þ k(T) p] (1)
where AM stands for the integrated intensity corresponding to
full coverage. Combination of eqn (1) with the well known
van’t Hoff equation, eqn (2), gives eqn (3) below:
k(T) = exp[DS0/R] exp[�DH0/RT] (2)
ln[A/(AM � A)p] = (�DH0/RT) þ (DS0/R), (3)
from which DH0 and DS0 can be derived.
The plot of the left-hand side of eqn (3) versus reciprocal
temperature for all of the experimental measurements, de-
picted in Fig. 2, shows a good linear fit of eqn (3). Note that
the value of AM needed (for which only an approximate
estimation was known, since experimental points in Fig. 1
correspond to coverages far from saturation) was chosen as
that giving the best linear fit of eqn (3) for all experimentally
determined points (see ref. 1 for details). From this AM value,
it was inferred that experimental points in Fig. 2 correspond to
a coverage range of 0.20 r y r 0.65. From the linear plot in
Fig. 2, the standard adsorption enthalpy was determined to be
DH0 = �4.1 kJ mol�1 and the corresponding entropy change
(DS0) is �57 J mol�1 K�1. The estimated error limits are about
�0.8 kJ mol�1 for the enthalpy and �10 J mol�1 K�1 for the
entropy.
3.2. Computational study
The structure of cation sites and coordination of the Li1 ion in
FER was investigated systematically, considering all possible
coordinations of the metal cation in the vicinity of each of four
distinguishable framework aluminium atoms.24 Two site types
were found in the vicinity of a single framework Al atom: (i)
channel wall site (denoted M7/T3) where Li1 is located on top
of a 6-membered ring on the channel wall, and (ii) intersection
site (I2/T2) where Li1 is located in the 8-membered entrance
window of the perpendicular channel, at the intersection of the
main and perpendicular channels. The interaction of H2 with
Li1 cations in the zeolite was studied for the most stable Li1
site of each type, M7/T3 and I2/T2. In addition, H2 adsorption
on the P6/T1 site, that has a rather peculiar geometry (the Li1
ion is located right in the plane of the 6-membered window
located at the bottom of FER cage) was also studied. The
investigated sites are depicted in Fig. 3.
Results obtained with the periodic DFT model (FER) are
reported in Table 1, along with those obtained using less
sophisticated 0-T and 1-T cluster models. The strongest inter-
action (�23.5 kJ mol�1) was found for H2 adsorption on a
bare Li1 cation (0-T model). This is not surprising in light of
previous theoretical work5 which showed that the H2
Fig. 2 Plot of the left-hand side of eqn (3) versus reciprocal tempera-
ture for spectra measured in two independent runs (circle and square
symbols). R, linear regression coefficient; and SD, standard deviation.
Fig. 3 The most stable Li1 sites in FER. The localization of the site is
depicted in the left part of the figure, viewed along the perpendicular,
main, and perpendicular channel for the I2/T2, M7/T3, and P6/T1 site,
respectively. The I2/T2 site is at the 8-membered entrance window of
the perpendicular channel, on the intersection of both channels. The
M7/T3 site is located in the main channel. The P6/T1 site is located in
the plane of the 6-membered ring separating two adjacent FER cages.
Details of Li1 coordination for each site type are given in the right-
hand side. Distances between the Li1 ion and closest framework
oxygen atoms are shown in A.
2288 | Phys. Chem. Chem. Phys., 2006, 8, 2286–2292 This journal is �c the Owner Societies 2006

interaction with alkali metal cations is dominated by the
polarization contribution. The interaction of H2 with the
Li1 site represented by the 1-T model is five times weaker
than interaction with the bare Li1 cation. Calculations per-
formed on the periodic model gave DH0 values which are
much smaller than that for the bare cation (as expected), but
they are comparable to, or even larger than, the adsorption
enthalpy obtained with the 1-T cluster model.
The values of H2 adsorption enthalpy on the Li1 cation at
the intersection site (I2/T2) were �5.6 and �5.9 kJ mol�1 for
the H2 molecule approaching the Li1 ion from the main and
the perpendicular channel, respectively. It is apparent that two
H2 molecules can interact with one Li1 at the intersection site
(Fig. 4a) at the same time without affecting each other. The H2
adsorption enthalpy on the Li1 cation at the channel wall site
(M7/T3) is slightly smaller (by about 1 kJ mol�1) than that for
the intersection site. However, H2 cannot be adsorbed on the
Li1 ion at the P6/T1 site.
For all models investigated (0-T, 1-T, and periodic model),
the structures having the lowest energy were T-shaped adsorp-
tion complexes. The H–H bond length is elongated by only a
few thousandths of an A upon interaction with the alkali metal
cation. (Note that in the gas phase H2 molecule r(H–H) is
0.751 A at the PBE level using both the aug-cc-pVTZ and
plane-wave basis sets). The largest H–H bond length elonga-
tion is found for H2 interacting with a bare Li1 ion (almost
0.01 A), the smallest change in H–H bond length is observed
for the least stable P6/T1 site. It is apparent from Table 1 that
the calculated DH0 values correlate with corresponding H–H
bond elongation. The coordination of the metal cation to the
zeolite framework was found to be unaltered upon interaction
with adsorbed H2.
4. Discussion
The experimentally determined value of DH0 = �4.1 kJ mol�1
is close to the corresponding values calculated using the
periodic DFT approach (Table 1), excluding site P6/T1 which
should not contribute to hydrogen adsorption. It should be
noted, however, that the excellent agreement found between
experimental and calculated values of standard adsorption
enthalpy could, to some extent, be fortuitous. Two main
sources of uncertainty can affect calculated DH0 values. First,
the interaction energy calculated using GGA functionals (in-
cluding the PBE functional) is known to be somewhat over-
estimated, while attraction due to dispersion forces is
neglected at the DFT level, so these two terms can partially
cancel out calculation errors. Secondly, the thermal contribu-
tion to DU0(100) was calculated from the vibrational partition
function of the adsorption complex, using frequency values
obtained at the harmonic approximation for the 1-T cluster
model, and it is worth noticing that this approximation can be
rather inaccurate, particularly for low lying vibrational modes.
In addition, use of the 1-T cluster model neglects interaction of
Table 1 Adsorption enthalpy and bond distances for H2 adsorbed on Li1 cations, obtained with DFT calculations on cluster models (0-T and1-T) and on the periodic model (FER)
H2 Locationb r(H–H)/A r(Li–H)/A DH0(100)/kJ mol�1
Cluster model0-T 0.7609 2.026 �23.51-T 0.7547 2.155 �4.7FERa
M7/T3 þ H2 M 0.7549 2.180, 2.204 �4.6I2/T2 þ H2 M 0.7559 2.206, 2.235 �5.6I2/T2 þ H2 P 0.7561 2.183, 2.195 �5.9I2/T2 þ 2 � H2
cd M 0.7554 2.207, 2.242 �5.2P 0.7561 2.220, 2.229
P6/T1 þ H2e P 0.7536 2.479, 2.434 0.1
Experimental value �4.1 (�0.8)a Alkali metal sites are defined in Fig. 1. b M and P denotes the H2 molecule located in the main and in the perpendicular channel of FER,
respectively. c Adsorption complex of two H2 molecules on the I2/T2 site depicted in Fig. 4a. d Average adsorption enthalpy. e A positive value of
DH0(100) results from the use of constant correction (DH0(100 K) � DEel(0 K) = 4.9 kJ mol�1) for all sites.
Fig. 4 Adsorption complexes of two H2 molecules on (a) Li1 and (b)
Na1 cations at the I2/T2 intersection site (viewed along the main
channel). The nearest framework oxygen atoms are on average 2.91
and 3.29 A away from hydrogen atoms in Li–FER and Na–FER
zeolites, respectively.
This journal is �c the Owner Societies 2006 Phys. Chem. Chem. Phys., 2006, 8, 2286–2292 | 2289
the H2 molecule with the zeolite channel wall. More refined
calculations, however, would require a degree of complexity
which is well beyond the scope of the present work.
Regarding multiplicity of adsorption sites, theoretical cal-
culations have clearly shown that the H2 molecule can be
adsorbed on two different site types: the intersection site
(I2/T2) and channel wall site (M7/T3). In addition, two differ-
ent adsorption complexes (having either one or two adsorbed
molecules) can be formed on the intersection site. By contrast,
IR spectra show only a single infrared absorption band (Fig.
1) and, in addition to that, the experimental data could be
interpreted by assuming a single (homogeneous) adsorbing
site, i.e., within the context of an ideal Langmuir behaviour,
which is implicit in eqn (3). These seemingly contrasting results
can be reconciled by noticing that differences in the interaction
energy for individual adsorption sites are not greater than 1.3
kJ mol�1, so (i) these differences are too small to cause a
significant deviation from the ideal Langmuir behaviour, and
(ii) IR spectroscopy (at 3 cm�1 resolution) cannot resolve
infrared absorption bands originating from the different ad-
sorption complexes formed in the H2–Li–FER system.
As already mentioned in the Introduction, a comparison of
results obtained in this study with previously reported data3
for the H2–Na–FER and H2–K–FER systems is of interest.
Table 2 summarizes experimentally determined values for the
three gas–solid systems. The bathochromic frequency shift,
Dn, is seen to follow a homogeneous trend (as expected), being
largest for H2 adsorbed on Li–FER and smallest for K–FER.
However, the adsorption enthalpy, DH0, does not follow the
same trend: for the H2–Li–FER system, the corresponding
value (�4.1 kJ mol�1) is lower than that found for the
H2–Na–FER system (�6.0 kJ mol�1). This somewhat puzzling
observation finds a precedent in previously reported stu-
dies22,25 on H2 adsorption on alkali metal exchanged ZSM-5
zeolites. For H2–Li–ZSM-5, reported values of Dn and DH0
are �71 cm�1 and �6.5 kJ mol�1, respectively, while for
H2–Na–ZSM-5 they are �62 cm�1 and �10.3 kJ mol�1. It
should also be noted that, in agreement with experimental
results, the calculated adsorption enthalpy of H2 on Li–FER
(�4.6 to �5.9 kJ mol�1, Table 1) is smaller than that found3
for H2 on Na–FER (�5.2 to �7.0 kJ mol�1). A tentative
explanation for the H2–Li–ZSM-5 system showing a larger Dnvalue than H2–Na–ZSM-5, while DH0 is smaller for
H2–Li–ZSM-5 than for H2–Na–ZSM-5, was given in ref. 22.
Some of us proposed that, upon coordination to the adsorbed
H2 molecule, the Li1 ion could slightly move outward from its
original position on the zeolite wall, so as to optimize the
interaction with the adsorbed molecule. Since this step would
(necessarily) be endothermic, the overall value of DH0 would
be lower than expected as compared to the H2–Na–ZSM-5
system. However, no theoretical calculations were performed
at the time to substantiate this tentative hypothesis. We now
report calculations for alkali metal exchanged ferrierite which
give some evidence that cation movement is not a major
reason for a low value of the adsorption enthalpy of H2 on
Li1 sites.
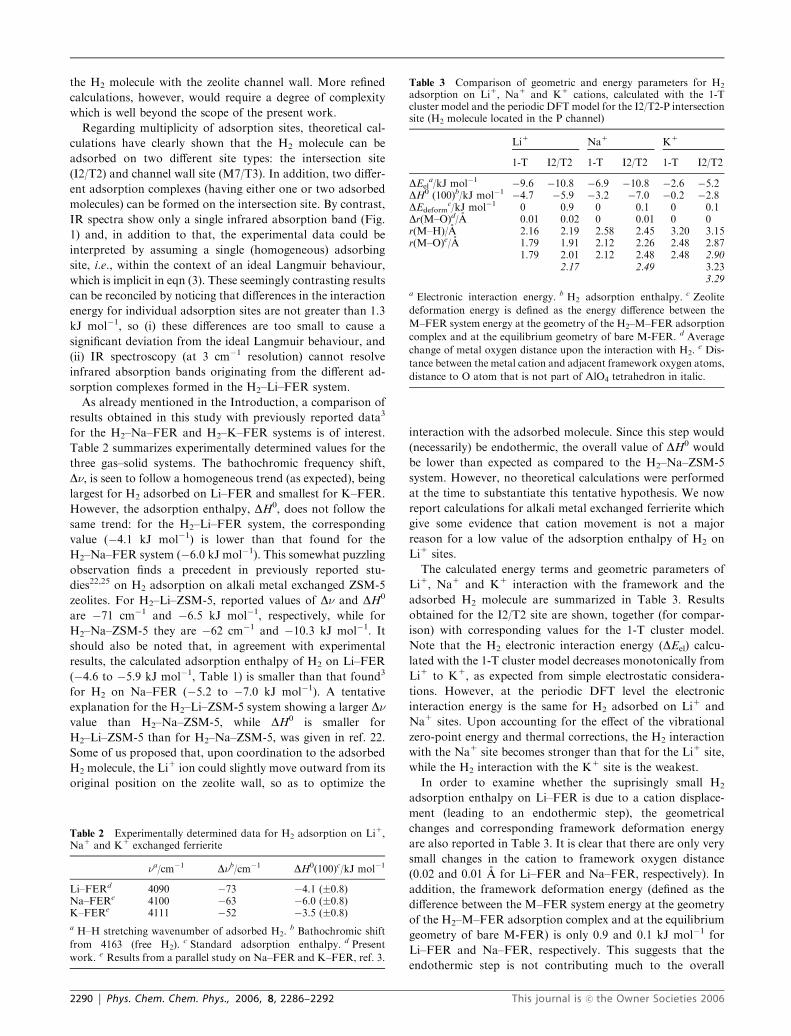
The calculated energy terms and geometric parameters of
Li1, Na1 and K1 interaction with the framework and the
adsorbed H2 molecule are summarized in Table 3. Results
obtained for the I2/T2 site are shown, together (for compar-
ison) with corresponding values for the 1-T cluster model.
Note that the H2 electronic interaction energy (DEel) calcu-
lated with the 1-T cluster model decreases monotonically from
Li1 to K1, as expected from simple electrostatic considera-
tions. However, at the periodic DFT level the electronic
interaction energy is the same for H2 adsorbed on Li1 and
Na1 sites. Upon accounting for the effect of the vibrational
zero-point energy and thermal corrections, the H2 interaction
with the Na1 site becomes stronger than that for the Li1 site,
while the H2 interaction with the K1 site is the weakest.
In order to examine whether the suprisingly small H2
adsorption enthalpy on Li–FER is due to a cation displace-
ment (leading to an endothermic step), the geometrical
changes and corresponding framework deformation energy
are also reported in Table 3. It is clear that there are only very
small changes in the cation to framework oxygen distance
(0.02 and 0.01 A for Li–FER and Na–FER, respectively). In
addition, the framework deformation energy (defined as the
difference between the M–FER system energy at the geometry
of the H2–M–FER adsorption complex and at the equilibrium
geometry of bare M-FER) is only 0.9 and 0.1 kJ mol�1 for
Li–FER and Na–FER, respectively. This suggests that the
endothermic step is not contributing much to the overall
Table 2 Experimentally determined data for H2 adsorption on Li1,Na1 and K1 exchanged ferrierite
na/cm�1 Dnb/cm�1 DH0(100)c/kJ mol�1
Li–FERd 4090 �73 �4.1 (�0.8)Na–FERe 4100 �63 �6.0 (�0.8)K–FERe 4111 �52 �3.5 (�0.8)a H–H stretching wavenumber of adsorbed H2.
b Bathochromic shift
from 4163 (free H2).c Standard adsorption enthalpy. d Present
work. e Results from a parallel study on Na–FER and K–FER, ref. 3.
Table 3 Comparison of geometric and energy parameters for H2
adsorption on Li1, Na1 and K1 cations, calculated with the 1-Tcluster model and the periodic DFT model for the I2/T2-P intersectionsite (H2 molecule located in the P channel)
Li1 Na1 K1
1-T I2/T2 1-T I2/T2 1-T I2/T2
DEela/kJ mol�1 �9.6 �10.8 �6.9 �10.8 �2.6 �5.2
DH0 (100)b/kJ mol�1 �4.7 �5.9 �3.2 �7.0 �0.2 �2.8DEdeform
c/kJ mol�1 0 0.9 0 0.1 0 0.1Dr(M–O)d/A 0.01 0.02 0 0.01 0 0r(M–H)/A 2.16 2.19 2.58 2.45 3.20 3.15r(M–O)e/A 1.79 1.91 2.12 2.26 2.48 2.87
1.79 2.01 2.12 2.48 2.48 2.902.17 2.49 3.23
3.29
a Electronic interaction energy. b H2 adsorption enthalpy. c Zeolite
deformation energy is defined as the energy difference between the
M–FER system energy at the geometry of the H2–M–FER adsorption
complex and at the equilibrium geometry of bare M-FER. d Average
change of metal oxygen distance upon the interaction with H2.e Dis-
tance between the metal cation and adjacent framework oxygen atoms,
distance to O atom that is not part of AlO4 tetrahedron in italic.
2290 | Phys. Chem. Chem. Phys., 2006, 8, 2286–2292 This journal is �c the Owner Societies 2006
adsorption enthalpy for these systems. However, it should be
noted that for strongly adsorbed molecules, the framework
deformation energy significantly lowers the adsorption enthal-
py, as shown recently for CO and NO adsorption on
Cu–ZSM-5.26,27
The Li1 ion is tightly coordinated to oxygen atoms of the
zeolite framework, as shown in Fig. 4. The geometrical para-
meters of H2–M–FER complexes (M= Li and Na) are shown
in Table 3. Note that going from the 1-T cluster model to the
periodic model the M–H distance increases slightly in the Li1
complex, while for the Na1 complex it shortens by over 0.1 A.
In agreement with this observation, the calculated H2 adsorp-
tion enthalpy on Li1 and Na1 cations was found to increase
by 0.9 kJ mol�1 (Table 1) and 3.8 (ref. 3) kJ mol�1, respec-
tively, on going from the 1-T cluster model to the periodic
FER model.
Fig. 4 depicts the adsorption complexes formed by two H2
molecules in Li–FER and Na–FER (I2/T2 site). For Li–FER
the adsorbed H2 molecule comes significantly closer to adja-
cent framework oxygen atoms than for Na–FER. Average
distances between H atoms and closest framework oxygens
(shown by black segments in Fig. 4) are 2.91 A for Li–FER
and 3.29 A for Na–FER. Calculations of pair-interaction
energy between H2 and the zeolite framework (at the geometry
of the corresponding adsorption complex) gave �0.7 and �1.9kJ mol�1 for H2–Li–FER and for H2–Na–FER, respectively.
Considering uncertainties inherent to the calculations per-
formed, these energy values are too small to be confidently
discussed. In addition, the H2 interaction with the framework
for other Li1 and Na1 sites in FER was found to be even
smaller. Therefore, the reason for the enthalpy of adsorption
of H2 on Li–FER being smaller than that on Na–FER remains
unclear. However, the above calculations suggest that, (i)
deformation of the adsorption site upon H2 coordination to
the Li1 ion is not the major factor involved, (ii) tight Li1
coordination to the zeolite framework lowers the Li1 ability to
bind H2, and (iii) H2 interaction with the zeolite framework (at
the equilibrium distance in the adsorption complex) could
slightly stabilize the H2–Li–FER and H2–Na–FER complexes
to different extents. Further studies seem to be desirable in
order to shed light on these points.
5. Conclusions
The standard adsorption enthalpy of H2 on the zeolite
Li–FER was experimentally determined to be DH0 = �4.1(�0.8) kJ mol�1 by means of variable temperature IR spectro-
scopy. This value was found to agree within �1.5 kJ mol�1
with that calculated by using a periodic DFT method. How-
ever, such a close agreement can (in part) be due to internal
cancellation of errors in the theoretical calculations.
Periodic DFT calculations showed that two different cation
sites can adsorb hydrogen. One of them (M7/T3) is situated on
the channel wall, the other (I2/T2) is at the intersection of two
perpendicular channels. Only one H2 molecule can be ad-
sorbed on the M7/T3 site, while two H2 molecules can be
simultaneously adsorbed on the I2/T2 site. In both cases, the
adsorption complex formed is T-shaped and the correspond-
ing values of interaction energy are very similar. H2 cannot be
adsorbed on the P6/T1 site, where the Li1 cation is located in
the plane of a 6-membered ring separating adjacent FER cages.
Finally, it is worth noting that both DFT calculations and
experimental results showed that the standard adsorption
enthalpy of molecular hydrogen on Li–FER is about 1.5–2
kJ mol�1 smaller than that on Na–FER. By contrast, the
bathochromic frequency shift (from the free molecule value of
4163 cm�1) of the adsorbed H2 molecule is larger for
H2–Li–FER than for H2–Na–FER, with values of �73 and
�63 cm�1, respectively.
Acknowledgements
The Spanish Ministry of Education and Science is gratefully
acknowledged for supporting work done at the UIB
(Project number: MAT2005-05350). Work in Prague was
supported by Grants of ME CR No. LC512 and GA CR
No. 203/06/0324. EG gratefully acknowledges funding from
the Italian Ministry of Education (MIUR). Research Project
FISR 2004.
References
1 E. Garrone and C. Otero Arean, Chem. Soc. Rev., 2005, 34,846–857.
2 C. Otero Arean, O. V. Manoilova, G. Turnes Palomino, M.Rodrıguez Delgado, A. A. Tsyganenko, B. Bonelli and E. Garrone,Phys. Chem. Chem. Phys., 2002, 4, 5713–5715.
3 C. Otero Arean, G. Turnes Palomino, E. Garrone, D. Nachtigal-lova and P. Nachtigall, J. Phys. Chem. B, 2006, 110, 395–402.
4 L. Benco, T. Bucko, J. Hafner and H. Toulhoat, J. Phys. Chem. B,2005, 109, 22491–22501.
5 X. Solans-Monfort, V. Branchadell, M. Sodupe, C. M. Zicovich-Wilson, E. Gribov, G. Spoto, C. Busco and P. Ugliengo, J. Phys.Chem. B, 2004, 108, 8278–8286.
6 J. G. Vitillo, A. Damin, A. Zecchina and G. Ricchiardi, J. Chem.Phys., 2005, 122, 114311.
7 C. Otero Arean, O. V. Manoilova, A. A. Tsyganenko, G. TurnesPalomino, M. Penarroya Mentruit, F. Geobaldo and E. Garrone,Eur. J. Inorg. Chem., 2001, 1739–1743.
8 O. Bludsky, M. Silhan, P. Nachtigall, T. Bucko, L. Benco andJ. Hafner, J. Phys. Chem. B, 2005, 109, 9631–9638.
9 P. A. Vaughan, Acta Crystallogr., 1966, 21, 983.10 J. P. Perdew, K. Burke and M. Ernzerhof, Phys. Rev. Lett., 1996,
77, 3865–3868.11 J. P. Perdew, K. Burke and M. Ernzerhof, Phys. Rev. Lett., 1997,
78, 1396–1396.12 P. E. Blochl, Phys. Rev. B, 1994, 50, 17953–17979.13 G. Kresse and D. Joubert, Phys. Rev. B, 1999, 59, 1758–1775.14 G. Kresse and J. Hafner, Phys. Rev. B, 1993, 48, 13115–13118.15 G. Kresse and J. Hafner, Phys. Rev. B, 1994, 49, 14251–14269.16 G. Kresse and J. Furthmuller, Comput. Mater. Sci., 1996, 6,
15–50.17 G. Kresse and J. Furthmuller, Phys. Rev. B, 1996, 54,
11169–11186.18 T. H. Dunning, J. Chem. Phys., 1989, 90, 1007–1023.19 D. E. Woon and T. H. Dunning, J. Chem. Phys., 1993, 98,
1358–1371.20 M. J. Frisch, G. W. Trucks, H. B. Schlegel, G. E. Scuseria, M. A.
Robb, J. R. Cheeseman, J. A. Montgomery Jr, T. Vreven, K. N.Kudin, J. C. Burant, J. M. Millam, S. S. Iyengar, J. Tomasi, V.Barone, B. Mennucci, M. Cossi, G. Scalmani, N. Rega, G. A.Petersson, H. Nakatsuji, M. Hada, M. Ehara, K. Toyota, R.Fukuda, J. Hasegawa, M. Ishida, T. Nakajima, Y. Honda, O.Kitao, H. Nakai, M. Klene, X. Li, J. E. Knox, H. P. Hratchian, J.B. Cross, C. Adamo, J. Jaramillo, R. Gomperts, R. E. Stratmann,O. Yazyev, A. J. Austin, R. Cammi, C. Pomelli, J. W. Ochterski,P. Y. Ayala, K. Morokuma, G. A. Voth, P. Salvador,J. J. Dannenberg, V. G. Zakrzewski, S. Dapprich, A. D. Daniels,
This journal is �c the Owner Societies 2006 Phys. Chem. Chem. Phys., 2006, 8, 2286–2292 | 2291

M. C. Strain, O. Farkas, D. K. Malick, A. D. Rabuck,K. Raghavachari, J. B. Foresman, J. V. Ortiz, Q. Cui,A. G. Baboul, S. Clifford, J. Cioslowski, B. B. Stefanov, G. Liu,A. Liashenko, P. Piskorz, I. Komaromi, R. L. Martin, D. J. Fox,T. Keith, M. A. Al-Laham, C. Y. Peng, A. Nanayakkara,M. Challacombe, P. M. W. Gill, B. Johnson, W. Chen, M. W.Wong, C. Gonzalez and J. A. Pople, GAUSSIAN 03, GaussianInc., Pittsburgh, PA. 2003.
21 S. F. Boys and F. Bernardi, Mol. Phys., 1970, 19, 553.22 G. Turnes Palomino, M. Rodrıguez Delgado, N. M. Tsyganenko,
A. A. Tsyganenko, E. Garrone, B. Bonelli, O. V. Manoilova andC. Otero Arean, Stud. Surf. Sci. Catal., 2005, 158, 853–860.
23 C. Otero Arean, O. V. Manoilova, B. Bonelli, M. RodrıguezDelgado, G. Turnes Palomino and E. Garrone, Chem. Phys. Lett.,2003, 370, 631–635.
24 R. Bulanek and P. Nachtigall, Appl. Catal., A, 2006,DOI: 10.1016/j.apcata.2006.03.020.
25 C. Otero Arean, M. Rodrıguez Delgado, G. Turnes Palomino, M.Tomas Rubio, N. M. Tsyganenko, A. A. Tsyganenko and E.Garrone, Microporous Mesoporous Mater., 2005, 80, 247–252.
26 M. Davidova, D. Nachtigallova, R. Bulanek and P. Nachtigall,J. Phys. Chem. B, 2003, 107, 2327–2332.
27 M. Davidova, D. Nachtigallova, P. Nachtigall and J. Sauer,J. Phys. Chem. B, 2004, 108, 13674–13682.
2292 | Phys. Chem. Chem. Phys., 2006, 8, 2286–2292 This journal is �c the Owner Societies 2006