Superconducting Characteristics of 4-Å Carbon Nanotube-Zeolite Composite
6
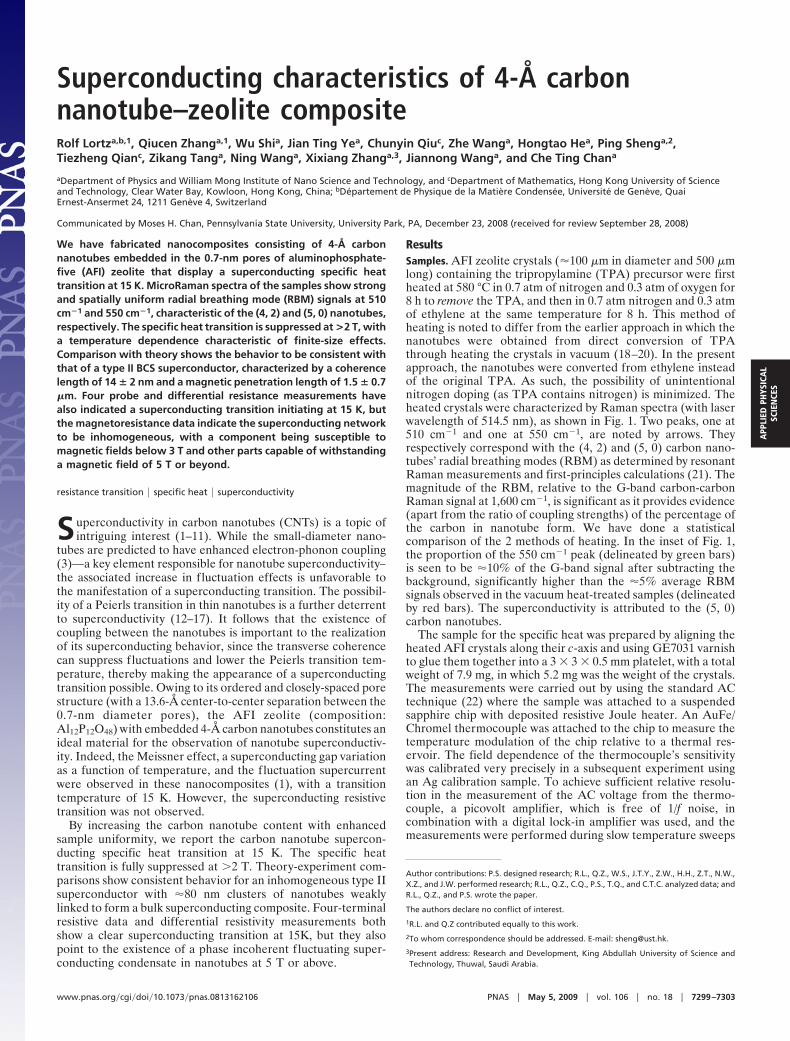
Superconducting characteristics of 4-Å carbon nanotube–zeolite composite Rolf Lortz a,b,1 , Qiucen Zhang a,1 , Wu Shi a , Jian Ting Ye a , Chunyin Qiu c , Zhe Wang a , Hongtao He a , Ping Sheng a,2 , Tiezheng Qian c , Zikang Tang a , Ning Wang a , Xixiang Zhang a,3 , Jiannong Wang a , and Che Ting Chan a a Department of Physics and William Mong Institute of Nano Science and Technology, and c Department of Mathematics, Hong Kong University of Science and Technology, Clear Water Bay, Kowloon, Hong Kong, China; b De ´ partement de Physique de la Matie ` re Condense ´ e, Universite ´ de Gene ` ve, Quai Ernest-Ansermet 24, 1211 Gene ` ve 4, Switzerland Communicated by Moses H. Chan, Pennsylvania State University, University Park, PA, December 23, 2008 (received for review September 28, 2008) We have fabricated nanocomposites consisting of 4-Å carbon nanotubes embedded in the 0.7-nm pores of aluminophosphate- five (AFI) zeolite that display a superconducting specific heat transition at 15 K. MicroRaman spectra of the samples show strong and spatially uniform radial breathing mode (RBM) signals at 510 cm 1 and 550 cm 1 , characteristic of the (4, 2) and (5, 0) nanotubes, respectively. The specific heat transition is suppressed at >2 T, with a temperature dependence characteristic of finite-size effects. Comparison with theory shows the behavior to be consistent with that of a type II BCS superconductor, characterized by a coherence length of 14 2 nm and a magnetic penetration length of 1.5 0.7 m. Four probe and differential resistance measurements have also indicated a superconducting transition initiating at 15 K, but the magnetoresistance data indicate the superconducting network to be inhomogeneous, with a component being susceptible to magnetic fields below 3 T and other parts capable of withstanding a magnetic field of 5 T or beyond. resistance transition specific heat superconductivity S uperconductivity in carbon nanotubes (CNTs) is a topic of intriguing interest (1–11). While the small-diameter nano- tubes are predicted to have enhanced electron-phonon coupling (3)—a key element responsible for nanotube superconductivity– the associated increase in fluctuation effects is unfavorable to the manifestation of a superconducting transition. The possibil- ity of a Peierls transition in thin nanotubes is a further deterrent to superconductivity (12–17). It follows that the existence of coupling between the nanotubes is important to the realization of its superconducting behavior, since the transverse coherence can suppress fluctuations and lower the Peierls transition tem- perature, thereby making the appearance of a superconducting transition possible. Owing to its ordered and closely-spaced pore structure (with a 13.6-Å center-to-center separation between the 0.7-nm diameter pores), the AFI zeolite (composition: Al 12 P 12 O 48 ) with embedded 4-Å carbon nanotubes constitutes an ideal material for the observation of nanotube superconductiv- ity. Indeed, the Meissner effect, a superconducting gap variation as a function of temperature, and the fluctuation supercurrent were observed in these nanocomposites (1), with a transition temperature of 15 K. However, the superconducting resistive transition was not observed. By increasing the carbon nanotube content with enhanced sample uniformity, we report the carbon nanotube supercon- ducting specific heat transition at 15 K. The specific heat transition is fully suppressed at 2 T. Theory-experiment com- parisons show consistent behavior for an inhomogeneous type II superconductor with 80 nm clusters of nanotubes weakly linked to form a bulk superconducting composite. Four-terminal resistive data and differential resistivity measurements both show a clear superconducting transition at 15K, but they also point to the existence of a phase incoherent fluctuating super- conducting condensate in nanotubes at 5 T or above. Results Samples. AFI zeolite crystals (100 m in diameter and 500 m long) containing the tripropylamine (TPA) precursor were first heated at 580 °C in 0.7 atm of nitrogen and 0.3 atm of oxygen for 8 h to remove the TPA, and then in 0.7 atm nitrogen and 0.3 atm of ethylene at the same temperature for 8 h. This method of heating is noted to differ from the earlier approach in which the nanotubes were obtained from direct conversion of TPA through heating the crystals in vacuum (18–20). In the present approach, the nanotubes were converted from ethylene instead of the original TPA. As such, the possibility of unintentional nitrogen doping (as TPA contains nitrogen) is minimized. The heated crystals were characterized by Raman spectra (with laser wavelength of 514.5 nm), as shown in Fig. 1. Two peaks, one at 510 cm 1 and one at 550 cm 1 , are noted by arrows. They respectively correspond with the (4, 2) and (5, 0) carbon nano- tubes’ radial breathing modes (RBM) as determined by resonant Raman measurements and first-principles calculations (21). The magnitude of the RBM, relative to the G-band carbon-carbon Raman signal at 1,600 cm 1 , is significant as it provides evidence (apart from the ratio of coupling strengths) of the percentage of the carbon in nanotube form. We have done a statistical comparison of the 2 methods of heating. In the inset of Fig. 1, the proportion of the 550 cm 1 peak (delineated by green bars) is seen to be 10% of the G-band signal after subtracting the background, significantly higher than the 5% average RBM signals observed in the vacuum heat-treated samples (delineated by red bars). The superconductivity is attributed to the (5, 0) carbon nanotubes. The sample for the specific heat was prepared by aligning the heated AFI crystals along their c-axis and using GE7031 varnish to glue them together into a 3 3 0.5 mm platelet, with a total weight of 7.9 mg, in which 5.2 mg was the weight of the crystals. The measurements were carried out by using the standard AC technique (22) where the sample was attached to a suspended sapphire chip with deposited resistive Joule heater. An AuFe/ Chromel thermocouple was attached to the chip to measure the temperature modulation of the chip relative to a thermal res- ervoir. The field dependence of the thermocouple’s sensitivity was calibrated very precisely in a subsequent experiment using an Ag calibration sample. To achieve sufficient relative resolu- tion in the measurement of the AC voltage from the thermo- couple, a picovolt amplifier, which is free of 1/f noise, in combination with a digital lock-in amplifier was used, and the measurements were performed during slow temperature sweeps Author contributions: P.S. designed research; R.L., Q.Z., W.S., J.T.Y., Z.W., H.H., Z.T., N.W., X.Z., and J.W. performed research; R.L., Q.Z., C.Q., P.S., T.Q., and C.T.C. analyzed data; and R.L., Q.Z., and P.S. wrote the paper. The authors declare no conflict of interest. 1 R.L. and Q.Z contributed equally to this work. 2 To whom correspondence should be addressed. E-mail: [email protected]. 3 Present address: Research and Development, King Abdullah University of Science and Technology, Thuwal, Saudi Arabia. www.pnas.orgcgidoi10.1073pnas.0813162106 PNAS May 5, 2009 vol. 106 no. 18 7299 –7303 APPLIED PHYSICAL SCIENCES
-
Upload
independent -
Category
Documents
-
view
0 -
download
0
Transcript of Superconducting Characteristics of 4-Å Carbon Nanotube-Zeolite Composite
Superconducting characteristics of 4-Å carbonnanotube–zeolite compositeRolf Lortza,b,1, Qiucen Zhanga,1, Wu Shia, Jian Ting Yea, Chunyin Qiuc, Zhe Wanga, Hongtao Hea, Ping Shenga,2,Tiezheng Qianc, Zikang Tanga, Ning Wanga, Xixiang Zhanga,3, Jiannong Wanga, and Che Ting Chana
aDepartment of Physics and William Mong Institute of Nano Science and Technology, and cDepartment of Mathematics, Hong Kong University of Scienceand Technology, Clear Water Bay, Kowloon, Hong Kong, China; bDepartement de Physique de la Matiere Condensee, Universite de Geneve, QuaiErnest-Ansermet 24, 1211 Geneve 4, Switzerland
Communicated by Moses H. Chan, Pennsylvania State University, University Park, PA, December 23, 2008 (received for review September 28, 2008)
We have fabricated nanocomposites consisting of 4-Å carbonnanotubes embedded in the 0.7-nm pores of aluminophosphate-five (AFI) zeolite that display a superconducting specific heattransition at 15 K. MicroRaman spectra of the samples show strongand spatially uniform radial breathing mode (RBM) signals at 510cm�1 and 550 cm�1, characteristic of the (4, 2) and (5, 0) nanotubes,respectively. The specific heat transition is suppressed at >2 T, witha temperature dependence characteristic of finite-size effects.Comparison with theory shows the behavior to be consistent withthat of a type II BCS superconductor, characterized by a coherencelength of 14 � 2 nm and a magnetic penetration length of 1.5 � 0.7�m. Four probe and differential resistance measurements havealso indicated a superconducting transition initiating at 15 K, butthe magnetoresistance data indicate the superconducting networkto be inhomogeneous, with a component being susceptible tomagnetic fields below 3 T and other parts capable of withstandinga magnetic field of 5 T or beyond.
resistance transition � specific heat � superconductivity
Superconductivity in carbon nanotubes (CNTs) is a topic ofintriguing interest (1–11). While the small-diameter nano-
tubes are predicted to have enhanced electron-phonon coupling(3)—a key element responsible for nanotube superconductivity–the associated increase in fluctuation effects is unfavorable tothe manifestation of a superconducting transition. The possibil-ity of a Peierls transition in thin nanotubes is a further deterrentto superconductivity (12–17). It follows that the existence ofcoupling between the nanotubes is important to the realizationof its superconducting behavior, since the transverse coherencecan suppress fluctuations and lower the Peierls transition tem-perature, thereby making the appearance of a superconductingtransition possible. Owing to its ordered and closely-spaced porestructure (with a 13.6-Å center-to-center separation between the0.7-nm diameter pores), the AFI zeolite (composition:Al12P12O48) with embedded 4-Å carbon nanotubes constitutes anideal material for the observation of nanotube superconductiv-ity. Indeed, the Meissner effect, a superconducting gap variationas a function of temperature, and the fluctuation supercurrentwere observed in these nanocomposites (1), with a transitiontemperature of 15 K. However, the superconducting resistivetransition was not observed.
By increasing the carbon nanotube content with enhancedsample uniformity, we report the carbon nanotube supercon-ducting specific heat transition at 15 K. The specific heattransition is fully suppressed at �2 T. Theory-experiment com-parisons show consistent behavior for an inhomogeneous type IIsuperconductor with �80 nm clusters of nanotubes weaklylinked to form a bulk superconducting composite. Four-terminalresistive data and differential resistivity measurements bothshow a clear superconducting transition at 15K, but they alsopoint to the existence of a phase incoherent fluctuating super-conducting condensate in nanotubes at 5 T or above.
ResultsSamples. AFI zeolite crystals (�100 �m in diameter and 500 �mlong) containing the tripropylamine (TPA) precursor were firstheated at 580 °C in 0.7 atm of nitrogen and 0.3 atm of oxygen for8 h to remove the TPA, and then in 0.7 atm nitrogen and 0.3 atmof ethylene at the same temperature for 8 h. This method ofheating is noted to differ from the earlier approach in which thenanotubes were obtained from direct conversion of TPAthrough heating the crystals in vacuum (18–20). In the presentapproach, the nanotubes were converted from ethylene insteadof the original TPA. As such, the possibility of unintentionalnitrogen doping (as TPA contains nitrogen) is minimized. Theheated crystals were characterized by Raman spectra (with laserwavelength of 514.5 nm), as shown in Fig. 1. Two peaks, one at510 cm�1 and one at 550 cm�1, are noted by arrows. Theyrespectively correspond with the (4, 2) and (5, 0) carbon nano-tubes’ radial breathing modes (RBM) as determined by resonantRaman measurements and first-principles calculations (21). Themagnitude of the RBM, relative to the G-band carbon-carbonRaman signal at 1,600 cm�1, is significant as it provides evidence(apart from the ratio of coupling strengths) of the percentage ofthe carbon in nanotube form. We have done a statisticalcomparison of the 2 methods of heating. In the inset of Fig. 1,the proportion of the 550 cm�1 peak (delineated by green bars)is seen to be �10% of the G-band signal after subtracting thebackground, significantly higher than the �5% average RBMsignals observed in the vacuum heat-treated samples (delineatedby red bars). The superconductivity is attributed to the (5, 0)carbon nanotubes.
The sample for the specific heat was prepared by aligning theheated AFI crystals along their c-axis and using GE7031 varnishto glue them together into a 3 � 3 � 0.5 mm platelet, with a totalweight of 7.9 mg, in which 5.2 mg was the weight of the crystals.The measurements were carried out by using the standard ACtechnique (22) where the sample was attached to a suspendedsapphire chip with deposited resistive Joule heater. An AuFe/Chromel thermocouple was attached to the chip to measure thetemperature modulation of the chip relative to a thermal res-ervoir. The field dependence of the thermocouple’s sensitivitywas calibrated very precisely in a subsequent experiment usingan Ag calibration sample. To achieve sufficient relative resolu-tion in the measurement of the AC voltage from the thermo-couple, a picovolt amplifier, which is free of 1/f noise, incombination with a digital lock-in amplifier was used, and themeasurements were performed during slow temperature sweeps
Author contributions: P.S. designed research; R.L., Q.Z., W.S., J.T.Y., Z.W., H.H., Z.T., N.W.,X.Z., and J.W. performed research; R.L., Q.Z., C.Q., P.S., T.Q., and C.T.C. analyzed data; andR.L., Q.Z., and P.S. wrote the paper.
The authors declare no conflict of interest.
1R.L. and Q.Z contributed equally to this work.
2To whom correspondence should be addressed. E-mail: [email protected].
3Present address: Research and Development, King Abdullah University of Science andTechnology, Thuwal, Saudi Arabia.
www.pnas.org�cgi�doi�10.1073�pnas.0813162106 PNAS � May 5, 2009 � vol. 106 � no. 18 � 7299–7303
APP
LIED
PHYS
ICA
LSC
IEN
CES

of 0.02 K/min at a time constant of 10 s and a modulationfrequency of �1.5 Hz. The AC measurements were combinedwith a ‘‘long’’ relaxation technique to achieve an accuracy of thetotal heat capacity determination of �1%. The contribution ofthe 2.7 mg of dried varnish was corrected using literature data(23). Measurements were performed in magnetic fields of 0, 0.4,1, 2, and 5 T, applied both parallel and perpendicular to thec-axis.
Specific Heat Experiments on CNT@AFI. The total specific heat* ofthe sample C/T, corrected for the GE varnish contribution, isshown in the inset of Fig. 2A. The tiny superconducting transitionsignal becomes visible only after subtracting the phonon con-tribution which is dominated by the AFI host, under an appliedfield of 5 T. We used the data taken at 5 T for this purpose asearlier magnetization measurements (1) suggest that the uppercritical field is below 5 T. The resulting Celectr (H)/T data areplotted in Fig. 2 A (perpendicular) and 2B (parallel). On a scalethat is �3 orders of magnitude smaller than the total specificheat, a broad anomaly was visible in zero field with maximum at12 K and onset at �15 K. A magnetic field further broadened theanomaly and shifted it down to lower temperatures. At the lowesttemperatures, an exponential increase of the specific heat wasobserved in zero field which suggests a standard s-wave orderparameter. Surprisingly, there was only a very small amount ofmagnetic anisotropy, a point to be discussed later. We used thecriterion that Celectr/T approaches zero at T � 0 for a fully gappedsuperconductor to estimate the Sommerfeld constant �n � 2.2 �0.4 mJ/mole of (5, 0) unit cells/K2 for the superconducting
fraction of the sample*. This value is 370 times smaller than thetotal specific heat of the AFI crystals at 15 K, and we have usedfor normalization the number of nanotube unit cells in the totallength of the AFI pores in the sample, assuming 100% occu-pancy. This is certainly not true, but the value allowed us tocompare with the BCS prediction, �n � (2/3)� 2kB
2 N(0), wherekB is Boltzmann’s constant, for an estimate of the true fillingfactor of the pores. Recent calculations (21) suggest a density ofstates at the Fermi level N(0) � 5/eV/unit cell, implying atheoretical value of �n � 23.4 mJ/mole of (5, 0) unit cells/K2. Thiscomparison allows us to conclude that 10 � 2% of the totallength of the pores of the AFI crystals were filled with super-
*The total C/T measured at 15 K is 5.5� 10�6 J/K2 (corrected for GE varnish), and Celectr/T �
1.5� 10�8 J/K2 represents the low temperature difference between the 5-T data and thezero field data. This value was taken to be �n. The numbers in the text were obtained fromthe following useful data. AFI zeolite density is 1.87 g/cm3 and the (5,0) carbon nanotube’sunit cell length is 4.32 Å, with 20 carbon atoms to each unit cell. Per unit length of the pore[filled with (5,0) carbon nanotubes], the mass of the carbon is 32% that of AFI zeolite,which has the composition of Al12P12O48, with a unit cell length of 8.4 Å. In Fig. 2, the massused in the Celectr/T normalization was mostly that of AFI zeolite.
600 900 1200 1500 18000
50
100
150
200
)s/tnuoc( yt isnet
nI nama
R
Raman Shift (cm-1)
D
G
RBM
0 2 4 6 8 10 120
10
20
30
40
50 Old Process New Processe
gatnecr
eP
RBM/G (%)
Fig. 1. Comparison of the Raman spectra for the old (delineated by the redcurve) and the current (delineated by the green curve) heating processes. TheRaman excitation wavelength is 514.5 nm. The RBM ratio to the G band isnearly doubled for the current process. For clarity, the 2 spectra are verticallydisplaced from each other. Inset: Proportion of the samples exhibiting thevarious RBM ratio to the G band.
0 4 8 12 16
0
5
10
0
5
10
0 5 10 150.0
0.5
1.0
1.5
0 T 0.4 T 1 T 2 T
B
A
T (K)
C.rtceleT/(μ
g J1-K
2-)
C.rtceleT /(μ
g J1-K
2-)
C/T (mJ g-1K-2)
0 4 8 12 16 200
1
2
3
0 1 2 3 40.0
0.5
1.0
)T(
H
T (K)
C
γ/)
K 2(γ n
H (T)
Fig. 2. Specific heat data of the CNT@AFI sample. Electronic contributionCelectr./T of superconducting nanotubes encaged in the pores of AFI singlecrystals for magnetic fields applied perpendicular (A) and parallel (B) to thenanotubes. Solid lines represent the data; open circles are theoretical fits withTc � 15 K and parameter values given in the text. For clarity, the 0.4, 1, and 2T curves have been shifted downwards by 1.7, 3.4, and 5.1 �J/g/K2, respectively.The data are normalized by the mass of the sample as the total amount ofnanotubes in this composite material is unknown (20). Data’s error bar isabout � 0.5 �J/g/K2. Inset of (A): Zero field total specific heat of the AFI singlecrystals with encaged nanotubes in the pores. The Sommerfeld constant of thesuperconducting contribution is 370 times smaller than the total specific heatat 15 K. (C) Magnetic phase diagram derived from the specific heat (fieldapplied perpendicular to the nanotubes). Because of the fluctuation-inducedbroadening of the transition, 3 different criteria have been used to trace Tc(H):The upper onset of the transition (red dots), the midpoint of the broadenedspecific-heat jump (black squares), and the specific-heat maximum (greentriangles). The dashed lines are extrapolations toward Hc2 (0) according to a fitwith the standard WHH model. Inset: Plot of the normalized low-temperatureelectronic specific heat at 2 K as a function of the magnetic field.
7300 � www.pnas.org�cgi�doi�10.1073�pnas.0813162106 Lortz et al.

conducting material. Fig. 2C shows a magnetic phase diagramderived from the specific-heat data in field applied perpendic-ular to the CNTs. As the transition is broadened by fluctuations,we used three different criteria to trace the upper critical fieldline, that is, the upper onset of the superconducting transition(highest temperature where the data starts to deviate from �n),the midpoint of the broadened specific-heat jump, and themaximum of the specific-heat anomaly. We used the standardmodel of Werthamer, Helfand, and Hohenberg (WHH model;24) to extrapolate the upper critical field to Hc2 (0). The 3 curvesconverge to Hc2 (0) � 2.8 � 0.4 T. Indeed, at 3 T no moresignature of superconductivity was observed in the experiments.The deviation of the data from the model close to Tc(H) is almostcertainly related to the presence of strong phase fluctuations,which lower the transition temperature somewhat from the BCSvalue and broaden the transition. The inset to Fig. 2C shows thenormalized magnetic field dependence of the electronic spe-cific heat at 2 K, which also indicates Hc2 (0) �3 T. Note thatthe concave behavior of this quantity is unlikely to be relatedto the presence of nodes in the order parameter. A lineardependence of the low temperature specific heat for s-wavesuperconductors is only expected at magnetic fields muchsmaller than Hc2.
Theoretical Modeling of the Specific Heat Data. The peaks are muchbroader than those observed in bulk superconductors, and thereis no significant anisotropy in the data. We attribute bothfeatures to the finite size of the superconducting nanotubeclusters. To substantiate this attribution and to extract theparameter values relevant to the sample, we used the Bardeen-Cooper-Schrieffer (BCS) specific heat expression (25), with thegap function �(T,H) simulated by an anisotropic Ginzburg-Landau (GL) model for finite-sized superconducting clusters(2). Here,
Celectr � 2�2kB�g�exp�E�1 � exp�E��2
� � E2 �12
�d�2
d�� d�
where � � 1/kBT, E � [� 2 �2]1/2, g(�) � N(0)�1 �/�F, and�F is the Fermi energy. By setting [�/�(0)] � �����2/��0�2�, weevaluate the normalized gap function through the ensemble-averaged (denoted by the angular brackets) values of the abso-lute-value square of the complex GL order parameter �. Here,the subscript 0 denotes the value at H, T � 0, and �(0) � gkBTcwith the value of g to be fixed by the low temperature data.
The values of g � 3 � 0.2 and Tc � 15 � 1 K can be easilyobtained from Monte Carlo simulations (2, 26) on zero-field���2�/��0�2� for a sample of size 6 � 6 � 3 (in units of thezero-temperature coherence length 0, with 3 being along thec-axis direction), with good fits obtained to both the experimen-tal peak height and the observed low temperature behavior asshown by the connected symbols in Figs. 2 A and 2B. Here, thetheoretical values are normalized to the experimental value of�n. It is noted that �(0) � 3kBTc is larger than the BCS value of�(0) � 1.76kBTc, but the temperature dependence of the nor-malized gap is in very good agreement with that obtained earliervia different means (1). For finite magnetic fields, we alsoobtained very good fits to the data in both orientations withoutfurther changes in the parameter values, with dimensionless B� �0.04, 0.1, and 0.2 to correspond with 0.4, 1, and 2 T, respectively.Since B� � B0
2/�0 with �0 � hc/2e being the quantum flux, thegood agreement between theory and experiment implies 0 �14 � 2 nm. As the scaled problem is isotropic in terms of theinteractions, 0 is the only coherence length obtainable. The
slight difference between the 2 orientations at intermediatefields is due to the shape of the finite-sized sample. We have alsoused the low temperature asymptotes as an indicator for thefraction ƒn(H) of the sample turned to normal by the magneticfield, so that the plotted theory curves represent ƒn (1 �ƒn)Ces/(�nT). No useful anisotropy information may be obtainedfrom the data, owing to the lack of information on either theactual physical geometry of the nanotube clusters, or the ratio inthe coherence lengths along the 2 principal directions†. From ourdata fitting, an estimate of zero-temperature Hc � 100 � 50 Gand an effective magnetic penetration length � 1.5 � 0.7 �mwere obtained. The values of and 0 were noted to beremarkably consistent with those estimated earlier (2).
Electronic Transport Characteristics of CNT@AFI. As the specific heatwas measured with reference to the 5 T values, any supercon-ducting order not quenched at 5 T would not be fully manifestedin the data. Transport measurements, however, may yield someinformation regarding the existence of (fluctuating) supercon-ducting condensate in individual nanotubes beyond 5 T.
To measure the electric transport characteristics, we preparedthe sample by selecting an AFI zeolite crystallite (50 � 50 � 300�m) and using the Focused Ion Beam (FIB, Seiko SMI2050) todelineate a 5-�m slice (see the cartoon inset of Fig. 3) containingnanotubes perpendicular to the slice. To provide electricalcontact, 50 nm of Ti and 150 nm of Au were sputtered on thesurface of AFI as well as the fresh ends of the single-wallednanotubes (SWNTs). FIB was again used to define the 4-termi-nal electrode configuration on the AFI surface as shown by thecartoon inset in Fig. 3. The 2 voltage leads in the center wereseparated by 100 nm. Further annealing in vacuum (10�6 Torr)at 500–600 °C reduced the contact resistance between SWNTsand Au/Ti. It should be noted that owing to the fact that thenanotubes were situated only �10 Å below the AFI surface,
†For example, if it is known that the average physical size of the nanotube clusters is 5 timesas long (along the c-axis) as it is wide (i.e., 80 nm wide and 400 nm in length), then fromour simulation results it can be concluded that the coherence length in the z direction is10 � 0, which implies a factor of 100 in the ratio of the coupling strength along thetransverse and longitudinal directions.
0 5 10 15 20
0
2
4
6
8
10
12
R( kΩ)
T (K)
0 T4 T
9.5
10.0
10.5
0 T
10 20 T (K)
R(kΩ)
15
0 5 10 15 20
0
2
4
6
8
10
12
R( k)
T (K)
0 T4 T
9.5
10.0
10.5
0 T
10 20 T (K)
R(k)
15
Fig. 3. Resistance plotted as a function of temperature for the 4-terminalsample, measured at 10 nA. The geometry of the sample is illustrated in thecartoon inset, with yellow indicating gold coating and green the AFI crystalsurface. The slice between the 2 grooves is 5 �m thick. The enlarged sectionshows the transition starts at 15 K. Up to 4 T, there is no appreciable changein the R(T) behavior.
Lortz et al. PNAS � May 5, 2009 � vol. 106 � no. 18 � 7301
APP
LIED
PHYS
ICA
LSC
IEN
CES

sample contact with the electrodes was good, in particular as theAFI surface is imperfect.
Low temperature measurements of resistance vs. temperaturewere made with a series resistance of less than 15 Ohms. As theAFI zeolite is insulating, the conductance of the sample directlyreflects the conductance of the SWNTs.
Fig. 3 shows the resistance measured in the 4-terminal con-figuration plotted as a function of temperature. It is seen that thetransition initiates at 15 K (see the inset showing the enlargedsection), with resistance decreasing smoothly toward zero. Theresistance vs. temperature behavior was not changed under a 4-Tmagnetic field (applied perpendicular to the c-axis of the AFIcrystal), suggesting the superconducting component, in this case,may consist of thin bundles of coupled nanotubes. Clearly, sucha component would not be detectable by specific heat measure-ments with a quenching field of 4–5 T.
In another sample prepared for 2-terminal measurement (inwhich the central slice is only 1 �m wide), differential resistivityof the SWNTs array was measured as a function of the biascurrent.‡ At 16 K, there was a broad resistivity peak around lowcurrent bias, presumably due to electron-electron interactioneffects in SWNTs (27). A sudden change occurred at Tc � 15 Kwith the onset of a dip around the low current bias. In Fig. 4, weshow the measured resistivity dip at 14 K (Fig. 4A) and 12K (Fig.4B). It is seen that as temperature decreased, the depth of themeasured resistivity dip increased. At 14 K, there was nomagnetoresistance up to 5 T (Fig. 4A), but at 12 K, there waspositive magnetoresistance up to 3 T (noted to be consistent withthe specific heat data), but beyond which the dip did not changeas the field was increased to 5 T (Fig. 4B). The dip disappearedas the temperature was raised to 15 K. These characteristicsstrongly suggest the superconducting component of the sampleto be inhomogeneous, with part of the network susceptible tomagnetic effects below 3 T (the part where the nanotubes arecoupled through Josephson interaction, with condensation start-ing at below 14 K) and which can be in series with the other parts
(thin bundles or even single nanotubes) capable of withstandinga much higher magnetic field, maybe up to the Pauli limit,whereby the singlet spin pairing is broken, estimated to be 30–40T. While the Josephson coupled array is detectable by thespecific heat, the thin bundle component of the network is onlymeasurable through the transport measurements. Owing to thelarge sample resistance (on the order of 7 mega Ohms), the R vs.T transition behavior was not seen in the sample with the2-terminal configuration.
ConclusionsIn conjunction with the previous Meissner effect data (1), thespecific heat and differential resistivity measurements showthat nanostructure in the form of thin tubes can inducesuperconductivity in undoped carbon, which was not previ-ously known to be superconducting. Such superconductivitywith 1-D elements displays a qualitatively BCS-type behavioron the scale of 10 nm or more. However, its intrinsic charac-teristics at the level of individual nanotubes still remain to befurther explored§.
§We note that in spite of the different samples and their fabrication processes, there isconsistency in the measured transition temperature. This could be due to the ordered AFIcrystal structure. Also, it should be noted that the constancy of the 15 K transitiontemperature greatly decreases the possibility that the superconductivity is due to unin-tentional nitrogen doping, since in the current sample fabrication approach the nano-tubes are formed from ethylene (instead of TPA as in the original approach), which has nonitrogen. If the superconductivity was due to nitrogen doping, then at least the transitiontemperature should be sensitive to the doping level. The different fabrication approachesshould, at a minimum, alter the nitrogen doping level. Thus, the constancy of thetransition temperature may be regarded as strong evidence against nitrogen doping asthe cause of the observed superconductivity. The lack of magnetic anisotropy also repre-sents a significant difference with the previous samples. This could be due to the largertransverse dimension of the nanotube clusters in the present samples.
ACKNOWLEDGMENTS. We thank Bei Zhang, Ling Li, Z. M. Li, Fuyi Jiang, WeiMin Chung, and Milky Tang for technical support and Paul Chu for making itpossible to obtain the essential pieces of equipment used in the experiments.P.S. thanks the late Leroy Chang for his continued encouragement. R.L. thanksDirk van der Marel and Jean-Marc Triscone for their support during theexperiments in Geneva. This work was supported by the Research GrantsCouncil of Hong Kong Grants CA04/04.SC02, DSC104/05.SC01, and VPAAO04/05.SC01.
1. Tang ZK, et al. (2001) Superconductivity in 4-Angstrom single-walled carbon nano-tubes. Science 292:2462–2465.
2. Qiu C, Qian T, Sheng P (2007) Meissner effect in a system of coupled one-dimensionalsuperconducting wires: Monte Carlo simulations. Phys Rev B 75:024504.
3. Benedict LX, Crespi VH, Louie SG, Cohen ML (1995) Static conductivity and superconductivityof carbon nanotubes: Relations between tubes and sheets. Phys Rev B 52:14935–14940.
4. Kasumov A, et al. (2003) Quantum transport through carbon nanotubes: Proximity-induced and intrinsic superconductivity. Phys Rev B 68:214521.
‡Differential resistance measurement was done by using a negative, 2-nA and 0.02-scurrent pulse followed by a similar positive pulse, and measuring the voltage difference.This is repeated for every current value.
-80 -60 -40 -20 0 20 40 60 80
5.5
6.0
6.5
7.0
7.5
8.0
-80 -60 -40 -20 0 20 40 60 80
4.0
4.5
5.0
5.5
6.0
6.5
7.0
7.5
8.0T = 14K
k( ytivitsiseR lait
nereffiD
Ω ••
)m
Current (nA)
0T 1T 3T 5T
A B
k( ytivitsiseR lait
nere ffiD
Ω ••
)m
Current (nA)
0T 1T 2T 3T 4T 5T
T = 12K
Fig. 4. Magnetic field dependence of the differential resistivity for the 2-terminal sample. (A) At 14 K, the application of a magnetic field of up to 5 T had noeffect on the differential resistivity dip at small bias current. (B) At 12 K, there is clear positive magnetoresistance up to 3 T. A scanning electron microscopy imageof the sample is shown in the inset.
7302 � www.pnas.org�cgi�doi�10.1073�pnas.0813162106 Lortz et al.

5. Kociak M, et al. (2001) Superconductivity in ropes of single-walled carbon nanotubes.Phys Rev Lett 86:2416–2419.
6. Takesue I, et al. (2007) Superconductivity in entirely end-bonded multi-walled carbonnanotubes. Physica C 460-462:111–115.
7. Takesue I, et al. (2006) Superconductivity in entirely end-bonded multiwalled carbonnanotubes. Phys Rev Lett 96:057001.
8. Sasaki K-I, Jiang J, Saito R, Onari S, Tanaka Y (2007) Theory of superconductivity ofcarbon nanotubes and graphene. J Phys Soc Jpn 76:033702.
9. Morpurgo AF, Kong J, Marcus CM, Dai H (1999) Gate-controlled superconductingproximity effect in carbon nanotubes. Science 286:263–265.
10. Tsuneta T, Lechner L, Hakonen PJ (2007) Gate-controlled superconductivity in a diffu-sive multiwalled carbon nanotube. Phys Rev Lett 98:087002.
11. Barnett R, Demler E, Kaxiras E (2005) Electron-phonon interaction in ultrasmall-radiuscarbon nanotubes. Phys Rev B 71:035429.
12. Huang Y, Okada M, Tanaka K, Yamabe T (1996) Estimation of Peierls-transitiontemperature in metallic carbon nanotube. Sol Stat Comm 97:303–307.
13. Sedeki A, Caron LG, Bourbonnais C (2000) Electron-phonon coupling and Peierlstransition in metallic carbon nanotubes. Phys Rev B 62:6975–6978.
14. Bohnen K-P, Heid R, Liu HJ, Chan CT (2004) Lattice dynamics and electron-phononinteraction in (3,3) carbon nanotubes. Phys Rev Lett 93:245501.
15. Gonzalez J, Perfetto E (2005) Coulomb screening and electronic instabilities of small-diameter (5,0) nanotubes. Phys Rev B 72:205406.
16. Connetable D, Rignanese G-M, Charlier J–C, Blase X (2005) Room temperature Peierlsdistortion in small diameter nanotubes. Phys Rev Lett 94:015503.
17. Fernandez-Serra MV, Blase X (2008) Zone-center instability of C(5,0) carbon nanotubesinside AIPO4–5 channels. Phys Rev B 77:195115.
18. Wang N, Tang ZK, Li GD, Chen JS (2000) Single-walled 4-Å carbon nanotube arrays.Nature 408:50–51.
19. Li ZM, et al. (2001) Polarized absorption spectra of single-walled 4-Å carbon nanotubesaligned in channels of an AlPO4-5 single crystal. Phys Rev Lett 87:127401.
20. Li ZM, et al. (2004) Synthesis of 4-Å single-walled carbon nanotubes in catalyticSi-substituted AlPO4-5 molecular sieves. Appl Phys Lett 85:1253–1255.
21. Liu HJ, Chan CT (2002) Properties of 4-Å carbon nanotubes from first-principlescalculations. Phys Rev B 66:115416.
22. Sullivan PF, Seidel G (1968) Steady-state, AC-temperature calorimetry. Phys Rev173:679–685.
23. Heessels JT (1971) Specific heat of General Electric 7031 varnish from 2 to 80 K.Cryogenics 11:483–484.
24. Werthamer NR, Helfand E, Hohenberg PC (1966) Temperature and purity dependenceof superconducting critical field Hc2. III. Electron spin and spin-orbit effects. Phys Rev147:295–302.
25. Tinkham M (1996) Introduction to Superconductivity, (McGraw-Hill, New York) 2nd Ed,pp 124.
26. Scalapino DJ, Sears M, Ferrell RA (1972) Statistical mechanics of one-dimensionalGinzburg-Landau fields. Phys Rev B 6:3409–3416.
27. Bockrath M, et al. (1999) Luttinger-liquid behaviour in carbon nanotubes. Nature397:598–601.
Lortz et al. PNAS � May 5, 2009 � vol. 106 � no. 18 � 7303
APP
LIED
PHYS
ICA
LSC
IEN
CES

CELL BIOLOGYCorrection for ‘‘EGF receptor signaling blocks aryl hydrocarbonreceptor-mediated transcription and cell differentiation in humanepidermal keratinocytes,’’ by Carrie Hayes Sutter, Hong Yin,Yunbo Li, Jennifer S. Mammen, Sridevi Bodreddigari, GayleneStevens, Judith A. Cole, and Thomas R. Sutter, which appeared inissue 11, March 17, 2009, of Proc Natl Acad Sci USA (106:4266–
4271; first published March 2, 2009; 10.1073/pnas.0900874106).The authors note that on page 4269, in Fig. 4C, the black and
gray bars are mislabeled. The black bars should indicate cellstreated without EGFR tyrosine kinase inhibitor PD153035, andthe gray bars should indicate cells treated with PD153035. Thiserror does not affect the conclusions of the article. The correctedfigure and its legend appear below.
APPLIED PHYSICAL SCIENCESCorrection for ‘‘Superconducting characteristics of 4-Å carbonnanotube–zeolite composite,’’ by Rolf Lortz, Qiucen Zhang, WuShi, Jiang Ting Ye, Chunyin Qiu, Zhe Wang, Hongtao He, PingSheng, Tiezheng Qian, Zikang Tang, Ning Wang, XixiangZhang, Jiannong Wang, and Che Ting Chan, which appeared inissue 18, May 5, 2009, of Proc Natl Acad Sci USA (106:7299–7303;first published April 15, 2009; 10.1073/pnas.0813162106).
The authors note that the author name Jiang Ting Ye shouldhave appeared as Jian Ting Ye. The online version has beencorrected. The corrected author line appears below. Addition-ally, the authors note that in the Acknowledgments section, thename Wei Min Chung should have appeared as Wai Man Chung.
Rolf Lortz, Qiucen Zhang, Wu Shi, Jian Ting Ye, ChunyinQiu, Zhe Wang, Hongtao He, Ping Sheng, Tiezheng Qian,Zikang Tang, Ning Wang, Xixiang Zhang, Jiannong Wang,and Che Ting Chan
www.pnas.org/cgi/doi/10.1073/pnas.0904669106
Fig. 4. Opposing effects of TCDD and EGF on differentiation of NHEKs. (A) NHEKs were grown to confluence, and basal medium, or medium with�-naphthoflavone (NF, 1 �M) was added 24 h before treatment. CEs were isolated after treatment with either 0.1% DMSO or TCDD (10 nM) for 5 days. (B) NHEKswere grown to confluence, and basal medium with or without EGF (10 ng/mL) was added 24 h before treatment. CEs were isolated after treatment with either0.1% DMSO or TCDD (10 nM) for 5 days. (C) NHEKs were grown to confluence, and basal medium, or medium with EGF (10 ng/mL), was added 24 h beforetreatment. CEs were isolated after treatment with either 0.1% DMSO or TCDD (10 nM) in the presence or absence of PD153035 (300 nM) for 5 days. (A–C) Thevalues for CEs are a mean of triplicate samples � SD. (D–G) NHEKs were grown to a cell density of either 50% or 100% confluence before basal medium, or mediumwith EGF (10 ng/mL), was added for 24 h before treatment. Total mRNA was isolated after treatment with either control vehicle (0.1% DMSO) or TCDD (10 nM)for 24 h. Real-time PCR was used to determine the relative expression of each indicated gene (y axis). Levels of mRNA [mean (n � 3) � SD] are expressed in unitsrelative to the minimum, given a value of 1. (A–G) The a indicates that the value from treatment with TCDD is significantly different from the DMSO control;the b indicates that the value from cotreatment with TCDD and NF is significantly different from TCDD alone; the c indicates that the value from cotreatmentwith TCDD and EGF is significantly different from with TCDD alone; the d indicates that the value from treatment with TCDD, EGF, and PD153035 is significantlydifferent from treatment with TCDD and EGF; and the e indicates that treatment with EGF is significantly different from DMSO control treatment. For each ofthese comparisons, P � 0.01 by Student’s t test. Comparisons made in D–G are within the group grown to a cell density of 100% confluence.
www.pnas.org/cgi/doi/10.1073/pnas.0903987106
PNAS � June 2, 2009 � vol. 106 � no. 22 � 9121
CORR
ECTI
ON
S