Computer Simulations in Zeolite Catalysis Research
17
PLEASE SCROLL DOWN FOR ARTICLE This article was downloaded by: On: 14 January 2011 Access details: Access Details: Free Access Publisher Taylor & Francis Informa Ltd Registered in England and Wales Registered Number: 1072954 Registered office: Mortimer House, 37- 41 Mortimer Street, London W1T 3JH, UK Molecular Simulation Publication details, including instructions for authors and subscription information: http://www.informaworld.com/smpp/title~content=t713644482 Computer Simulations in Zeolite Catalysis Research C. J. J. Den Ouden a ; B. Smit a ; A. F. H. Wielers a ; R. A. Jackson b ; A. K. Nowak c a Koninklijke/Shell Laboratorium Amsterdam (Shell Research B.V.), Amsterdam, The Netherlands b Department of Chemistry, University of Keele, Keele, Staffordshire, UK c Davy Faraday Laboratory, The Royal Institution, London, UK To cite this Article Ouden, C. J. J. Den , Smit, B. , Wielers, A. F. H. , Jackson, R. A. and Nowak, A. K.(1989) 'Computer Simulations in Zeolite Catalysis Research', Molecular Simulation, 4: 1, 121 — 136 To link to this Article: DOI: 10.1080/08927028908021969 URL: http://dx.doi.org/10.1080/08927028908021969 Full terms and conditions of use: http://www.informaworld.com/terms-and-conditions-of-access.pdf This article may be used for research, teaching and private study purposes. Any substantial or systematic reproduction, re-distribution, re-selling, loan or sub-licensing, systematic supply or distribution in any form to anyone is expressly forbidden. The publisher does not give any warranty express or implied or make any representation that the contents will be complete or accurate or up to date. The accuracy of any instructions, formulae and drug doses should be independently verified with primary sources. The publisher shall not be liable for any loss, actions, claims, proceedings, demand or costs or damages whatsoever or howsoever caused arising directly or indirectly in connection with or arising out of the use of this material.
-
Upload
independent -
Category
Documents
-
view
0 -
download
0
Transcript of Computer Simulations in Zeolite Catalysis Research

PLEASE SCROLL DOWN FOR ARTICLE
This article was downloaded by:On: 14 January 2011Access details: Access Details: Free AccessPublisher Taylor & FrancisInforma Ltd Registered in England and Wales Registered Number: 1072954 Registered office: Mortimer House, 37-41 Mortimer Street, London W1T 3JH, UK
Molecular SimulationPublication details, including instructions for authors and subscription information:http://www.informaworld.com/smpp/title~content=t713644482
Computer Simulations in Zeolite Catalysis ResearchC. J. J. Den Oudena; B. Smita; A. F. H. Wielersa; R. A. Jacksonb; A. K. Nowakc
a Koninklijke/Shell Laboratorium Amsterdam (Shell Research B.V.), Amsterdam, The Netherlands b
Department of Chemistry, University of Keele, Keele, Staffordshire, UK c Davy Faraday Laboratory,The Royal Institution, London, UK
To cite this Article Ouden, C. J. J. Den , Smit, B. , Wielers, A. F. H. , Jackson, R. A. and Nowak, A. K.(1989) 'ComputerSimulations in Zeolite Catalysis Research', Molecular Simulation, 4: 1, 121 — 136To link to this Article: DOI: 10.1080/08927028908021969URL: http://dx.doi.org/10.1080/08927028908021969
Full terms and conditions of use: http://www.informaworld.com/terms-and-conditions-of-access.pdf
This article may be used for research, teaching and private study purposes. Any substantial orsystematic reproduction, re-distribution, re-selling, loan or sub-licensing, systematic supply ordistribution in any form to anyone is expressly forbidden.
The publisher does not give any warranty express or implied or make any representation that the contentswill be complete or accurate or up to date. The accuracy of any instructions, formulae and drug dosesshould be independently verified with primary sources. The publisher shall not be liable for any loss,actions, claims, proceedings, demand or costs or damages whatsoever or howsoever caused arising directlyor indirectly in connection with or arising out of the use of this material.

Molecular Simuhtion, 1989, Vol. 4, pp. 121-136 Reprints available directly from the publisher Photocopying permitted by license only
0 1989 Gordon and Breach Science Publishers S.A. Printed in Great Britain
COMPUTER SIMULATIONS IN ZEOLITE CATALYSIS RESEARCH
C.J.J. DEN OUDEN' , B. SMIT' , A.F.H. WIELERS' , R.A. JACKSON2, and A.K. NOWAK3
KoninklijkelShell Laboratorium Amsterdam (SheN Research B. V.) , Badhuisweg 3, 1031 CM Amsterdam, The Netherlands
'Department of Chemistry, University of Keele, Keele, Staflordshire, STS 5BG, UK
Davy Faraday Laboratory, The Royal Institution, 21 Albemarle Street, London W1X 4BS, UK
(Received January 1989, accepted February 1989)
An overview is presented of computer simulations applied to zeolite catalysis research. It is shown that using (numerical) statistical methods one is able to explain features observed in Ni2+ ion exchange. Lattice energy minimisation calculations confirm the validity of the model used. Furthermore, Monte Carlo and molecular dynamics simulations offer opportunities to describe adsorption and mass transport phenomena at a molecular level which is of importance in studies on shape selective catalysis.
KEY WORDS: Zeolites, catalysis, Monte Carlo, molecular dynamics, adsorption, mass transport
INTRODUCTION
Zeolites are microporous crystalline materials consisting of silicon, aluminium, oxy- gen and exchangeable charge compensating extra framework cations. The framework is built up by interlinking TO4 tetrahedra (in which the T-sites are occupied by either silicon or aluminium). The zeolite framework chemical composition is indicated by the AljSi ratio. Loewenstein's rule [l] forbids Al-0-A1 sequences in the lattice and hence the AljSi ratio lies between 0 (siliceous zeolites such as silicalite) and 1 (high alumina zeolites such as zeolite X and A). Zeolites containing H+ ions as charge compensating cations can act like solid acids, the acidity primarily depending on the aluminium content in the zeolite lattice [2] , and are used as acidic catalysts in various hydrocarbon conversion reactions.
The catalytic performance of zeolities can be modified by introducing various cations via ion exchange procedures. In particular, transition metal ions present in the micropores may act as alternative catalytic centres in reactions other than those requiring carbenium ions as intermediates [3]. Because of the catalytic properties exhibited, zeolites are widely used as components in heterogeneous catalysts in the oil- and chemical processing industries [4, 51.
For zeolites, catalytic selectivity is not only a matter of stoichiometry, but also steric constraints for molecular transport in the zeolitic void space can be the reason for the so called shape selectivity [6]. Shape selectivity can in principle be obtained by adjusting the size [7] and accessibility [8] of the micropores. A distinction is made between three types of shape selectivity depending on whether the pore size limits the entrance of the reacting molecule (reactant selectivity), the departure of the product
121
Downloaded At: 14:25 14 January 2011
122 C.J.J. DEN OUDEN ET A L .
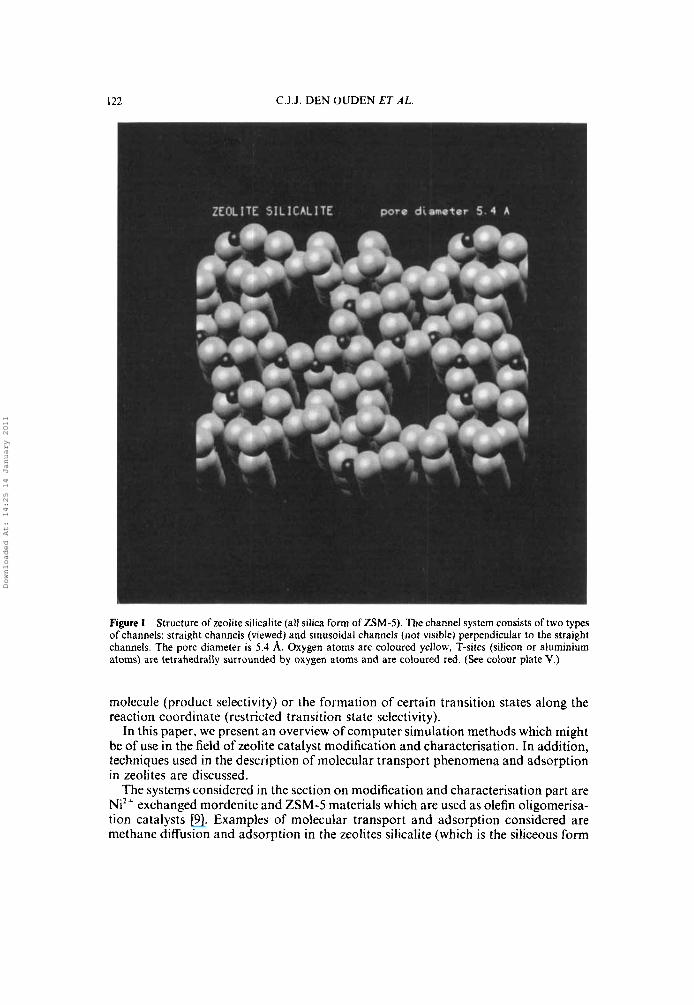
Figure I Structure of zeolite silicalite (all silica form of ZSM-5). Thechannel system consists of two types of channels: straight channels (viewed) and sinusoidal channels (not visible) perpendicular to the straight channels. The pore diameter is 5.4 A. Oxygen atoms are coloured yellow, T-sites (silicon or aluminium atoms) are tetrahedrally surrounded by oxygen atoms and are coloured red. (See colour plate V.)
molecule (product selectivity) or the formation of certain transition states along the reaction coordinate (restricted transition state selectivity).
In this paper, we present an overview of computer simulation methods which might be of use in the field of zeolite catalyst modification and characterisation. In addition, techniques used in the description of molecular transport phenomena and adsorption in zeolites are discussed.
The systems considered in the section on modification and characterisation part are Ni2+ exchanged mordenite and ZSM-5 materials which are used as olefin oligomerisa- tion catalysts [9]. Examples of molecular transport and adsorption considered are methane diffusion and adsorption in the zeolites silicalite (which is the siliceous form
Downloaded At: 14:25 14 January 2011

ZEOLITE CATALYSIS RESEARCH 123
Figure 2 Structure of zeolite mordenite. The channel system consists of two types of channels which are parallel to each other (both viewed), the main channel has a pore diameter of 7 A, whereas the secondary channel is much smaller. Side pockets are located at the edges of the main channels and are small cages with an entrance diameter of approximately 5 A. Oxygen atoms are coloured yellow, T-sites (silicon or aluminium atoms) are tetrahedrally surrounded by oxygen atoms and are coloured red. (See colour plate VI .)
of ZSM-5) and mordenite. Structural information on various types of zeolites are presented in Figure 1, 2, and 3.
ZEOLITE CATALYST MODIFICATION AND CHARACTERISATION
The ion exchange properties of zeolites make it possible to modify and to tune the catalytic performance by introducing different cations in the micropores. Therefore, ion exchange studies are important both from a practical and a fundamental point of
Downloaded At: 14:25 14 January 2011

I24 C.J.J. DEN OUDEN ET A L .
Figure 1 Structure of zeolite silicalite (all silica form of ZSM-5) The channel system consists of two types of channels straight channels (viewed) and sinusoidal channels (not visible) perpendicular to the straight channels The pore diameter is 5 4 8, Oxygen atoms dre coloured yellow, T-sites (silicon or aluminium atoms) are tetrahedrally surrounded by oxygen atoms and are coloured red (See colour plate VII.)
view. It is generally accepted that the exchange capacity of zeolites is related to the amount of aluminium in the zeolite lattice. This feature stems from the fact that an aluminium atom substituted for a silicon atom in the lattice causes an excess negative charge. This negative charge is compensated for by the presence of an extra frame- work cation. Recently however, we showed that the exchange of monovalent cations for divalent cations, such as Ni” , is not a simple stoichiometric one, especially for low aluminium concentrations in the zeolite.Furthermore the amount of Ni2+ that can be exchanged is related to the distribution of aluminium in the zeolite lattice [lo].
Several research groups [ I 1, 121 have also investigated exchange properties of both mono- and divalent metal ions in siliceous (Al/Si < 0.05) zeolites. Whereas mon-
Downloaded At: 14:25 14 January 2011

ZEOLITE CATALYSIS RESEARCH 125
ovalent ions generally reveal complete exchange (M + /A1 = I), the ion exchange properties for divalent metal ions are less clear cut and in general an incomplete exchange is found, i.e. M?+/AI < 0.5.
The location of divalent cations (and hence the location of the catalytic centres) inside zeolites is still a matter of extensive debate. With high alumina zeolites, the concentration of divalent cations attainable is in general sufficiently high to allow determination of their location by standard X R D techniques [13, 141, but with siliceous zeolites, levels of exchange are too low to allow investigation of the location of divalent cations by these methods.
In order to explain and understand the peculiar exchange properties of divalent cations in siliceous ZSM-5, we have developed two statistical models, one based on basic statistics and one based on a Monte Carlo numerical statistical model respec- tively [lo]. The concept of both models is the same and is based on a random distribution of aluminium atoms in the zeolite lattice. Ni‘+ ions are assumed to coordinate to AI-0-Si-0-A1 sequences in the framework, thus the amount of Ni2+ which can be incorporated equals the number of Al-0-Si-0-A1 sequences found. In the first model (which will be referred to as the analytical or AN model), we derived a simple analytical expression from basic statistics which relates the Ni/Al ratio to the ZSM-5 AljSi ratio [lo]:
Ni/Al = 5.96 AljSi (1)
This analytical expression can only be obtained if Loewenstein’s rule is neglected which is only allowed in situations dealing with low aluminium contents (as is the case in this paper). If one wishes to include Loewenstein’s rule, the statistics become much more complicated. In order to obey Loewenstein’s rule, we additionally employed a Monte Carlo numerical method (referred to as the MC method) in which loewen- stein’s rule can easily be implemented. For this purpose we have calculated the number of AI-0-Si-0-A1 sequences in a ZSM-5 crystallite consisting of 3 x 3 x 3 = 27 unit cells. Periodic conditions have been used to overcome boun- dary effects.
The MC procedure involves the generation of an ensemble of N,, ZSM-5 crystal- lites. In each of these crystallites, N,, aluminium atoms are randomly distributed over the available T-sites in the crystallite. N,, depends on the AI/Si ratio considered. Crystallites in the ensemble which violate Loewenstein’s rule are rejected from the ensemble, thus reducing the number of crystallites from NMc to N&. Typical values for N& are of the order of 200,000. The total number of Al-0-Si-0-A1 sequences is counted from the reduced ensemble of crystallites. Following this procedure, the average number of AI-0-Si-0-A1 sequneces, N,,-o-s,-o-A,, and thus the average number of Ni’+ ions per crystallite, N,,, is given by:
= NAI-O-S~-O-AI/N$C ( 2 ) and therefore:
Figure 4 displays the Ni/Al ratio versus the ZSM-5 Al/Si ratio as obtained from chemical analysis (experimental), the AN method and the MC method.
The excellent agreement between modelling results and experimental data is strik- ing, indicating that aluminium is indeed randomly distributed in siliceous ZSM-5 and
Downloaded At: 14:25 14 January 2011

126 C.J J . DEN OUDEN El‘ AL.
AN method
MC method
Experimental
AI/Si (mol/mol) Figure 4 Carlo ( M C ) procedure. Experimental values are represented b> the solid dots.
Ni A1 molar ratio versus Al Si molar ratio according to the analytical (AN). and the Monte
that Ni” ions arc coordinated to thc ZSM-5 lattice via specific AI-0-Si-0-AI sequences. From Figure 4, i t can also be concluded that neglecting Loewenstein’s rule (AN-method) for low aluminium contents (as is the case in this paper) is justified. Systems with higher AI.Si ratios arc under investigation, and we expect that in these cases Loewenstein‘s rule has to be incorporated (i.e. the MC-method should give better results in this casc).
I n order to verify u u r model and to unravel the location of Nil* ions in high silica mordenite, we followed an alternative computational approach [ 1.51 based on lattice energy miniinisation calculations which already proved to be valuable techniques in simulation studies on zeolite structures [! h] and the determination of zeolite frame- work stabilities [17]. Various AI-0-(Si-O),-AI framework sequences (with N > 0 to obey Loewenstein’s rule) were investigated. For Ni” ions, three different locations i n the mordenite structure can be distinguished: in the 12-ring main channel, the %ring
Downloaded At: 14:25 14 January 2011

ZEOLITE CATALYSIS RESEARCH
145
140
127
- N=3+
N-2+
r4-3-
- N=2-
N-3- N-1- N - 2 e
N i l N-1+
I 1
A E, KJ/mole
150
Figure 5 Mordenite framework stability as a function of the location of the Ni2+ ion and framework AI-O-(Si-O),-Al sequence, AE is the difference between the all silica mordenite lattice energy and the Ni-alumino mordenite lattice energy. Decreasing AE means increasing coordination strength.
secondary channel and the 8-ring side pockets at the edges of the main channels. The results for the various locations and the various values of N are displayed in Figure 5.
As can clearly be seen from Figure 5 , NiZ+ is preferentially coordinated to an AI-O-Si-O-A1 (N = 1) sequence. The energy gaps between the levels N = 1 and N = 2 for the case of location in the 12-ring main channel and 8-ring side-pocket are substantial whereas this energy gap is much less pronounced for Ni’+ located in the %ring secondary channels.
The main conclusion which can be drawn from the modification and characterisa- tion modelling studies on Ni-alumino ZSM-5 and mordenite is that there is strong evidence that Ni2+ is coordinated to the zeolite lattice via specific AI-O-(Si-0), -A1 sequences, preferentially with ?J = 1 . Furthermore, these studies enable us to relate the amount of Ni” to be incorporated to the aluminium distribution throughout the framework.
ADSORPTION AND DIFFUSION IN ZEOLITE CATALYSTS
In order to understand the high selectivities observed in adsorption processes and
Downloaded At: 14:25 14 January 2011

128 C.J.J. DEN OUDEN ET A L
catalytic conversions of hydrocarbons over zeolite catalysts, it is necessary to study the behaviour of molecules inside the micropores of a zeolite. Since this kind of information is difficult to obtain from direct experiments, computer simulations might offer valuable alternative approaches to the problem.
In this section. we will show an example in which Monte Carlo simulations of methane adsorption in mordenite predict a very peculiar adsorption behaviour at various AI:Si ratios [IS]. Furthermore. we will present molecular dynamics simula- tions on molecular mass transport phenomena for methane migrating in the mi- cropores of siliceous mordenite and silicalite [19].
Adso rpt iort
Following the methods pioneered by Yashonath rt ul. [ZO], we have carried out Monte Carlo adsorption simulations at low coverage of methane. This allows us to ignore methane-methane interactions and hence only methane-zeolite interactions are taken into account. The potentials are taken from Kiselev et ul. [ ? I ] and Yashonath et al.
The Monte Carlo calculations were performed on a Cray XMP/lS computer using the conventional Metropolis algorithm [ 2 2 ] . A methane molecule is initially placed inside a micropore. One Monte Carlo step consists of two parts: first a random displacement of the centre of mass followed by an arbitrary rotation of the entire molecule. In order to eliminate the effect of boundaries, periodic conditions have been used with a period equal to one zeolite unit cell
In our model, we assume that methane has the same interaction with silicon and aluminium atoms in the zeolite, thus silicon and aluminium are treated as equivalent T-sites. However. as the A1 Si ratio is increased, the positive charge on the zeolite lattice decreases. This decrease is compensated by sodium ions at extra framework positions [23].
In Figure 6. the calculated adsorption enthalpy of methane in mordenite is presen- ted as a function of the AISi ratio at 300K. A sudden decrease of the adsorption enthalpy is observed as the Al;Si ratio exceeds 0.15.
The distribution of positions occupied by methane in mordenite are shown in Figure 7. At low AI!Si ratios (Figure 7a), one sees that methane is located in the straight channels and in the side pockets. The colour coding in figure 7a shows that methane located in such a side pocket has a considerably lower energy than a methane molecule i n the central channel. As the AliSi ratio is increased, the side pockets are effectively blocked by the sodium ions (Figure 7b). In this case, methane cannot reach these low energy sites anymore. We suggest that this effective blocking by the sodium ions explains the observed decrease of the adsorption enthalpy at high Al/Si ratios (cf. Figure 6). Work is in progress in order to obtain experimental verification of our observations.
Also displayed in Figure 6 is the experimental adsorption enthalpy for methane in mordenite at At& = 0.09 [27]. It is clearly seen that the agreement between cal- culated and experimental adsorption enthalpies is very good, indicating the strength of the method.
In this study, we have restricted ourselves to the special case of methane in mordenite. This relatively simple case clearly illustrates how computer simulations can provide microscopic information about the arrangement and pore accessibilities of molecules in zeolites and how this information may help us to predict the behaviour
pol.
Downloaded At: 14:25 14 January 2011

ZEOLITE CATALYSIS RESEARCH I29
EAT OF ADSORPTION ( k J/malc)
Calculated
0 Experimental
1L I I I I J
AL/Si RATIO 0 0.15 0.30 0.45 0.60 0.75
Figure 6 Adsorption enthalpy of methane in mordenite as a function of the AljSi ratio (T = 300 K).
of such zeolites.
Dzfusion
Methane diffusion in siliceous mordenite and silicalite (siliceous ZSM-5) was simu- lated using molecular dynamics procedures. The methane-zeolite and methane- methane interaction potentials were obtained from reference 21.
The molecular dynamics simulations were carried out on a Cray XMP/18 computer under NVT conditions (constant number of particles, constant volume, constant temperature) using the Verlet algorithm [24]. Each time step, the temperature, T,, of the ensemble of adsorbed methane molecules was calculated followed by a scaling of the velocities to the desired simulation temperature T, :
vi + p v i Tc (4)
The time step length, 62, was typically of the order of 10-3ps. Total simulation times varied from a few ps up to 100 ps. The simulations were carried out in a volume of 2 x 2 x 2 = 8 unit cells taking periodic boundary conditions into account. The
M S l M E
Downloaded At: 14:25 14 January 2011

I30 C.J.J. DEN OUDEN ET AL
Figure 7a Distribution of methane adsorbed in mordenite at 300K and Al/SI = 0.09 The zeolite structure is represented by oxygen (red rods), aluminium and silicon (blue rods) and extra-framework sodium ions (preen spheres) Each spot inside the mordenite pore represents the projection of the centre of mass of the methane mulecule The colour of the spot 15 3 measure for the energy of the methane molecule (the energy decreases in the order red, yellow, green, grren/white) (See colour plate VIII)
maximum zeolite loading was 4 and 3 methane molecules per unit cell silicalite and mordenite, respcctively. So the total number of methane molecules in these cases equals 32 for silicalite and 24 for mordenite. The diffusion coefficient was obtained from the mean squared displacements of the methane molecules. Diffusivities of methane migrating in silicalite and siliceous mordenite have been calculated as a function of zeolite loading. Figure 8 displays the results obtained at T = 300K.
Although the scatter in Figure 8 IS substantial, i t is clearly seen that the diffusivity of methane in silicalite is almost independent of the zeolite loading whereas the
Downloaded At: 14:25 14 January 2011
ZEOLITE CATALYSIS RESEARCH 131
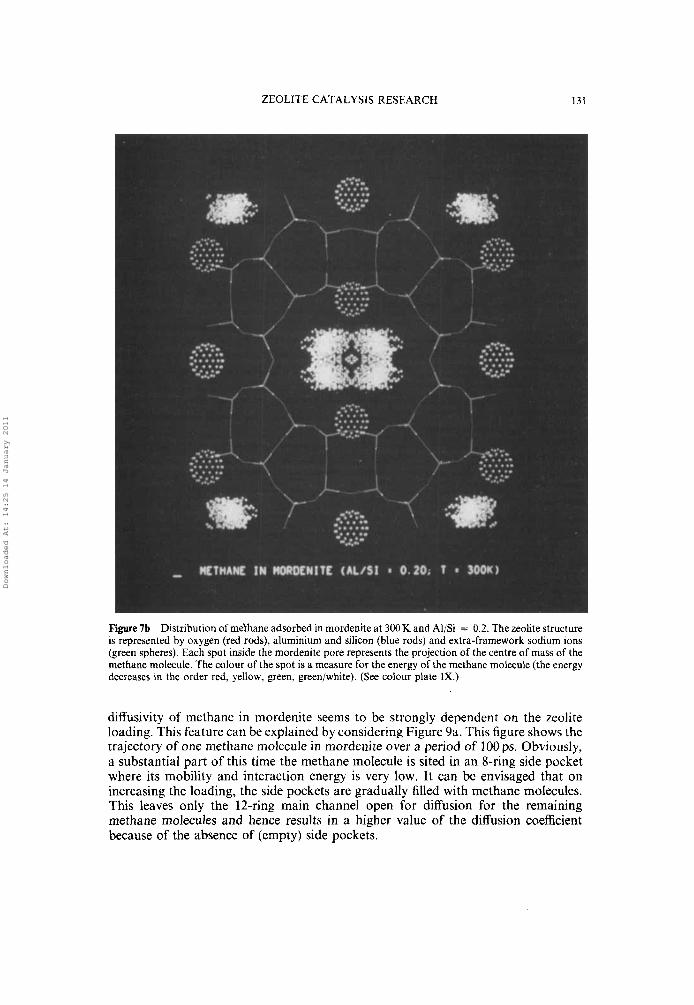
Figure 7b Distribution of methane adsorbed in mordenite at 300 K and AljSi = 0.2. The zeolite structure is represented by oxygen (red rods), aluminium and silicon (blue rods) and extra-framework sodium ions (green spheres). Each spot inside the mordenite pore represents the projection of the centre of mass of the methane molecule. The colour of the spot is a measure for the energy of the methane molecule (the energy decreases in the order red, yellow, green, green/white). (See colour plate IX.)
diffusivity of methane in mordenite seems to be strongly dependent on the zeolite loading. This feature can be explained by considering Figure 9a. This figure shows the trajectory of one methane molecule in mordenite over a period of loops. Obviously, a substantial part of this time the methane molecule is sited in an 8-ring side pocket where its mobility and interaction energy is very low. It can be envisaged that on increasing the loading, the side pockets are gradually filled with methane molecules. This leaves only the 12-ring main channel open for diffusion for the remaining methane molecules and hence results in a higher value of the diffusion coefficient because of the absence of (empty) side pockets.
Downloaded At: 14:25 14 January 2011

132
L
C.J.J. DEN OUDEN ET A L .
l a I
0
- @ - Mordeni te
- -0- - Silicalite
loading (molecules/mit cell)
Figure 8 and silicalite at T = 300 K .
Difl'usion cucfiilciziit (m' s ) bersus zeolite loading f u r merhanr migrating in a!! silica mordcnite
Table 1 Experimental dnd c ~ l i u l a t e d diKu.iion cuefficienfs fcm nicthane 111 ,111 uIm mordenite d11d dicalite.
I?ICI hod 7 rrllLrrllle m j t denire
Memhrane diBusion mesuremerit5 (ref 2 5 ) 7 14 0011 - PFG-NMR (ref 26) 300 I I - Molecular dyndmics 300 1 2 1 8
l h j I ) x loy n1' 3 ) i D x 10' m'/r)
Downloaded At: 14:25 14 January 2011

ZEOLITE CATALYSIS RESEARCH 133
Figure 9a Trajectory of a methane molecule migrating in the main channel of mordenite (the main channel is horizontally displayed) over a time period of 100 ps. The simulation temperature equals 300 K. Each spot inside the micropores represents the projection of the centre of mass of the methane molecule. (See colour plate X.)
Figure 9b displays the trajectory of one methane molecule migrating in silicalite over a loops. time period. An interesting feature in this figure is the difference in residence times of the methane molecule localised in the straight (horizontal in Figure 9b) and sinusoidal (vertical in Figure 9b) channels of the silicalite pore system. It is clearly seen that residence times for methane adsorbed in the sinusoidal channels are longer (high density of dots) than the residence times in the straight channels (low density of dots).
Calculated diffusion coefficients for methane self diffusion in silicalite and siliceous mordenite are represented in table I. Furthermore, experimental diffusion coefficients
Downloaded At: 14:25 14 January 2011

Figure 9b Trajectory of a methane molecule migrating in the straight and slnusoiddl channel of silicalite (the straight channel is horizontally displdyed whereas the sinuwidal chdnnel 15 vertically displayed) over a time penod of loops The simulation temperature equals 3WK Each spot inside the micropores represents the projection of thc centre of rn,I\< of the meth,int. moleLule (See colour pldte XI )
obtained via membrane diffusion measurements [25] and Pulse Field Gradient (PFG) NMR techniques [26] are also represented for comparison. To our knowledge. no experimental data for methane diffusion in siliceous rnvrdenite is available.
From table 1, we see very good agreement between molecular dynamics results and results obtained via PFG-NMR experiments. The difference in the diffusion coef- ficients obtained via uptake measurements and NMR spectroscopy has often been observed in the literature and is still a matter of much controversy. However, we stress that self diffusion is measured by PFG-NMR whereas uptake measurements consider
Downloaded At: 14:25 14 January 2011

ZEOLITE CATALYSIS RESEARCH 135
diffusion caused by concentration gradients. Molecular dynamics simulates self dif- fusion, so agreement with PFG-NMR would seem logical.
CONCLUSIONS
This paper has highlighted some examples of computer simulations applied to zeolite catalysis research. Although the systems under study are to some extent simplified, the characteristics and the strength of the methods used are clearly demonstrated. It has become clear that the field of applications of computer simulations in combination with experimental work is very wide. We have shown that in two different areas of zeolite catalyst and catalysis research, modification/characterisation and the descrip- tion of mass transport/adsorption, the latter being related to shape selective catalysis, simulations proved to be powerful techniques. It should be stressed that catalysis research for a long time to come is, and as a matter of fact should be, mainly an experimentally based science. Nevertheless we believe that computer simulations can contribute to a better understanding of zeolite catalysts and catalysis at a molecular level. Such an understanding is crucial for the future design of tailor-made zeolite catalysts with an ultra-high selectivity and activity.
Acknowledgewents
We wish to thank many people who have given us assistance with the studies outlined in this paper and in particular D.P. de Bruijn, C.R.A. Catlow, A.K. Cheetham, H.P.C.E. Kuipers, S. Pickett, M.F.M. Post and J.M. Thomas.
References [ I ] D.W. Breck “Zeolite Molecular Sieves” Robert E. Krieger Publishing Company, Malabar, Florida
(1 984) [2] Seee.g. M. Neuber, V. Dondur, H.G. Karge, L. Pacheco, S. Ernst, and J. Weitkampin “Spectroscop-
ic and catalytic characterisation of faujasites via the (NH,),SiF6 method” Proc. Int. Symp. “Innova- tion in Zeolite Materials Science”, Elsevier, Amsterdam (1988), page 461.
[3] Kh. Minachev and Ya. I. Isakov in J.A. Rabo (Ed.), “Zeolites Chemistry and Catalysis”, ACS monograph (1976), volume 171
[4] I.E. Maxwell “Zeolite catalysis in hydrocarbonprocessing technology” Catalysis T o d a ~ 1(4), 385 ( 1987 j.
[5] W.F. Hoelderich “New horizons in catalysis using modified and unmodified pentasil zeolites” Pure Appl. Chem., 58(10), 1383 (1986)
[6] I.E. Maxwell “Shape selective catalysis and process technology via molecular inclusion in zeolites” J . Inclusion Phenom. 4,l (1986)
[7] E.F. Vansant “Pore size engineering in zeolites” Proc. Int. Symp. “Innovation in Zeolite Materials Sciene”, Elsevier, Amsterdam (1988j, page 143
[8] C. Mirodatos and D. Barthomeuf “A new concept in zeolite-catalysed reactions: energy gradient selectivity” J. of Cuta/ysis,93,246 (1985)
[9] See e.g. G. Wendt, K. Haenau, R. Dimitrova, Z. Popova, and Ch. Dimitrov “Dimerisation of n-butenes on nickel mordenite catalysts” React. Kinet. Cutal. Lett., 31,383 (1986)
[lo] C.J.J. den Ouden, A.F.H. Wielers, H.P.C.E. Kuipers, M. Vaarkamp, M. Mackay, and M.F.M. Post “Ion exchange of Ni2+ ions in siliceous ZSM-5” Paper to be presented at the 8th Int. Zeolite Conf. Amsterdam (1989)
[ I I] P. Chu and E.G. Dwyer “Inorganic Cation Exchange properties of zeolite ZSM-5” A C S , Symp. Ser., 218,59 (1983)
Downloaded At: 14:25 14 January 2011

C.J.J. DEN OUDEN ET AL.
D.P. Matthews and L.V.C. Rees “Ion exchange in ZSM-5 zeolite“ Chmm. Age. India, 37,(5), 353 ( 1 986) P.J. Maddox, J . Spachursky. and J .M. Thomas “Probing structural changes during the onset of catalytic activity by in situ X-ray diffractornetry” Cat. Lett.. 1,191 (1988) J.M. Thomas. C. Williams. and T. Rayment “Monitoring cation-site occupancy of nickel-exchanged zeolite Y catalysts by high-temperature in situ X-ray powder diffractometry” J . Chem. Soc. Faradap Trans., I, 84(9), 2915 (1988) C.J.J. den Ouden. R.A. Jackson. C.R.A. Catlow. and M.F.M. Post “The location of Ni’+ ions in siliceous mordenite: a computational approach” To be published R.A. Jackson and C.R.A. Catlow ”Computer simulation studies of zeolite structure” Molecular Simulation. 1,207 (1988) G . Ooms, R.A. van Santen, C.J.J. den Ouden. R.A. Jackson. and C.R.A. Catlow “Relative stabilities of zeolitic alumino silicates“ J . Phj.s. Cheni., 92,4462 (1988) B. Smit and C.J.J. den Ouden “Monte Carlo simulations on the relation between structure and properties of zeolites: The adsorption of small hydrocarbons“J. Phys. Chmi., 92,7169 (1988) To be published S. Yashonath. J.M. Thomas. A.K. Nowak. and A.K. Chcctham ”The siting. energetics and mobility of saturated hydrocarbons inside zeolitic cages: methane in zeolite Y” Nature, 331,601 (1988) A.V. Kiselev. A.A. Lopatkin, and A.A. Schulga “Molecular statistical calculation of gas adsorption by silicalite” Zeolites, 5.261 (1985) N. Metropolis, A.W. Rosenbluth, M.N. Rosenbluth, A.H. Teller, and E. Teller “Equation of state calculations by fast computing machines” J. Cliem. P h w . 21,1081 (1953) W.J. Mortier “Compilation of extra framework sites in zeolites” Butterworth Scientific Limited (1982) M.P. Allen and D.J. Tildesley “Computer Simulation of Liquids’. Clarendon Press, Oxford (1987) D.T. Hayhurst and A.R. Paravar “Diffusion of C , to C , normal paraffins in silicalite” Zeolites, 8,27 (1988) J. Karger. H. Pfeifer. and D. Freude “NMR Investigations of self-diffusion in Pentasils” Stud. Strrf. Sc. and Cat. 28,633 (1986) R.M. Batrer in “Zeolites: Science and Technology” NATO AS1 series E 80, 227 Martinus Nijhoff Publications. The Hague (1984)
Downloaded At: 14:25 14 January 2011