
conflicts of residential landscaping: overview, frameworks, and ...
Upload
khangminh22Category
view
0download
0
Zeolite Frameworks
With β-cages
Ka Ming Leung
St Anne’s College
University of Oxford
Doctor of Philosophy
Michaelmas 2015

This thesis is dedicated to my family, especially
my father, Leung Lem Chung, and my mother, Tong Oi Yin.
Although they are 9692 kilometers away, I will never forget their
words of encouragement. More importantly, as a self-funded student,
without their financial support, I will not be able to finish my degree.
I am also thankful that my auntie, Tong Hau Yin, and my brother,
Leung Ka Man, have never left my side and are very helpful.

Acknowledgements
Firstly, I would like to express my sincere gratitude to my supervisor, Dr.
Asel Sartbaeva, for the continuous support of my DPhil study, for her
patience, encouragement, and inspirations. Her guidance helped me in all
the time of research and writing of this thesis. I will always remember
those days when we work together in the laboratory, and it is my honour
to be her first Ph.D student.
I would also like to thank Prof. Peter P. Edwards for all his helpful advices
and support, especially in the last two years of my study.
Beside my supervisors, my sincere thanks goes to: Dr. Stephen A. Wells,
who taught me the geometric simulation in my research, and is a magician
who made everything so easy to understand for a non-physicist; Dr. Matt
Tucker, who works in ISIS and helped with the set up, data collection
and analysis of the high pressure experiments in my research; Dr. David
C. Apperley and his colleagues of the EPSRC National Solid-state NMR
Service who collect all the NMR data in this research and his professional
comments on the NMR spectra.

Abstract
This study focuses on five zeolites: sodalite, zeolite A, linde type N, ze-
olite Y, and EMC-2, with SOD, LTA, LTN, FAU, and EMT framework
topologies respectively. All of these zeolites have β-cages as the frame-
work building units. The aims are to understand the conditions which
control the formation of different zeolite phases and some of the physi-
cal properties of zeolite frameworks, mainly the framework flexibility, and
the capacity of β-cage to accommodate guest molecules such as water and
methanol.
The hydrothermal and microwave syntheses of zeolite with no organic
structure directing agents require precise control of synthesis conditions
and form the fundamental part of this study. Reaction temperature and
synthesis time control the phase purity in zeolite A synthesis. A transfor-
mation from zeolite A to sodalite is observed and is related to framework
density and reaction temperatures. Microwave syntheses of sodalite show
that the batch compositions and methods of preparation also affect the
as-synthesised zeolite phases and a new sodalite morphology is found. By
using microwaves instead of traditional hydrothermal methods, one of the
most complex zeolites, linde type N zeolite, was synthesised. This is the

first study to report this new method.
The newly defined extrinsic flexibility window is studied on more depth
in this work. While the intrinsic flexibility is defined by the ability of an
empty framework to flex with no distortions in the primary tetrahedral
building units; the extrinsic flexibility window is limited by the host–guest
steric interactions between the framework and the extra framework con-
tents. In zeolite Y, the extrinsic flexibility window can be limited not only
under compression, but also in expansion, as the β-cage in a maximally
expanded framework lack the flexibility to adapt to bulky contents such
as a combination of methanol and water molecules. It is also found that
the β-cage in zeolite Y can only accommodate a maximum number of two
water molecules and one methanol molecule.
The same phenomenon is observed in sodalite under compression. In
the sodium form, the framework remains within its intrinsic flexibility
window when fluorinert is used as pressure transmitting media, as fluo-
rinert does not enter the zeolite pores. However, an extrinsic flexibility
window is observed in both the sodium and sodium bromide forms with
methanol/ethanol/water mixture as pressure transmitting media.
An exception is seen in EMC-2. The intrinsic and extrinsic flexibility
windows are identical to each other. The presence of 18-crown-6 ether
molecules in the pores does not affect the flexibility window. The crown
ether, despite its steric bulk, does not limit the geometric flexibility of
5

the framework since the cage of the EMT framework has enough space to
accommodate the crown ether molecule and can adapt to the contraction.
This shows that the extrinsic flexibility window of zeolite frameworks is
controlled not only by the extra framework contents, but also by the
framework building units.
6

Contents
1 Introduction 1
1.1 What is a zeolite . . . . . . . . . . . . . . . . . . . . . . . . . . . . . 1
1.2 β-cage as a building unit . . . . . . . . . . . . . . . . . . . . . . . . . 7
1.3 Literature review . . . . . . . . . . . . . . . . . . . . . . . . . . . . . 11
1.3.1 Sodalite . . . . . . . . . . . . . . . . . . . . . . . . . . . . . . 11
1.3.2 Zeolite A . . . . . . . . . . . . . . . . . . . . . . . . . . . . . . 12
1.3.3 Linde Type N . . . . . . . . . . . . . . . . . . . . . . . . . . . 14
1.3.4 Zeolite Y . . . . . . . . . . . . . . . . . . . . . . . . . . . . . . 15
1.3.5 EMC-2 . . . . . . . . . . . . . . . . . . . . . . . . . . . . . . . 16
1.4 The flexibility window in zeolites . . . . . . . . . . . . . . . . . . . . 17
2 Characterization techniques 20
2.1 X ray powder diffraction . . . . . . . . . . . . . . . . . . . . . . . . . 20
2.2 Solid-state magic angle spinning nuclear magnetic resonance . . . . . 25
2.3 Scanning electron microscopy . . . . . . . . . . . . . . . . . . . . . . 29
2.4 Geometric simulation of flexibility window . . . . . . . . . . . . . . . 30
i

3 Synthesis of LTA, SOD, and LTN framework zeolites with no
organic structure directing agent 33
3.1 Synthesis of zeolite A with no OSDA using microwave and
hydrothermal methods . . . . . . . . . . . . . . . . . . . . . . . . . . 33
3.2 Synthesis of sodalite with no OSDA using microwave methods . . . . 37
3.3 Transformation between LTA framework and SOD framework . . . . 43
3.4 Synthesis of Linde Type N zeolite with no OSDA . . . . . . . . . . . 47
3.4.1 Microwave synthesis of Linde Type N zeolite . . . . . . . . . . 47
3.4.2 Hydrothermal synthesis of Linde Type N zeolite . . . . . . . . 51
3.5 Summary . . . . . . . . . . . . . . . . . . . . . . . . . . . . . . . . . 54
4 β-cage capacity of water and methanol molecules in siliceous
zeolite Y 55
4.1 Preparation of zeolite Y structure for geometric simulation . . . . . . 55
4.2 Intrinsic flexibility window in FAU framework . . . . . . . . . . . . . 57
4.3 Steric limits on water occupancy in β-cages . . . . . . . . . . . . . . . 60
4.4 Steric limits on methanol occupancy in β-cages . . . . . . . . . . . . 62
4.5 Access to the β-cage through the six-ring pore . . . . . . . . . . . . . 66
4.6 Chapter summary . . . . . . . . . . . . . . . . . . . . . . . . . . . . . 68
ii

5 Synthesis and framework flexibility of zeolite EMC-2 70
5.1 Synthesis of zeolite EMC-2 . . . . . . . . . . . . . . . . . . . . . . . . 70
5.2 Flexibility window in EMT zeolite framework . . . . . . . . . . . . . 73
5.2.1 Preparation of EMT structure for geometric simulation . . . . 74
5.2.2 The flexibility window of EMT framework . . . . . . . . . . . 76
5.3 Chapter summary . . . . . . . . . . . . . . . . . . . . . . . . . . . . . 79
6 Framework flexibility of sodalite under pressure 80
6.1 High-pressure experiment . . . . . . . . . . . . . . . . . . . . . . . . . 80
6.2 Geometric simulation on sodalite . . . . . . . . . . . . . . . . . . . . 86
6.2.1 Preparation of sodalite structure for geometric simulation . . . 86
6.2.2 The flexibility window of sodalite . . . . . . . . . . . . . . . . 88
6.3 Chapter summary . . . . . . . . . . . . . . . . . . . . . . . . . . . . . 97
7 Conclusion & Future works 99
Appendices 102
A The Bragg’s equation 103
B Additional information for Chapter 3, Section 3.2 105
iii

C Synthesis of LTA, SOD, and LTN framework zeolites with no
organic structure directing agent 106
C.1 X-ray powder diffraction . . . . . . . . . . . . . . . . . . . . . . . . . 106
C.2 Hydrothermal synthesis of zeolite A with no OSDAs . . . . . . . . . . 107
C.2.1 29Si SS MAS NMR . . . . . . . . . . . . . . . . . . . . . . . . 107
C.2.2 29Si CP MAS NMR . . . . . . . . . . . . . . . . . . . . . . . . 108
C.2.3 27Al SS MAS NMR . . . . . . . . . . . . . . . . . . . . . . . . 109
C.2.4 23Na SS MAS NMR . . . . . . . . . . . . . . . . . . . . . . . . 110
C.3 Microwave & hydrothermal synthesis of Linde Type N zeolite with no
OSDAs . . . . . . . . . . . . . . . . . . . . . . . . . . . . . . . . . . . 111
C.3.1 SS MAS NMR . . . . . . . . . . . . . . . . . . . . . . . . . . . 111
Bibliography 111
iv

List of Figures
1.1 Framework topologies and building units. Framework topology: a)
SOD, b) LTA, c) LTN, d) FAU, and e) EMT. Building unit: (1) Double
4-ring (D4R), (2) Double 6-ring (D6R), (3) can-cage, (4) β-cage, and
(5) distorted α-cage. Blue transparent spheres are included to show
where β-cages are located in the frameworks. . . . . . . . . . . . . . . 8
1.2 Periodic building units of LTN framework. (a) BU1 consists of a β-cage
and four can-cages, and (b) BU2 has a distorted α-cavity connected to
four can-cages and four D6R units. The blue sphere in BU1 shows the
position of the β-cage. . . . . . . . . . . . . . . . . . . . . . . . . . . 9
1.3 Supercages present in FAU and EMT frameworks form by 12-ring win-
dows of the faujasite layer. (a) 124 supercage of FAU framework, (b)
123 supercage of EMT framework, and (c) 125 supercage of EMT frame-
work. The superscript represents the number of 12-ring which forms
the supercage. For example, 124 supercage has four 12-rings as building
unit. . . . . . . . . . . . . . . . . . . . . . . . . . . . . . . . . . . . . 10
v

2.1 Lattice planes of a cubic unit cell contains a single β-cage with Miller
indices (a) 110, (b) 101, and (c) 011. Lattice planes are shown in grey,
with blue and red spheres represent the Si and O atoms respectively. 22
2.2 Graphical representation of Bragg’s Law . . . . . . . . . . . . . . . . 23
2.3 SS MAS NMR spectrum of an as-synthesised zeolite A sample using
tetramethylammonium hydroxide as organic structural directing agent.
The spectrum contains five typical Si local environments: Si4(Al),
Si(3Al), Si2(Al), Si(1Al), and Si(0Al). . . . . . . . . . . . . . . . . . . 27
2.4 Chemical shifts of the five local Si environments. . . . . . . . . . . . . 27
2.5 Schematic illustration of the geometric simulation process in a simpli-
fied 2D version. (a) The input structure consists of a list of atomic
positions; (b) Atoms are linked and vertex-sharing clusters are formed;
(c) Templates are constructed to resemble the shape of vertex-sharing
clusters, mismatches are identified; (d) Mismatches are minimised by
rotating the templates, with some residual mismatches; (e) The resid-
ual mismatches are further minimized by relaxing the atomic position. 31
3.1 Powder pattern of as-synthesised zeolites - microwave synthesised LTA40M,
and hydrothermal synthesised LTA40D24 and LTA40D1, with corre-
sponding Miller indices. The SOD 110 peak is marked with an asterisk. 35
3.2 SEM images of (a), (b) LTA40D24 synthesised at 40 ◦C hydrothermally,
and (c), (d) LTA40M synthesised at 40 ◦C using a microwave method. 36
vi

3.3 Synthesis conditions, starting materials, batch compositions and prepa-
ration methods for sodalite. . . . . . . . . . . . . . . . . . . . . . . . 38
3.4 Powder patterns of as-synthesised zeolite under (a) condition 1, (b)
condition 2, (c) condition 3, (d) using recipe 3 in four conditions. . . 38
3.5 SEM images of zeolite samples synthesised under condition 1 using (a)
recipe 1 (b) recipe 3 . . . . . . . . . . . . . . . . . . . . . . . . . . . 43
3.6 Powder pattern of as-synthesised zeolite samples at different tempera-
ture and reaction time. . . . . . . . . . . . . . . . . . . . . . . . . . . 44
3.7 SEM images of as-synthesised zeolite samples, (a) 50 ◦C, (b) 70 ◦C,
(c)80 ◦C for 24 hours, and (d) 95 ◦C for 48 hours . . . . . . . . . . . . 47
3.8 Powder patterns of as-synthesised zeolite samples without OSDAs us-
ing microwave methods. (a) Linde Type N zeolite forms above 60 ◦C,
(b) A high resolution powder pattern of as-synthesised zeolite sample
at 60 ◦C. . . . . . . . . . . . . . . . . . . . . . . . . . . . . . . . . . . 49
3.9 Powder pattern of as-synthesised zeolite samples. Sodalite forms at
and above 100 ◦C . . . . . . . . . . . . . . . . . . . . . . . . . . . . . 50
3.10 SEM images of as-synthesised zeolite samples, (a) at 60 ◦C (b) at 90 ◦C
(c) at 100 ◦C . . . . . . . . . . . . . . . . . . . . . . . . . . . . . . . . 50
3.11 Powder pattern of as-synthesised Linde Type N zeolite with no OSDA
using hydrothermal method. . . . . . . . . . . . . . . . . . . . . . . . 52
3.12 SEM images of hydrothermal synthesised Linde Type N zeolite samples
at 100 ◦C, 1 hour. . . . . . . . . . . . . . . . . . . . . . . . . . . . . . 53
vii

4.1 Models used in geometric simulation. (a) water molecule (b) methanol
molecule . . . . . . . . . . . . . . . . . . . . . . . . . . . . . . . . . . 57
4.2 Flexibility windows of the FAU framework with a varying water content
in the β-cages: 0, 1, 4 or 8 water spheres per cage. The upper (squares)
and lower (diamonds) limits of the flexibility window for each case are
shown and the extent of the window is shown with a dashed bar. For
the 0 water case, circles show experimental data points during compres-
sion in silicone oil; for the 4 water molecules case, circles show exper-
imental data points during compression in methanol–ethanol–water.
The upper and lower pressure limits of the experimental data are in-
dicated by labelled arrows. . . . . . . . . . . . . . . . . . . . . . . . . 58
4.3 (a) A β-cage of faujasite from the crystal structure as refined by Col-
ligan et al. (a tetrahedral framework view), showing the locations of
the eight water sites (spheres), (b) A β-cage after geometric relaxation,
showing the tetrahedra of the framework and the relaxed locations of
eight water spheres, (c) As in (b), with the atoms of the framework
shown in space-filling representation; one six-ring of the β-cage has
been removed to show the occupation of the interior. The view is in
all cases along a crystallographic [1,-1,1] direction. . . . . . . . . . . . 62
viii

4.4 Flexibility windows of the FAU framework with varying methanol and
water content in the β-cages. 1M* = 1 methanol in one cage, other
cages empty; 1M = 1 methanol in each cage; 1M/4W = 1 methanol in
one cage, four water molecules in all other cages; 1M2W* = 1 methanol
and 2 water molecules in one cage, other cages empty; 1M2W = 1
methanol and 2 water molecules in each cage. The upper (squares)
and lower (diamonds) limits of the flexibility window for each case are
shown and the extent of the window is shown with a bar. A finely
dotted line highlights the contraction of the upper edge of the window
in the latter two cases. . . . . . . . . . . . . . . . . . . . . . . . . . . 63
4.5 (a) β-cage of faujasite, showing the tetrahedra of the framework after
relaxation with cage contents of one methanol and two water molecules
(spheres). The methanol hydroxy group is the sphere nearest the centre
of the image. (b) As in (a), showing the oxygen atoms of the framework
in space filling representation. One side of the cage has been removed
to view the interior. Both figures are viewed along a crystallographic
[1,-1,1] direction. . . . . . . . . . . . . . . . . . . . . . . . . . . . . . 65
4.6 (a)Relationship between Si–O bond length lb, six-ring aperture edge
length lE, framework oxygen radius rO and the radius, rM , of the
largest molecule that can pass through an unstrained six-ring aper-
ture. (b) Distortions in tetrahedral bonding, D, and steric overlap, P,
when larger molecules pass through. . . . . . . . . . . . . . . . . . . . 67
ix

5.1 Powder pattern of as-synthesised and calcined zeolite EMC-2. . . . . 71
5.2 29Si MAS NMR of calcined zeolite EMC-2. . . . . . . . . . . . . . . . 72
5.3 SEM images of zeolite EMC-2: (a) as-synthesised, (b) close-up of the
as-synthesised sample, (c) calcined . . . . . . . . . . . . . . . . . . . 73
5.4 Extent of the flexibility window for the EMT framework during varia-
tion of the a and c parameters . . . . . . . . . . . . . . . . . . . . . . 76
5.5 EMT framework under ambient conditions showing the location of well-
resolved crown ether molecules in the t-wof cages . . . . . . . . . . . 78
5.6 (a) EMT framework at the limit of geometric compression of the a
parameter; (b) EMT framework at the limit of geometric compression
of the c parameter. . . . . . . . . . . . . . . . . . . . . . . . . . . . . 79
6.1 Powder patterns of as-synthesised Na-sodalite (Blue) and NaBr-sodalite
(Black). . . . . . . . . . . . . . . . . . . . . . . . . . . . . . . . . . . 81
6.2 GSAS refinement of the experimental Na-SOD neutron diffraction data
at pressure 0.05GPa. Four phases are fitted here - Na-SOD (pink),
lead (blue), alumina of the PE cell and gasket (black), and zirconia
surrounding the gasket (brown). Pink arrow indicates the Na-SOD
211 peak, the only peak which does not overlap with other phases. . . 82
x

6.3 Cell parameters vs pressure. a) Cell parameter, a, against pressure of
NaBr-SOD with methanol/ethanol mixture fitted to the Birch-Murnaghan
equation of state (EOS); b) Cell parameter, a, against pressure of Na-
SOD with methanol/ethanol mixture and fluorinert as pressure trans-
mitting media: green circles - with fluorinert, red triangles - with
methanol/ethanol mixture. Error bars are not significant compared
to the data presented. . . . . . . . . . . . . . . . . . . . . . . . . . . 84
6.4 Time-of-flight neutron diffraction data of: a) NaBr-SOD with methanol/ethanol
mixture as pressure transmitting medium, b) Na-SOD with methanol/ethanol
mixture, and c) Na-SOD with fluorinert, as pressure transmitting medium. 85
6.5 Different simulations with SOD frameworks. a) Empty framework with
only SiO4 tetrahedra, b) empty ordered Si/Al = 50/50 framework,
c) Na-SOD framework with Na as yellow spheres, and d) NaBr-SOD
framework with Br in brown, and Na ions in yellow. SiO4 tetrahedral
unit is shown in blue and AlO4 tetrahedra in cyan. . . . . . . . . . . 87
6.6 Flexibility window of SOD framework in the hypothetical siliceous form
(triangles) and the fully ordered Si/Al form (circles) with Al centered
tetrahedra geometry. . . . . . . . . . . . . . . . . . . . . . . . . . . . 88
6.7 Flexibility window of a fully ordered Si/Al SOD framework with sodium
ions (triangles) and sodium bromide (squares) with Al centered tetra-
hedra geometry. . . . . . . . . . . . . . . . . . . . . . . . . . . . . . . 89
6.8 RMS rotation of Si tetrahedral units in hypothetical siliceous SOD
framework . . . . . . . . . . . . . . . . . . . . . . . . . . . . . . . . . 90
xi

6.9 RMS rotation of Si and Al tetrahedral units in fully ordered Si/Al SOD
framework . . . . . . . . . . . . . . . . . . . . . . . . . . . . . . . . . 90
6.10 Flexibility window of bar-constrained fully ordered Si/Al SOD framework 92
6.11 Flexibility window of bar-constrained fully ordered Si/Al framework
with sodium ions (triangles), and with sodium bromide (squares) . . . 93
6.12 RMS rotation of bar-constrained, fully ordered Si/Al SOD framework
with 8 sodium atoms in beta-cage . . . . . . . . . . . . . . . . . . . . 94
6.13 RMS rotation of bar-constrained, fully ordered Si/Al SOD framework
with sodium and bromide ions . . . . . . . . . . . . . . . . . . . . . . 94
6.14 Total clash2 of empty (circle), sodium (triangle), and sodium bromide
(square), bar-constrained, fully ordered Si/Al SOD framework. . . . . 95
A.1 Graphical representation of Bragg’s Law . . . . . . . . . . . . . . . . 103
C.1 Powder pattern of as-synthesised Linde Type N zeolite samples using
fumed silica. (a) 60 ◦C (b) 90 ◦C . . . . . . . . . . . . . . . . . . . . . 106
C.2 As-synthesised zeolite samples with no OSDAs at (a) 40 ◦C (b) 50 ◦C
(c) 60 ◦C (d) 70 ◦C (e) 80 ◦C for 1 hour, (f) 95 ◦C for 2 hours . . . . . 107
C.3 As-synthesised zeolite samples with no OSDAs at (a) 40 ◦C (b) 50 ◦C
(c) 60 ◦C (d) 70 ◦C (e) 80 ◦C for 1 hour, (f) 95 ◦C for 2 hours, red -
signal of 29Si MAS NMR, blue - signal of 29Si CP MAS NMR, black -
difference between two signals . . . . . . . . . . . . . . . . . . . . . . 108
C.4 As-synthesised zeolite samples with no OSDAs at (a) 40 ◦C (b) 50 ◦C
(c) 60 ◦C (d) 70 ◦C (e) 80 ◦C for 1 hour, (f) 95 ◦C for 2 hours . . . . . 109
xii

C.5 As-synthesised zeolite samples with no OSDAs at (a) 40 ◦C, (b) 50 ◦C,
(c) 60 ◦C, (d) 70 ◦C, (e) 80 ◦C for 1 hour, and (f) 95 ◦C for 2 hours . . 110
C.6 SS MAS NMR spectra of as-synthesised zeolite sample with no OS-
DAs. Column left: Microwave synthesis. Column right: Hydrothermal
synthesis. . . . . . . . . . . . . . . . . . . . . . . . . . . . . . . . . . 111
xiii

Chapter 1
Introduction
1.1 What is a zeolite
The term “Zeolite” was coined in 1756 by the Swedish mineralogist, Axel Fredrik
Cronstedt [1]. When he heated a material (later known as Stilbite) with a blowpipe
frame, it produced a large amount of steam. He therefore called this mineral “Zeolite”
which means “boiling stone”. Since then, more naturally occurring zeolites have been
discovered and put to different uses. However, since naturally occurring zeolites
are rarely phase-pure and are contaminated by other minerals, scientists have been
spending decades trying to synthesise and tailor them for specific applications [2].
Zeolites are crystalline aluminosilicates with meso- or micropores inside their
framework structures [3–5]. They have highly crystalline three dimensional frame-
works formed by the corner-sharing of the oxygen atoms of [SiO4]4− and [AlO4]
5−
tetrahedra, which are the primary building units of most zeolites [5–8]. The differ-
ence in valence between Si and Al atoms is charge balanced by alkali metal cations
such as sodium. The general formula of a zeolite is shown in 1.1 on the following page,
where n is the valency of the metal ion M which balance the negative charges in the
1

aluminosilicate framework. The numbers x and y depend on the framework being
described, for example, the sodium form of zeolite A has x = y = 12 in 1 : 1 ratio.
The combination of intricate cages, pores and channels of various sizes produces open
frameworks with complex structures. Although the arrangement of tetrahedra can
produce numerous possible frameworks (there are millions of hypothetical frameworks
in theory), only a very small number of these possible frameworks exist [9]. At the
time of writing this thesis, 229 zeolites can be synthesised in the laboratory, out of
which about 40 are naturally occurring [5].
Mx/n
((AlO2)x (SiO2)y
)·mH2O (1.1)
Zeolite formation involves several steps from a solution, to a gel, and finally, the
crystalline product [10]. In a typical sol-gel synthesis, a silica source and an alumina
source are mixed with the source of cation and sodium hydroxide. The hydroxide
provides the necessary alkaline condition, at pH > 10, for the hydrolysis of start-
ing materials. At the point when these materials are mixed together, a primary
amorphous phase is formed. It can either be a visible gel or a transparent colloidal
solution. This primary amorphous phase is in a non-equilibrium state, and contains
unreacted materials as well as amorphous aluminosilicates. When such a mixture is
treated to a certain temperature, the reaction reaches equilibrium. Reactants contin-
uously go through hydrolysis and condensation and are converted into a secondary
amorphous phase. A characteristic distribution of silicate and aluminosilicate anions
is established and maintained. Although the secondary amorphous phase does not
contain any periodic lattice which is essential to the formation of a crystalline zeo-
2

lite phase, there is an increase of structural ordering by continuous dissolution and
reconstruction. The oxygen linkage of the framework is also formed at this point.
Given sufficient time, nucleation occurs, and once the nuclei grow to a critical size,
crystal growth can begin by propagation of periodical building units. Over time, a
crystalline zeolite structure is formed.
Zeolite synthesis requires precise control of various parameters [11, 12]. The prepa-
ration can be sometimes very delicate. The choice of starting materials can affect the
as-synthesised zeolite phase due to the solubility and the specific surface area of the
particles [13, 14]. The use of different cations and anions, the so-called ‘mineralizer’,
also plays an important role. Majority of zeolite syntheses use sodium hydroxide
to create the necessary alkaline condition, but solutions containing fluoride ions or
phosphate ions can also be used [15, 16], and for some zeolite frameworks, the use
of cations other than sodium can achieve a better result [17, 18]. Organic structure
directing agents can be added to the reaction to achieve a pure zeolite phase, but the
removal of the organic template after synthesis is a time consuming process, and may
release other toxic chemicals. For example, the removal of tetramethylammonium
ions for zeolite A synthesis would produce toxic ammonia gas. Aging, seeding, stir-
ring or static conditions during gel preparations are known to affect zeolite synthesis
[19, 20]. The reaction temperature and synthesis time are considered to be the most
important factors. For zeolite frameworks with a higher density, a higher reaction
temperature and longer synthesis time is usually required [21]. Different crystallisa-
tion methods may also affect the final zeolite phase. The hydrothermal method is
common for zeolite synthesis, and it has been used for several decades. However, the
3

microwave method has become more and more popular in the last 20 years.
One of the most significant improvements of synthesising zeolite materials us-
ing microwave energy is the reduction of reaction times by up to over an order of
magnitude [22–24]. From an industrial and commercial points of view, less energy
is involved in the production, thus reduces cost and the amount of fuel being used.
Continuous production would be possible instead of batch synthesis, and improves
the efficiency of mass production. More uniform crystals with less defects can also
be synthesized using microwave energy which increase the performance of zeolite as
catalyst. Although many experiments have been done to show that using microwave
energy can result in dramatic decrease in reaction time, the mechanism and engi-
neering for the enhanced rate of syntheses are still unknown. Several hypotheses
suggested that microwave energy may affect the dissolution of precursors, and in-
crease the heating rate of the synthesis mixture with a more uniform heating [25].
It is shown in the study by Conner et al. [26] and Panzarella et al. [27] that mi-
crowave irradiation causes rapid nucleation in the precursor gel, therefore reduces
the induction period during zeolite formation. The microwave energy distribution is
suggested to affect the nucleation rate and depends on various factors such as ves-
sel size, precursor volume, and irradiation method of microwave energy. Vessel with
wider diameter cause uneven distribution of electric field with local hot spots being
observed which enhanced dissolution, and bigger crystals were synthesised. Increase
in precursor volume led to slower synthesis. Microwave reactor with multi-mode ir-
radiation reduced the induction time compared to mono-mode irradiation. However,
the enhance in rate of synthesis cannot be merely explain by one factor such as the
4

variation in microwave electric field, since different reactants, intermediate species,
and solid response differently to microwave [27]. The effect of silica precursor, reaction
temperature distribution, and other factors should also be considered [28, 29].
Zeolites are widely used in industry due to their porous framework structure,
diverse and highly selective catalytic and ion exchange properties [30–32]. They are
particularly valuable materials in the petroleum industry. For example, millions of
tonnes of zeolite Y is used in petroleum refinery catalytic cracking to increase the yield
of gasoline and diesel fuel from crude oil. The different shapes and sizes of cavities,
pores, and channels of zeolite frameworks only allow molecules of a certain size to
access their interior, and thus provide size and shape selectivity for catalytic reactions,
as well as industrial gas separations [33, 34]. The high internal surface area of zeolite
allows them to accommodate a large number of active sites including the Brøntsted
acid sites and Lewis acid sites [35, 36]. The Brøntsted acid sites are bridged hydroxyl
groups, SiO(H)Al, with protons directly bonded to framework oxygen ions, and act
as a proton donor. One of the applications of Brøntsted acidity is the methanol–
olefin conversion using zeolites with CHA framewrok typology, such as chabazite
[37, 38]. The Lewis acid sites are electron-pair acceptors, which are three-coordinated
aluminium ion in zeolite framework [39]. They can form bonds with lone pair electrons
of oxygen or nitrogen atoms of guest molecules. The high internal surface area of
zeolite also means that a large amount of substance can be adsorbed. Different
zeolites have affinities for different types of molecule. Zeolites with a very high Si:Al
ratio favour the absorption of non-polar molecules such as hydrocarbons which can
make catalytic cracking processes more efficient.
5

The cations associated with the hydrated zeolite framework can be exchanged
with other cations in the surrounding solution. The major applications of zeolites
as ion-exchangers are the removal of heavy metal ions or radioactive elements in
contaminated water [40]. Other common applications using the ion-exchange property
of zeolites include detergent builders in washing powder, and water softener [41, 42].
Zeolites are also good drying agents. They can be heated under vacuum to remove
water inside the framework and once exposed to ambient condition, absorb water and
return to their hydrated form. The potential applications of zeolites are unlimited.
Most recently, they are being investigated for drug delivery in medicine [43].
One of the main focuses in this study is the behavior of zeolite frameworks under
pressure. Since the framework oxygen bridges between tetrahedral units are not
rigid, majority of zeolite frameworks show some degree of flexibility [6]. The range of
densities over which the tetrahedral units in the framework can in principle be made
geometrically ideal is defined as the flexibility window. In theory, the arrangement
of tetrahedral units can produce numerous possible frameworks, but yet only 229
frameworks can be synthesised. There are several criteria to determine whether a
hypothetical zeolite can be selected as synthetic targets. It is suggested that the
flexibility window is one of the necessary structural features for such selection [6, 44].
It is also important to understand the structural change of zeolite framework under
pressure, since zeolite applications are not limited to ambient conditions. Zeolite
under pressure has already shown several interesting properties such as change in ionic
conductivity, pressure-induced over-hydration, and volume expansion [45]. However,
zeolite frameworks eventually become amorphous if excess pressure is applied [46].
6

Such amorphization reduces the size and volume of the pores and channels of the
zeolite framework, thus affects the catalytic, ion exchange, and seperation properties
of zeolite in industrial applications.
1.2 β-cage as a building unit
Among all the different types of zeolite frameworks, I focused my research on those
which are made of sodalite cages, also known as β-cages. They are built by two sec-
ondary building units (SBUs) - every cage is formed by connecting eight 6-membered
rings (6T atoms) and six 4-membrane rings (4T atoms), assembled as a truncated
octahedron. The zeolites in this study are zeolite A, sodalite, Linde Type N, zeolite
Y, and EMC-2, which have the LTA, SOD, LTN, FAU, and EMT framework topol-
ogy respectively. The three letter code is assigned by the Structure Commission of
the International Zeolite Association. It refers to the way in which the tetrahedral
units are interconnected, irrespective to its composition, symmetry or physiochemical
properties. Each framework topology can include several framework materials, and
it is not limited to aluminosilicates. For example, the topology FAU, which is found
in natural occurring faujasite, includes the synthetic zeolite X and Y, as well as the
silicoaluminophosphate material SAPO-37.
Figure 1.1 on the next page shows the zeolite framework topologies being studied,
and their respective building units. Table 1.1 on the following page gives more infor-
mation about each of the topologies including the corresponding zeolite, the unit cell
geometry, the building unit(s) involved, and the density. The frameworks in figure
1.1 can be divided into three categories: (1) SOD and LTA frameworks (figure 1.1(a)
7

Figure 1.1: Framework topologies and building units. Framework topology: a) SOD, b) LTA, c)LTN, d) FAU, and e) EMT. Building unit: (1) Double 4-ring (D4R), (2) Double 6-ring (D6R), (3)can-cage, (4) β-cage, and (5) distorted α-cage. Blue transparent spheres are included to show whereβ-cages are located in the frameworks.
Table 1.1: Frameworks and the corresponding zeolites in this study.
Frameworktopology
ZeoliteUnitcell
Buildingunit(s)
Density(T/nm3)1
SOD Sodalite Cubic (4) 16.7LTA Zeolite A Cubic (1), (4) 14.2LTN Linde Type N Cubic (2), (3), (4), (5) 17.0FAU Zeolite Y Cubic (2), (4) 13.3EMT EMC-2 Hexagonal (2), (4) 13.3
1 Number of tetrahedral units per nm3
and (b)), (2) LTN framework (figure 1.1(c)), (3) FAU and EMT framework (figure
1.1(d) and (e)).
SOD and LTA frameworks both have a cubic unit cell. The SOD framework is the
least complex among the five being shown in figure 1.1. It is formed by stacking the
β-cage on top of each other through the 4-rings with no space in between. It has a
0-dimensional channel system, meaning that the framework is relatively dense. The
8

LTA framework is also formed by stacking the β-cages, however cages are connected
by an extra building unit, the D4R unit. This creates the α-cavity, also known as
LTA-cage, with an 8-ring opening, which is similar to the one shown in figure 1.1(5),
but not distorted. A 3-dimensional channel system is formed when the α-cavities
are connected to each other. This makes the LTA framework useful in term of ion-
exchange properties since ions can easily access the relatively big α-cages from all
three directions [47].
(a) (b)
Figure 1.2: Periodic building units of LTN framework. (a) BU1 consists of a β-cage and fourcan-cages, and (b) BU2 has a distorted α-cavity connected to four can-cages and four D6R units.The blue sphere in BU1 shows the position of the β-cage.
The LTN framework, compared to the SOD and LTA frameworks, has a more
complex structure. Its unit cell is about four times bigger than the SOD framework
and three times to the LTA framework. It is also the densest framework among the five
in this study. Two periodic building units (PerBUs) are present in the structure, as
shown in figure 1.2. BU1 is formed by connecting a β-cage to four can-cages through
the 6-ring, as shown in figure 1.2(a). The second building unit, BU2, consists of
a distorted α-cavity connected to four can-cages and four D6R units. These two
9
building units are then arranged in a repeated pattern to form the complicated LTN
framework. Although the framework does not form any channel system, the zeolite
can be used as a desiccant for oxygen and nitrogen streams due to the fact that it
only absorbs water.
(a) (b) (c)
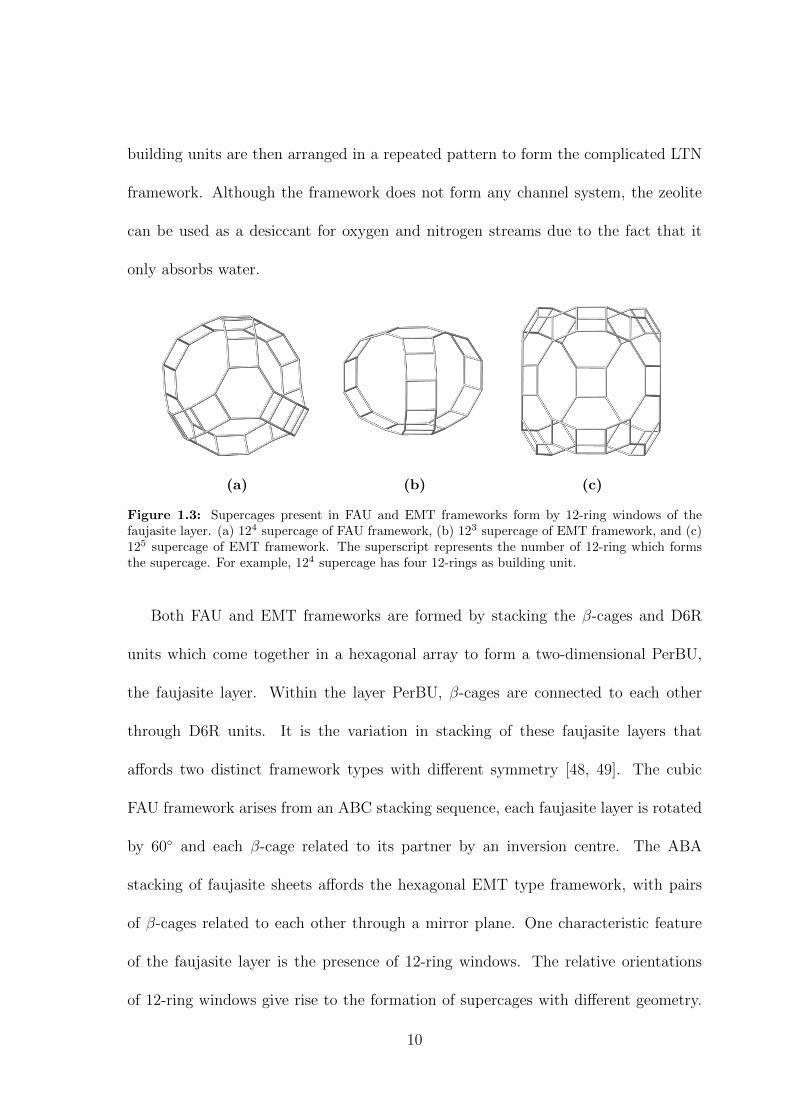
Figure 1.3: Supercages present in FAU and EMT frameworks form by 12-ring windows of thefaujasite layer. (a) 124 supercage of FAU framework, (b) 123 supercage of EMT framework, and (c)125 supercage of EMT framework. The superscript represents the number of 12-ring which formsthe supercage. For example, 124 supercage has four 12-rings as building unit.
Both FAU and EMT frameworks are formed by stacking the β-cages and D6R
units which come together in a hexagonal array to form a two-dimensional PerBU,
the faujasite layer. Within the layer PerBU, β-cages are connected to each other
through D6R units. It is the variation in stacking of these faujasite layers that
affords two distinct framework types with different symmetry [48, 49]. The cubic
FAU framework arises from an ABC stacking sequence, each faujasite layer is rotated
by 60◦ and each β-cage related to its partner by an inversion centre. The ABA
stacking of faujasite sheets affords the hexagonal EMT type framework, with pairs
of β-cages related to each other through a mirror plane. One characteristic feature
of the faujasite layer is the presence of 12-ring windows. The relative orientations
of 12-ring windows give rise to the formation of supercages with different geometry.
10

The cubic FAU framework contains four 124 supercages within its unit cell, referred
to as the t-fau cavity, whereas EMT contains two different supercages; one smaller
123 supercage termed the t-wof cavity, and one larger 125, known as the t-wou cavity
[48]. The geometry of the corresponding supercages is shown in figure 1.3.
1.3 Literature review
1.3.1 Sodalite
Sodalite is a naturally occuring zeolite which can also be synthesised in the laboratory,
either with no organic template or with inorganic anion template. The first reported
sodalite synthesis without using organic template was reported by Robert Milton [50]
in 1949 when he was working in the Linde’s research facilities aiming to synthesise
chabazite. It was regarded as a hydroxy form of sodalite since only sodium hydroxide
was used in the synthesis. The absence of the 3D channel system in sodalite means
that it has no known catalytic properties. It is useful in the ceramic industry as a
glaze, or is used as a silica/alumina source [51]. In the early 90s, Stein et al. [52, 53]
reported that sodalite can be synthesised using different halogen anions. Although the
sodium bromide (NaBr) form of sodalite can be easily synthesised, the huge bromide
anions occupy majority of the space inside the β-cages making it not suitable for any
gas adsorption or ion exchange application.
Some more applications were found during the 90s which includes the patent
registered by Tadafumi Koyama [54]. It involves the use of a sodium intermediate to
immobilize waste chloride salt containing radioactive nuclei. The sodium intermediate
will then be converted to sodalite and the radioactive nuclei trapped within the β-
11

cage.
Millimeter-sized sodalite single crystal has been synthesised by Shiraki et al. [55]
in 2001. In the 20th century, scientists are still trying to make sodalite using different
precursors and find new applications [56]. A hydrothermal synthesis and a microwave
synthesis are given below as examples.
Fan et al. [57] synthesised sodalite nanocrystals hydrothermally without organic
structure directing agent (OSDA). By carefully controlling the ratio of SiO2: Al2O3:
Na2O: H2O, as well as the reaction time and temperature, Fan et al. successfully
synthesised hydroxy-sodalite crystals of 20 - 40 nm. During the synthesis of hydroxy-
sodalite, they reported from the observed powder pattern that a zeolite A phase is
formed before the sodalite phase, which indicated a transformation of zeolite A into
sodalite. They also reported that the final product was affected by the order of mixing
of the Al and Si source during gel preparation.
In another study, Julbe et al. [58] used a microwave method to synthesise sodalite
on an alpha Al2O3 membrane without SDAs. They used gel composition 5SiO2:
1Al2O3: 38Na2O: 1000H2O. By changing the reaction temperature and time, sodalite
with different size and morphology was successfully synthesised. They concluded that
by carefully controlling the synthesis parameters, microwave synthesis can be used to
synthesis sodalite with desired size.
1.3.2 Zeolite A
There is no naturally occurring zeolite A. Like sodalite, zeolite A was also first syn-
thesized in 1949 by Robert Milton [50]. No template reagent was used and a mixture
12

with zeolite X impurity was obtained. 10 years later, in 1959, the synthesis of zeolite
A was patented [59]. In 1961, Barrer et al. [60] and Kerr et al. [61, 62] proposed
the use of quaternary ammonium cations (tetramethylammonium cations) to synthe-
sis zeolite A. Kerr et al. in addition syntheised the silica-rich version of zeolite A,
which was named ZK-4. Since then, studies on zeolite A are mainly about the effect
of synthesis conditions towards the final zeolite phase, and some examples are given
below.
Bayati et al. [63] synthesised zeolite A hydrothermally using different Na2O/Al2O3
and SiO2/Al2O3 ratios and different reaction time and temperatures. They char-
acterised the as-synthesised zeolite A using X-ray powder diffraction (XRPD) and
scanning electron microscopy (SEM). Their results show that by increasing reaction
temperature, both particle size and crystallinity of zeolite A increase dramatically.
They proposed the optimum temperature range to synthesise cubic zeolite A crystals
with particle size of 2µm is between 60 ◦C and 90 ◦C, with a maximum reaction time of
24 hours, and a gel composition of 10SiO2:1Al2O3:50Na2O:1000H2O. They observed
that sodalite was formed instead of zeolite A when a gel with low SiO2/Al2O3 ra-
tio was used. Therefore, they concluded that SiO2/Al2O3 ratio is also an important
factor to control the phase behaviour and morphology of zeolite A.
Proverbio et al. [64] synthesised zeolite A using a household type microwave
without OSDAs. They fixed the molar ratio of the gel to 2Na2O: 1Al2O3: 1.9SiO2:
65H2O, and used a multiple-step microwave synthesis method. They found that not
only the power of the microwave, but also gel quantity affected the synthesise of
zeolite A, and demonstrated that they can synthesis zeolite A in a total processing
13

time of 1 hour, thus concluding that microwave methodology was faster compared to
hydrothermal synthesis. However, most of their zeolite A phase was contaminated
by hydroxy-sodalite. They further commented on the microwave method that during
the short heating time, a lack of nuclei formation occurred in the gel, therefore, a
low crystal yield and formation of impurities was observed. Long aging time and
adequate stirring are required for microwave methods, so the increase in speed of
zeolite crystallization using microwave methods may not be that advantageous.
1.3.3 Linde Type N
Linde Type N is another synthetic zeolite. There are not many reports about this
zeolite in the literature. The first Linde Type N hydrothermal synthesis was reported
by Acara et al. [65] in a patent in 1968 using tetramethyl ammonium cations as an
OSDA. They mentioned in this patent several conditions which favored the formation
of Linde Type N. It tends to form with no aging of the resulting gel, under dynamic
conditions (stirring/shaking) during an agitation step, and at optimum temperature
for crystallisation between 90 ◦C and 100 ◦C. Static conditions produce zeolite A.
Since activated Linde Type N does not adsorb oxygen or nitrogen but only water, it
is suggested that the zeolite can act as a desiccant for oxygen and nitrogen streams.
In 1971, Duecker et al. [66] in a patent mentioned an OSDA free synthesis of a zeolite
named “Z–21”, which has the same framework structure as Linde Type N. Zeolite
Z–21 is a large pore zeolite with a pore diameter of about 17 A, and it is suggested
it can function as a carrier for a wide variety of chemical compounds. It was not
until 1982 that the crystal structure of Linde Type N was solved by Falth et al. [67].
14

Recently I described a new microwave method to synthesise Linde Type N zeolite
[68].
1.3.4 Zeolite Y
Zeolite Y, and its counterpart, zeolite X, are both synthetic forms of the naturally
occurring faujasite. Zeolite X was first synthesised as an impurity by Robert Milton
when he attempted to synthesise zeolite A in 1949. The pure form was isolated a year
after, in 1950. The main difference between zeolite Y and zeolite X is the Si/Al ratio;
it is above 3 for zeolite Y, and between 2 and 3 for zeolite X [69, 70]. Although zeolite
X has higher Al content and thus more exchangeable cationic sites than zeolite Y, it
is mainly used for CO2 adsorption and gas separation [71]. The stability of zeolite
Y is due to its relatively high Si content and the appropriate pore diameter makes it
extremely useful in petroleum industry for catalytic cracking - breaking the long chain
carbons in crude oil to smaller chains used in gasoline, diesel, etc. [72]. Zeolite Y can
also be exchanged with various rare-earth metals after dealumination to increase the
catalytic properties [73–75].
The earliest publications regarding zeolite Y structure were in the 1970s. Gallezot
et al. [76, 77] reported three partially decationised, and two protonated, cerium
exchanged zeolite Y structures using XRPD in 1971. In 1974, two more zeolite Y
structures were reported by Gallezot et al., the dealuminated form and the CO2
exchanged form [78, 79]. In the following decades, the structure of zeolite Y has been
thoroughly studied. One of the more remarkable structural characterizations was
done and published by Su et al. in 2012 [80]. They synthesised single sodium zeolite
15

Y crystals, and saturated the framework with sodium ions by stirring with a sodium
chloride solution. The crystals were dehydrated and characterised by X-ray single
crystal diffraction. Su et al. were able to identify the framework silicon, aluminium
and oxygen sites, as well as the five other extra-framework sites partially occupied by
sodium ions.
Siliceous zeolite Y under pressure was studied by Colligan et al. in 2004 [81].
They collected high pressure data using two different pressure transmitting media
– methanol/ethanol/water mixture (penetrating pressure transmitting medium) and
silicon oil (non penetrating pressure transmitting medium). Rietveld refinement of
synchrotron powder patterns was performed using the siliceous zeolite Y data with
methanol/ethanol/water mixture from ambient pressure to 7.9 GPa. Although the
zeolite had no extra-framework content, pore filling was observed as a function of
pressure up to 4 GPa. Above 4 GPa, the framework became distorted with more
extra-framework sites being refined. Although Colligan et al. was able to refine the
atom coordinates of framework sites, the shape and size of molecules which entered
the zeolite and occupied the extra framework sites were not identified. The pore
filling was not observed when silicone oil was used as pressure transmitting medium.
1.3.5 EMC-2
EMC-2 is the only zeolite with EMT framework topology, which is a hexagonal poly-
morph of FAU framework, and can only be synthesised in the laboratory. It was first
observed in 1970s as an intergrowth phase with FAU framework. The pure form of
this zeolite was synthesised in 1990 by Delprato et al. [82] using the OSDA 18-crown-
16

6 ether. Since then, more successful syntheses using crown ether were reported in the
literature [83–86]. In 2012, Ng et al. [87] synthesised EMC-2 nano-crystals using an
organic-template-free system at low temperature. In 2015, Mou et al. [88] reported
a seed-directing method from an organic-template-free system to synthesise EMC-2
crystal with size of several µm.
The first structural study of EMC-2 was done by Baerlocher et al. in 1994 [48].
In this study, X-ray powder patterns were collected on both partially dehydrated and
calcined EMC-2 samples. Structural refinement was performed on the two sets of
data to compare the positions of framework atoms. The Rietveld refinement result
showed there was no crown ether molecule inside the β-cage, but there was evidence
that the 18-crown-6 occupied the larger cages of the framework.
1.4 The flexibility window in zeolites
According to Sartbaeva et al. [6], the flexibility window is defined as the range of
densities over which the tetrahedral units in the framework can in principle be made
geometrically ideal. In their 2006 publication, a full study of the flexibility window of
faujasite using geometric simulation was given as an example. A set of cubic zeolite
frameworks was then modelled as the pure silica form, and they showed that all these
frameworks posses a flexibility window. Moreover, the majority of zeolite frameworks
under ambient conditions would prefer to be maximumly extended, which sat close to
the low density end of the flexibility window. This can be explained by the Coulomb
repulsion between co-dimeric oxygen atoms - the most extended form minimizes such
repulsion and avoids steric clashes.
17

Another study reported by Sartbaeva et al. [7] applied the theory of flexibility
windows to explain the pressure-induced phase transition of analcime. Such transi-
tions happened under pressure at around 1 GPa from a high-symmetry cubic form
to a low-symmetry triclinic form, without going through any intermediate-symmetry
form. Geometric simulation was done using a pure-silica cubic ANA framework to
compare with the experimental data. It was found that the experimental cell param-
eters were within the simulated flexibility window, and the ambient framework lay
slightly inside the low-density edge of the window. However, at the high-density edge,
the framework was no longer ideal with even a small change of the cell parameter.
Two more distortions were then introduced to the ANA framework - the orthorhombic
and trigonal distortion. These intermediate-symmetry forms showed limited flexibil-
ity, and there was no space at the edge of the window for the cell to compress. This
would explain the fact that no intermediate forms were observed between the cubic
and triclinic phase transition. At the higher-denisty end, the cubic framework at-
tempted to remain within its flexibility window and a triclinic distortion was the only
option. Similar behaviour is seen in leucite, pollucite and wairakite [89, 90].
Geometric simulation can also be used to study the response of framework struc-
ture to different types of pressure media. In another study reported by Sartbaeva et al.
[44], a high silica zeolite, Silicalite-1, was being studied. Silicalite-1 has MFI frame-
work topology and exists in a monoclinic form under ambient condition, but became
orthorhombic, then metrically tetragonal under pressure. High pressure structural
experiments were done on synthetic silicalite-1 using two different pressure mediums.
Silcone oil was used as a non-penetrating pressure transmitting media while carbon
18

dioxide and argon were used as penetrating pressure media. Geometric simulation
was then performed to see if the experimental results can be explained using the flexi-
bility window theory. It was found that with a non-penetrating pressure transmitting
medium, the structure was relaxable and remained in the flexibility window through
the monoclinic to orthorhombic phase transition, as well as the pressure induced
amorphisation. Further compression would lead to the structure being forced out of
the flexibility window. However, with a penetrating pressure medium, the framework
remains crystalline through a wide pressure range, and eventually cannot stay within
the flexibility window as it is stressed.
19

Chapter 2
Characterization techniques
2.1 X ray powder diffraction
Zeolites are polycrystalline framework materials. For such materials usually synthe-
sised in a powder form, X-ray powder diffraction (XRPD) is a powerful technique to
identify the as-synthesised zeolite phase. The powder pattern of an as-synthesised
zeolite once obtained can be compared to the simulated models from the “Database
of Zeolite Structures” to confirm its identity, if the desired zeolite phase is known
from the synthesis. For high resolution powder patterns, Rietveld refinement can be
done to get more information such as the position of extra-framework contents, and
the location of template molecules. However, XRPD only gives an average structure
for the sample being characterized; the presence of defects or the ordering of Si and
Al tetrahedra cannot be identified using XRPD.
Diffraction occurs when X-rays are scattered by a periodic array with long-range
order. Crystals are built up from regularly repeating structural building units, which
can be atoms, molecules or groups of atoms and molecules. To simplify a crystal
structure, the locations of identical repeating environments are specified by lattice
20

points. These lattice points are joined together in three dimensions to form a “unit
cell”, which is the the smallest volume portion of the highest symmetry in a crystal.
In 3-dimensions, the unit cell in a crystal array has three sides and three angles.
An axial system is used to name the three sides, denoted a, b, and c, which are
the unit cell parameters of the cell; the three angles are denoted with symbols α
(between side b and c), β (between side a and c), and γ (between side a and b).
When atoms/molecules arrange themselves in periodic and specific configurations,
they can be described using a set of symmetry operation known as crystallographic
point groups. The combination of these 32 crystallographic point groups creates 219
distinct types of space groups in three dimensions, and based on the restrictions placed
on the unit cell parameters and the angles of the lattice by these space groups, 7 crystal
systems are formed which includes triclinic, monoclinic, orthorhombic, rhombohedral,
tetragonal, hexagonal, and cubic. The number of lattice points and their positions in
the unit cell dictate the lattice type, which can be Primitive (P), Body-centred (I),
Face-centred (F), or Base-centred (C). These lattice types, combined with the seven
crystal systems give 14 unique “Bravais lattices” which can be used to describe all
crystal structures [91].
The axial system, which is used to name the three sides of a unit cell, is called
the Weiss index in the order of a, b, and c. Lattice planes are joined by linking
different lattice points, and they intersect with the three sides of the unit cell. Each
Weiss index refers to one plane, and therefore, parallel planes have indices which are
multiples of each other. Miller indices are the reciprocals of the Weiss indices with
the fractions removed. Each Miller index (h, k, l) corresponds to a family of parallel
21

(a) (b) (c)
Figure 2.1: Lattice planes of a cubic unit cell contains a single β-cage with Miller indices (a) 110,(b) 101, and (c) 011. Lattice planes are shown in grey, with blue and red spheres represent the Siand O atoms respectively.
lattice planes with a characteristic inter-planar spacing (d). Some lattice planes of the
cubic crystal system are given as an example in figure 2.1, with their corresponding
Miller indices. The unit cell parameters and inter-planar spacings of cubic symmetry,
as well as the orthorhombic symmetry, are related by equation 2.1.
1
d2=h2
a2+k2
b2+l2
c2(2.1)
For cubic symmetry, such as the LTA framework, where a = b = c and α = β =
γ = 90 ◦, equation 2.1 is then simplified to equation 2.2.
1
d2=h2 + k2 + l2
a2(2.2)
Some planes are equivalent because of the symmetry of the unit cell. For example,
in the cubic unit cell of zeolite A, the (200), (020) and (002) lattice planes are the
same. A multiplicity factor also arises due to the fact that different lattice planes,
22

with different orientations, can have the same d-spacings, for example the (644) and
(820) lattice plane for zeolite A. The diffraction peaks are then overlapped, and this
makes it difficult to determine intensity of individual peaks.
nλ = 2dsinθ (2.3)
X-rays interact with electron clouds of atoms in a crystal. The principle of X-
ray powder diffraction can be explained by the Bragg’s Law [92], and is illustrated
by equation 2.3, where λ is the wavelength of the X-ray, θ is the angle between the
incident rays and the crystal lattice planes, d is the distance between lattice planes,
and n is an integer number of wavelengths (1, 2, 3 etc.).
Figure 2.2: Graphical representation of Bragg’s Law
A graphic representation is shown in figure 2.2. Imagine a single X-ray (blue line)
with a certain wavelength hits lattice planes separated by the interplanar distance d, it
is reflected by two of the atoms, A and B. The path difference between the reflected X-
ray AD and BC (red lines) is 2dsinθ. A peak is shown in the powder pattern when the
reflected X-rays, AD and BC, interact with each other by constructive interference.
23

For this to happen, the path different must equal to a whole number of wavelength,
nλ. Appendix A gives more detail about Bragg’s equation.
It can be seen from Bragg’s equation that the angle of reflection, θ, is inversely
proportional to the d-spacing. Peaks with bigger number of Miller indices have a
larger reflected angle, and thus a smaller d-spacing between lattice planes. For certain
Bravais lattice, destructive interference from some lattice planes occurs leading to
general absences - the peak has zero intensity although X-rays have been reflected.
Bragg’s law does not give any information about the intensities of the diffraction
peaks. The intensity relates to the electron density at any point in the unit cell. All
atoms have electron clouds different in size, and are able to scatter X-rays in different
ways. Each atom, therefore, has an atomic scattering factor which is proportional
to the number of electrons (atomic number) at low Bragg angles. As θ increases,
the interaction with X-rays decreases. Thus in a powder pattern, peaks with stronger
intensities are being observed at lower 2θ, and vice versa. Elements with high electron
density, so called “heavy atoms”, give a greater intensity, compared to those with low
electron density, e.g. hydrogen.
All powder patterns acquired in this thesis were obtained using either a Philips
X’pert X-ray diffractometer or a Philips PW1792 X-ray diffractometer, both operating
with Cu Kα radiation, unless otherwise stated.
24

2.2 Solid-state magic angle spinning nuclear
magnetic resonance
Solid-state magic angle spinning nuclear magnetic resonance (SS MAS NMR) is an
analytical tool to study the local environment (ordering) of crystalline solids. Most of
the zeolite frameworks contain isotopes which possess nuclear spin (I) and are NMR
active, for example, 29Si (I = 1/2), 27Al (I = 3/2), and 23Na (I = 5/2) are all com-
mon zeolite isotopes with natural abundance of 4.7%, 100% and 100% respectively
[93]. NMR works by applying a magnetic field to a nuclei with spin; since differ-
ent isotopes interact differently to the applied magnetic field, signals are obtained as
chemical shifts. Chemical shift is defined as the resonant frequency of a nucleus rela-
tive to a standard in a magnetic field, and depends on the structure of the compound
being studied. The applied magnetic field does not only interact with the nuclei,
but also with the surrounding electron shell. The interacting electrons produce an
induced field which is opposed to the applied magnetic field. Nuclei that have higher
electron density are therefore being shielded, and those have relatively low electron
density, are deshielded. For systems with abnormally high electron density, e.g. the
π system of benzene, such anisotropic interactions can lead to signal broadening and
thus reduce the resolution of the NMR spectra. In solutions, since molecules have
freedom of movement, anisotropic interactions can be averaged. However, as a solid,
the freedom of movement is extremely limited, and the anisotropic interactions have
to be overcome by magic angle spinning (MAS). This technique involves spinning
the solid sample at an magic angle, θm, at 54.74 ◦ with respect to the direction of
25

the magnetic field. Since the dipolar interactions and anisotropic chemical shielding
equations contain the term (3cos2θ−1), this becomes zero when θm is approximately
54.74 ◦ [94]. The anisotropic interaction is thus minimized, and the broadened signal
becomes narrower which increases the resolution of the NMR spectrum.
Almost all zeolites obey the “Loewenstein rule” [95]. It was suggested by Walter
Loewenstein in 1954 and the rule states that when two tetrahedra are linked by an
oxygen bridge, only one of the tetrahedral centers can be occupied by an Al atom. It
means that Al–O–Al linkages are forbidden since the Al ion is four-fold coordinated
to oxygen and carries a negative charge. This rule explains why the maximum sub-
stitution of Al to a zeolite framework cannot exceed 50%. In a zeolite framework, Si
tetrahedra can coordinate with a maximum of four Si or Al tetrahedra. This creates
five different Q4 Si local environments in the 29Si NMR spectrum with 0, 1, 2, 3, and
4 O-Al linkage, notated as Si(0Al), Si(1Al), Si(2Al), Si(3Al), Si(4Al) respectively.
Figure 2.3 on the following page gives an example of an NMR spectrum of an as-
synthesised zeolite A sample using tetramethylammonium hydroxide as an organic
structural directing agent, which consists of the five mentioned Si local environments.
The chemical shifts occupy a range from -84 ppm to -114 ppm, with small overlap
between individual environments [4, 96], and is summarized in figure 2.4 on the next
page. If Si tetrahedron shares only three corner oxygen atoms, a Q3 silanol species is
formed, with an OH group attached – Si(OSi)3OH. 29Si cross polarization (CP) MAS
NMR can be used to confirm the presence of silanol species. The chemical shifts of
these silanol species, mainly Q3 or Q2 species in zeolite framework, occupy a wide
range from -60 ppm to -100 ppm, and overlap with the Q4 species [94].
26

Figure 2.3: SS MAS NMR spectrum of an as-synthesised zeolite A sample using tetramethylam-monium hydroxide as organic structural directing agent. The spectrum contains five typical Si localenvironments: Si4(Al), Si(3Al), Si2(Al), Si(1Al), and Si(0Al).
Figure 2.4: Chemical shifts of the five local Si environments.
27

(Si
Al
)framework
=
(∑4n=0 ISi(nAl)
)(∑4n=0 0.25nISi(nAl)
) (2.4)
Another useful piece of information from solid state NMR is to use the 29Si NMR
spectrum to calculate the Si/Al ratio of the as-synthesised zeolite sample [96–99]. For
a zeolite framework that obeys the Loewenstein rule, an aluminum atom will always
be surrounded by four silicon atoms. Therefore, the total number of aluminum atoms
in the framework will be one-fourth of the total number of Si–O–Al bonds. Since
the intensity of a silicon resonance is proportional to the number of associated silicon
atoms, the Si/Al ratio can be given by equation 2.4, where I is the intensity of a
particular silicon resonance and n is the number of coordinated Al atoms for that
resonance. It is common that the silicon resonances of a zeolite sample are partially
overlapped or broadened, thus a deconvolution step is needed to determine the in-
tensity of a particular Si local environment before the Si/Al ratio can be calculated.
Deconvolution of the spectra involves fitting of individual peaks. This consists of
modelling the experimental NMR spectra with analytical peak functions: Gaussian,
Lorentzian or a mixture of both. Peak intensities, widths and positions are adjusted
in an iterative process in order to fit the calculated curve to the experimental NMR
peaks by minimising the sum of the squared residuals. However, if more than one
zeolite phase of similar framework structures are found in an as-synthesised zeolite
sample, for example, a mixture of zeolite A and sodalite, the Si/Al ratio cannot be
accurately determined as the Si resonance will be strongly overlapped. The error in
28

the Si/Al ratio calculated using equation 2.4 depends on how the local Si environ-
ments being assigned in the 29Si NMR spectrum. This affects the intensity – the
ISi(nAl) term in the equation, and a range of Si/Al ratio is observed.
Since Al–O–Al linkage is forbidden in zeolite frameworks according to the Loewen-
stein rule, there is only one Al local environment that exists for 27Al SS MAS NMR
if all Al are tetrahedral coordinated. The chemical shift for [Al(OSi)4] units con-
sist of a single signal in the chemical shift range of 50 - 70 ppm. However, there
are two more Al environments, the penta and octahedrally coordinated species. The
octahedral coordinated Al usually occupy the extra framework sites as a result of
calcination, steaming or acid leaching [100], and has a chemical shift around 0 ppm,
while pentagonal species have chemical shifts around 30 ppm.
All the NMR spectra in this study were collected at the EPSRC UK National
Solid-state NMR Service at Durham.
2.3 Scanning electron microscopy
Scanning electron microscopy (SEM) can be used to study the morphology of the
zeolite samples. Zeolite crystals have their own unique morphology, for example,
zeolite A is cubic while faujasite is tetrahedral in shape, though some zeolites have
multiple morphologies depending on the synthetic conditions. SEM can also be used
to study the different stages of zeolite crystallisation [101].
SEM works by emitting a narrow and high energy electron beam to the surface of
the sample under vacuum. The incident electron beam causes backscattered electrons
to be emitted from the sample’s surface and the difference in energy is detected and
29

shown as a difference in brightness, thus an image is obtained. For backscattered
electron imaging, the sample can either be conductive or non-conductive. However,
the image quality can be improved by coating the sample with a thin layer of con-
ductive material, such as carbon, gold, platinum, etc. The sample is loaded on a
carbon substrate to improve conductivity. The advantages of using SEM to study
zeolite morphology are the high resolution (down to nanometer scale) and the depth
of field, so crystals can be seen clearly in 3-dimension. However, SEM only works on
the surface of material which means the framework structure cannot be observed.
2.4 Geometric simulation of flexibility window
The geometric simulation in this study is done by using the software “Geometric
Analysis of Structural Polyhedra” (GASP) which was written by Stephen A. Wells.
There are several structural analyses can be performed using this piece of software
such as protein simulation, phase transition, and framework disorder, etc. [102],
however, the flexibility window is the main subject of interest. Although the details
of the calculation and theory behind the GASP program is out of the scope in this
study, a full explanation is given in the publications by Wells et al. [103, 104].
From [102], the geometry simulation is a template-based method, and the process
is illustrated in figure 2.5 as a simplified 2D version. The input is a list of atomic
positions. GASP then links the corresponding atoms by geometry and forms vertex-
sharing clusters. Templates resembling the shape of the vertex-sharing clusters are
then constructed. The mismatch is minimized by rotating the template to get the
initial fit. The residual mismatch from the previous fitting step is finally overcome by
30

Figure 2.5: Schematic illustration of the geometric simulation process in a simplified 2D version.(a) The input structure consists of a list of atomic positions; (b) Atoms are linked and vertex-sharing clusters are formed; (c) Templates are constructed to resemble the shape of vertex-sharingclusters, mismatches are identified; (d) Mismatches are minimised by rotating the templates, withsome residual mismatches; (e) The residual mismatches are further minimized by relaxing the atomicposition.
relaxing of the atomic position. The fitting steps are repeated until all the mismatches
are minimized.
In the case of zeolite flexibility window simulation, a rigid model is applied. The
model takes the tetrahedral unit of a zeolite framework as a rigid unit, and the only
flexible component is the T–O–T bonding linking the two tetrahedral units. The
Si–O bond length is set to be 1.61 A, while the Al–O bond length is 1.75 A for
the tetrahedral units. The atomic radii of an aluminosilicate zeolite framework that
consists of Si, Al, and O are 0.26 A, 0.39 A, and 1.35 A respectively. The input
structure depends on the zeolite framework being studied, but is in the P1 space
group to create the minimum symmetry equivalent position within the unit cell. The
31

extra framework species, such as sodium ions, can be customised and included in the
geometric simulation. GASP uses full periodic boundary conditions during geometry
simulations; atoms at one edge of the unit cell “see” a periodic image of the atoms
near the opposite edge. Bonds go out of one wall of the unit cell come back in through
the opposite wall, so atoms in the unit cells are always bonded to each other. There
are no dangling bonds at the edge of the unit cell.
32

Chapter 3
Synthesis of LTA, SOD, and LTNframework zeolites with no organicstructure directing agent
In this chapter, I will describe synthesis and characterization of zeolite A, sodalite
and Linde Type N with no organic structure directing agent (OSDA) and the trans-
formations between these zeolites during the crystallisation process. The chapter will
begin with the synthesis of zeolite A using both hydrothermal and microwave methods
with no OSDA, followed by the microwave synthesis of sodalite. The transformation
between zeolite A and sodalite will then be discussed. Finally, this chapter will end
with a new method of synthesising Linde Type N using a microwave method, and a
hydrothermal synthesis of this zeolite will also be present for comparison. Part of the
study in this chapter has been published in [68].
3.1 Synthesis of zeolite A with no OSDA using
microwave and hydrothermal methods
For the microwave synthesis, a modified method reported by Smaihi et al.[105] is
used. 6.78 g of sodium hydroxide (Fisher) was dissolved in 40 cm3 of deionized water
33

and divided into two 20 cm3 portions. 0.988 g of sodium aluminate was added to
one portion while 2.42 g of colloidal silica (Ludox HS-30, 30 wt% SiO2, Aldrich)
was added to the other. Both the Al2O3/Na2O/H2O solution and the silica solution
were stirred for 90 minutes at room temperature. The silica solution was then added
to the Al2O3/Na2O/H2O solution in a 60 ml polypropylene bottle, and stirred for 15
minutes. The homogeneous gel with batch composition 2SiO2:Al2O3:14Na2O:400H2O
was sealed and treated using a specialised microwave oven (CEM Mars 6) at 40 ◦C
(600 W) for 1 hour (LTA40M). The sample was then washed with distilled water until
pH 7 was attained, and dried in an oven at 110 ◦C overnight. For comparison, the
synthesis was repeated using a conventional oven at 40 ◦C for 24 hours (LTA40D24)
and 1 hour (LTA40D1). All as-synthesised zeolites were characterized by XRPD, as
shown in figure 3.1 on the following page.
The powder pattern of LTA40M is almost identical to LTA40D24. It is interesting
to see that the sodalite 110 peak is present in the LTA40M sample. This indicated
that the formation of zeolite A and sodalite depends on the synthesis condition. No
zeolite phase is observed in the powder pattern of LTA40D1 when the gel was treated
hydrothermally at 40 ◦C for an hour. The experiment proves that the microwave
method can reduce reaction time dramatically compared to hydrothermal synthesis,
from 24 hours to 1 hour, and zeolite A can be synthesised without OSDA using a
microwave method.
Figure 3.2 on page 36 shows the morphology of the two as-synthesised zeolite
samples acquired by SEM. Zeolite A synthesised hydrothermally (LTA40D24) gives
aggregates of small crystals with uneven size distribution (figure 3.2(a), 3.2(b)). The
34

Figure 3.1: Powder pattern of as-synthesised zeolites - microwave synthesised LTA40M, and hy-drothermal synthesised LTA40D24 and LTA40D1, with corresponding Miller indices. The SOD 110peak is marked with an asterisk.
biggest cubic crystals were around 0.5 µm in size. Crystallites of zeolite A synthesised
using a microwave method (LTA40M) are bigger and more uniform in size to about
1 µm. Inter-growth of cubic crystals are common (figure 3.2(d)), and impurities
(amorphous materials) are observed around the cubic crystals (figure 3.2(c), 3.2(d)).
An attempt to characterise the particle size distribution using the Scherrer equation
were not successful due to the low resolution of the PXRD pattern and asymmetric
nature of the peaks.
In a study reported by Sathupunya et al.[106], they synthesised zeolite A using
sol-gel microwave techniques with organic precursors (silatrane and alumatrane) and
OSDAs. Cubic zeolite A crystals with uniform size of 4.5 µm formed only at 110 ◦C
with a minimum reaction time of 4 hours. When zeolite A was synthesized at the
35

(a) (b)
(c) (d)
Figure 3.2: SEM images of (a), (b) LTA40D24 synthesised at 40 ◦C hydrothermally, and (c), (d)LTA40M synthesised at 40 ◦C using a microwave method.
same temperature for less than 4 hours, impurities were always present. No crystal
was formed in 1 hour syntheses. In this study, the morphology of LTA40M is similar
to what was reported by Sathupunya et al., but without using OSDA, at a lower tem-
perature, and a shorter reaction time. It is expected that by increasing the reaction
time of the LTA40M synthesis, cubic crystals with no impurity will form. However,
this may also increase the amount of the sodalite phase.
Sathupunya et al. also reported the concentration of NaOH in the starting gel
strongly affects the particle size. A high Na2O:SiO2 ratio (10:1) produced small zeolite
A crystals less than 1 µm, while a low Na2O:SiO2 ratio (3:1) gave bigger crystals with
36

size of 4.5 µm. In this study, the Na2O:SiO2 ratio was 7.5:1 for both microwave and
hydrothermal synthesis, which is closer to the higher end of the suggested Na2O:SiO2
ratio, and therefore small zeolite A crystals were obtained.
3.2 Synthesis of sodalite with no OSDA using
microwave methods
N.B. - See appendix B on page 105 for further information about this section.
To see if sodalite can also be synthesised using microwave methods, different
synthetic conditions were used. Figure 3.3 on the next page summarized the three
different recipes of making sodalite with the corresponding starting materials, batch
compositions and methods of preparation. Each sample was synthesised under four
different conditions. Two methods were used to prepare the gel. In both preparations,
a large amount of sodium hydroxide was dissolved in water, and the solution was then
halved and mixed with the Al and Si source separately, or the Al and Si sources were
added stepwise, and stirred for 2 hours. The powder patterns of the corresponding
as-synthesised zeolite are shown in figure 3.4 on the following page, and table 3.1
summarized the zeolite phase of all reactions.
Table 3.1: Summary of the as-synthesised zeolite samples prepared asmentioned in figure 3.3.
Samples Recipe
Condition 1 2 3
1 SOD SOD SOD+LTA2 SOD+LTA(T1) SOD+LTA(T) SOD+LTA(T)3 SOD SOD SOD4 SOD SOD SOD
1 T=in trace amount
37

Figure 3.3: Synthesis conditions, starting materials, batch compositions and preparation methodsfor sodalite.
(a) (b)
(c) (d)
Figure 3.4: Powder patterns of as-synthesised zeolite under (a) condition 1, (b) condition 2, (c)condition 3, (d) using recipe 3 in four conditions.
38

Figure 3.4(a) shows the powder pattern of the as-synthesised zeolite under condi-
tion 1, a relatively short, high temperature synthesis. The use of different Si sources
does not affect the formation of sodalite, e.g. fumed silica (recipe 1) or 98% precipi-
tated silica (recipe 2). However, under short reaction time, gel preparation makes a
difference to sodalite formation in samples. The powder pattern of the as-synthesised
zeolite of recipe 3 shows a mixture of zeolite A and sodalite. By dissolving the Si
source thoroughly in the gel, i.e. recipe 1 & 2, a pure sodalite phase is achieved.
Figure 3.4(b) shows the powder pattern of zeolites formed under a long, relatively
low temperature condition 2. A trace of zeolite A is present in all samples when the
synthesis is performed at a lower temperature. This can be seen as small peaks in the
diffraction pattern below 10 ◦ 2θ. However, comparing the powder patterns of recipe
3 in figure 3.4(b) to figure 3.4(a), the intensity of the zeolite A peaks are largely
reduced. It implies that even at low temperature, a longer reaction time favours the
formation of sodalite.
In the long, high temperature condition 3, a single sodalite phase is formed using
all three recipes regardless of the batch composition or gel preparation (figure 3.4(c)).
These results indicate that there is a transformation of zeolite A to sodalite depending
on reaction time and temperature, which will be discussed in section 3.3.
Figure 3.4(d) shows the powder patterns of as-synthesised zeolite using recipe 3
under four different conditions. Comparing the samples made using a microwave
method to the hydrothermal synthesis using an oven, sodalite is formed regardless of
the methods being used. The purity depends on temperature and time of crystallisa-
tion. However, the synthesis time is highly reduced with microwave methods. Batch
39

composition is known to affect the size of the crystalline product[57], but in the above
study, difference in batch composition does not affect the formation of sodalite phase.
It is known that the use of different silica sources affects the nucleation step, the
size distribution of the as-synthesised zeolite crystals, and the as-synthesised zeolite
phase. In a study reported by Twu et al. [107], they synthesised zeolite X and Y using
two different silica source, and characterised the gel using Raman spectroscopy. The
two silica source used were Ludox and N-brand, which were colloidal SiO2 particles
suspended in water and a sodium silicate solution respectively.
In the zeolite X synthesis, zeolite X was synthesised regardless the silica source
being used. However, Raman spectroscopy suggested the initial reaction between the
two silica sources and the aluminate source was different. Ludox solution consists of
SiO2particles covered with OH groups, and by reacting with aluminate source, forming
a core-shell like particle with an aluminum hydroxide sheath, only monomeric silica
species was observed. N-brand silicate solution, however, consists of polymeric silicate
species such as trimeric cyclic silicate and demeric silicate [108]. When it reacted with
aluminate source, Si–O–Al bonds were formed immediately and no excess aluminate
ions were observed. Although Ludox and N-brand reacted differently with aluminate
source, similar solid and solution-species were formed after 2-3 hours of heating, and
zeolite X was synthesised regardless the Si source being used. Use of different silica
source also affects the rate of crystallization of zeolite X. Zeolite X was crystallized
after 8 hours of heating in the Ludox system while minimum of 12 hours of heating
was required in the N-brand system. Zeolite X nuclei were formed after 5.5 hours of
heating in the Ludox system.
40

When Twu et al. synthesised zeolite Y with an aging step of 24 hours, zeolite P
(with GIS framework topology) and zeolite Y were formed using N-brand and Ludox
respectively. Raman data showed that the spectral differences between Ludox and
N-brand synthesis were only significant in the first hour of the aging process. Only
monomeric silicate ions were observed in the Ludox system, but monomeric, dimeric,
as well as oligomeric silicate species were observed in the N-brand system. Additional
experiments by mixing the Ludox and N-brand containing gel provided evidence that
the formation of zeolite P using N-brand was due to the presence of the polymeric
silicate species in the very early stage of the aging step - tetrameric Si–O chains
were formed which are the important building units for GIS framework, and zeolite P
was formed. Thus, the reaction between the aluminate species and the silicate species
initially presence in the silica source affects the formation of the as-synthesised zeolite
phase.
The study of Twu et al. may explain why the use of precipitated silica and fumed
silica had no effect on the as-synthesised zeolite phase in the microwave syntheses
described in this section. Both precipitated silica and fumed silica are in solid forms,
and form SiO2 particles with OH groups attached on the surface when mixing in
an alkaline solution, which is very similar to the Ludox system. Monomeric silicate
species are dominant and there are very few polymeric silicate species.
Twu et al. showed that in their zeolite X synthesis, different silica sources influence
the nucleation process. This is also supported by the study reported by Hamilton et
al. [109] and Tekin et al. [110]. Hamilton et al. synthesised zeolite NaX crystals using
11 different silica sources. Their results showed that the choice of silica source affects
41

the crystallization time, the final average crystal size and the impurity zeolite phases.
Cab-O-sil, a type of fumed silica, produced the largest zeolite X crystals but less
zeolite X nuclei, and required the longest crystallization time. Sodium metasilicate
nonahydrate, however, produced the smallest zeolite X crystals with the shortest
crystallization time. The effect of different metal ion impurities presence in the silica
sources were also tested and had no effect on the crystal size and the purity of the
as-synthesised zeolite NaX.
The effects of using different silica sources are not limited to zeolite syntheses with
FAU framework topology. Mohamed et al. [111] reported the effect of four different
silica sources on the crystallinity of nanosized ZSM-5 zeolite. It was found that ZSM-5
crystals synthesied using fumed silica had the highest crystallinity and surface area,
while using sodium metasilicate produced quartz material. When colloidal silica was
used, the crystal obtained had the highest average crystal size but the lowest surface
area.
The morphology and crystal size of two selected zeolite samples were studied by
SEM, as shown in figure 3.5 on the following page. Both samples were sythesised under
condition 1 in figure 3.3, but two different recipes were used. When fumed silica was
used and the Na2O:SiO2 ratio kept low to around 3:1 (recipe 1), aggregates of highly
crystalline particles were obtained (figure 3.5(a)). No such morphology was reported
in the literature. When precipitated silica was used and the Na2O:SiO2 ratio increased
to about 7.5:1 (recipe 3), spherical sodalite particles with sizes about 10 µm were
synthesised, as well as some cubic zeolite A crystals (figure 3.5(b)). Close observations
on these spherical sodalite crystals indicated that each of them were composed by
42

inter-growth of smaller disc-like plates. Huang et al. [112] reported a similar sodalite
morphology when studying the effect of ethanol in sodalite crystallization. Such
morphology was observed when a low concentration of ethanol was used.
(a) (b)
Figure 3.5: SEM images of zeolite samples synthesised under condition 1 using (a) recipe 1 (b)recipe 3
3.3 Transformation between LTA framework and
SOD framework
I mentioned in section 3.1 and 3.2 that the formation of zeolite A and sodalite phase
heavily depends on the synthesis conditions. In order to have a better understanding
between the formation of LTA and SOD framework, a series of samples were sythesised
hydrothermally using the same method described in section 3.1 at different reaction
temperature and time.
The powder patterns of as-synthesised zeolite A with no OSDA at various tem-
peratures are shown in figure 3.6 on the next page. Pure zeolite A phase was formed
when treated hydrothermally for 24 hours at 40 ◦C, 50 ◦C and 60 ◦C. When the tem-
perature was increased to 70 ◦C, a mix of zeolite A and sodalite was observed. The
43

sodalite 110 peak can clearly be seen around 14 ◦ 2θ. The amount of sodalite in the
as-synthesised sample increases from 70 ◦C to 95 ◦C. The sample synthesised at 95 ◦C
for 24 hours consisted mostly of sodalite. When the reaction time increased from 24
hours to 48 hours at 95 ◦C, single phase sodalite was synthesised. These data show
that zeolite A can be synthesised at temperatures as low as 40 ◦C without OSDA.
Figure 3.6: Powder pattern of as-synthesised zeolite samples at different temperature and reactiontime.
The transformation from the LTA framework to the SOD framework with in-
creased temperature has been reported previously [14, 21, 112–114]. Both zeolite
A and sodalite are formed by β-cages stacked in different ways. To make the SOD
framework, β-cages are stacked on top of each other in a simple cubic arrangement
via single four-rings (S4R). The LTA framework is made in a similar manner with a
cubic arrangement of β-cages, but with additional space between the β-cages – D4R
units. This makes zeolite A (framework density 14.7 T/nm3) more open compared to
44

sodalite (framework density 16.7 T/nm3), so it is reasonable to expect that sodalite
will preferentially form with increased temperature[14, 21, 112–114]. Increasing the
duration of hydrothermal treatment also favors the formation of sodalite at high
temperature.
Table 3.2: SS MAS NMR of as-synthesised zeolite samples (see appendix for spectra)
Sample Phase Temp Time Si Al Na◦C hour(s) ppm ppm ppm
1 Zeolite A 40 24 -84.9, -89.5 58.6 -2.42 Zeolite A 50 24 -84.5, -85.4, -86.5, -89.3 58.8 -1.93 Zeolite A 60 24 -86.5, -89.4, -91.1 58.6 -3.44 Zeolite A, Sodalite 70 24 -83.5, -86.6, -89.4, -94.6 58.5 -3.15 Zeolite A, Sodalite 80 24 -83.5, -86.5, -89.3 58.5 -3.16 Sodalite 95 48 -83.8, -85.2 63.7, 65.3 4.0, -4.1
To study the change of Si and Al local environment during the transformation,
the as-synthesised zeolite samples were characterised by solid state MAS NMR. Table
3.2 summarizes the chemical shift of all samples being characterised. Since some
of the zeolites were synthesised at temperatures as low as 40 ◦C, it is difficult to
identify specific local Si environments for each of the Si chemical shifts. The presence
of silanol signals is also expected for some of these zoelite samples, especially at
low temperatures, and it was confirmed by 29Si cross-polarization (CP) MAS NMR
(appendix C.2.2). It is interesting to see that there was one signal around -89.4 ppm
which was present in all samples with zeolite A (Table 3.2, sample 1-5). This signal
was suggested by Ren et al. as an intrinsic signal for the LTA framework [115]. This
peak is usually attributed to Si(4Al) species in zeolites [4]. Fan et al. [57] reported
that when microsized sodalite crystals were synthesised, only one signal at -85.5 ppm
was observed. However, there was an extra signal around -83.0 ppm for nanometer-
sized crystals. Since both signals were observed in sample 6, it is highly probable that
45

nanometer-sized sodalite crystals were being synthesised (figure 3.7 on the following
page).
27Al and 23Na MAS NMR spectra of as-synthesized zeolite samples at 40 ◦C, 50 ◦C,
60 ◦C, 70 ◦C and 80 ◦C (sample 1-5) show only one Al and one Na local environment
respectively (appendix C.2.3 and C.2.4 (a) - (e)). This indicates that Al were tetra-
hedrally coordinated in the framework associated with Na ions. Sodalite (sample 6),
however, showed an extra broad 23Na signal at 4.0 ppm.
For single phase zeolites, the Si/Al ratio can be calculated by using equation
2.4 mentioned in chapter 2. For zeolite samples synthesised hydrothermally with no
OSDA at 50 ◦C (sample 2) and 95 ◦C (sample 6), the estimated ratio was 1.17±0.16
and 1.10±0.10 respectively. The error arises from the identification of Si local envi-
ronments and the presence of silanol signals. For comparison, the suggested Si/Al
ratio for zeolite A with no OSDA, and for sodalite, is 1 [52, 116].
The morphology of selected as-synthesised zeolite samples were characteriesed
using SEM, as shown in figure 3.7 on the next page. Although the powder pattern
of the zeolite sample synthesised at 50 ◦C showed a single phase, aggregates of small
crystals less than 0.2 µm without defined shape were observed. At temperatures
of 70 ◦C and 80 ◦C, a mixture of faceted cubic and truncated zeolite A crystals, as
well as sodalite crystals with undefined shape were obtained. Sodalite crystals with
hexagonal faces formed at 95 ◦C. Most of these crystals were less than 1 µm in size.
46

(a) (b)
(c) (d)
Figure 3.7: SEM images of as-synthesised zeolite samples, (a) 50 ◦C, (b) 70 ◦C, (c)80 ◦C for 24hours, and (d) 95 ◦C for 48 hours
3.4 Synthesis of Linde Type N zeolite with no
OSDA
3.4.1 Microwave synthesis of Linde Type N zeolite
In section 3.1, zeolite A was synthesised using a microwave method. When this
synthesis was repeated using the same reagents and method of preparation, but with
a different gel composition, Linde Type N zeolite was synthesised instead of zeolite
A. The Linde Type N zeolite synthesis used the same volume of Ludox HS-30 (2 ml)
and water (40 ml), with double and triple the amount of sodium aluminate (2.05 g),
47

and sodium hydroxide (21 g) respectively. The batch composition was SiO2 : Al2O3 :
22Na2O : 200H2O. All syntheses were microwave treated for an hour at 40 ◦C, 60 ◦C,
80 ◦C, 90 ◦C, 100 ◦C, and 120 ◦C respectively. Two more samples were synthesised
using fumed silica instead of Ludox HS-30 at 60 ◦C and 90 ◦C.
The powder pattern of selected as-synthesised zeolite samples are shown in fig-
ure 3.8 on the following page and figure 3.9 on page 50. When the gel was microwave
treated at 40 ◦C, no zeolite phase was observed. Linde Type N zeolite started to form
at 60 ◦C, and up to 90 ◦C (figure 3.8(a)). Transformation between Linde Type N
zeolite and sodalite occurred between 90 ◦C and 100 ◦C. At 100 ◦C and above, single
phase sodalite was formed (figure 3.9). The calculated unit cell parameter of Linde
Type N zeolite synthesised at 60 ◦C was a = 36.724(4) A, which is bigger than the
value, a = 35.622 A, reported in the “Database of Zeolite Structures”. The increase
in cell parameter may correspond to trapped water in the cages of the zeolite which
was present during the microwave synthesis. The use of fumed silica has no effect on
the as-synthesised zeolite phase and Linde Type N zeolite is formed (see appendix
C.1 for powder pattern).
29Si MAS NMR spectrum (appendix C.3.1 on page 111, figure C.6(a)) of the Linde
Type N zeolite sample synthesised at 90 ◦C shows two major signals at -85.3 ppm and
-86.3 ppm, with -83.7 ppm contributing to silanol species. Since there is no NMR
data reported for Linde Type N zeolite in the literature, it is difficult to compare the
Si local environment for each of these signals. Both 27Al and 23Na (appendix C.3.1
on page 111, figure C.6(c), (e)) gave two signals. For 27Al MAS NMR, no penta
or octahedral coordinated aluminum were observed in the zeolite framework. The
48

(a)
(b)
Figure 3.8: Powder patterns of as-synthesised zeolite samples without OSDAs using microwavemethods. (a) Linde Type N zeolite forms above 60 ◦C, (b) A high resolution powder pattern ofas-synthesised zeolite sample at 60 ◦C.
49

Figure 3.9: Powder pattern of as-synthesised zeolite samples. Sodalite forms at and above 100 ◦C
(a) (b)
(c)
Figure 3.10: SEM images of as-synthesised zeolite samples, (a) at 60 ◦C (b) at 90 ◦C (c) at 100 ◦C
50

presence of two 27Al environments may be a result of minor framework distortion.
SEM images of as-synthesised zeolite samples at 60 ◦C, 90 ◦C, and 100 ◦C are
shown in figure 3.10 on the preceding page. At 60 ◦C, Linde Type N zeolite formed
as truncated cubic crystals associated with spheres formed by inter-growth of smaller
disc-like plates (figure 3.10(a)). The truncated cubic crystals grow into aggregates and
eventually to 2 µm spheres with a smooth surface at 90 ◦C (figure 3.10(b)). Uniform
sodalite crystals with size 3 µm were observed at 100 ◦C, as shown in figure 3.10(c).
3.4.2 Hydrothermal synthesis of Linde Type N zeolite
To compare the microwave synthesised Linde Type N zeolite samples in section 3.4.1,
a Linde Type N sample was synthesised using hydrothermal method with no OSDA.
The method is based on the patent described by Duecker et al.[66]. 10 g of sodium
hydroxide was dissolved in 25 ml of deionized water followed by 0.95 g of aluminium
hydroxide and stirred at 95 ◦C for 1 hour until a clear solution was formed. 2.18 ml
of sodium silicate solution was then added and shaken vigorously for 1 minute. The
resulting gel was transferred into a 60 ml polypropylene bottles and heated at 100 ◦C
for 1 hour, then washed with distilled water until pH 7 was attained, and dried in an
oven at 100 ◦C overnight.
Figure 3.11 on the next page is the powder pattern of the hydrothermal sythesised
Linde Type N zeolite sample. The calculated unit cell parameter is a = 35.400(2) A,
which is close to the suggested value, a = 35.622 A. No impurity is observed from
the powder pattern.
51

Figure 3.11: Powder pattern of as-synthesised Linde Type N zeolite with no OSDA using hy-drothermal method.
Table 3.3: SS MAS NMR of hydrothermal synthesised and microwave synthesised Linde Type Nsamples
Chemical Shift(s) / ppm
LTN samples Si Al NaHydrothermal -84.80, -86.65, -87.10, -88.95, -90.57, -92.13 55.05, 59.54 7.15Microwave -83.70, -85.30, -86.30 60.60, 63.53 2.10, -4.81
Table 3.3 summaries the chemical shifts of the hydrothermal and microwave syn-
thesised Linde Type N samples. Compared to the microwave synthesised samples,
the 29Si MAS NMR spectrum of the hydrothermal synthesised Linde Type N sample
(appendix C.3.1 on page 111, figure C.6(b)) gave four major signals at -87.10 ppm,
-88.95 ppm, -90.57 ppm, and -92.13 ppm, with two relatively low intensity signals at
-84.80 ppm and -86.65 ppm. The four strong signals can be assigned to the Si(4Al)
and Si(3Al) local environments, however, individual signals cannot be precisely as-
signed to the two local environments. Since two morphologies were observed in this
Linde Type N zeolite sample (figure 3.12 on the following page), it is very likely that
52

one morphology gives the signals at -87.10 ppm and -90.57 ppm, while the signals at
-90.57 ppm and -92.13 ppm belong to the other morphology. More characterizations
are necessary before a conclusion can be made. Although two signals were observed
on the 27Al MAS NMR spectrum (appendix C.3.1, figure C.6(d)) at 55.05 ppm and
59.54 ppm, both are tetrahedrally coordinated Al species. The 23Na MAS NMR (ap-
pendix C.3.1, figure C.6(f)) gave only one signal at 7.15 ppm, indicating a uniform
distribution of extra-framework Na cations.
(a) (b)
Figure 3.12: SEM images of hydrothermal synthesised Linde Type N zeolite samples at 100 ◦C, 1hour.
Figure 3.12 shows the SEM images of the hydrothermal synthesised Linde Type
N zeolite. Two morphologies were observed. The majority of the crystals were inter-
growths of smaller cubic crystals, which eventually formed aggregates with an average
size of 4 µm. Another morphology being observed is the elongated rod with lengths
as long as 6 µm. The SEM images presented are known to be the first for Linde Type
N zeolite, as none have been reported in the literature.
53

3.5 Summary
This chapter shows that zeolite synthesis with no organic structure directing agent
(OSDA) is challenging, and requires precise control of synthesis conditions. Transfor-
mation of zeolite frameworks with similar building units is likely to happen without
OSDAs, for example, zeolite A is synthesised hydrothermally at 40 ◦C but sodalite is
formed when the temperature increases to 95 ◦C. At low temperature, frameworks
with lower densities are more likely to form, and vice versa. By merely changing the
method of crystallization from hydrothermal to microwave, Linde Type N zeolite is
synthesised at 60 ◦C instead of zeolite A. The synthesis of Linde Type N zeolite using
a microwave method is new and is the first to be reported in the literature.
54

Chapter 4
β-cage capacity of water andmethanol molecules in siliceouszeolite Y
This chapter is a theoretical study about siliceous zeolite Y using the data obtained
from the high pressure study by Colligan et al.[81]. The chapter will start by looking
for the flexibility window of siliceous zeolite Y, and to see if the framework will re-
main in its flexibility window under pressure. The occupation of water and methanol
molecules in the beta-cages is then investigated to explain some experimental obser-
vation regarding site occupancy. The intrinsic flexibility window of the framework
will be distinguished from the newly defined extrinsic window limited by host–guest
steric interactions to end the chapter. The study in the chapter has been published
in [117].
4.1 Preparation of zeolite Y structure for
geometric simulation
In this study, the input is an all-atom crystal structure in P1 symmetry, in this case a
single unit cell of the FAU framework containing 192 tetrahedral units (192 Si and 384
55

framework oxygen atoms) using the Rietveid refined high pressure experimental data
obtained on siliceous zeolite-Y by Colligan et al. [81] using methanol-ethanol-water
(16:3:1) as a pressure transmitting fluid. The structure is modeled with fixed cell
parameters and periodic boundary conditions. Inter-atomic bonding in the SiO4 unit
is represented using a tetrahedral template [118] with a Si-O bond length of 1.61 A.
Framework oxygen atoms are assigned a steric radius of 1.35 A [119]. Although the
geometric simulation method is capable of modelling both SiO4 and the larger AlO4
tetrahedra, the input structure in this case is refined as a siliceous structure, and so
only SiO4 units are used in the modelling. A siliceous structure has no interaction
between charge-balancing cations and framework oxygen atoms.
A cell parameter can then be imposed on the framework, either from theory or
from experimental data. The extra-framework sites can also be populated with a cho-
sen distribution of molecules. Geometric relaxation of the structure reveals whether
the framework can accommodate the extra-framework content without distortion of
the tetrahedral units. In this case, the structure is “stress-free” within the simplified
physical model, lying within its flexibility window. If the structure cannot accom-
modate without distortions, then it is intrinsically stressed. The a parameter was
exposed to a precision of 0.01 A, e.g. a reported window edge on expansion of 23.46
A signifies that the structure relaxes at this value but not at a = 23.47 A. The cri-
teria to consider the tetrahedral units as effectively undistorted is for all mismatches
between atomic positions and template vertices to be less than 0.001 A.
56

(a) (b)
Figure 4.1: Models used in geometric sim-ulation. (a) water molecule (b) methanolmolecule
A major point of interest in this study
is the steric limitation of β-cage occupancy
by water and methanol molecules. Given
the simplified nature of the geometric simula-
tion, these molecules were represented using
a united atom approach. Water molecules are
represented as a molecular sphere with a radius of 1.39 A based on the inter-oxygen
distance in water [120]. The larger methanol molecule is represented as a diatomic
molecule consisting of a methyl sphere of radius 2.00 A and a hydroxy sphere of radius
1.39 A, connected by a bond of 1.40 A, as shown in figure 4.1 [121, 122].
The behaviour of porous materials under compression can be strikingly different
when the pressure transmitting medium contains small molecules that are capable
of penetrating the pores and channels of the structure, compared to the case when
the medium consists of larger molecules (such as silicone oil) which cannot occupy
void spaces within the material [123]. Since the β-cages in siliceous zeolite Y are
much more confined than the “supercages” making up the main channel network, the
supercage contents are neglected, and the occupation of the β-cages is the main focus.
4.2 Intrinsic flexibility window in FAU framework
I started the simulation with the empty framework structure as refined by Colligan
et al. at ambient pressure (a = 24.24 A), and then explored greater cell volumes by
increasing the a cell parameter to identify the point at which over-extension of the Si–
O bond becomes inevitable, thus defining the upper limit of the flexibility window.
57

The lower cell volumes are also being explored by decreasing the a parameter to
identify the point at which collisions between codimeric framework oxygen atoms
can no longer be resolved without distortions of the tetrahedral geometry, therefore
defining the lower limit of the window. The intrinsic window obtained lies between a
= 24.46 A and a = 22.50 A. The wide range of the flexibility window and the position
of the cell parameter under ambient conditions near the expanded edge are plotted
in figure 4.2 along with the ranges of compression observed experimentally.
Figure 4.2: Flexibility windows of the FAU framework with a varying water content in the β-cages: 0, 1, 4 or 8 water spheres per cage. The upper (squares) and lower (diamonds) limits of theflexibility window for each case are shown and the extent of the window is shown with a dashed bar.For the 0 water case, circles show experimental data points during compression in silicone oil; forthe 4 water molecules case, circles show experimental data points during compression in methanol–ethanol–water. The upper and lower pressure limits of the experimental data are indicated bylabelled arrows.
During compression experiments by Colligan et al. without penetrating media,
the structure starts to display significant peak broadening at pressures above 2.2 GPa,
which is interpreted as the onset of amorphization. At this stage the framework lies
58

well within the theoretical limits of the flexibility window, with a = 23.76 A at 2.7
GPa as shown in figure 4.2. This observation matches a recent result on silicalite
[44], with amorphization occurring while the framework lies within the flexibility
window. During compression in the modelling, steric contacts between codimeric
framework oxygen atoms first occur when the a parameter reaches 23.00 A. This
indicates that, experimentally, amorphisation in the empty framework sets in well
before the framework oxygens would be forced into contact.
In the geometric simulations, Si–O–Si bridging angles are not explicitly con-
strained. However, in practice the zeolite structures do display a preference for angles
in the vicinity of 145◦ [119] and substantially smaller angles would indicate a degree of
strain in the framework. I have therefore examined the angular geometry of the input
crystal structure, and of the structure geometrically relaxed under ambient conditions
(a = 24.24 A) and at the experimental onset of amorphisation (a = 23.76 A). Four
crystallographically distinct populations of bridging angles are identifiable in siliceous
zeolite Y. The input structure displays bridging angles of 137◦, 149◦, 126◦ and 148◦
(all values reported to an accuracy of 1◦) with a mean around 140◦; essentially the
same values are tabulated by Colligan et al. [81]. When the structure is geometrically
relaxed under ambient conditions, the four populations become much more similar,
with values of 144◦, 142◦, 139◦ and 141◦. This suggests that the low (strained) values
in the crystal structure may be an artefact of the refinement by Colligan et al. At the
onset of amorphisation, the values in the relaxed structure are 154◦, 129◦, 127◦ and
132◦, with a mean around 135◦, indicating that a considerable angular strain would
exist in the structure at this point and may be the driver of amorphisation.
59

In the case of silicalite, the framework becomes geometrically stressed during com-
pression with penetrating media [44]. In siliceous zeolite Y, however, the framework
remains within its intrinsic flexibility window even with penetrating pressure media,
as the smallest cell parameter recorded (a = 23.76 A at 7.9 GPa) lies well above the
limit of the intrinsic window at a = 22.50 A. This difference may be due to the lower
framework density of faujasite compared to silicalite (13.3 T nm−3 vs. 18.4 T nm−3).
4.3 Steric limits on water occupancy in β-cages
In the experimental investigation by Colligan et al., extra-framework content was
notionally modeled as ‘water’ sites. At various stages of compression, the β-cage was
refined with one, four or eight water sites, though with partial occupancies less than
1. At low pressures there is a single extra-framework site, Ow(1), at the center of
the β-cage, located at the special symmetry position (1/8, 1/8, 1/8). At pressures
from 2.7 GPa upwards, this primary site moves off the special position and becomes
a tetrahedron of partially occupied sub-sites, Ow(4). As thermal factors could not
be refined for these sites, their exact positions should not be over-interpreted; rather,
they represent a zone of extra-framework density. At pressures from 3.2 GPa up-
wards a second extra-framework site, Ow(5), in the β-cage is also occupied. Full
population of all extra-framework sites in the modelling corresponds to placing eight
water spheres in each β-cage, a level of cage occupation which exceeds that observed
experimentally. I have modelled the structure with β-cage contents of one, four and
eight water molecules initially placed on extra-framework water sites. The flexibility
windows obtained are shown in figure 4.2 on page 58.
60

A single water molecule per β-cage can be accommodated without affecting the
intrinsic flexibility window. As water occupancy increases, the flexibility window
narrows, giving an extrinsic flexibility window controlled by host–guest interactions
in the β-cages. The sum of partial site occupancies seen experimentally at higher
pressures corresponds roughly to the occupation of four water molecules per β-cage.
However, even with eight water molecules per cage, the extrinsic flexibility window
is wider than the experimentally observed range of cell parameters, indicating that
cage occupancies greater than those observed experimentally are sterically possible.
Colligan et al. treated all extra-framework sites as water sites, and made the
following comment: ‘There are distances shorter than the van der Waals contacts
between Ow(4) and Ow(5) sites in the β-cages...but given the partial occupancies,
these will not be simultaneously occupied.’ However, in the case of primary sites,
the distance between the sub-sites is approximately 1.6 A, and the partial occupancy
of these subsites is 0.5 or higher for pressures from 2.7 to 5.7 GPa. These partial
occupancies imply that at least two of the Ow(4) and Ow(5) sub-sites in each cage
are occupied; and yet the 1.6 A distance between sub-sites is quite incompatible with
a water–water contact distance of 2.8 A. Indeed, the inter-sub-site distance is closer
to a typical value for an inter-atomic bond.
The sites as refined within the β-cage form a central tetrahedron of Ow(4) subsites
spaced 1.6 A apart, surrounded by a complementary outer tetrahedron of Ow(5)
subsites lying in the 6-ring apertures connecting the β-cage to the supercage (figure
4.3(a)). The Ow(4) sites are in steric clash amongst themselves while the Ow(5)
61

(a) (b) (c)
Figure 4.3: (a) A β-cage of faujasite from the crystal structure as refined by Colligan et al. (atetrahedral framework view), showing the locations of the eight water sites (spheres), (b) A β-cageafter geometric relaxation, showing the tetrahedra of the framework and the relaxed locations of eightwater spheres, (c) As in (b), with the atoms of the framework shown in space-filling representation;one six-ring of the β-cage has been removed to show the occupation of the interior. The view is inall cases along a crystallographic [1,-1,1] direction.
sites are in a steric clash with framework oxygen atoms in the six-ring. Four water
molecules in the simulation, lying initially on the Ow(4) subsites, sterically repel
each other to a contact distance of 2.8 A. Eight water molecules lying initially on the
Ow(4) and Ow(5) subsites resolve their steric clash in the simulation, taking up an
almost cubic arrangement within the β-cage, as shown in figure 4.3(b). The contrast
between the refined extra-framework site positions in figure 4.3(a) and those that are
geometrically possible, figure 4.3(b), is very evident.
4.4 Steric limits on methanol occupancy in
β-cages
The results of section 4.3 make it doubtful that water molecules in the β-cage can fully
account for the extra-framework density observed in the experiments. The presence
of a methanol molecule in the β-cage, however, would provide a natural explana-
tion for the presence of two closely adjacent non-hydrogen atoms (C and O) on two
62

of the Ow(4) sub-sites during compression with a methanol–ethanol–water pressure
transmitting fluid. I have therefore investigated the capacity of the β-cages to accom-
modate methanol molecules as well as water molecules. When introducing methanol
molecules into the cage, we initially place the ‘hydroxy’ and ‘methyl’ spheres on two
Ow(4) sub-sites in the centre of the cage.
Figure 4.4: Flexibility windows of the FAU framework with varying methanol and water contentin the β-cages. 1M* = 1 methanol in one cage, other cages empty; 1M = 1 methanol in each cage;1M/4W = 1 methanol in one cage, four water molecules in all other cages; 1M2W* = 1 methanoland 2 water molecules in one cage, other cages empty; 1M2W = 1 methanol and 2 water moleculesin each cage. The upper (squares) and lower (diamonds) limits of the flexibility window for eachcase are shown and the extent of the window is shown with a bar. A finely dotted line highlightsthe contraction of the upper edge of the window in the latter two cases.
Figure 4.4 shows the flexibility windows obtained with methanol in β-cages. Plac-
ing a single methanol molecule in one β-cage and leaving the others empty allows
the framework to relax over a window from a = 24.46 A to a = 23.10 A. Placing a
single methanol molecule within each of the eight β-cages in the unit cell also allows
63

the framework to relax over an only slightly narrower window, with the lower limit
at a = 23.29 A. A structure with one methanol molecule in one cage and four water
molecules in each of the others relaxes down to a = 23.24 A. These data suggest that
a single methanol molecule is almost interchangeable with four water molecules in
terms of β-cage contents.
Two methanol molecules cannot be placed in a single β-cage without introducing
stress into the framework. However, some water molecules can share a cage with a
methanol molecule. Placing a single methanol molecule and two water molecules in
one β-cage and leaving the others empty allows the framework to relax over a window
from a = 24.43 A to a = 23.57 A. Here an interesting effect is seen with the cage
content causing the flexibility window to become narrower at both the extended and
compressed edges; a structure at the limit (a = 24.46 A) of the empty framework is
unable to accommodate the cage contents, and must contract slightly to allow the
cage to adapt. A similar but a much more marked effect is seen if a single methanol
molecule and two water molecules are placed in each of the eight β-cages in the unit
cell. In this case the window narrows to the range from a = 24.41 A to a = 24.18 A.
This dramatic narrowing illustrates the collective nature of framework flexibility. The
β-cages do not accommodate their contents in isolation, but rather through collective
motions of the framework polyhedra, which are transmitted to adjacent cages. This
behaviour can be considered as a form of an ‘internal auxetic’ effect; near the expanded
edge of the flexibility window, expansion of the entire framework effectively contracts
the β-cages, preventing them from accommodating bulky contents.
64

(a) (b)
Figure 4.5: (a) β-cage of faujasite, showing the tetrahedra of the framework after relaxation withcage contents of one methanol and two water molecules (spheres). The methanol hydroxy group isthe sphere nearest the centre of the image. (b) As in (a), showing the oxygen atoms of the frameworkin space filling representation. One side of the cage has been removed to view the interior. Bothfigures are viewed along a crystallographic [1,-1,1] direction.
The geometry of the β-cage containing one methanol and two water molecules is
shown in figure 4.5. Note particularly the substantial reorientations of the framework
tetrahedra in figure 4.5(a) compared to figure 4.3(b), illustrating the importance of
framework flexibility in adapting the cage geometry to bulky contents.
From the result of geometric simulation in section 4.3 and section 4.4, the ex-
perimental data of Colligan et al. may provide evidence for the entry of methanol
molecules into the β-cages of the FAU framework during compression. This would
account for several features of the β-cage occupancy which are difficult to explain if
water is the only molecule occupying the β-cage. One of these features is the 50%
partial occupancy of the Ow(4) subsites lying only 1.6 A apart. This concentration
of heavy-atom (non-H) sites is sterically forbidden for water molecules but is eas-
ily explained by the methanol C and O atoms effectively occupying two adjacent
Ow(4) sub-sites. Another is the location of the Ow(5) subsite in an apparent clash
with framework oxygen atoms in the 6-ring, and a net occupation of extra-framework
65

sites in the β-cage corresponding to around four water molecules, when sterically
up to eight water molecules could be accommodated without clashes. A disordered
arrangement with methanol molecules in some β-cages and varying number of wa-
ter molecules in others would account for these data. Steric limitations mean that
no more than one methanol molecule is able to occupy a β-cage, as two methanol
molecules would inevitably cause geometric stress in the framework.
4.5 Access to the β-cage through the six-ring
pore
The result of the geometric simulation and the experimental data of Colligan et al.
suggested that the β-cage, under certain pressure, is occupied by a methanol molecule.
This leaves a fundamental question to be addressed which is the accessibility of the
β-cage interior to methanol molecules, as the relatively large methyl group must pass
through the small radius of the six-ring aperture. In general, the available aperture
depends on the local geometry of an individual six-ring, which may vary considerably;
the statistics of such apertures across large structural models can be investigated using
Delaunay triangulation [124]. However, the maximum free aperture will be displayed
when the six-ring has a regular hexagonal geometry, as any deviation will bring some
pair of opposing oxygens closer together, and therefore this limiting case is being
investigated.
The aperture can be considered as a hexagon of oxygen sites whose edge length is
the edge length of the regular SiO4 tetrahedron, which is lE = 2.63 A (for a Si–O bond
length of lb = 1.61 A and O–Si–O angle = 109.5 degree, lE = sin(1/2)(109.5◦)*1.61
66

(a) (b)
Figure 4.6: (a)Relationship between Si–O bond length lb, six-ring aperture edge length lE , frame-work oxygen radius rO and the radius, rM , of the largest molecule that can pass through an un-strained six-ring aperture. (b) Distortions in tetrahedral bonding, D, and steric overlap, P, whenlarger molecules pass through.
A*2). The distance between opposite oxygen centres will be twice the edge length, and
the free aperture is this distance less twice the radius of a framework oxygen atom,
rO; this is 2lE - 2rO = 5.26 - 2.70 = 2.56 A, the diameter of the largest molecule
that could pass without strain in the 6-ring (see figure 4.6(a)). Comparing this to
the diameters of the water group (2.78 A) and of the methyl group (4.0 A), both
molecules would be excluded from passage through an unstrained six-ring aperture.
Therefore, it is necessary to consider what degree of strain is required to permit the
molecules to pass.
Two parameters will be needed to describe this situation: the tetrahedral strain D
involved in stretching the O–O distance to increase the tetrahedral edge length, and
the overlap P as atoms approach more closely than the sum of their radii. If D is the
displacement of a framework oxygen atom from its ideal vertex in the tetrahedron,
67

the edge length is now lE* = lE + 2D, and the distance between opposite oxygen
vertices in the strained six-ring will now be given by 2lE*. If a molecule with a radius
rM is passing through the aperture, this distance must be equal to 2rO + 2rM - 2P.
These parameters are illustrated in figure 4.6(b).
The strain required by equating D and P is estimated, so that all deviations from
the ideal geometry, steric or bonding, are equal in magnitude. Setting P = D, then
2(lE + 2D) = 2rO + 2rM - 2D, hence D = (1/3)(rO + rM - lE). The passage of a water
group with rM = 1.39 A requires a distortion of D = 0.03 A. Using the methyl radius
rM = 2.00 A, a required strain of D = 0.24 A is obtained. This degree of compression
requires the methanol and framework oxygen groups to approach to about 90% of
their contact distance, presenting a significant but not insuperable barrier to entry.
The appearance of the multiple Ow(4) site within the β-cage at a pressure of 2.7 GPa
may therefore mark the point at which the pressure is sufficient to drive methanol, the
major component of the pressure-transmitting medium, into the β-cages of faujasite.
4.6 Chapter summary
The influence of explicitly present extra-framework contents is addressed by the “flex-
ibility window” concept. Low loadings of water within the faujasite β-cage do not
affect the flexibility window, which on compression is limited by collisions among
codimeric framework oxygen atoms, as in the empty framework. Higher loadings of
water or methanol lead to a different behaviour in which the flexibility window on com-
pression is limited by collisions between the framework oxygens and extra-framework
contents. Therefore the intrinsic flexibility window of the empty framework and the
68

extrinsic window at higher loadings can be distinguished.
An unexpected feature of the extrinsic window is that it can be narrower than the
intrinsic window not only in compression, but also in extension. It is intuitive that
the presence of extra-framework content should naturally impose a steric limit on the
window in compression. The effect on extension is more subtle; near the expanded
edge of the window, the cages in the structure lack the freedom to adapt to the shape
of bulky contents such as a combination of methanol and water molecules.
Analysis of structural data on the siliceous faujasite framework under compression,
using geometric simulation, indicates that the framework remains within its flexibil-
ity window over a wide range of pressures, with or without penetrating pressure-
transmitting media. The onset of amorphization during compression without pene-
trating media occurs while the framework is well within its flexibility window. The
geometric simulations indicate that the distribution of the extra-framework content
in faujasite within the β-cages at higher pressures (2.7 GPa and above) may be ac-
counted for the presence of methanol molecules within some of the β-cages.
69

Chapter 5
Synthesis and framework flexibilityof zeolite EMC-2
In this chapter, I will first describe the synthesis of zeolite EMC-2 using an organic
structure directing agent - a crown ether molecule named 18-crown-6. The chapter
will then move on to a theoretical study by geometric simulation to see if the 18-
crown-6 molecule, which occupies specific cages of the EMT framework, will affect
the flexibility window [125].
5.1 Synthesis of zeolite EMC-2
Zeolite EMC-2 was synthesised using 25.32 g colloidal silica (Ludox HS-30, 30 wt%
SiO2, Aldrich), 2.41 g sodium aluminate (Al2O3 50-56%, Na2O 40-45%, Sigma-
Aldrich), 2 g sodium hydroxide solution (50% in H2O, Sigma-Aldrich), and 13.14
g deionised water. Crown ether (18-crown-6, Aldrich) was used as an organic struc-
ture directing agent [82]. Sodium hydroxide solution was first added to deionised
water, followed by sodium aluminate and 18-crown-6. The solution was stirred for
an hour under ambient condition. Colloidal silica was then added and stirred vigor-
ously for another 30 minutes. The resulting gel was incubated for 24 hours at room
70

temperature, sealed into a 64 ml stainless steel autoclave, and placed into an oven
for 12 days at 110 ◦C. The as-synthesised zeolite was washed with deionised water
to remove excess crown ether. The sample was then dried in an oven for 24 hours at
120 ◦C. Calcination was done at 300 ◦C under vacuum for 6 hours using a tube finance
(Lenton) with the following program setting: ramp at 1 ◦C per minute from 20 ◦C to
300 ◦C with dwelling for two hours at 100 ◦C and 200 ◦C respectively, followed by a
2 ◦C per minute drop down to ambient condition.
Figure 5.1: Powder pattern of as-synthesised and calcined zeolite EMC-2.
The powder patterns of the as-synthesised zeolite EMC-2 before and after calci-
nation are shown in figure 5.1. The powder pattern of the calcined zeolite EMC-2
remained almost unchanged, compared to the sample before calcination. The hexag-
onal unit cell parameters of the as-synthesised and calcined zeolite EMC-2 are a =
17.761(4) A, c = 28.029(8) A, and a = 17.769(5) A, c = 28.010(8) A respectively,
which is close to each other, and very closed to the suggested value reported by the
71

“Database of Zeolite Structures” - a = 17.215 A, and c = 28.082 A. Elemental analy-
sis of the as-synthesised zeolite sample shows that there is 8 wt% of carbon, indicating
the presence of crown ether in the pores of the zeolite. However, after calcination, a
significant drop of carbon content is observed - only 0.11 wt% remains in the sample
suggesting a successful calcination.
Four Si local environments are observed in the 29Si MAS NMR spectrum of the
calcined sample (figure 5.2) [126]. Chemical shifts at -88.98 ppm, -94.38 ppm, -100.25
ppm, and -106.03 ppm can be assigned to the local Si(4Al), Si(3Al), Si(2Al), and
Si(1Al) environments respectively. The calculated Si/Al ratio is 1.89 (65.39% Si),
which is lower than the suggested 79% Si by Delprato et al. [82]. 27Al MAS
NMR shows only a single peak at 59.29 ppm indicating all aluminium atoms are
tetrahedrally-coordinated to Si atoms.
Figure 5.2: 29Si MAS NMR of calcined zeolite EMC-2.
The morphology of zeolite EMC-2 before and after calcination is shown in figure
72

5.3. It is synthesised as hexagonal plates. No change in morphology is observed before
and after calcination. Crystals are uniform in shape and approximately 2.5 µm in
size.
(a) (b)
(c)
Figure 5.3: SEM images of zeolite EMC-2: (a) as-synthesised, (b) close-up of the as-synthesisedsample, (c) calcined
5.2 Flexibility window in EMT zeolite framework
For the synthesis of zeolite EMC-2, crown ether (18-crown-6) is regarded as an es-
sential organic structure directing agent [82]. The center of the 18-crown-6 ether ring
can accommodate cations such as sodium and form the 18-crown-6/Na complex. It
is concluded that such a complex matches the geometry of the smaller supercages
present which leads to development of the EMT framework [49, 127]. In this section,
73

geometric simulation is used to study the flexibility window of the hexagonal EMT
framework in both its calcined (empty) and crown-ether containing (as-synthesised)
forms, and determine whether crown ether controls an extrinsic flexibility window in
EMT zeolite framework.
5.2.1 Preparation of EMT structure for geometricsimulation
The all-atom input structure comprises a single EMC-2 (EMT) unit cell in P1 symme-
try, using the coordinates obtained by Baerlocher et al. through Rietveld refinement
[48]. Each unit cell contains 96 tetrahedral units and the hexagonal unit cell param-
eters of the ambient structure are a,b = 17.37 A, c = 28.36 A. The framework was
modelled with T–O bond length of 1.63 A to reflect the presence of a small proportion
of aluminium in the structure. The results are not sensitive to the bond length: use
of a shorter bond length of 1.61 A, for pure silica, in this case slightly contracts the
window but does not change its shape or character. The steric radius of oxygen in
the framework, a key controlling parameter in the intrinsic flexibility window, was
set at 1.35 A as is conventional [119].
In the study of Baerlocher et al. [48], the as-synthesised crystal structure has
well-resolved 18-crown-6 ether molecules in the smaller t-wof cavities; in the crystallo-
graphic average structure, each cavity contains a superposition of two such molecules
with 50% occupancy. Since there is room in the cavity for only one molecule, its
orientation - facing up or facing down - is random. For the input structure in my
simulation, a single copy of the ether molecule was retained in each of the two t-wof
74

cavities in the unit cell, one in each of the two possible orientations. The bond lengths
and angles in the crown ether are taken from the input structure. Bonds are assigned
in GASP between the central Na ion and its three coordinating oxygens to maintain
the geometry of the complex. Since the hydrogen atoms in the CH2 groups of the
ether are not resolved, a suitable effective radius must be assigned to the carbon
atoms by considering the closest approach between an ether C and a framework O
atom in the crystal structure and this distance is 2.95 A. A radius of 1.60 A (C–O
contact distance - radius of O atom = 2.95 A - 1.35 A) is therefore assigned to the
ether carbons, so that the ether is just in contact with the framework initially. Ro-
tation is permitted around all C–C and C–O bonds in the molecule, and the ether is
not tethered to the framework so it is able to move and flex in response to changes
in the cage geometry.
The presence of crown ether is detectable in the larger t-wou cages. However, these
molecules are partially disordered and only some of the heavy atoms are resolved,
indicating both positional and orientational disorder. Given this disorder and the
larger size of the cavity, the modeling of crown ether molecules in the t-wou cages
was not attempted, but rather the disordered molecules were neglected, so as all
other water and sodium ions. This study therefore makes use of two input structures,
one with crown ether molecules present in the t-wof cavities, and one without any
extra-framework content which represents the empty framework.
75

5.2.2 The flexibility window of EMT framework
Figure 5.4: Extent of the flexibility window for the EMT framework during variation of the a andc parameters
Since EMT is a hexagonal structure, its flexibility window is defined by variations
of the two independent cell parameters, a(=b) and c. An initial investigation of the
intrinsic flexibility window in EMT framework comprised the exploration of uniaxial
variation of the parameters to an accuracy of 0.01 A. The a parameter can be ex-
panded slightly to 17.56 A, corresponding to a 2.15% increase in unit cell volume,
before the onset of extension in the Si–O bonds. In compression the parameter can
be reduced substantially to 16.07 A, reducing the initial ambient unit cell volume by
16.89%. For uniaxial variation along the c parameter, a similar trend is observed. The
parameter can be extended to 28.87 A, equivalent to a 1.78% expansion in unit cell
76

volume, compared to a 10.76% decrease in volume on compression to 25.31 A. These
limits, represented as solid, linear lines in figure 5.4 on the previous page, describe
the uniaxial confines of the intrinsic flexibility window for empty EMC-2.
Having established the preliminary limits to EMT framework flexibility, the next
step was to determine points lying along the perimeter of the flexibility window.
The results are depicted in figure 5.4 as dotted lines. The window has an almost
rectangular shape in the a, c plane, showing that there are substantial areas of phase
space within which the parameters can be independently varied. In detail, however,
the window has a strikingly nontrivial, “speech-bubble” shape, showing that at the
limits of compression, there are complex interactions between the mechanisms of
compression along different directions.
The next step was to carry out the same exploration of the flexibility window
with Na+/crown ether complexes present in the t-wof cages of the EMT framework.
The crown ether is a bulky molecule which effectively fills one side of the t-wof cage,
with the sodium ion and its coordinating ether oxygens lying in the mid-plane of the
cage. The structure with crown ethers present is shown in figure 5.5 on the following
page. As noted, the ether carbon radius was chosen so that the ether is already in
steric contact with the framework in the input structure. Therefore a substantial
contraction of the flexibility window would be expected when the ether OSDA was
included in the simulation. The result obtained is in fact entirely different: the
EMT framework with crown ethers included displays an identical flexibility window
to the empty framework. The window illustrated in figure 5.4 thus also applies to the
framework with ethers present. The ether molecule has sufficient geometric flexibility
77

that it can adapt to the contraction of the t-wof cage during the simulations, and the
flexibility window remains under the control of intrinsic framework factors. A striking
example of this adaptation is illustrated in figure 5.6 on the next page, which shows
the structure at the limit of compression of the c and a parameters. The cage itself
displays substantial compression, and the ether molecule is in steric contact with the
surrounding framework, yet the molecule can adapt to its surroundings so that it does
not limit the contraction of the framework, and the degree of steric overlap remains
on the order of 0.01 A or less.
Figure 5.5: EMT framework under ambient conditions showing the location of well-resolved crownether molecules in the t-wof cages
78

(a) (b)
Figure 5.6: (a) EMT framework at the limit of geometric compression of the a parameter; (b)EMT framework at the limit of geometric compression of the c parameter.
5.3 Chapter summary
Zeolite EMC-2 is synthesed using crown ether, 18-crown-6. The powder pattern of the
calcined form is identical to the as-synthesised zeolite sample. 29Si MAS NMR shows
four Si local environments, and all Al are tetrahedral-coordinated in the framework.
Hexagonal crystals are observed using SEM with an average size of 2.5 µm.
The geometric simulation reveals that the intrinsic flexibility window, by varying
the a and c parameters, is in a “speech-bubble” shape. No difference between ex-
trinsic and intrinsic flexibility window is observed when the simulation only includes
crown ether molecules in the t-wof cages; the ether molecule has sufficient geometric
flexibility which can adapt to the contraction of the t-wof cages.
79

Chapter 6
Framework flexibility of sodaliteunder pressure
In this chapter, I will first describe the preparation of two different forms of sodalite -
the hydroxy form and the sodium bromide form. High pressure experiments were done
using these two samples. The frameworks response differently to the compression
depending on the pressure transmitting media being used during the experiments.
Such behaviors can be explained by geometric simulation of four SOD frameworks
with various composition, which results will be present at the end of this chapter.
6.1 High-pressure experiment
Two different forms of sodalite were prepared before the high pressure experiment:
Na-sodalite (Na-SOD) with no OSDA and NaBr-sodalite (NaBr-SOD) with bro-
mide ion following recipes modified from Stem et al. [52], with batch composition
Al(OH)3:SiO2:5NaOH:41H2O and Al(OH)3:SiO2:12.5NaOH:7.5NaBr:144H2O respec-
tively. In the synthesis of Na-SOD, aluminium hydroxide and fumed silica were
dissolved separately in water with sodium hydroxide, and heated to 95 ◦C. The silica
solution and aluminium hydroxide solution were then mixed together and stirred vig-
80

orously for 5 minutes. The gel was put in an oven at 95 ◦C for 24 hours. The synthesis
of NaBr-SOD was the same as Na-SOD, e.g. temperature, reaction time, starting ma-
terial, but using sodium bromide as a template. The as-synthesised zeolites were then
dehydrated under vacuum to remove water.
Figure 6.1 shows the powder patterns of the as-synthesised Na-SOD and NaBr-
SOD zeolites. Both samples have no impurity, the only difference is that NaBr-SOD
has a bromine ion that sits inside the β-cage while Na-SOD is relatively empty.
Figure 6.1: Powder patterns of as-synthesised Na-sodalite (Blue) and NaBr-sodalite (Black).
High-pressure neutron diffraction experiments were carried out on PEARL beam-
line, ISIS (a time-of-flight neutron diffractometer with Paris-Edinburgh (PE) cell) to
obverse the response of framework under varying pressures. Ethanol/methanol mix-
ture and fluorinert (C6F14) were used as pressure transmitting media. Ethanol/methanol
mixture is a penetrating medium which enters the SOD framework while fluorinert re-
81

mains outside the framework and is a non-penetrating medium. A lead pellet inside
the gasket was used for pressure calibration. For the experiment with NaBr-SOD
using an ethanol/methanol mixture, 15 pressure points were measured from ambi-
ent pressure up to 6 GPa. For Na-SOD, 4 pressure points were measured using the
ethanol/methanol mixture, and 7 pressure points for fluorinert.
Figure 6.2: GSAS refinement of the experimental Na-SOD neutron diffraction data at pressure0.05GPa. Four phases are fitted here - Na-SOD (pink), lead (blue), alumina of the PE cell andgasket (black), and zirconia surrounding the gasket (brown). Pink arrow indicates the Na-SOD 211peak, the only peak which does not overlap with other phases.
General Structure Analysis System (GSAS) [128] was used to refine all high-
pressure data. Figure 6.2 is an example of the Na-SOD GSAS refinement at 0.05 GPa.
The neutron diffraction pattern consists of four different phases - Na-SOD (pink), lead
(blue), alumina of the PE cell and gasket (black), and zirconia surrounding the gasket
82

(brown). The Na-SOD 211 peak, labelled by the pink arrow, is the only peak that does
not overlap with any other phases. The actual pressure of the sample is calculated
using GSAS refinement of a lead pellet and the Birch-Murnaghan equation of state
(EOS) [129], as shown in equation 6.1, where P is the pressure (in GPa) experienced
by the sample. V0, B0 and B′0 are the volume, bulk modules, and its derivative at
ambient pressure, respectively.
P = 1.5B0
[(V
V0
)−7/5−(V
V0
)−5/3][1 + 0.75 (B′0 − 4)
((V
V0
)−2/3− 1
)](6.1)
The cell parameter and volume for NaBr-SOD decreases smoothly with pressure,
this can be seen from figure 6.3(a). Figure 6.4(a) shows the time-of-flight diffraction
data of NaBr-SOD under varying pressures. The 211 peak can be clearly seen up to
4 GPa. Above 4 GPa, this peak merges with the alumina peak. However, from the
powder pattern, it is observed that the zeolite remains crystalline at least up to 4
GPa.
The refined Na-SOD cell parameter under various pressures with methanol/ethanol
mixture and fluorinert at 0.05 GPa is 9.02 A and 9.10 A respectively (figure 6.3(b)).
The difference is due to the internal screening effect of polar molecules inside the
framework of Na-SOD. As a result, the framework of Na-SOD shrinks slightly in the
presence of the methanol/ethanol mixture, having a smaller cell parameter. It is
known that a methanol molecule is small enough to occupy a β-cage (chapter 4). The
cell parameter of Na-SOD (red triangles) decreases from 9.02 A at 0.05 GPa to 8.90 A
at 0.81 GPa, then flattens out. This behaviour is seen because after a certain pressure,
the methanol molecules in the β-cage act as scaffolding and the framework cannot
83

(a)
(b)
Figure 6.3: Cell parameters vs pressure. a) Cell parameter, a, against pressure of NaBr-SODwith methanol/ethanol mixture fitted to the Birch-Murnaghan equation of state (EOS); b) Cellparameter, a, against pressure of Na-SOD with methanol/ethanol mixture and fluorinert as pressuretransmitting media: green circles - with fluorinert, red triangles - with methanol/ethanol mixture.Error bars are not significant compared to the data presented.
84

(a)
(b)
(c)
Figure 6.4: Time-of-flight neutron diffraction data of: a) NaBr-SOD with methanol/ethanol mix-ture as pressure transmitting medium, b) Na-SOD with methanol/ethanol mixture, and c) Na-SODwith fluorinert, as pressure transmitting medium.
85

be compressed around it anymore without distortions. The experimental neutron
diffraction data is shown in figure 6.4(b).
A different picture is seen with fluorinert. Unlike the ethanol/methanol mixture,
fluorinert is a very bulky molecule that cannot enter the SOD framework. In figure
6.3(b), the cell parameter of Na-SOD (green dots) decreases from 9.10 A at 0.05 GPa
to 9.06 A at 0.55 GPa and there is a sudden drop between 0.6 and 0.8 GPa. After
0.8 GPa, the framework amorphises, since it is mostly empty without any scaffolding
molecules within the β-cage. This manifests in dramatic change in the cell parameter
and loss in the intensity of most diffraction peaks can be seen in figure 6.4(c).
6.2 Geometric simulation on sodalite
6.2.1 Preparation of sodalite structure for geometricsimulation
The input structure of sodalite for geometric simulation is very similar to siliceous
zeolite Y in chapter 4 and EMC-2 in chapter 5. In this case, a single unit cell of SOD
framework consists of 12 tetrahedral units (12 Si or Al, and 24 framework oxygen
atoms) in P1 symmetry. The structure is modeled with fixed cell parameters and
periodic boundary conditions. Inter-atomic bonding in the SiO4 unit is represented
using a tetrahedral template with a Si-O bond length of 1.61 A. The simulation
contains Al tetrahedral units, where the inter-atomic Al–O bond length is set to be
1.75 A. Framework oxygen atoms, extra framework sodium and bromide ions are
assigned a steric radius of 1.35 A, 1.02 A, and 1.94 A respectively.
Several different simulations were done and a summary is shown in figure 6.5. Se-
86

(a) (b) (c) (d)
Figure 6.5: Different simulations with SOD frameworks. a) Empty framework with only SiO4
tetrahedra, b) empty ordered Si/Al = 50/50 framework, c) Na-SOD framework with Na as yellowspheres, and d) NaBr-SOD framework with Br in brown, and Na ions in yellow. SiO4 tetrahedralunit is shown in blue and AlO4 tetrahedra in cyan.
ries 1 (figure 6.5(a)) is a simulation of a hypothetical empty siliceous SOD framework
in which all polyhedra are identical and have the Si–O bond length. The simulation
cell contains 12 Si atoms and 24 vertex oxygen atoms. In this case, a range of cell
parameters is explored for the cubic unit cell, so as to determine the theoretical width
of the flexibility window. Series 2 (figure 6.5(b)) is a simulation of an empty ordered
Si/Al SOD framework in which alternate neighboring polyhedra have Si–O and Al–O
bond lengths. The simulation cell contains 6 Si atoms, 6 Al atoms, and 24 vertex
oxygen atoms. This simulation is intended to represent the case where the polyhedra
of the ordered framework can rotate freely without steric hindrance from the frame-
work contents. Series 3 (figure 6.5(c)) is an ordered framework with sodium atoms.
In this series, the simulation is an ordered Si/Al framework with 8 Na atoms in the
β-cage. This exceeded the experimental number of Na atoms, which was 6, but since
it was hard to refine the precise position of all Na atoms, an excess number was used.
Series 4 (figure 6.5(d)) is a simulation of an ordered Si/Al SOD framework in which
sodium and bromine channel contents are explicitly present as spheres. In simulations
87

containing AlO4 tetrahedral units, another set of simulation was run. Instead of a
rigid tetrahedral AlO4 template, a “softer” AlO4 unit is used by setting the internal
O–Al–O bond angle free.
6.2.2 The flexibility window of sodalite
Firstly, a simulation is done to locate the flexibility window of the SOD framework in
the hypothetical siliceous form, as shown in figure 6.6. As expected, the framework
displays a broad flexibility window. The most expanded end of the flexibility window
lies at a = 8.98 A; further expansion above this limit causes over-extension of Si–
O bonds. As the a parameter is reduced to compress the unit cell, steric contacts
between codimeric oxygens first occur at a = 7.35 A, and distortion of the tetrahedra
becomes inevitable on compression below a = 6.50 A.
Figure 6.6: Flexibility window of SOD framework in the hypothetical siliceous form (triangles)and the fully ordered Si/Al form (circles) with Al centered tetrahedra geometry.
88

Figure 6.7: Flexibility window of a fully ordered Si/Al SOD framework with sodium ions (triangles)and sodium bromide (squares) with Al centered tetrahedra geometry.
In the cubic SOD framework, every tetrahedral centre lies on a face of the unit
cell. The folding mechanism during isotropic compression of the cell involves counter-
rotation of adjacent tetrahedra; each tetrahedron rotates in-plane, that is, the axis of
rotation for each tetrahedron is perpendicular to the unit cell face. The magnitude
of tetrahedral rotation, measured relative to the maximally expanded structure at
a = 8.98 A, is shown in figure 6.8 on the next page. The tetrahedral rotation is a
whole-body measure, calculated by superposing corresponding tetrahedra and finding
the best-fit rotation which minimises their mismatch.
Having obtained these data for the hypothetical siliceous SOD framework, the next
step is to examine the fully ordered Si/Al SOD framework, distinguishing between Al-
and Si-centred tetrahedral units. It is found that this introduction of two differently
sized tetrahedra causes intrinsic strain in the framework at all densities. A window
89

Figure 6.8: RMS rotation of Si tetrahedral units in hypothetical siliceous SOD framework
Figure 6.9: RMS rotation of Si and Al tetrahedral units in fully ordered Si/Al SOD framework
90

can still be defined, distinguishing a central low-strain region from high-strain regions
in compression and extension, as illustrated in figure 6.6 on page 88. Within the
low-strain region, the strain decreases linearly as the a parameter increases, and is
minimised by expansion to a = 9.37 A. The folding mechanism, of in-plane counter-
rotations of adjacent tetrahedra, retains the same character as in the hypothetical
siliceous SOD framework; however, the magnitude of the rotation is greater for the
Si tetrahedra than for the Al tetrahedra, in inverse proportion to their bond lengths,
as shown in figure 6.9 on the previous page.
The point of maximum expansion for the fully ordered Si/Al SOD framework
lies at a considerably lower density (larger a parameter) than the expanded limit of
the pure-silica hypothetical window. This is because Al tetrahedral units are slightly
bigger in size compared to Si tetrahedral units, and they are negatively charged which
can interact with the extra framework contents such as counter-balancing sodium ions.
The flexibility window of a fully ordered Si/Al SOD framework with 8 Na+, as shown
in figure 6.7 on page 89, is identical to the empty fully ordered Si/Al SOD framework,
with the most expanded end at 9.37 A and the most compressed end at 7.67 A. When
bromide ion is included in the framework (figure 6.7), the flexibility window at the
low density end remains unchanged, but is narrowed at the most compressed end to
8.75 A.
A further step is to reflect the “softer” character of bonding at an Al centred tetra-
hedron by relaxing the requirement of strict tetrahedral geometry. This is achieved
in the simulation using ‘bar’ constraints, which require the same Al–O bond length
of 1.75 A, but do not limit the O–Al–O angle. Since the O vertices in an AlO4
91

unit lie further apart than the O–O contact distance of 2.70 A, this permits some
variation of the AlO4 geometry. With this approach, ordered Si/Al centered tetrahe-
dra SOD frameworks display a true flexibility window analogous to that defined for
the siliceous systems, as shown in figure 6.10. The limits of this window correspond
closely to those defined for the fully tetrahedral case discussed above, with the most
expanded end at a = 9.37 A, and the most compressed end at a = 7.70 A.
Figure 6.10: Flexibility window of bar-constrained fully ordered Si/Al SOD framework
After simulating the hypothetical siliceous SOD framework and fully ordered Si/Al
SOD framework with/without Al tetrahedral bonding geometry, simulation then fo-
cuses on the presence of extra framework contents which may affect the flexibility of
the SOD framework. It starts by populating a “bar” constrained, fully ordered Si/Al
framework with 8 sodium ions in the β-cage. The flexibility window is identical to
92

the empty fully ordered Si/Al framework (see figure 6.11). The inclusion of 8 sodium
ions does not hinder the rotations of Si/Al tetrahedra (see figure 6.12 on the following
page).
Figure 6.11: Flexibility window of bar-constrained fully ordered Si/Al framework with sodiumions (triangles), and with sodium bromide (squares)
When populating the framework with sodium ions as well as bromide ions, the
point of maximum expansion is found at a = 9.37 A, which is identical to the
framework with the presence of sodium only (see figure 6.11). However, the most
compressed end of the flexibility window lies at 9.00 A. Further compression of the
framework leads to a significant increase of framework distortion, and beyond 8.20 A,
distortion of the tetrahedra becomes inevitable. Figure 6.13 on the next page shows
the RMS rotation of bar-constrained, fully ordered Si/Al SOD framework with NaBr.
A much shorter range of tetrahedral rotation is observed which is consistent with the
flexibility window.
93

Figure 6.12: RMS rotation of bar-constrained, fully ordered Si/Al SOD framework with 8 sodiumatoms in beta-cage
Figure 6.13: RMS rotation of bar-constrained, fully ordered Si/Al SOD framework with sodiumand bromide ions
94

Figure 6.14: Total clash2 of empty (circle), sodium (triangle), and sodium bromide (square),bar-constrained, fully ordered Si/Al SOD framework.
When bulky bromide ions are present in the SOD framework, an “extrinsic” flex-
ibility window is observed. It is similar to the case when methanol molecules occupy
the β-cages of zeolite Y mentioned in chapter 4. The bromide ion restricts the rotation
of the tetrahedral units and the framework is extremely stressed even under moderate
compression. With the presence of extra framework contents, steric contacts involving
Br−, Na+, and framework O spheres are inevitable. Instead of measuring individual
contacts, the “total clash2” is used to measure the sum of all steric contacts involved.
Figure 6.14 shows the “total clash2” of empty, Na+, and NaBr bar-constrained, fully
ordered Si/Al SOD framework. With no extra framework contents, no clash is ob-
served below a = 7.85 A. Clashes between framework oxygen start to build up around
a = 7.75 A. With presence of 8 Na+, clashes between framework oxygen is first ob-
95

served at a = 8.90 A, together with extra-framework Na+ clashes at a = 7.94 A and
above. When the framework contains Na+ and Br−, steric clashes become significant
even at a = 8.78 A. Given the very substantial size of the Br−, it limits the capac-
ity of the framework polyhedra to rotate, and distortions of the polyhedra become
unavoidable.
The results of the geometric simulation can be used to explain some observa-
tions of the high pressure experiments. In the experiment of NaBr-SOD using the
methanol/ethanol solution as a pressure transmitting medium, the maximum ex-
panded experimental ambient cell parameter is 8.94 A, which is located towards
to the most extended edge of the simulated flexibility window of the tetrahedral-
constrained, fully ordered Si/Al framework with NaBr at 9.37 A. This once again
shows that zeolites at ambient condition tend to be maximumly extended. However,
the highest experimental pressure point is 6.25 GPa, which is equivalent to a = 8.62
A. Compare to the most compressed end of the simulated flexibility window which
is 8.75 A, the framework at 6.25 GPa is already stressed and being push out of the
flexibility window. This can explain the loss of intensity of the sodalite 211 peak in
figure 6.4(a) above 4.01 GPa.
In the pressure experiment of Na-SOD using methanol/ethanol solution as pres-
sure transmitting medium, loss of intensity of the sodalite 211 peak is observed at
pressure above 0.81 GPa in figure 6.4(b). This is equivalent to a = 8.90 A. The intrin-
sic flexibility window from the geometric simulation of the tetrahedral-constrained,
fully ordered Si/Al framework with 8 Na+ is between 9.37 A (the most extended
end) and 7.95 A (the most compressed end). This implies that the experimental
96

cell parameter can be compressed beyond a = 8.90 A in theory. The difference be-
tween geometric simulated and experimental cell parameters can be explained by the
“extrinsic flexibility window”. Such window is controlled by the extra framework
content present in the framework; in this case, the methanol molecule from the pres-
sure transmitting medium. It is already shown in chapter 4 that methanol molecules
can occupy the β-cage. It acts as scaffolding molecules to avoid further collapse of
the structure, however, by doing this, it also increases the stress experienced by the
framework. This is exactly what is being observed from the high pressure experiment
- the framework remains in its flexibility window, but cannot be compressed further.
A similar result is observed when Na-SOD is compressed using fluorinert as pres-
sure transmitting medium. The highest experimental pressure point is 1.086 GPa,
equivalent to a = 8.99 A, which is quite a distance away from the most compressed end
of the simulated flexibility window with a = 7.95 A. Unlike the methanol molecules
which have a scaffolding effect, fluorinert is a non penetrating transmitting medium.
It compressed the framework directly with increasing pressure. Since the framework
is relatively empty with the absence of bulky extra framework contents, the effect is
dramatic. The framework starts to lose its structure at 0.55 GPa (figure 6.4(c)), and
the cell parameter remains at a = 8.99 A to the maximum compression point at 1.086
GPa.
6.3 Chapter summary
High pressure experiments were done using two different forms of sodalite - one con-
tains only Na+, another with Na+ as well as Br−. The frameworks respond differently
97

when methanol/ethanol mixture was used as a pressure transmitting medium. Col-
lapse of framework structure is observed in Na-sodalite even at small compressions.
At high pressure, there is no change in cell parameter due to the scaffolding effect
of the penetrating methanol molecules, although the framework remains in its flexi-
bility window, and in theory can be compressed further. Increase in stress in terms
of distortion and rotation of framework tetrahedral units is observed from the ge-
ometric simulation. However, NaBr-sodalite retains its crystallinity along a wider
pressure range. Although the methanol molecules cannot penetrate the framework,
the Br− acts as the scaffolding species in this case and supports the framework against
pressure. However, under high pressure, the framework is being pushed out of its flex-
ibility window since it cannot accommodate the stress due to distortion of framework
tetrahedral units when framework oxygen atoms start clashing. The experiment of
Na-sodalite using fluorinert as pressure transmitting medium is an example to show
that the framework cannot hold its structure without any scaffolding species, even
when it remains in its flexibility window. The “extrinsic flexibility window” is thus
defined, and is controlled by the extra framework contents.
98

Chapter 7
Conclusion & Future works
The synthesis of zeolite materials without the use of organic structure directing agents
requires precise control of synthesis conditions. Syntheses of zeolite A, sodalite and
Linde Type N zeolites using hydrothermal and microwave methods have been stud-
ied here in depth in order to find new future synthesis methods. Zeolite A can be
synthesised at a temperature as low as 40 ◦C hydrothermally, and with increasing tem-
perature, a transformation to sodalite is observed. Such transformation is explained
by the difference in framework density - sodalite is denser compared to zeolite A, so
can be synthesised at a higher temperature. The use of microwave methods for zeolite
synthesis has reduced the reaction time dramatically, and yet pure zeolite phase can
still be achieved by precise control of reaction conditions which can be seen from the
sodalite microwave synthesis experiments. It is surprising that, by simply changing
the method of crystallization, a new method of synthesising Linde Type N zeolite is
found and was reported in this study.
Geometric simulation is used to study the maximum number of water/methanol
guest molecules occupying the β-cage of siliceous zeolite Y. It is found that a maxi-
mum number of two water molecules and one methanol molecule can simultaneously
99

occupy the β-cage while the framework structure remains in its flexibility window, i.e.
undeformed. The extra framework content of a zeolite framework can have a signifi-
cant effect to the flexibility window. Methanol molecules penetrating the framework
of siliceous zeolite Y under certain pressure have a scaffolding effect which increase the
stress experienced by the framework and thus reduce its flexibility window. The same
result is observed when NaBr-sodalite is under pressure with methanol/ethanol mix-
ture. These lead to the discovery of the newly defined “extrinsic“ flexibility window
of zeolite frameworks which is governed by the extra framework contents. However,
an exception is observed in the case of zeolite EMC-2. The ether molecule occupies
the t-wof cages, having no effect on the flexibility window and does not limit the con-
traction of the framework since crown ether has sufficient geometric flexibility that it
can adapt to the contraction of the t-wof cage.
One of the aims in zeolite science is to synthesise new zeolite framework with
useful applications. To achieve this, the knowledge of synthesis conditions which
control different zeolite phase is essential. This study already showed that merely
changing the synthesis conditions can control the formation of LTA, SOD, and LTN
frameworks which sharing a common building unit, the β-cage. These frameworks
are only a very small fraction of the existing frameworks being synthesised in the
laboratory. It would be interesting to see if similar frameworks relationship existed
by doing a systematic study on all existing synthetic zeolite frameworks.
Structural changes of zeolite frameworks under compression depend on their frame-
work building units and the extra-framework contents. Although this study only
focused on three different zeolite under compression, significant differences in frame-
100

works response to the pressure transmitting media and the extra-framework contents
were observed. High pressure experiments can apply to all synthetic zeolite frame-
works. The change of channel shape and size under pressure may affect the property
of zeolites in molecules seperation and catalytic reactions, and lead to discovery of
new application. Apart from zeolite materials, high pressure studies can also apply to
metal-organic frameworks (MOFs), zeotypes such as aluminum phosphate materials
(AlPOs), as well as hybrid zeolite-like metal-organic frameworks. These frameworks
may behave differently under pressure compared to inorganic zeolite materials.
101

Appendices
102

Appendix A
The Bragg’s equation
Figure A.1: Graphical representation of Bragg’s Law
The path difference of the two reflected ray from two different lattice plane is:
(AB +BC) − AD (A.1)
For constructive interference to happen, the path difference must equal to any
whole number of the wavelength. Therefore:
(AB +BC) − AD = nλ (A.2)
103

Since:
AB = BC =d
sinθ(A.3)
AC =2d
tanθ(A.4)
Then:
AD = (AC)cosθ =2d
tanθcosθ =
(2d
sinθcosθ
)cosθ =
2d
sinθcos2θ (A.5)
Thus, substitute the corresponding formula to equation B.2:
nλ =d
sinθ+
d
sinθ− 2d
sinθcos2θ =
2d
sinθ
(1 − cos2θ
)=
2d
sinθsin2θ = 2dsinθ (A.6)
which is the Bragg’s equation.
104

Appendix B
Additional information for Chapter3, Section 3.2
The microwave syntheses in this section are preliminary works to see if single phase
Na-SOD can be made using the “CEM Mars 6” microwave reactor, and to find out the
optimum synthesis condition. The aim is to make a single phase Na-SOD sample to
be used in the high pressure experiment mentioned in chapter 6. It is recommended
that precise comparisons should not be made using the data presented in this section,
but rather as a reference, mainly because of the presence of multiple variables between
experiments and the uncertainties with the microwave reactor.
For those who are planning to replicate the microwave syntheses in this section for
precise comparisons, it is recommended to repeat each of the syntheses at least three
times (no repeat was done for the data already presented in this section). Moreover,
the conditions of microwave syntheses should be altered slightly, for example, condi-
tion 1 - 20 mins, 150 ◦C, condition 2 - 20 mins, 75 ◦C, condition 3 - 120 mins, 150 ◦C.
The batch composition of recipe 3 should be kept the same as recipe 1 and recipe 2.
It is also important not to fill the container more than 50 % of its total volume.
105

Appendix C
Synthesis of LTA, SOD, and LTNframework zeolites with no organicstructure directing agent
C.1 X-ray powder diffraction
Figure C.1: Powder pattern of as-synthesised Linde Type N zeolite samples using fumed silica.(a) 60 ◦C (b) 90 ◦C
106

C.2 Hydrothermal synthesis of zeolite A with no
OSDAs
C.2.1 29Si SS MAS NMR
(a) (b)
(c) (d)
(e) (f)
Figure C.2: As-synthesised zeolite samples with no OSDAs at (a) 40 ◦C (b) 50 ◦C (c) 60 ◦C (d)70 ◦C (e) 80 ◦C for 1 hour, (f) 95 ◦C for 2 hours
107

C.2.2 29Si CP MAS NMR
(a) (b)
(c) (d)
(e) (f)
Figure C.3: As-synthesised zeolite samples with no OSDAs at (a) 40 ◦C (b) 50 ◦C (c) 60 ◦C (d)70 ◦C (e) 80 ◦C for 1 hour, (f) 95 ◦C for 2 hours, red - signal of 29Si MAS NMR, blue - signal of 29SiCP MAS NMR, black - difference between two signals
108

C.2.3 27Al SS MAS NMR
(a) (b)
(c) (d)
(e) (f)
Figure C.4: As-synthesised zeolite samples with no OSDAs at (a) 40 ◦C (b) 50 ◦C (c) 60 ◦C (d)70 ◦C (e) 80 ◦C for 1 hour, (f) 95 ◦C for 2 hours
109

C.2.4 23Na SS MAS NMR
(a) (b)
(c) (d)
(e) (f)
Figure C.5: As-synthesised zeolite samples with no OSDAs at (a) 40 ◦C, (b) 50 ◦C, (c) 60 ◦C, (d)70 ◦C, (e) 80 ◦C for 1 hour, and (f) 95 ◦C for 2 hours
110

C.3 Microwave & hydrothermal synthesis of
Linde Type N zeolite with no OSDAs
C.3.1 SS MAS NMR
Micorwave Linde Type N Hydrothermal Linde Type N
29Si 29Si(a) (b)
27Al 27Al(c) (d)
23Na 23Na(e) (f)
Figure C.6: SS MAS NMR spectra of as-synthesised zeolite sample with no OSDAs. Column left:Microwave synthesis. Column right: Hydrothermal synthesis.
111

Bibliography
[1] A. F. Cronstedt, “Observation and description of an unknown kind of rock to be
named zeolites,” Kongl Vetenskaps Academiens Handlingar Stockholm, vol. 17,
pp. 120–123, 1756.
[2] M. A. Camblor, “The synthetic zeolites as geoinspired materials,” Macla, vol. 6,
pp. 19–22, 2006.
[3] D. W. Breck, Zeolite Molecular sieves. Robert E. Krieger Publishing Company,
Malabar, FL, USA, 1984.
[4] A. Dyer, An Introduction to Zeolite Molecular Sieves. John Wiley & Sons Ltd,
Chichester, 1988.
[5] C. Baerlocher, L. B. McCusker, and D. H. Olson, Atlas of zeolite framework
types. Oxford: Elsevier B. V., 6th ed., 2007.
[6] A. Sartbaeva, S. A. Wells, M. M. J. Treacy, and M. F. Thorpe, “The flexibility
window in zeolites,” Nature Materials, vol. 5, no. 12, pp. 962–965, 2006.
[7] A. Sartbaeva, G. D. Gatta, and S. A. Wells, “Flexibility window controls
pressure-induced phase transition in analcime,” EPL, vol. 83, no. 26002, pp. 1–
5, 2008.
[8] A. Nearchou and A. Sartbaeva, “Influence of alkali metal cations on the for-
112

mation of zeolites under hydrothermal conditions with no organic structure
directing agents,” Cryst. Eng. Comm., vol. 17, no. 12, pp. 2496–2503, 2015.
[9] M. M. J. Treacy, I. Rivin, E. Balkovsky, K. H. Randall, and M. D. Foster,
“Enumeration of periodic tetrahedral frameworks. II. Polynodal graphs,” Mi-
croporous and Mesoporous Materials, vol. 74, no. 1–3, pp. 121–132, 2004.
[10] C. S. Cundy and P. A. Cox, “The hydrothermal synthesis of zeolites: Pre-
cursors, intermediates and reaction mechanism,” Microporous and Mesoporous
Materials, vol. 82, no. 1–2, pp. 1–78, 2005.
[11] V. Gabova, J. Dedecek, and J. Cejka, “Control of Al distribution in ZSM-5 by
conditions of zeolite synthesis,” Chem. Commun., vol. 10, pp. 1196–1197, 2003.
[12] M. A. Camblor, A. Mifsud, and J. Perezpariente, “Influence of the synthesis
conditions on the crystallization of zeolite Beta,” Zeolites, vol. 11, pp. 792–797,
1991.
[13] E. I. Basaldella, A. Kikot, and J. C. Tara, “Effect of Pellet Pore-Size and
Synthesis Conditions in the in-Situ Synthesis of Low-Silica X-Zeolite,” Ind.
Eng. Chem. Res., vol. 34, pp. 2990–2992, 1995.
[14] R. I. Walton, F. Millange, D. O’Hare, A. T. Davies, G. Sankar, and C. R. A. Cat-
low, “An in situ energy-dispersive X-ray diffraction study of the hydrothermal
crystallization of zeolite A. 1. Influence of reaction conditions and transforma-
tion into sodalite,” J. Phys. Chem. B, vol. 105, pp. 83–90, 2001.
[15] P. A. Barrett, M. J. Diaz-Cabanas, M. A. Camblor, and R. H. Jones, “Synthesis
in fluoride and hydroxide media and structure of the extra-large pore pure silica
zeolite CIT-5,” J. Chem. Soc., Faraday Trans., vol. 94, no. 16, pp. 2475–2481,
113

1998.
[16] B. DeWitte, J. Patarin, and T. Cholley, “Crown-ether mediated synthesis of
FAU- and EMT-type zeolites in the presence of phosphate anions: study of the
incorporation of gallium,” Microporous Materials, vol. 10, pp. 189–198, 1997.
[17] R. Mostowicz, F. Testa, F. Crea, R. Aiello, A. Fonseca, and J. B. Nagy, “Synthe-
sis of zeolite Beta in presence of fluorides: Influence of alkali cations,” Zeolites,
vol. 18, pp. 308–324, 1997.
[18] M. Sasidharan and R. Kumar, “Effect of various inorganic cations (Li, Na, K
and Cs) and silica sources on the synthesis of the silica analogue of zeolite
NCL-1 (Si-NCL- 1),” Microporous Materials, vol. 8, pp. 43–47, 1997.
[19] D. Y. Zhao, R. Szostak, and L. Kevan, “Role of alkali-metal cations and seeds
in the synthesis of silica-rich heulandite-type zeolites,” J. Mater. Chem., vol. 8,
pp. 233–239, 1998.
[20] I. Guray, J. Warzywoda, N. Bac, and A. Sacco, “Synthesis of zeolite MCM-22
under rotating and static conditions,” Microporous and Mesoporous Materials,
vol. 31, pp. 241–251, 1999.
[21] M. Maldonado, M. D. Oleksiak, S. Chinta, and J. D. Rimer, “Controlling Crys-
tal Polymorphism in Organic-Free Synthesis of Na-Zeolites,” J. Am. Chem.
Soc., vol. 135, pp. 2641–2652, 2013.
[22] G. A. Tompsett, W. C. Conner, and K. S. Yngvesson, “Microwave Synthesis of
Nanoporous Materials,” ChemPhyChem, vol. 7, pp. 296–319, 2006.
[23] L. Bonaccorsi and E. Proverbio, “Influence of process parameters in microwave
continuous synthesis of zeolite LTA,” Microporous and Mesoporous Materials,
114

vol. 112, pp. 481–493, 2008.
[24] H. Katsuki, S. Furuta, and S. Komarneni, “Microwave Versus Conventional-
Hydrothermal Synthesis of NaY Zeolite,” Journal of Porous Materials, vol. 8,
pp. 5–12, 2001.
[25] C. S. Cundy, “Microwave Techniques in the Synthesis and Modification of Zeo-
lite Catalysts. A Review,” Collect. Czech. Chem. Commun., vol. 63, pp. 1699–
1723, 1998.
[26] W. C. Conner, G. Tompsett, K. Lee, and K. S. Yngvesson, “Microwave Synthe-
sis of Zeolites: 1. Reactor Engineering,” J. Phys. Chem. B, vol. 108, pp. 13913–
13920, 2004.
[27] B. Panzarella, G. A. Tompsett, K. S. Yngvesson, and W. C. Conner, “Microwave
Synthesis of Zeolites. 2. Effect of Vessel Size, Precursor Volume, and Irradiation
Method,” J. Phys. Chem. B, vol. 111, pp. 12657–12667, 2007.
[28] M. Gharibeh, G. A. Tompsett, K. S. Yngvesson, and W. C. Conner, “Microwave
Synthesis of Zeolites: Effect of Power Delivery,” J. Phys. Chem. B, vol. 113,
pp. 8930–8940, 2009.
[29] M. Gharibeh, G. Tompsett, F. Lu, S. M. Auerbach, K. S. Yngvesson, and W. C.
Conner, “Temperature Distributions within Zeolite Precursor Solutions in the
Presence of Microwaves,” J. Phys. Chem. B, vol. 113, pp. 12506–12520, 2009.
[30] J. Cejka, H. V. Bekkum, A. Corma, and F. Schuth, Introduction to zeolite
science and practice. Elsevier, Amsterdam, 2007.
[31] S. Kulprathipanja, Zeolites in industrial separation and catalysis. Wiley, Great
Britain, 6th ed., 2010.
115

[32] J. Weitkamp and L. Puppe, Catalysis and zeolites, fundamentals and applica-
tions. Springer-Verlag, Berlin, 1999.
[33] T. Isoda, K. Kusakabe, S. Morooka, and I. Mochida, “Reactivity and selectivity
for the hydrocracking of vacuum gas oil over metal-loaded and dealuminated
Y-zeolites,” Energy & Fuels, vol. 12, no. 3, pp. 493–502, 1998.
[34] J. C. White, P. K. Dutta, K. Shqau, and H. Verweij, “Synthesis of Ultrathin
Zeolite Y Membranes and their Application for Separation of Carbon Dioxide
and Nitrogen Gases,” Langmuir, vol. 26, no. 12, pp. 10287–10293, 2010.
[35] R. Shah, M. C. Payne, and J. D. Gale, “Acid-Base Catalysis in Zeolites
from First Principles,” International Journal of Quantum Chemistry, vol. 61,
pp. 393–398, 1997.
[36] G. B. Kauffman, “The Brønsted-Lowry Acid-Base Concept,” Journal of Chem-
ical Education, vol. 65, no. 1, pp. 28–31, 1988.
[37] Q. J. Zhu, J. N. Kondo, R. Ohnuma, Y. Kubota, M. Yamaguchi, and T. Tat-
sumi, “The study of methanol-to-olefin over proton type aluminosilicate CHA
zeolites,” Microporous and Mesoporous Materials, vol. 112, pp. 153–161, 2008.
[38] F. Bleken, M. Bjørgen, L. Palumbo, S. Bordiga, S. Svelle, K. P. Lillerud, and
U. Olsbye, “The Effect of Acid Strength on the Conversion of Methanol to
Olefins Over Acidic Microporous Catalysts with the CHA Topology,” Top Catal,
vol. 52, pp. 218–228, 2009.
[39] G. L. Woolery, G. H. Kuehl, H. C. Timken, A. W. Chester, and J. C. Vartuli,
“On the nature of framework Brønsted and Lewis acid sites in ZSM-5,” Zeolites,
vol. 19, pp. 288–296, 1997.
116

[40] T. Kubota, S. Fukutani, T. Ohta, and Y. Mahara, “Removal of radioactive
cesium, strontium, and iodine from natural waters using bentonite, zeolite, and
activated carbon,” J Radioanal Nucl Chem, vol. 296, no. 2, pp. 981–984, 2013.
[41] F. K. Sutili, N. Miotto, E. Rigoti, S. B. C. Pergher, and F. G. Penha, “Appli-
cation of synthetic zeolites as builder in detergent formulation,” Quimica Nova,
vol. 32, no. 4, pp. 879–883, 2009.
[42] R. Levanmao, N. T. Vu, S. Y. Xiao, and A. Ramsaran, “Modified Zeolites for
the Removal of Calcium and Magnesium from Hard Water,” J. Mater. Chem.,
vol. 4, no. 7, pp. 1143–1147, 1994.
[43] M. G. Rimoli, M. R. Rabaioli, D. Melisi, A. Curcio, S. Mondello, R. Mirabelli,
and E. Abignente, “Synthetic zeolites as a new tool for drug delivery,” J.
Biomed. Mater. Res. Part A, vol. 87A, pp. 156–164, 2008.
[44] A. Sartbaeva, J. Haines, O. Cambon, M. Santoro, F. Gorelli, C. Levelut, G. Gar-
barino, and S. A. Wells, “Flexibility windows and compression of monoclinic
and orthorhombic silicalites,” Physics Review B, vol. 85, no. 064109, pp. 1–5,
2012.
[45] G. D. Gatta and Y. Lee, “Zeolites at high pressure: A review,” Mineralogical
Magazine, vol. 78, no. 2, pp. 267–291, 2014.
[46] H. Liu, R. A. Secco, and Y. Huang, “Pressure-induced amorphization of hy-
drated Na-X zeolite,” PhysChemComm, vol. 4, pp. 37–39, 2001.
[47] H. S. Sherry and H. F. Walton, “The ion-exchange properties of zeolites. II.
Ion exchange in the synthetic zeolite Linde 4A,” J. Phys. Chem., vol. 71, no. 5,
pp. 1457–1465, 1967.
117

[48] C. Baerlocher, L. B. McCusker, and R. Chiappetta, “Location of the 18-
crown-6 template in EMC-2 (EMT) Rietveld refinement of the calcined and
as-synthesized forms,” Microporous Materials, vol. 2, pp. 269–280, 1994.
[49] S. L. Burkett and M. E. Davis, “Structure-directing effects in the crown ether-
mediated syntheses of FAU and EMT zeolites,” Microporous Materials, vol. 1,
no. 4, pp. 265–282, 1993.
[50] R. M. Milton, “Molecular sieve science and technology - a historical perspec-
tive,” ACS Symp. Ser., vol. 398, pp. 1–10, 1989.
[51] J. W. Earley and I. H. Milne, “Manufacture of synthetic sodalite,” United States
Patent 2911285, pp. 1–3, 1959.
[52] A. Stein, G. A. Ozin, P. M. Macdonald, G. D. Stucky, and R. Jelinek, “Silver,
Sodium Halosodalites: Class A Sodalites,” J. Am. Chem. Soc., vol. 114, no. 13,
pp. 5171–5186, 1992.
[53] A. Stein, G. A. Ozin, and G. D. Stucky, “Class B Sodalites: Nonstoichiometric
Silver, Sodium Halosodalites,” J. Am. Chem. Soc., vol. 114, no. 21, pp. 8119–
8129, 1992.
[54] T. Koyama, “Method to synthesize dense crystallized sodalite pellet for immo-
bilizing halide salt radioactive waste,” United States Patent 5340506, pp. 1–5,
1994.
[55] T. Shiraki, T. Wakihara, M. Sadakata, M. Yoshimura, and T. Okubo,
“Millimeter-sized sodalite single crystals grown under high-temperature, high-
pressure hydrothermal conditions,” Microporous and Mesoporous Materials,
vol. 42, pp. 229–234, 2001.
118

[56] C. M. Braunbarth, P. Behrens, J. Felsche, G. vandeGoor, G. Wilder-
muth, and G. Engelhardt, “Synthesis and characterization of two new sil-
ica sodalites containing ethanolamine or ethylenediamine as guest species:
[C2H7NO](2)[Si6O12](2) and [C2H8N2](2)[Si6O12](2),” Zeolites, vol. 16,
pp. 207–217, 1996.
[57] W. Fan, K. Morozumi, R. Kimura, T. Yokoi, and T. Okubo, “Synthesis of
nanometer-sized sodalite without adding organic additives,” Langmuir, vol. 24,
pp. 6952–6958, 2008.
[58] A. Julbe, J. Motuzas, F. Cazevielle, G. Volle, and C. Guizard, “Synthesis of
sodalite/alpha Al2O3 composite membranes by microwave heating,” Separation
and Purification Technology, vol. 32, pp. 139–149, 2003.
[59] R. M. Milton, “Molecular sieve adsorbents,” United States Patent 2882243,
pp. 1–12, 1959.
[60] R. M. Barrer and P. J. Denny, “Hydrothermal chemistry of the silicates. 9.
Nitrogenous aluminosilicates,” J. Chem. Soc., pp. 971–982, 1961.
[61] G. T. Kerr and G. T. Kokotail, “Sodium zeolite ZK-4, a new synthetic crys-
talline aluminosilicate,” J. Am. Chem. Soc., vol. 83, no. 22, p. 4675, 1961.
[62] G. T. Kerr, “Chemistry of crystalline aluminosilicates. 2. Synthesis and prop-
erties of zeolite ZK-4,” Inorg. Chem., vol. 5, no. 9, pp. 1537–1539, 1966.
[63] B. Bayati, A. A. Babaluo, and R. Karimi, “Hydrothermal synthesis of nanos-
tructure NaA zeolite: The effect of synthesis parameters on zeolite seed size
and crystallinity,” J. Eur. Ceram. Soc., vol. 28, pp. 2653–2657, 2008.
[64] L. Bonaccorsi and E. Proverbio, “Microwave assisted crystallization of zeolite
119

A from dense gels,” J. Cryst. Gr., vol. 247, pp. 555–562, 2003.
[65] N. A. Acara, “Zeolite n and process for preparing same,” United States Patent
341460, pp. 1–4, 1965.
[66] H. C. Duecker, C. R. Guerra, and A. Weiss, “Synthetic crystalline zeolite,”
United States Patent 3567372, pp. 1–3, 1971.
[67] L. Falth and S. Andersson, “Crystal structure of the synthetic zeolite N,
NaAlSiO4 · 1.35H2O,” Z. Kristallogr., vol. 160, pp. 313–316, 1982.
[68] K. M. Leung, P. P. Edwards, E. Jones, and A. Sartbaeva, “Microwave synthesis
of LTN framework zeolite with no organic structure directing agents,” RSC
Adv., vol. 5, pp. 35580–35585, 2015.
[69] P. A. Howell, “Low angle X-ray scattering from synthetic zeolites: zeolites A,
X, and Y,” J. Phys. Chem., vol. 64, no. 3, pp. 364–367, 1960.
[70] R. M. Barrer, J. A. Davies, and L. V. C. Rees, “Comparison of the ion exchange
properties of zeolites X and Y,” J. inorg. nucl. Chem., vol. 31, no. 8, pp. 2599–
2609, 1969.
[71] T. C. Golden, F. W. Taylor, N. H. Malik, C. J. Raiswell, and E. H. Salter,
“Process for reducing the level of carbon dioxide in a gaseous mixture,” United
States Patent 6506236-B2, pp. 1–6, 2003.
[72] M. A. Camblor, A. Corma, A. Martinez, F. A. Mocholi, and J. P. Pariente,
“Catalytic Cracking of Gas-oil - Benefits in Activity and Selectivity of Small
Y Zeolite Crystallites Stabilized by a Higher Silicon-to-Aluminium Ratio by
Synthesis,” Applied Catalysis, vol. 55, no. 1, pp. 65–74, 1989.
[73] A. Nock and R. Rudham, “Enhanced cracking activity of dealuminated Y-
120

zeolites,” Zeolites, vol. 7, no. 5, pp. 481–484, 1987.
[74] H. S. Sherry, “The Ion-Exchange Properties of Zeolites. IV. Alkaline Earth Ion
Exchange in the Synthetic Zeolites Linde X and Y,” J. Phys. Chem., vol. 72,
no. 12, pp. 4086–4094, 1968.
[75] J. Scherzer and R. E. Ritter, “Ion-Exchanged Ultrastable Y Zeolites. 3. Gas Oil
Cracking over Rare Earth-Exchanged Ultrastable Y Zeolites,” Ind. Eng. Chem.
Prod. Dev., vol. 17, no. 3, pp. 219–223, 1978.
[76] P. Gallezot and B. Imelik, “Crystal structure of three partially decationized
Y-Type Zeolites - (NA26.6H29.4)Y, (NA14.2H41.8)Y, (NA2.2H53.8)Y,” J. de
Chimie Physique et de Physico-Chemie Biologique, vol. 68, no. 5, p. 816, 1971.
[77] P. Gallezot and B. Imelik, “Crystal structure of 2 protonated and cerium Y-
Type zeolites, CEHY,” J. de Chimie Physique et de Physico-Chemie Biologique,
vol. 68, no. 1, p. 34, 1971.
[78] P. Gallezot, R. Beaumont, and D. Barthome, “Crystal Structure of a Dealumi-
nated Y-Type Zeolite,” J. Phys. Chem., vol. 78, no. 15, pp. 1550–1553, 1974.
[79] P. Gallezot and B. Imelik, “Crystal structure of CO2 exchanged Y-Type zeo-
lites,” J. de Chimie Physique et de Physico-Chemie Biologique, vol. 71, no. 2,
pp. 155–163, 1974.
[80] H. Su, H. S. Kim, S. M. Seo, S. O. Ko, J. M. Suh, G. H. Kim, and W. T. Lim,
“Location of Na+ ions in fully dehydrated Na+ saturated Zeolite Y (FAU, Si/Al
= 1.56),” Bull. Korean Chem. Soc., vol. 33, pp. 2785–2788, 2012.
[81] M. Colligan, P. M. Forster, A. K. Cheetham, Y. Lee, T. Vogt, and J. A. Hril-
jac, “Synchrotron X-ray Powder Diffraction and Computational Investigation
121

of Purely Siliceous Zeolite Y under Pressure,” J. Am. Chem. Soc., vol. 126,
pp. 12015–12022, 2004.
[82] F. Delprato, L. Delmotte, J. L. Guth, and L. Huve, “Synthesis of new silica-
rich cubic and hexagonal Faujasites using crown-ether based supramolecules as
templates,” Zeolites, vol. 10, pp. 546–552, 1990.
[83] F. Dougnier, J. Patarin, J. L. Guth, and D. Anglerot, “Synthesis, characteriza-
tion, and catalytic properties of silica-rich faujasite-type zeolite (FAU) and its
hexagonal analog (EMT) prepared by using crown-ethers as templates,” Zeo-
lites, vol. 12, pp. 160–166, 1992.
[84] R. Wendelbo, M. Stocker, H. Junggreen, H. B. Mostad, and D. E. Akporiaye,
“Tumbling approach towards template-free synthesis of EMT zeolite,” Microp-
orous and Mesoporous Materials, vol. 28, pp. 361–375, 1999.
[85] J. W. Sun, M. X. Sun, C. Nie, and Q. Z. Li, “Synthesis of zeolite EMT with a
novel route promoted by surfactants and its benefit in catalytic performance,”
Chem. Commun., no. 24, pp. 2459–2460, 1999.
[86] M. Matsukata, K. Kizu, M. Ogura, and E. Kikuchi, “Synthesis of EMT zeolite
by a steam-assisted crystallization method using crown ether as a structure-
directing agent,” Crystal Growth & Design, vol. 1, no. 6, pp. 509–516, 2001.
[87] E. P. Ng, J. M. Goupil, A. Vicente, C. Fernandez, R. Retoux, V. Valtchev,
and S. Mintova, “Nucleation and crystal growth features of EMT-type zeo-
lite synthesized from an organic-template-free system,” Chem. Mater., vol. 24,
pp. 4758–4765, 2012.
[88] Q. Mou, N. Li, and S. Xiang, “Seed-directed synthesis of EMT-type zeolite
122

from an organic-template-free system,” Microporous and Mesoporous Materials,
vol. 212, pp. 73–79, 2015.
[89] G. D. Gatta, A. Sartbaeva, and S. A. Wells, “Compression behaviour and flex-
ibility window of the analcime-like feldspathoids: experimental and theoretical
findings,” Eur. J. Mineral., vol. 21, pp. 571–580, 2009.
[90] S. A. Wells, A. Sartbaeva, and G. D. Gatta, “Flexibility windows and phase
transitions of ordered and disordered ANA framework zeolites,” EPL, vol. 94,
no. 56001, pp. 1–5, 2011.
[91] W. Clegg, Crystal Structure Determination. Oxford University Press Inc., New
York, 1998.
[92] W. H. Bragg and W. L. Bragg, “The Reflexion of X-rays by Crystals,” Proc R.
Soc. Lond. A, vol. 88, no. 605, pp. 428–438, 1913.
[93] C. A. Fyfe, G. C. Gobbi, J. S. Hartman, J. Klinowski, and J. M. Thomas, “Solid-
state magic-angle spinning Aluminum-27 nuclear magnetic resonance studies of
zeolites using a 400-MHz high-resolution spectrometer,” J. phys. Chem., vol. 86,
no. 8, pp. 1247–1250, 1982.
[94] D. C. Apperley, R. K. Harris, and P. Hodgkinson, Solid State NMR: Basic
Principles & Practice. Momentum Press, 2012.
[95] W. Loewenstein, “The distribution of aluminum in the tetrahedra of silicates
and aluminates,” American mineralogist, vol. 39, pp. 92–96, 1954.
[96] C. A. Fyfe, J. M. Thomas, J. Klinowski, and G. C. Gobbi, “Magic-angle-
spinning NMR (MAS-NMR) spectroscopy and the structure of zeolites,” Angew.
Chem. Int. Ed. Engl., vol. 22, pp. 259–275, 1983.
123

[97] J. Klinowski, “Applications of solid-state NMR for the study of molecular
sieves,” Anal. Chim. Acta, vol. 283, pp. 929–965, 1993.
[98] E. Lippmaa, M. Magi, A. Samoson, G. Engelhardt, and A. Grimmer, “Struc-
tural studies of silicates by Solid State high resolution 29 Si NMR,” JACS,
vol. 102, pp. 4889–4893, 1980.
[99] A. Sartbaeva, N. H. Rees, P. P. Edwards, A. J. Ramirez-Cuesta, and E. Barney,
“Local probes show that framework modification in zeolites occurs on ammo-
nium exchange without calcination,” Journal of Materials Chemistry A, vol. 1,
pp. 7415–7421, 2013.
[100] J. A. van Bokhoven, D. C. Koningsberger, P. Kunkeler, H. van Bekkum, and
A. P. M. Kentgens, “Stepwise dealumination of zeolite beta at specific T-
sites observed with 27Al MAS and 27Al MQ MAS NMR,” J. Am. Chem. Soc.,
vol. 122, no. 51, pp. 12842–12847, 2000.
[101] P. Sharma, J. G. Yeo, M. H. Han, and C. H. Cho, “NaA zeolite cubic crystal
formation and deformation: cubes with crystalline core, simultaneous growth
of surface and core crystals, and layer-by-layer destruction,” RSC Adv., vol. 2,
pp. 7809–7823, 2012.
[102] S. A. Wells and A. Sartbaeva, “Template-Based Geometric Simulation of Flex-
ible Frameworks,” Materials, vol. 5, pp. 415–431, 2012.
[103] S. Wells, M. Dove, and M. Tucker, “Reverse Monte Carlo with geometric anal-
ysis - RMC+GA,” J. Appl. Cryst., vol. 37, pp. 536–544, 2004.
[104] S. A. Wells and A. Sartbaeva, “GASP: software for geometric simulations of
flexibility in polyhedral and molecular framework structures,” Molecular Sim-
124

ulations, vol. 41, pp. 1409–1421, 2015.
[105] M. Smaihi, O. Barida, and V. Valtchev, “Investigation of the Crystallization
Stages of LTA-Type Zeolite by Complementary Characterization Techniques,”
Eur. J. Inorg. Chem., vol. 2003, no. 24, pp. 4370–4377, 2003.
[106] M. Sathupunya, E. Gulari, and S. Wongkasemjit, “Na-A (LTA) zeolite synthe-
sis directly from alumatrane and silatrane by sol-gel microwave techniques,”
Journal of the European Ceramic Society, vol. 23, no. 8, pp. 1293–1303, 2003.
[107] J. Twu, P. K. Dutta, and C. T. Kresge, “Raman spectroscopic studies of the syn-
thesis of faujasitic zeolites: Comparison of two silica sources,” Zeolites, vol. 11,
pp. 672–679, 1991.
[108] I. L. Svensson, S. Sjoberg, and L. Ohman, “Polysilicate equilibria in concen-
trated sodium silicate solutions,” J. Chem. Soc., Faraday Trans. 1, vol. 82,
pp. 3635–3646, 1986.
[109] K. E. Hamilton, E. N. Coker, A. Sacco, A. G. Dixon, and R. W. Thompson,
“The effects of the silica source on the crystallization of zeolite NaX,” Zeolites,
vol. 13, pp. 645–653, 1993.
[110] R. Tekin, N. Bac, J. Warzywoda, and A. Sacco, “Effect of reaction mixture
composition and silica source on size distribution of zeolite X crystals,” Journal
of Crystal Growth, vol. 411, pp. 45–48, 2015.
[111] R. M. Mohamed, H. M. Aly, M. F. El-Shahat, and I. A. Ibrahim, “Effect of the
silica sources on the crystallinity of nanosized ZSM-5 zeolite,” Microporous and
Mesoporous Materials, vol. 79, pp. 7–12, 2005.
[112] Y. Huang, J. F. Yao, X. Y. Zhang, C. H. Kong, H. Y. Chen, D. X. Liu, M. Tsap-
125

atsis, M. R. Hill, A. J. Hill, and H. T. Wang, “Role of ethanol in sodalite crys-
tallization in an ethanol-Na2O-Al2O3-SiO2-H2O system,” Cryst. Eng. Comm.,
vol. 13, pp. 4714–4722, 2011.
[113] H. Greer, P. S. Wheatley, S. E. Ashbrook, R. E. Morris, and W. Z. Zhou,
“Early stage reversed crystal growth of zeolite A and its phase transformation
to sodalite,” J. Am. Chem. Soc., vol. 131, pp. 17986–17992, 2009.
[114] M. D. Oleksiak and J. D. Rimer, “Synthesis of zeolites in the absence of or-
ganic structure-directing agents: factors governing crystal selection and poly-
morphism,” Reviews in Chemical Engineering, vol. 30, pp. 1–49, 2014.
[115] L. M. Ren, C. J. Li, F. T. Fan, Q. Guo, D. S. Liang, Z. C. Feng, C. Li,
S. G. Li, and F. S. Xiao, “UV-Raman and NMR Spectroscopic Studies on the
Crystallization of Zeolite A and a New Synthetic Route,” Chem. Eur. J., vol. 17,
pp. 6162–6169, 2011.
[116] R. W. Thompson and M. J. Huber, “Analysis of the growth of the molecu-
lar sieve zeolite NaA in a batch precipitation system,” J. Cryst. Gr., vol. 56,
pp. 711–722, 1982.
[117] S. A. Wells, K. M. Leung, P. P. Edwards, and A. Sartbaeva, “Flexibility windows
in faujasite with explicit water and methanol extra-framework content,” Dalton
Trans., vol. 44, pp. 5978–5984, 2015.
[118] S. A. Wells and A. Sartbaeva, “Template-Based Geometric Simulation of Flex-
ible Frameworks,” Materials, vol. 5, pp. 415–431, 2012.
[119] C. Baerlocher, A. Hepp, and W. Meier, “A FORTRAN program for the simu-
lation of crystal structures by geometric refinement,” Institute fur Kristallogra-
126

phie und Petrographie, ETH, Zurich, 1978.
[120] U. Bergmann, A. D. Cicco, P. Wernet, E. Principi, P. Glatzel, and A. Nils-
son, “Nearest-neighbor oxygen distances in liquid water and ice observed by
X-ray Raman based extended X-ray absorption fine structure,” J. Chem. Phys.,
vol. 127, p. 174504, 2007.
[121] A. Bondi, “Van der Waals volums and radii,” J. Chem. Phys., vol. 68, pp. 441–
451, 1964.
[122] F. M. Richards, “Interpretation of protein structures: total volume, group vol-
ume distributions and packing density,” J. Mol. Biol., vol. 82, pp. 1–14, 1974.
[123] R. J. Angel, M. Bujak, J. Zhao, G. D. Gatta, and S. D. Jacobsen, “Effective
hydrostatic limits of pressure media for high-pressure crystallographic studies,”
J. Appl. Crystallogr., vol. 40, pp. 26–32, 2007.
[124] M. D. Foster, I. Rivin, M. M. J. Treacy, and O. D. Friedrichs, “A geometric
solution to the largest-free-sphere problem in zeolite frameworks,” Microporous
Mesoporous Materials, vol. 90, pp. 32–38, 2006.
[125] R. E. Fletcher, S. A. Wells, K. M. Leung, P. P. Edwards, and A. Sartbaeva,
“Intrinsic flexibility of porous materials; theory, modelling and the flexibility
window of the EMT zeolite framework,” Acta Cryst., vol. B71, pp. 641–647,
2015.
[126] E. J. P. Feijen, J. L. Leivens, J. A. Martens, P. J. Grobet, and P. A. Jacobs, “Sil-
icon and Aluminum ordering in frameworks of FAU and EMT aluminosilicate
zeolites crystallized in the presence of crown ethers,” J. Phys. Chem., vol. 100,
pp. 4970–4975, 1996.
127

[127] E. J. P. Feijen, K. Devadder, M. H. Bosschaerts, J. L. Lievens, J. A. Martens,
P. J. Grobet, and P. A. Jacobs, “Role of 18-Crown-6 and 15-Crown-5 Ethers in
the Crystallization of Polytype Faujasite Zeolites,” J. Am. Chem. Soc., vol. 116,
no. 7, pp. 2950–2957, 1994.
[128] A. C. Larson and R. B. Von Dreele, General Structure Analysis System (GSAS).
Los Alamos, 1994.
[129] F. Birch, “Finite Elastic Strain of Cubic Crystals,” Phys. Review, vol. 71,
pp. 809–824, 1947.
128
Copyright © 2022 FDOKUMEN


![Inclusion of methano[60]fullerene derivatives in cavitand-based coordination cages](https://static.fdokumen.com/doc/165x107/631ed46f4c5c8fb3a00e625a/inclusion-of-methano60fullerene-derivatives-in-cavitand-based-coordination-cages.jpg)