Catalysis for Global Development - MDPI
316
Catalysis for Global Development Contributions around the Iberoamerican Federation of Catalysis Printed Edition of the Special Issue Published in Catalysts Helder T. Gomes and Joaquim Luís Faria Edited by
-
Upload
khangminh22 -
Category
Documents
-
view
0 -
download
0
Transcript of Catalysis for Global Development - MDPI
Catalysis for Global DevelopmentContributions around the Iberoamerican Federation of Catalysis
Printed Edition of the Special Issue Published in Catalysts
Helder T. Gomes and Joaquim Luís FariaEdited by
Catalysis for Global Development • H
elder T. Gomes and Joaquim
Luís Faria

Catalysis for Global Development.Contributions around theIberoamerican Federation of Catalysis


Catalysis for Global Development.Contributions around theIberoamerican Federation of Catalysis
Special Issue Editors
Helder T. Gomes
Joaquim Luıs Faria
MDPI • Basel • Beijing • Wuhan • Barcelona • Belgrade • Manchester • Tokyo • Cluj • Tianjin

Special Issue Editors
Helder T. Gomes
Instituto Politecnico de Braganca (IPB)
Portugal
Joaquim Luıs Faria
Associate Laboratory LSRE-LCM
Faculdade de Engenharia da
Universidade do Porto (FEUP)
Portugal
Editorial Office
MDPI
St. Alban-Anlage 66
4052 Basel, Switzerland
This is a reprint of articles from the Special Issue published online in the open access journal
Catalysts (ISSN 2073-4344) (available at: https://www.mdpi.com/journal/catalysts/special issues/
Global Development).
For citation purposes, cite each article independently as indicated on the article page online and as
indicated below:
LastName, A.A.; LastName, B.B.; LastName, C.C. Article Title. Journal Name Year, Article Number,
Page Range.
ISBN 978-3-03928-891-5 (Hbk) ISBN 978-3-03928-892-2 (PDF)
c© 2020 by the authors. Articles in this book are Open Access and distributed under the Creative
Commons Attribution (CC BY) license, which allows users to download, copy and build upon
published articles, as long as the author and publisher are properly credited, which ensures maximum
dissemination and a wider impact of our publications.
The book as a whole is distributed by MDPI under the terms and conditions of the Creative Commons
license CC BY-NC-ND.
Contents
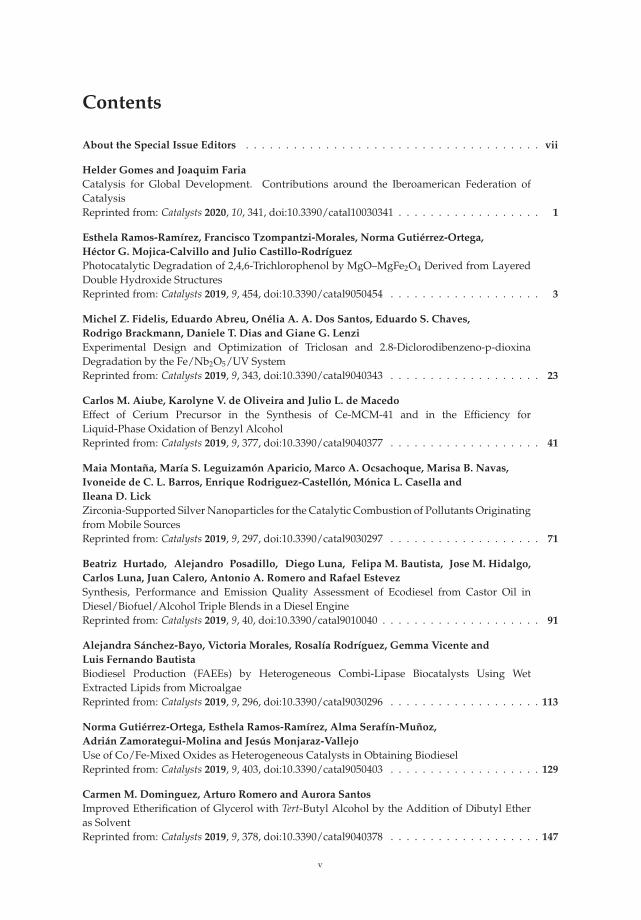
About the Special Issue Editors . . . . . . . . . . . . . . . . . . . . . . . . . . . . . . . . . . . . . vii
Helder Gomes and Joaquim Faria
Catalysis for Global Development. Contributions around the Iberoamerican Federation ofCatalysisReprinted from: Catalysts 2020, 10, 341, doi:10.3390/catal10030341 . . . . . . . . . . . . . . . . . . 1
Esthela Ramos-Ramırez, Francisco Tzompantzi-Morales, Norma Gutierrez-Ortega,
Hector G. Mojica-Calvillo and Julio Castillo-Rodrıguez
Photocatalytic Degradation of 2,4,6-Trichlorophenol by MgO–MgFe2O4 Derived from LayeredDouble Hydroxide StructuresReprinted from: Catalysts 2019, 9, 454, doi:10.3390/catal9050454 . . . . . . . . . . . . . . . . . . . 3
Michel Z. Fidelis, Eduardo Abreu, Onelia A. A. Dos Santos, Eduardo S. Chaves,
Rodrigo Brackmann, Daniele T. Dias and Giane G. Lenzi
Experimental Design and Optimization of Triclosan and 2.8-Diclorodibenzeno-p-dioxinaDegradation by the Fe/Nb2O5/UV SystemReprinted from: Catalysts 2019, 9, 343, doi:10.3390/catal9040343 . . . . . . . . . . . . . . . . . . . 23
Carlos M. Aiube, Karolyne V. de Oliveira and Julio L. de Macedo
Effect of Cerium Precursor in the Synthesis of Ce-MCM-41 and in the Efficiency forLiquid-Phase Oxidation of Benzyl AlcoholReprinted from: Catalysts 2019, 9, 377, doi:10.3390/catal9040377 . . . . . . . . . . . . . . . . . . . 41
Maia Montana, Marıa S. Leguizamon Aparicio, Marco A. Ocsachoque, Marisa B. Navas,
Ivoneide de C. L. Barros, Enrique Rodriguez-Castellon, Monica L. Casella and
Ileana D. Lick
Zirconia-Supported Silver Nanoparticles for the Catalytic Combustion of Pollutants Originatingfrom Mobile SourcesReprinted from: Catalysts 2019, 9, 297, doi:10.3390/catal9030297 . . . . . . . . . . . . . . . . . . . 71
Beatriz Hurtado, Alejandro Posadillo, Diego Luna, Felipa M. Bautista, Jose M. Hidalgo,
Carlos Luna, Juan Calero, Antonio A. Romero and Rafael Estevez
Synthesis, Performance and Emission Quality Assessment of Ecodiesel from Castor Oil inDiesel/Biofuel/Alcohol Triple Blends in a Diesel EngineReprinted from: Catalysts 2019, 9, 40, doi:10.3390/catal9010040 . . . . . . . . . . . . . . . . . . . . 91
Alejandra Sanchez-Bayo, Victoria Morales, Rosalıa Rodrıguez, Gemma Vicente and
Luis Fernando Bautista
Biodiesel Production (FAEEs) by Heterogeneous Combi-Lipase Biocatalysts Using WetExtracted Lipids from MicroalgaeReprinted from: Catalysts 2019, 9, 296, doi:10.3390/catal9030296 . . . . . . . . . . . . . . . . . . . 113
Norma Gutierrez-Ortega, Esthela Ramos-Ramırez, Alma Serafın-Munoz,
Adrian Zamorategui-Molina and Jesus Monjaraz-Vallejo
Use of Co/Fe-Mixed Oxides as Heterogeneous Catalysts in Obtaining BiodieselReprinted from: Catalysts 2019, 9, 403, doi:10.3390/catal9050403 . . . . . . . . . . . . . . . . . . . 129
Carmen M. Dominguez, Arturo Romero and Aurora Santos
Improved Etherification of Glycerol with Tert-Butyl Alcohol by the Addition of Dibutyl Etheras SolventReprinted from: Catalysts 2019, 9, 378, doi:10.3390/catal9040378 . . . . . . . . . . . . . . . . . . . 147
v
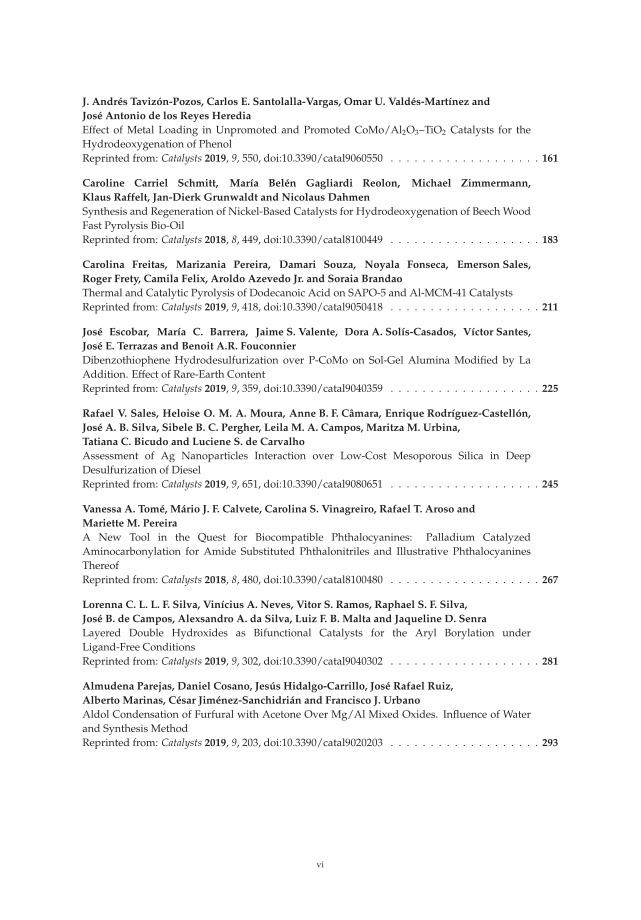
J. Andres Tavizon-Pozos, Carlos E. Santolalla-Vargas, Omar U. Valdes-Martınez and
Jose Antonio de los Reyes Heredia
Effect of Metal Loading in Unpromoted and Promoted CoMo/Al2O3–TiO2 Catalysts for theHydrodeoxygenation of PhenolReprinted from: Catalysts 2019, 9, 550, doi:10.3390/catal9060550 . . . . . . . . . . . . . . . . . . . 161
Caroline Carriel Schmitt, Marıa Belen Gagliardi Reolon, Michael Zimmermann,
Klaus Raffelt, Jan-Dierk Grunwaldt and Nicolaus Dahmen
Synthesis and Regeneration of Nickel-Based Catalysts for Hydrodeoxygenation of Beech WoodFast Pyrolysis Bio-OilReprinted from: Catalysts 2018, 8, 449, doi:10.3390/catal8100449 . . . . . . . . . . . . . . . . . . . 183
Carolina Freitas, Marizania Pereira, Damari Souza, Noyala Fonseca, Emerson Sales,
Roger Frety, Camila Felix, Aroldo Azevedo Jr. and Soraia Brandao
Thermal and Catalytic Pyrolysis of Dodecanoic Acid on SAPO-5 and Al-MCM-41 CatalystsReprinted from: Catalysts 2019, 9, 418, doi:10.3390/catal9050418 . . . . . . . . . . . . . . . . . . . 211
Jose Escobar, Marıa C. Barrera, Jaime S. Valente, Dora A. Solıs-Casados, Vıctor Santes,
Jose E. Terrazas and Benoit A.R. Fouconnier
Dibenzothiophene Hydrodesulfurization over P-CoMo on Sol-Gel Alumina Modified by LaAddition. Effect of Rare-Earth ContentReprinted from: Catalysts 2019, 9, 359, doi:10.3390/catal9040359 . . . . . . . . . . . . . . . . . . . 225
Rafael V. Sales, Heloise O. M. A. Moura, Anne B. F. Camara, Enrique Rodrıguez-Castellon,
Jose A. B. Silva, Sibele B. C. Pergher, Leila M. A. Campos, Maritza M. Urbina,
Tatiana C. Bicudo and Luciene S. de Carvalho
Assessment of Ag Nanoparticles Interaction over Low-Cost Mesoporous Silica in DeepDesulfurization of DieselReprinted from: Catalysts 2019, 9, 651, doi:10.3390/catal9080651 . . . . . . . . . . . . . . . . . . . 245
Vanessa A. Tome, Mario J. F. Calvete, Carolina S. Vinagreiro, Rafael T. Aroso and
Mariette M. Pereira
A New Tool in the Quest for Biocompatible Phthalocyanines: Palladium CatalyzedAminocarbonylation for Amide Substituted Phthalonitriles and Illustrative PhthalocyaninesThereofReprinted from: Catalysts 2018, 8, 480, doi:10.3390/catal8100480 . . . . . . . . . . . . . . . . . . . 267
Lorenna C. L. L. F. Silva, Vinıcius A. Neves, Vitor S. Ramos, Raphael S. F. Silva,
Jose B. de Campos, Alexsandro A. da Silva, Luiz F. B. Malta and Jaqueline D. Senra
Layered Double Hydroxides as Bifunctional Catalysts for the Aryl Borylation underLigand-Free ConditionsReprinted from: Catalysts 2019, 9, 302, doi:10.3390/catal9040302 . . . . . . . . . . . . . . . . . . . 281
Almudena Parejas, Daniel Cosano, Jesus Hidalgo-Carrillo, Jose Rafael Ruiz,
Alberto Marinas, Cesar Jimenez-Sanchidrian and Francisco J. Urbano
Aldol Condensation of Furfural with Acetone Over Mg/Al Mixed Oxides. Influence of Waterand Synthesis MethodReprinted from: Catalysts 2019, 9, 203, doi:10.3390/catal9020203 . . . . . . . . . . . . . . . . . . . 293
vi
About the Special Issue Editors
Helder Gomes is currently Coordinator Professor at the Polytechnic Institute of Braganca and
the Product and Process Engineering topic leader at the Mountain Research Centre (CIMO).
He graduated with a degree in Chemical Engineering from the Faculty of Engineering of the
University of Porto (FEUP) in 1997. In 2002, also from FEUP, he completed his Ph.D. in Chemical
Engineering in the area of Catalytic Wet Air Oxidation of Organic Pollutants. He joined the
Department of Chemical and Biological Technology (DTQB) at the Polytechnic Institute of
Braganca (IPB) in 2001. Between 2016 and 2018 he was President of the Division of Catalysis
and Porous Materials of the Portuguese Chemical Society and, since 2018, he is Vice-President of
the Iberoamerican Federation of Catalysis Societies. His main research interests are focused on
the synthesis and characterization of heterogeneous carbon-based materials for environmental,
biomedical and bioenergy applications, the valorization of industrial and agro-industrial wastes
into materials and fuels, and the development of water/wastewater treatment solutions based on
advanced oxidation processes. He has published 63 ISI papers and more than 200 communications
in international/national congresses. He has participated in more than 30 projects and 8 networks as
coordinator.
Joaquim L Faria joined the Laboratory of Catalysis and Materials (University of Porto) in 1994 and
founded a research line on Heterogeneous Photocatalysis. He is currently Associate Professor in
the Faculty of Engineering of the University of Porto (FEUP), Board Member of the Department
of Chemical Engineering of the same Faculty, member of the Scientific Committee of the MSc in
Chemical Engineering, and member of the Scientific Council of the Associate Laboratory LSRE-LCM
(Laboratory of Separation and Reaction Engineering – Laboratory of Catalysis and Materials—a
distinguished research unit devoted to specific objectives of the scientific and technological policy
laid down by the government. He has chaired and collaborated on the organization of several
national and international meetings, and has acted as a member of several scientific boards of
national and international meetings. His work focuses on chemical emergent systems (including
catalytic) for sustainability and development in the areas of environmental protection, energy, and
fine chemical synthesis. He has published over 180 articles in international ISI journals and more
than 300 communications in international congresses and symposia (h index of 48, more than 6616
times cited without self-citations). He has written book chapters, been a guest editor of volumes on
specific collections, and acted as a reviewer of scientific journals and other non-periodic publications.
Prof. Faria has also performed public demonstrations of popular science for young people.
vii

catalysts
Editorial
Catalysis for Global Development. Contributionsaround the Iberoamerican Federation of Catalysis
Helder Gomes 1,2,* and Joaquim Faria 2
1 Centro de Investigação de Montanha (CIMO), Instituto Politécnico de Bragança, 5300-253 Bragança, Portugal2 Laboratory of Separation and Reaction Engineering—Laboratory of Catalysis and Materials (LSRE-LCM),
Faculdade de Engenharia, Universidade do Porto, 4200-465 Porto, Portugal; [email protected]* Correspondence: [email protected]
Received: 28 February 2020; Accepted: 11 March 2020; Published: 19 March 2020
Following biennial meetings held since 1968, the Iberoamerican Federation of Catalysis Societies(FISoCat), the Portuguese Chemical Society (SPQ) and the University of Coimbra jointly organizedthe XXVI Iberoamerican Congress on Catalysis (CICat 2018), which took place in the historic cityof Coimbra, Portugal, between the 9th and 14th of September 2018. CICat 2018 was of particularimportance in the history of these events, as it marked the 50th anniversary since the beginning ofthis series of meetings—by far the most important in the field of catalysis in the Iberoamerican region.Associated with the commemoration of this event, this Special Issue, Catalysis for Global Development:Contributions around the Iberoamerican Federation of Catalysis, emerged to feature selected workspresented at CICat 2018. Other possible additional contributions promoting linkages among catalyticscience, technology, education, and culture plans and processes involved in cooperation programs andprojects among the Iberoamerican Member States, as well as states and institutions of other regions,were also envisaged.
The topics of the conference covered various aspects of catalysis in all its diversity (environmentalcatalysis, industrial catalysis, oil refining, natural gas conversion and petrochemistry, catalyst design,preparation and characterization, sustainable processes and clean energies, fine chemistry, andother topics on biocatalysis, homogeneous and heterogeneous catalysis), as well other related areas.The diversity of the topics covered was evidenced by the 442 delegates from 20 countries, mostlyIberoamerican countries, attending the conference, and by the presentation of 510 works, together withfive plenary lessons—one lesson alluding to the history of CICat to celebrate their 50 years—eightkeynotes, and six awards given during the event.
Its extensive scope and interdisciplinarity affirm catalysis to be an essential part of the process andthe chemical industry. Research in catalysis supports several strategic industrial sectors in Iberoamericadevelopment through products and processes from energy to the manufacture of materials, and hasimplications for the development of digital applications and devices. Catalysis plays a crucial role inenvironmental protection, whether by recycling waste or by reducing gas emissions that contribute toincreasing global warming—thereby opening new routes for eco-friendly processes and products that aresustainable and ecologically correct. It is on these topics and directly-related subjects that sixteen selectedcontributions from the Iberoamerican Federation of Catalysis are gathered in this Special Issue [1–16].
We believe that the contributions published will serve as a source of inspiration and guidanceto all those involved in the exciting field of catalysis, particularly for the young researchers andstudents taking their first steps into research on catalysis. We would like to thank the authors fortheir enthusiasm since the call for papers was opened, showing from the very earliest stages of theproduction of the Special Issue their motivation to contribute to this collection. Finally, we acknowledgethe unmeasurable help of the assistant editors and reviewers involved, which allowed speeding upthe production process and promoting the quality of the manuscripts presented in this Special Issue,making it, so far, the most successful conference issue in Catalysts.
Catalysts 2020, 10, 341; doi:10.3390/catal10030341 www.mdpi.com/journal/catalysts1
Catalysts 2020, 10, 341
Conflicts of Interest: The authors declare no conflict of interest
References
1. Carriel Schmitt, C.; Gagliardi Reolon, M.; Zimmermann, M.; Raffelt, K.; Grunwaldt, J.; Dahmen, N. Synthesisand Regeneration of Nickel-Based Catalysts for Hydrodeoxygenation of Beech Wood Fast Pyrolysis Bio-Oil.Catalysts 2018, 8, 449. [CrossRef]
2. Tomé, V.; Calvete, M.; Vinagreiro, C.; Aroso, R.; Pereira, M. A New Tool in the Quest for BiocompatiblePhthalocyanines: Palladium Catalyzed Aminocarbonylation for Amide Substituted Phthalonitriles andIllustrative Phthalocyanines Thereof. Catalysts 2018, 8, 480. [CrossRef]
3. Hurtado, B.; Posadillo, A.; Luna, D.; Bautista, F.; Hidalgo, J.; Luna, C.; Calero, J.; Romero, A.;Estevez, R. Synthesis, Performance and Emission Quality Assessment of Ecodiesel from Castor Oil inDiesel/Biofuel/Alcohol Triple Blends in a Diesel Engine. Catalysts 2019, 9, 40. [CrossRef]
4. Parejas, A.; Cosano, D.; Hidalgo-Carrillo, J.; Ruiz, J.; Marinas, A.; Jiménez-Sanchidrián, C.; Urbano, F. AldolCondensation of Furfural with Acetone Over Mg/Al Mixed Oxides. Influence of Water and Synthesis Method.Catalysts 2019, 9, 203. [CrossRef]
5. Sánchez-Bayo, A.; Morales, V.; Rodríguez, R.; Vicente, G.; Bautista, L. Biodiesel Production (FAEEs) byHeterogeneous Combi-Lipase Biocatalysts Using Wet Extracted Lipids from Microalgae. Catalysts 2019, 9, 296.[CrossRef]
6. Montaña, M.; Leguizamón Aparicio, M.; Ocsachoque, M.; Navas, M.; de CL Barros, I.; Rodriguez-Castellón, E.;Casella, M.; Lick, I. Zirconia-Supported Silver Nanoparticles for the Catalytic Combustion of PollutantsOriginating from Mobile Sources. Catalysts 2019, 9, 297. [CrossRef]
7. Silva, L.; Neves, V.; Ramos, V.; Silva, R.; Campos, J.; Silva, A.; Malta, L.; Senra, J. Layered Double Hydroxides asBifunctional Catalysts for the Aryl Borylation under Ligand-Free Conditions. Catalysts 2019, 9, 302. [CrossRef]
8. Fidelis, M.; Abreu, E.; Dos Santos, O.; Chaves, E.; Brackmann, R.; Dias, D.; Lenzi, G. Experimental Design andOptimization of Triclosan and 2.8-Diclorodibenzeno-p-dioxina Degradation by the Fe/Nb2O5/UV System.Catalysts 2019, 9, 343. [CrossRef]
9. Escobar, J.; Barrera, M.; Valente, J.; Solís-Casados, D.; Santes, V.; Terrazas, J.; Fouconnier, B. DibenzothiopheneHydrodesulfurization over P-CoMo on Sol-Gel Alumina Modified by La Addition. Effect of Rare-EarthContent. Catalysts 2019, 9, 359. [CrossRef]
10. Aiube, C.; Oliveira, K.; Macedo, J. Effect of Cerium Precursor in the Synthesis of Ce-MCM-41 and in theEfficiency for Liquid-Phase Oxidation of Benzyl Alcohol. Catalysts 2019, 9, 377. [CrossRef]
11. Dominguez, C.; Romero, A.; Santos, A. Improved Etherification of Glycerol with Tert-Butyl Alcohol by theAddition of Dibutyl Ether as Solvent. Catalysts 2019, 9, 378. [CrossRef]
12. Gutiérrez-Ortega, N.; Ramos-Ramírez, E.; Serafín-Muñoz, A.; Zamorategui-Molina, A.; Monjaraz-Vallejo, J. Useof Co/Fe-Mixed Oxides as Heterogeneous Catalysts in Obtaining Biodiesel. Catalysts 2019, 9, 403. [CrossRef]
13. Freitas, C.; Pereira, M.; Souza, D.; Fonseca, N.; Sales, E.; Frety, R.; Felix, C.; Azevedo, A.; Brandao, S. Thermal andCatalytic Pyrolysis of Dodecanoic Acid on SAPO-5 and Al-MCM-41 Catalysts. Catalysts 2019, 9, 418. [CrossRef]
14. Ramos-Ramírez, E.; Tzompantzi-Morales, F.; Gutiérrez-Ortega, N.; Mojica-Calvillo, H.; Castillo-Rodríguez, J.Photocatalytic Degradation of 2,4,6-Trichlorophenol by MgO–MgFe2O4 Derived from Layered DoubleHydroxide Structures. Catalysts 2019, 9, 454. [CrossRef]
15. Tavizón-Pozos, J.; Santolalla-Vargas, C.; Valdés-Martínez, O.; de los Reyes Heredia, J. Effect of Metal Loadingin Unpromoted and Promoted CoMo/Al2O3–TiO2 Catalysts for the Hydrodeoxygenation of Phenol. Catalysts2019, 9, 550. [CrossRef]
16. V. Sales, R.; Moura, H.; Câmara, A.; Rodríguez-Castellón, E.; Silva, J.; Pergher, S.; Campos, L.; Urbina, M.;Bicudo, T.; de Carvalho, L. Assessment of Ag Nanoparticles Interaction over Low-Cost Mesoporous Silica inDeep Desulfurization of Diesel. Catalysts 2019, 9, 651. [CrossRef]
© 2020 by the authors. Licensee MDPI, Basel, Switzerland. This article is an open accessarticle distributed under the terms and conditions of the Creative Commons Attribution(CC BY) license (http://creativecommons.org/licenses/by/4.0/).
2

catalysts
Article
Photocatalytic Degradation of 2,4,6-Trichlorophenolby MgO–MgFe2O4 Derived from Layered DoubleHydroxide Structures
Esthela Ramos-Ramírez 1,* , Francisco Tzompantzi-Morales 2, Norma Gutiérrez-Ortega 3,* ,
Héctor G. Mojica-Calvillo 1 and Julio Castillo-Rodríguez 2
1 Laboratory of Advanced Materials and Processes, Department of Chemistry, Division of Natural and ExactSciences, University of Guanajuato, Guanajuato, Gto. 36050, Mexico; [email protected]
2 Laboratory of Ecocatalysis, Department of Chemistry, Metropolitan Autonomous University,México City 09340, Mexico; [email protected] (F.T.-M.); [email protected] (J.C.-R.)
3 Laboratory of Environmental Engineering, Department of Civil Engineering, Division of Engineering,University of Guanajuato, Guanajuato, Gto. 36000, Mexico
* Correspondence: [email protected] (E.R.-R.); [email protected] (N.G.-O.);Tel.: +52-473-732-0006 (ext. 1457) (E.R.-R.); +52-473-732-0006 (ext. 2227) (N.G.-O.)
Received: 5 April 2019; Accepted: 14 May 2019; Published: 17 May 2019
Abstract: In recent years, the search for solutions for the treatment of water pollution by toxiccompounds such as phenols and chlorophenols has been increasing. Phenols and their derivativesare widely used in the manufacture of pesticides, insecticides, paper, and wood preservers, amongother things. Chlorophenols are partially biodegradable but not directly photodegradable by sunlightand are extremely toxic—especially 2,4,6-trichlorophenol, which is considered to be potentiallycarcinogenic. As a viable proposal to be applied in the treatment of water contaminated with2,4,6-trichlorophenol, this paper presents an application study of the thermally activated Mg/Felayered double hydroxides as photocatalysts for the mineralization of this contaminant. ActivatedMg/Fe layered double hydroxides were characterized by X-ray diffraction, thermal analysis, N2
physisorption, and scanning electron microscopy with X-ray dispersive energy. The results of thephotocatalytic degradation of 2,4,6-trichlorophenol in aqueous solution showed good photocatalyticactivity, with an efficiency of degradation of up to 93% and mineralization of 82%; degradation valueswhich are higher than that of TiO2-P25, which only reached 18% degradation. The degradationcapacity is attributed to the structure of the MgO–MgFe2O4 oxides derived from double laminatehydroxide Mg/Fe. A path of degradation based on a mechanism of superoxide and hollow radicalsis proposed.
Keywords: photocatalysis; Mg/Fe layered double hydroxides; coprecipitation; chlorophenols; mixedoxides; elimination; degradation
1. Introduction
Layered double hydroxides (LDH) or hydrotalcite-type compounds are a large class of naturaland synthetic compounds of the anionic clay type [1,2]. These compounds are characterized by havinga laminar structure with octahedral arrays of double metal hydroxides that generate a positive residualcharge, which is neutralized by the presence of hydrated interlaminar anions [3–5]. Its structuralformula is represented in a general way as [M(II)1−xM(III)x(OH)2]x+[Ax/n
n−]·mH2O, where M (II) andM (III) can be any divalent cation (Mg2+, Fe2+, Co2+, Zn2+, Cu2+, and Ni2+) or trivalent cation (Al3+,Fe3+, Cr3+, In3+, Ga3+, and Mn3+), respectively; A is any anion (CO3
2−, NO3−, SO4
2−, Cl−, CrO42−,
etc.) of n charge; x is the fraction of the trivalent cation (at the ratio of x = M(III)/M (III)+M(II)]);
Catalysts 2019, 9, 454; doi:10.3390/catal9050454 www.mdpi.com/journal/catalysts3
Catalysts 2019, 9, 454
and m is the number of water molecules in the interlaminar space [6,7]. The properties of an LDHwill depend on its structural characteristics and will determine the applications that can be given tothem. A characteristic that is determinant for the use of an LDH is its profile of evolution of phasesby thermal treatment, which allows dehydration, deanionization, and dehydroxylation, with thesubsequent formation of a variety of double and simple mixed metal oxides [8–10] Among the mainapplications that have been found to thermally decompose the products of LDHs is heterogeneouscatalysis [11–14]. More specifically, heterogeneous catalysis assisted by irradiation of ultraviolet andvisible light as an advanced process of oxidation of recalcitrant and/or persistent organic molecules hasbecome of interest as a potential application of LDHs [15,16]. Several advanced oxidation processes,such as O3/Ultraviolet (UV), O3/H2O2, UV/H2O2, Fenton, UV/Fenton, and UV/TiO2, have been appliedin wastewater as a treatment to mineralize many organic chemicals [17–21]. Within the persistentmolecules that exist, interest in their degradation tends to increase by their toxicity and damage to theenvironment, as is the case for chlorophenols. Chlorophenols are aromatic compounds that are releasedinto the environment in wastewater generated by the wood and petroleum processing industries, aswell as the production of drugs, weapons, paper, textiles, and pesticides [22,23]. Most chlorophenolsare considered highly toxic, depending on the nature and degree of ring substitution by chlorine. Ingeneral, the toxicity increases directly with the degree of chlorination. Specifically, 2,4,6-trichlorophenoltends to accumulate in the lipid tissues of several organisms, is mutagenic or co-mutagenic, andhas been linked to cancer in animals, producing lymphomas and leukemia after consumption ofcontaminated food and water for long periods of time, and in high concentrations [24,25]. Specificstudies on the degradation of 2,4,6-trichlorophenol using various technologies have included biologicaland physicochemical treatments. Specifically, biological treatments have been inefficient because2,4,6-trichlorophenol is a molecule resistant to biodegradation, as well as being toxic to microorganisms.Physicochemical treatments such as thermal treatment and adsorption have the disadvantage ofgenerating other dangerous compounds as a result of decomposition or generating residues with highconcentrations of the contaminant, respectively [26–30]. Therefore, it is feasible to think of advancedoxidation processes as a more effective alternative for the destruction of this pollutant, such as ozone,hydrogen peroxide, photocatalysts, and even combinations of these. Among the semiconductors mostused as photocatalysts in the degradation of 2,4,6-trichlorophenol are TiO2, Fe2O3, CeO2, CuO, ZnO,ZrO, and Al2O3, among others; they have been used either alone and mixed or doped, preferablywith metals such as Ag, Au, Fe, Co, and Ni, to degrade the pollutant in a significant way [31–36].The present work reports MgO–MgFe2O4 derived from layered double hydroxides Mg/Fe with bandenergy in the range of 2.28–2.47 eV, and its application in the degradation of 2,4,6-trichlorophenol inthe aqueous phase using ultraviolet radiation as a source of light.
2. Results and Discussion
2.1. X-Ray Diffraction (XRD)
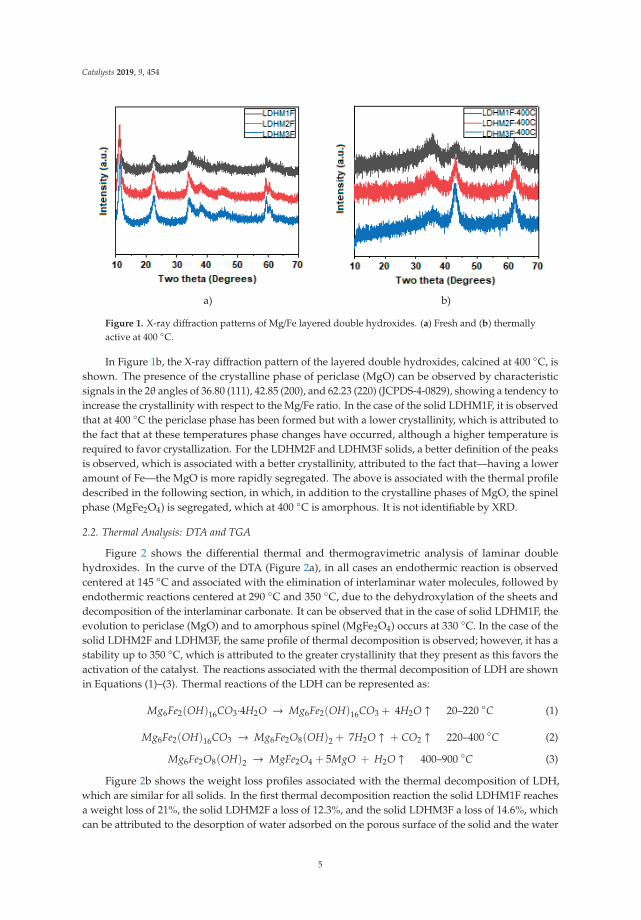
The X-ray diffraction patterns of the LDH are shown in Figure 1a. The three patterns are similarin relation to the position of the signals, but it is observed that crystallinity increases when the Mg/Feratio increases, with a tendency of LDHM1F < LDHM2F < LDHM3F, which is associated with agreater crystallinity produced by the decrease of Fe3+ within the brucite type network [Mg (OH)2].The characteristic signals are in the 2θ angles of 11.2 (003), 23.0 (006), 34.0 (012), 38.0 (015), 45 (018),59.5 (110), and 61 (013), corresponding to the pyroaurite phase with the PDF card 25-0521 [2,37].
4
Catalysts 2019, 9, 454
a) b)
Figure 1. X-ray diffraction patterns of Mg/Fe layered double hydroxides. (a) Fresh and (b) thermallyactive at 400 ◦C.
In Figure 1b, the X-ray diffraction pattern of the layered double hydroxides, calcined at 400 ◦C, isshown. The presence of the crystalline phase of periclase (MgO) can be observed by characteristicsignals in the 2θ angles of 36.80 (111), 42.85 (200), and 62.23 (220) (JCPDS-4-0829), showing a tendency toincrease the crystallinity with respect to the Mg/Fe ratio. In the case of the solid LDHM1F, it is observedthat at 400 ◦C the periclase phase has been formed but with a lower crystallinity, which is attributed tothe fact that at these temperatures phase changes have occurred, although a higher temperature isrequired to favor crystallization. For the LDHM2F and LDHM3F solids, a better definition of the peaksis observed, which is associated with a better crystallinity, attributed to the fact that—having a loweramount of Fe—the MgO is more rapidly segregated. The above is associated with the thermal profiledescribed in the following section, in which, in addition to the crystalline phases of MgO, the spinelphase (MgFe2O4) is segregated, which at 400 ◦C is amorphous. It is not identifiable by XRD.
2.2. Thermal Analysis: DTA and TGA
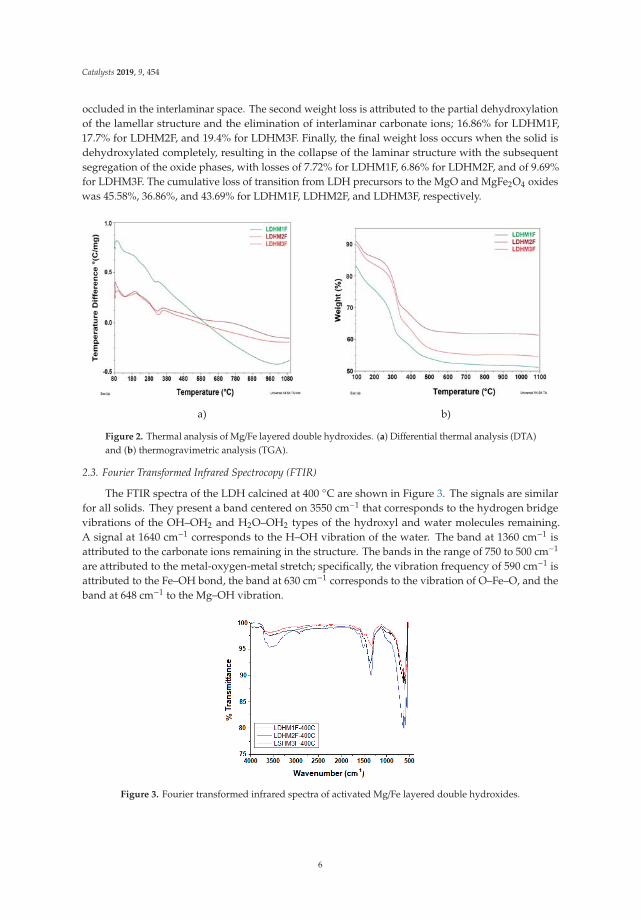
Figure 2 shows the differential thermal and thermogravimetric analysis of laminar doublehydroxides. In the curve of the DTA (Figure 2a), in all cases an endothermic reaction is observedcentered at 145 ◦C and associated with the elimination of interlaminar water molecules, followed byendothermic reactions centered at 290 ◦C and 350 ◦C, due to the dehydroxylation of the sheets anddecomposition of the interlaminar carbonate. It can be observed that in the case of solid LDHM1F, theevolution to periclase (MgO) and to amorphous spinel (MgFe2O4) occurs at 330 ◦C. In the case of thesolid LDHM2F and LDHM3F, the same profile of thermal decomposition is observed; however, it has astability up to 350 ◦C, which is attributed to the greater crystallinity that they present as this favors theactivation of the catalyst. The reactions associated with the thermal decomposition of LDH are shownin Equations (1)–(3). Thermal reactions of the LDH can be represented as:
Mg6Fe2(OH)16CO3·4H2O → Mg6Fe2(OH)16CO3 + 4H2O ↑ 20–220 ◦C (1)
Mg6Fe2(OH)16CO3 → Mg6Fe2O8(OH)2 + 7H2O ↑ + CO2 ↑ 220–400 ◦C (2)
Mg6Fe2O8(OH)2 → MgFe2O4 + 5MgO + H2O ↑ 400–900 ◦C (3)
Figure 2b shows the weight loss profiles associated with the thermal decomposition of LDH,which are similar for all solids. In the first thermal decomposition reaction the solid LDHM1F reachesa weight loss of 21%, the solid LDHM2F a loss of 12.3%, and the solid LDHM3F a loss of 14.6%, whichcan be attributed to the desorption of water adsorbed on the porous surface of the solid and the water
5
Catalysts 2019, 9, 454
occluded in the interlaminar space. The second weight loss is attributed to the partial dehydroxylationof the lamellar structure and the elimination of interlaminar carbonate ions; 16.86% for LDHM1F,17.7% for LDHM2F, and 19.4% for LDHM3F. Finally, the final weight loss occurs when the solid isdehydroxylated completely, resulting in the collapse of the laminar structure with the subsequentsegregation of the oxide phases, with losses of 7.72% for LDHM1F, 6.86% for LDHM2F, and of 9.69%for LDHM3F. The cumulative loss of transition from LDH precursors to the MgO and MgFe2O4 oxideswas 45.58%, 36.86%, and 43.69% for LDHM1F, LDHM2F, and LDHM3F, respectively.
a) b)
Figure 2. Thermal analysis of Mg/Fe layered double hydroxides. (a) Differential thermal analysis (DTA)and (b) thermogravimetric analysis (TGA).
2.3. Fourier Transformed Infrared Spectrocopy (FTIR)
The FTIR spectra of the LDH calcined at 400 ◦C are shown in Figure 3. The signals are similarfor all solids. They present a band centered on 3550 cm−1 that corresponds to the hydrogen bridgevibrations of the OH–OH2 and H2O–OH2 types of the hydroxyl and water molecules remaining.A signal at 1640 cm−1 corresponds to the H–OH vibration of the water. The band at 1360 cm−1 isattributed to the carbonate ions remaining in the structure. The bands in the range of 750 to 500 cm−1
are attributed to the metal-oxygen-metal stretch; specifically, the vibration frequency of 590 cm−1 isattributed to the Fe–OH bond, the band at 630 cm−1 corresponds to the vibration of O–Fe–O, and theband at 648 cm−1 to the Mg–OH vibration.
Figure 3. Fourier transformed infrared spectra of activated Mg/Fe layered double hydroxides.
6

Catalysts 2019, 9, 454
2.4. Textural Analysis
The N2 adsorption-desorption isotherms of LDH calcined at 400 ◦C are shown in Figure 4, showingthat for all cases, type IV isotherms corresponding to mesoporous materials are presented accordingto the IUPAC classification. The isotherms at high values of relative pressure (P/Po) did not show ahorizontal tendency, which indicates that the nitrogen physisorption took place between the aggregatesof particles that have a laminar morphology. Complementarily, the hysteresis cycles of the type H3 canbe observed, which indicate the presence of pores of asymmetric size and asymmetrical shape.
Figure 4. N2 physisorption isotherms of activated Mg/Fe layered double hydroxides.
Table 1 shows the values of the specific areas determined by the Brunauer–Emmett–Teller (BET)method for the physisorption isotherms of N2 of activated Mg/Fe layered double hydroxides, as wellas the average pore diameter calculated by the Barrett, Joyner, and Halenda (BJH) method and thevolume of the pores. It is observed that when the Mg/Fe ratio increases, there is a tendency to decreasethe surface area, which is associated with the increase in the crystallinity of the solids and with therespective decrease in the pore size of the solids. The increase of area in the solids is because when thematerials are calcined, the double structures collapse, and the pores of the tubular material expand(shape of the isotherm). The LDH with the highest specific area is the HTM1F-400 ◦C catalyst, whichreaches specific areas close to 300 m2/g, which will favor the contact area of the photocatalyst withthe pollutant.
Table 1. Textural properties of activated Mg/Fe layered double hydroxides.
Catalyst BET Area (m2/g) Pore Diameter (nm) Pore Volume (cm3/g)
LDHMIF-400 ◦C 282.2 8.72 0.0178LDHM2F-400 ◦C 253.1 7.34 0.0391LDHM3F-400 ◦C 248.9 6.30 0.0136
2.5. Scanning Electron Microscopy (SEM) with Energy-Dispersive X-Ray Spectroscopy (EDS)
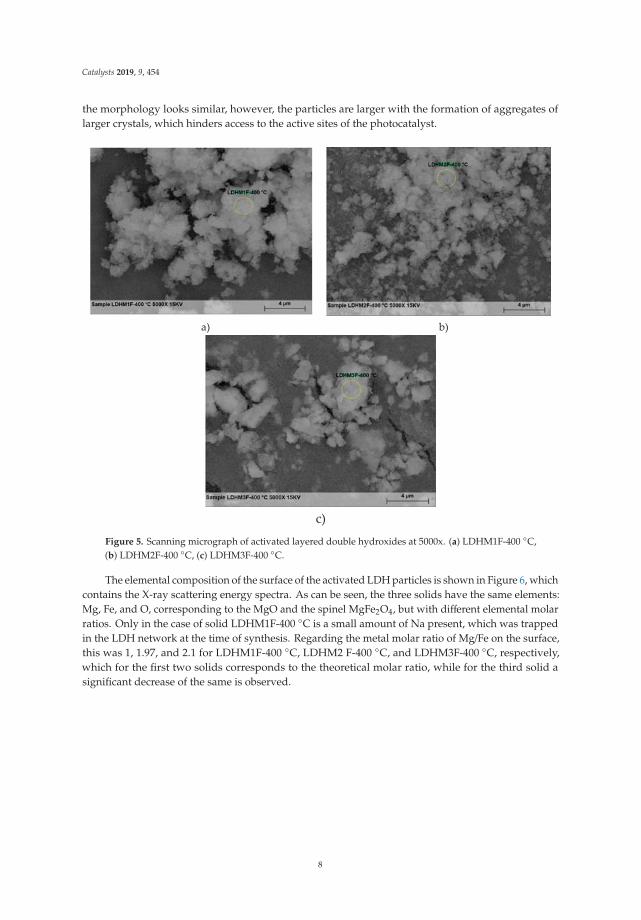
Figure 5 shows the scanning microphotographs of activated layered double hydroxides. In thecase of the solids LDHM2F-400 ◦C and LDHM3F-400 ◦C, crystals of heterogeneous size with numerousedges can be observed, in which the structure of stacked sheets can be seen, with crystallinity and verysimilar particle size, which will favor catalytic capacity for both solids. For the solid LDHM1F-400 ◦C,
7
Catalysts 2019, 9, 454
the morphology looks similar, however, the particles are larger with the formation of aggregates oflarger crystals, which hinders access to the active sites of the photocatalyst.
a)
b)
c)
Figure 5. Scanning micrograph of activated layered double hydroxides at 5000x. (a) LDHM1F-400 ◦C,(b) LDHM2F-400 ◦C, (c) LDHM3F-400 ◦C.
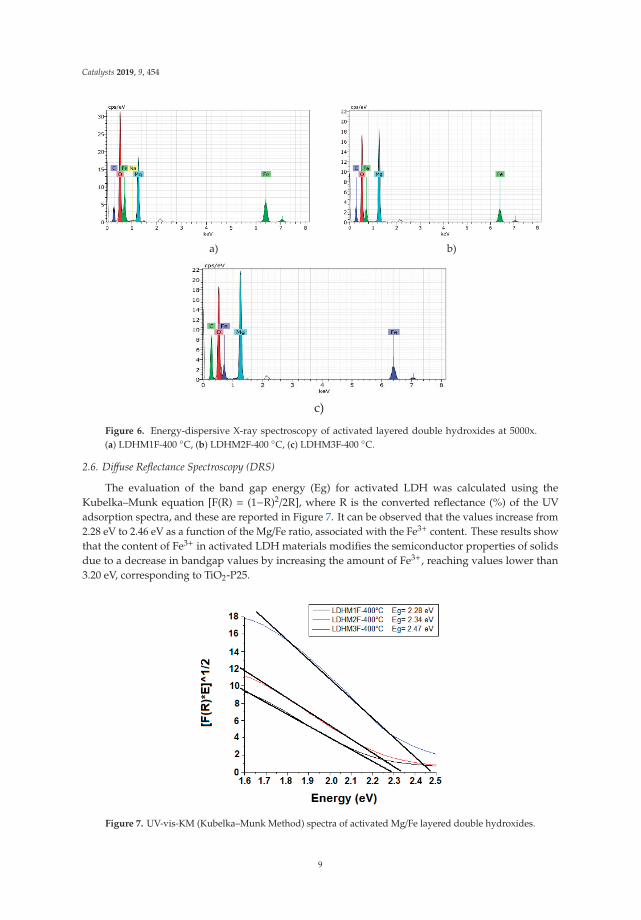
The elemental composition of the surface of the activated LDH particles is shown in Figure 6, whichcontains the X-ray scattering energy spectra. As can be seen, the three solids have the same elements:Mg, Fe, and O, corresponding to the MgO and the spinel MgFe2O4, but with different elemental molarratios. Only in the case of solid LDHM1F-400 ◦C is a small amount of Na present, which was trappedin the LDH network at the time of synthesis. Regarding the metal molar ratio of Mg/Fe on the surface,this was 1, 1.97, and 2.1 for LDHM1F-400 ◦C, LDHM2 F-400 ◦C, and LDHM3F-400 ◦C, respectively,which for the first two solids corresponds to the theoretical molar ratio, while for the third solid asignificant decrease of the same is observed.
8
Catalysts 2019, 9, 454
a) b)
c)
Figure 6. Energy-dispersive X-ray spectroscopy of activated layered double hydroxides at 5000x.(a) LDHM1F-400 ◦C, (b) LDHM2F-400 ◦C, (c) LDHM3F-400 ◦C.
2.6. Diffuse Reflectance Spectroscopy (DRS)
The evaluation of the band gap energy (Eg) for activated LDH was calculated using theKubelka–Munk equation [F(R) = (1−R)2/2R], where R is the converted reflectance (%) of the UVadsorption spectra, and these are reported in Figure 7. It can be observed that the values increase from2.28 eV to 2.46 eV as a function of the Mg/Fe ratio, associated with the Fe3+ content. These results showthat the content of Fe3+ in activated LDH materials modifies the semiconductor properties of solidsdue to a decrease in bandgap values by increasing the amount of Fe3+, reaching values lower than3.20 eV, corresponding to TiO2-P25.
Figure 7. UV-vis-KM (Kubelka–Munk Method) spectra of activated Mg/Fe layered double hydroxides.
9
Catalysts 2019, 9, 454
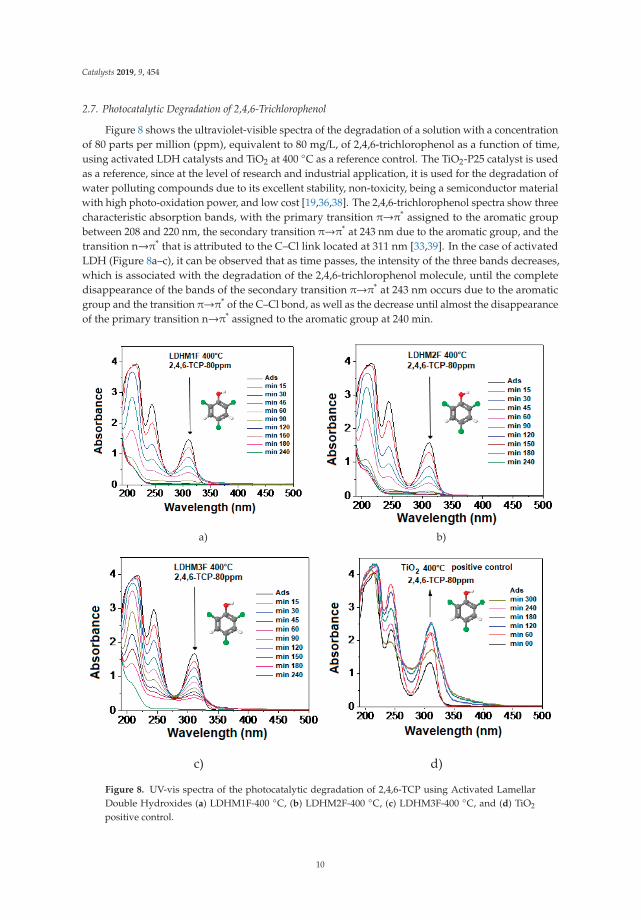
2.7. Photocatalytic Degradation of 2,4,6-Trichlorophenol
Figure 8 shows the ultraviolet-visible spectra of the degradation of a solution with a concentrationof 80 parts per million (ppm), equivalent to 80 mg/L, of 2,4,6-trichlorophenol as a function of time,using activated LDH catalysts and TiO2 at 400 ◦C as a reference control. The TiO2-P25 catalyst is usedas a reference, since at the level of research and industrial application, it is used for the degradation ofwater polluting compounds due to its excellent stability, non-toxicity, being a semiconductor materialwith high photo-oxidation power, and low cost [19,36,38]. The 2,4,6-trichlorophenol spectra show threecharacteristic absorption bands, with the primary transition π→π* assigned to the aromatic groupbetween 208 and 220 nm, the secondary transition π→π* at 243 nm due to the aromatic group, and thetransition n→π* that is attributed to the C–Cl link located at 311 nm [33,39]. In the case of activatedLDH (Figure 8a–c), it can be observed that as time passes, the intensity of the three bands decreases,which is associated with the degradation of the 2,4,6-trichlorophenol molecule, until the completedisappearance of the bands of the secondary transition π→π* at 243 nm occurs due to the aromaticgroup and the transition π→π* of the C–Cl bond, as well as the decrease until almost the disappearanceof the primary transition n→π* assigned to the aromatic group at 240 min.
a) b)
c) d)
Figure 8. UV-vis spectra of the photocatalytic degradation of 2,4,6-TCP using Activated LamellarDouble Hydroxides (a) LDHM1F-400 ◦C, (b) LDHM2F-400 ◦C, (c) LDHM3F-400 ◦C, and (d) TiO2
positive control.
10

Catalysts 2019, 9, 454
In the case of the LDHM1F and LDHM2F catalysts, the decrease of the bands is very similaras a function of time, reaching degradation values higher than 90% at 90 min, while the LDHM3Fcatalyst at 90 min has only about 50% degradation, which is attributed to its band gap values of 2.34and 2.47 eV. This is favored by the presence of Fe in the catalysts, requiring 240 min to reach valuesgreater than 90% degradation of the entire organochlorine molecule. For TiO2 used as a referencecatalyst as a photocatalyst in the degradation of 2,4,6-trichlorophenol (Figure 8d), the intensity ofthe absorbance increases with the irradiation time, which is the opposite of the behavior of activatedMg/Fe LDH catalysts. The increase in the intensity of the signals is because the degradation of TiO2
produces intermediates, which have higher absorptivity coefficients (This coefficient is proportional tothe intensity in the absorbance), modifying the characteristic signals of 2,4,6-tetrachlorophenol at 245and 310.5 nm. The intermediaries that are formed are mainly catechols, as well as benzoquinones andhydroxyquinones; all of them are compounds that preserve the aromatic ring increasing the signalsbetween 200 and 225 nm.
Figure 9 shows the graph of the relative degradation rate of 80 ppm of 2,4,6-trichlorophenolwith different catalysts. It can be corroborated that the photocatalysts show a good degradation of2,4,6-trichlorophenol at 90 min, reaching 93% for LDHM2F-400 ◦C, 92% for LDHM1F-400 ◦C, and 55%for LDHM3F-400 ◦C—values higher than the 18% degradation of TiO2-P25-400 ◦C. For the catalystsLDHM1F-400 ◦C and LDHM2F-400 ◦C, the degradation behavior as a function of time is very similar,only showing a small difference at the beginning of the degradation process, whereas the catalyst ofMg/Fe = 1 ratio at 15 min has degraded the pollutant more quickly, but at 30 min, both catalysts reachthe same speed, which at 90 min is slightly higher for the ratio catalyst Mg/Fe = 2.
Figure 9. Relative photodegradation rate of 80 ppm of 2,4,6-trichlorophenol.
On the other hand, TiO2 shows zero activity during the first 15 min, and then the degradationof the pollutant begins at a low speed, which allows it to reach 14% degradation at 60 min after thedegradation process has begun, and only 18% at 90 min, showing a decrease in rate.
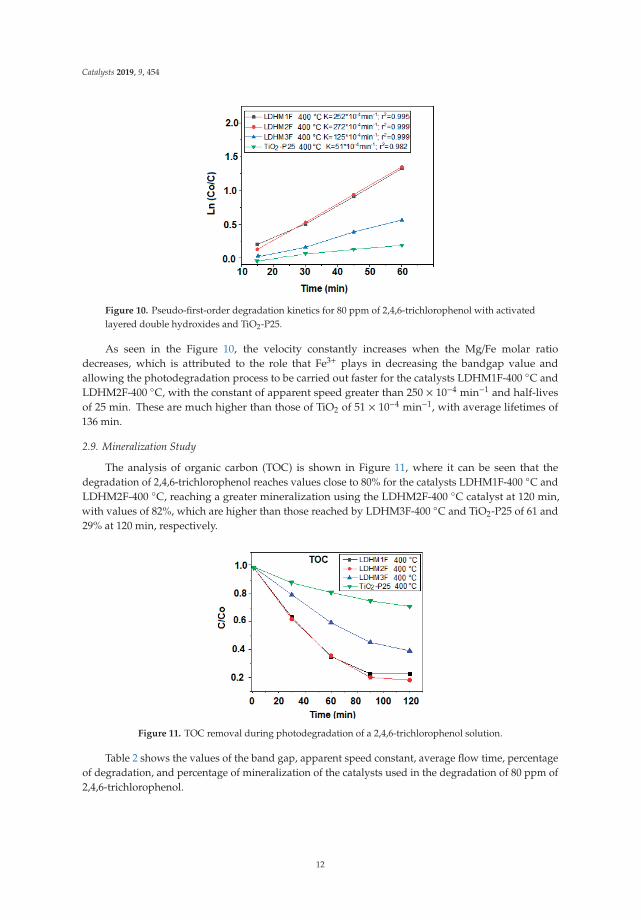
2.8. Kinetic Model Adjustment Study
Figure 10 shows the adjustment of the kinetic model of the relative degradation rate of 80 ppm of2,4,6-trichlorophenol with the different catalysts, which corresponds to a pseudo-first-order degradationbehavior in all cases—corresponding to the kinetic model of Langmuir–Hinshelwood, which is used todescribe many photocatalytic reactions where the rate follows the kinetics of the pseudo-first-orderconsidering steady state conditions [38,40].
11
Catalysts 2019, 9, 454
Figure 10. Pseudo-first-order degradation kinetics for 80 ppm of 2,4,6-trichlorophenol with activatedlayered double hydroxides and TiO2-P25.
As seen in the Figure 10, the velocity constantly increases when the Mg/Fe molar ratiodecreases, which is attributed to the role that Fe3+ plays in decreasing the bandgap value andallowing the photodegradation process to be carried out faster for the catalysts LDHM1F-400 ◦C andLDHM2F-400 ◦C, with the constant of apparent speed greater than 250 × 10−4 min−1 and half-livesof 25 min. These are much higher than those of TiO2 of 51 × 10−4 min−1, with average lifetimes of136 min.
2.9. Mineralization Study
The analysis of organic carbon (TOC) is shown in Figure 11, where it can be seen that thedegradation of 2,4,6-trichlorophenol reaches values close to 80% for the catalysts LDHM1F-400 ◦C andLDHM2F-400 ◦C, reaching a greater mineralization using the LDHM2F-400 ◦C catalyst at 120 min,with values of 82%, which are higher than those reached by LDHM3F-400 ◦C and TiO2-P25 of 61 and29% at 120 min, respectively.
Figure 11. TOC removal during photodegradation of a 2,4,6-trichlorophenol solution.
Table 2 shows the values of the band gap, apparent speed constant, average flow time, percentageof degradation, and percentage of mineralization of the catalysts used in the degradation of 80 ppm of2,4,6-trichlorophenol.
12
Catalysts 2019, 9, 454
Table 2. Bandgap energy, specific area, apparent kinetic constant, half-life, percentage of degradation,and percentage of mineralization of activated layered double hydroxides.
Catalyst Bandgap (eV)Kapp*10−4
(min−1)t1/2
(min)%Degradation
(UV-Vis)%Mineralization
(TOC)
LDHMIF-400 ◦C 2.28 252 28 92 78LDHM2F-400 ◦C 2.34 272 25 93 82LDHM3F-400 ◦C 2.47 125 56 55 61TiO2-P25-400 ◦C 3.20 51 136 18 29
As can be seen, the LDHM1F and LDHM2 catalysts have very similar behaviors, however, theLDHM2F catalyst has a greater apparent speed constant, as well as a half-life of less than 25 min, 93%degradation and mineralization of 82%, which is why it can be considered as the catalyst with betterphotodegradation capacity for 2,4,6-trichlorophenol. This allowed LDHM2F-400 ◦C to be chosen tocarry out studies on the possible mechanism of this photocatalytic reaction.
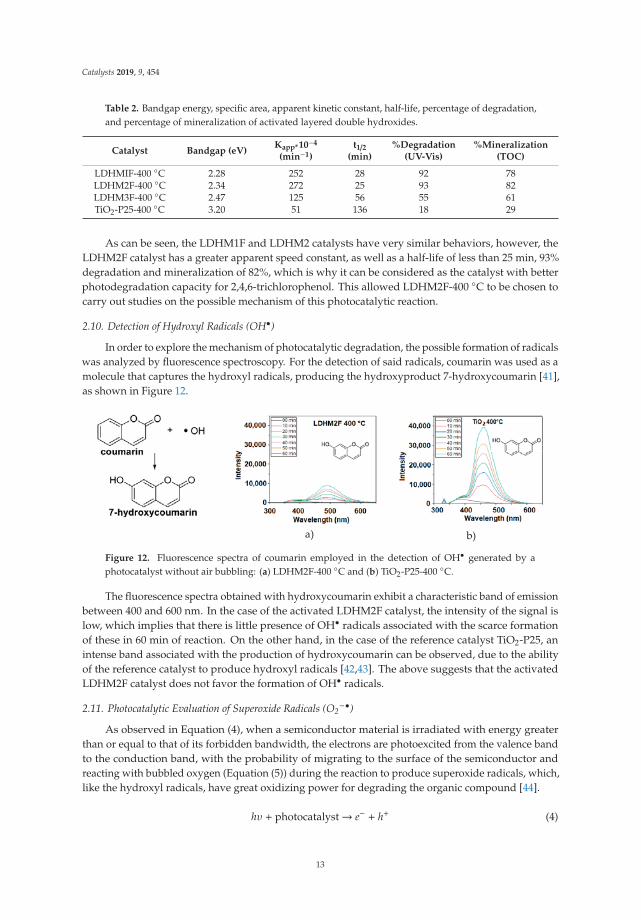
2.10. Detection of Hydroxyl Radicals (OH•)
In order to explore the mechanism of photocatalytic degradation, the possible formation of radicalswas analyzed by fluorescence spectroscopy. For the detection of said radicals, coumarin was used as amolecule that captures the hydroxyl radicals, producing the hydroxyproduct 7-hydroxycoumarin [41],as shown in Figure 12.
a) b)
Figure 12. Fluorescence spectra of coumarin employed in the detection of OH• generated by aphotocatalyst without air bubbling: (a) LDHM2F-400 ◦C and (b) TiO2-P25-400 ◦C.
The fluorescence spectra obtained with hydroxycoumarin exhibit a characteristic band of emissionbetween 400 and 600 nm. In the case of the activated LDHM2F catalyst, the intensity of the signal islow, which implies that there is little presence of OH• radicals associated with the scarce formationof these in 60 min of reaction. On the other hand, in the case of the reference catalyst TiO2-P25, anintense band associated with the production of hydroxycoumarin can be observed, due to the abilityof the reference catalyst to produce hydroxyl radicals [42,43]. The above suggests that the activatedLDHM2F catalyst does not favor the formation of OH• radicals.
2.11. Photocatalytic Evaluation of Superoxide Radicals (O2−•)
As observed in Equation (4), when a semiconductor material is irradiated with energy greaterthan or equal to that of its forbidden bandwidth, the electrons are photoexcited from the valence bandto the conduction band, with the probability of migrating to the surface of the semiconductor andreacting with bubbled oxygen (Equation (5)) during the reaction to produce superoxide radicals, which,like the hydroxyl radicals, have great oxidizing power for degrading the organic compound [44].
hυ + photocatalyst→ e− + h+ (4)
13
Catalysts 2019, 9, 454
O2 + e− → O2−• (5)
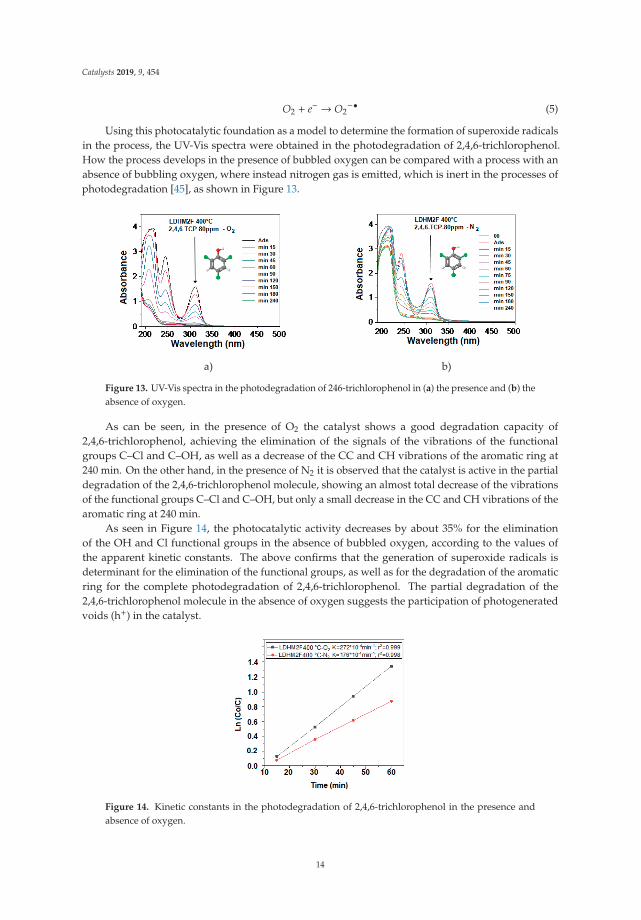
Using this photocatalytic foundation as a model to determine the formation of superoxide radicalsin the process, the UV-Vis spectra were obtained in the photodegradation of 2,4,6-trichlorophenol.How the process develops in the presence of bubbled oxygen can be compared with a process with anabsence of bubbling oxygen, where instead nitrogen gas is emitted, which is inert in the processes ofphotodegradation [45], as shown in Figure 13.
a) b)
Figure 13. UV-Vis spectra in the photodegradation of 246-trichlorophenol in (a) the presence and (b) theabsence of oxygen.
As can be seen, in the presence of O2 the catalyst shows a good degradation capacity of2,4,6-trichlorophenol, achieving the elimination of the signals of the vibrations of the functionalgroups C–Cl and C–OH, as well as a decrease of the CC and CH vibrations of the aromatic ring at240 min. On the other hand, in the presence of N2 it is observed that the catalyst is active in the partialdegradation of the 2,4,6-trichlorophenol molecule, showing an almost total decrease of the vibrationsof the functional groups C–Cl and C–OH, but only a small decrease in the CC and CH vibrations of thearomatic ring at 240 min.
As seen in Figure 14, the photocatalytic activity decreases by about 35% for the eliminationof the OH and Cl functional groups in the absence of bubbled oxygen, according to the values ofthe apparent kinetic constants. The above confirms that the generation of superoxide radicals isdeterminant for the elimination of the functional groups, as well as for the degradation of the aromaticring for the complete photodegradation of 2,4,6-trichlorophenol. The partial degradation of the2,4,6-trichlorophenol molecule in the absence of oxygen suggests the participation of photogeneratedvoids (h+) in the catalyst.
Figure 14. Kinetic constants in the photodegradation of 2,4,6-trichlorophenol in the presence andabsence of oxygen.
14
Catalysts 2019, 9, 454
2.12. Photocatalytic Evaluation of the Hole Trap (h+)
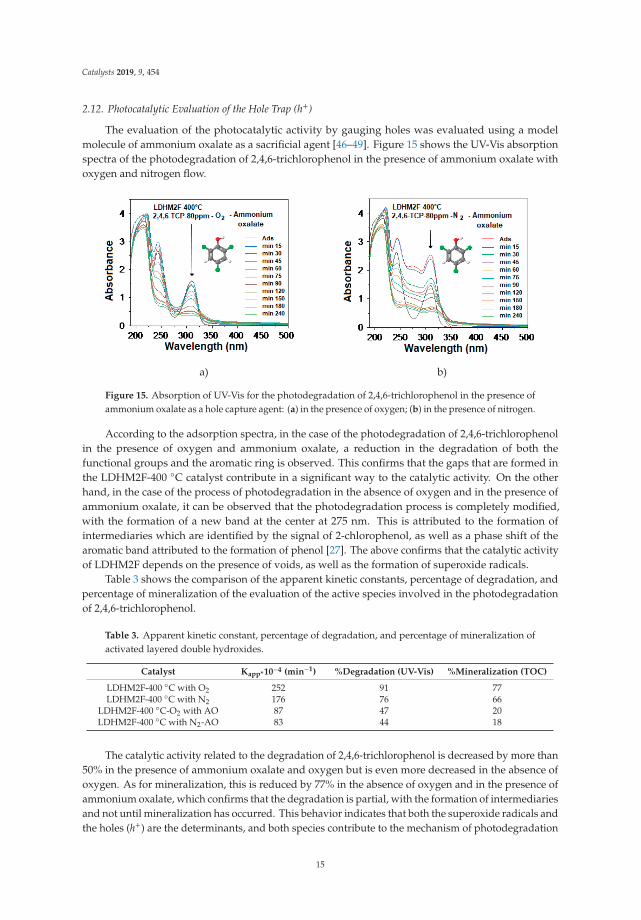
The evaluation of the photocatalytic activity by gauging holes was evaluated using a modelmolecule of ammonium oxalate as a sacrificial agent [46–49]. Figure 15 shows the UV-Vis absorptionspectra of the photodegradation of 2,4,6-trichlorophenol in the presence of ammonium oxalate withoxygen and nitrogen flow.
a) b)
Figure 15. Absorption of UV-Vis for the photodegradation of 2,4,6-trichlorophenol in the presence ofammonium oxalate as a hole capture agent: (a) in the presence of oxygen; (b) in the presence of nitrogen.
According to the adsorption spectra, in the case of the photodegradation of 2,4,6-trichlorophenolin the presence of oxygen and ammonium oxalate, a reduction in the degradation of both thefunctional groups and the aromatic ring is observed. This confirms that the gaps that are formed inthe LDHM2F-400 ◦C catalyst contribute in a significant way to the catalytic activity. On the otherhand, in the case of the process of photodegradation in the absence of oxygen and in the presence ofammonium oxalate, it can be observed that the photodegradation process is completely modified,with the formation of a new band at the center at 275 nm. This is attributed to the formation ofintermediaries which are identified by the signal of 2-chlorophenol, as well as a phase shift of thearomatic band attributed to the formation of phenol [27]. The above confirms that the catalytic activityof LDHM2F depends on the presence of voids, as well as the formation of superoxide radicals.
Table 3 shows the comparison of the apparent kinetic constants, percentage of degradation, andpercentage of mineralization of the evaluation of the active species involved in the photodegradationof 2,4,6-trichlorophenol.
Table 3. Apparent kinetic constant, percentage of degradation, and percentage of mineralization ofactivated layered double hydroxides.
Catalyst Kapp*10−4 (min−1) %Degradation (UV-Vis) %Mineralization (TOC)
LDHM2F-400 ◦C with O2 252 91 77LDHM2F-400 ◦C with N2 176 76 66
LDHM2F-400 ◦C-O2 with AO 87 47 20LDHM2F-400 ◦C with N2-AO 83 44 18
The catalytic activity related to the degradation of 2,4,6-trichlorophenol is decreased by more than50% in the presence of ammonium oxalate and oxygen but is even more decreased in the absence ofoxygen. As for mineralization, this is reduced by 77% in the absence of oxygen and in the presence ofammonium oxalate, which confirms that the degradation is partial, with the formation of intermediariesand not until mineralization has occurred. This behavior indicates that both the superoxide radicals andthe holes (h+) are the determinants, and both species contribute to the mechanism of photodegradation
15
Catalysts 2019, 9, 454
until the mineralization of 2,4,6-trichlorophenol using the LDHM2F-400 ◦C catalyst. The results inTable 3 show that the oxidation of 2,4,6-trichlorophenol occurs first in the holes (h+) photogenerated inthe double-layered hydroxides under reconstruction and subsequently the intermediates are removedby further oxidation with superoxide radicals or other oxygen oxidizing species.
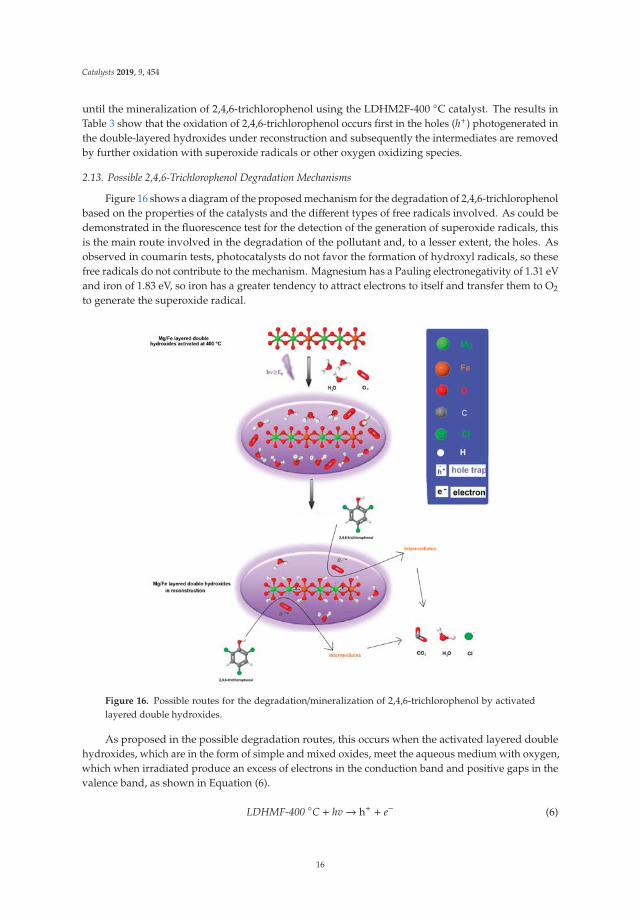
2.13. Possible 2,4,6-Trichlorophenol Degradation Mechanisms
Figure 16 shows a diagram of the proposed mechanism for the degradation of 2,4,6-trichlorophenolbased on the properties of the catalysts and the different types of free radicals involved. As could bedemonstrated in the fluorescence test for the detection of the generation of superoxide radicals, thisis the main route involved in the degradation of the pollutant and, to a lesser extent, the holes. Asobserved in coumarin tests, photocatalysts do not favor the formation of hydroxyl radicals, so thesefree radicals do not contribute to the mechanism. Magnesium has a Pauling electronegativity of 1.31 eVand iron of 1.83 eV, so iron has a greater tendency to attract electrons to itself and transfer them to O2
to generate the superoxide radical.
Figure 16. Possible routes for the degradation/mineralization of 2,4,6-trichlorophenol by activatedlayered double hydroxides.
As proposed in the possible degradation routes, this occurs when the activated layered doublehydroxides, which are in the form of simple and mixed oxides, meet the aqueous medium with oxygen,which when irradiated produce an excess of electrons in the conduction band and positive gaps in thevalence band, as shown in Equation (6).
LDHMF-400 ◦C + hv→ h+ + e− (6)
16

Catalysts 2019, 9, 454
On the other hand, electrons over the conduction band react with molecular oxygen, which actsas an electron acceptor to form superoxide radicals (Equation (7)).
e− + O2 → O2−• (7)
The generated superoxide radicals can attack and oxidize 2,4,6-trichlorophenol (Equation (8)).
O2−• + 2,4,6-trichlorophenol→ intermediates→ CO2 + H2O (8)
The final LDHMF catalytic precursor is recovered thanks to the memory effect, a propertycharacteristic of the laminar double hydroxide materials [50–52]. Said precursor can be reactivated fora second cycle as a catalyst for the degradation of 2,4,6-trichlorophenol.
The degradation to the mineralization takes place thanks to the presence of superoxide radicalsaccompanied by the holes until the disappearance of the total organic carbon [32,53–56], implying amechanism in which the superoxide radicals are carrying out the degradation of the aromatic ringsimultaneously with the elimination of chlorine, since the formation of monochlorinated intermediatesor phenols is not observed by the ultraviolet spectrum.
The catalyst with the highest photocatalytic activity is LDHM2F, whose pore volume value ishigher compared to the LDHM1F-400 ◦C and LDHM3F-400 ◦C catalysts. This may indicate that thereis enough separation between the laminar structures of the catalysts, promoting an improvement inthe transfer of charges (e− and h+) by decreasing the recombination and, therefore, increasing thephotocatalytic activity.
In the analysis by SEM, it is observed that the particle size of the LDHM2F-400 ◦C catalysts is lowerthan that of LDHM1F-400 ◦C, which indicates that, by the synthesis method used, the nucleation isdifferent with the addition of Fe to the LDH. Being smaller particles, a lower percentage of conglomeratesis obtained, suggesting that Fe increases directly in the LDH by modifying its electronegativity in sucha way that a better transfer of charges is obtained, and with this the photocatalytic activity increases.
The main advantages of the activated layered double hydroxides are that they are not toxic, theycan regenerate for continuous use, and they can be synthesized in an easy way, and without needing tobe doped.
3. Materials and Methods
3.1. Obtaining Photocatalysts
3.1.1. Synthesis of Mg/Fe-Layered Double Hydroxide Catalytic Pre-Cursors of Ratios 1, 2, and 3
Layered double hydroxides with different Mg/Fe molar ratios were obtained by the coprecipitationmethod. The stoichiometric amounts of magnesium nitrate [Mg (NO3)·6H2O], (Fermont, Lopez Mateos,Mexico), and iron nitrate [Fe (NO3)3·9H2O] (Fermont, Lopez Mateos, Mexico)were dissolved in waterand subsequently coprecipitated at a pH of 11.5 with sodium hydroxide (NaOH) (Fermont, LopezMateos, Mexico). The coprecipitate was left and aged for 24 h, washed until it reached a pH of 9, anddried at 100 ◦C. The materials were identified as LDHM1F, LDHM2F, and LDHM3F, corresponding tothe Mg/Fe = 1, 2, and 3 ratios.
3.1.2. Activation of Layered Double Hydroxides
The LDHs that were synthesized were thermally treated at 400 ◦C in an air atmosphere for 4 h forthe formation of the mixed Mg/Fe oxides and were identified as LDHM1F-400 ◦C, LDHM2F-400 ◦C,and LDHM3F-400 ◦C.
17
Catalysts 2019, 9, 454
3.2. Physicochemical Characterization of Catalytic Pre-Cursors and Catalysts
The materials were characterized by physicochemically fresh and calcined. To corroboratethe present crystalline phase, X-ray diffraction was performed on a Siemens D500 powderdiffractometer (University of Guanajuato, Guanajuato, Mexico) with CuKα radiation, a graphitecrystal monochromator with a step of 2θ equal to 0.02 s−1, and a counting time of 9 s per point. Thethermal analyses were carried out in a TA Instruments Thermoanalyzer (University of Guanajuato,Guanajuato, Mexico) at a heating rate of 10 ◦C/min in an air atmosphere, at a speed of 100 mL/minand using α-alumina as a reference. The infrared spectra with Fourier transform were obtained ina Bruker model Tensor 27 Hyperion 7000 (University of Guanajuato, Guanajuato, Mexico) with aresolution of 4 cm−1 and 20 scans, from 400 to 4000 cm−1, and the samples were prepared by dilutionwith KBr. The nitrogen adsorption-desorption isotherms were determined in TriStar Micromeriticsequipment (University of Guanajuato, Guanajuato, Mexico), with the samples previously dried at100 ◦ C for 24 h, with a degassing at 150 ◦C, and a vacuum pressure of up to 0.5 mmHg. The BETmodel was used to obtain the specific area. Scanning electron microscopy analysis was performed on aSeizz 1550VP microscope with field emission, with Oxford EDS equipment (University of Guanajuato,Guanajuato, Mexico) with an opening of 30.0 μm and a width of 3.1 mm. The band gap energy ofthe photocatalysts was calculated from the ultraviolet absorption spectra coupled with an integratingsphere (diffuse reflectance) in a UV-Vis Recording S UV2401 Shimadzu instrument (University ofGuanajuato, Guanajuato, Mexico), and using the Kubelka–Munk theory, which consists of plotting theenergy of the photon against the square root of the Kubelka–Munk function multiplied by the energyof the photon and extrapolating the linear part with the abscissa axis.
3.3. Evaluation of the Photocatalytic Activity in the Degradation of 2,4,6-Trichlorophenol
3.3.1. Degradation of 2,4,6-Trichlorophenol
The photocatalytic degradation capacity of 2,4,6-trichlorophenol using activated LDH wasdetermined under the following conditions: standard 200 ml solution at a concentration of 80 ppmof 2,4,6-trichlorophenol (Sigma-Aldrich, St. Louis, MO, USA), in a Batch reactor at a controlledtemperature of 25 ◦C with constant magnetic stirring of 700 rpm, with a flow of air of 2 mL/s and aUV light irradiation of 254 nm, and an emission of 2.5 mW/cm2 generated by a Pen-Ray UV lampinserted in a tube of quartz. The photoactivity of all materials was determined by using 1 g/L ofphotocatalyst. To determine the adsorption phenomena effect, the suspension was stirred at 800 rpmunder airflow in dark conditions for 1 h; after that, an aliquot was collected, and the reaction wasstarted by turning on the UV lamp that was kept on for 240 min while stirring. Additionally, asample of 2,4,6-trichlorophenol solution was subjected to photolysis in the absence of any catalystto determine the effect of the radiation on the contaminant. In addition, for the comparison againsta reference photocatalyst, commercial TiO2-P25 was used. In all cases, the process of degradationof 2,4,6-trichlorophenol was monitored using an aliquot sample of the reactor, with the subsequentquantification of this in a UV-Vis Cary 100 spectrophotometer (Metropolitan Autonomous University,Mexico City, Mexico) at a wavelength of 310.5 nm. The aliquots were collected at 15-minute intervalsfor 240 min, and in order to separate the solid catalyst from the aqueous solution, the aliquots werefiltered using a nitrocellulose membrane with a pore size of 0.22 μm (Millipore Corporation, Burlington,Massachusetts, Estados Unidos). The amount of total organic carbon present in the irradiated solutionwas determined in a TOC-V-CSH/CSN Shimadzu 5000 TOC (Metropolitan Autonomous University,Mexico City, Mexico) to corroborate the degradation of the molecule until mineralization.
3.3.2. Detection of Hydroxyl and Superoxide Radicals and Study of the Hole Trap
A dilute aqueous solution (2 × 10⁻³ M) of coumarin (Sigma-Aldrich, St. Louis, MO, USA) wasprepared, in which 200 mL of solution and 200 mg of photocatalyst to be analyzed were pouredinto a Batch reactor. TiO2-P25 was used as the reference material. As above, the study was carried
18
Catalysts 2019, 9, 454
out in the absence of a photocatalyst (Photolysis) to observe the possible production of hydroxylradicals with and without a photocatalyst. Once this was done, the solution was irradiated with UVlight for 1 h with a Pen-Ray lamp (λ = 254 nm and I0 = 4.4 mWcm−2) under conditions of constantstirring, oxygen bubbling, and temperature (800 rpm, 1 mL/s, and 25 ◦C, respectively), extracting 3 mLaliquots at 10 min intervals. Finally, the fluorescence emission spectra in the irradiated solution wereanalyzed by photoluminescence in a Fluorescence spectroscopy Scinco FS-2 spectrometer (MetropolitanAutonomous University, Mexico City, Mexico), a wavelength of 320 nm, and the results obtained withthe synthesized materials and photolysis were compared with those obtained using the referencesolid TiO2-P25.
3.3.3. Photocatalytic Evaluation of Hole Capture with Ammonium Oxalate as a Sacrificial Agent
The photocatalytic reaction was monitored with the material with the highest photodegradation(HTM2F-400 ◦C) in the presence of ammonium oxalate (Sigma-Aldrich, St. Louis, MO, USA), and withoxygen and nitrogen flow. An aqueous solution of 246-TCF at 80 ppm was used, and 1 g/L of thephotocatalyst with higher activity and a concentration of 0.004 M of ammonium oxalate were pouredinto a reactor. The solution was irradiated with UV light, maintaining the conditions of constantstirring, bubbling of nitrogen/oxygen, and temperature (800 rpm, 1 mL/s, and 25 ◦C, respectively),while extracting aliquots of 3 mL to be analyzed by UV-Vis spectroscopy.
4. Conclusions
The results of the present work show that layered double hydroxides of different Mg/Fe molarratio can be synthesized by the coprecipitation method, which have a hydrotalcite crystalline structure,and which when calcined at 400 ◦C evolve to a crystalline phase of periclase and an amorphous phaseof spinel, with Type IV isotherms characteristic of mesoporous materials and specific areas between273.9 and 248.9 m2/g. Layered double hydroxides activated at 400 ◦C have Eg values ranging from2.28 to 2.47, which are lower values than TiO2, so they have better semiconductor properties. Thesephotocatalysts have good photocatalytic activity, with degradation efficiencies for 2,4,6-trichlorophenolof 93% LDHM2F-400 ◦C > 92% LDHM1F-400 ◦C > 55% LDHM3F-400 ◦C > 18% TiO2-P25- 400 ◦C inless than 90 minutes. Therefore, it is concluded that the most active catalysts are LDHM2FI-400 ◦Cand LDHM1F-400 ◦C, which present a greater amount of iron in the structure and which reachmineralization values of up to 82%. The degradation mechanism proposed for the photodegradationof 2,4,6-trichlorophenol considers that the degradation occurs first in the photogenerated holes in thelayered double hydroxides under reconstruction and then the intermediates are removed by furtheroxidation with the superoxide radicals or other oxidizing species of oxygen. These photocatalystsobtained from Mg/Fe layered double hydroxides are promising for the photodegradation of recalcitrantchlorinated compounds.
Author Contributions: Conceptualization, E.R.-R. and N.G.-O.; methodology, E.R.-R., H.G.M.-C., and J.C.-R.;software, J.C.-R.; validation, F.T.-M.; formal analysis, F.T.-M., H.G.M.-C., and J.C.-R.; investigation, F.T.-M.;resources, H.G.M.-C.; data curation, N.G.-O.; writing—original draft preparation, E.R.-R.; writing—review andediting, N.G.-O. and E.R.-R.; funding acquisition, E.R.-R.
Funding: This research received no external funding. Funding was received from the resources of the Universityof Guanajuato.
Acknowledgments: We would like to especially thank the Directorate for Research and Postgraduate Support(DAIP) at the University of Guanajuato for their support in developing this project. Also, we thank the Universityof Guanajuato-CONACyT National Laboratory SEM-EDS. Additionally, we thank the CONACyT for the graduatescholarship and UAM-I for technical support.
Conflicts of Interest: The authors declare no conflict of interest.
19
Catalysts 2019, 9, 454
References
1. Miyata, S. Physico-chemical properties of synthetic hydrotalcites in relation to composition. Clays Clay Miner.1980, 28, 50–56. [CrossRef]
2. Mills, S.J.; Christy, A.G.; Génin, J.M.R.; Kameda, T.; Colombo, F. Nomenclature of the hydrotalcite supergroup:Natural layered double hydroxides. Mineral. Mag. 2012, 76, 1289–1336. [CrossRef]
3. Roelofs, J.C.A.A.; Bokhoven, J.A.; Dillen, A.J.; Geus, J.W.; Jong, K.P. The Thermal Decomposition of Mg±AlHydrotalcites: Effects of Interlayer Anions and Characteristics of the Final Structure. Chem. Eur. J. 2002, 8,5571–5579. [CrossRef]
4. Nguyen, H.K.D.; Nguyen, H.V.; Nguyen, V.A. Effect of synthetic conditions on the structure of mesoporousMg-Al-Co hydrotalcite. J. Mol. Struct. 2018, 1171, 25–32. [CrossRef]
5. Sikander, U.; Sufian, S.; Salam, M.A. A review of hydrotalcite based catalysts for hydrogen productionsystems. Int. J. Hydrogen Energy 2017, 42, 19851–19868. [CrossRef]
6. Cavani, F.; Trifiro, F.; Vaccari, A. Hydrotalcite–type anionic clays: Preparation, properties and applications.Catal Today 1992, 11, 173–301. [CrossRef]
7. Othman, M.R.; Helwani, Z.; Martunus, W.J.N. Synthetic hydrotalcites from different routes and theirapplication as catalysts and gas adsorbents: A review. Appl. Organomet. Chem. 2009, 23, 335–346. [CrossRef]
8. Yahyaoui, R.; Sanchez, P.E.; Pérez, L.A.; Nahdi, K.; Criado, J.M. Synthesis, characterization and combinedkinetic analysis of thermal decomposition of hydrotalcite (Mg6Al2(OH)16CO3·4H2O). Thermochim. Acta 2018,667, 177–184. [CrossRef]
9. Vágvölgyi, V.; Palmer, S.J.; Kristóf, J.; Frost, R.L.; Horváth, E. Mechanism for hydrotalcite decomposition: Acontrolled rate thermal analysis study. J. Colloid Interface Sci. 2008, 318, 302–308. [CrossRef]
10. Mokhtar, M.; Inayat, A.; Ofili, J.; Schwieger, W. Thermal decomposition, gas phase hydration and liquidphase reconstruction in the system Mg/Al hydrotalcite/mixed oxide: A comparative study. Appl. Clay Sci.2010, 50, 176–181. [CrossRef]
11. Parida, K.M.; Sahoo, M.; Singha, S. Synthesis and characterization of a Fe(III)-Schiff base complex in a Zn-AlLDH host for cyclohexane oxidation. J. Mol. Catal A Chem. 2010, 329, 7–12. [CrossRef]
12. Védrine, J.C. Heterogeneous Catalysis on Metal Oxides. Catalysts 2017, 7, 341. [CrossRef]13. Baloyi, J.; Ntho, T.; Mom, J. Synthesis and application of pillared clay heterogeneous catalysts for wastewater
treatment: A review. RSC Adv. 2018, 8, 5197. [CrossRef]14. Prasad, C.; Tang, H.; Liu, W. Magnetic Fe3O4 based layered double hydroxides (LDHs) nanocomposites
(Fe3O4/LDHs): Recent review of progress in synthesis, properties and applications. J. Nanostruct. Chem.2018, 8, 393–412. [CrossRef]
15. Moma, J.; Baloyi, J.; Ntho, T. Synthesis and characterization of an efficient and stable Al/Fe pillared claycatalyst for the catalytic wet air oxidation of phenol. RSC Adv. 2018, 8, 30115. [CrossRef]
16. Valencia-Lopez, C.D.; Zafra-Calvo, M.; Martín de Vidales, M.J.; Blanco-Gutierrez, V.; Atanes-Sanchez, E.;Merayo, N.; Fernandez-Martinez, F.; Nieto-Marquez, A.; Dos santos-Garcia, J. Synthesis of NiFe2O4-LDHComposites with High Adsorption and Photocatalytic Activity for Methyl Orange Degradation. Inorganics2018, 6, 98. [CrossRef]
17. Li, Z.; Chen, H.; Liu, W. Full-Spectrum Photocatalytic Activity of ZnO/CuO/ZnFe2O4 Nanocomposite as aPhotoFenton-Like Catalyst. Catalysts 2018, 8, 557. [CrossRef]
18. Descorme, C. Catalytic wastewater treatment: Oxidation and reduction processes. Recent studies onchlorophenols, Claude Descorme. Catal Today 2017, 297, 324–334. [CrossRef]
19. Lazar, M.A.; Varghese, S.; Nair, S.S. Photocatalytic Water Treatment by Titanium Dioxide: Recent Updates.Catalysts 2012, 2, 572–601. [CrossRef]
20. Pi, Y.; Wang, J. Pathway of the ozonation of 2,4,6-trichlorophenol in aqueous solution. Front. Environ. Sci.Eng. China 2007, 1, 179–183. [CrossRef]
21. Yan, Y.; Wu, X.; Zhang, H. Catalytic wet peroxide oxidation of phenol over Fe2O3/MCM-41 in a fixed bedreactor. Sep. Purif. Technol. 2016, 171, 52–61. [CrossRef]
22. Honda, M.; Kannan, K. Biomonitoring of chlorophenols in human urine from several Asian countries, Greeceand the United States. Environ. Pollut. 2018, 232, 487–493. [CrossRef]
23. Badanthadka, M.; Mehendale, H.M. Chlorophenols. In Encyclopedia of Toxicology, 3rd ed.; Elsiever: Amsterdam,The Netherlands, 2014; pp. 896–899. [CrossRef]
20
Catalysts 2019, 9, 454
24. Mostafalou, S.; Abdollahi, M. Pesticides: An update of human exposure and toxicity. Arch. Toxicol. 2017, 91,549–599. [CrossRef]
25. Michałowicz, J. Pentachlorophenol and its derivatives induce oxidative damage and morphological changesin human lymphocytes (in vitro). Arch. Toxicol. 2010, 84, 379–387. [CrossRef]
26. Khorsandi, H.; Ghochlavi, N.; Aghapour, A.A. Biological Degradation of 2,4,6-Trichlorophenol by aSequencing Batch Reactor. Environ. Process. 2018, 5, 907–917. [CrossRef]
27. Yi, A.; Feng, Y.; Du, Z.; Li, H. Mechanism of 2, 4, 6-Trichlorophenol Degradation in Microbial Fuel CellsSystem with Microbe Isolated from Submarine Sediment. Int. J. Electrochem. Sci. 2015, 10, 1459–1468.
28. Krishnaiah, D.; Anisuzzaman, S.M.; Bono, A.; Sarbatly, R. Adsorption of 2,4,6-trichlorophenol (TCP) ontoactivated carbon. J. King Saud Univ. Sci. 2013, 25, 251–255. [CrossRef]
29. Zhao, P.; Liu, X.; Tian, W.; Yan, D.; Sun, X.; Lei, X. Adsolubilization of 2,4,6-trichlorophenol from aqueoussolution by surfactant intercalated ZnAl layered double hydroxides. Chem. Eng. J. 2015, 279, 597–604.[CrossRef]
30. Saritha, P.; Suman, D.S.; Aparna, C.; Vijaya, P.N.; Himabindu, V.; Anjaneyulu, Y. Degradative Oxidation of2,4,6 Trichlorophenol Using Advanced Oxidation Processes—A Comparative Study. Water Air Soil Pollut.2009, 200, 169–179. [CrossRef]
31. Kashyap, J.; Riaz, U. Facile synthesis of novel polypyrrole dispersed AgFeO2 nanohybrid with highly efficientphotocatalytic activity towards 2,4,6-trichlorophenol degradation. RSC Adv. 2018, 8, 13218–13225. [CrossRef]
32. Benbachir, H.; Gaffour, H.; Mokhtari, M. Photodegradation of 2,4,6-trichlorophenol using natural hematitemodified with chloride of zirconium oxide. React. Kinet. Mech. Catal. 2017, 122, 635–653. [CrossRef]
33. Pino-Chamorro, J.Á.; Ditrói, T.; Lente, G.; Fábián, I. A detailed kinetic study of the direct photooxidation of2,4,6-trichlorophenol. J. Photochem. Photobiol. A 2016, 330, 71–78. [CrossRef]
34. Chaliha, S.; Bhattacharyya, K.G. Wet oxidative method for removal of 2,4,6-trichlorophenol in water usingFe(III), Co(II), Ni(II) supported MCM41 catalysts. J. Hazard. Mater. 2008, 150, 728–736. [CrossRef] [PubMed]
35. Yang, J.; Chen, H.; Gao, J.; Yan, T.; Zhou, F.; Cuin, S.; Bi, W. Synthesis of Fe3O4/g-C3N4 nanocomposites andtheir application in the photodegradation of 2,4,6-trichlorophenol under visible light. Mater. Lett. 2016, 164,183–189. [CrossRef]
36. Hee-Chan, K.; Sang-Hyup, L.; Dong-Ju, K.; Jae-Woo, C. Photocatalytic Activity of 2,4,6-Trichlorophenol byTiO2 Mesostructures: Effects of Surface Modification, Calcination Temperature and Initial pH. Water AirSoil Pollut. 2013, 224, 1459–1467. [CrossRef]
37. Rozov, K.; Berner, U.R.; Kulik, D.A.; Diamond, L.W. Solubility and thermodynamic properties ofcarbonate-bearing hydrotalcite-pyroaurite solid solutions with a 3:1 Mg/(Al+Fe) mole ratio. Clays Clay Miner.2011, 59, 215–232. [CrossRef]
38. Lavand, A.B.; Malghe, Y.S. Nano sized C-doped TiO2 as a visible-light photocatalyst for the degradation of2,4,6- trichlorophenol. Adv. Mater. Lett. 2015, 6, 695–700. [CrossRef]
39. Skrabal, P.M. Spectroscopy: An Interdisciplinary Integral Description of Spectroscopy from UV to NMR, 1st ed.;vdf Hochschulverlag AG an der ETZ Zurich: Zurich, Switzerland, 2012; Volume 1, pp. 216–224. ISBN978-3-7281-3385-4.
40. Turchi, C.S.; Ollis, D.F. Mixed Reactant photocatalysis: Intermediates and Mutual Rate Inhibition. J. Catal.1989, 119, 483–496. [CrossRef]
41. Lin, Z.R.; Zhao, L.; Dong, Y.H. Quantitative characterization of hydroxyl radical generation in agoethite-catalyzed Fenton-like reaction Author links open overlay panel. Chemosphere 2015, 141, 7–12.[CrossRef]
42. Fu, S.; Deng, B.; Ma, D.; Cheng, H.; Dong, S. Visible-Light-Driven Photocatalytic Fuel Cell with an Ag-TiO2
Carbon Foam Anode for Simultaneous 4-Chlorophenol Degradation and Energy Recovery. ChemEngineering2018, 2, 20. [CrossRef]
43. An, X.; Liu, H.; Qu, J.; Moniz, S.J.A.; Tang, J. Photocatalytic mineralisation of herbicide2,4,5-trichlorophenoxyacetic acid: Enhanced performance by triple junction Cu–TiO2–Cu2O and theunderlying reaction mechanism. New J. Chem. 2015, 39, 314–320. [CrossRef]
44. Nosaka, Y.; Nosaka, A.Y. Generation and Detection of Reactive Oxygen Species in Photocatalysis. Chem. Rev.2017, 117, 11302–11336. [CrossRef]
45. Chen, F.; Yang, Q.; Pehkonen, S.O.; Ray, M.B. Modeling of Gas-Phase Photodegradation of Chloroform andCarbon Tetrachloride. J. Air Waste Manag. Assoc. 2004, 54, 1281–1292. [CrossRef] [PubMed]
21
Catalysts 2019, 9, 454
46. Rodríguez, E.M.; Márquez, G.; Tena, M.; Álvarez, P.M.; Beltrán, F.J. Determination of main species involvedin the first steps of TiO2 photocatalytic degradation of organics with the use of scavengers: The case ofofloxacin. Appl. Catal. B 2015, 178, 44–53. [CrossRef]
47. Wu, W.; Liang, S.; Chen, Y.; Shen, L.; Zheng, H.; Wu, L. High efficient photocatalytic reduction of 4-nitroanilineto p-phenylenediamine over microcrystalline SrBi2Nb2O9. Catal. Commun. 2012, 17, 39–42. [CrossRef]
48. Xian, T.; Yang, H.; Di, L.; Ma, J.; Zhang, H.; Dai, J. Photocatalytic reduction synthesis of SrTiO3-graphenenanocomposites and their enhanced photocatalytic activity. Nanoscale Res. Lett. 2014, 9, 1–9. [CrossRef][PubMed]
49. Liu, W.; Wnag, M.; Xu, C.; Chen, S.; Fu, X. Significantly enhanced visible-light photocatalytic activity ofg-C3N4 via ZnO modification and the mechanism study. J. Mol. Catal. A Chem. 2013, 368, 9–15. [CrossRef]
50. Mascolo, G.; Mascolo, M.C. On the synthesis of layered double hydroxides (LDHs) by reconstruction methodbased on the “memory effect”. Microporous Mesoporous Mater. 2015, 214, 246–248. [CrossRef]
51. Kim, B.K.; Gwak, G.H.; Okada, T.; Oh, J.M. Effect of particle size and local disorder on specific surface area oflayered double hydroxides upon calcination-reconstruction. J. Solid State Chem. 2018, 263, 60–64. [CrossRef]
52. Teodorescu, F.; Paladuta, A.M.; Pavel, O.D. Memory effect of hydrotalcites and its impact on cyanoethylationreaction. Mater. Res. Bull. 2013, 48, 2055–2059. [CrossRef]
53. Czaplicka, M. Photo-degradation of chlorophenols in the aqueous solution. J. Hazard Mater. 2006, 134, 45–59.[CrossRef]
54. Xu, L.; Wang, J. Degradation of 2,4,6-trichlorophenol using magnetic nanoscaled Fe3O4/CeO2 composite as aheterogeneous Fenton-like catalyst. Sep. Purif. Technol. 2015, 149, 255–264. [CrossRef]
55. Odling, G.; Robertson, N. Bridging the gap between laboratory and application in photocatalytic waterpurification. Catal. Sci. Technol. 2019, 9, 533–545. [CrossRef]
56. Guo, Q.; Zhou, C.; Ma, Z.; Ren, Z.; Fan, H.; Yang, X. Elementary Chemical Reactions in Surface Photocatalysis.Annu. Rev. Phys. Chem. 2018, 69, 451–472. [CrossRef]
© 2019 by the authors. Licensee MDPI, Basel, Switzerland. This article is an open accessarticle distributed under the terms and conditions of the Creative Commons Attribution(CC BY) license (http://creativecommons.org/licenses/by/4.0/).
22
catalysts
Article
Experimental Design and Optimization of Triclosanand 2.8-Diclorodibenzeno-p-dioxina Degradation bythe Fe/Nb2O5/UV System
Michel Z. Fidelis 1,* , Eduardo Abreu 1, Onélia A. A. Dos Santos 2, Eduardo S. Chaves 3 ,
Rodrigo Brackmann 4, Daniele T. Dias 5 and Giane G. Lenzi 1
1 Departamento de Engenharia Química, Universidade Tecnológica Federal do Paraná, Av Monteiro Lobato,s/n—Km 04, Ponta Grossa, PR 84016-210, Brazil; [email protected] (E.A.);[email protected] (G.G.L.)
2 Departamento de Engenharia Química, Universidade Estadual de Maringá, Avenida Colombo, 5790,Maringá, PR 87020-900, Brazil; [email protected]
3 Departamento de Química, Universidade Federal de Santa Catarina, Campus Reitor João David FerreiraLima, R. Eng. Agronômico Andrei Cristian Ferreira, s/n, Florianópolis, SC 88040-900, Brazil;[email protected]
4 Departamento de Química, Universidade Tecnológica Federal do Paraná, Via do Conhecimento,s/n—Km 01, Pato Branco, PR 85503-390, Brazil; [email protected]
5 Departamento Acadêmico de Física, Universidade Tecnológica Federal do Paraná, Av Monteiro Lobato,s/n—Km 04, Ponta Grossa, PR 84016-210, Brazil; [email protected]
* Correspondence: [email protected]; Tel.: +55-42-3220-4800
Received: 11 February 2019; Accepted: 27 March 2019; Published: 8 April 2019
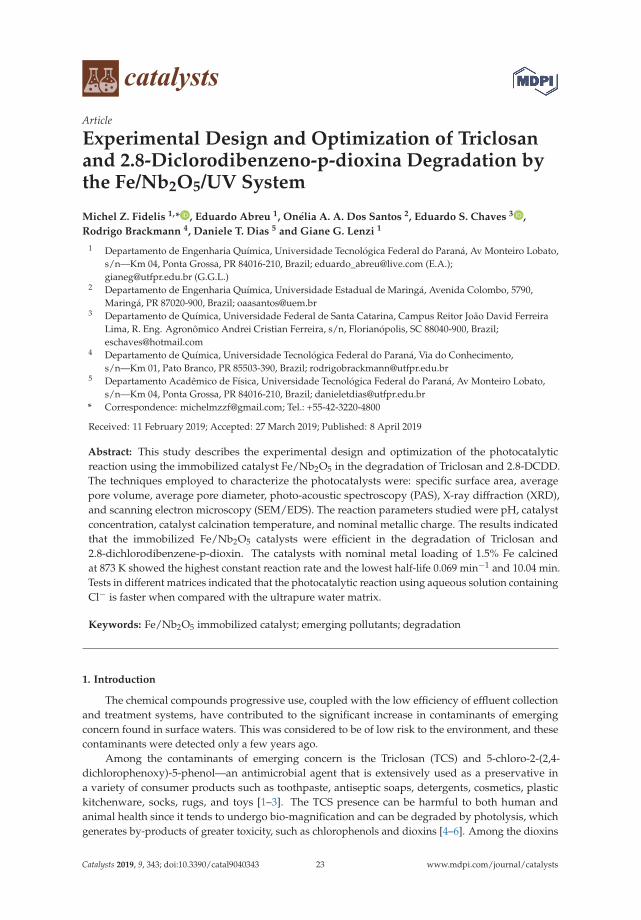
Abstract: This study describes the experimental design and optimization of the photocatalyticreaction using the immobilized catalyst Fe/Nb2O5 in the degradation of Triclosan and 2.8-DCDD.The techniques employed to characterize the photocatalysts were: specific surface area, averagepore volume, average pore diameter, photo-acoustic spectroscopy (PAS), X-ray diffraction (XRD),and scanning electron microscopy (SEM/EDS). The reaction parameters studied were pH, catalystconcentration, catalyst calcination temperature, and nominal metallic charge. The results indicatedthat the immobilized Fe/Nb2O5 catalysts were efficient in the degradation of Triclosan and2.8-dichlorodibenzene-p-dioxin. The catalysts with nominal metal loading of 1.5% Fe calcinedat 873 K showed the highest constant reaction rate and the lowest half-life 0.069 min−1 and 10.04 min.Tests in different matrices indicated that the photocatalytic reaction using aqueous solution containingCl− is faster when compared with the ultrapure water matrix.
Keywords: Fe/Nb2O5 immobilized catalyst; emerging pollutants; degradation
1. Introduction
The chemical compounds progressive use, coupled with the low efficiency of effluent collectionand treatment systems, have contributed to the significant increase in contaminants of emergingconcern found in surface waters. This was considered to be of low risk to the environment, and thesecontaminants were detected only a few years ago.
Among the contaminants of emerging concern is the Triclosan (TCS) and 5-chloro-2-(2,4-dichlorophenoxy)-5-phenol—an antimicrobial agent that is extensively used as a preservative ina variety of consumer products such as toothpaste, antiseptic soaps, detergents, cosmetics, plastickitchenware, socks, rugs, and toys [1–3]. The TCS presence can be harmful to both human andanimal health since it tends to undergo bio-magnification and can be degraded by photolysis, whichgenerates by-products of greater toxicity, such as chlorophenols and dioxins [4–6]. Among the dioxins
Catalysts 2019, 9, 343; doi:10.3390/catal9040343 www.mdpi.com/journal/catalysts23
Catalysts 2019, 9, 343
that may be formed, 2,8-dichlorodibenzene-p-dioxin (2.8-DCDD) stands out as being a chemicallystable compound and it is known to suppress antibody responses. In addition, exposure to radiation,mainly in an environment with free chlorine, favors the reaction of transformation of the TCS in thiscompound [6,7].
Conventional water treatment methods are ineffective for removing substances with biologicalactivity, such as Triclosan, and extremely stable substances such as dioxins. Therefore, in recentdecades, Advanced Oxidation Processes (AOPs) have received attention as an alternative for removingthese compounds. They are based on the hydroxyl radicals generation, which has a strong oxidizingcharacter and has the capacity to degrade compounds through oxidation. The formation of free radicalsthat react with dissolved oxygen is an example of such [8,9].
Many semiconductors have been studied in the heterogeneous photo catalysis in order to degradepollutants in water bodies (ZnO, CdO, TiO2, Fe2O3, among others). Among these, TiO2 stands out asthe most used photo catalyst due to its highly chemical stability, nontoxic, band gap of 3.2 eV for UVradiation (natural/artificial), and relatively low cost [10–13]. However, since its band gap is 3.2 eV,the highest efficiency of the process is limited by the absorption of the TiO2 semiconductor with aradiation of over 385 nm, which corresponds to approximately 3% of the solar spectrum at sea level.
Thus, the search for new catalysts becomes essential. The use of niobium pentoxide (Nb2O5) asa semiconductor for application in heterogeneous photocatalysis has few literature references. Thiscompound has chemical characteristics of low toxicity and band gap (3.4 eV), which is very similarto TiO2 [14,15]. It is a stable semiconductor and insoluble in water, which can be attacked only byconcentrated hydrofluoric acid. Compared with vanadium oxide, it is more stable and difficult toreduce. In contrast to titanium oxide, it presents an advantage in some types of photo degradation [16].
Due to the characteristics of the oxide, it has been used in catalytic reactions such asdehydrogenation, alkylation, hydrolysis, and photocatalytic degradation. The study of Nb2O5 showsthat it has a combination of energy when in contact with ultraviolet radiation, and, also, when togetherwith another semiconductor, can greatly increase the catalytic activity and the life of a catalyst [16,17].
One of the negative aspects of the photocatalytic process is the difficulty to separate the catalystafter its treatment. In this direction, the material immobilization allows the separation of the catalystby avoiding the need of a later step in the process and increases the porosity, the adsorption capacity,and thermal stability [18]. On the other hand, a catalytic activity reduction occurs [19,20]. In order toimprove the photoreaction efficiency, many authors have metals such as Ag [21], Fe [22], and Cu [23]added to it in order to prevent the process of electron/role recombination in semiconductors.
In this context, this study describes the optimization of the photocatalytic degradation of TCSand 2.8-DCDD using the immobilized Fe/Nb2O5 as the photo-catalyst. It was also analyzed usingdifferent parameters such as pH, catalyst concentration, and the catalyst calcination temperature.
2. Results and Discussion
2.1. Catalysts Characterization
2.1.1. Pore Properties (BET Method)
The results of the textural properties for the calcined Fe/Nb2O5 catalysts at different temperaturesare shown in Table 1.
A variation of the specific surface area for the studied catalysts ranges from 20.26 to 149.63 m2 g−1.The lowest area obtained for the samples was 0.5% Fe/Nb2O5 calcined at 673 K, and the highestfor the sample was 1.0% Fe/Nb2O5 at 773 K. These results indicate the influence of the calcinationtemperature and the addition of Fe. The 1.0% Fe/Nb2O5 catalysts and 0.5% Fe/Nb2O5 calcined at773 K and 873K practically obtained the same results of approximately 150 m2 g−1. The catalystsare mesoporous materials (pores of internal width between 20 Å and 50 Å). When comparingthe results of the pore diameter, it is possible to verify that the samples did not have significantvariations in this property. Regarding the micro-pore volumes, there was considerable variation of
24
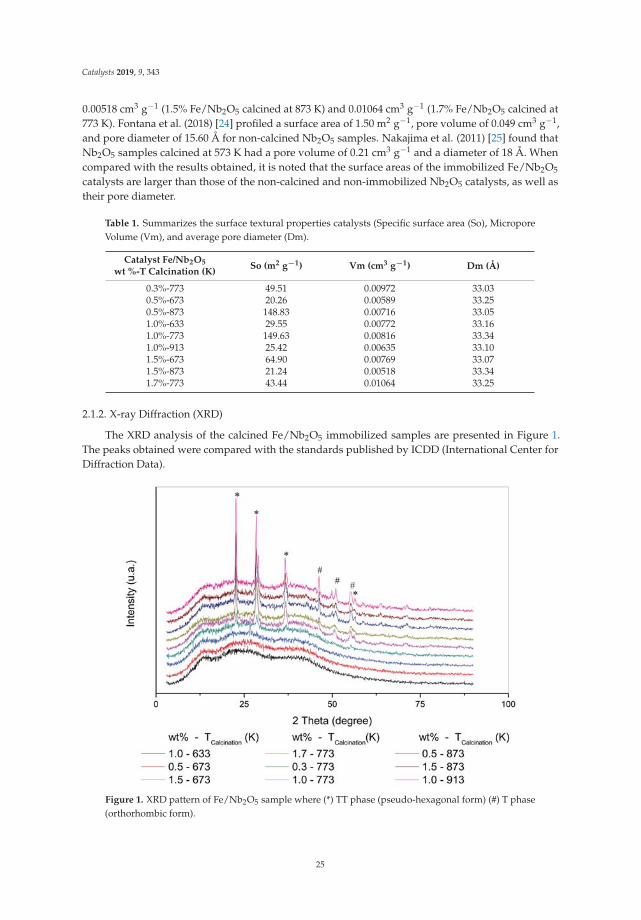
Catalysts 2019, 9, 343
0.00518 cm3 g−1 (1.5% Fe/Nb2O5 calcined at 873 K) and 0.01064 cm3 g−1 (1.7% Fe/Nb2O5 calcined at773 K). Fontana et al. (2018) [24] profiled a surface area of 1.50 m2 g−1, pore volume of 0.049 cm3 g−1,and pore diameter of 15.60 Å for non-calcined Nb2O5 samples. Nakajima et al. (2011) [25] found thatNb2O5 samples calcined at 573 K had a pore volume of 0.21 cm3 g−1 and a diameter of 18 Å. Whencompared with the results obtained, it is noted that the surface areas of the immobilized Fe/Nb2O5
catalysts are larger than those of the non-calcined and non-immobilized Nb2O5 catalysts, as well astheir pore diameter.
Table 1. Summarizes the surface textural properties catalysts (Specific surface area (So), MicroporeVolume (Vm), and average pore diameter (Dm).
Catalyst Fe/Nb2O5
wt %-T Calcination (K)So (m2 g−1) Vm (cm3 g−1) Dm (Å)
0.3%-773 49.51 0.00972 33.030.5%-673 20.26 0.00589 33.250.5%-873 148.83 0.00716 33.051.0%-633 29.55 0.00772 33.161.0%-773 149.63 0.00816 33.341.0%-913 25.42 0.00635 33.101.5%-673 64.90 0.00769 33.071.5%-873 21.24 0.00518 33.341.7%-773 43.44 0.01064 33.25
2.1.2. X-ray Diffraction (XRD)
The XRD analysis of the calcined Fe/Nb2O5 immobilized samples are presented in Figure 1.The peaks obtained were compared with the standards published by ICDD (International Center forDiffraction Data).
Figure 1. XRD pattern of Fe/Nb2O5 sample where (*) TT phase (pseudo-hexagonal form) (#) T phase(orthorhombic form).
25
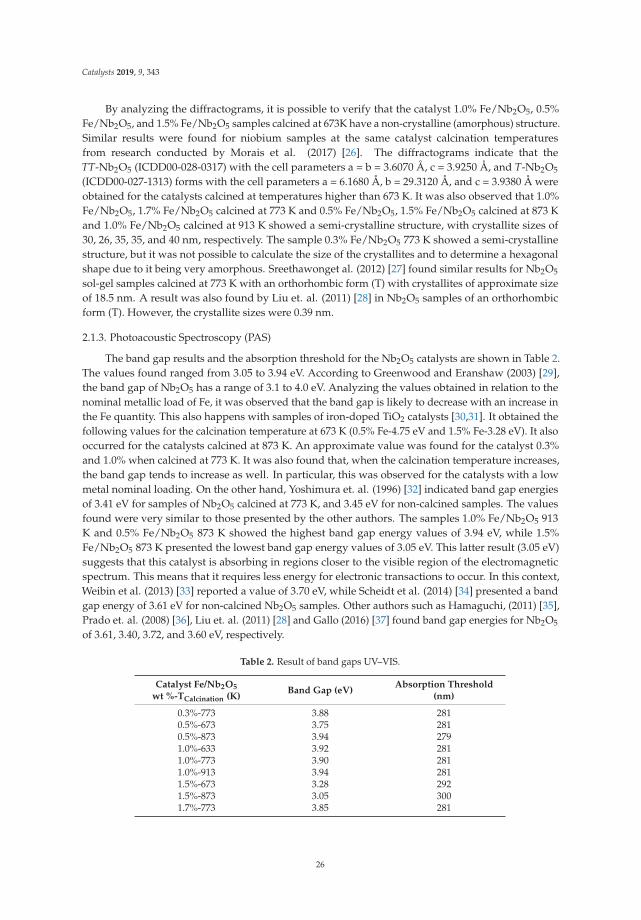
Catalysts 2019, 9, 343
By analyzing the diffractograms, it is possible to verify that the catalyst 1.0% Fe/Nb2O5, 0.5%Fe/Nb2O5, and 1.5% Fe/Nb2O5 samples calcined at 673K have a non-crystalline (amorphous) structure.Similar results were found for niobium samples at the same catalyst calcination temperaturesfrom research conducted by Morais et al. (2017) [26]. The diffractograms indicate that theTT-Nb2O5 (ICDD00-028-0317) with the cell parameters a = b = 3.6070 Å, c = 3.9250 Å, and T-Nb2O5
(ICDD00-027-1313) forms with the cell parameters a = 6.1680 Å, b = 29.3120 Å, and c = 3.9380 Å wereobtained for the catalysts calcined at temperatures higher than 673 K. It was also observed that 1.0%Fe/Nb2O5, 1.7% Fe/Nb2O5 calcined at 773 K and 0.5% Fe/Nb2O5, 1.5% Fe/Nb2O5 calcined at 873 Kand 1.0% Fe/Nb2O5 calcined at 913 K showed a semi-crystalline structure, with crystallite sizes of30, 26, 35, 35, and 40 nm, respectively. The sample 0.3% Fe/Nb2O5 773 K showed a semi-crystallinestructure, but it was not possible to calculate the size of the crystallites and to determine a hexagonalshape due to it being very amorphous. Sreethawonget al. (2012) [27] found similar results for Nb2O5
sol-gel samples calcined at 773 K with an orthorhombic form (T) with crystallites of approximate sizeof 18.5 nm. A result was also found by Liu et. al. (2011) [28] in Nb2O5 samples of an orthorhombicform (T). However, the crystallite sizes were 0.39 nm.
2.1.3. Photoacoustic Spectroscopy (PAS)
The band gap results and the absorption threshold for the Nb2O5 catalysts are shown in Table 2.The values found ranged from 3.05 to 3.94 eV. According to Greenwood and Eranshaw (2003) [29],the band gap of Nb2O5 has a range of 3.1 to 4.0 eV. Analyzing the values obtained in relation to thenominal metallic load of Fe, it was observed that the band gap is likely to decrease with an increase inthe Fe quantity. This also happens with samples of iron-doped TiO2 catalysts [30,31]. It obtained thefollowing values for the calcination temperature at 673 K (0.5% Fe-4.75 eV and 1.5% Fe-3.28 eV). It alsooccurred for the catalysts calcined at 873 K. An approximate value was found for the catalyst 0.3%and 1.0% when calcined at 773 K. It was also found that, when the calcination temperature increases,the band gap tends to increase as well. In particular, this was observed for the catalysts with a lowmetal nominal loading. On the other hand, Yoshimura et. al. (1996) [32] indicated band gap energiesof 3.41 eV for samples of Nb2O5 calcined at 773 K, and 3.45 eV for non-calcined samples. The valuesfound were very similar to those presented by the other authors. The samples 1.0% Fe/Nb2O5 913K and 0.5% Fe/Nb2O5 873 K showed the highest band gap energy values of 3.94 eV, while 1.5%Fe/Nb2O5 873 K presented the lowest band gap energy values of 3.05 eV. This latter result (3.05 eV)suggests that this catalyst is absorbing in regions closer to the visible region of the electromagneticspectrum. This means that it requires less energy for electronic transactions to occur. In this context,Weibin et al. (2013) [33] reported a value of 3.70 eV, while Scheidt et al. (2014) [34] presented a bandgap energy of 3.61 eV for non-calcined Nb2O5 samples. Other authors such as Hamaguchi, (2011) [35],Prado et. al. (2008) [36], Liu et. al. (2011) [28] and Gallo (2016) [37] found band gap energies for Nb2O5
of 3.61, 3.40, 3.72, and 3.60 eV, respectively.
Table 2. Result of band gaps UV–VIS.
Catalyst Fe/Nb2O5
wt %-TCalcination (K)Band Gap (eV)
Absorption Threshold(nm)
0.3%-773 3.88 2810.5%-673 3.75 2810.5%-873 3.94 2791.0%-633 3.92 2811.0%-773 3.90 2811.0%-913 3.94 2811.5%-673 3.28 2921.5%-873 3.05 3001.7%-773 3.85 281
26

Catalysts 2019, 9, 343
2.1.4. Scanning Electron Microscopy (SEM/EDS)
Figure 2 shows the images obtained by the scanning electron microscopy with an EDS detector(SEM/EDS), for 0.3 and 1.7% Fe/Nb2O5 samples calcined at 773 K, respectively.
Figure 2. Cont.
27
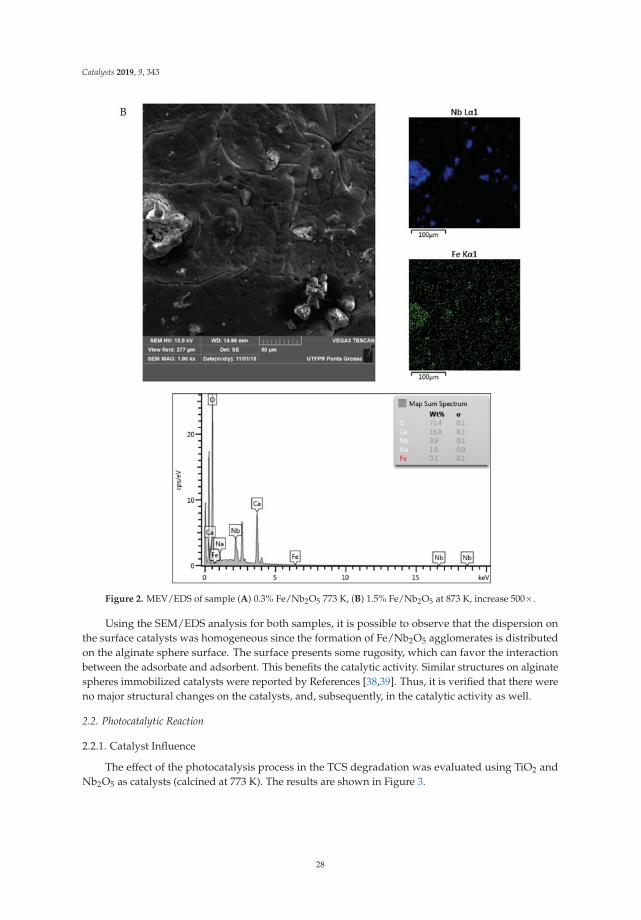
Catalysts 2019, 9, 343
Figure 2. MEV/EDS of sample (A) 0.3% Fe/Nb2O5 773 K, (B) 1.5% Fe/Nb2O5 at 873 K, increase 500×.
Using the SEM/EDS analysis for both samples, it is possible to observe that the dispersion onthe surface catalysts was homogeneous since the formation of Fe/Nb2O5 agglomerates is distributedon the alginate sphere surface. The surface presents some rugosity, which can favor the interactionbetween the adsorbate and adsorbent. This benefits the catalytic activity. Similar structures on alginatespheres immobilized catalysts were reported by References [38,39]. Thus, it is verified that there wereno major structural changes on the catalysts, and, subsequently, in the catalytic activity as well.
2.2. Photocatalytic Reaction
2.2.1. Catalyst Influence
The effect of the photocatalysis process in the TCS degradation was evaluated using TiO2 andNb2O5 as catalysts (calcined at 773 K). The results are shown in Figure 3.
28
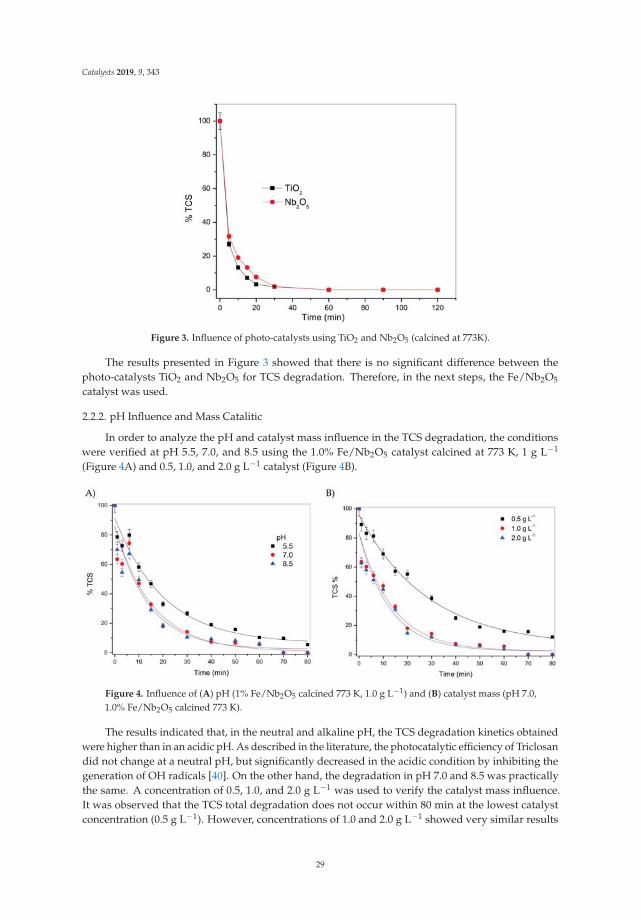
Catalysts 2019, 9, 343
Figure 3. Influence of photo-catalysts using TiO2 and Nb2O5 (calcined at 773K).
The results presented in Figure 3 showed that there is no significant difference between thephoto-catalysts TiO2 and Nb2O5 for TCS degradation. Therefore, in the next steps, the Fe/Nb2O5
catalyst was used.
2.2.2. pH Influence and Mass Catalitic
In order to analyze the pH and catalyst mass influence in the TCS degradation, the conditionswere verified at pH 5.5, 7.0, and 8.5 using the 1.0% Fe/Nb2O5 catalyst calcined at 773 K, 1 g L−1
(Figure 4A) and 0.5, 1.0, and 2.0 g L−1 catalyst (Figure 4B).
Figure 4. Influence of (A) pH (1% Fe/Nb2O5 calcined 773 K, 1.0 g L−1) and (B) catalyst mass (pH 7.0,1.0% Fe/Nb2O5 calcined 773 K).
The results indicated that, in the neutral and alkaline pH, the TCS degradation kinetics obtainedwere higher than in an acidic pH. As described in the literature, the photocatalytic efficiency of Triclosandid not change at a neutral pH, but significantly decreased in the acidic condition by inhibiting thegeneration of OH radicals [40]. On the other hand, the degradation in pH 7.0 and 8.5 was practicallythe same. A concentration of 0.5, 1.0, and 2.0 g L−1 was used to verify the catalyst mass influence.It was observed that the TCS total degradation does not occur within 80 min at the lowest catalystconcentration (0.5 g L−1). However, concentrations of 1.0 and 2.0 g L−1 showed very similar results
29

Catalysts 2019, 9, 343
(Figure 4B). Therefore, a pH 7.0 and a catalyst mass concentration of 1.0 g L−1 were maintained, in thefollowing tests.
2.2.3. Adsorption, Photolysis, and Photo Catalyst Tests
The results of adsorption and photocatalytic for the TCS degradation using the Fe/Nb2O5
immobilized catalysts are shown in Figure 5. The adsorption was performed in the first 30 minbefore the photo catalysis.
Figure 5. Adsorption and photo catalysis results (pH = 7.0, 1 g L−1).
It was observed that there was an instability in the adsorption process (adsorption and desorptionof TCS on catalytic surface), which indicates that only the adsorption process is not adequate for theTCS removal. In addition, it was verified that a greater adsorption does not directly imply a higherrate of degradation. For example, 0.5 wt % catalyst calcined at 873 K obtained approximately 40%adsorption. However, other catalysts saw a similar level of degradation of TCS, without the sameadsorption capacity. This catalyst had a high specific surface area (~149 m2 g−1). The photocatalyticdegradation presented an exponential profile for all catalysts studied. The data obtained indicated thatall the photo catalysts degraded the TCS after 80 min of the reaction.
It is also possible to verify that catalysts with higher calcination temperatures of 873 K and 913 Khave a higher photocatalytic activity in the first 15 min of the reaction, when compared to the othercatalysts used.
These values show that the photocatalytic degradation of TCS in an aqueous solution canbe described by a pseudo-first order kinetic model. In addition, to compare the results obtained,the half-life (t1/2) was evaluated, which indicates the approximate time required for the contaminantconcentration to be halved.
Its half-life was calculated according to Equation (1), where k is the constant reaction rate.The results are shown in Table 3.
t( 12 )
= −ln(
12
)
k(1)
30
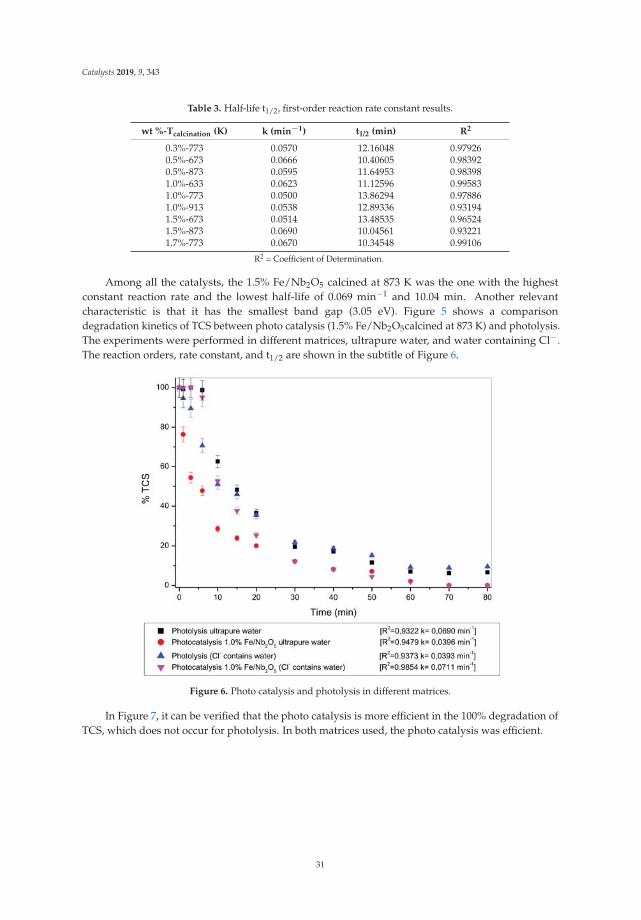
Catalysts 2019, 9, 343
Table 3. Half-life t1/2, first-order reaction rate constant results.
wt %-Tcalcination (K) k (min−1) t1/2 (min) R2
0.3%-773 0.0570 12.16048 0.979260.5%-673 0.0666 10.40605 0.983920.5%-873 0.0595 11.64953 0.983981.0%-633 0.0623 11.12596 0.995831.0%-773 0.0500 13.86294 0.978861.0%-913 0.0538 12.89336 0.931941.5%-673 0.0514 13.48535 0.965241.5%-873 0.0690 10.04561 0.932211.7%-773 0.0670 10.34548 0.99106
R2 = Coefficient of Determination.
Among all the catalysts, the 1.5% Fe/Nb2O5 calcined at 873 K was the one with the highestconstant reaction rate and the lowest half-life of 0.069 min−1 and 10.04 min. Another relevantcharacteristic is that it has the smallest band gap (3.05 eV). Figure 5 shows a comparisondegradation kinetics of TCS between photo catalysis (1.5% Fe/Nb2O5calcined at 873 K) and photolysis.The experiments were performed in different matrices, ultrapure water, and water containing Cl−.The reaction orders, rate constant, and t1/2 are shown in the subtitle of Figure 6.
Figure 6. Photo catalysis and photolysis in different matrices.
In Figure 7, it can be verified that the photo catalysis is more efficient in the 100% degradation ofTCS, which does not occur for photolysis. In both matrices used, the photo catalysis was efficient.
31
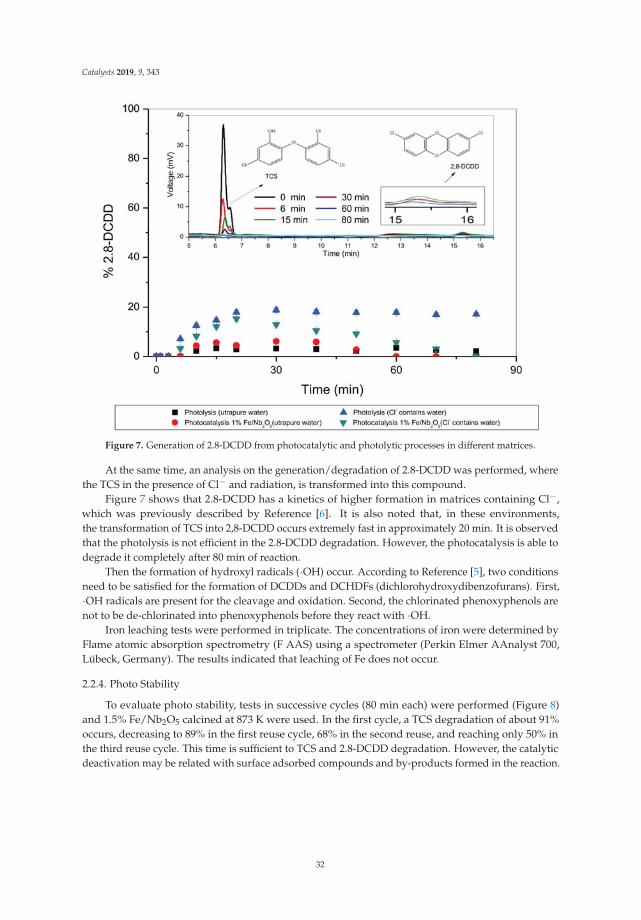
Catalysts 2019, 9, 343
Figure 7. Generation of 2.8-DCDD from photocatalytic and photolytic processes in different matrices.
At the same time, an analysis on the generation/degradation of 2.8-DCDD was performed, wherethe TCS in the presence of Cl− and radiation, is transformed into this compound.
Figure 7 shows that 2.8-DCDD has a kinetics of higher formation in matrices containing Cl−,which was previously described by Reference [6]. It is also noted that, in these environments,the transformation of TCS into 2,8-DCDD occurs extremely fast in approximately 20 min. It is observedthat the photolysis is not efficient in the 2.8-DCDD degradation. However, the photocatalysis is able todegrade it completely after 80 min of reaction.
Then the formation of hydroxyl radicals (·OH) occur. According to Reference [5], two conditionsneed to be satisfied for the formation of DCDDs and DCHDFs (dichlorohydroxydibenzofurans). First,·OH radicals are present for the cleavage and oxidation. Second, the chlorinated phenoxyphenols arenot to be de-chlorinated into phenoxyphenols before they react with ·OH.
Iron leaching tests were performed in triplicate. The concentrations of iron were determined byFlame atomic absorption spectrometry (F AAS) using a spectrometer (Perkin Elmer AAnalyst 700,Lübeck, Germany). The results indicated that leaching of Fe does not occur.
2.2.4. Photo Stability
To evaluate photo stability, tests in successive cycles (80 min each) were performed (Figure 8)and 1.5% Fe/Nb2O5 calcined at 873 K were used. In the first cycle, a TCS degradation of about 91%occurs, decreasing to 89% in the first reuse cycle, 68% in the second reuse, and reaching only 50% inthe third reuse cycle. This time is sufficient to TCS and 2.8-DCDD degradation. However, the catalyticdeactivation may be related with surface adsorbed compounds and by-products formed in the reaction.
32
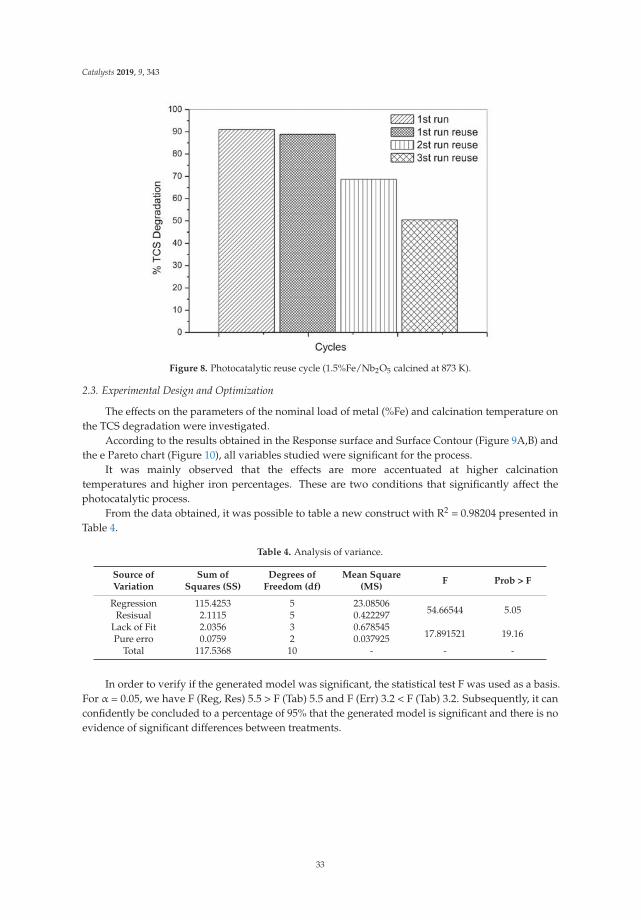
Catalysts 2019, 9, 343
Figure 8. Photocatalytic reuse cycle (1.5%Fe/Nb2O5 calcined at 873 K).
2.3. Experimental Design and Optimization
The effects on the parameters of the nominal load of metal (%Fe) and calcination temperature onthe TCS degradation were investigated.
According to the results obtained in the Response surface and Surface Contour (Figure 9A,B) andthe e Pareto chart (Figure 10), all variables studied were significant for the process.
It was mainly observed that the effects are more accentuated at higher calcinationtemperatures and higher iron percentages. These are two conditions that significantly affect thephotocatalytic process.
From the data obtained, it was possible to table a new construct with R2 = 0.98204 presented inTable 4.
Table 4. Analysis of variance.
Source ofVariation
Sum ofSquares (SS)
Degrees ofFreedom (df)
Mean Square(MS)
F Prob > F
Regression 115.4253 5 23.0850654.66544 5.05Resisual 2.1115 5 0.422297
Lack of Fit 2.0356 3 0.67854517.891521 19.16Pure erro 0.0759 2 0.037925
Total 117.5368 10 - - -
In order to verify if the generated model was significant, the statistical test F was used as a basis.For α = 0.05, we have F (Reg, Res) 5.5 > F (Tab) 5.5 and F (Err) 3.2 < F (Tab) 3.2. Subsequently, it canconfidently be concluded to a percentage of 95% that the generated model is significant and there is noevidence of significant differences between treatments.
33
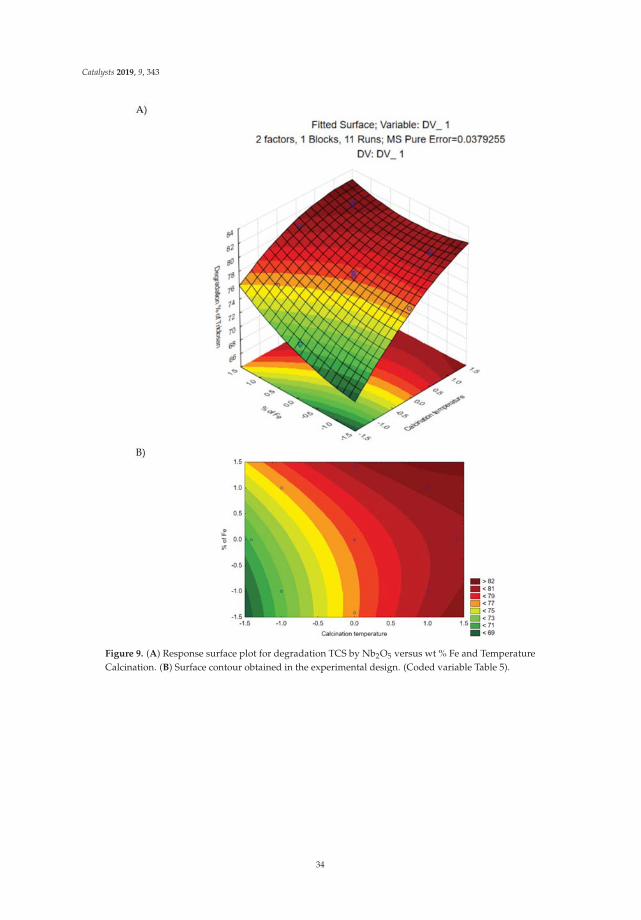
Catalysts 2019, 9, 343
Figure 9. (A) Response surface plot for degradation TCS by Nb2O5 versus wt % Fe and TemperatureCalcination. (B) Surface contour obtained in the experimental design. (Coded variable Table 5).
34
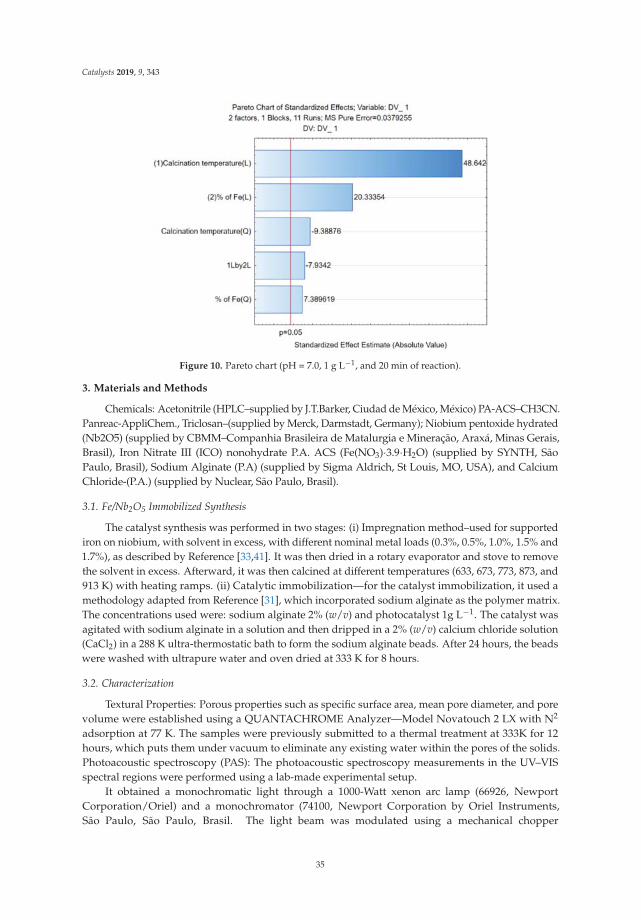
Catalysts 2019, 9, 343
Figure 10. Pareto chart (pH = 7.0, 1 g L−1, and 20 min of reaction).
3. Materials and Methods
Chemicals: Acetonitrile (HPLC–supplied by J.T.Barker, Ciudad de México, México) PA-ACS–CH3CN.Panreac-AppliChem., Triclosan–(supplied by Merck, Darmstadt, Germany); Niobium pentoxide hydrated(Nb2O5) (supplied by CBMM–Companhia Brasileira de Matalurgia e Mineração, Araxá, Minas Gerais,Brasil), Iron Nitrate III (ICO) nonohydrate P.A. ACS (Fe(NO3)·3.9·H2O) (supplied by SYNTH, SãoPaulo, Brasil), Sodium Alginate (P.A) (supplied by Sigma Aldrich, St Louis, MO, USA), and CalciumChloride-(P.A.) (supplied by Nuclear, São Paulo, Brasil).
3.1. Fe/Nb2O5 Immobilized Synthesis
The catalyst synthesis was performed in two stages: (i) Impregnation method–used for supportediron on niobium, with solvent in excess, with different nominal metal loads (0.3%, 0.5%, 1.0%, 1.5% and1.7%), as described by Reference [33,41]. It was then dried in a rotary evaporator and stove to removethe solvent in excess. Afterward, it was then calcined at different temperatures (633, 673, 773, 873, and913 K) with heating ramps. (ii) Catalytic immobilization—for the catalyst immobilization, it used amethodology adapted from Reference [31], which incorporated sodium alginate as the polymer matrix.The concentrations used were: sodium alginate 2% (w/v) and photocatalyst 1g L−1. The catalyst wasagitated with sodium alginate in a solution and then dripped in a 2% (w/v) calcium chloride solution(CaCl2) in a 288 K ultra-thermostatic bath to form the sodium alginate beads. After 24 hours, the beadswere washed with ultrapure water and oven dried at 333 K for 8 hours.
3.2. Characterization
Textural Properties: Porous properties such as specific surface area, mean pore diameter, and porevolume were established using a QUANTACHROME Analyzer—Model Novatouch 2 LX with N2
adsorption at 77 K. The samples were previously submitted to a thermal treatment at 333K for 12hours, which puts them under vacuum to eliminate any existing water within the pores of the solids.Photoacoustic spectroscopy (PAS): The photoacoustic spectroscopy measurements in the UV–VISspectral regions were performed using a lab-made experimental setup.
It obtained a monochromatic light through a 1000-Watt xenon arc lamp (66926, NewportCorporation/Oriel) and a monochromator (74100, Newport Corporation by Oriel Instruments,São Paulo, São Paulo, Brasil. The light beam was modulated using a mechanical chopper
35

Catalysts 2019, 9, 343
(SR540—Stanford Research Systems). A lab-made photoacoustic cell was designed to have a verylow volume and was made of aluminum block. It was machined to hold samples with dimensionsof up to 10 mm in diameter and 1.5 mm in thickness. This allowed light to enter through a hightransparent quartz window of a 6-mm diameter and 2-mm thickness. The distance of the microphonechamber was 15 mm. It was connected to the sample holder room through a 1-mm diameter duct.The capacitive microphone (4953, Brüel&Kjaer) used was a 12-mm diameter. It was very sensitiveand presented a gain of 50 mV/Pa, and a flat frequency response between 3 to 10 kHz. It also useda lock-in amplifier (SR830, Stanford Research System). All the photoacoustic spectra were obtainedat a 23 Hz modulation frequency and recorded between 225 to 700 nm. Data was acquired using apersonal computer, and the PAS spectra were normalized regarding the carbon black signal. The bandgap energies were established through Equation (2):
λ =hc
Egap=
1240Egap
(2)
where Egap is the band gap energy in eV units. The direct method was applied to obtain the values, i.e.,m = 2.
X-ray diffraction: The samples were measured through a Rigaku-Denki Diffractometer withCu-Kα radiation (λ = 1.5406 Å) at 40 kV voltage and 40 mA current. Subsequently, the obtainedpatterns were compared with the diffraction dataset cards from the ICDD.
Scanning electron microscopy (SEM/EDS): For the analysis, a scanning electron microscope(model VEGA 3 LMU, brand TESCAN) was used, complete with W 30kV filament, 3.0 nm resolution,SE detectors, and retractable BSE. It also featured a low vacuum mode (500 Pa), chamber with internaldiameter of 230 mm, and a door width of 148 mm. The microscope also included compucentric rotation,5-axis fully motorized, with X movement: 80 mm, Y: 60 mm and Z: 47mm, CCD camera for viewingsamples, and “chamberview” software, VegaTC operational software, data processing system, andtrack-ball. The Microscope is also equipped with the EDS detector, dry, model AZTec Energy X-Act,resolution 130 eV, brand Oxford.
3.3. Photocatalytic Tests
The reaction mixture was transferred to a reactor consisting of a cylindrical Pyrex cell(5.0 × 10⁻⁴ m3) surrounded by a water jacket and a magnetic stirrer. This was used to ensure aconstant temperature (298 K) with ultra-thermostatic bath and solution homogeneity throughout theexperiment. The tests were performed for 80 min and opened to the air. Oxygen was pumped at8.3 × 10−9 m3 s−1 into the solution containing 10 ppm of TCS and a photo catalyst. The TCS 10 mg L−1
solution was prepared with 70% of acetonitrile and 30% of ultrapure water. A total of 500 mL wasinserted into the reactor, along with the catalyst mass. UV light was irradiated by using a 125-Wmedium pressure mercury lamp, the radiation incidence was measured (2.48 mW/cm2). Aliquotswere collected at regular intervals of time. Chromatographic analysis of Triclosan was performed witha high performance liquid chromatograph YL Clarity model 9100 equipped with a pre-column, reversephase C-18 column, and visible ultraviolet detector (UV-VIS). It used the standard acetonitrile HPLCfor chemical analysis and the pH control of sodium hydroxide and nitric acid.
Different conditions were studied: pH 5.5, 7.0, and 8.5, catalyst mass 0.5, 1.0, and 2.0 g L−1 andcalcination temperature of the catalyst between 633 and 913 K. The adsorption tests were performedby applying the same procedures of the previous photocatalytic test, but without the presence of light.The photolysis experiments were conducted using no catalysts and followed the same procedures ofthe photocatalytic tests. The tests were completed twice.
Tests about photo stability were performed in four successive cycles. Between the cycles,the catalyst was filtered, washed (ultrapure water), and dried.
36

Catalysts 2019, 9, 343
3.4. Optimization of Experimental Parameters
The effects of operating parameters of TCS degradation using the Fe/Nb2O5 catalyst wereanalyzed by using a central composite factorial. The general form of this factorial design is 2n plus astar configuration (±α = 2n(1/4)
), with a central point, where n and 2 represent the number of factorsand the two levels of work [33], respectively. The levels are defined as low level (−1), high level (+1),central point (0), and two outer points. The independent variables were the Calcination Temperatureof catalysts and nominal metal load (%Fe), while the dependent variable Y (variable response) wasthe TCS removal percentage. The settings for the independent variables were as follows (low/highvalue): calcination Temperature: 633 to 913 K, and nominal metal load: 0.3 to 1.7 %Fe. Table 5 showsexperimental results of the independent variables. The values for coded and decoded variables arealso shown.
Table 5. Design matrix and experimental results for the central composite factorial design.
Run Calcination Temperature (K) %Fe and (Coded Variable)
1 873 (+1) 1.5 (+1)2 873 (+1) 0.5 (−1)3 673 (−1) 1.5 (+1)4 673 (−1) 0.5 (−1)5 913 (+α) 1.0 (0)6 633 (−α) 1.0 (0)7 773 (0) 0.3 (−α)8 773 (0) 1.7 (+α)9 773 (0) 1.0 (0)10 773 (0) 1.0 (0)11 773 (0) 1.0 (0)
4. Conclusions
The Fe/Nb2O5 immobilized catalysts were efficient in the Triclosan and 2,8-dichlorodibenzene-p-dioxin degradation. The characterization indicated that a variation in the specific surface area occursfor the catalysts studied. This is influenced by the calcination temperature and nominal metal loading.
In the XRD analysis, catalysts calcined at 673 K or at lower temperatures have a non-crystallinestructure. Above this calcination temperature, structures in the form T and TT were found. The bandgap results, in general, see a decrease of the band gap in accordance with an increase in the nominalmetallic charge of Fe. On the other hand, when the calcination temperature increases, the band gap alsotends to increase. The SEM/EDS analysis showed the formation of agglomerates throughout the spheresurface and rugosity. The photocatalytic tests indicated that the operating optimum conditions werepH 7.0 and catalyst mass of 1.0 g L−1. The adsorption process is not efficient for the TCS removal and ahigher adsorption on the catalytic surface does not imply a faster photocatalytic process. All catalystswere efficient in the TCS degradation after 80 min of reaction. The catalysts 1.5% Fe/Nb2O5 calcined at873 K showed the highest constant reaction rate and the lowest half-life—0.069 min−1 and 10.04 min.This was, consequently, the best catalyst studied.
Photo catalysis was efficient (100% degradation) in both matrices studied (ultrapure and watercontaining Cl−). On the other hand, this did not occur with photolysis. In the process, the generationand subsequent degradation of 2.8-DCDD occurred. This degradation was larger in matrices containingCl−, since it was totally degraded after 80 min of reaction. The parameters studied (nominal metal load(%Fe) and calcination temperature) in the experimental design and optimization were significant forthe process. From the results obtained, it was concluded that the greater the amount of Fe percentageand calcination temperature, the better the result.
Author Contributions: M.Z.F, E.A., and E.S.C. carried out the experiment, conceived, and planned theexperiments. R.B. and D.T.D. Characterization Analysis. G.G.L. and O.A.A.D.S. original draft preparation.All authors discussed the results and contributed to the final manuscript.
37

Catalysts 2019, 9, 343
Acknowledgments: The authors thank the CBMM-CompanhiaBrasileira de Matalurgia e Mineração by theNiobium, and CNPq agency.
Conflicts of Interest: The authors declare no conflict of interest.
References
1. Bedoux, G.; Roig, B.; Thomas, O.; Dupont, V.; Le Bot, B. Occurrence and toxicity of antimicrobial triclosanand by-products in the environment. Environ. Sci. Pollut. Res. 2012, 19, 1044–1065. [CrossRef]
2. Reiss, R.; Mackay, N.; Habig, C.; Griffin, J. An ecological risk assessment for triclosan in lotic systemsfollowing discharge from wastewater treatment plants in the United States. Environ. Toxicol. Chem. 2002, 21,2483–2492. [CrossRef]
3. Singer, H.; Müller, S.; Tixier, C.; Pillonel, L. Triclosan: Occurrence and Fate of a Widely Used Biocide inthe Aquatic Environment: Field Measurements in Wastewater Treatment Plants, Surface Waters, and LakeSediments. Environ. Sci. Technol. 2002, 36, 4998–5004. [CrossRef] [PubMed]
4. Wang, J.L.; XU, L.J. Advanced oxidation processes for wastewater treatment: formation of hydroxyl radicaland application. Crit. Rev. Environ. Sci. Technol. 2012, 42, 251–325. [CrossRef]
5. Niu, J.; Dai, Y.; Yin, L.; Shang, J.; Crittenden, J.C. Photocatalytic reduction of triclosan on Au-Cu2O nanowirearrays as plasmonic photoatalysts under visible light irradiation. Phys. Chem. Chem. Phys. 2015, 17,17421–17428. [CrossRef] [PubMed]
6. Buth, J.M.; Steen, P.O.; Sueper, C.; Blumentritt, D.; Vikesland, P.J.; Arnold, W.A.; McNeill, K. DioxinPhotoproducts of Triclosan and Its Chlorinated Derivatives in Sediment Cores. Environ. Sci. Technol.2010, 44, 4545–4551. [CrossRef]
7. UNEP—United Nations Environment Programme. Persistent Organic Pollutants. 2013. Available online:http://www.chem.unep.ch/pops/ (accessed on 22 January 2018).
8. Chen, J.; Huang, Y.; Li, G.; An, T.; Hu, Y.; Li, Y. VOCs elimination and health risk reduction in e-wastedismantling workshop using integrated techniques of electrostatic precipitation with advanced oxidationtechnologies. J. Hazard. Mater. 2016, 302, 395–403. [CrossRef] [PubMed]
9. Zeng, Z.-Q.; Wang, J.-F.; Li, Z.-H.; Sun, B.-C.; Shao, L.; Li, W.-J.; Zou, H.-K. The Advanced Oxidation Processof Phenol Solution by O3/H2O2in a Rotating Packed Bed. Ozone Sci. Eng. 2013, 35, 101–108. [CrossRef]
10. Abdullah, A.M.; Al-Thani, N.J.; Tawbi, K.; Al-Kandari, H. Carbon/nitrogen-doped TiO2: New synthesisroute, characterization and application for phenol degradation. Arab. J. Chem. 2016, 9, 229–237. [CrossRef]
11. Pelaez, M.; Nolan, N.T.; Pillai, S.C.; Seery, M.K.; Falaras, P.; Kontos, A.G. A review on the visible light activetitanium dioxide photocatalysts for environmental applications. Appl. Catal. B Environ. 2012, 125, 331–349.[CrossRef]
12. Espino-Estévez, M.R.; Fernández-Rodríguez, C.; González-Díaz, O.M. Effect of TiO2–Pd and TiO2–Ag on thephotocatalytic oxidation of diclofenac, isoproturon and phenol. Chem. Eng. J. 2016, 298, 82–95. [CrossRef]
13. Léonard, G.L.; Pàez, C.A.; Ramírez, A.E.; Mahy, J.G.; Heinrichs, B. Interactions between Zn2+ or ZnO withTiO2 to produce an efficient photocatalytic, superhydrophilic and aesthetic glass. J. Photochem. Photobiol.A Chem. 2018, 350, 32–43. [CrossRef]
14. Yan, J.; Wu, G.; Guan, N.; Li, L. Nb2O5/TiO2 heterojunctions: Synthesis strategy and photocatalytic activity.Appl. Catal. B 2014, 152–153, 280–288. [CrossRef]
15. Kalan, R.E.; Yaparatne, S.; Amirbahman, A.; Tripp, C.P. P25 titanium dioxide coated magnetic particles:Preparation, characterization and photocatalytic activity. Appl. Catal. B 2016, 187, 249–258. [CrossRef]
16. Castro, D.C. Síntese de Nb2O5 mesoporo para aplicação em fotocatálise heterogênea. Master’s Degree,Universidade Federal de Mato Grosso do Sul, Campo Grande, MS, Brazil, 2014.
17. Zhao, Y.; Zhou, X.; Ye, L.; Chi Edman Tsang, S. Nanostructured Nb2O5 catalysts. Nano Rev. 2012, 3, 17631.[CrossRef]
18. Dong, Y.; Tang, D.; Li, C. Photocatalytic oxidation of methyl orange in water phase by immobilizedTiO2-carbon nanotube nanocomposite photocatalyst. Appl. Surf. Sci. 2014, 296, 1–7. [CrossRef]
19. Katsaros, G.; Stergiopoulos, T.; Arabatzis, I.; Papadokostaki, K.; Falaras, P. A solvent-freecomposite polymer/inorganic oxide electrolyte for high efficiency solid-state dye-sensitized solar cells.J. Photochem. Photobiol. 2002, 149, 191–198. [CrossRef]
38
Catalysts 2019, 9, 343
20. Sakkas, V.; Arabatzis, I.; Konstantinou, I.; Dimou, A.; Albanis, T.; Falaras, P. Metolachlor photocatalyticdegradation using TiO2 photocatalysts. Appl. Catal. B Envioron. 2004, 49, 195–205. [CrossRef]
21. Santos, L.M.; Machado, W.A.; França, M.D.; Borges, K.A.; Paniago, R.M.; Patrocinio, A.O.T.; Machado, A.E.H.Structural characterization of Ag-doped TiO2 with enhanced photocatalytic activity. RSC Adv. 2015, 5,103752–103759. [CrossRef]
22. Arcanjo, G.S.; Mounteer, A.H.; Bellato, C.R.; da Silva, L.M.M.; Brant Dias, S.H.; da Silva, P.R. Heterogeneousphotocatalysis using TiO2 modified with hydrotalcite and iron oxide under UV–visible irradiation for colorand toxicity reduction in secondary textile mill effluent. J. Environ. Manage. 2018, 211, 154–163. [CrossRef]
23. Yadav, H.M.; Otari, S.V.; Koli, V.B.; Mali, S.S.; Hong, C.K.; Pawar, S.H.; Delekar, S.D. Preparation andcharacterization of copper-doped anatase TiO2 nanoparticles with visible light photocatalytic antibacterialactivity. J. Photochem. Photobiol. 2014, 280, 32–38. [CrossRef]
24. Fontana, K.B.; Chaves, E.S.; Kosera, V.S.; Lenzi, G.G. Barium removal by photocatalytic process:An alternative for water treatment. J. Water Process Eng. 2018, 22, 163–171. [CrossRef]
25. Nakajima, K.; Baba, Y.; Noma, R.; Kitano, M.N.; Kondo, J.; Hayashi, S.; Hara, M. Nb2O5·nH2O as aHeterogeneous Catalyst with Water-Tolerant Lewis Acid Sites. J. Am. Chem. Soc. 2011, 133, 4224–4227.[CrossRef]
26. Morais, L.A.; Adán, C.; Araujo, A.S.; Guedes, A.P.M.A.; Marugán, J. Synthesis, Characterization, and PhotonicEfficiency of Novel Photocatalytic Niobium Oxide Materials. Glob. Chall. 2017, 1, 1700066. [CrossRef]
27. Sreethawong, T.; Ngamsinlapasathian, S.; Yoshikawa, S. Crystalline mesoporous Nb2O5 nanoparticlessynthesized via a surfactant-modified sol–gel process. Mater. Lett. 2012, 78, 135–138. [CrossRef]
28. Liu, J.; Zhang, T.; Wang, Z.; Dawson, G.; Chen, W. Simple pyrolysis of urea into graphitic carbon nitride withrecyclable adsorption and photocatalytic activity. J. Mater. Chem. 2011, 21, 14398. [CrossRef]
29. Greenwood, N.N.; Earnshaw, A. Chemistry of the Elements, 2nd ed; Butterworth-Heinemann: Oxford, UK, 1998.30. Yamashita, H.; Harada, M.; Misaka, J.; Takeuchi, M.; Neppolian, B.; Anpo, M. Photocatalytic degradation
of organic compounds diluted in water using visible light-responsive metal ion-implanted TiO2 catalysts:Fe ion-implanted TiO2. Catal. Today 2003, 84, 191–196. [CrossRef]
31. Malengreaux, C.M.; Pirard, S.L.; Léonard, G.; Mahy, J.G.; Klobes, B.; Herlitschke, M.; Hermann, R.;Heinrichs, B.; Bartlett, J.R. Study of the photocatalytic activity of Fe3+, Cr3+, La3+ and Eu3+ single- dopedand co-doped TiO2 catalysts produced by aqueous sol-gel processing. J. Alloys Compd. 2017, 691, 726–738.[CrossRef]
32. Yoshimura, K.; Miki, T.; Iwama, S.; Tanemura, S. Characterization of niobium oxide electrochromic thin filmsprepared by reactive d.c. magnetron sputtering. Thin Solid Films 1996, 281–282, 235–238. [CrossRef]
33. Weibin, Z.; Weidong, W.; Xueming, W.; Xinlu, C.; Dawei, Y.; Changle, S.; Li, B. The investigation of NbO2
and Nb2O5 electronic structure by XPS, UPS and first principles methods. Surf. Interface Anal. 2013, 45,1206–1210. [CrossRef]
34. Scheidt, G. Caracterização óptica de filmes finos de NbOx obtidos por sputtering reativo. Master’s Degree inNuclear Technology-Materials-Nuclear and Energy Research Institute, University of São Paulo, São Paulo,Brazil, 2014.
35. Hamaguchi, R. Preparação, caracterização e estudo das propriedades fotocatalíticas de catalisadores obtidosde dopagem de TiO2 e Nb2O5. Master’s Degree, DQ-FFCLRP-USP, Ribeirão Preto, Brazil, 2011.
36. Prado, A.G.S.; Bolzon, L.B.; Pedroso, C.P.; Moura, A.O.; Costa, L.L. Nb2O5 as efficient and recyclablephotocatalyst for indigo carmine degradation. Appl. Catal. B 2008, 82, 219–224. [CrossRef]
37. Gallo, I.F.L. Preparação e caracterização de fotocatalisadores heterogêneos de titânio e nióbio e avaliação dopotencial de fotodegradação. Master’s Degree, FFCL-USP, Ribeirão Preto, Brazil, 2016.
38. Dalponte, I.; Mathias, A.L.; Jorge, R.M.M.; Weinschutz, R. Degradação fotocatalítica de tartrazina com TiO2
imobilizado em esferas de alginato. Quim. Nova. 2016, 39, 1165–1169. [CrossRef]39. Kosera, V.S.; Cruz, T.M.; Chaves, E.S.; Tiburtius, E.R.L. Triclosan degradation by heterogeneous
photocatalysis using ZnO immobilized in biopolymer as catalyst. J. Photochem. Photobiol. 2017, 344, 184–191.[CrossRef]
39

Catalysts 2019, 9, 343
40. Son, H.-S.; Lee, S.-J.; Cho, I.-H.; Zoh, K.-D. Kinetics and mechanism of TNT degradation in TiO2
photocatalysis. Chemosphere 2004, 57, 309–317. [CrossRef]41. Lenzi, G.G.; Fávero, C.V.B.; Colpini, L.M.S.; Bernabe, H.; Baesso, M.L.; Specchia, S.; Santos, O.A.A.
Photocatalytic reduction of Hg(II) on TiO2 and Ag/TiO2 prepared by the sol–gel and impregnation methods.Desalination 2011, 270, 241–247. [CrossRef]
© 2019 by the authors. Licensee MDPI, Basel, Switzerland. This article is an open accessarticle distributed under the terms and conditions of the Creative Commons Attribution(CC BY) license (http://creativecommons.org/licenses/by/4.0/).
40

catalysts
Article
Effect of Cerium Precursor in the Synthesis ofCe-MCM-41 and in the Efficiency for Liquid-PhaseOxidation of Benzyl Alcohol
Carlos M. Aiube 1,* , Karolyne V. de Oliveira 2 and Julio L. de Macedo 1,*
1 Group of New Materials for Sustainable Chemical Catalysis, Institute of Chemistry, Campus Darcy Ribeiro,University of Brasília, Brasília-DF 70910-900, Brazil
2 Laboratory of Materials and Fuels, Institute of Chemistry, Campus Darcy Ribeiro, University of Brasília,Brasília-DF 70910-900, Brazil; [email protected]
* Correspondence: [email protected] (C.M.A.); [email protected] (J.L.d.M.); Tel.: +55-61-3107-3877 (J.L.d.M.)
Received: 14 March 2019; Accepted: 17 April 2019; Published: 23 April 2019
Abstract: Understanding the effects of synthetic parameters in the catalytic activity of heterogeneouscatalysts is of utmost importance when aiming for optimal reaction conditions. Hence, we disclosein this work the synthesis and characterization of cerium-modified MCM-41 materials. In addition,it was observed for the first time, differences in catalytic activity when using different ceriumsynthetic precursors: CeCl3·7H2O and Ce(NO3)3·6H2O (Ce-MCM-Cl and Ce-MCM-NO3, respectively).A mechanism for cerium incorporation in MCM-41 was proposed, where [Ce(OH)3] species werehydrogen bonded to silicate anions, forming framework Ce-O-Si bonds during condensationand, consequently, causing distortion of the typical hexagonal mesophase. It was also observedthat Ce(OH)3 formed aggregated layers with template assemblies during synthesis, resulting innon-framework CeO2 species on the MCM-41 surface after calcination. These CeO2 species werepreferentially formed for Ce-MCM-NO3 and were attributed to the nitrate ions’ strong binding totemplate molecules. In the solvent free liquid-phase oxidation of benzyl alcohol (BzOH), Ce-MCM-Clachieved better BzOH conversions and benzaldehyde (BzD) yields, while Ce-MCM-NO3 offeredincreased BzD selectivity. The catalysts’ reusability was also studied over three catalytic runs, whereCe-MCM-NO3 was more resistant than Ce-MCM-Cl towards deactivation. The observed catalyticbehavior shows the importance of metal precursors in the obtainment of materials with desirablefinal properties.
Keywords: MCM-41; cerium; benzyl alcohol; oxidation; benzaldehyde
1. Introduction
The need for starting materials in industrial processes makes fine chemistry one of the most relevantsectors in the modern industry, having an expressive economic impact in our society. By definition, finechemicals are economically relevant products manufactured in a limited content (less than 5000 tonsper year) with high added-value associated to its production process and end use [1]. In Brazil, morethan 90% of the income from this sector belongs to the production of important starting materials forpharmaceutical, agricultural, and livestock industries [2]. According to data collected by the BrazilianAssociation of Chemical Industries (ABIQUIM), the cited industries ended 2017 with a net billingof approximately US$25.7 billion altogether, which corresponds to 21.4% of the national chemicalindustry total income [3]. It is noteworthy that the sustainability of industrial actions must be a majormotive to investigate alternative routes for established chemical processes. This concern arises fromthe main disadvantage of fine chemistry: The generation of about 5 to 50 kg of waste per kg of productdue to the use of homogeneous catalysis, stoichiometric reagents, and harsh reaction conditions [4,5].
Catalysts 2019, 9, 377; doi:10.3390/catal9040377 www.mdpi.com/journal/catalysts41
Catalysts 2019, 9, 377
Benzaldehyde (BzD) is an essential fine chemical material for several industrial sectors, beingused as a flavoring agent, as a denaturant, as a fragrance, and as a precursor to the manufacture ofimportant products, such as, cinnamaldehyde, mandelic acid, and malachite green [6]. According to aneconomic report from Transparent Market Research [7], the global revenue of the benzaldehyde marketsurpassed US$234 million in 2014 and the demand of approximately 80 Mt is expected to increase3.06% until 2023. Since the last century, benzaldehyde is produced following two main industrialprocesses [6,8]: (i) The alkali hydrolysis of benzal chloride; and (ii) the aerobic oxidation of toluene.Both reaction pathways present environmental and procedural drawbacks: High basicity of effluentsand a large amount of residues in the alkali hydrolysis; and high pressure and temperature at theexpense of low conversions in the aerobic oxidation [6,8]. Thus, the development of safer, moreefficient, and environmentally friendly technologies to improve the production of benzaldehyde isof great interest to the fine chemical industry. The liquid-phase oxidation of benzyl alcohol (BzOH)is an interesting alternative due to its intrinsic benefits: (i) Generation of low levels of effluents withlittle or no negative environmental effects [9]; (ii) use of milder conditions than the cited industrialprocesses, with temperatures and partial pressures (for oxidants, like molecular oxygen) not higherthan 150 ◦C and 3 atm, respectively [9,10]; and (iii) the protective effect of BzOH towards over-oxidationof benzaldehyde to benzoic acid (HBz), mainly due to the low dissociation energy of the methylenegroup C-H bond [11]. Hence, the study of this catalytic oxidation process offers good opportunitiesfor the renewal of the knowledge in catalytic oxidative processes, and in the preparation and use ofheterogeneous catalysts as well.
The application of numerous heterogeneous catalysts for both gas- and liquid-phase oxidationof BzOH has been reported in the literature [12–16] and microstructural/physicochemical aspects ofthese materials are decisive in their efficient application. For example, Della Pina and co-workers [12]reported the gas-phase oxidation of BzOH by air using 1 wt.% of gold and/or copper supportedon silica as catalysts. The monometallic materials exhibited lower conversion (75% for Au/SiO2) orselectivity (78% for Cu/SiO2) when compared to the bimetallic combination. Among these, the materialAu-Cu/SiO2 with an Au/Cu weight ratio = 4 was the best catalyst, showing 98% of BzOH conversionand >99% of selectivity towards BzD at 313 ◦C. Similarly, Enache and co-workers [13] used Au-Pd/TiO2
catalysts in the liquid-phase oxidation of BzOH under O2 constant pressure. The material containing 2.5wt.% of each metal showed good performance under mild conditions (pO2 = 0.2 MPa and T = 100 ◦C)when compared to their monometallic analogs, exhibiting 75% of BzOH conversion and 92% ofselectivity towards BzD after 8 h. Even though the good redox activity of metal nanoparticles in theactivation of oxygenated species to form peroxo/hydroperoxo intermediates via hydride transfer anddehydrogenative pathways is well known [17], the combination with other metallic nanoparticles seeksthe enhancement of the catalyst conversion, selectivity, and durability. Jia and co-workers [14] modifiedZSM-5 zeolites with sodium hydroxide to investigate their activity in the liquid-phase oxidation of BzOHwith hydrogen peroxide (H2O2/BzOH ratio = 1.3) at reflux conditions. All obtained materials presenteda higher Lewis acidity and external surface area after the alkali-treatment. The best catalyst was obtainedafter 0.5 h of the latter process, showing 53% of BzOH conversion and 86% of selectivity towards BzD.Both Lewis and Brønsted acid-base sites can play important roles in the efficiency of this process byperforming a dehydrogenative step in the methylene carbon that allows BzOH oxidation [14,18]. Chenand co-workers [16] synthesized a mesoporous hybrid material based on the interaction between theheteropolyacid H3PW12O40 and N”-(3-amino-2-hydroxypropyl)-N,N,N′,N′-tetramethylguanidiniumchloride (TMGHACl), an ionic liquid. The catalyst, [TMGHA]2.4H0.6PW12O40, was tested in thewater-mediated liquid-phase oxidation of BzOH with H2O2 to test the reaction viability in a triphasicsystem. The catalyst gave 98% of BzOH conversion and 94% of selectivity towards BzD at 90 ◦C after6 h. The interaction between the heteropolyanion PW12O40
3− in the catalyst and hydrogen peroxideforms {PO4[WO(O2)2]4}3− species that are active in oxidation reactions [19,20]. Also, the catalyst wasefficient in a great variety of pure and mixed solvents due to the polar groups of the ionic liquid,providing a range of triphasic systems that allow better catalyst recovery and benzaldehyde separation.
42
Catalysts 2019, 9, 377
MCM-41 (mobile composition of matter) is one of the most studied mesoporous silica-basedmolecular sieves [21]. These materials have desirable properties for heterogeneous catalysis dueto: (i) Long-range ordering of cylindrical mesopores in an hexagonal array; (ii) specific surfaceareas higher than 700 m2 g−1; (iii) tunable pore volumes between 0.7 and 1.2 cm3 g−1; and (iv) porediameter between 2.5 and 4.5 nm. Such properties allow a high dispersion of catalytic species, a betteraccessibility to these active sites, and increase the mass diffusion of reactants than those observed formicroporous materials [22]. This singular structure is possible because the synthesis procedure employslong-chain alkyl-ammonium surfactants that arrange themselves in rod-like micelles in water [23].Such supramolecular arrangements act as structural directing agents and define the manner that silicateoligomers will interact with the cationic head group before crystallizing in the final material [24].Therefore, disturbances in this molecular assembly might lead to microstructural changes in MCM-41solids, affecting their final properties as well [25,26].
In the context of benzyl alcohol oxidation, studies have shown the potential of MCM-41 assupport for active catalysts, including heteropolyacids [27,28], metal complexes [29,30], and metallicnanoparticles [31]. Few reports in the literature have dedicated attention to the catalytic activity ofmetal-incorporated MCM-41 (i.e., isomorphically substituted) in this subject [32,33], although examplestowards the oxidation of other substrates have been demonstrated over the years [34,35]. Specifically,cerium-incorporated MCM-41 (Ce-MCM-41) has been explored towards oxidation reactions withpositive results [36,37], mainly because of the active Ce4+/Ce3+ redox pair that allows oxygen mobilityin the structure of these materials. This feature refers to the ability of oxide-based Ce4+ materialsto generate and relinquish oxygen vacancies, easily generating reactive sites for the activation ofoxygenated species that can intermediate redox chemical processes. The insertion of cerium ionsin the inorganic framework of MCM-41 could propitiate the formation of distorted coordinativeenvironments not found on bulk materials and enhance the redox activity inherent to the element.So far, only Pal and co-workers [32] has explored this characteristic in the liquid-phase oxidationof BzOH. The material obtained by the researchers, named HSCS-20, presented 28.1 wt.% of thecerium content and showed 53.5% of BzOH conversion and 100% of selectivity towards BzD at roomtemperature for 24 h using tert-butyl hydroperoxide (TBHP) as the oxidant. Even though this resultencourages the investigation of mesoporous cerium-silica catalysts in oxidation reactions, syntheticaspects involving these materials must be taken into account. For example, little has been done tounravel the effect that cerium precursors have in the catalytic activity of Ce-MCM-41 in any oxidationreaction whatsoever.
This work studies the preparation of Ce-MCM-41 materials by using different metal precursors,CeCl3·7H2O and Ce(NO3)3·6H2O (generating the catalysts, Ce-MCM-Cl and Ce-MCM-NO3,respectively). The structural, morphological, and textural differences between the two materialswere demonstrated through characterization techniques (XRD, XRF, FTIR, UV-Vis, TG/DTG, DSC, N2
physisorption, solid state NMR, TEM, and Raman) and correlated with disturbances in the assemblyof surfactant molecules and the stability of cerium species in the synthesis medium. In addition,the catalytic activity of the materials was evaluated in the liquid-phase oxidation of BzOH with TBHP.
2. Results and Discussion
2.1. Catalysts’ Characterization
The results described below are related to the calcined materials, except for the Raman spectroscopyand thermal analysis also done for the as-synthesized materials. Also, the Ce3+ ions used as a precursorin the synthesis procedure were oxidized to Ce4+ during the two step calcination to remove thetemplate [38] (see Materials and Methods).
43
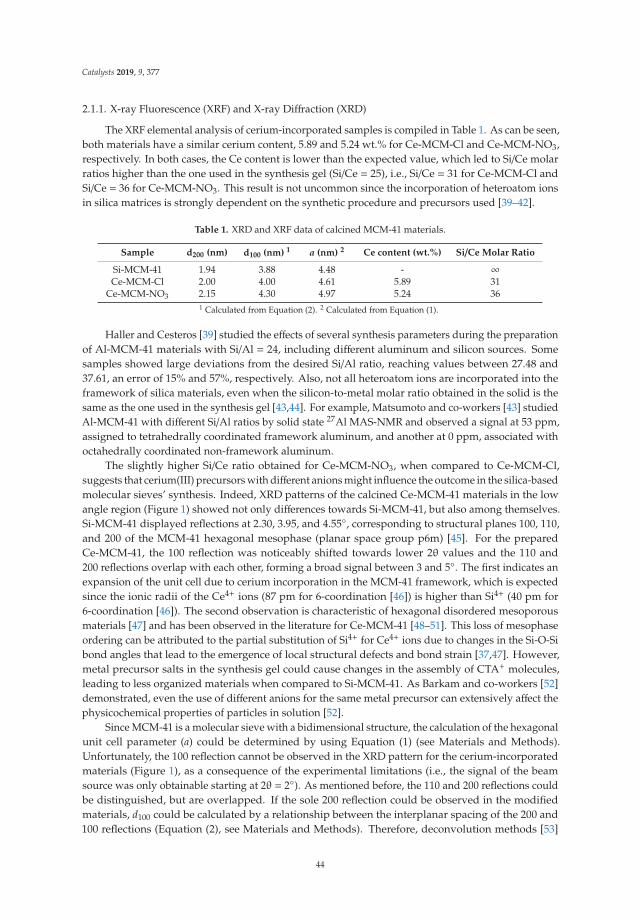
Catalysts 2019, 9, 377
2.1.1. X-ray Fluorescence (XRF) and X-ray Diffraction (XRD)
The XRF elemental analysis of cerium-incorporated samples is compiled in Table 1. As can be seen,both materials have a similar cerium content, 5.89 and 5.24 wt.% for Ce-MCM-Cl and Ce-MCM-NO3,respectively. In both cases, the Ce content is lower than the expected value, which led to Si/Ce molarratios higher than the one used in the synthesis gel (Si/Ce = 25), i.e., Si/Ce = 31 for Ce-MCM-Cl andSi/Ce = 36 for Ce-MCM-NO3. This result is not uncommon since the incorporation of heteroatom ionsin silica matrices is strongly dependent on the synthetic procedure and precursors used [39–42].
Table 1. XRD and XRF data of calcined MCM-41 materials.
Sample d200 (nm) d100 (nm) 1 a (nm) 2 Ce content (wt.%) Si/Ce Molar Ratio
Si-MCM-41 1.94 3.88 4.48 - ∞Ce-MCM-Cl 2.00 4.00 4.61 5.89 31
Ce-MCM-NO3 2.15 4.30 4.97 5.24 361 Calculated from Equation (2). 2 Calculated from Equation (1).
Haller and Cesteros [39] studied the effects of several synthesis parameters during the preparationof Al-MCM-41 materials with Si/Al = 24, including different aluminum and silicon sources. Somesamples showed large deviations from the desired Si/Al ratio, reaching values between 27.48 and37.61, an error of 15% and 57%, respectively. Also, not all heteroatom ions are incorporated into theframework of silica materials, even when the silicon-to-metal molar ratio obtained in the solid is thesame as the one used in the synthesis gel [43,44]. For example, Matsumoto and co-workers [43] studiedAl-MCM-41 with different Si/Al ratios by solid state 27Al MAS-NMR and observed a signal at 53 ppm,assigned to tetrahedrally coordinated framework aluminum, and another at 0 ppm, associated withoctahedrally coordinated non-framework aluminum.
The slightly higher Si/Ce ratio obtained for Ce-MCM-NO3, when compared to Ce-MCM-Cl,suggests that cerium(III) precursors with different anions might influence the outcome in the silica-basedmolecular sieves’ synthesis. Indeed, XRD patterns of the calcined Ce-MCM-41 materials in the lowangle region (Figure 1) showed not only differences towards Si-MCM-41, but also among themselves.Si-MCM-41 displayed reflections at 2.30, 3.95, and 4.55◦, corresponding to structural planes 100, 110,and 200 of the MCM-41 hexagonal mesophase (planar space group p6m) [45]. For the preparedCe-MCM-41, the 100 reflection was noticeably shifted towards lower 2θ values and the 110 and200 reflections overlap with each other, forming a broad signal between 3 and 5◦. The first indicates anexpansion of the unit cell due to cerium incorporation in the MCM-41 framework, which is expectedsince the ionic radii of the Ce4+ ions (87 pm for 6-coordination [46]) is higher than Si4+ (40 pm for6-coordination [46]). The second observation is characteristic of hexagonal disordered mesoporousmaterials [47] and has been observed in the literature for Ce-MCM-41 [48–51]. This loss of mesophaseordering can be attributed to the partial substitution of Si4+ for Ce4+ ions due to changes in the Si-O-Sibond angles that lead to the emergence of local structural defects and bond strain [37,47]. However,metal precursor salts in the synthesis gel could cause changes in the assembly of CTA+ molecules,leading to less organized materials when compared to Si-MCM-41. As Barkam and co-workers [52]demonstrated, even the use of different anions for the same metal precursor can extensively affect thephysicochemical properties of particles in solution [52].
Since MCM-41 is a molecular sieve with a bidimensional structure, the calculation of the hexagonalunit cell parameter (a) could be determined by using Equation (1) (see Materials and Methods).Unfortunately, the 100 reflection cannot be observed in the XRD pattern for the cerium-incorporatedmaterials (Figure 1), as a consequence of the experimental limitations (i.e., the signal of the beamsource was only obtainable starting at 2θ = 2◦). As mentioned before, the 110 and 200 reflections couldbe distinguished, but are overlapped. If the sole 200 reflection could be observed in the modifiedmaterials, d100 could be calculated by a relationship between the interplanar spacing of the 200 and100 reflections (Equation (2), see Materials and Methods). Therefore, deconvolution methods [53]
44
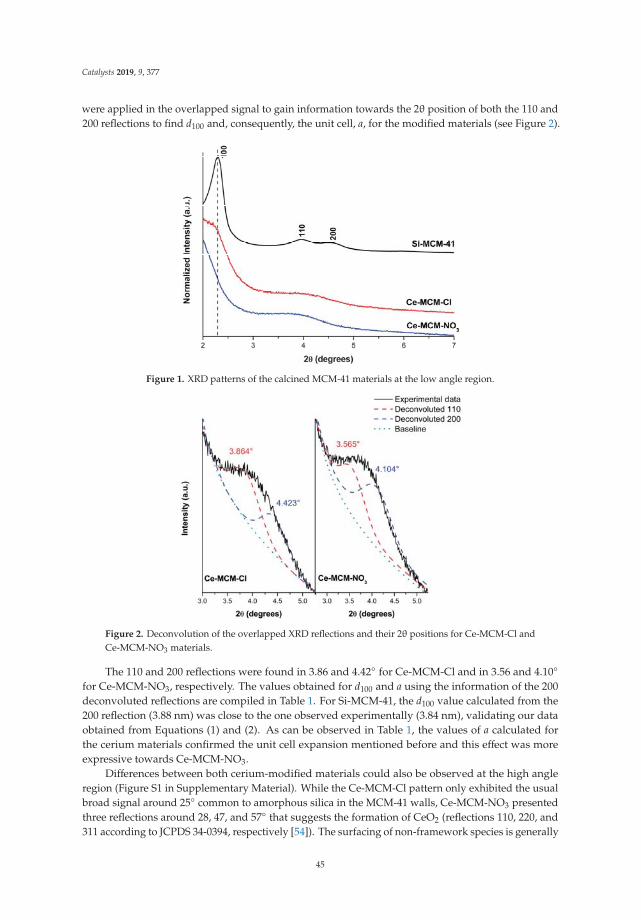
Catalysts 2019, 9, 377
were applied in the overlapped signal to gain information towards the 2θ position of both the 110 and200 reflections to find d100 and, consequently, the unit cell, a, for the modified materials (see Figure 2).
Figure 1. XRD patterns of the calcined MCM-41 materials at the low angle region.
Figure 2. Deconvolution of the overlapped XRD reflections and their 2θ positions for Ce-MCM-Cl andCe-MCM-NO3 materials.
The 110 and 200 reflections were found in 3.86 and 4.42◦ for Ce-MCM-Cl and in 3.56 and 4.10◦for Ce-MCM-NO3, respectively. The values obtained for d100 and a using the information of the 200deconvoluted reflections are compiled in Table 1. For Si-MCM-41, the d100 value calculated from the200 reflection (3.88 nm) was close to the one observed experimentally (3.84 nm), validating our dataobtained from Equations (1) and (2). As can be observed in Table 1, the values of a calculated forthe cerium materials confirmed the unit cell expansion mentioned before and this effect was moreexpressive towards Ce-MCM-NO3.
Differences between both cerium-modified materials could also be observed at the high angleregion (Figure S1 in Supplementary Material). While the Ce-MCM-Cl pattern only exhibited the usualbroad signal around 25◦ common to amorphous silica in the MCM-41 walls, Ce-MCM-NO3 presentedthree reflections around 28, 47, and 57◦ that suggests the formation of CeO2 (reflections 110, 220, and311 according to JCPDS 34-0394, respectively [54]). The surfacing of non-framework species is generally
45
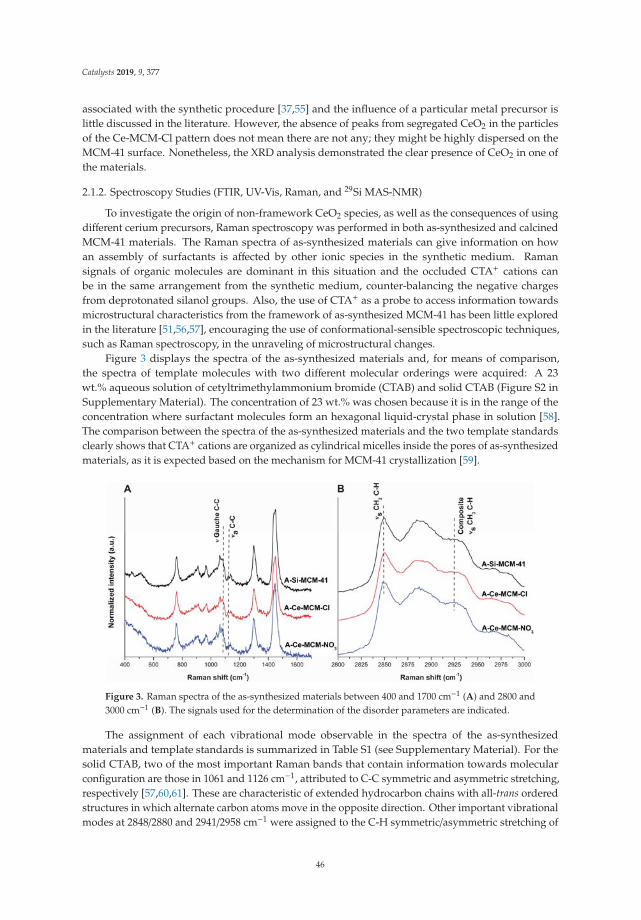
Catalysts 2019, 9, 377
associated with the synthetic procedure [37,55] and the influence of a particular metal precursor islittle discussed in the literature. However, the absence of peaks from segregated CeO2 in the particlesof the Ce-MCM-Cl pattern does not mean there are not any; they might be highly dispersed on theMCM-41 surface. Nonetheless, the XRD analysis demonstrated the clear presence of CeO2 in one ofthe materials.
2.1.2. Spectroscopy Studies (FTIR, UV-Vis, Raman, and 29Si MAS-NMR)
To investigate the origin of non-framework CeO2 species, as well as the consequences of usingdifferent cerium precursors, Raman spectroscopy was performed in both as-synthesized and calcinedMCM-41 materials. The Raman spectra of as-synthesized materials can give information on howan assembly of surfactants is affected by other ionic species in the synthetic medium. Ramansignals of organic molecules are dominant in this situation and the occluded CTA+ cations canbe in the same arrangement from the synthetic medium, counter-balancing the negative chargesfrom deprotonated silanol groups. Also, the use of CTA+ as a probe to access information towardsmicrostructural characteristics from the framework of as-synthesized MCM-41 has been little exploredin the literature [51,56,57], encouraging the use of conformational-sensible spectroscopic techniques,such as Raman spectroscopy, in the unraveling of microstructural changes.
Figure 3 displays the spectra of the as-synthesized materials and, for means of comparison,the spectra of template molecules with two different molecular orderings were acquired: A 23wt.% aqueous solution of cetyltrimethylammonium bromide (CTAB) and solid CTAB (Figure S2 inSupplementary Material). The concentration of 23 wt.% was chosen because it is in the range of theconcentration where surfactant molecules form an hexagonal liquid-crystal phase in solution [58].The comparison between the spectra of the as-synthesized materials and the two template standardsclearly shows that CTA+ cations are organized as cylindrical micelles inside the pores of as-synthesizedmaterials, as it is expected based on the mechanism for MCM-41 crystallization [59].
Figure 3. Raman spectra of the as-synthesized materials between 400 and 1700 cm−1 (A) and 2800 and3000 cm−1 (B). The signals used for the determination of the disorder parameters are indicated.
The assignment of each vibrational mode observable in the spectra of the as-synthesizedmaterials and template standards is summarized in Table S1 (see Supplementary Material). For thesolid CTAB, two of the most important Raman bands that contain information towards molecularconfiguration are those in 1061 and 1126 cm−1, attributed to C-C symmetric and asymmetric stretching,respectively [57,60,61]. These are characteristic of extended hydrocarbon chains with all-trans orderedstructures in which alternate carbon atoms move in the opposite direction. Other important vibrationalmodes at 2848/2880 and 2941/2958 cm−1 were assigned to the C-H symmetric/asymmetric stretching of
46
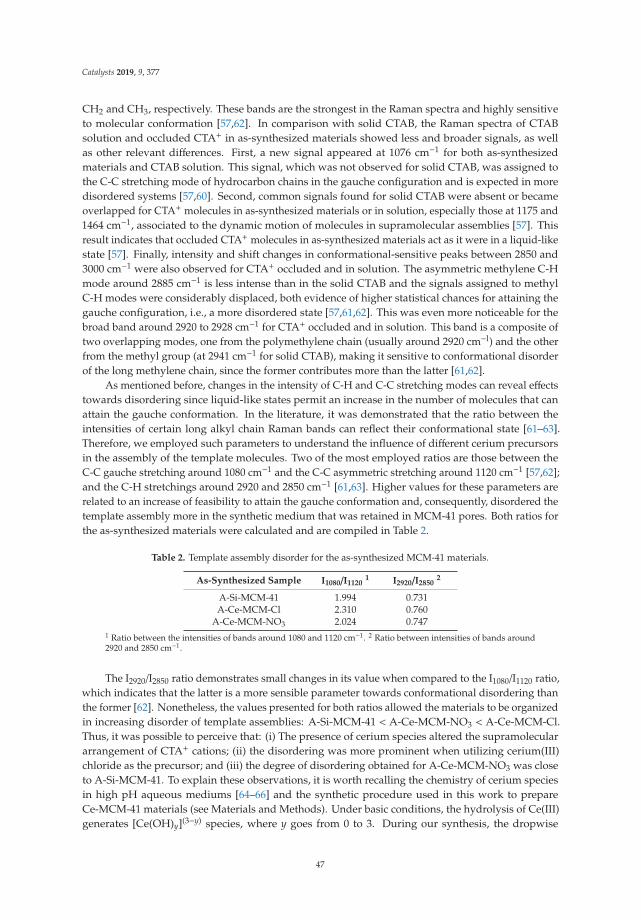
Catalysts 2019, 9, 377
CH2 and CH3, respectively. These bands are the strongest in the Raman spectra and highly sensitiveto molecular conformation [57,62]. In comparison with solid CTAB, the Raman spectra of CTABsolution and occluded CTA+ in as-synthesized materials showed less and broader signals, as wellas other relevant differences. First, a new signal appeared at 1076 cm−1 for both as-synthesizedmaterials and CTAB solution. This signal, which was not observed for solid CTAB, was assigned tothe C-C stretching mode of hydrocarbon chains in the gauche configuration and is expected in moredisordered systems [57,60]. Second, common signals found for solid CTAB were absent or becameoverlapped for CTA+ molecules in as-synthesized materials or in solution, especially those at 1175 and1464 cm−1, associated to the dynamic motion of molecules in supramolecular assemblies [57]. Thisresult indicates that occluded CTA+ molecules in as-synthesized materials act as it were in a liquid-likestate [57]. Finally, intensity and shift changes in conformational-sensitive peaks between 2850 and3000 cm−1 were also observed for CTA+ occluded and in solution. The asymmetric methylene C-Hmode around 2885 cm−1 is less intense than in the solid CTAB and the signals assigned to methylC-H modes were considerably displaced, both evidence of higher statistical chances for attaining thegauche configuration, i.e., a more disordered state [57,61,62]. This was even more noticeable for thebroad band around 2920 to 2928 cm−1 for CTA+ occluded and in solution. This band is a composite oftwo overlapping modes, one from the polymethylene chain (usually around 2920 cm−l) and the otherfrom the methyl group (at 2941 cm−1 for solid CTAB), making it sensitive to conformational disorderof the long methylene chain, since the former contributes more than the latter [61,62].
As mentioned before, changes in the intensity of C-H and C-C stretching modes can reveal effectstowards disordering since liquid-like states permit an increase in the number of molecules that canattain the gauche conformation. In the literature, it was demonstrated that the ratio between theintensities of certain long alkyl chain Raman bands can reflect their conformational state [61–63].Therefore, we employed such parameters to understand the influence of different cerium precursorsin the assembly of the template molecules. Two of the most employed ratios are those between theC-C gauche stretching around 1080 cm−1 and the C-C asymmetric stretching around 1120 cm−1 [57,62];and the C-H stretchings around 2920 and 2850 cm−1 [61,63]. Higher values for these parameters arerelated to an increase of feasibility to attain the gauche conformation and, consequently, disordered thetemplate assembly more in the synthetic medium that was retained in MCM-41 pores. Both ratios forthe as-synthesized materials were calculated and are compiled in Table 2.
Table 2. Template assembly disorder for the as-synthesized MCM-41 materials.
As-Synthesized Sample I1080/I11201 I2920/I2850
2
A-Si-MCM-41 1.994 0.731A-Ce-MCM-Cl 2.310 0.760
A-Ce-MCM-NO3 2.024 0.7471 Ratio between the intensities of bands around 1080 and 1120 cm−1. 2 Ratio between intensities of bands around2920 and 2850 cm−1.
The I2920/I2850 ratio demonstrates small changes in its value when compared to the I1080/I1120 ratio,which indicates that the latter is a more sensible parameter towards conformational disordering thanthe former [62]. Nonetheless, the values presented for both ratios allowed the materials to be organizedin increasing disorder of template assemblies: A-Si-MCM-41 < A-Ce-MCM-NO3 < A-Ce-MCM-Cl.Thus, it was possible to perceive that: (i) The presence of cerium species altered the supramoleculararrangement of CTA+ cations; (ii) the disordering was more prominent when utilizing cerium(III)chloride as the precursor; and (iii) the degree of disordering obtained for A-Ce-MCM-NO3 was closeto A-Si-MCM-41. To explain these observations, it is worth recalling the chemistry of cerium speciesin high pH aqueous mediums [64–66] and the synthetic procedure used in this work to prepareCe-MCM-41 materials (see Materials and Methods). Under basic conditions, the hydrolysis of Ce(III)generates [Ce(OH)y](3−y) species, where y goes from 0 to 3. During our synthesis, the dropwise
47
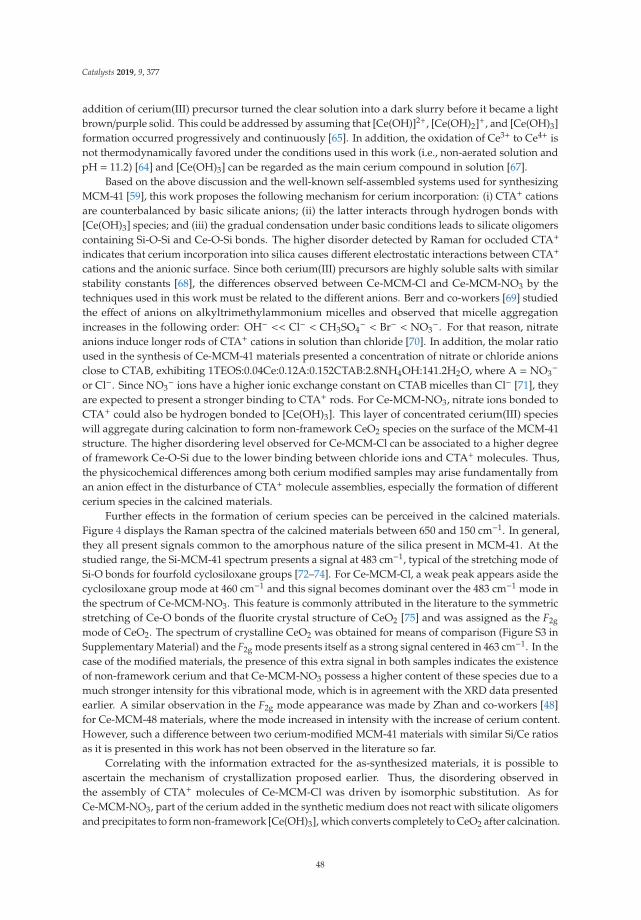
Catalysts 2019, 9, 377
addition of cerium(III) precursor turned the clear solution into a dark slurry before it became a lightbrown/purple solid. This could be addressed by assuming that [Ce(OH)]2+, [Ce(OH)2]+, and [Ce(OH)3]formation occurred progressively and continuously [65]. In addition, the oxidation of Ce3+ to Ce4+ isnot thermodynamically favored under the conditions used in this work (i.e., non-aerated solution andpH = 11.2) [64] and [Ce(OH)3] can be regarded as the main cerium compound in solution [67].
Based on the above discussion and the well-known self-assembled systems used for synthesizingMCM-41 [59], this work proposes the following mechanism for cerium incorporation: (i) CTA+ cationsare counterbalanced by basic silicate anions; (ii) the latter interacts through hydrogen bonds with[Ce(OH)3] species; and (iii) the gradual condensation under basic conditions leads to silicate oligomerscontaining Si-O-Si and Ce-O-Si bonds. The higher disorder detected by Raman for occluded CTA+
indicates that cerium incorporation into silica causes different electrostatic interactions between CTA+
cations and the anionic surface. Since both cerium(III) precursors are highly soluble salts with similarstability constants [68], the differences observed between Ce-MCM-Cl and Ce-MCM-NO3 by thetechniques used in this work must be related to the different anions. Berr and co-workers [69] studiedthe effect of anions on alkyltrimethylammonium micelles and observed that micelle aggregationincreases in the following order: OH− << Cl− < CH3SO4
− < Br− < NO3−. For that reason, nitrate
anions induce longer rods of CTA+ cations in solution than chloride [70]. In addition, the molar ratioused in the synthesis of Ce-MCM-41 materials presented a concentration of nitrate or chloride anionsclose to CTAB, exhibiting 1TEOS:0.04Ce:0.12A:0.152CTAB:2.8NH4OH:141.2H2O, where A = NO3
−or Cl−. Since NO3
− ions have a higher ionic exchange constant on CTAB micelles than Cl− [71], theyare expected to present a stronger binding to CTA+ rods. For Ce-MCM-NO3, nitrate ions bonded toCTA+ could also be hydrogen bonded to [Ce(OH)3]. This layer of concentrated cerium(III) specieswill aggregate during calcination to form non-framework CeO2 species on the surface of the MCM-41structure. The higher disordering level observed for Ce-MCM-Cl can be associated to a higher degreeof framework Ce-O-Si due to the lower binding between chloride ions and CTA+ molecules. Thus,the physicochemical differences among both cerium modified samples may arise fundamentally froman anion effect in the disturbance of CTA+ molecule assemblies, especially the formation of differentcerium species in the calcined materials.
Further effects in the formation of cerium species can be perceived in the calcined materials.Figure 4 displays the Raman spectra of the calcined materials between 650 and 150 cm−1. In general,they all present signals common to the amorphous nature of the silica present in MCM-41. At thestudied range, the Si-MCM-41 spectrum presents a signal at 483 cm−1, typical of the stretching mode ofSi-O bonds for fourfold cyclosiloxane groups [72–74]. For Ce-MCM-Cl, a weak peak appears aside thecyclosiloxane group mode at 460 cm−1 and this signal becomes dominant over the 483 cm−1 mode inthe spectrum of Ce-MCM-NO3. This feature is commonly attributed in the literature to the symmetricstretching of Ce-O bonds of the fluorite crystal structure of CeO2 [75] and was assigned as the F2g
mode of CeO2. The spectrum of crystalline CeO2 was obtained for means of comparison (Figure S3 inSupplementary Material) and the F2g mode presents itself as a strong signal centered in 463 cm−1. In thecase of the modified materials, the presence of this extra signal in both samples indicates the existenceof non-framework cerium and that Ce-MCM-NO3 possess a higher content of these species due to amuch stronger intensity for this vibrational mode, which is in agreement with the XRD data presentedearlier. A similar observation in the F2g mode appearance was made by Zhan and co-workers [48]for Ce-MCM-48 materials, where the mode increased in intensity with the increase of cerium content.However, such a difference between two cerium-modified MCM-41 materials with similar Si/Ce ratiosas it is presented in this work has not been observed in the literature so far.
Correlating with the information extracted for the as-synthesized materials, it is possible toascertain the mechanism of crystallization proposed earlier. Thus, the disordering observed inthe assembly of CTA+ molecules of Ce-MCM-Cl was driven by isomorphic substitution. As forCe-MCM-NO3, part of the cerium added in the synthetic medium does not react with silicate oligomersand precipitates to form non-framework [Ce(OH)3], which converts completely to CeO2 after calcination.
48

Catalysts 2019, 9, 377
Such a hypothesis is scarcely pointed out to explain the difference in the reactivity of cerium precursorsin the synthesis of oxides, but there is an extensive literature regarding the differences in the use ofprecursors that leads to singular microstructural properties of these materials [52,76,77]. These worksclearly suggest that the anions in cerium precursors have major roles in defining the properties of thefinal cerium-based materials more than just the mere electrostatic counterparts in the synthetic medium.
Figure 4. Raman spectra of the calcined materials between 150 and 650 cm−1.
Figure 5 displays the Fourier transform infrared spectroscopy (FTIR) spectra for all calcinedMCM-41 materials.
Figure 5. FTIR spectra of the calcined MCM-41 materials.
The vibrational modes between 1400 and 400 cm−1 are typical of Si-O-Si bonds [78]. In the caseof Si-MCM-41: (i) Asymmetric stretching of Si-O-Si bonds at 1232 and 1084 cm−1; (ii) symmetricstretching of Si-OH bonds at 964 cm−1; (iii) symmetric stretching of Si-O-Si at 802 cm−1; and (iv)the Si-O-Si bending mode at 459 cm−1. Changes in the wavenumber of these modes are frequentlyassociated to isomorphic substitution of heteroelements in the framework of silica-based materials,because the average length of T-O bonds (T corresponds to any heteroatom) in the walls of the MCM-41
49
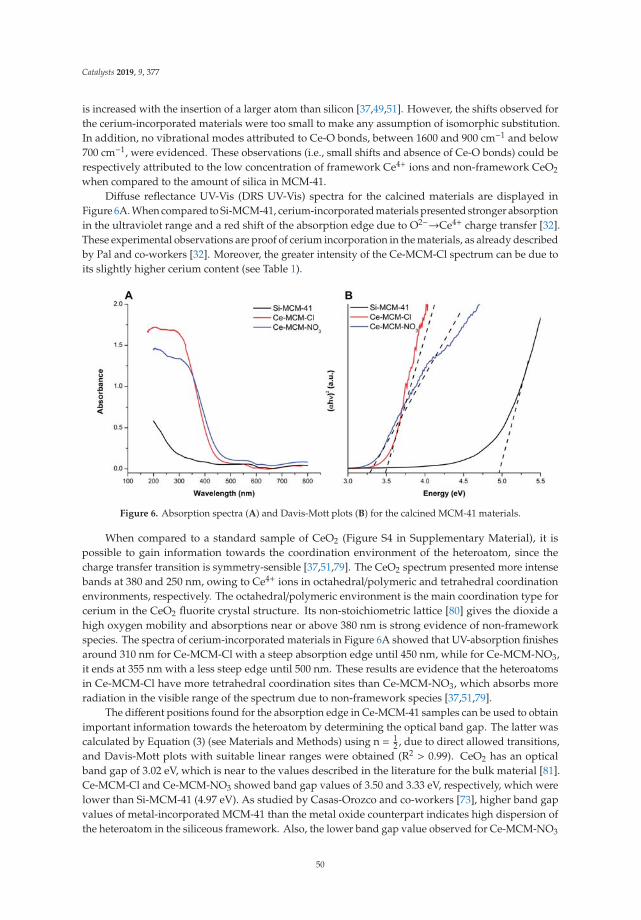
Catalysts 2019, 9, 377
is increased with the insertion of a larger atom than silicon [37,49,51]. However, the shifts observed forthe cerium-incorporated materials were too small to make any assumption of isomorphic substitution.In addition, no vibrational modes attributed to Ce-O bonds, between 1600 and 900 cm−1 and below700 cm−1, were evidenced. These observations (i.e., small shifts and absence of Ce-O bonds) could berespectively attributed to the low concentration of framework Ce4+ ions and non-framework CeO2
when compared to the amount of silica in MCM-41.Diffuse reflectance UV-Vis (DRS UV-Vis) spectra for the calcined materials are displayed in
Figure 6A. When compared to Si-MCM-41, cerium-incorporated materials presented stronger absorptionin the ultraviolet range and a red shift of the absorption edge due to O2−→Ce4+ charge transfer [32].These experimental observations are proof of cerium incorporation in the materials, as already describedby Pal and co-workers [32]. Moreover, the greater intensity of the Ce-MCM-Cl spectrum can be due toits slightly higher cerium content (see Table 1).
Figure 6. Absorption spectra (A) and Davis-Mott plots (B) for the calcined MCM-41 materials.
When compared to a standard sample of CeO2 (Figure S4 in Supplementary Material), it ispossible to gain information towards the coordination environment of the heteroatom, since thecharge transfer transition is symmetry-sensible [37,51,79]. The CeO2 spectrum presented more intensebands at 380 and 250 nm, owing to Ce4+ ions in octahedral/polymeric and tetrahedral coordinationenvironments, respectively. The octahedral/polymeric environment is the main coordination type forcerium in the CeO2 fluorite crystal structure. Its non-stoichiometric lattice [80] gives the dioxide ahigh oxygen mobility and absorptions near or above 380 nm is strong evidence of non-frameworkspecies. The spectra of cerium-incorporated materials in Figure 6A showed that UV-absorption finishesaround 310 nm for Ce-MCM-Cl with a steep absorption edge until 450 nm, while for Ce-MCM-NO3,it ends at 355 nm with a less steep edge until 500 nm. These results are evidence that the heteroatomsin Ce-MCM-Cl have more tetrahedral coordination sites than Ce-MCM-NO3, which absorbs moreradiation in the visible range of the spectrum due to non-framework species [37,51,79].
The different positions found for the absorption edge in Ce-MCM-41 samples can be used to obtainimportant information towards the heteroatom by determining the optical band gap. The latter wascalculated by Equation (3) (see Materials and Methods) using n = 1
2 , due to direct allowed transitions,and Davis-Mott plots with suitable linear ranges were obtained (R2 > 0.99). CeO2 has an opticalband gap of 3.02 eV, which is near to the values described in the literature for the bulk material [81].Ce-MCM-Cl and Ce-MCM-NO3 showed band gap values of 3.50 and 3.33 eV, respectively, which werelower than Si-MCM-41 (4.97 eV). As studied by Casas-Orozco and co-workers [73], higher band gapvalues of metal-incorporated MCM-41 than the metal oxide counterpart indicates high dispersion ofthe heteroatom in the siliceous framework. Also, the lower band gap value observed for Ce-MCM-NO3
50
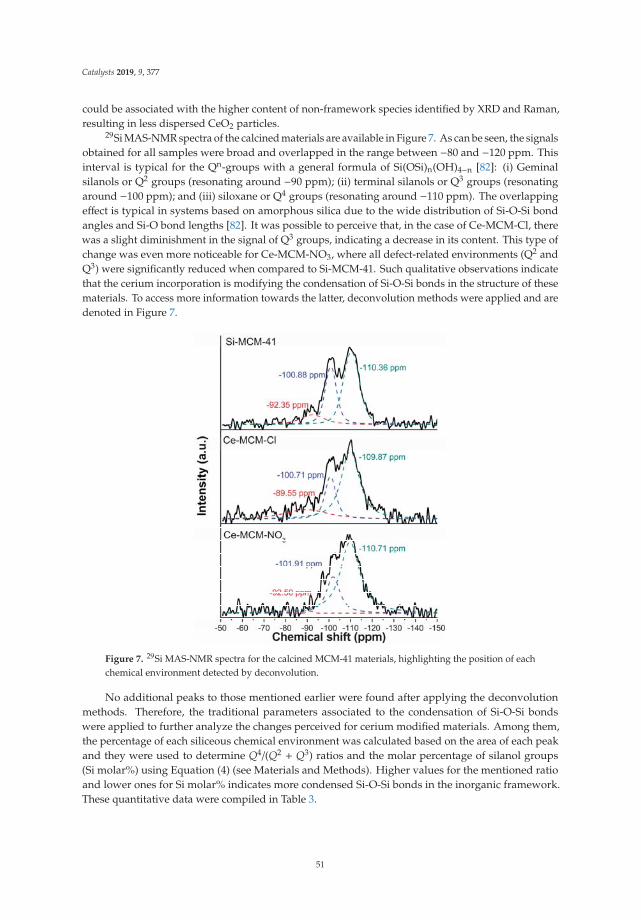
Catalysts 2019, 9, 377
could be associated with the higher content of non-framework species identified by XRD and Raman,resulting in less dispersed CeO2 particles.
29Si MAS-NMR spectra of the calcined materials are available in Figure 7. As can be seen, the signalsobtained for all samples were broad and overlapped in the range between −80 and −120 ppm. Thisinterval is typical for the Qn-groups with a general formula of Si(OSi)n(OH)4−n [82]: (i) Geminalsilanols or Q2 groups (resonating around −90 ppm); (ii) terminal silanols or Q3 groups (resonatingaround −100 ppm); and (iii) siloxane or Q4 groups (resonating around −110 ppm). The overlappingeffect is typical in systems based on amorphous silica due to the wide distribution of Si-O-Si bondangles and Si-O bond lengths [82]. It was possible to perceive that, in the case of Ce-MCM-Cl, therewas a slight diminishment in the signal of Q3 groups, indicating a decrease in its content. This type ofchange was even more noticeable for Ce-MCM-NO3, where all defect-related environments (Q2 andQ3) were significantly reduced when compared to Si-MCM-41. Such qualitative observations indicatethat the cerium incorporation is modifying the condensation of Si-O-Si bonds in the structure of thesematerials. To access more information towards the latter, deconvolution methods were applied and aredenoted in Figure 7.
Figure 7. 29Si MAS-NMR spectra for the calcined MCM-41 materials, highlighting the position of eachchemical environment detected by deconvolution.
No additional peaks to those mentioned earlier were found after applying the deconvolutionmethods. Therefore, the traditional parameters associated to the condensation of Si-O-Si bondswere applied to further analyze the changes perceived for cerium modified materials. Among them,the percentage of each siliceous chemical environment was calculated based on the area of each peakand they were used to determine Q4/(Q2 + Q3) ratios and the molar percentage of silanol groups(Si molar%) using Equation (4) (see Materials and Methods). Higher values for the mentioned ratioand lower ones for Si molar% indicates more condensed Si-O-Si bonds in the inorganic framework.These quantitative data were compiled in Table 3.
51

Catalysts 2019, 9, 377
Table 3. Content of Qn-groups and related parameters obtained from 29Si MAS-NMR spectra of thecalcined MCM-41 materials.
Sample Q2 (%) 1 Q3 (%) 1 Q4 (%) 1 Q4/(Q2 + Q3) Silanol (Si Molar%) 2
Si-MCM-41 12.4 33.1 54.5 1.20 57.9Ce-MCM-Cl 19.3 21.2 59.5 1.47 59.7
Ce-MCM-NO3 0.4 25.6 74.0 2.85 26.41 Calculated from normalization of the area of each peak. 2 Calculated from Equation (4).
From the values displayed in Table 3, it was possible to infer that: (i) For Ce-MCM-Cl, even thoughthe content of terminal silanols (Q3) decreases, the siloxane group (Q4) does not increase significantlywhen compared to geminal silanols (Q2), suggesting that even if the condensation of Si-O-Si bondsslightly increases, the percentage of silanol groups (Si molar%) remains relatively constant if Q2
increases; and (ii) for Ce-MCM-NO3, the modification decreases drastically the content of silanolgroups, indicating that the non-framework cerium species might be located in the mesopores’ wall orexternal surface, but Raman data suggests the former. Once again, there is little contribution fromthe literature to explain effectively the reason for differences in 29Si MAS NMR arising solely withvarying the counterion in cerium precursor. Even though this is a scarce topic, it is well known thatsuch effects in siliceous molecular sieves are dependent more in the synthetic procedure than in anyother aspect and the fact that cerium incorporation can lead to a more or less condensed degree ofchemical bonds has already been reported [32,51]. Thus, the MAS-NMR data is in good agreementwith the observations made earlier due to the crystallization mechanism proposed: (i) The smalleraggregation effect of chloride anions on CTA+ assemblies and the formation of framework Ce-O-Sibonds led to the emergence of silanol defects (Q2); and (ii) the precipitation of Ce(OH)3 and conversionto non-framework CeO2 resulted in a coating effect in the MCM-41 surface, leading to the decreaseof Q2.
2.1.3. Morphological (TEM and HRTEM), Textural (Surface Area and Pore Volume), and ThermalAnalyses (TG/DTG/DSC)
The morphology of the calcined MCM-41 materials was accessed through low-resolutiontransmission electron microscopy (TEM). Representative images are selected and displayed in Figure 8.
Figure 8. TEM images for the calcined MCM-41 materials: Si-MCM-41 (A); Ce-MCM-Cl (B); andCe-MCM-NO3 (C).
For Si-MCM-41, perfectly spherical nanoparticles were obtained (mean size of 61.8 ± 15.9 nm).There is little aggregation between the particles, possibly a synthetic consequence of the rapidformation of ethanol as a side product during TEOS hydrolysis [83]. On the other hand, the modifiedmaterials present smaller and spherical nanoparticles, with a mean size of around 34.2 ± 14.5 nmand 38.7 ± 9.1 nm for Ce-MCM-Cl and Ce-MCM-NO3, respectively. Also, the nanoparticles have amore aggregated aspect when compared with Si-MCM-41, exhibiting more irregular shapes. These
52
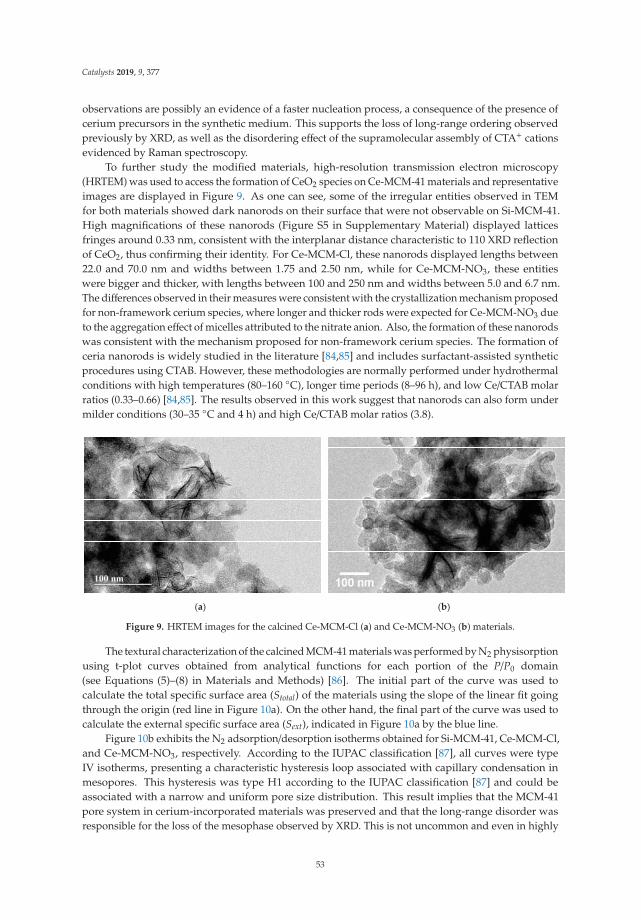
Catalysts 2019, 9, 377
observations are possibly an evidence of a faster nucleation process, a consequence of the presence ofcerium precursors in the synthetic medium. This supports the loss of long-range ordering observedpreviously by XRD, as well as the disordering effect of the supramolecular assembly of CTA+ cationsevidenced by Raman spectroscopy.
To further study the modified materials, high-resolution transmission electron microscopy(HRTEM) was used to access the formation of CeO2 species on Ce-MCM-41 materials and representativeimages are displayed in Figure 9. As one can see, some of the irregular entities observed in TEMfor both materials showed dark nanorods on their surface that were not observable on Si-MCM-41.High magnifications of these nanorods (Figure S5 in Supplementary Material) displayed latticesfringes around 0.33 nm, consistent with the interplanar distance characteristic to 110 XRD reflectionof CeO2, thus confirming their identity. For Ce-MCM-Cl, these nanorods displayed lengths between22.0 and 70.0 nm and widths between 1.75 and 2.50 nm, while for Ce-MCM-NO3, these entitieswere bigger and thicker, with lengths between 100 and 250 nm and widths between 5.0 and 6.7 nm.The differences observed in their measures were consistent with the crystallization mechanism proposedfor non-framework cerium species, where longer and thicker rods were expected for Ce-MCM-NO3 dueto the aggregation effect of micelles attributed to the nitrate anion. Also, the formation of these nanorodswas consistent with the mechanism proposed for non-framework cerium species. The formation ofceria nanorods is widely studied in the literature [84,85] and includes surfactant-assisted syntheticprocedures using CTAB. However, these methodologies are normally performed under hydrothermalconditions with high temperatures (80–160 ◦C), longer time periods (8–96 h), and low Ce/CTAB molarratios (0.33–0.66) [84,85]. The results observed in this work suggest that nanorods can also form undermilder conditions (30–35 ◦C and 4 h) and high Ce/CTAB molar ratios (3.8).
(a) (b)
Figure 9. HRTEM images for the calcined Ce-MCM-Cl (a) and Ce-MCM-NO3 (b) materials.
The textural characterization of the calcined MCM-41 materials was performed by N2 physisorptionusing t-plot curves obtained from analytical functions for each portion of the P/P0 domain(see Equations (5)–(8) in Materials and Methods) [86]. The initial part of the curve was used tocalculate the total specific surface area (Stotal) of the materials using the slope of the linear fit goingthrough the origin (red line in Figure 10a). On the other hand, the final part of the curve was used tocalculate the external specific surface area (Sext), indicated in Figure 10a by the blue line.
Figure 10b exhibits the N2 adsorption/desorption isotherms obtained for Si-MCM-41, Ce-MCM-Cl,and Ce-MCM-NO3, respectively. According to the IUPAC classification [87], all curves were typeIV isotherms, presenting a characteristic hysteresis loop associated with capillary condensation inmesopores. This hysteresis was type H1 according to the IUPAC classification [87] and could beassociated with a narrow and uniform pore size distribution. This result implies that the MCM-41pore system in cerium-incorporated materials was preserved and that the long-range disorder wasresponsible for the loss of the mesophase observed by XRD. This is not uncommon and even in highly
53
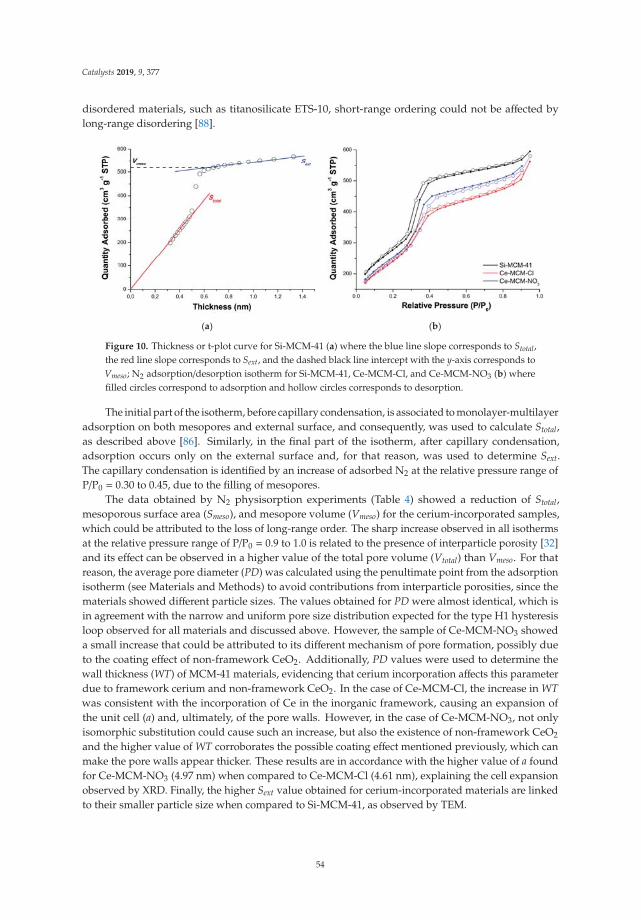
Catalysts 2019, 9, 377
disordered materials, such as titanosilicate ETS-10, short-range ordering could not be affected bylong-range disordering [88].
(a) (b)
Figure 10. Thickness or t-plot curve for Si-MCM-41 (a) where the blue line slope corresponds to Stotal,the red line slope corresponds to Sext, and the dashed black line intercept with the y-axis corresponds toVmeso; N2 adsorption/desorption isotherm for Si-MCM-41, Ce-MCM-Cl, and Ce-MCM-NO3 (b) wherefilled circles correspond to adsorption and hollow circles corresponds to desorption.
The initial part of the isotherm, before capillary condensation, is associated to monolayer-multilayeradsorption on both mesopores and external surface, and consequently, was used to calculate Stotal,as described above [86]. Similarly, in the final part of the isotherm, after capillary condensation,adsorption occurs only on the external surface and, for that reason, was used to determine Sext.The capillary condensation is identified by an increase of adsorbed N2 at the relative pressure range ofP/P0 = 0.30 to 0.45, due to the filling of mesopores.
The data obtained by N2 physisorption experiments (Table 4) showed a reduction of Stotal,mesoporous surface area (Smeso), and mesopore volume (Vmeso) for the cerium-incorporated samples,which could be attributed to the loss of long-range order. The sharp increase observed in all isothermsat the relative pressure range of P/P0 = 0.9 to 1.0 is related to the presence of interparticle porosity [32]and its effect can be observed in a higher value of the total pore volume (Vtotal) than Vmeso. For thatreason, the average pore diameter (PD) was calculated using the penultimate point from the adsorptionisotherm (see Materials and Methods) to avoid contributions from interparticle porosities, since thematerials showed different particle sizes. The values obtained for PD were almost identical, which isin agreement with the narrow and uniform pore size distribution expected for the type H1 hysteresisloop observed for all materials and discussed above. However, the sample of Ce-MCM-NO3 showeda small increase that could be attributed to its different mechanism of pore formation, possibly dueto the coating effect of non-framework CeO2. Additionally, PD values were used to determine thewall thickness (WT) of MCM-41 materials, evidencing that cerium incorporation affects this parameterdue to framework cerium and non-framework CeO2. In the case of Ce-MCM-Cl, the increase in WTwas consistent with the incorporation of Ce in the inorganic framework, causing an expansion ofthe unit cell (a) and, ultimately, of the pore walls. However, in the case of Ce-MCM-NO3, not onlyisomorphic substitution could cause such an increase, but also the existence of non-framework CeO2
and the higher value of WT corroborates the possible coating effect mentioned previously, which canmake the pore walls appear thicker. These results are in accordance with the higher value of a foundfor Ce-MCM-NO3 (4.97 nm) when compared to Ce-MCM-Cl (4.61 nm), explaining the cell expansionobserved by XRD. Finally, the higher Sext value obtained for cerium-incorporated materials are linkedto their smaller particle size when compared to Si-MCM-41, as observed by TEM.
54
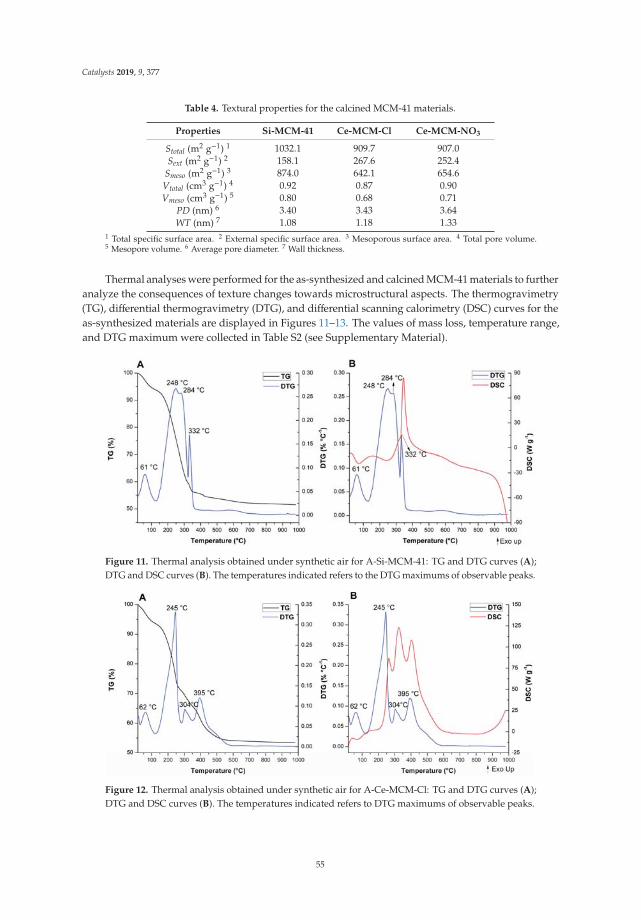
Catalysts 2019, 9, 377
Table 4. Textural properties for the calcined MCM-41 materials.
Properties Si-MCM-41 Ce-MCM-Cl Ce-MCM-NO3
Stotal (m2 g−1) 1 1032.1 909.7 907.0Sext (m2 g−1) 2 158.1 267.6 252.4
Smeso (m2 g−1) 3 874.0 642.1 654.6Vtotal (cm3 g−1) 4 0.92 0.87 0.90Vmeso (cm3 g−1) 5 0.80 0.68 0.71
PD (nm) 6 3.40 3.43 3.64WT (nm) 7 1.08 1.18 1.33
1 Total specific surface area. 2 External specific surface area. 3 Mesoporous surface area. 4 Total pore volume.5 Mesopore volume. 6 Average pore diameter. 7 Wall thickness.
Thermal analyses were performed for the as-synthesized and calcined MCM-41 materials to furtheranalyze the consequences of texture changes towards microstructural aspects. The thermogravimetry(TG), differential thermogravimetry (DTG), and differential scanning calorimetry (DSC) curves for theas-synthesized materials are displayed in Figures 11–13. The values of mass loss, temperature range,and DTG maximum were collected in Table S2 (see Supplementary Material).
Figure 11. Thermal analysis obtained under synthetic air for A-Si-MCM-41: TG and DTG curves (A);DTG and DSC curves (B). The temperatures indicated refers to the DTG maximums of observable peaks.
Figure 12. Thermal analysis obtained under synthetic air for A-Ce-MCM-Cl: TG and DTG curves (A);DTG and DSC curves (B). The temperatures indicated refers to DTG maximums of observable peaks.
55
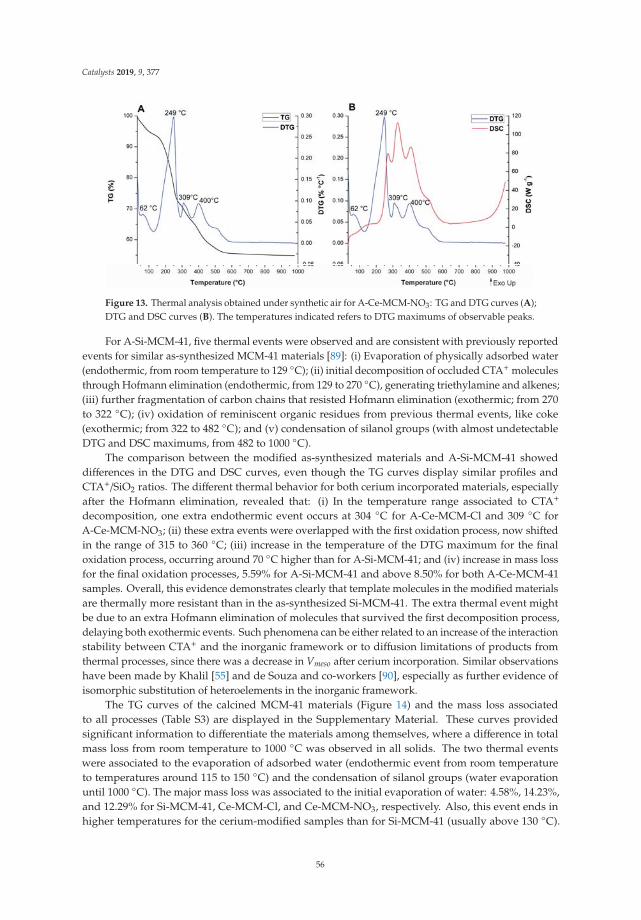
Catalysts 2019, 9, 377
Figure 13. Thermal analysis obtained under synthetic air for A-Ce-MCM-NO3: TG and DTG curves (A);DTG and DSC curves (B). The temperatures indicated refers to DTG maximums of observable peaks.
For A-Si-MCM-41, five thermal events were observed and are consistent with previously reportedevents for similar as-synthesized MCM-41 materials [89]: (i) Evaporation of physically adsorbed water(endothermic, from room temperature to 129 ◦C); (ii) initial decomposition of occluded CTA+ moleculesthrough Hofmann elimination (endothermic, from 129 to 270 ◦C), generating triethylamine and alkenes;(iii) further fragmentation of carbon chains that resisted Hofmann elimination (exothermic; from 270to 322 ◦C); (iv) oxidation of reminiscent organic residues from previous thermal events, like coke(exothermic; from 322 to 482 ◦C); and (v) condensation of silanol groups (with almost undetectableDTG and DSC maximums, from 482 to 1000 ◦C).
The comparison between the modified as-synthesized materials and A-Si-MCM-41 showeddifferences in the DTG and DSC curves, even though the TG curves display similar profiles andCTA+/SiO2 ratios. The different thermal behavior for both cerium incorporated materials, especiallyafter the Hofmann elimination, revealed that: (i) In the temperature range associated to CTA+
decomposition, one extra endothermic event occurs at 304 ◦C for A-Ce-MCM-Cl and 309 ◦C forA-Ce-MCM-NO3; (ii) these extra events were overlapped with the first oxidation process, now shiftedin the range of 315 to 360 ◦C; (iii) increase in the temperature of the DTG maximum for the finaloxidation process, occurring around 70 ◦C higher than for A-Si-MCM-41; and (iv) increase in mass lossfor the final oxidation processes, 5.59% for A-Si-MCM-41 and above 8.50% for both A-Ce-MCM-41samples. Overall, this evidence demonstrates clearly that template molecules in the modified materialsare thermally more resistant than in the as-synthesized Si-MCM-41. The extra thermal event mightbe due to an extra Hofmann elimination of molecules that survived the first decomposition process,delaying both exothermic events. Such phenomena can be either related to an increase of the interactionstability between CTA+ and the inorganic framework or to diffusion limitations of products fromthermal processes, since there was a decrease in Vmeso after cerium incorporation. Similar observationshave been made by Khalil [55] and de Souza and co-workers [90], especially as further evidence ofisomorphic substitution of heteroelements in the inorganic framework.
The TG curves of the calcined MCM-41 materials (Figure 14) and the mass loss associatedto all processes (Table S3) are displayed in the Supplementary Material. These curves providedsignificant information to differentiate the materials among themselves, where a difference in totalmass loss from room temperature to 1000 ◦C was observed in all solids. The two thermal eventswere associated to the evaporation of adsorbed water (endothermic event from room temperatureto temperatures around 115 to 150 ◦C) and the condensation of silanol groups (water evaporationuntil 1000 ◦C). The major mass loss was associated to the initial evaporation of water: 4.58%, 14.23%,and 12.29% for Si-MCM-41, Ce-MCM-Cl, and Ce-MCM-NO3, respectively. Also, this event ends inhigher temperatures for the cerium-modified samples than for Si-MCM-41 (usually above 130 ◦C).
56
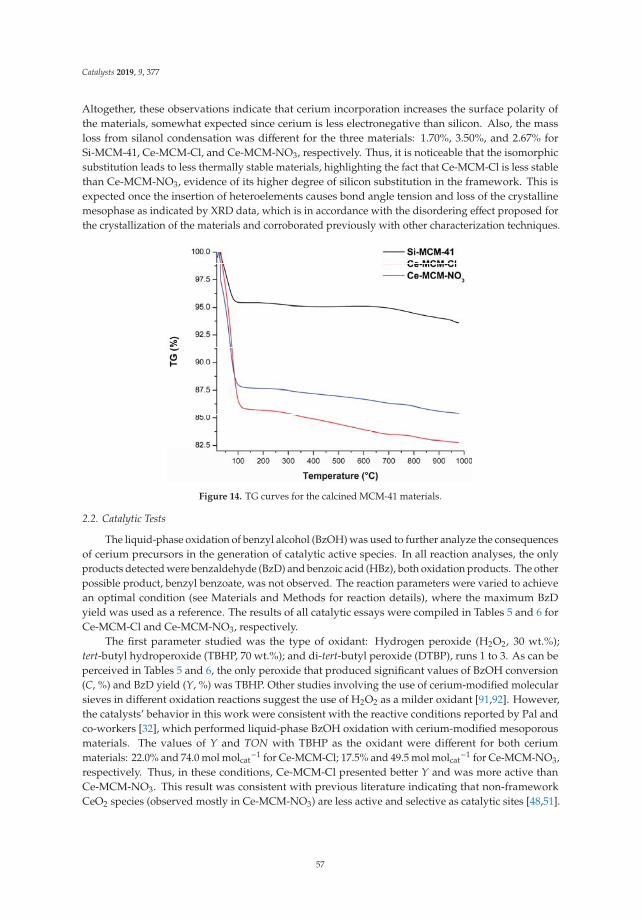
Catalysts 2019, 9, 377
Altogether, these observations indicate that cerium incorporation increases the surface polarity ofthe materials, somewhat expected since cerium is less electronegative than silicon. Also, the massloss from silanol condensation was different for the three materials: 1.70%, 3.50%, and 2.67% forSi-MCM-41, Ce-MCM-Cl, and Ce-MCM-NO3, respectively. Thus, it is noticeable that the isomorphicsubstitution leads to less thermally stable materials, highlighting the fact that Ce-MCM-Cl is less stablethan Ce-MCM-NO3, evidence of its higher degree of silicon substitution in the framework. This isexpected once the insertion of heteroelements causes bond angle tension and loss of the crystallinemesophase as indicated by XRD data, which is in accordance with the disordering effect proposed forthe crystallization of the materials and corroborated previously with other characterization techniques.
Figure 14. TG curves for the calcined MCM-41 materials.
2.2. Catalytic Tests
The liquid-phase oxidation of benzyl alcohol (BzOH) was used to further analyze the consequencesof cerium precursors in the generation of catalytic active species. In all reaction analyses, the onlyproducts detected were benzaldehyde (BzD) and benzoic acid (HBz), both oxidation products. The otherpossible product, benzyl benzoate, was not observed. The reaction parameters were varied to achievean optimal condition (see Materials and Methods for reaction details), where the maximum BzDyield was used as a reference. The results of all catalytic essays were compiled in Tables 5 and 6 forCe-MCM-Cl and Ce-MCM-NO3, respectively.
The first parameter studied was the type of oxidant: Hydrogen peroxide (H2O2, 30 wt.%);tert-butyl hydroperoxide (TBHP, 70 wt.%); and di-tert-butyl peroxide (DTBP), runs 1 to 3. As can beperceived in Tables 5 and 6, the only peroxide that produced significant values of BzOH conversion(C, %) and BzD yield (Y, %) was TBHP. Other studies involving the use of cerium-modified molecularsieves in different oxidation reactions suggest the use of H2O2 as a milder oxidant [91,92]. However,the catalysts’ behavior in this work were consistent with the reactive conditions reported by Pal andco-workers [32], which performed liquid-phase BzOH oxidation with cerium-modified mesoporousmaterials. The values of Y and TON with TBHP as the oxidant were different for both ceriummaterials: 22.0% and 74.0 mol molcat
−1 for Ce-MCM-Cl; 17.5% and 49.5 mol molcat−1 for Ce-MCM-NO3,
respectively. Thus, in these conditions, Ce-MCM-Cl presented better Y and was more active thanCe-MCM-NO3. This result was consistent with previous literature indicating that non-frameworkCeO2 species (observed mostly in Ce-MCM-NO3) are less active and selective as catalytic sites [48,51].
57
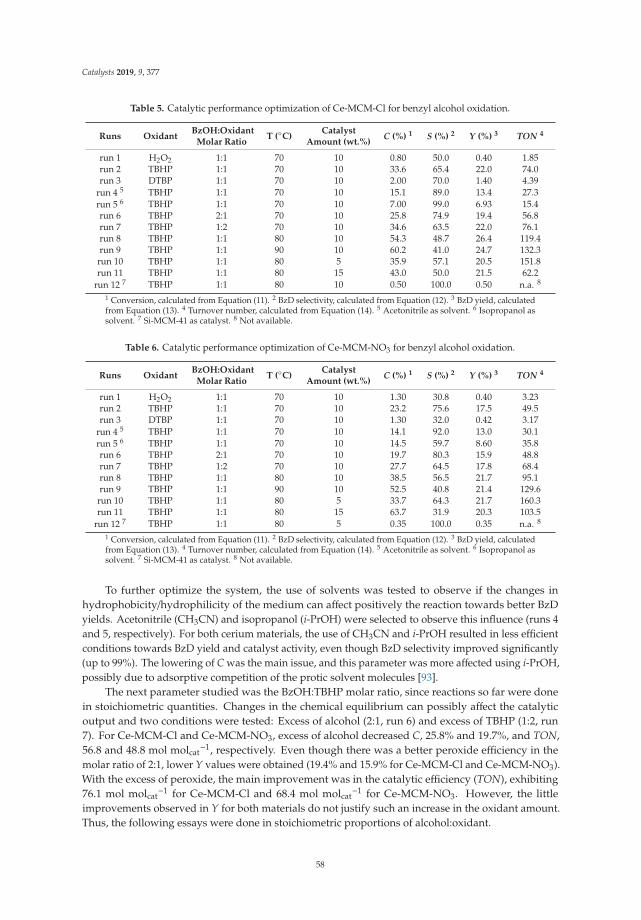
Catalysts 2019, 9, 377
Table 5. Catalytic performance optimization of Ce-MCM-Cl for benzyl alcohol oxidation.
Runs OxidantBzOH:Oxidant
Molar RatioT (◦C)
CatalystAmount (wt.%)
C (%) 1 S (%) 2 Y (%) 3 TON 4
run 1 H2O2 1:1 70 10 0.80 50.0 0.40 1.85run 2 TBHP 1:1 70 10 33.6 65.4 22.0 74.0run 3 DTBP 1:1 70 10 2.00 70.0 1.40 4.39
run 4 5 TBHP 1:1 70 10 15.1 89.0 13.4 27.3run 5 6 TBHP 1:1 70 10 7.00 99.0 6.93 15.4run 6 TBHP 2:1 70 10 25.8 74.9 19.4 56.8run 7 TBHP 1:2 70 10 34.6 63.5 22.0 76.1run 8 TBHP 1:1 80 10 54.3 48.7 26.4 119.4run 9 TBHP 1:1 90 10 60.2 41.0 24.7 132.3run 10 TBHP 1:1 80 5 35.9 57.1 20.5 151.8run 11 TBHP 1:1 80 15 43.0 50.0 21.5 62.2
run 12 7 TBHP 1:1 80 10 0.50 100.0 0.50 n.a. 8
1 Conversion, calculated from Equation (11). 2 BzD selectivity, calculated from Equation (12). 3 BzD yield, calculatedfrom Equation (13). 4 Turnover number, calculated from Equation (14). 5 Acetonitrile as solvent. 6 Isopropanol assolvent. 7 Si-MCM-41 as catalyst. 8 Not available.
Table 6. Catalytic performance optimization of Ce-MCM-NO3 for benzyl alcohol oxidation.
Runs OxidantBzOH:Oxidant
Molar RatioT (◦C)
CatalystAmount (wt.%)
C (%) 1 S (%) 2 Y (%) 3 TON 4
run 1 H2O2 1:1 70 10 1.30 30.8 0.40 3.23run 2 TBHP 1:1 70 10 23.2 75.6 17.5 49.5run 3 DTBP 1:1 70 10 1.30 32.0 0.42 3.17
run 4 5 TBHP 1:1 70 10 14.1 92.0 13.0 30.1run 5 6 TBHP 1:1 70 10 14.5 59.7 8.60 35.8run 6 TBHP 2:1 70 10 19.7 80.3 15.9 48.8run 7 TBHP 1:2 70 10 27.7 64.5 17.8 68.4run 8 TBHP 1:1 80 10 38.5 56.5 21.7 95.1run 9 TBHP 1:1 90 10 52.5 40.8 21.4 129.6run 10 TBHP 1:1 80 5 33.7 64.3 21.7 160.3run 11 TBHP 1:1 80 15 63.7 31.9 20.3 103.5
run 12 7 TBHP 1:1 80 5 0.35 100.0 0.35 n.a. 8
1 Conversion, calculated from Equation (11). 2 BzD selectivity, calculated from Equation (12). 3 BzD yield, calculatedfrom Equation (13). 4 Turnover number, calculated from Equation (14). 5 Acetonitrile as solvent. 6 Isopropanol assolvent. 7 Si-MCM-41 as catalyst. 8 Not available.
To further optimize the system, the use of solvents was tested to observe if the changes inhydrophobicity/hydrophilicity of the medium can affect positively the reaction towards better BzDyields. Acetonitrile (CH3CN) and isopropanol (i-PrOH) were selected to observe this influence (runs 4and 5, respectively). For both cerium materials, the use of CH3CN and i-PrOH resulted in less efficientconditions towards BzD yield and catalyst activity, even though BzD selectivity improved significantly(up to 99%). The lowering of C was the main issue, and this parameter was more affected using i-PrOH,possibly due to adsorptive competition of the protic solvent molecules [93].
The next parameter studied was the BzOH:TBHP molar ratio, since reactions so far were donein stoichiometric quantities. Changes in the chemical equilibrium can possibly affect the catalyticoutput and two conditions were tested: Excess of alcohol (2:1, run 6) and excess of TBHP (1:2, run7). For Ce-MCM-Cl and Ce-MCM-NO3, excess of alcohol decreased C, 25.8% and 19.7%, and TON,56.8 and 48.8 mol molcat
−1, respectively. Even though there was a better peroxide efficiency in themolar ratio of 2:1, lower Y values were obtained (19.4% and 15.9% for Ce-MCM-Cl and Ce-MCM-NO3).With the excess of peroxide, the main improvement was in the catalytic efficiency (TON), exhibiting76.1 mol molcat
−1 for Ce-MCM-Cl and 68.4 mol molcat−1 for Ce-MCM-NO3. However, the little
improvements observed in Y for both materials do not justify such an increase in the oxidant amount.Thus, the following essays were done in stoichiometric proportions of alcohol:oxidant.
58

Catalysts 2019, 9, 377
Next, the effect of temperature was studied, increasing it from 70 to 80 and 90 ◦C (runs 8 and 9).With increasing temperature, significant enhancements in C were obtained (up to 60.2% and 52.5% forCe-MCM-Cl and Ce-MCM-NO3, respectively), but with concomitant decreases in S (close to 41% forboth materials at 90 ◦C). In addition, improvements in Y and TON were significant, especially at 80 ◦C(26.4% and 119.4 mol molcat
−1 for Ce-MCM-Cl, and 21.7% and 95.1 mol molcat−1 for Ce-MCM-NO3). At
higher temperatures, a better activation of oxidants and generation of reactive species were obtained,but it was only beneficial until a certain point, since a loss of selectivity was visible at 90 ◦C for bothmaterials when compared to 80 ◦C. Therefore, the following essays were performed at 80 ◦C.
The final parameter evaluated was the catalyst amount, 5 and 15 wt.%, runs 10 and 11, respectively.In the case of Ce-MCM-Cl, both changes led to less efficient catalytic situations in terms of C and Y,where decreases of up to 20.0% for the latter and around 40.0% of the former were perceived whencompared to run 8 (10 wt.%). This can be associated to a more exacerbated decomposition of TBHPin the case of 15 wt.% and a less efficient activation of the oxidant at 5 wt.%, achieving the optimalmass and active sites’ amount around 10 wt.% for this catalyst. Surprisingly, a different trend wasobserved for Ce-MCM-NO3, where the catalyst amount of 5 wt.% showed a negligible decrease of Cand a considerable increase of S (33.7% and 64.3%, respectively). This combination resulted in the sameY and better catalytic performance (TON = 160.3 mol molcat
−1) than from run 8 (10 wt.%), while the useof 15 wt.% catalyst increased C to 63.7% with concomitant decrease in S to 31.9%, resulting in a decreasein Y (20.3%) and catalytic performance (TON = 103.5 mol molcat
−1). This can be associated to the masstransfer in Ce-MCM-NO3 mesopores, while 5 wt.% offered an optimal condition of catalytic site usageand diffusion of reactants and products; 10 or 15 wt.% seems to lead to conditions where over-oxidationwas favored due to an excess of active sites. These results are consistent with the fact that mainlynon-framework CeO2 (less selective) is present in the material’s constitution as mentioned before.Thus, the amount of catalyst plays a significant role in attaining better Y, but also in differentiating theapplicability of both active materials in this study. Also, for comparison means, Si-MCM-41 was testedin the optimal conditions found for Ce-MCM-Cl and Ce-MCM-NO3 (run 12), and negligible valuesof C and Y (less than 1%) were obtained, proving that the activity of MCM-41 materials is due to thepresence of cerium species.
In order to evaluate the reusability of the catalysts, the solids from the optimized conditions wererecovered and studied for further cycles, see Materials and Methods. After each cycle, the ceriumcontent and coordination state were analyzed by XRF and Raman to understand possible changes inthe catalytic performance. The recycled results are compiled in Figure 15.
Figure 15. Performance of recovered solids after three catalytic cycles: Ce-MCM-Cl (A) andCe-MCM-NO3 (B).
As can be perceived from Figure 15, BzD Y of both catalysts maintains a stable state after threecatalytic cycles, but the conversion of both materials decreases. For Ce-MCM-Cl, the conversiondecreases from 54.3% to 43.9% in the second cycle and 39.3% in the third cycle. Meanwhile,
59
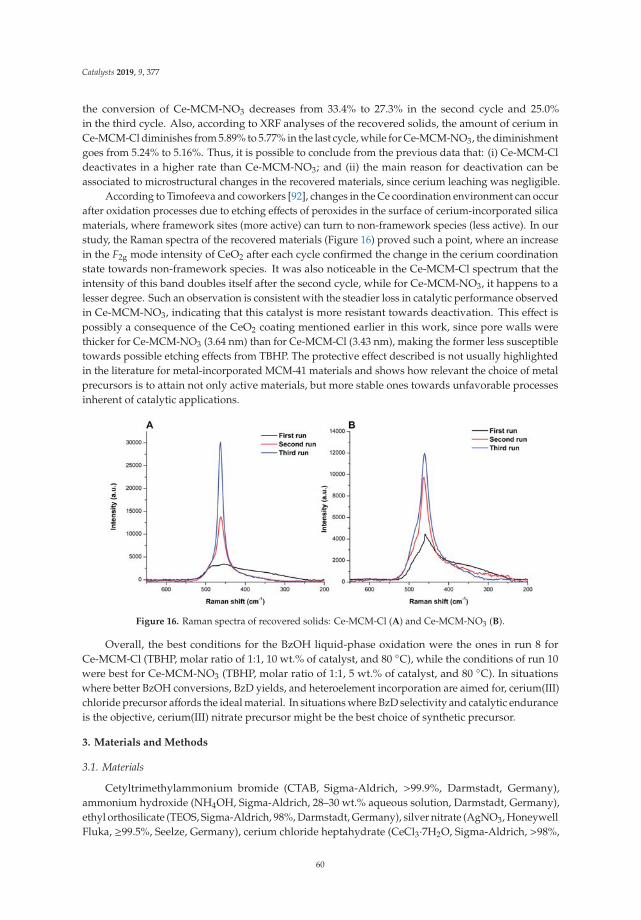
Catalysts 2019, 9, 377
the conversion of Ce-MCM-NO3 decreases from 33.4% to 27.3% in the second cycle and 25.0%in the third cycle. Also, according to XRF analyses of the recovered solids, the amount of cerium inCe-MCM-Cl diminishes from 5.89% to 5.77% in the last cycle, while for Ce-MCM-NO3, the diminishmentgoes from 5.24% to 5.16%. Thus, it is possible to conclude from the previous data that: (i) Ce-MCM-Cldeactivates in a higher rate than Ce-MCM-NO3; and (ii) the main reason for deactivation can beassociated to microstructural changes in the recovered materials, since cerium leaching was negligible.
According to Timofeeva and coworkers [92], changes in the Ce coordination environment can occurafter oxidation processes due to etching effects of peroxides in the surface of cerium-incorporated silicamaterials, where framework sites (more active) can turn to non-framework species (less active). In ourstudy, the Raman spectra of the recovered materials (Figure 16) proved such a point, where an increasein the F2g mode intensity of CeO2 after each cycle confirmed the change in the cerium coordinationstate towards non-framework species. It was also noticeable in the Ce-MCM-Cl spectrum that theintensity of this band doubles itself after the second cycle, while for Ce-MCM-NO3, it happens to alesser degree. Such an observation is consistent with the steadier loss in catalytic performance observedin Ce-MCM-NO3, indicating that this catalyst is more resistant towards deactivation. This effect ispossibly a consequence of the CeO2 coating mentioned earlier in this work, since pore walls werethicker for Ce-MCM-NO3 (3.64 nm) than for Ce-MCM-Cl (3.43 nm), making the former less susceptibletowards possible etching effects from TBHP. The protective effect described is not usually highlightedin the literature for metal-incorporated MCM-41 materials and shows how relevant the choice of metalprecursors is to attain not only active materials, but more stable ones towards unfavorable processesinherent of catalytic applications.
Figure 16. Raman spectra of recovered solids: Ce-MCM-Cl (A) and Ce-MCM-NO3 (B).
Overall, the best conditions for the BzOH liquid-phase oxidation were the ones in run 8 forCe-MCM-Cl (TBHP, molar ratio of 1:1, 10 wt.% of catalyst, and 80 ◦C), while the conditions of run 10were best for Ce-MCM-NO3 (TBHP, molar ratio of 1:1, 5 wt.% of catalyst, and 80 ◦C). In situationswhere better BzOH conversions, BzD yields, and heteroelement incorporation are aimed for, cerium(III)chloride precursor affords the ideal material. In situations where BzD selectivity and catalytic enduranceis the objective, cerium(III) nitrate precursor might be the best choice of synthetic precursor.
3. Materials and Methods
3.1. Materials
Cetyltrimethylammonium bromide (CTAB, Sigma-Aldrich, >99.9%, Darmstadt, Germany),ammonium hydroxide (NH4OH, Sigma-Aldrich, 28–30 wt.% aqueous solution, Darmstadt, Germany),ethyl orthosilicate (TEOS, Sigma-Aldrich, 98%, Darmstadt, Germany), silver nitrate (AgNO3, HoneywellFluka, ≥99.5%, Seelze, Germany), cerium chloride heptahydrate (CeCl3·7H2O, Sigma-Aldrich, >98%,
60
Catalysts 2019, 9, 377
Darmstadt, Germany), cerium nitrate hexahydrate (Ce(NO3)3·6H2O, Vetec, 99%, Duque de Caxias, RJ,Brazil), benzyl alcohol (BzOH, Tedia®, >99%, Fairfield, OH, USA), tert-butyl hydroperoxide (TBHP,Sigma-Aldrich, 70 wt.% aqueous solution, Darmstadt, Germany), hydrogen peroxide (H2O2, Vetec, 30wt.% aqueous solution, Duque de Caxias, RJ, Brazil), di-tert-butyl peroxide (DTBP, Sigma-Aldrich, 98%,Darmstadt, Germany), deuterated chloroform (CDCl3, Sigma-Aldrich, ≥ 99.8% D atom and 0.03% v/vof tetramethylsilane, TMS, Darmstadt, Germany), acetonitrile (CH3CN, J.T.Baker, 99.99%, Phillipsburg,NJ, USA), and isopropanol (i-PrOH, Cromoline, 99.5%, Diadema, SP, Brazil) were used as supplied.
3.2. Synthesis of MCM-41 Materials
The catalysts were synthesized following an adaptation of the precipitation method proposed byGrün and co-workers [94]. In the synthesis of Si-MCM-41, 55 mL of deionized water and 1.24 g ofCTAB were added in a round bottom flask. The mixture was stirred at 400 rpm and heated at 30 to35 ◦C until homogenization. Then, 4.1 mL of concentrated NH4OH and 5 mL of TEOS were added,the latter being dropwise with a Pasteur pipette. The synthetic mixture contained the following molarratio of the reactants: 1TEOS:0.152CTAB:2.8NH4OH:141.2H2O. After 4 h of reaction, the resultingwhite solid was filtered and washed with distilled water until it was free of halide anions (tested witha 1 mol L−1 aqueous solution of AgNO3). The material was dried at room temperature for 3 days andthen calcined in two steps: 300 ◦C for 3 h and 550 ◦C for 3 h. Ce-MCM-41 samples were prepared byadding, simultaneously, 5 mL of an aqueous solution of CeCl3·7H2O or Ce(NO3)3·6H2O and TEOSin a dropwise manner. The synthetic mixture contained a Si/Ce molar ratio = 25, generating thematerials of Ce-MCM-Cl and Ce-MCM-NO3, respectively. The resulting light brown/purple solids werefiltered, washed, dried, and calcined under the same conditions as Si-MCM-41. After the calcinationprocedure, both cerium-incorporated materials showed a light-yellow appearance. The as-synthesizedmaterials (obtained after the drying step) were designated as A-Si-MCM-41, A-Ce-MCM-Cl, andA-Ce-MCM-NO3.
3.3. Characterization of the Catalysts
X-ray fluorescence (XRF) analyses were made under vacuum on a Shimadzu EDX-720 (Tokyo,Japan) equipped with a rhodium tube as the X-ray source.
X-ray diffraction (XRD) patterns were obtained on a Rigaku Ultima IV diffractometer (Tokyo,Japan) with CuKα radiation (λ = 0.15409 nm) at 1◦ min−1, 2θ range between 2 and 80◦, and a step of0.01◦. For peak deconvolution, Gaussian functions were fitted with an exponential decay baselineusing the Peak Analyzer tool in OriginPro 2019. The calculation of the cell lattice parameter (a) wasmade using crystallographic knowledge of hexagonal crystal lattices and Bragg’s law [95] according toEquations (1) and (2):
a = (2/31/2)d100 (1)
d100 = 2d200 (2)
where d100 and d200 are interplanar spaces of the 100 and 200 reflections, respectively.Fourier transform infrared spectroscopy (FTIR) spectra were obtained on a Varian 640-IR (Palo
Alto, CA, USA) using a 4 cm−1 resolution, 32 scans, and 1 wt.% of sample in KBr pellets.The Raman spectroscopy measurements were performed on an In-ViaTM Raman system from
Renishaw (Wotton-under-Edge, Glos., England) equipped with a thermoelectric cooled CCD detectorand a 1200 lines/groove diffraction grating. A Leica microscope (Wetzlar, Germany) with a 50× objectivelens was used to focus the radiation of the excitation laser on the sample and to collect the scatteredphotons. The wavenumbers were calibrated using the Raman phonon of a silicon wafer at 520.5 cm−1.Each spectrum was the accumulation of 10 scans with a 20 s integration time at 632.8 nm (HeNe laser).All Raman spectra were recorded at a laser power of 20 mW and the nominal spectra resolution was6 cm−1. A 1 mm optical path quartz cuvette was used to perform Raman measurements of the solutions.All Raman measurements were performed at room temperature.
61
Catalysts 2019, 9, 377
Diffuse reflectance UV-Vis spectroscopy (UV-Vis-DRS) spectra were obtained on a Varian Cary5000 UV-Vis-NIR spectrophotometer (Palo Alto, CA, USA) equipped with a Harrick diffuse reflectanceaccessory and using BaSO4 as a background standard. The optical band gap was calculated usingthe Davis-Mott method [96], in which a plot is done according to Equation (3). After obtaining theDavis-Mott plot, an extrapolation to zero of the linear portion where the curvature of the graph firstchanges gives the optical band gap value:
[αhυ]1/n = A(Eg − hυ) (3)
where α is the absorption coefficient, replaced in this work by the Kubelka-Munk function, F(R); Eg isthe optical band gap; hυ is energy; A is a proportionality constant; and 1/n is a coefficient dependent onthe type of transition responsible for the absorption edge observed.
Nuclear magnetic resonance (NMR) experiments were conducted in the solid state at 14 T with aBruker AscendTM 600 (Kontich, AN, Belgium) equipped with a 4 mm magic-angle spinning (MAS)probe and zirconia rotors. 29Si MAS-NMR spectra (119.237 MHz) were obtained with spinning rate at10 kHz, pulse length of 4.25 μs (π/2), 512 scans, and a recycle delay of 20 s. The spectra were referencedto TMS (δ = 0.0 ppm). The molar percentage of silanol groups (Si molar%) was calculated usingEquation (4) [97]:
Si molar% = [(2Q2 + Q3)/(Q2 + Q3 + Q4)]100 (4)
where Q2, Q3, and Q4 correspond to the relative proportions in the percentage of geminal silanols,terminal silanols, and siloxane groups, respectively. Peak areas were obtained after deconvolution byfitting the signals to Voigt peaks in the range between −110 and −90 ppm.
Thermogravimetry (TG), derivative thermogravimetry (DTG), and differential scanningcalorimetry (DSC) curves were obtained on a TA Instruments SDT Q600 (New Castle, DE, USA)from room temperature to 1000 ◦C (20 ◦C min−1), using synthetic air (99.999%) as the purge gas (flowrate of 60 mL min−1). The analysis was performed on alumina crucibles and the external standardemployed for calibration was sapphire.
N2 physisorption measurements were performed at −196 ◦C on a Quantachrome InstrumentsNOVA 4200e apparatus (Boynton Beach, FL, USA). All samples were outgassed at 200 ◦C undervacuum for 24 h prior to the analysis. Surface area and porosity data were obtained from N2
adsorption/desorption isotherms. Total specific surface area (Stotal), external specific surface area (Sext),and mesopore volume (Vmeso) were determined using a t-plot curve obtained from analytical functionsfor each portion of the P/P0 domain (see Equations (5)–(8) and Figure 10a) [86]. Mesoporous surfacearea (Smeso) was calculated by subtracting Sext from Stotal. Total pore volume (Vtotal) was calculatedusing the penultimate point from the adsorption isotherm. Average pore diameter (PD) was calculatedaccording to Equation (9). Wall thickness (WT) was calculated according to Equation (10):
t (nm) = A(P/P0)a + B(P/P0)b for 0.03 ≤ P/P0 < 0.25 (5)
t (nm) = {C/[D − log(P/P0)]}c for 0.25 ≤ P/P0 < 0.60 (6)
t (nm) = {E/[F − log(P/P0)]}e for 0.60 ≤ P/P0 < 0.90 (7)
t (nm) = G(P/P0)g + H(P/P0)h for 0.90 ≤ P/P0 (8)
PD (nm) = 4Vtotal/Stotal (9)
WT (nm) = a − PD (10)
where A = 0.5675647, a = 0.199735, B = 0.4116168, b = 2.00834, C = 0.1423566, D = 0.1078, c = 0.4888,E = 0.08309076, F = 0.02995, e = 0.369, G = 1.268066, g = 1.931, H = 0.76934, and h = 51.09.
Low-resolution transmission electron microscopy (TEM) images were obtained on a JEOL-1011microscope (Tokyo, Japan) at 120 kV. Before analysis, each sample was dispersed in ethanol (0.1 mg mL−1)
62
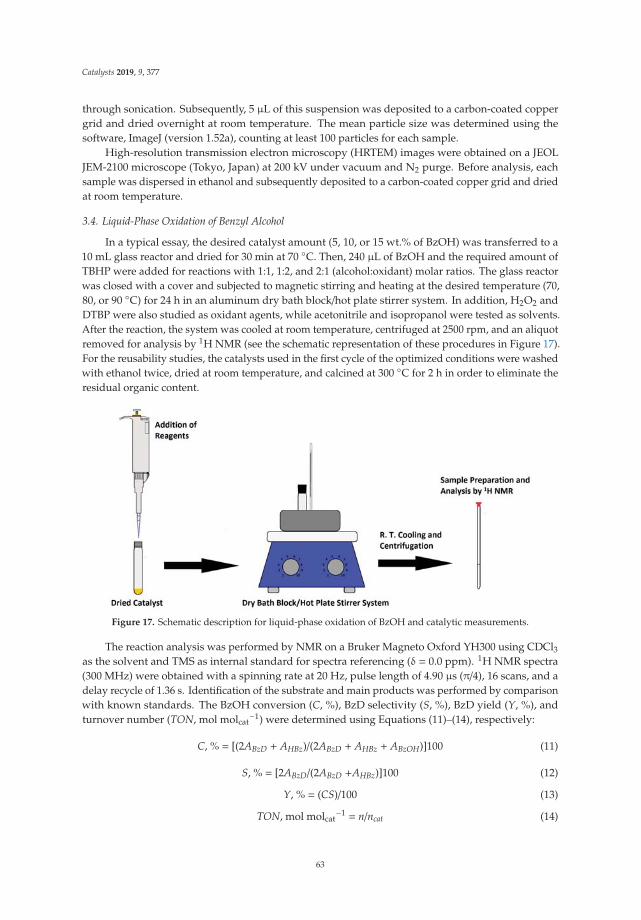
Catalysts 2019, 9, 377
through sonication. Subsequently, 5 μL of this suspension was deposited to a carbon-coated coppergrid and dried overnight at room temperature. The mean particle size was determined using thesoftware, ImageJ (version 1.52a), counting at least 100 particles for each sample.
High-resolution transmission electron microscopy (HRTEM) images were obtained on a JEOLJEM-2100 microscope (Tokyo, Japan) at 200 kV under vacuum and N2 purge. Before analysis, eachsample was dispersed in ethanol and subsequently deposited to a carbon-coated copper grid and driedat room temperature.
3.4. Liquid-Phase Oxidation of Benzyl Alcohol
In a typical essay, the desired catalyst amount (5, 10, or 15 wt.% of BzOH) was transferred to a10 mL glass reactor and dried for 30 min at 70 ◦C. Then, 240 μL of BzOH and the required amount ofTBHP were added for reactions with 1:1, 1:2, and 2:1 (alcohol:oxidant) molar ratios. The glass reactorwas closed with a cover and subjected to magnetic stirring and heating at the desired temperature (70,80, or 90 ◦C) for 24 h in an aluminum dry bath block/hot plate stirrer system. In addition, H2O2 andDTBP were also studied as oxidant agents, while acetonitrile and isopropanol were tested as solvents.After the reaction, the system was cooled at room temperature, centrifuged at 2500 rpm, and an aliquotremoved for analysis by 1H NMR (see the schematic representation of these procedures in Figure 17).For the reusability studies, the catalysts used in the first cycle of the optimized conditions were washedwith ethanol twice, dried at room temperature, and calcined at 300 ◦C for 2 h in order to eliminate theresidual organic content.
Figure 17. Schematic description for liquid-phase oxidation of BzOH and catalytic measurements.
The reaction analysis was performed by NMR on a Bruker Magneto Oxford YH300 using CDCl3as the solvent and TMS as internal standard for spectra referencing (δ = 0.0 ppm). 1H NMR spectra(300 MHz) were obtained with a spinning rate at 20 Hz, pulse length of 4.90 μs (π/4), 16 scans, and adelay recycle of 1.36 s. Identification of the substrate and main products was performed by comparisonwith known standards. The BzOH conversion (C, %), BzD selectivity (S, %), BzD yield (Y, %), andturnover number (TON, mol molcat
−1) were determined using Equations (11)–(14), respectively:
C, % = [(2ABzD + AHBz)/(2ABzD + AHBz + ABzOH)]100 (11)
S, % = [2ABzD/(2ABzD +AHBz)]100 (12)
Y, % = (CS)/100 (13)
TON, mol molcat−1 = n/ncat (14)
63
Catalysts 2019, 9, 377
where ABzOH, ABzD, and AHBz are the integrated areas of the methylene singlet at 4.69 ppm, the aldehydehydrogen singlet at 10.02 ppm, and the deshielded aromatic double multiplet centered at 8.10 ppm,respectively; n =moles of BzOH converted; and ncat =moles of Ce in the catalyst.
4. Conclusions
For the first time, the effect of different cerium(III) precursors was reported in the synthesisof Ce-MCM-41 materials. Cerium incorporation into the MCM-41 framework led to long-rangedisordered materials, but the results obtained by several characterization techniques showed theinfluence of different anions in the microstructural properties and catalytic activity of Ce-MCM-Cland Ce-MCM-NO3. A mechanism for cerium incorporation in the MCM-41 structure was proposed,where [Ce(OH)3] species were hydrogen bonded to silicate anions, forming framework Ce-O-Si bondsduring condensation. It was also observed that the synthesis of Ce-MCM-NO3 follows a differentpath when compared to Ce-MCM-Cl. The former induced Ce(OH)3 monomers to aggregate, formingnon-framework CeO2 during calcination on the MCM-41 surface, while the latter preferentiallyformed framework Ce-O-Si bonds. The preferential formation of CeO2 species on Ce-MCM-NO3
was attributed to the nitrate ions’ strong binding to template molecules. The prepared materialswere tested in the solvent free oxidation of benzyl alcohol to produce benzaldehyde, an importantfine chemical compound for several industrial sectors, and the reaction parameters were optimizedfor each catalyst. Overall, Ce-MCM-Cl achieved better BzOH conversions and benzaldehyde (BzD)yields, while Ce-MCM-NO3 offered increased BzD selectivity. The catalysts’ reusability was alsostudied over three cycles. Ce-MCM-Cl and Ce-MCM-NO3 showed a reduction in conversion, butincrease in selectivity, resulting in negligible changes in BzD yield values. Also, it was observed thatthe different crystallization mechanism differentiates both catalysts’ endurance towards deactivation,where Ce-MCM-NO3 was more resistant than Ce-MCM-Cl. This effect was attributed to the CeO2
coating on the Ce-MCM-NO3 surface, making the latter less prone to possible etching effects fromTBHP. Thus, the manuscript shows the importance of the selection of suitable heteroelement precursorsin the synthesis of materials. Even more, there is scarce literature regarding differences in the samemetal-incorporated silicas that can achieve different conditions for liquid-phase reactions, an aspectvery important when seeking the best choices for the synthetic preparation of catalysts with the desiredactivity/selectivity in industrial processes.
Supplementary Materials: The following are available online at http://www.mdpi.com/2073-4344/9/4/377/s1,Figure S1: XRD patterns of Ce-MCM-Cl and Ce-MCM-NO3 materials at high angle region, Figure S2. Raman spectraof CTA+ systems between 400–1700 cm−1 (A) and 2800–3000 cm−1 (B), Figure S3. Raman spectrum of crystallineCeO2, Figure S4. Absorption spectra (A) and Davis-Mott plot (B) for of CeO2, Figure S5. High magnification inHRTEM images highlighting CeO2 110 interplanar spacing for: Ce-MCM-Cl (A) and Ce-MCM-NO3 (B), Table S1.Raman band assignments for CTA+ cations in as-synthesized MCM-41 materials and template standards, Table S2.TGA results for the as-synthesized MCM-41 materials, Table S3. TGA results for the calcined MCM-41 materials.
Author Contributions: Conceptualization, formal analysis, methodology, project administration, visualization,writing—Review and editing, C.M.A. and J.L.M.; investigation, C.M.A. and K.V.d.O.; writing—Original draftpreparation, C.M.A., K.V.d.O. and J.L.M.; validation, C.M.A.; funding acquisition, resources, supervision, J.L.M.
Funding: This research was funded by Conselho Nacional de Desenvolvimento Científico e Tecnológico—Brasil(CNPq), grant number 308061/2015-2; Fundação de Apoio à Pesquisa do Distrito Federal (FAPDF)—Brasil, grantnumber 0193001347/2016; and Coordenação de Aperfeiçoamento de Pessoal de Nível Superior—Brasil (CAPES),finance code 001.
Acknowledgments: The authors would like to thank Financiadora de Inovação e Pesquisa—Brasil (Finep), Institutode Química da Universidade de Brasília—Brasil, Ministério da Ciência, Tecnologia e Inovação—Brasil (MCTI),Linconl Araújo Teixeira and Sandra Maria da Luz (Faculdade Gama da Universidade de Brasília—Brasil) forTG/DTG/DSC measurements, Rafael Brasil Figueras (Instituto de Geociências da Universidade de Brasília—Brasil)for XRD measurements, Tatiane Oliveira dos Santos (Laboratório Multiusuário de Alta Resolução da UniversidadeFederal do Goiás—Brasil) for high resolution TEM measurements, Ingrid Gracielle Martins da Silva (Laboratóriode Microscopia Eletrônica e Microanálise do Instituto de Ciências Biológicas da Universidade de Brasília—Brasil)for low resolution TEM measurements, Maryene Alves Camargo for theoretical discussion and Claudia CristinaGatto for the support during this manuscripts writing.
64
Catalysts 2019, 9, 377
Conflicts of Interest: The authors declare no conflict of interest. The funders had no role in the design of thestudy; in the collection, analyses, or interpretation of data; in the writing of the manuscript, or in the decision topublish the results.
References
1. Ciriminna, R.; Pagliaro, M. Green chemistry in the fine chemicals and pharmaceutical industries. Org. ProcessRes. Dev. 2013, 17, 1479–1484. [CrossRef]
2. de Oliveira, N.B. Inovação e produção na química fina. Quim. Nova 2005, 28, S79–S85. [CrossRef]3. O desempenho da indústria quimica em 2017. Available online: http://www.webcitation.org/75xqkk7e9
(accessed on 5 February 2019).4. Anastas, P.; Eghbali, N. Green chemistry: Principles and practice. Chem. Soc. Rev. 2010, 39, 301–312. [CrossRef]5. Sheldon, R.A. The E Factor: Fifteen years on. Green Chem. 2007, 9, 1273–1283. [CrossRef]6. Brühne, F.; Wright, E. Benzaldehyde. In Ullmann’s Encyclopedia of Industrial Chemistry, 7th ed.; Elvers, B., Ed.;
Wiley-VCH Verlag GmbH & Co. KGaA: Weinheim, Germany, 2011; Volume 5, pp. 223–235.7. Benzaldehyde Market for Aroma Chemicals, Pharmaceuticals, Agriculture, Coatings and Other
End-Users—Global Industry Analysis, Size, Share, Growth, Trends and Forecast 2015–2023. Available online:http://www.webcitation.org/75xscDvAV (accessed on 5 February 2019).
8. Shearon, W.H.; Hall, H.E.; Stevens, J.E. Fine chemicals from coal. Ind. Eng. Chem. 1949, 41, 1812–1820. [CrossRef]9. Sheldon, R.A. Recent advances in green catalytic oxidations of alcohols in aqueous media. Catal. Today 2015,
247, 4–13. [CrossRef]10. Kopylovich, M.N.; Ribeiro, A.P.C.; Alegria, E.C.B.A.; Martins, N.M.R.; Martins, L.M.D.R.S.; Pombeiro, A.J.L.
Catalytic oxidation of alcohols: Recent advances. Adv. Organomet. Chem. 2015, 63, 91–174.11. Sankar, M.; Nowicka, E.; Carter, E.; Murphy, D.M.; Knight, D.W.; Bethell, D.; Hutchings, G.J. The benzaldehyde
oxidation paradox explained by the interception of peroxy radical by benzyl alcohol. Nat. Commun. 2014, 5,3332–3337. [CrossRef]
12. Della Pina, C.; Falletta, E.; Rossi, M. Highly selective oxidation of benzyl alcohol to benzaldehyde catalyzedby bimetallic gold–copper catalyst. J. Catal. 2008, 260, 384–386. [CrossRef]
13. Enache, D.I.; Edwards, J.K.; Landon, P.; Solsona-Espriu, B.; Carley, A.F.; Herzing, A.A.; Watanabe, M.;Kiely, C.J.; Knight, D.W.; Hutchings, G.J. Solvent-free oxidation of primary alcohols to aldehydes usingAu-Pd/TiO2 catalysts. Science 2006, 311, 362–365. [CrossRef] [PubMed]
14. Jia, A.; Lou, L.-L.; Zhang, C.; Zhang, Y.; Liu, S. Selective oxidation of benzyl alcohol to benzaldehyde withhydrogen peroxide over alkali-treated ZSM-5 zeolite catalysts. J. Mol. Catal. A Chem. 2009, 306, 123–129.[CrossRef]
15. Bansal, V.K.; Thankachan, P.P.; Prasad, R. Oxidation of benzyl alcohol and styrene using H2O2 catalyzed bytetraazamacrocycle complexes of Cu(II) and Ni(II) encapsulated in zeolite-Y. Appl. Catal. A Gen. 2010, 381,8–17. [CrossRef]
16. Chen, G.; Zhou, Y.; Long, Z.; Wang, X.; Li, J.; Wang, J. Mesoporous polyoxometalate-based ionic hybrid as atriphasic catalyst for oxidation of benzyl alcohol with H2O2 on water. ACS Appl. Mater. Interfaces 2014, 6,4438–4446. [CrossRef] [PubMed]
17. Della Pina, C.; Falletta, E.; Prati, L.; Rossi, M. Selective oxidation using gold. Chem. Soc. Rev. 2008, 37,2077–2095. [CrossRef]
18. Corma, A.; García, H. Lewis Acids as Catalysts in Oxidation Reactions: From Homogeneous to HeterogeneousSystems. Chem. Rev. 2002, 102, 3837–3892. [CrossRef] [PubMed]
19. Ishii, Y.; Yamawaki, K.; Ura, T.; Yamada, H.; Yoshida, T.; Ogawa, M. Hydrogen peroxide oxidation catalyzedby heteropoly acids combined with cetylpyridinium chloride. Epoxidation of olefins and allylic alcohols,ketonization of alcohols and diols, and oxidative cleavage of 1,2-diols and olefins. J. Org. Chem. 1988, 53,3587–3593. [CrossRef]
20. Venturello, C.; D’Aloisio, R.; Bart, J.C.J.; Ricci, M. A New peroxotungsten heteropoly anion with specialoxidizing properties: Synthesis and structure of tetrahexylammonium tetra(diperoxotungsto)phosphate(3-).J. Mol. Catal. 1985, 32, 107–110. [CrossRef]
21. Kresge, C.T.; Roth, W.J. The discovery of mesoporous molecular sieves from the twenty year perspective.Chem. Soc. Rev. 2013, 42, 3663–3670. [CrossRef]
65
Catalysts 2019, 9, 377
22. Alothman, A.Z. A review: Fundamental aspects of silicate mesoporous materials. Materials 2012, 5, 2874–2902.[CrossRef]
23. Linares, N.; Silvestre-Albero, A.M.; Serrano, E.; Silvestre-Albero, J.; García-Martínez, J. Mesoporous materialsfor clean energy technologies. Chem. Soc. Rev. 2014, 43, 7681–7717. [CrossRef]
24. Lin, H.-P.; Mou, C.-Y. Salt effect in post-synthesis hydrothermal treatment of MCM-41. Microporous MesoporousMater. 2002, 55, 69–80. [CrossRef]
25. Lin, H.-P.; Kao, C.-P.; Mou, C.-Y. Counterion and alcohol effect in the formation of mesoporous silica.Microporous Mesoporous Mater. 2001, 48, 135–141. [CrossRef]
26. Leontidis, E. Hofmeister anion effects on surfactant self-assembly and the formation of mesoporous solids.Curr. Opin. Colloid Interface Sci. 2002, 7, 81–91. [CrossRef]
27. Singh, S.; Patel, A. Environmentally benign oxidations of alkenes and alcohols to corresponding aldehydesover anchored phosphotungstates: Effect of supports as well as oxidants. Catal. Lett. 2016, 146, 1059–1072.[CrossRef]
28. Patel, A.; Singh, S. Undecatungstophosphate anchored to MCM-41: An ecofriendly and efficient bifunctionalsolid catalyst for non-solvent liquid-phase oxidation as well as esterification of benzyl alcohol. MicroporousMesoporous Mater. 2014, 195, 240–249. [CrossRef]
29. Wang, X.; Wu, G.; Li, J.; Zhao, N.; Wei, W.; Sun, Y. Selective oxidation of benzyl alcohol catalyzed by Cr(salen)complexes immobilized on MCM-41. J. Mol. Catal. A Chem. 2007, 276, 86–94. [CrossRef]
30. Hamza, A.; Srinivas, D. Selective oxidation of benzyl alcohol over copper phthalocyanine immobilized onMCM-41. Catal. Lett. 2009, 128, 434–442. [CrossRef]
31. Kumar, A.; Kumar, V.P.; Vishwanathan, V.; Chary, K.V.R. Synthesis, characterization, and reactivity ofAu/MCM-41 catalysts prepared by homogeneous deposition–precipitation (HDP) method for vapor phaseoxidation of benzyl alcohol. Mater. Res. Bull. 2015, 61, 105–112. [CrossRef]
32. Pal, N.; Cho, E.-B.; Kim, D. Synthesis of ordered mesoporous silica/ceria–silica composites and their highcatalytic performance for solvent-free oxidation of benzyl alcohol at room temperature. RSC Adv. 2014, 4,9213–9222. [CrossRef]
33. Cánepa, A.L.; Elías, V.R.; Vaschetti, V.M.; Sabre, E.V.; Eimer, G.A.; Casuscelli, S.G. Selective oxidation ofbenzyl alcohol through eco-friendly processes using mesoporous V-MCM-41, Fe-MCM-41 and Co-MCM-41materials. Appl. Catal. A Gen. 2017, 545, 72–78. [CrossRef]
34. Dang, T.T.H.; Seeburg, D.; Radnik, J.; Kreyenschulte, C.; Atia, H.; Vu, T.T.H.; Wohlrab, S. Influence ofV-sources on the catalytic performance of VMCM-41 in the selective oxidation of methane to formaldehyde.Catal. Commun. 2018, 103, 56–59. [CrossRef]
35. Corma, A.; Navarro, M.T.; Nemeth, L.; Renz, M. Sn-MCM-41—A heterogeneous selective catalyst for theBaeyer–Villiger oxidation with hydrogen peroxide. Chem. Commun. 2001, 2190–2191. [CrossRef]
36. Yao, W.; Chen, Y.; Min, L.; Fang, H.; Yan, Z.; Wang, H.; Wang, J. Liquid oxidation of cyclohexane tocyclohexanol over cerium-doped MCM-41. J. Mol. Catal. A Chem. 2006, 246, 162–166. [CrossRef]
37. González Vargas, O.A.; de los Reyes Heredia, J.A.; Montesinos Castellanos, A.; Chen, L.F.; Wang, J.A. Ceriumincorporating into MCM-41 mesoporous materials for CO oxidation. Mater. Chem. Phys. 2013, 139, 125–133.[CrossRef]
38. Ghesti, G.F.; de Macedo, J.L.; Parente, V.C.; Dias, J.A.; Dias, S.C. Synthesis, characterization and reactivity ofLewis acid/surfactant cerium trisdodecylsulfate catalyst for transesterification and esterification reactions.Appl. Catal. A Gen. 2009, 355, 139–147. [CrossRef]
39. Cesteros, Y.; Haller, G.L. Several factors affecting Al-MCM-41 synthesis. Microporous Mesoporous Mater. 2001,43, 171–179. [CrossRef]
40. Ghiaci, M.; Seyedeyn-Azad, F.; Kia, R. Fast and efficient synthesis of ZSM-5 in a broad range of SiO2/Al2O3
without using seeding gel. Mater. Res. Bull. 2004, 39, 1257–1264. [CrossRef]41. Zhao, D.; Nie, C.; Zhou, Y.; Xia, S.; Huang, L.; Li, Q. Comparison of disordered mesoporous aluminosilicates
with highly ordered Al-MCM-41 on stability, acidity and catalytic activity. Catal. Today 2001, 68, 11–20.[CrossRef]
42. Reddy, K.M.; Song, C. Effect of Al sources on the synthesis and acidic characteristics of mesoporousaluminosilicates of MCM-41 type. In Studies in Surface Science and Catalysis; Bonneviot, L., Béland, F.,Danumah, C., Giasson, S., Kaliaguine, S., Eds.; Elsevier: Amsterdam, The Netherlands, 1998; Volume 117,pp. 291–299.
66
Catalysts 2019, 9, 377
43. Matsumoto, A.; Chen, H.; Tsutsumi, K.; Grün, M.; Unger, K. Novel route in the synthesis of MCM-41containing framework aluminum and its characterization. Microporous Mesoporous Mater. 1999, 32, 55–62.[CrossRef]
44. Lin, W.; Cai, Q.; Pang, W.; Yue, Y.; Zou, B. New mineralization agents for the synthesis of MCM-41.Microporous Mesoporous Mater. 1999, 33, 187–196. [CrossRef]
45. Beck, J.S.; Vartuli, J.C.; Roth, W.J.; Leonowicz, M.E.; Kresge, C.T.; Schmitt, K.D.; Chu, C.T.W.; Olson, D.H.;Sheppard, E.W.; McCullen, S.B.; et al. A new family of mesoporous molecular sieves prepared with liquidcrystal templates. J. Am. Chem. Soc. 1992, 114, 10834–10843. [CrossRef]
46. Shannon, R. Revised effective ionic radii and systematic studies of interatomic distances in halides andchalcogenides. Acta Crystallogr. Sect. A 1976, 32, 751–767. [CrossRef]
47. El Haskouri, J.; Morales, J.M.; Ortiz de Zárate, D.; Fernández, L.; Latorre, J.; Guillem, C.; Beltrán, A.;Beltrán, D.; Amorós, P. Nanoparticulated silicas with bimodal porosity: Chemical control of the pore sizes.Inorg. Chem. 2008, 47, 8267–8277. [CrossRef]
48. Zhan, W.; Lu, G.; Guo, Y.; Guo, Y.; Wang, Y.; Wang, Y.; Zhang, Z.; Liu, X. Synthesis of cerium-doped MCM-48molecular sieves and its catalytic performance for selective oxidation of cyclohexane. J. Rare Earths 2008, 26,515–522. [CrossRef]
49. de Souza, L.K.C.; Pardauil, J.J.R.; Zamian, J.R.; da Rocha Filho, G.N.; Barrado, C.M.; Angélica, R.S.; daCosta, C.E.F. Rapid synthesis and characterization of CeMCM-41. Powder Technol. 2012, 229, 1–6. [CrossRef]
50. Bing, J.; Li, L.; Lan, B.; Liao, G.; Zeng, J.; Zhang, Q.; Li, X. Synthesis of cerium-doped MCM-41 for ozonationof p-chlorobenzoic acid in aqueous solution. Appl. Catal. B 2012, 115–116, 16–24. [CrossRef]
51. Laha, S.C.; Mukherjee, P.; Sainkar, S.R.; Kumar, R. Cerium containing MCM-41-type mesoporous materialsand their acidic and redox catalytic properties. J. Catal. 2002, 207, 213–223. [CrossRef]
52. Barkam, S.; Ortiz, J.; Saraf, S.; Eliason, N.; McCormack, R.; Das, S.; Gupta, A.; Neal, C.; Petrovici, A.;Hanson, C.; et al. Modulating the catalytic activity of cerium oxide nanoparticles with the anion of theprecursor salt. J. Phys. Chem. C 2017, 121, 20039–20050. [CrossRef]
53. Mihailova, B.; Valtchev, V.; Mintova, S.; Faust, A.C.; Petkov, N.; Bein, T. Interlayer stacking disorder in zeolitebeta family: A Raman spectroscopic study. Phys. Chem. Chem. Phys. 2005, 7, 2756–2763. [CrossRef]
54. Zhou, L.; Li, X.; Yao, Z.; Chen, Z.; Hong, M.; Zhu, R.; Liang, Y.; Zhao, J. Transition-metal doped ceriamicrospheres with nanoporous structures for CO oxidation. Sci. Rep. 2016, 6, 23900. [CrossRef]
55. Khalil, K.M.S. Cerium modified MCM-41 nanocomposite materials via a nonhydrothermal direct method atroom temperature. J. Colloid Interface Sci. 2007, 315, 562–568. [CrossRef]
56. Kolodziejski, W.; Corma, A.; Navarro, M.-T.; Pérez-Pariente, J. Solid-state NMR study of ordered mesoporousaluminosilicate MCM-41 synthesized on a liquid-crystal template. Solid State Nucl. Magn. Reson. 1993, 2,253–259. [CrossRef]
57. Chao, K.J.; Wu, C.N.; Chang, H.; Lee, L.J.; Hu, S.-f. Incorporation of vanadium in mesoporous MCM-41 andmicroporous AFI zeolites. J. Phys. Chem. B 1997, 101, 6341–6349. [CrossRef]
58. Hill, P.J.; Shrestha, K.L.; Ishihara, S.; Ji, Q.; Ariga, K. Self-assembly: From amphiphiles to chromophores andbeyond. Molecules 2014, 19, 8589–8609. [CrossRef]
59. Chen, C.-Y.; Burkett, S.L.; Li, H.-X.; Davis, M.E. Studies on mesoporous materials II. Synthesis mechanism ofMCM-41. Microporous Mater. 1993, 2, 27–34. [CrossRef]
60. Dendramis, A.L.; Schwinn, E.W.; Sperline, R.P. A surface-enhanced Raman scattering study of CTABadsorption on copper. Surf. Sci. 1983, 134, 675–688. [CrossRef]
61. Snyder, R.G.; Strauss, H.L.; Elliger, C.A. Carbon-hydrogen stretching modes and the structure of n-alkylchains. 1. Long, disordered chains. J. Phys. Chem. 1982, 86, 5145–5150. [CrossRef]
62. Orendorff, C.J.; Ducey, M.W.; Pemberton, J.E. Quantitative correlation of Raman spectral indicators indetermining conformational order in alkyl chains. J. Phys. Chem. A 2002, 106, 6991–6998. [CrossRef]
63. Jamieson Lauren, E.; Li, A.; Faulds, K.; Graham, D. Ratiometric analysis using Raman spectroscopy as apowerful predictor of structural properties of fatty acids. R. Soc. Open Sci. 2018, 5, 181483. [CrossRef]
64. Terribile, D.; Trovarelli, A.; Llorca, J.; de Leitenburg, C.; Dolcetti, G. The synthesis and characterization ofmesoporous high-surface area ceria prepared using a hybrid organic/inorganic route. J. Catal. 1998, 178,299–308. [CrossRef]
67
Catalysts 2019, 9, 377
65. Hayes, S.A.; Yu, P.; O’Keefe, T.J.; O’Keefe, M.J.; Stoffer, J.O. The phase stability of cerium species in aqueoussystems: I. E-pH diagram for the Ce-HClO4–H2O system. J. Electrochem. Soc. 2002, 149, C623–C630.[CrossRef]
66. Bumajdad, A.; Eastoe, J.; Mathew, A. Cerium oxide nanoparticles prepared in self-assembled systems.Adv. Colloid Interface Sci. 2009, 147–148, 56–66. [CrossRef]
67. Bouchaud, B.; Balmain, J.; Bonnet, G.; Pedraza, F. pH-distribution of cerium species in aqueous systems.J. Rare Earths 2012, 30, 559–562. [CrossRef]
68. Peppard, D.F.; Mason, G.W.; Hucher, I. Stability constants of certain lanthanide(III) and actinide(III) chlorideand nitrate complexes. J. Inorg. Nucl. Chem. 1962, 24, 881–888. [CrossRef]
69. Berr, S.; Jones, R.R.M.; Johnson, J.S. Effect of counterion on the size and charge of alkyltrimethylammoniumhalide micelles as a function of chain length and concentration as determined by small-angle neutronscattering. J. Phys. Chem. 1992, 96, 5611–5614. [CrossRef]
70. Ye, F.; Vallhov, H.; Qin, J.; Daskalaki, E.; Sugunan, A.; Toprak, M.S.; Fornara, A.; Gabrielsson, S.; Scheynius, A.;Muhammed, M. Synthesis of high aspect ratio gold nanorods and their effects on human antigen presentingdendritic cells. Int. J. Nanotechnol. 2011, 8, 22. [CrossRef]
71. Gamboa, C.; Sepulveda, L.; Soto, R. Free energies of transfer of anions from water to cationic micelles fromionic exchange measurements. J. Phys. Chem. 1981, 85, 1429–1434. [CrossRef]
72. Xiong, G.; Li, C.; Li, H.; Xin, Q.; Feng, Z. Direct spectroscopic evidence for vanadium species in V-MCM-41molecular sieve characterized by UV resonance Raman spectroscopy. Chem. Commun. 2000, 677–678.[CrossRef]
73. Casas-Orozco, D.; Alarcón, E.; Carrero, C.A.; Venegas, J.M.; McDermott, W.; Klosterman, E.; Hermans, I.;Villa, A.-L. Influence of tin loading and pore size of Sn/MCM-41 catalysts on the synthesis of nopol. Ind. Eng.Chem. Res. 2017, 56, 6590–6598. [CrossRef]
74. Li, C. Identifying the isolated transition metal ions/oxides in molecular sieves and on oxide supports by UVresonance Raman spectroscopy. J. Catal. 2003, 216, 203–212. [CrossRef]
75. Li, L.; Chen, F.; Lu, J.-Q.; Luo, M.-F. Study of defect sites in Ce1–xMxO2−δ (x = 0.2) solid solutions usingRaman spectroscopy. J. Phys. Chem. A 2011, 115, 7972–7977. [CrossRef]
76. He, H.; Yang, P.; Li, J.; Shi, R.; Chen, L.; Zhang, A.; Zhu, Y. Controllable synthesis, characterization, andCO oxidation activity of CeO2 nanostructures with various morphologies. Ceram. Int. 2016, 42, 7810–7818.[CrossRef]
77. Soren, S.; Bessoi, M.; Parhi, P. A rapid microwave initiated polyol synthesis of cerium oxide nanoparticleusing different cerium precursors. Ceram. Int. 2015, 41, 8114–8118. [CrossRef]
78. Ghiaci, M.; Abbaspur, A.; Kia, R.; Belver, C.; Trujillano, R.; Rives, V.; Vicente, M.A. Vapor-phase alkylation oftoluene by benzyl alcohol on H3PO4-modified MCM-41 mesoporous silicas. Catal. Commun. 2007, 8, 49–56.[CrossRef]
79. Fu, Y.; Zhan, W.; Guo, Y.; Wang, Y.; Liu, X.; Guo, Y.; Wang, Y.; Lu, G. Effect of surface functionalization ofcerium-doped MCM-48 on its catalytic performance for liquid-phase free-solvent oxidation of cyclohexanewith molecular oxygen. Microporous Mesoporous Mater. 2015, 214, 101–107. [CrossRef]
80. Mullins, D.R. The surface chemistry of cerium oxide. Surf. Sci. Rep. 2015, 70, 42–85. [CrossRef]81. Zdravkovic, J.; Simovic, B.; Golubovic, A.; Poleti, D.; Veljkovic, I.; Šcepanovic, M.; Brankovic, G. Comparative
study of CeO2 nanopowders obtained by the hydrothermal method from various precursors. Ceram. Int.2015, 41, 1970–1979. [CrossRef]
82. Zhao, X.S.; Lu, G.Q.; Whittaker, A.K.; Millar, G.J.; Zhu, H.Y. Comprehensive study of surface chemistry ofMCM-41 using 29Si CP/MAS NMR, FTIR, pyridine-TPD, and TGA. J. Phys. Chem. B 1997, 101, 6525–6531.[CrossRef]
83. Varache, M.; Bezverkhyy, I.; Saviot, L.; Bouyer, F.; Baras, F.; Bouyer, F. Optimization of MCM-41 type silicananoparticles for biological applications: Control of size and absence of aggregation and cell cytotoxicity.J. Non-Cryst. Solids 2015, 408, 87–97. [CrossRef]
84. Vantomme, A.; Yuan, Z.-Y.; Du, G.; Su, B.-L. Surfactant-Assisted Large-Scale Preparation of Crystalline CeO2Nanorods. Langmuir 2005, 21, 1132–1135. [CrossRef]
85. Pan, C.; Zhang, D.; Shi, L. CTAB assisted hydrothermal synthesis, controlled conversion and CO oxidationproperties of CeO2 nanoplates, nanotubes, and nanorods. J. Solid State Chem. 2008, 181, 1298–1306. [CrossRef]
68

Catalysts 2019, 9, 377
86. Galarneau, A.; Villemot, F.; Rodriguez, J.; Fajula, F.; Coasne, B. Validity of the t-plot method to assessmicroporosity in hierarchical micro/mesoporous materials. Langmuir 2014, 30, 13266–13274. [CrossRef]
87. Sing, K.S.W.; Everett, D.H.; Haul, R.A.W.; Moscou, L.; Pierotti, R.A.; Rouquérol, J.; Siemieniewska, T.Reporting physisorption data for gas/solid systems with special reference to the determination of surfacearea and porosity. Pure Appl. Chem. 1985, 57, 17. [CrossRef]
88. Anderson, M.W. Solid-state NMR as a probe of porous catalysts and catalytic processes. Top. Catal. 1996, 3,195–220. [CrossRef]
89. Kleitz, F.; Schmidt, W.; Schüth, F. Evolution of mesoporous materials during the calcination process: Structuraland chemical behavior. Microporous Mesoporous Mater. 2001, 44–45, 95–109. [CrossRef]
90. de Souza, L.K.C.; Pardauil, J.J.R.; Zamian, J.R.; da Rocha Filho, G.N.; da Costa, C.E.F. Influence of theincorporated metal on template removal from MCM-41 type mesoporous materials. J. Therm. Anal. Calorim.2011, 106, 355–361. [CrossRef]
91. Selvaraj, M.; Park, D.W.; Ha, C.S. Well ordered two-dimensional mesoporous CeSBA-15 synthesized withimproved hydrothermal stability and catalytic activity. Microporous Mesoporous Mater. 2011, 138, 94–101.[CrossRef]
92. Timofeeva, M.N.; Jhung, S.H.; Hwang, Y.K.; Kim, D.K.; Panchenko, V.N.; Melgunov, M.S.; Chesalov, Y.A.;Chang, J.S. Ce-silica mesoporous SBA-15-type materials for oxidative catalysis: Synthesis, characterization,and catalytic application. Appl. Catal. A Gen. 2007, 317, 1–10. [CrossRef]
93. Wang, Z.; Balkus, K.J. Liquid phase propylene oxidation with tert-butyl hydroperoxide over titaniumcontaining wrinkled mesoporous silica. Catal. Commun. 2017, 96, 15–18. [CrossRef]
94. Grün, M.; Unger, K.K.; Matsumoto, A.; Tsutsumi, K. Novel pathways for the preparation of mesoporousMCM-41 materials: Control of porosity and morphology. Microporous Mesoporous Mater. 1999, 27, 207–216.[CrossRef]
95. Cullity, B.D. Elements of X-ray Diffraction, 2nd ed.; Addison-Wesley Publishing Company, Inc.: Reading, PS,USA, 1967; pp. 81–349.
96. Davis, E.A.; Mott, N.F. Conduction in non-crystalline systems V. Conductivity, optical absorption andphotoconductivity in amorphous semiconductors. Philos. Mag. 1970, 22, 0903–0922. [CrossRef]
97. Igarashi, N.; Koyano, K.A.; Tanaka, Y.; Nakata, S.; Hashimoto, K.; Tatsumi, T. Investigation of the factorsinfluencing the structural stability of mesoporous silica molecular sieves. Microporous Mesoporous Mater.2003, 59, 43–52. [CrossRef]
© 2019 by the authors. Licensee MDPI, Basel, Switzerland. This article is an open accessarticle distributed under the terms and conditions of the Creative Commons Attribution(CC BY) license (http://creativecommons.org/licenses/by/4.0/).
69

catalysts
Article
Zirconia-Supported Silver Nanoparticles for theCatalytic Combustion of Pollutants Originating fromMobile Sources
Maia Montaña 1, María S. Leguizamón Aparicio 1, Marco A. Ocsachoque 1, Marisa B. Navas 1,
Ivoneide de C. L. Barros 2 , Enrique Rodriguez-Castellón 3 , Mónica L. Casella 1 and
Ileana D. Lick 1,*
1 CINDECA (CCT La Plata- CONICET-UNLP), Departamento de Química, Facultad de Ciencias Exactas,Universidad Nacional de La Plata, Calle 47 N◦ 257, La Plata, Buenos Aires 1900, Argentina;[email protected] (M.M.); [email protected] (M.S.L.A.);[email protected] (M.A.O.); [email protected] (M.B.N.);[email protected] (M.L.C.)
2 Departamento de Química, Universidade Federal Rural de Pernambuco, Rua Dom Manuel de Medeiros,S/N, Dois Irmãos, Recife-PE CEP 52171-900, Brasil; [email protected]
3 Departamento de Química Inorgánica, Cristalografía y Mineralogía, Facultad de Ciencias,Universidad de Málaga, Campus de Teatinos, 29071 Málaga, España; [email protected]
* Correspondence: [email protected]; Tel.: +54-221-421-1353
Received: 29 January 2019; Accepted: 16 March 2019; Published: 25 March 2019
Abstract: This work presents the physicochemical characterization and activity of zirconia-supportedsilver catalysts for the oxidation of pollutants present in diesel engine exhaust (propane, propene,naphthalene and soot). A series of silver-supported catalysts AgxZ (x = 1, 5 and 10 wt.%, Z = zirconia)were prepared, which were studied by various characterization techniques. The results show thatsilver is mainly found under the form of small metal nanoparticles (<10 nm) dispersed over thesupport. The metallic phase coexists with the AgOx oxidic phases. Silver is introduced ontothe zirconia, generating Ag–ZrO2 catalysts with high activity for the oxidation of propene andnaphthalene. These catalysts also show some activity for soot combustion. Silver species cancontribute with zirconia in the catalytic redox cycle, through a synergistic effect, providing sites thatfacilitate the migration and availability of oxygen, which is favored by the presence of structuraldefects. This is a novel application of the AgOx–Ag/ZrO2 system in the combustion reaction ofpropene and naphthalene. The results are highly promising, given that the T50 values found for bothmodel molecules are quite low.
Keywords: silver nanoparticles; zirconia; hydrocarbons; diesel soot; catalytic combustion
1. Introduction
Mobile emission sources generate a large amount of pollutants, which are emitted into theatmosphere and cause serious environmental problems, both historically and in human health. Amongthese pollutants are nitrogen oxides (NOx), carbon oxides (COx), volatile organic compounds (VOCs),sulfur oxides (SOx) and particulate matter, usually called soot or diesel soot [1].
Among the VOCs, different light hydrocarbons (C2–C10), known as NMHCs (non-methanehydrocarbons), are found in very low concentrations. The NMHCs that are the most difficult toeliminate are C3-C4, and polyaromatic compounds (PAHs), which present a level of high toxicity [2,3].On the other hand, diesel soot consists of solid particles of small size, whose main component iscarbon [4]. These particles are very small and can penetrate the lungs, which makes soot very harmfulto health.
Catalysts 2019, 9, 297; doi:10.3390/catal9030297 www.mdpi.com/journal/catalysts71
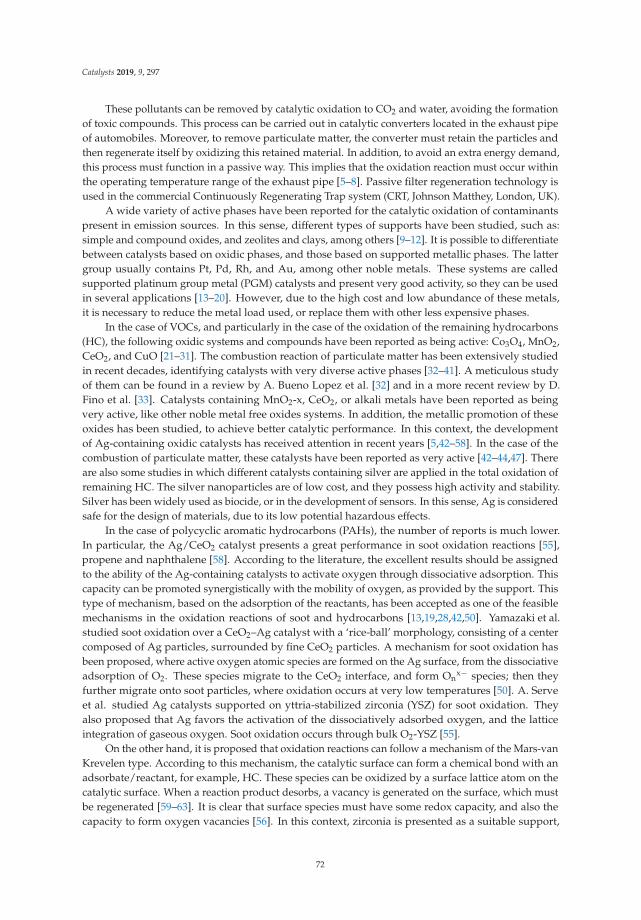
Catalysts 2019, 9, 297
These pollutants can be removed by catalytic oxidation to CO2 and water, avoiding the formationof toxic compounds. This process can be carried out in catalytic converters located in the exhaust pipeof automobiles. Moreover, to remove particulate matter, the converter must retain the particles andthen regenerate itself by oxidizing this retained material. In addition, to avoid an extra energy demand,this process must function in a passive way. This implies that the oxidation reaction must occur withinthe operating temperature range of the exhaust pipe [5–8]. Passive filter regeneration technology isused in the commercial Continuously Regenerating Trap system (CRT, Johnson Matthey, London, UK).
A wide variety of active phases have been reported for the catalytic oxidation of contaminantspresent in emission sources. In this sense, different types of supports have been studied, such as:simple and compound oxides, and zeolites and clays, among others [9–12]. It is possible to differentiatebetween catalysts based on oxidic phases, and those based on supported metallic phases. The lattergroup usually contains Pt, Pd, Rh, and Au, among other noble metals. These systems are calledsupported platinum group metal (PGM) catalysts and present very good activity, so they can be usedin several applications [13–20]. However, due to the high cost and low abundance of these metals,it is necessary to reduce the metal load used, or replace them with other less expensive phases.
In the case of VOCs, and particularly in the case of the oxidation of the remaining hydrocarbons(HC), the following oxidic systems and compounds have been reported as being active: Co3O4, MnO2,CeO2, and CuO [21–31]. The combustion reaction of particulate matter has been extensively studiedin recent decades, identifying catalysts with very diverse active phases [32–41]. A meticulous studyof them can be found in a review by A. Bueno Lopez et al. [32] and in a more recent review by D.Fino et al. [33]. Catalysts containing MnO2-x, CeO2, or alkali metals have been reported as beingvery active, like other noble metal free oxides systems. In addition, the metallic promotion of theseoxides has been studied, to achieve better catalytic performance. In this context, the developmentof Ag-containing oxidic catalysts has received attention in recent years [5,42–58]. In the case of thecombustion of particulate matter, these catalysts have been reported as very active [42–44,47]. Thereare also some studies in which different catalysts containing silver are applied in the total oxidation ofremaining HC. The silver nanoparticles are of low cost, and they possess high activity and stability.Silver has been widely used as biocide, or in the development of sensors. In this sense, Ag is consideredsafe for the design of materials, due to its low potential hazardous effects.
In the case of polycyclic aromatic hydrocarbons (PAHs), the number of reports is much lower.In particular, the Ag/CeO2 catalyst presents a great performance in soot oxidation reactions [55],propene and naphthalene [58]. According to the literature, the excellent results should be assignedto the ability of the Ag-containing catalysts to activate oxygen through dissociative adsorption. Thiscapacity can be promoted synergistically with the mobility of oxygen, as provided by the support. Thistype of mechanism, based on the adsorption of the reactants, has been accepted as one of the feasiblemechanisms in the oxidation reactions of soot and hydrocarbons [13,19,28,42,50]. Yamazaki et al.studied soot oxidation over a CeO2–Ag catalyst with a ‘rice-ball’ morphology, consisting of a centercomposed of Ag particles, surrounded by fine CeO2 particles. A mechanism for soot oxidation hasbeen proposed, where active oxygen atomic species are formed on the Ag surface, from the dissociativeadsorption of O2. These species migrate to the CeO2 interface, and form On
x− species; then theyfurther migrate onto soot particles, where oxidation occurs at very low temperatures [50]. A. Serveet al. studied Ag catalysts supported on yttria-stabilized zirconia (YSZ) for soot oxidation. Theyalso proposed that Ag favors the activation of the dissociatively adsorbed oxygen, and the latticeintegration of gaseous oxygen. Soot oxidation occurs through bulk O2-YSZ [55].
On the other hand, it is proposed that oxidation reactions can follow a mechanism of the Mars-vanKrevelen type. According to this mechanism, the catalytic surface can form a chemical bond with anadsorbate/reactant, for example, HC. These species can be oxidized by a surface lattice atom on thecatalytic surface. When a reaction product desorbs, a vacancy is generated on the surface, which mustbe regenerated [59–63]. It is clear that surface species must have some redox capacity, and also thecapacity to form oxygen vacancies [56]. In this context, zirconia is presented as a suitable support,
72
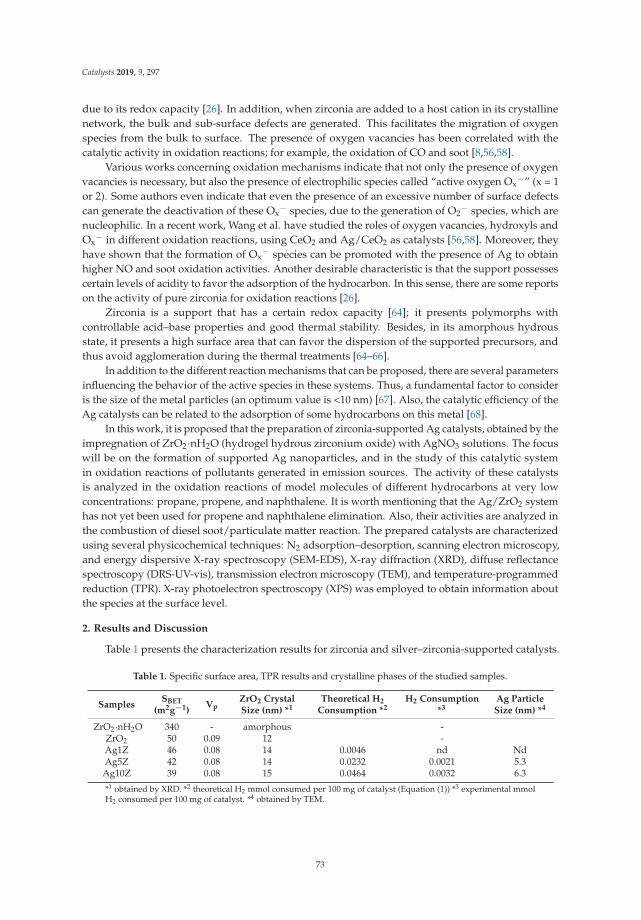
Catalysts 2019, 9, 297
due to its redox capacity [26]. In addition, when zirconia are added to a host cation in its crystallinenetwork, the bulk and sub-surface defects are generated. This facilitates the migration of oxygenspecies from the bulk to surface. The presence of oxygen vacancies has been correlated with thecatalytic activity in oxidation reactions; for example, the oxidation of CO and soot [8,56,58].
Various works concerning oxidation mechanisms indicate that not only the presence of oxygenvacancies is necessary, but also the presence of electrophilic species called “active oxygen Ox
−” (x = 1or 2). Some authors even indicate that even the presence of an excessive number of surface defectscan generate the deactivation of these Ox
− species, due to the generation of O2− species, which are
nucleophilic. In a recent work, Wang et al. have studied the roles of oxygen vacancies, hydroxyls andOx
− in different oxidation reactions, using CeO2 and Ag/CeO2 as catalysts [56,58]. Moreover, theyhave shown that the formation of Ox
− species can be promoted with the presence of Ag to obtainhigher NO and soot oxidation activities. Another desirable characteristic is that the support possessescertain levels of acidity to favor the adsorption of the hydrocarbon. In this sense, there are some reportson the activity of pure zirconia for oxidation reactions [26].
Zirconia is a support that has a certain redox capacity [64]; it presents polymorphs withcontrollable acid–base properties and good thermal stability. Besides, in its amorphous hydrousstate, it presents a high surface area that can favor the dispersion of the supported precursors, andthus avoid agglomeration during the thermal treatments [64–66].
In addition to the different reaction mechanisms that can be proposed, there are several parametersinfluencing the behavior of the active species in these systems. Thus, a fundamental factor to consideris the size of the metal particles (an optimum value is <10 nm) [67]. Also, the catalytic efficiency of theAg catalysts can be related to the adsorption of some hydrocarbons on this metal [68].
In this work, it is proposed that the preparation of zirconia-supported Ag catalysts, obtained by theimpregnation of ZrO2·nH2O (hydrogel hydrous zirconium oxide) with AgNO3 solutions. The focuswill be on the formation of supported Ag nanoparticles, and in the study of this catalytic systemin oxidation reactions of pollutants generated in emission sources. The activity of these catalystsis analyzed in the oxidation reactions of model molecules of different hydrocarbons at very lowconcentrations: propane, propene, and naphthalene. It is worth mentioning that the Ag/ZrO2 systemhas not yet been used for propene and naphthalene elimination. Also, their activities are analyzed inthe combustion of diesel soot/particulate matter reaction. The prepared catalysts are characterizedusing several physicochemical techniques: N2 adsorption–desorption, scanning electron microscopy,and energy dispersive X-ray spectroscopy (SEM-EDS), X-ray diffraction (XRD), diffuse reflectancespectroscopy (DRS-UV-vis), transmission electron microscopy (TEM), and temperature-programmedreduction (TPR). X-ray photoelectron spectroscopy (XPS) was employed to obtain information aboutthe species at the surface level.
2. Results and Discussion
Table 1 presents the characterization results for zirconia and silver–zirconia-supported catalysts.
Table 1. Specific surface area, TPR results and crystalline phases of the studied samples.
SamplesSBET
(m2g−1)Vp
ZrO2 CrystalSize (nm) *1
Theoretical H2
Consumption *2H2 Consumption
*3Ag ParticleSize (nm) *4
ZrO2·nH2O 340 - amorphous -ZrO2 50 0.09 12 -Ag1Z 46 0.08 14 0.0046 nd NdAg5Z 42 0.08 14 0.0232 0.0021 5.3
Ag10Z 39 0.08 15 0.0464 0.0032 6.3
*1 obtained by XRD. *2 theoretical H2 mmol consumed per 100 mg of catalyst (Equation (1)) *3 experimental mmolH2 consumed per 100 mg of catalyst. *4 obtained by TEM.
73
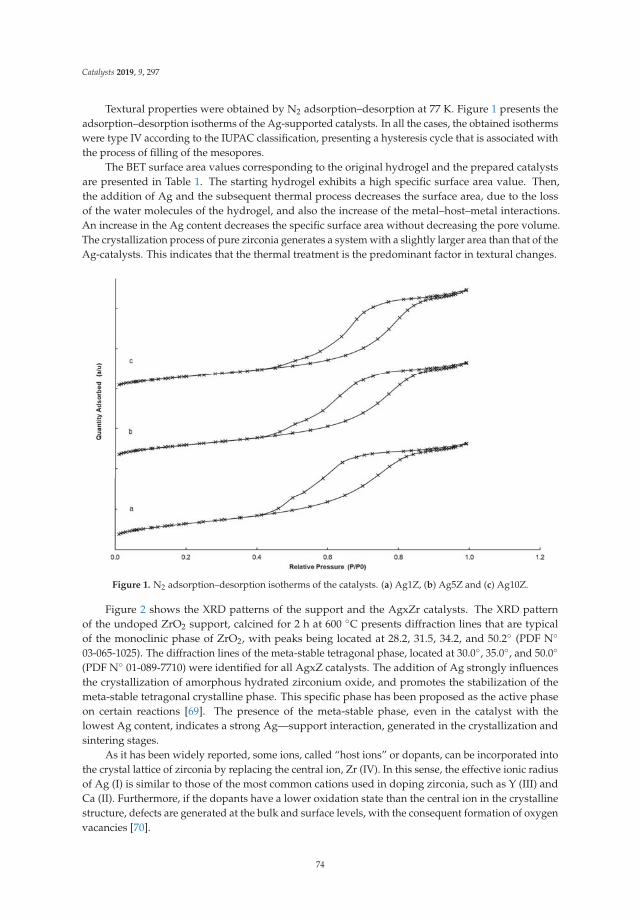
Catalysts 2019, 9, 297
Textural properties were obtained by N2 adsorption–desorption at 77 K. Figure 1 presents theadsorption–desorption isotherms of the Ag-supported catalysts. In all the cases, the obtained isothermswere type IV according to the IUPAC classification, presenting a hysteresis cycle that is associated withthe process of filling of the mesopores.
The BET surface area values corresponding to the original hydrogel and the prepared catalystsare presented in Table 1. The starting hydrogel exhibits a high specific surface area value. Then,the addition of Ag and the subsequent thermal process decreases the surface area, due to the lossof the water molecules of the hydrogel, and also the increase of the metal–host–metal interactions.An increase in the Ag content decreases the specific surface area without decreasing the pore volume.The crystallization process of pure zirconia generates a system with a slightly larger area than that of theAg-catalysts. This indicates that the thermal treatment is the predominant factor in textural changes.
Figure 1. N2 adsorption–desorption isotherms of the catalysts. (a) Ag1Z, (b) Ag5Z and (c) Ag10Z.
Figure 2 shows the XRD patterns of the support and the AgxZr catalysts. The XRD patternof the undoped ZrO2 support, calcined for 2 h at 600 ◦C presents diffraction lines that are typicalof the monoclinic phase of ZrO2, with peaks being located at 28.2, 31.5, 34.2, and 50.2◦ (PDF N◦
03-065-1025). The diffraction lines of the meta-stable tetragonal phase, located at 30.0◦, 35.0◦, and 50.0◦
(PDF N◦ 01-089-7710) were identified for all AgxZ catalysts. The addition of Ag strongly influencesthe crystallization of amorphous hydrated zirconium oxide, and promotes the stabilization of themeta-stable tetragonal crystalline phase. This specific phase has been proposed as the active phaseon certain reactions [69]. The presence of the meta-stable phase, even in the catalyst with thelowest Ag content, indicates a strong Ag—support interaction, generated in the crystallization andsintering stages.
As it has been widely reported, some ions, called “host ions” or dopants, can be incorporated intothe crystal lattice of zirconia by replacing the central ion, Zr (IV). In this sense, the effective ionic radiusof Ag (I) is similar to those of the most common cations used in doping zirconia, such as Y (III) andCa (II). Furthermore, if the dopants have a lower oxidation state than the central ion in the crystallinestructure, defects are generated at the bulk and surface levels, with the consequent formation of oxygenvacancies [70].
74
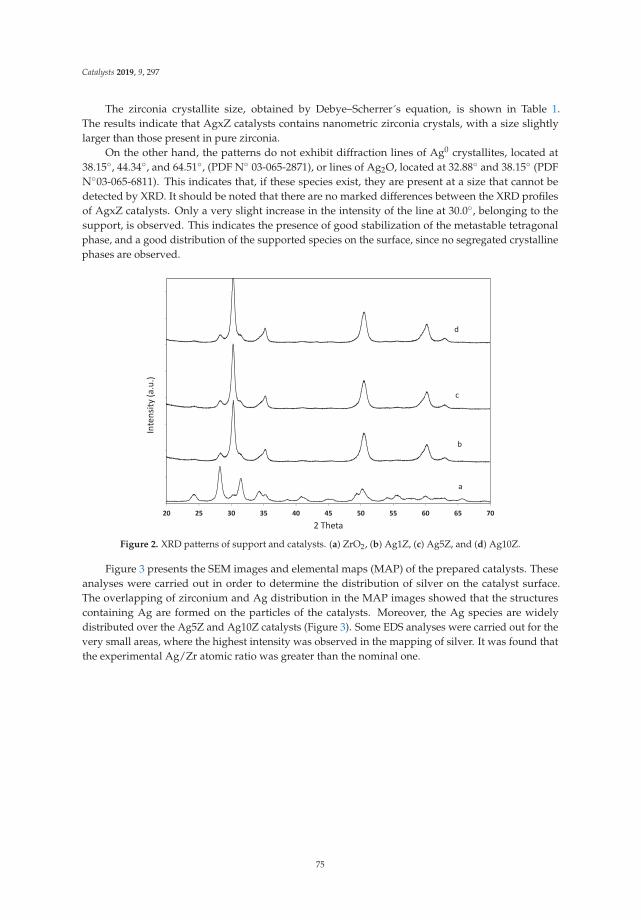
Catalysts 2019, 9, 297
The zirconia crystallite size, obtained by Debye–Scherrer´s equation, is shown in Table 1.The results indicate that AgxZ catalysts contains nanometric zirconia crystals, with a size slightlylarger than those present in pure zirconia.
On the other hand, the patterns do not exhibit diffraction lines of Ag0 crystallites, located at38.15◦, 44.34◦, and 64.51◦, (PDF N◦ 03-065-2871), or lines of Ag2O, located at 32.88◦ and 38.15◦ (PDFN◦03-065-6811). This indicates that, if these species exist, they are present at a size that cannot bedetected by XRD. It should be noted that there are no marked differences between the XRD profilesof AgxZ catalysts. Only a very slight increase in the intensity of the line at 30.0◦, belonging to thesupport, is observed. This indicates the presence of good stabilization of the metastable tetragonalphase, and a good distribution of the supported species on the surface, since no segregated crystallinephases are observed.
Figure 2. XRD patterns of support and catalysts. (a) ZrO2, (b) Ag1Z, (c) Ag5Z, and (d) Ag10Z.
Figure 3 presents the SEM images and elemental maps (MAP) of the prepared catalysts. Theseanalyses were carried out in order to determine the distribution of silver on the catalyst surface.The overlapping of zirconium and Ag distribution in the MAP images showed that the structurescontaining Ag are formed on the particles of the catalysts. Moreover, the Ag species are widelydistributed over the Ag5Z and Ag10Z catalysts (Figure 3). Some EDS analyses were carried out for thevery small areas, where the highest intensity was observed in the mapping of silver. It was found thatthe experimental Ag/Zr atomic ratio was greater than the nominal one.
75
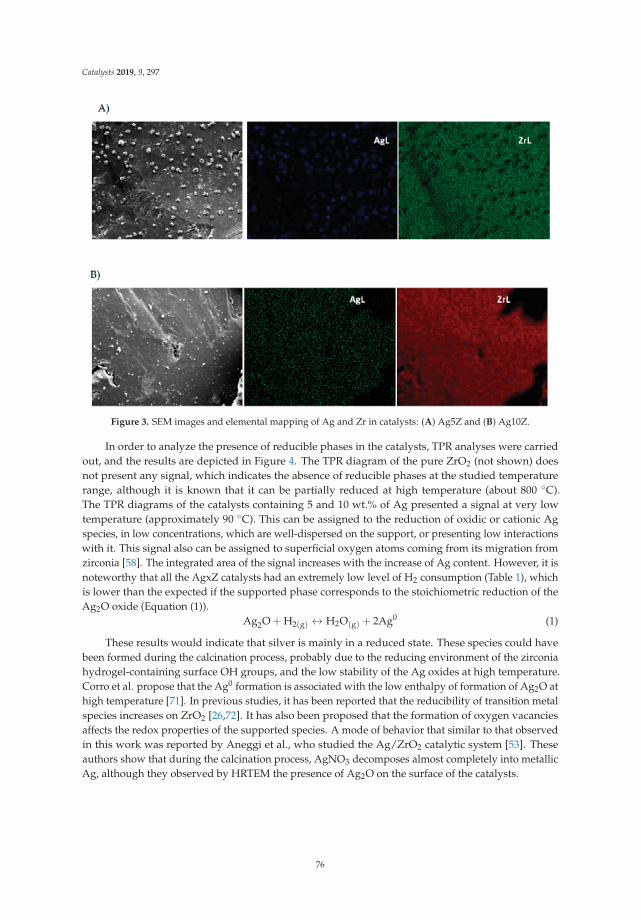
Catalysts 2019, 9, 297
Figure 3. SEM images and elemental mapping of Ag and Zr in catalysts: (A) Ag5Z and (B) Ag10Z.
In order to analyze the presence of reducible phases in the catalysts, TPR analyses were carriedout, and the results are depicted in Figure 4. The TPR diagram of the pure ZrO2 (not shown) doesnot present any signal, which indicates the absence of reducible phases at the studied temperaturerange, although it is known that it can be partially reduced at high temperature (about 800 ◦C).The TPR diagrams of the catalysts containing 5 and 10 wt.% of Ag presented a signal at very lowtemperature (approximately 90 ◦C). This can be assigned to the reduction of oxidic or cationic Agspecies, in low concentrations, which are well-dispersed on the support, or presenting low interactionswith it. This signal also can be assigned to superficial oxygen atoms coming from its migration fromzirconia [58]. The integrated area of the signal increases with the increase of Ag content. However, it isnoteworthy that all the AgxZ catalysts had an extremely low level of H2 consumption (Table 1), whichis lower than the expected if the supported phase corresponds to the stoichiometric reduction of theAg2O oxide (Equation (1)).
Ag2O + H2(g) ↔ H2O(g) + 2Ag0 (1)
These results would indicate that silver is mainly in a reduced state. These species could havebeen formed during the calcination process, probably due to the reducing environment of the zirconiahydrogel-containing surface OH groups, and the low stability of the Ag oxides at high temperature.Corro et al. propose that the Ag0 formation is associated with the low enthalpy of formation of Ag2O athigh temperature [71]. In previous studies, it has been reported that the reducibility of transition metalspecies increases on ZrO2 [26,72]. It has also been proposed that the formation of oxygen vacanciesaffects the redox properties of the supported species. A mode of behavior that similar to that observedin this work was reported by Aneggi et al., who studied the Ag/ZrO2 catalytic system [53]. Theseauthors show that during the calcination process, AgNO3 decomposes almost completely into metallicAg, although they observed by HRTEM the presence of Ag2O on the surface of the catalysts.
76

Catalysts 2019, 9, 297
Figure 4. H2-TPR profiles of (a) Ag1Z, (b) Ag5Z, and (c) Ag10Z.
In order to obtain more information about the nature of the supported Ag phases, DRS UV-Visstudies were performed. The spectra obtained for AgxZ catalysts are shown in Figure 5. An energyabsorption band located between 330 nm and 390 nm can be clearly observed. In this region of thespectrum, the absorption is assigned to Ag clusters Agn
δ+ (n = 2–7) or particles of metallic silver ofsmall size (3–5 nm). As the size of the particles grows, this band can suffer a bathochromic shift,towards longer wavelengths. This is probably the reason for the slight shift of this band in the Ag10Zcatalyst spectrum. The bands located at 220 and 265nm are associated with the presence of theAg+1 species, and the charge transfer band of the Agn
δ+ clusters respectively [67]. Although there isabsorbance in the region of the plasmon resonance, 400–450 nm, these bands are not well-resolved ordefined, due to the presence of energy absorption of the support, ZrO2.
Figure 5. DRS UV-Vis signals for the prepared catalysts. (a) Ag1Z, (b) Ag5Z and (c) Ag10Z.
The characterization techniques performed, which provide information at a mass level, suggestingthat a part of Ag is present in a metallic state, Ag0. In order to corroborate the presence of this type ofspecies, transmission electron microscopy (TEM) analysis were carried out (Figure 6). It is noticeablethat the micrographs corresponding to Ag5Z and Ag10Z catalysts show zirconia structures with highlydispersed silver nanoparticles. In the micrographs of the Ag1Z catalyst, although some Ag particles
77
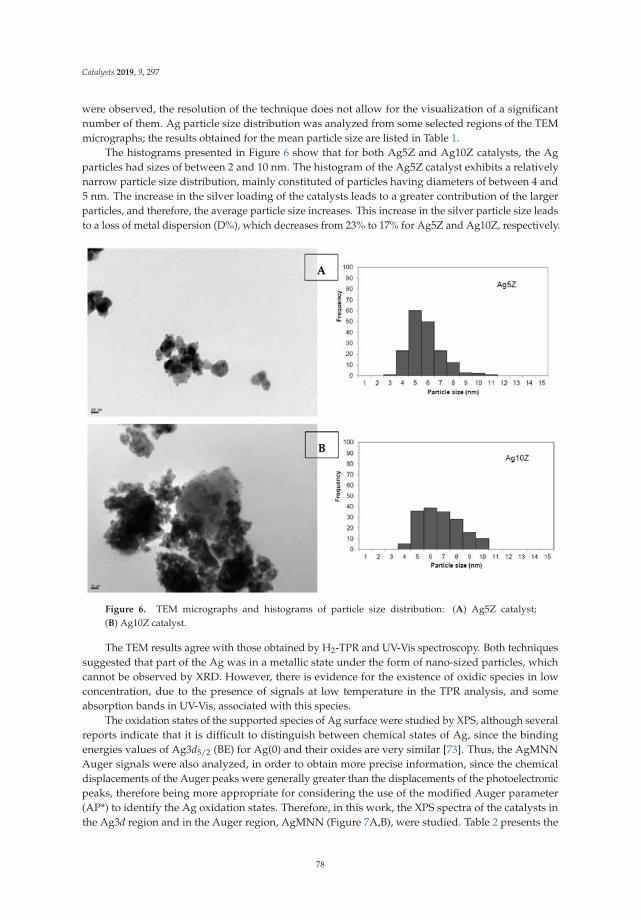
Catalysts 2019, 9, 297
were observed, the resolution of the technique does not allow for the visualization of a significantnumber of them. Ag particle size distribution was analyzed from some selected regions of the TEMmicrographs; the results obtained for the mean particle size are listed in Table 1.
The histograms presented in Figure 6 show that for both Ag5Z and Ag10Z catalysts, the Agparticles had sizes of between 2 and 10 nm. The histogram of the Ag5Z catalyst exhibits a relativelynarrow particle size distribution, mainly constituted of particles having diameters of between 4 and5 nm. The increase in the silver loading of the catalysts leads to a greater contribution of the largerparticles, and therefore, the average particle size increases. This increase in the silver particle size leadsto a loss of metal dispersion (D%), which decreases from 23% to 17% for Ag5Z and Ag10Z, respectively.
Figure 6. TEM micrographs and histograms of particle size distribution: (A) Ag5Z catalyst;(B) Ag10Z catalyst.
The TEM results agree with those obtained by H2-TPR and UV-Vis spectroscopy. Both techniquessuggested that part of the Ag was in a metallic state under the form of nano-sized particles, whichcannot be observed by XRD. However, there is evidence for the existence of oxidic species in lowconcentration, due to the presence of signals at low temperature in the TPR analysis, and someabsorption bands in UV-Vis, associated with this species.
The oxidation states of the supported species of Ag surface were studied by XPS, although severalreports indicate that it is difficult to distinguish between chemical states of Ag, since the bindingenergies values of Ag3d5/2 (BE) for Ag(0) and their oxides are very similar [73]. Thus, the AgMNNAuger signals were also analyzed, in order to obtain more precise information, since the chemicaldisplacements of the Auger peaks were generally greater than the displacements of the photoelectronicpeaks, therefore being more appropriate for considering the use of the modified Auger parameter(AP*) to identify the Ag oxidation states. Therefore, in this work, the XPS spectra of the catalysts inthe Ag3d region and in the Auger region, AgMNN (Figure 7A,B), were studied. Table 2 presents the
78
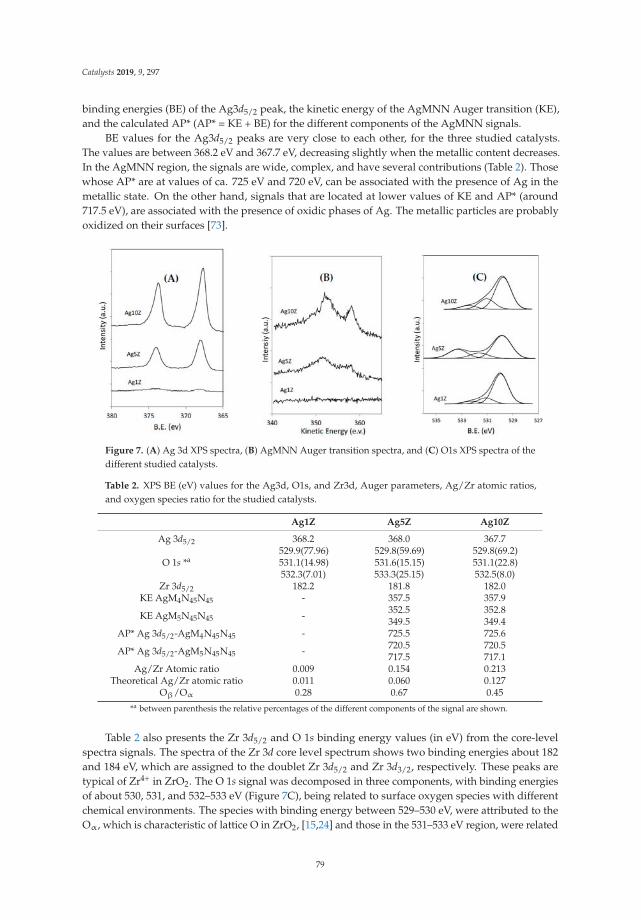
Catalysts 2019, 9, 297
binding energies (BE) of the Ag3d5/2 peak, the kinetic energy of the AgMNN Auger transition (KE),and the calculated AP* (AP* = KE + BE) for the different components of the AgMNN signals.
BE values for the Ag3d5/2 peaks are very close to each other, for the three studied catalysts.The values are between 368.2 eV and 367.7 eV, decreasing slightly when the metallic content decreases.In the AgMNN region, the signals are wide, complex, and have several contributions (Table 2). Thosewhose AP* are at values of ca. 725 eV and 720 eV, can be associated with the presence of Ag in themetallic state. On the other hand, signals that are located at lower values of KE and AP* (around717.5 eV), are associated with the presence of oxidic phases of Ag. The metallic particles are probablyoxidized on their surfaces [73].
Figure 7. (A) Ag 3d XPS spectra, (B) AgMNN Auger transition spectra, and (C) O1s XPS spectra of thedifferent studied catalysts.
Table 2. XPS BE (eV) values for the Ag3d, O1s, and Zr3d, Auger parameters, Ag/Zr atomic ratios,and oxygen species ratio for the studied catalysts.
Ag1Z Ag5Z Ag10Z
Ag 3d5/2 368.2 368.0 367.7
O 1s *a529.9(77.96)531.1(14.98)532.3(7.01)
529.8(59.69)531.6(15.15)533.3(25.15)
529.8(69.2)531.1(22.8)532.5(8.0)
Zr 3d5/2 182.2 181.8 182.0KE AgM4N45N45 - 357.5 357.9
KE AgM5N45N45 - 352.5349.5
352.8349.4
AP* Ag 3d5/2-AgM4N45N45 - 725.5 725.6
AP* Ag 3d5/2-AgM5N45N45 - 720.5717.5
720.5717.1
Ag/Zr Atomic ratio 0.009 0.154 0.213Theoretical Ag/Zr atomic ratio 0.011 0.060 0.127
Oβ/Oα 0.28 0.67 0.45
*a between parenthesis the relative percentages of the different components of the signal are shown.
Table 2 also presents the Zr 3d5/2 and O 1s binding energy values (in eV) from the core-levelspectra signals. The spectra of the Zr 3d core level spectrum shows two binding energies about 182and 184 eV, which are assigned to the doublet Zr 3d5/2 and Zr 3d3/2, respectively. These peaks aretypical of Zr4+ in ZrO2. The O 1s signal was decomposed in three components, with binding energiesof about 530, 531, and 532–533 eV (Figure 7C), being related to surface oxygen species with differentchemical environments. The species with binding energy between 529–530 eV, were attributed to theOα, which is characteristic of lattice O in ZrO2, [15,24] and those in the 531–533 eV region, were related
79
Catalysts 2019, 9, 297
to Oβ, which are associated with surface oxygen vacancies, oxygen-adsorbed species, surface hydroxyl,adsorbed water molecules, or carbonate species [74]. In our case, however, the presence of carbonateswas not evident in the spectra of the C1s region (not shown). The Ag5Z and Ag10Z catalysts presenteda higher proportion of Oβ species (Table 2), which are proposed as possible active sites.
The Ag/Zr surface atomic ratios have been calculated from XPS analysis, and then comparedwith the theoretical composition of the bulk (Table 2). As expected, the surface presents an enrichmentof Ag, due to the predominant location of Ag on the external surface of the support, both for the Ag5Zand Ag10Z catalysts.
The AgxZ catalysts, and also the pure zirconia were used in the catalytic oxidation of three modelmolecules of hydrocarbons (HC): propane, as a saturated linear hydrocarbon molecule; propene, as anunsaturated linear hydrocarbon molecule; and naphthalene, as a polyaromatic hydrocarbon molecule.In addition, the prepared catalysts were tested in the catalytic oxidation of particulate matter (dieselsoot). Table 3 summarizes the catalytic results obtained in all of the studied reactions. The combustionreactions of hydrocarbons were carried out in fixed-bed micro-reactors. The obtained T50 valuesin each experiment were presented, with T50 being the temperature where 50% HC conversion isreached. The results corresponding to Tmax for the soot combustion reactions, carried out in athermogravimetric reactor, are also presented in Table 3. Tmax is defined as being the temperature atwhich the derivative of the TGA curve shows a minimum. This derivative curve represents the loss ofmass by combustion, which is associated with the maximum burning rate.
As can be seen, all of the studied catalysts presented a level of activity for the total oxidation of allof the selected model molecules. In addition, in all the reactions the support contributed to the activity,with its redox characteristics. The influence of Ag and its metallic load depended on the nature of themolecule to be oxidized.
Table 3. Catalytic activity of ZrO2 and the three prepared AgxZ catalysts, for the different oxidationreactions studied.
CatalystT50 Propane
(C3H8) aΔT50
(C3H8)T50 Propene
(C3H6) aΔT50(C3H6)
T50 Naphthalene(C10H8) b
ΔT50(C10H8)
TmaxSoot c ΔTmax
Uncatalyzedreaction 600 - 630 - 430 - 650 -
ZrO2 490 110 520 110 280 150 612 38Ag1Z 485 115 470 160 260 170 547 97Ag5Z 480 120 280 350 172 258 525 125Ag10Z 450 150 210 420 210 220 425 225a 1000 ppm HC, 8% O2, mcat = 100 mg, Q = 50 mL·min−1; b 150 ppm HC, 8% O2, mcat = 100 mg, Q = 30 mL·min−1;c mcat = 30, msoot = 3, loose contact, ΔT = 10 ◦C min−1, 10% O2, Q = 100 mL·min−1.
In the case of propane combustion, the catalysts exhibited low activity, and the contributionof Ag was not significant (Table 3). Using pure zirconia, T50 was 490 ◦C and the addition of Agat different concentrations slightly increased the activity. Within the AgxZ series, the most activeseries the propane combustion resulted was the Ag10Z catalyst. When this catalyst is employed,it is possible to reduce T50 by 150 ◦C, with respect to the uncatalyzed reaction (600 ◦C). A seriesof materials with greater activity than those studied here for propane combustion, are presented inthe bibliography [25,27,30,31,75]. Different reports present catalytic systems where the T50 valuesare lower than 300 ◦C, even when using high-space velocities. For example, in a recent paper byX. Li et al. [30], the activities of the CoCeOx catalysts was reported and compared with other similarsystems, which presented very low values of T50. The poor performance of the AgxZ catalysts can beattributed to the low capacity of the Ag species to promote the activation of propane.
In contrast, the AgxZ catalysts had very good level of activity for the oxidation of propene.The results for propene oxidation reaction, expressed as propene conversion to CO2% vs temperature,are plotted for all the studied catalysts in Figure 8A. No other by-products or CO were observed asreaction products; CO2 selectivity was higher than 99%. In the absence of a catalyst, T50 was 630 ◦C,
80
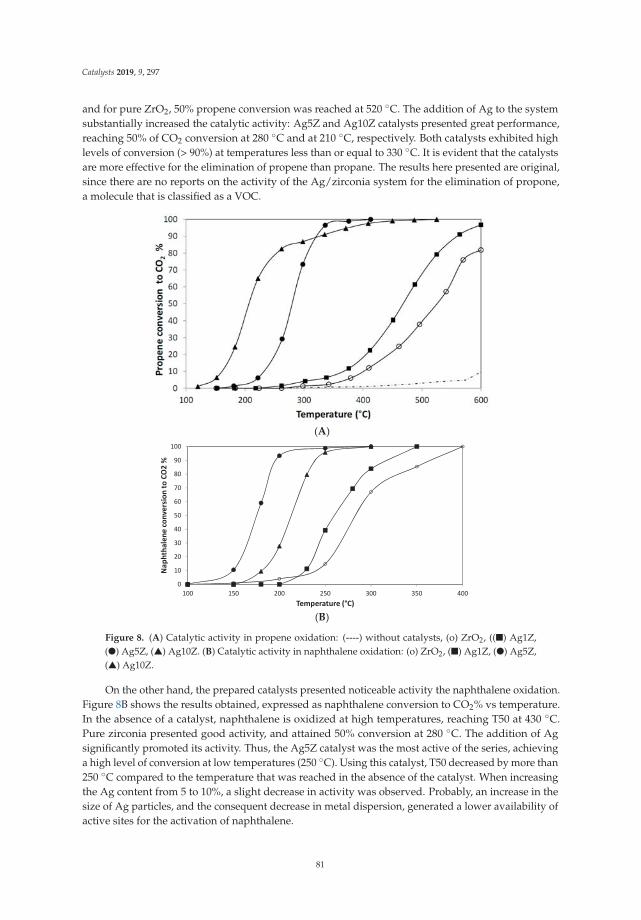
Catalysts 2019, 9, 297
and for pure ZrO2, 50% propene conversion was reached at 520 ◦C. The addition of Ag to the systemsubstantially increased the catalytic activity: Ag5Z and Ag10Z catalysts presented great performance,reaching 50% of CO2 conversion at 280 ◦C and at 210 ◦C, respectively. Both catalysts exhibited highlevels of conversion (> 90%) at temperatures less than or equal to 330 ◦C. It is evident that the catalystsare more effective for the elimination of propene than propane. The results here presented are original,since there are no reports on the activity of the Ag/zirconia system for the elimination of propone,a molecule that is classified as a VOC.
(A)
(B)
Figure 8. (A) Catalytic activity in propene oxidation: (----) without catalysts, (o) ZrO2, ((�) Ag1Z,(�) Ag5Z, (�) Ag10Z. (B) Catalytic activity in naphthalene oxidation: (o) ZrO2, (�) Ag1Z, (�) Ag5Z,(�) Ag10Z.
On the other hand, the prepared catalysts presented noticeable activity the naphthalene oxidation.Figure 8B shows the results obtained, expressed as naphthalene conversion to CO2% vs temperature.In the absence of a catalyst, naphthalene is oxidized at high temperatures, reaching T50 at 430 ◦C.Pure zirconia presented good activity, and attained 50% conversion at 280 ◦C. The addition of Agsignificantly promoted its activity. Thus, the Ag5Z catalyst was the most active of the series, achievinga high level of conversion at low temperatures (250 ◦C). Using this catalyst, T50 decreased by more than250 ◦C compared to the temperature that was reached in the absence of the catalyst. When increasingthe Ag content from 5 to 10%, a slight decrease in activity was observed. Probably, an increase in thesize of Ag particles, and the consequent decrease in metal dispersion, generated a lower availability ofactive sites for the activation of naphthalene.
81
Catalysts 2019, 9, 297
These results are an unprecedented contribution, taking into account that the silver–zirconiasystem has not been studied before, for the total oxidation of naphthalene. Besides, these resultsare promising, given that the T50 reached with the Ag5Z catalyst is 172 ◦C. This value is very low,and also comparable to previously obtained results using transition metal oxide catalysts supportedon zirconia [26] and with results recently reported by M. Liu et al. [58] with the Ag/CeO2 catalysts.Even more, as the Ag5Z catalyst was the most active, it was reused three times in the reaction cycles,keeping its activity.
Next, the activity results for diesel soot oxidation are presented. Table 3 shows the maximumoxidation rate temperature (Tmax) obtained for diesel soot combustion in the presence of air, usingloose contact conditions, and carried out in a thermogravimetric reactor. Table 3 includes the differencesbetween Tmax in a reaction with and without a catalyst (ΔTmax). The obtained values for ΔTmaxindicate that both the support and the catalysts presented levels of activity. While pure zirconia exhibitspoor activity, the activity of the AgxZ catalysts depends on the Ag content (Table 3, SupplementaryMaterial). It was found that with the increase in Ag content, the Tmax decreased. In this reaction,Ag10Z catalyst was the most active of the series, reaching a ΔTmax of 225 ◦C. These results indicatethat the presence of the Ag species generates a promoting effect.
As stated previously, although the catalysts presented activity, they depended on the Ag contentand the nature of the molecule to be oxidized. The systems did not have high efficiency for propaneoxidation, as it was being evident that it is not possible to activate this saturated molecule. On theother hand, they showed activity for the diesel soot oxidation, reaching combustion temperaturesthat were comparable with other reported catalysts containing silver, and other oxidic systems, whenmeasurements were made in “loose contact” mode [53,76]. However, there are numerous systems inthe literature that show evidence of higher activity; therefore, the presented formulations could beoptimized to achieve better results. Even so the obtained value of Tmax with the Ag10Z catalyst can beconsidered to be acceptable, since it is in the range of temperatures at which the exhaust pipe operates.
In the oxidation of molecules containing π–π bonds, such as propene and naphthalene, the catalystsexhibited very good performance. It was achieved a significant reduction at T50, especially whenusing the Ag5Z and Ag10Z catalysts. As previously mentioned, these results are original, since thesilver–zirconia system has not been applied to for the elimination of these unsaturated molecules.Moreover, a crystal-size effect of silver nanoparticles has been found in the catalytic performance ofthe system in the naphthalene combustion, which was not observed for the combustion of propene.As expected, zirconia provided some activity in all the reactions studied, and the addition of high Agcontent (5 and 10 wt.%) generated an Ag–zirconia system with a greater availability of superficial oxygenspecies. This fact may be responsible for the acceleration of the reaction and the regeneration of the activesites, through successive redox cycles. M. Skaf et al. have demonstrated the ability for Ag species (Ag0
and Ag+) supported on ceria to adsorb oxygen molecules through redox cycles [77]. The Ag–zirconiasynergic effect has been observed from the characterization techniques, and the formation of a metastabletetragonal phase is observed by XRD, leading to the generation of oxygen vacancies.
The coexistence of both types of species, AgOx and Ag0, may favor the redox capacity of thesurface, with the oxidic Ag species being responsible for oxidizing the adsorbed substrate onto thecatalytic surface, and hence adopting a lower oxidation state. This situation allows for an explanationof the reaction mechanism, employing Mars-van Krevelen formalism. Oxidic sites must be regenerated,and this step is favored through the capacity of the system, which contains oxygen vacancies and a highavailability of adsorbed Ox
− species, as evidenced by XPS. According to this technique, the catalystswith the highest metallic loading, Ag5Z and Ag10Z, which are the most active, contain a greaterproportion of oxidic species of high availability (Oβ).
According to the results of TEM, DRS UV-vis, and XPS techniques, Ag is preferably found on thesurface. Ag0 nanoparticles co-exist with oxidic Ag species (Agδ+ and Ag+). According to TPR results,the presence of these oxidic phases is conditioned by the presence of reducible phases in a very lowproportion. Supported Ag nanoparticles found are small (<10 nm), and well-dispersed over zirconia.
82
Catalysts 2019, 9, 297
As previously mentioned, in the literature, various mechanisms that are related to this kindof systems have been proposed for oxidation reactions. Therefore, it is not possible to rule out thedissociative adsorption of molecular oxygen on Ag nanoparticles, or that a combination of bothmechanisms occurs. When the activated oxygen (On
x−) is consumed during the oxidation of thesubstrate, it is restored by a new round of adsorption of the O2 present in the gas phase, or bythe migration of oxygen species through structural defects. These defects are present in the Agnanoparticles and in the support, which also can chemisorb oxygen and provide mobility. Oxygenvacancies exist not only at the surface level, but also at the bulk level.
The behavior observed in naphthalene oxidation, where the most active catalyst is Ag5Z, and alater increase in the Ag content, generates a less active catalyst. Probably, this can be associated withan increase in the size of the Ag particles, with a resultant decrease of dispersion, and a lower capacitytowards the adsorption of naphthalene. This point must be studied more deeply in the future, in orderto correlate the catalytic results with experimental evidence. In addition, a possible geometric effectby the Ag ensembles, which cause a decrease in the capacity of naphthalene adsorption, has not yetbeen ruled out [68]. Probably, given the geometry of the naphthalene molecule, with two conjugatedaromatic rings, its adsorption is sensitive to the structure of the catalyst surface. There is also evidencethat propene combustion does not follow the same behavior, in comparison to the size of the silvercrystallite, marking a difference between both molecules, which must be analyzed with greater depthin the future. All of the studied catalysts were active in the soot combustion reaction, with the Ag10Zcatalyst being the most active one. Again, the ability of these catalysts to generate a synergism betweenthe Ag species and zirconia for the activation and regeneration of oxygen is evidenced. This leads toan oxidation on the catalytic interphase, which in this case involves a gas phase and two solid phases.
3. Experimental Section
3.1. Material Preparation
Hydrous zirconium oxide, ZrO2·nH2O, was prepared by precipitation from a ZrOCl2·6H2O(Fluka, Buchs, Switzerland) solution with ammonium hydroxide (pH 10). The process was carriedout at room temperature with constant stirring for 6 h. The pH was maintained close to 10. Afterfiltration, the solid was washed (Cl− negative test in the solid) and dried at 100 ◦C for 6 h. Portionsof ZrO2·nH2O were impregnated with an aqueous solution of AgNO3, to obtain solids with a silverconcentration of 1, 5, and 10 wt.% (grams of Ag per 100 g of catalyst). After drying, the samples werethermally treated at 600 ◦C for 2 h. The materials so obtained were named Ag1Z, Ag5Z and Ag10Z,where Z = zirconia.
3.2. Catalyst Characterization
The textural characterization of the support and catalysts was determined by using the BETmethod, using a Micromeritics Accusorb 2100 E apparatus (Micromeritics, Norcross, GA, USA).Samples were degassed at 100 ◦C prior to analysis.
Scanning electron microscopy with energy-dispersive X-ray spectroscopy (SEM-EDS) analyseswere performed using a SEM Philips 505 equipment (Philips Co, Amsterdam, The Netherlands).The energy dispersive X-ray analysis of the samples was performed using an EDAX DX PRIME 10analyzer (EDAX, New Jersey, NJ, USA) at a working potential of 15 kV.
Temperature programmed reduction (TPR) analysis was performed with a home-made equipment.In a typical run, the sample (30.0 mg) was placed in an electrically heated fixed-bed quartz micro-reactor,and heated from 50 to 800 ◦C, with a heating rate of 10 ◦C min−1. In the experiments, a feed of 10%hydrogen in nitrogen (flow rate of 20 mL min−1) was used. Hydrogen consumption was detected by athermal conductivity detector.
Diffuse reflectance UV–visible spectra (DRS-UV–vis) of AgxZ catalysts were obtained with aPerkin Elmer Lambda 35 UV-VIS spectrometer (Perkin Elmer Inc., Waltham, MA, USA).
83
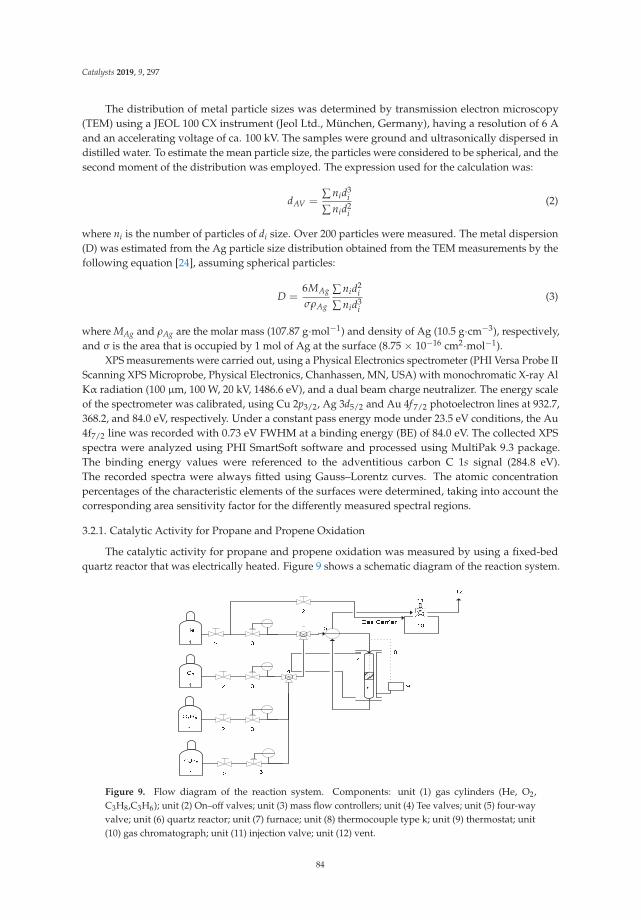
Catalysts 2019, 9, 297
The distribution of metal particle sizes was determined by transmission electron microscopy(TEM) using a JEOL 100 CX instrument (Jeol Ltd., München, Germany), having a resolution of 6 Aand an accelerating voltage of ca. 100 kV. The samples were ground and ultrasonically dispersed indistilled water. To estimate the mean particle size, the particles were considered to be spherical, and thesecond moment of the distribution was employed. The expression used for the calculation was:
dAV =∑ nid3
i
∑ nid2i
(2)
where ni is the number of particles of di size. Over 200 particles were measured. The metal dispersion(D) was estimated from the Ag particle size distribution obtained from the TEM measurements by thefollowing equation [24], assuming spherical particles:
D =6MAg
σρAg
∑ nid2i
∑ nid3i
(3)
where MAg and ρAg are the molar mass (107.87 g·mol−1) and density of Ag (10.5 g·cm−3), respectively,and σ is the area that is occupied by 1 mol of Ag at the surface (8.75 × 10⁻¹⁶ cm2·mol−1).
XPS measurements were carried out, using a Physical Electronics spectrometer (PHI Versa Probe IIScanning XPS Microprobe, Physical Electronics, Chanhassen, MN, USA) with monochromatic X-ray AlKα radiation (100 μm, 100 W, 20 kV, 1486.6 eV), and a dual beam charge neutralizer. The energy scaleof the spectrometer was calibrated, using Cu 2p3/2, Ag 3d5/2 and Au 4f 7/2 photoelectron lines at 932.7,368.2, and 84.0 eV, respectively. Under a constant pass energy mode under 23.5 eV conditions, the Au4f7/2 line was recorded with 0.73 eV FWHM at a binding energy (BE) of 84.0 eV. The collected XPSspectra were analyzed using PHI SmartSoft software and processed using MultiPak 9.3 package.The binding energy values were referenced to the adventitious carbon C 1s signal (284.8 eV).The recorded spectra were always fitted using Gauss–Lorentz curves. The atomic concentrationpercentages of the characteristic elements of the surfaces were determined, taking into account thecorresponding area sensitivity factor for the differently measured spectral regions.
3.2.1. Catalytic Activity for Propane and Propene Oxidation
The catalytic activity for propane and propene oxidation was measured by using a fixed-bedquartz reactor that was electrically heated. Figure 9 shows a schematic diagram of the reaction system.
Figure 9. Flow diagram of the reaction system. Components: unit (1) gas cylinders (He, O2,C3H8,C3H6); unit (2) On–off valves; unit (3) mass flow controllers; unit (4) Tee valves; unit (5) four-wayvalve; unit (6) quartz reactor; unit (7) furnace; unit (8) thermocouple type k; unit (9) thermostat; unit(10) gas chromatograph; unit (11) injection valve; unit (12) vent.
84
Catalysts 2019, 9, 297
The feed employed for the propane oxidation consisted of a mixture of 1000 ppm of C3H8, 8% ofO2 and He to close the balance. Propene combustion was carried out using a gas mixture, having acomposition of 1000 ppm of C3H6, 6% of O2 and He to close the balance. For each experiment, the massof the catalyst used was 100 mg, and the reaction temperature varied from 150 to 600 ◦C. A total flowrate of 50 mL·min−1 was used in both processes. The products were analyzed by a Shimadzu GC 2014(Shimadzu Corporation, Kyoto, Japan) chromatograph with a thermal conductivity detector.
3.2.2. Catalytic Activity for Naphthalene Oxidation
The catalysts were tested for the oxidation of naphthalene, using an electrically heated fixed-bedquartz reactor and 100 mg of catalyst. The reaction feed consisted of 10% O2 and 90% He, and 150 ppmnaphthalene. A total flow rate of 30 mL·min−1 was used. Catalytic activity was measured over atemperature range from 150 to 500 ◦C. Data were obtained at each temperature after a certain time,in order to obtain a stable concentration of naphthalene in the gas phase. The feed flow passes througha thermostated saturator containing naphthalene. The combustion was initiated as soon as a stablevapor pressure was reached. The products were analyzed using a Shimadzu GC 2014 chromatographwith a thermal conductivity detector.
3.2.3. Catalytic Activity for Diesel Soot Oxidation
Diesel soot oxidation tests were performed in a thermogravimetric reactor (TA-50 Shimadzu,Shimadzu Corporation, Kyoto, Japan) over a range of 200 to 650 ◦C, with a heating rate of 10 ◦C·min−1.The reaction mixture (8 vol.% O2) was obtained from two feed lines, air and He respectively,individually controlled to close the balance. Printex-U was used as the model diesel soot. Before thereaction, the Printex-U was mixed with the catalyst at a 1/10 ratio, with a spatula (loose contact).The mass loss and the reaction temperature were recorded as a function of time. From the massloss information as a function of time, the derivative curve (DTGA) was obtained, and from it,the temperature at which the combustion rate is maximum (Tmax).
4. Conclusions
This paper reported the preparation of a series of Ag-ZrO2 catalysts having three differentsilver concentrations (1, 5, and 10 wt.%). The prepared catalysts were examined by using variousanalytical techniques (SEM-EDS, XRD, DRS, TEM, TPR, and XPS). It was observed that part of thesilver was in a metallic state, in the form of nano-sized particles, and evidence was also found for theexistence of oxidic species at low concentration. The catalysts were tested for the catalytic combustionof propane, propene, naphthalene, and particulate matter. Their activities depended on the Agcontent and the nature of the molecule to be oxidized. Particularly, the Ag5Z and Ag10Z catalystsexhibited very good performance in the oxidation of molecules containing π–π bonds (propene andnaphthalene). Particularly, these catalysts are innovative and display promising results, given that theresulting silver/zirconia system is very active for the elimination of unsaturated molecules, and can beconsidered a non-toxic catalyst. All of the studied catalysts were also active in the soot combustionreaction, with the Ag10Z catalyst being the most active one. These results could likely be attributed toan Ag-ZrO2 synergic effect.
Supplementary Materials: The following are available online at http://www.mdpi.com/2073-4344/9/3/297/s1,Figure S1: TEM micrograph of Ag1Z catalyst, Figure S2: DTGA diagrams for the diesel soot catalytic results.
Author Contributions: M.L.C. and I.D.L. conceived and designed the experiments; M.S.L.A., M.B.N. and M.A.O.performed the experiments; I.d.C.L.B. and E.R.-C. contributed with the XPS spectroscopy measurements andanalyses; all authors discussed the results; I.D.L. and M.L.C. wrote the manuscript. All authors read, revised,and approved the final manuscript.
Funding: This research was funded by Consejo Nacional de Investigaciones Científicas y Técnicas: PIP 0276,Agencia Nacional de Promoción Científica y Tecnológica: PICT 0737, Universidad Nacional de La Plata: X700,and Universidad Nacional de La Plata: X707.
85
Catalysts 2019, 9, 297
Acknowledgments: The authors acknowledge the financial support of CONICET, ANPCyT, and UNLP, and PabloFetsis, Mariela Theiller, and María Laura Barbelli for characterization experiments.
Conflicts of Interest: The authors declare no conflict of interest.
References
1. Pfefferle, L.D.; Pfefferle, W.C. Catalysis in Combustion. Catal. Rev. Sci. Eng. 1987, 29, 219–267. [CrossRef]2. Choudhary, T.V.; Banerjee, S.; Choudhary, V.R. Catalysts for combustion of methane and lower alkanes.
Appl. Catal. A 2002, 234, 1–23. [CrossRef]3. García, T.; Solsona, B.; Taylor, S.H. Naphthalene total oxidation over metal oxide catalysts. Appl. Catal. B
2006, 66, 92–99. [CrossRef]4. Ruiz, M.L.; Lick, I.D.; Ponzi, M.; Rodríguez-Castellón, E.; Jiménez-López, A.; Ponzi, E.N. Combustion of
diesel soot in NO/O2 presence. Cesium nitrate and gold catalysts. Appl. Catal. A 2011, 392, 45–56. [CrossRef]5. Lee, J.; Theis, J.R.; Kyriakidou, E.A. Vehicle emissions trapping materials: Successes, challenges, and the
path forward. Appl. Catal. B 2019, 243, 397–414. [CrossRef]6. Sui, L.; Yu, L. Diesel soot oxidation catalyzed by Co-Ba-K catalysts: Evaluation of the performance of the
catalysts. Chem. Eng. J. 2008, 142, 327–330. [CrossRef]7. Lick, I.D.; Carrascull, A.L.; Ponzi, M.I.; Ponzi, E.N. Zirconia-supported Cu-KNO3 catalyst. Characterization
and catalytic behavior in the catalytic combustion of soot with a NO/O2 mixture. Ind. Eng. Chem. Res. 2008,47, 3834–3839. [CrossRef]
8. Aranda, A.; Agouram, S.; López, J.M.; Mastral, A.M.; Sellick, D.R.; Solsona, B.; Taylor, S.H.; García, T. Oxygendefects: The key parameter controlling the activity and selectivity of mesoporous copper-doped ceria for thetotal oxidation of naphthalene. Appl. Catal. B 2012, 127, 77–88. [CrossRef]
9. Kamal, M.S.; Razzak, S.A.; Hossain, M.M. Catalytic oxidation of volatile organic compounds (VOCs)—Areview. Atmos. Environ. 2016, 140, 117–134. [CrossRef]
10. Zhang, Z.; Jiang, Z.; Shangguan, W. Low-temperature catalysis for VOCs removal in technology andapplication: A state-of-the-art review. Catal. Today 2016, 264, 270–278. [CrossRef]
11. Yi, T.; Zhang, Y.; Yang, X. Combination of Pt@CeO2/MCM-56 and CeO2-CuO/MCM-56 to purify the exhaustemissions from diesel vehicles. Appl. Catal. A 2019, 570, 387–394. [CrossRef]
12. Banús, E.D.; Ulla, M.A.; Miró, E.E.; Milt, V.G. Structured Catalysts for Soot Combustion for Diesel Engines, InChapter 5, in Diesel Engine—Combustion, Emissions and Condition Monitoring. IntechOpen 2013, 117–142.[CrossRef]
13. Garetto, T.F.; Rincón, E.; Apesteguía, C.R. The origin of the enhanced activity of Pt/zeolites for combustionof C2–C4 alkanes. Appl. Catal. B 2007, 73, 65–72. [CrossRef]
14. Diehl, F.; Barbier, J.; Duprez, D.; Guibard, I.; Mabilon, G. Catalytic oxidation of heavy hydrocarbons overPt/Al2O3. Oxidation of C10
+ solid hydrocarbons representative of soluble organic fraction of Diesel soot.Appl. Catal. A 2015, 504, 37–43. [CrossRef]
15. Varela-Gandía, F.J.; Berenguer-Murcia, A.; Lozano-Castelló, D.; Cazorla-Amorós, D.; Sellick, D.R.; Taylor, S.Total oxidation of naphthalene using palladium nanoparticles supported on BETA, ZSM-5, SAPO-5 andalumina powders. Appl. Catal. B 2013, 129, 98–105. [CrossRef]
16. Demoulin, O.; Clef, B.L.; Navez, M.; Ruiz, P. Combustion of methane, ethane and propane and of mixturesof methane with ethane or propane on Pd/γ-Al2O3 catalysts. Appl. Catal. A 2008, 344, 1–9. [CrossRef]
17. Liotta, L.F. Catalytic oxidation of volatile organic compounds on supported noble metals. Appl. Catal. B 2010,100, 403–412. [CrossRef]
18. Avila, M.S.; Vignatti, C.I.; Apesteguía, C.R.; Garetto, T.F. Effect of support on the deep oxidation of propaneand propylene on Pt-based catalysts. Chem. Eng. J. 2014, 241, 52–59. [CrossRef]
19. Cortés-Reyes, M.; Herrera, C.; Larrubia, M.Á.; Alemany, L.J. Intrinsic reactivity analysis of soot removal inLNT-catalysts. Appl. Catal. B 2016, 193, 110–120. [CrossRef]
20. Burch, R.; Breen, J.P.; Meunier, F.C. A review of the selective reduction of NOx with hydrocarbons underlean-burn conditions with non-zeolitic oxide and platinum group metal catalysts. Appl. Catal. B 2002, 39,283–303. [CrossRef]
86

Catalysts 2019, 9, 297
21. Sanz, O.; Banús, E.D.; Goya, A.; Larumbe, H.; Delgado, J.J.; Monzón, A.; Montes, M. Stacked wire-meshmonoliths for VOCs combustion: Effect of the mesh-opening in the catalytic performance. Catal. Today 2017,296, 76–83. [CrossRef]
22. Aranda, A.; López, J.M.; Murillo, R.; Mastral, A.M.; Dejoz, A.; Vázquez, I.; Solsona, B.; Taylor, S.H.; García, T.Total oxidation of naphthalene with high selectivity using a ceria catalyst prepared by a combustion methodemploying ethyleneglicol. J. Hazard. Mater. 2009, 171, 393–399. [CrossRef] [PubMed]
23. Li, W.B.; Wang, J.X.; Gong, H. Catalytic combustion of VOCs on non-noble metal catalysts. Catal. Today 2009,148, 81–87. [CrossRef]
24. Sanchis, R.; Alonso-Domínguez, D.; Dejoz, A.; Pico, M.P.; Alvarez-Serrano, I.; García, T.; López, M.L.;Solsona, B. Eco-Friendly Cavity-Containing Iron Oxides Prepared by Mild Routes as Very Efficient Catalystsfor the Total Oxidation of VOCs. Materials 2018, 11, 1387. [CrossRef]
25. Solsona, B.; Sanchis, R.; Dejoz, A.M.; García, T.; Ruiz-Rodríguez, L.; López Nieto, J.M.; Cecilia, J.A.;Rodríguez-Castellón, E. Total Oxidation of Propane Using CeO2 and CuO-CeO2 Catalysts Prepared UsingTemplates of Different Nature. Catalysts 2017, 7, 96. [CrossRef]
26. Leguizamón Aparicio, M.S.; Ocsachoque, M.A.; Gazzoli, D.; Botto, I.L.; Lick, I.D. Total Oxidation ofNaphthalene with Zirconia-Supported Cobalt, Copper and Nickel catalysts. Catalysts 2017, 7, 293. [CrossRef]
27. Heynderickx, M.P.; Thybaut, J.W.; Poelman, H.; Poelman, D.; Marin, G.B. The total oxidation of propane oversupported Cu and Ce oxides: A comparison of single and binary metal oxides. J. Catal. 2010, 272, 109–120.[CrossRef]
28. Morales, M.R.; Yeste, M.P.; Vidal, H.; Gatica, J.M.; Cadus, L.E. Insights on the combustion mechanism ofethanol and n-hexane in honeycomb monolithic type catalysts: Influence of the amount and nature of Mn-Cumixed oxide. Fuel 2017, 208, 637–646. [CrossRef]
29. Mrad, R.; Cousin, R.; Poupin, C.; Aboukaïs, A.; Siffert, S. Propene oxidation and NO reduction over MgCu–Al(Fe) mixed oxides derived from hydrotalcite-like compounds. Catal. Today 2015, 257, 98–103. [CrossRef]
30. Li, X.; Li, X.; Zeng, X.; Zhu, T. Correlation between the physicochemical properties and catalytic performancesof micro/mesoporous CoCeOx mixed oxides for propane combustion. Appl. Catal. A 2019, 572, 61–70.[CrossRef]
31. Solsona, B.; Davies, T.E.; García, T.; Vázquez, I.; Dejoz, A.; Taylor, S.H. Total oxidation of propane usingnanocrystalline cobalt oxide and supported cobalt oxide catalysts. Appl. Catal. B 2008, 84, 176–184. [CrossRef]
32. Hernández-Giménez, A.M.; Castelló, D.L.; Bueno-López, A. Diesel soot combustion catalysts: Review ofactive phases. Chem. Pap. 2014, 68, 1154–1168. [CrossRef]
33. Fino, D.; Bensaid, S.; Piumetti, M.; Russo, N. A review on the catalytic combustion of soot in diesel particulatefilters for automotive applications: From powder catalysts to structured reactors. Appl. Catal. A 2016, 509,75–96. [CrossRef]
34. Comelli, N.A.; Ruiz, M.L.; Leguizamón Aparicio, M.S.; Merino, N.A.; Cecilia, J.A.; Rodríguez-Castellón, E.;Lick, I.D.; Ponzi, M.I. Influence of the synthetic conditions on the composition, morphology of CuMgAlhydrotalcites and their use as catalytic precursor in diesel soot combustion reactions. Appl. Clay Sci. 2018,157, 148–157. [CrossRef]
35. Banús, E.B.; Sanz, O.; Milt, V.G.; Miró, E.E.; Montes, M. Development of a stacked wire-mesh structure fordiesel soot combustion. Chem. Eng. J. 2014, 246, 353–365. [CrossRef]
36. Alcalde-Santiago, V.; Davó-Quiñonero, A.; Lozano-Castelló, D.; Bueno-López, A. On the soot combustionmechanism using 3DOM ceria catalysts. Appl. Catal. B 2018, 234, 187–197. [CrossRef]
37. Bueno-López, A.; Lozano-Castelló, D.; McCue, A.J.; Anderson, J.A. NOx storage and reduction overcopper-based catalysts. part 3: Simultaneous NOx and soot removal. Appl. Catal. B 2016, 198, 266–275.
38. Legutko, P.; Peza, J.; Villar Rossi, A.; Marzec, M.; Jakubek, T.; Kozieł, M.; Adamski, A. Elucidation ofunexpectedly weak Catalytic effect of doping with cobalt of the cryptomelane and birnessite systems Activein Soot Combustion. Top. Catal. 2019. [CrossRef]
39. Atribak, I.; Bueno-Lopez, A.; García-García, A.; Navarro, P.; Frías, D. Catalytic activity for soot combustionof birnessite and cryptomelane. Appl. Catal. B 2010, 93, 267–273. [CrossRef]
40. Li, Q.; Wang, X.; Chen, H.; Xin, Y.; Tian, G.; Lu, C.; Zhang, Z.; Zheng, L. K-supported catalysts for diesel sootcombustion: Making a balance between activity and stability. Catal. Today 2016, 264, 171–179. [CrossRef]
41. Ruiz, M.L.; Lick, I.D.; Ponzi, M.I.; Ponzi, E.N. Catalysts of alkaline nitrates supported on oxides for the dieselsoot combustion. Deactivation by hydro-treatment and CO2. Catal. Commun. 2013, 34, 45–51. [CrossRef]
87

Catalysts 2019, 9, 297
42. Nossova, L.; Caravaggio, G.; Couillard, M.; Ntais, S. Effect of preparation method on the performanceof silver-zirconia catalysts for soot oxidation in diesel engine exhaust. Appl. Catal. B 2018, 225, 538–549.[CrossRef]
43. Pecchi, G.; Dinamarca, R.; Campos, C.M.; Garcia, X.; Jimenez, R.G.; Fierro, J.L. Soot Oxidation onSilver-Substituted LaMn0.9Co0.1O3 Perovskites. Ind. Eng. Chem. Res. 2014, 53, 10090–10096. [CrossRef]
44. Haneda, M.; Towata, A. Catalytic performance of supported Ag nano-particles prepared by liquid phasechemical reduction for soot oxidation. Catal. Today 2015, 242, 351–356. [CrossRef]
45. Lee, C.; Jeon, Y.; Kim, T.; Tou, A.; Park, J.-I.; Einaga, H.; Shul, Y.-G. Ag-loaded cerium-zirconium solidsolution oxide nano-fibrous webs and their catalytic activity for soot and CO oxidation. Fuel 2018, 212,395–404. [CrossRef]
46. Luo, M.-F.; Yuan, X.-X.; Zheng, X.-M. Catalyst characterization and activity of Ag–Mn, Ag–Co and Ag–Cecomposite oxides for oxidation of volatile organic compounds. Appl. Catal. A 1998, 175, 121–129. [CrossRef]
47. Yamazaki, K.; Sakakibara, Y.; Dong, F.; Shinjoh, H. The remote oxidation of soot separated by ash depositsvia silver–ceria composite catalysts. Appl. Catal. A 2014, 476, 113–120. [CrossRef]
48. Gao, Y.; Duan, A.; Liu, S.; Wu, X.; Liu, W.; Weng, D. Study of Ag/CexNd1−xO2 nanocubes as soot oxidationcatalysts for gasoline particulate filters: Balancing catalyst activity and stability by Nd doping. Appl. Catal. B2017, 203, 116–126. [CrossRef]
49. Shimizu, H.; Kawachi, H.; Satsuma, A. Study of active sites and mechanism for soot oxidation bysilver-loaded ceria catalyst. Appl. Catal. B 2010, 96, 169–175. [CrossRef]
50. Yamazaki, K.; Tomoyuki Kayama, T.; Dong, F.; Hirofumi Shinjoh, H. A mechanistic study on soot oxidationover CeO2–Ag catalyst with ‘rice-ball’ morphology. J. Catal. 2011, 282, 289–298. [CrossRef]
51. Yamaura, H.; Takahashi, H.; Fukuoka, M.; Nishibori, M.; Yamaguchi, S.; Yahiro, H. PM oxidationover Ag-loaded perovskite-type oxide catalyst prepared by thermal decomposition of heteronuclearcyano-complex precursor. Catal. Today 2018. [CrossRef]
52. Castoldi, L.; Aneggi, E.; Matarrese, R.; Bonzi, R.; Llorca, J.; Trovarelli, A.; Lietti, L. Silver-based catalyticmaterials for the simultaneous removal of soot and NOx. Catal. Today 2015, 258, 405–415. [CrossRef]
53. Aneggi, E.; Llorca, J.; de Leitenburg, C.; Dolcetti, G.; Trovarelli, A. Soot combustion over silver-supportedcatalysts. Appl. Catal. B 2009, 91, 489–498. [CrossRef]
54. Deng, X.; Li, M.; Zhang, J.; Hu, X.; Zheng, J.; Zhang, N.; Chen, B.H. Constructing nano-structure onsilver/ceria-zirconia towards highly active and stable catalyst for soot oxidation. Chem. Eng. J. 2017, 313,544–555. [CrossRef]
55. Serve, A.; Boreave, A.; Cartoxia, B.; Pajot, K.; Vernoux, P. Synergy between Ag nanoparticles andyttria-stabilized zirconia for soot oxidation. Appl. Catal B 2019, 242, 140–149. [CrossRef]
56. Wang, H.; Luo, S.; Zhang, M.; Liu, W.; Wu, X.; Liu, S. Roles of oxygen vacancy and Ox− in oxidation reactionsover CeO2 and Ag/CeO2 nanorod model catalysts. J. Catal. 2018, 368, 365–378. [CrossRef]
57. Makkee, M.; Jelles, S.J.; Moulijn, J.A. Cerium and Platinum Based Diesel Fuel Additives in the Diesel SootAbatement Technology. In Catalysis by Ceria and Related Materials, 1st ed.; Trovarelli, A., Ed.; Imperial CollegePress: London, UK, 2002; Volume 2, pp. 391–406.
58. Liu, M.; Wu, X.; Shuang Liu, S.; Gao, Y.; Chen, Z.; Ma, Y.; Ran, R.; Weng, D. Study of Ag/CeO2 catalysts fornaphthalene oxidation: Balancing the oxygen availability and oxygen regeneration capacity. Appl. Catal. B2017, 219, 231–240. [CrossRef]
59. Mars, P.; van Krevelen, D.W. Oxidations carried out by means of vanadium oxide catalysts. Chem. Eng. Sci.1954, 3, 41–59. [CrossRef]
60. Vannice, A. An analysis of the Mars–van Krevelen rate expression. Catal. Today 2007, 123, 18–22. [CrossRef]61. Bueno-López, A.; Krishna, K.; Makkee, M.; Moulijn, J.A. Active oxygen from CeO2 and its role in catalyzed
soot oxidation. Catal. Lett. 2005, 99, 203–205. [CrossRef]62. Hosseini, M.; Barakat, T.; Cousin, R.; Aboukais, A.; Su, B.-L.; De Weireld, G. Catalytic performance of
core–shell and alloy Pd–Au nanoparticles for total oxidation of VOC: The effect of metal deposition.Appl. Catal. B 2012, 111, 218–224. [CrossRef]
63. Guillén-Hurtado, N.; García-García, A.; Bueno-López, A. Isotopic study of ceria catalyzed soot oxidation inthe presence of NOx. J. Catal. 2013, 299, 181–187. [CrossRef]
64. Kauppi, E.I.; Honkala, K.; Krause, A.O.I.; Kanervo, J.M.; Lefferts, L. ZrO2 Acting as a Redox Catalyst.Top. Catal. 2016, 59, 823–832. [CrossRef]
88
Catalysts 2019, 9, 297
65. Wyrwalski, F.; Lamonier, J.-F.; Siffert, S.; Aboukaïs, A. Additional effects of cobalt precursor and zirconiasupport modifications for the design of efficient VOC oxidation catalysts. Appl. Catal B 2007, 70, 393–399.[CrossRef]
66. Campa, M.C.; Ferraris, G.; Gazzoli, D.; Pettiti, I.; Pietrogiacomi, D. Rhodium supported on tetragonal ormonoclinic ZrO2 as catalyst for the partial oxidation of methane. Appl. Catal B 2013, 142, 423–431. [CrossRef]
67. Kolobova, E.; Pestryakov, A.; Mamontov, G.; Kotolevich, Y.; Bogdanchikova, N.; Farias, M.; Vosmerikov, A.;Vosmerikova, L.; Cortes Corberán, V. Low-temperature CO oxidation on Ag/ZSM-5 catalysts: Influence ofSi/Al ratio and redox pretreatments on formation of silver active sites. Fuel 2017, 188, 121–131. [CrossRef]
68. Rekha, T.N.; Umadevi, M.; Rajkumar, B.J.M. Structural and spectroscopic study of adsorption of naphthaleneon silver. J. Mol. Struct. 2015, 1079, 155–162. [CrossRef]
69. Xie, Y.; Tang, Y. Spontaneous monolayer dispersion of oxides and salts onto surfaces of supports: Applicationsto heterogeneous catalysis. Adv. Catal. 1990, 37, 1–43.
70. Valigi, M.; Gazzoli, D.; Dragone, R.; Gherardi, M.; Minelli, G. Nickel oxide-zirconium oxide: Ni2+
incorporation and its influence on the phase transition and sintering of zirconia. J. Mater. Chem. 1995,5, 183–189. [CrossRef]
71. Corro, G.; Vidal, E.; Cebada, S.; Pal, U.; Buñuelos, F.; Vargas, D.; Guilleminot, E. Electronic state of silverin Ag/SiO2 and Ag/ZnO catalysts and its effect on diesel particulate matter oxidation: An XPS study.Appl. Catal. B 2017, 216, 1–10. [CrossRef]
72. Centi, G.; Cerrato, G.; D’Angelo, S.; Finardi, U.; Giamello, E.; Morterra, C.; Perathoner, S. Catalytic behaviorand nature of active sites in copper-on-zirconia catalysts for the decomposition of N2O. Catal. Today 1996, 27,265–270. [CrossRef]
73. Ferraria, A.M.; Carapeto, A.P.; do Rego, A.M. X-ray photoelectron spectroscopy: Silver salts revisited.Vacuum 2012, 86, 1988–1991. [CrossRef]
74. Galtayries, A.; Sporken, R.; Riga, J.; Blanchard, G.; Caudano, R. XPS comparative study of ceria/zirconiamixed oxides: Powders and thin film characterization. J. Electron. Spectrosc. Relat. Phenom. 1998, 88, 951–956.[CrossRef]
75. Okal, J.; Zawadzki, M. Combustion of propane over novel zinc aluminate-supported ruthenium catalysts.Appl. Catal. B 2011, 105, 182–190. [CrossRef]
76. Lee, C.; Shul, Y.-G.; Einaga, H. Silver and manganese oxide catalysts supported on mesoporous ZrO2
nanofiber mats for catalytic removal of benzene and diesel soot. Catal. Today 2017, 281, 460–466. [CrossRef]77. Skaf, M.; Hany, S.; Aouad, S.; Labaki, M.; Abi-Aad, E.; Aboukaïs, A. Adsorption of probe molecules to
investigate by EPR the redox properties of silver loaded on ceria. Chem. Phys. 2019, 517, 131–137. [CrossRef]
© 2019 by the authors. Licensee MDPI, Basel, Switzerland. This article is an open accessarticle distributed under the terms and conditions of the Creative Commons Attribution(CC BY) license (http://creativecommons.org/licenses/by/4.0/).
89

catalysts
Article
Synthesis, Performance and Emission QualityAssessment of Ecodiesel from Castor Oil inDiesel/Biofuel/Alcohol Triple Blends ina Diesel Engine
Beatriz Hurtado 1, Alejandro Posadillo 2, Diego Luna 1,* , Felipa M. Bautista 1,
Jose M. Hidalgo 3 , Carlos Luna 1 , Juan Calero 1 , Antonio A. Romero 1 and Rafael Estevez 1
1 Departamento de Química Orgánica, Universidad de Córdoba, Campus de Rabanales, Ed. Marie Curie,14014 Córdoba, Spain; [email protected] (B.H.); [email protected] (F.M.B.); [email protected] (C.L.);[email protected] (J.C.); [email protected] (A.A.R.); [email protected] (R.E.)
2 Seneca Green Catalyst S.L., Campus de Rabanales, 14014 Córdoba, Spain; [email protected] Institute of Physical Chemistry, Polish Academy of Sciences, ul. Kasprzaka 44/52, 01-224 Warsaw, Poland;
[email protected]* Correspondence: [email protected]; Tel.: +34-957212065
Received: 13 November 2018; Accepted: 20 December 2018; Published: 3 January 2019
Abstract: This research aims to promote the use of second-generation biofuels based mainly onCastor oil, which is not adequate for food use, and Sunflower oil as a standard reference for recycledoils. They have been applied in the production of Ecodiesel, a biofuel that integrates glycerol asmonoglyceride, employing sodium methoxide as homogeneous catalyst and ethanol as solvent, butoperating in milder conditions than in the synthesis of conventional biodiesel in order to obtaina kinetic control of the selective transesterification. The behavior of biofuels has been evaluated ina conventional diesel engine, operating as an electricity generator. The contamination degree wasalso evaluated from the opacity values of the generated smokes. The different biofuels here studiedhave practically no differences in the behavior with respect to the power generated, although a smallincrease in the fuel consumption was obtained in some cases. However, with the biofuels employed,a significant reduction, up to 40%, in the emission of pollutants is obtained, mainly with the blenddiesel/castor oil/alcohol. Besides, it is found that pure Castor oil can be employed directly as biofuelin triple blends diesel/biofuel/alcohol, exhibiting results that are very close to those obtained usingbiodiesel or Ecodiesel.
Keywords: castor oil; biofuel; selective transesterification; ecodiesel; biodiesel; diesel engine;electricity generator; smoke opacity; Bacharach opacity
1. Introduction
Nowadays, regardless of the introduction of vehicles that incorporate electric or hydrogen engines,the gradual incorporation of biofuels as substitute of fossil fuels is still mandatory [1]. The use ofbiofuels palliate the depletion of fossil fuels, minimize the negative impact of greenhouse gases,producing less amount of carbon monoxide, sulfur dioxide and unburned hydrocarbons than fossilfuel [2,3], and also allow continued use of the fleet of cars currently existing, estimated at morethan a billion, without modifying the compression ignition (C.I.) engines [4]. Furthermore, biofuelsand, specifically the biodiesel, can be easily integrated into the logistic of the global transportationsystem [5,6]. The gradual replacement of fossil fuels by others of renewable nature involves theintroduction of blends diesel/biofuel. In this sense, the objectives pursued by the EU are estimated at20% of biofuel in the blend in 2020 and 30% in 2030. Despite these objectives are apparently not difficult
Catalysts 2019, 9, 40; doi:10.3390/catal9010040 www.mdpi.com/journal/catalysts91
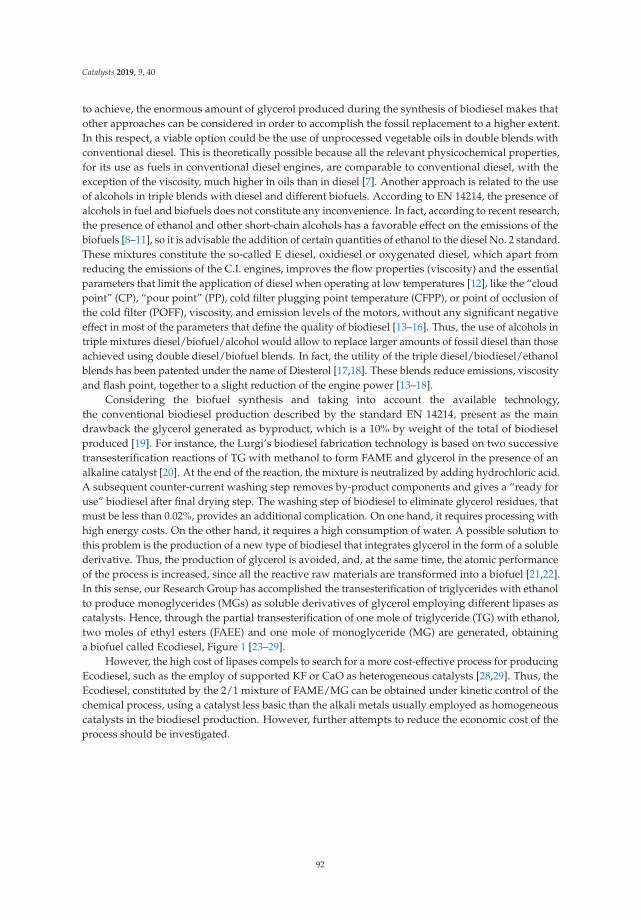
Catalysts 2019, 9, 40
to achieve, the enormous amount of glycerol produced during the synthesis of biodiesel makes thatother approaches can be considered in order to accomplish the fossil replacement to a higher extent.In this respect, a viable option could be the use of unprocessed vegetable oils in double blends withconventional diesel. This is theoretically possible because all the relevant physicochemical properties,for its use as fuels in conventional diesel engines, are comparable to conventional diesel, with theexception of the viscosity, much higher in oils than in diesel [7]. Another approach is related to the useof alcohols in triple blends with diesel and different biofuels. According to EN 14214, the presence ofalcohols in fuel and biofuels does not constitute any inconvenience. In fact, according to recent research,the presence of ethanol and other short-chain alcohols has a favorable effect on the emissions of thebiofuels [8–11], so it is advisable the addition of certain quantities of ethanol to the diesel No. 2 standard.These mixtures constitute the so-called E diesel, oxidiesel or oxygenated diesel, which apart fromreducing the emissions of the C.I. engines, improves the flow properties (viscosity) and the essentialparameters that limit the application of diesel when operating at low temperatures [12], like the “cloudpoint” (CP), “pour point” (PP), cold filter plugging point temperature (CFPP), or point of occlusion ofthe cold filter (POFF), viscosity, and emission levels of the motors, without any significant negativeeffect in most of the parameters that define the quality of biodiesel [13–16]. Thus, the use of alcohols intriple mixtures diesel/biofuel/alcohol would allow to replace larger amounts of fossil diesel than thoseachieved using double diesel/biofuel blends. In fact, the utility of the triple diesel/biodiesel/ethanolblends has been patented under the name of Diesterol [17,18]. These blends reduce emissions, viscosityand flash point, together to a slight reduction of the engine power [13–18].
Considering the biofuel synthesis and taking into account the available technology,the conventional biodiesel production described by the standard EN 14214, present as the maindrawback the glycerol generated as byproduct, which is a 10% by weight of the total of biodieselproduced [19]. For instance, the Lurgi’s biodiesel fabrication technology is based on two successivetransesterification reactions of TG with methanol to form FAME and glycerol in the presence of analkaline catalyst [20]. At the end of the reaction, the mixture is neutralized by adding hydrochloric acid.A subsequent counter-current washing step removes by-product components and gives a “ready foruse” biodiesel after final drying step. The washing step of biodiesel to eliminate glycerol residues, thatmust be less than 0.02%, provides an additional complication. On one hand, it requires processing withhigh energy costs. On the other hand, it requires a high consumption of water. A possible solution tothis problem is the production of a new type of biodiesel that integrates glycerol in the form of a solublederivative. Thus, the production of glycerol is avoided, and, at the same time, the atomic performanceof the process is increased, since all the reactive raw materials are transformed into a biofuel [21,22].In this sense, our Research Group has accomplished the transesterification of triglycerides with ethanolto produce monoglycerides (MGs) as soluble derivatives of glycerol employing different lipases ascatalysts. Hence, through the partial transesterification of one mole of triglyceride (TG) with ethanol,two moles of ethyl esters (FAEE) and one mole of monoglyceride (MG) are generated, obtaininga biofuel called Ecodiesel, Figure 1 [23–29].
However, the high cost of lipases compels to search for a more cost-effective process for producingEcodiesel, such as the employ of supported KF or CaO as heterogeneous catalysts [28,29]. Thus, theEcodiesel, constituted by the 2/1 mixture of FAME/MG can be obtained under kinetic control of thechemical process, using a catalyst less basic than the alkali metals usually employed as homogeneouscatalysts in the biodiesel production. However, further attempts to reduce the economic cost of theprocess should be investigated.
92

Catalysts 2019, 9, 40
Figure 1. Selective transesterification of a triglyceride molecule through the application of enzymaticcatalysis to produce Ecodiesel, a biofuel similar to biodiesel, constituted by two molecules of ethylesters of fatty acids and a monoglyceride molecule.
In addition to the abovementioned drawback of glycerol generation during the biodieselproduction, another important issue related to the biodiesel production is the ethical conflictssurrounding the production of biodiesel from edible oils, instead of using these edible oils exclusivelyfor feeding purposes. To overcome this, the production of the so-called second-generation biofuels,which are obtained from non-edible oils and also from recycled waste oils, using procedures withminimum waste generation and high atom efficiency, are being taken into account [30,31]. Amongthe non-edible oils, Castor oil (Ricinus communis L.) should be a promising option because it hasa large international market, since it is widely used in chemical and pharmaceutical industry [32,33]and it can be grown on marginal lands and in semi-arid climates [34]. However, it is not considereda good raw material to produce biofuels [35] because of the high kinematic viscosity that it exhibits(241.5 cSt). Likewise, the kinematic viscosity of the biodiesel obtained by its transesterification withmethanol is also too high for being employed in combustion engines (15 cSt). In fact, very recentstudies [36–39] have determined that Castor oil biodiesel can be only used in a 20–30% in mixtureswith fossil diesel, i.e., BCO20 to BCO30. In this respect, some researches, regarding the use of triplediesel/biodiesel/alcohol blends in order to increase the amount of biodiesel of castor oil in theseblends, have been initiated [13].
Another possibility, which is barely studied at present, is that Castor oil can be employed in itspure form blending with fossil diesel [40–42]. Castor oil exhibits, in fact, advantageous rheologicalproperties for being employed directly as biofuel, such as high solubility in very diverse organiccompounds, compatibility with polar liquids of low viscosity, such as alcohols; high values of CetaneIndex (81.1) and Flammability Point (229 ◦C); low cloud point −10 to −18 ◦C, (−23 ◦C in FAME),and crystallization (pour point) −30 ◦C (−45 ◦C in FAME), which allow its use in motor oil highperformance, as a lubricant and in hydraulic braking systems [34,43].
Hence, in this research, two different aspects have been addressed. On one hand, to furtherreduce the economic cost of the Ecodiesel production, a basic homogeneous catalytic process at theexperimental conditions that are soft enough to achieve the transesterification of the esters of primaryalcohols, positions 1 and 3 of glycerol, without affecting the carbon 2, a secondary alcohol, which isless reactive, has been investigated. To do so, a commercial sodium methoxide is employed as catalyst.Furthermore, in order to avoid the glycerol production that surely occurs employing methanol andan homogeneous catalyst, the possibility of using ethanol as solvent in a methanol/ethanol mixture toattenuate the higher reactivity of methanol has been studied.
On the other hand, to solve the problem of the high viscosity of Castor oil, this research dealswith the possibility of increasing the amount of renewable material in biofuel blends, here so-calleddiesel additive, through the application of diesel/biofuel/alcohol triple blends. In this sense, themost suitable double and triple blends, according to their viscosity values, are applied as a biofuel ina conventional diesel engine, operating as an electric generator. Besides, the quality of the emissionsobtained by using these biofuels was also evaluated from the opacity values of the generated smokes.
93
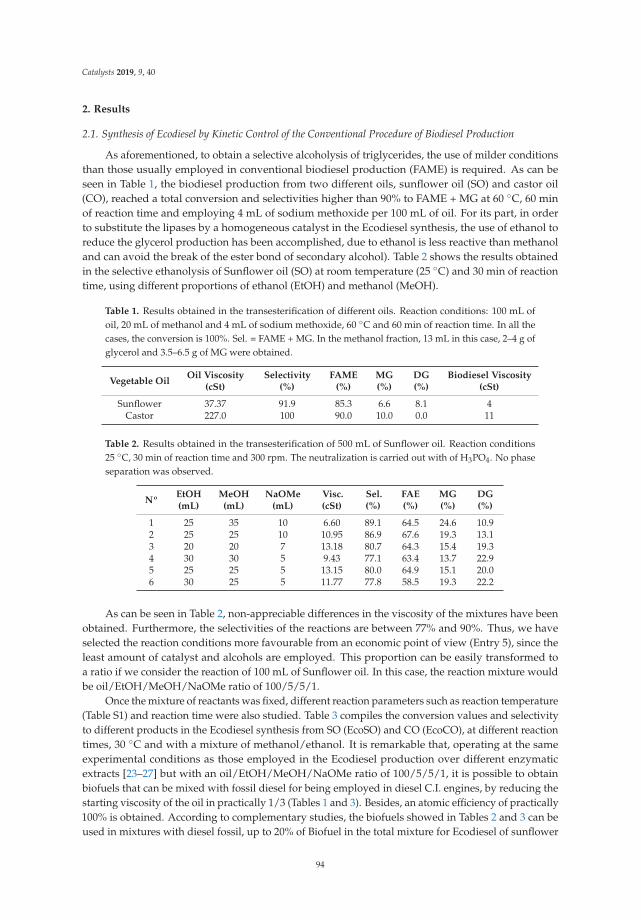
Catalysts 2019, 9, 40
2. Results
2.1. Synthesis of Ecodiesel by Kinetic Control of the Conventional Procedure of Biodiesel Production
As aforementioned, to obtain a selective alcoholysis of triglycerides, the use of milder conditionsthan those usually employed in conventional biodiesel production (FAME) is required. As can beseen in Table 1, the biodiesel production from two different oils, sunflower oil (SO) and castor oil(CO), reached a total conversion and selectivities higher than 90% to FAME + MG at 60 ◦C, 60 minof reaction time and employing 4 mL of sodium methoxide per 100 mL of oil. For its part, in orderto substitute the lipases by a homogeneous catalyst in the Ecodiesel synthesis, the use of ethanol toreduce the glycerol production has been accomplished, due to ethanol is less reactive than methanoland can avoid the break of the ester bond of secondary alcohol). Table 2 shows the results obtainedin the selective ethanolysis of Sunflower oil (SO) at room temperature (25 ◦C) and 30 min of reactiontime, using different proportions of ethanol (EtOH) and methanol (MeOH).
Table 1. Results obtained in the transesterification of different oils. Reaction conditions: 100 mL ofoil, 20 mL of methanol and 4 mL of sodium methoxide, 60 ◦C and 60 min of reaction time. In all thecases, the conversion is 100%. Sel. = FAME + MG. In the methanol fraction, 13 mL in this case, 2–4 g ofglycerol and 3.5–6.5 g of MG were obtained.
Vegetable OilOil Viscosity
(cSt)Selectivity
(%)FAME
(%)MG(%)
DG(%)
Biodiesel Viscosity(cSt)
Sunflower 37.37 91.9 85.3 6.6 8.1 4Castor 227.0 100 90.0 10.0 0.0 11
Table 2. Results obtained in the transesterification of 500 mL of Sunflower oil. Reaction conditions25 ◦C, 30 min of reaction time and 300 rpm. The neutralization is carried out with of H3PO4. No phaseseparation was observed.
NºEtOH(mL)
MeOH(mL)
NaOMe(mL)
Visc.(cSt)
Sel.(%)
FAE(%)
MG(%)
DG(%)
1 25 35 10 6.60 89.1 64.5 24.6 10.92 25 25 10 10.95 86.9 67.6 19.3 13.13 20 20 7 13.18 80.7 64.3 15.4 19.34 30 30 5 9.43 77.1 63.4 13.7 22.95 25 25 5 13.15 80.0 64.9 15.1 20.06 30 25 5 11.77 77.8 58.5 19.3 22.2
As can be seen in Table 2, non-appreciable differences in the viscosity of the mixtures have beenobtained. Furthermore, the selectivities of the reactions are between 77% and 90%. Thus, we haveselected the reaction conditions more favourable from an economic point of view (Entry 5), since theleast amount of catalyst and alcohols are employed. This proportion can be easily transformed toa ratio if we consider the reaction of 100 mL of Sunflower oil. In this case, the reaction mixture wouldbe oil/EtOH/MeOH/NaOMe ratio of 100/5/5/1.
Once the mixture of reactants was fixed, different reaction parameters such as reaction temperature(Table S1) and reaction time were also studied. Table 3 compiles the conversion values and selectivityto different products in the Ecodiesel synthesis from SO (EcoSO) and CO (EcoCO), at different reactiontimes, 30 ◦C and with a mixture of methanol/ethanol. It is remarkable that, operating at the sameexperimental conditions as those employed in the Ecodiesel production over different enzymaticextracts [23–27] but with an oil/EtOH/MeOH/NaOMe ratio of 100/5/5/1, it is possible to obtainbiofuels that can be mixed with fossil diesel for being employed in diesel C.I. engines, by reducing thestarting viscosity of the oil in practically 1/3 (Tables 1 and 3). Besides, an atomic efficiency of practically100% is obtained. According to complementary studies, the biofuels showed in Tables 2 and 3 can beused in mixtures with diesel fossil, up to 20% of Biofuel in the total mixture for Ecodiesel of sunflower
94

Catalysts 2019, 9, 40
oil (Table S2), and up to 15% if the Biodiesel is obtained from castor oil [41]. In these blends, theviscosity values drop to the limits established in EN 14214 standards.
Table 3. Results obtained in the transesterification of castor oil. Reaction conditions: 100 mL of eitherCastor oil or Sunflower oil (*), 5mL of ethanol, 5 mL of methanol and 1.0 mL of sodium methoxide,at 30 ◦C and 300 rpm. The neutralization is carried out with 0.1 mL of H3PO4. No phase separationwas observed.
Time(min)
Conv.(%)
Sel.(%)
FAME(%)
MG(%)
DG(%)
TG(%)
Ecodiesel Visc.(cSt)
15 67.3 44.0 34.1 9.9 23.3 32.7 9330 71.1 42.7 30.4 12.3 28.4 28.9 10645 73.3 52.0 40.9 11.1 21.3 26.7 6460 78.0 50.8 40.3 10.5 27.2 22.0 76
15 * 58.9 23.2 19.6 3.6 35.7 41.1 1230 * 86.7 38.9 32.4 6.5 47.8 13.3 1245 * 100 84.3 70.8 13.5 15.7 0.0 1160 * 100 66.6 54.4 12.2 33.4 0.0 11
2.2. Characterization of Biofuel Mixtures, with Fossil Diesel and Alcohols, to Allow Their Use in ConventionalCompression Ignition Engines, without Any Modification
2.2.1. Double Blends: Diesel/Biofuels
The mixtures of oils with diesel exhibit very different viscosity values, depending on thepercentages of oil in the diesel, and also depending on the oil employed. However, the rheologicalproperties of these mixtures are hardly affected by the nature of the oils, mainly at low oilconcentrations, so it is possible to obtain mixtures with a 10% v/v of oil in diesel, suitable of beinguse in conventional diesel engines, conforming to EN 14214. Thus, it is very remarkable that, despitethe high viscosity of castor oil, it behaves analogously to sunflower oil when it is blending withdiesel. In fact, considering BSO10 blends, the viscosity reached a 3.6 cSt while a BCO10 blend reachesa viscosity value of 4.5 cSt.
Taking into account the use of different mixtures of diesel with Ecodiesel, with lower viscositythan the starting oils, higher values of fossil fuel replacement can be achieved. Thus, with sunfloweroil, employed in this research as a reference for waste cooking oils (second generation biofuel), it ispossible to obtain Ecodiesel (EcoSO) under the experimental conditions as in Table 3, with viscosities inthe range of 12 to 15 cSt, whereas in a blend of diesel with a 30% of EcoSO, a viscosity value of 5.1 cStis obtained, suitable to be employed directly in conventional diesel engines. In addition, we mustnot lose the perspective of how the biofuels is considered to be employed, i.e., in different mixtures,20% in 2020, and 30% in 2030. To do so, the process described in Tables 2 and 3 seems to be themost appropriate to produce the biofuels in the most easy (and economical) way, although obviouslythey can be obtained with higher quality, even with a similar quality to biodiesel. However, higherconcentrations of catalyst and alcohols must be used for this purpose, implying then a higher cost.
Regardless of the procedure employed for the Ecodiesel synthesis, it is important to establish whatpercentages of mixture with diesel can be employed in every case. Thus, for the Ecodiesel obtainedwith the experimental conditions indicated in Table 3 (viscosity = 64 cSt), the maximum mixing levelfor being employed in C.I. engine is 15%, attaining a viscosity value of 5.8 cSt. However, if a lowerviscosity Ecodiesel is employed, either EcoCO or EcoSO, obtained by using higher concentrationsof catalyst and alcohol, they can be employed even up to 30% blending with diesel, Figure 2. Theseresults show that EcoCO exhibits similar rheological properties as BCO when they are blended withdiesel [41], up to 25% v/v.
95
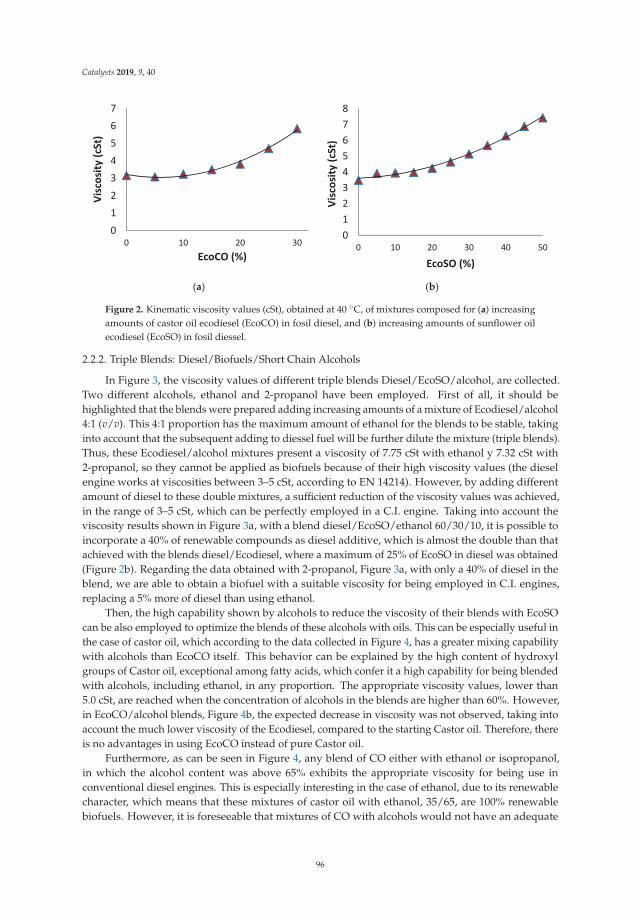
Catalysts 2019, 9, 40
(a) (b)
Figure 2. Kinematic viscosity values (cSt), obtained at 40 ◦C, of mixtures composed for (a) increasingamounts of castor oil ecodiesel (EcoCO) in fosil diesel, and (b) increasing amounts of sunflower oilecodiesel (EcoSO) in fosil diessel.
2.2.2. Triple Blends: Diesel/Biofuels/Short Chain Alcohols
In Figure 3, the viscosity values of different triple blends Diesel/EcoSO/alcohol, are collected.Two different alcohols, ethanol and 2-propanol have been employed. First of all, it should behighlighted that the blends were prepared adding increasing amounts of a mixture of Ecodiesel/alcohol4:1 (v/v). This 4:1 proportion has the maximum amount of ethanol for the blends to be stable, takinginto account that the subsequent adding to diessel fuel will be further dilute the mixture (triple blends).Thus, these Ecodiesel/alcohol mixtures present a viscosity of 7.75 cSt with ethanol y 7.32 cSt with2-propanol, so they cannot be applied as biofuels because of their high viscosity values (the dieselengine works at viscosities between 3–5 cSt, according to EN 14214). However, by adding differentamount of diesel to these double mixtures, a sufficient reduction of the viscosity values was achieved,in the range of 3–5 cSt, which can be perfectly employed in a C.I. engine. Taking into account theviscosity results shown in Figure 3a, with a blend diesel/EcoSO/ethanol 60/30/10, it is possible toincorporate a 40% of renewable compounds as diesel additive, which is almost the double than thatachieved with the blends diesel/Ecodiesel, where a maximum of 25% of EcoSO in diesel was obtained(Figure 2b). Regarding the data obtained with 2-propanol, Figure 3a, with only a 40% of diesel in theblend, we are able to obtain a biofuel with a suitable viscosity for being employed in C.I. engines,replacing a 5% more of diesel than using ethanol.
Then, the high capability shown by alcohols to reduce the viscosity of their blends with EcoSOcan be also employed to optimize the blends of these alcohols with oils. This can be especially useful inthe case of castor oil, which according to the data collected in Figure 4, has a greater mixing capabilitywith alcohols than EcoCO itself. This behavior can be explained by the high content of hydroxylgroups of Castor oil, exceptional among fatty acids, which confer it a high capability for being blendedwith alcohols, including ethanol, in any proportion. The appropriate viscosity values, lower than5.0 cSt, are reached when the concentration of alcohols in the blends are higher than 60%. However,in EcoCO/alcohol blends, Figure 4b, the expected decrease in viscosity was not observed, taking intoaccount the much lower viscosity of the Ecodiesel, compared to the starting Castor oil. Therefore, thereis no advantages in using EcoCO instead of pure Castor oil.
Furthermore, as can be seen in Figure 4, any blend of CO either with ethanol or isopropanol,in which the alcohol content was above 65% exhibits the appropriate viscosity for being use inconventional diesel engines. This is especially interesting in the case of ethanol, due to its renewablecharacter, which means that these mixtures of castor oil with ethanol, 35/65, are 100% renewablebiofuels. However, it is foreseeable that mixtures of CO with alcohols would not have an adequate
96
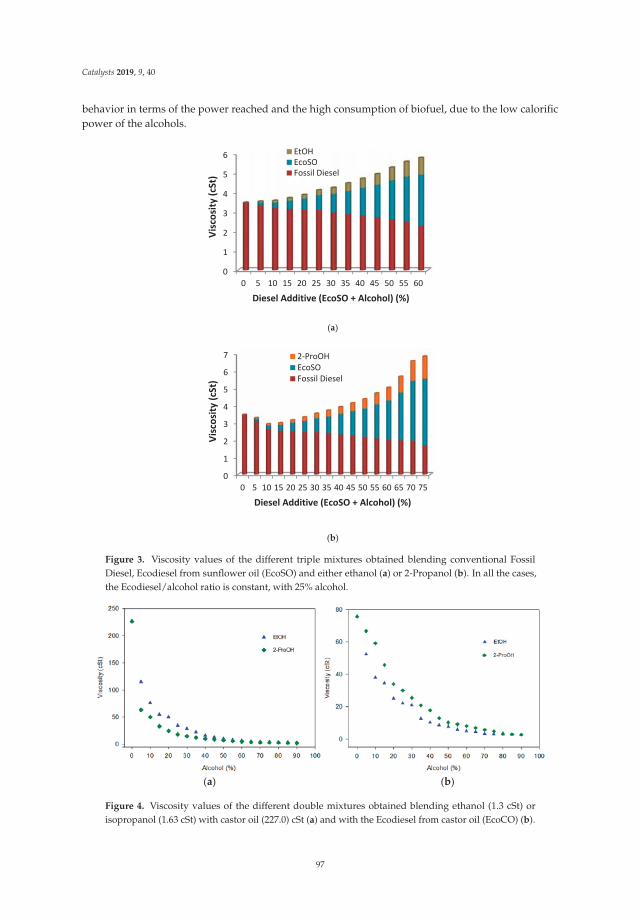
Catalysts 2019, 9, 40
behavior in terms of the power reached and the high consumption of biofuel, due to the low calorificpower of the alcohols.
(a)
(b)
Figure 3. Viscosity values of the different triple mixtures obtained blending conventional FossilDiesel, Ecodiesel from sunflower oil (EcoSO) and either ethanol (a) or 2-Propanol (b). In all the cases,the Ecodiesel/alcohol ratio is constant, with 25% alcohol.
(a) (b)
Figure 4. Viscosity values of the different double mixtures obtained blending ethanol (1.3 cSt) orisopropanol (1.63 cSt) with castor oil (227.0) cSt (a) and with the Ecodiesel from castor oil (EcoCO) (b).
97

Catalysts 2019, 9, 40
This behavior makes possible the assumption that triple blends diesel/EcoCO/alcoholand diesel/CO/alcohol can be employed as biofuels. In this respect, the triple mixturesdiesel/EcoCO/ethanol and diesel/EcoCO/2-propanol have been prepared by blending fossil dieselwith increasing amounts of a 1:1 blend of EcoCO/alcohol, and the viscosity values obtained for thoseblends are shown in Figure 5.
According to the results shown in Figure 5a, it is possible to incorporate a 40% diesel additive, e.g.,60/20/20 in the blend diesel/EcoCO/ethanol, so it is possible to achieve a higher substitution of dieselfuel than that achieved with the double blends diesel/Ecodiesel. Furthermore, no differences in theviscosity values obtained for the blends using either ethanol or 2-propanol were observed (Figure 5).
(a)
(b)
Figure 5. Viscosity values of the different triple mixtures obtained blending Ecodiesel from castor oil(EcoCO), a conventional diesel and either ethanol (a) or isopropanol (b). In all cases, the Ecodiesel/alcoholratio is 1:1.
However, when Castor oil is directly employed in these triple blends, diesel/CO/alcohol,a different behavior depending on the alcohol employed is observed. As can be seen in Figure 6,for blends diesel/Castor oil/alcohol, the replacement of fossil diesel by diesel additive in amountshigher than 20% is not possible, e.g., 80/10/10. This fact is due to the low solubility of ethanol anddiesel. However, if 2-propanol is employed, a 40% of diesel fuel can be replace by diesel additives,as can be seen for the blend 60/20/20, diesel/Castor oil/2-propanol.
98
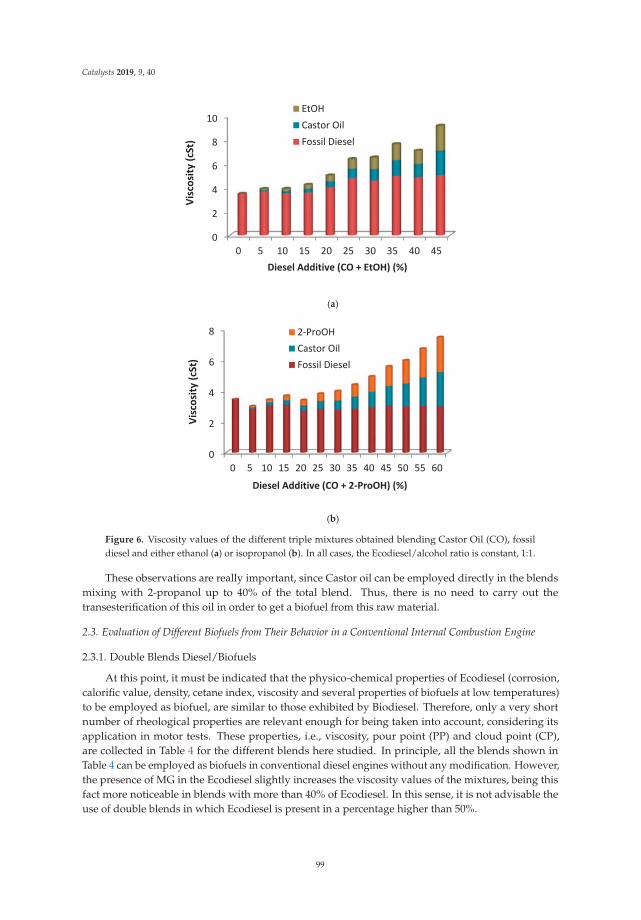
Catalysts 2019, 9, 40
(a)
(b)
Figure 6. Viscosity values of the different triple mixtures obtained blending Castor Oil (CO), fossildiesel and either ethanol (a) or isopropanol (b). In all cases, the Ecodiesel/alcohol ratio is constant, 1:1.
These observations are really important, since Castor oil can be employed directly in the blendsmixing with 2-propanol up to 40% of the total blend. Thus, there is no need to carry out thetransesterification of this oil in order to get a biofuel from this raw material.
2.3. Evaluation of Different Biofuels from Their Behavior in a Conventional Internal Combustion Engine
2.3.1. Double Blends Diesel/Biofuels
At this point, it must be indicated that the physico-chemical properties of Ecodiesel (corrosion,calorific value, density, cetane index, viscosity and several properties of biofuels at low temperatures)to be employed as biofuel, are similar to those exhibited by Biodiesel. Therefore, only a very shortnumber of rheological properties are relevant enough for being taken into account, considering itsapplication in motor tests. These properties, i.e., viscosity, pour point (PP) and cloud point (CP),are collected in Table 4 for the different blends here studied. In principle, all the blends shown inTable 4 can be employed as biofuels in conventional diesel engines without any modification. However,the presence of MG in the Ecodiesel slightly increases the viscosity values of the mixtures, being thisfact more noticeable in blends with more than 40% of Ecodiesel. In this sense, it is not advisable theuse of double blends in which Ecodiesel is present in a percentage higher than 50%.
99
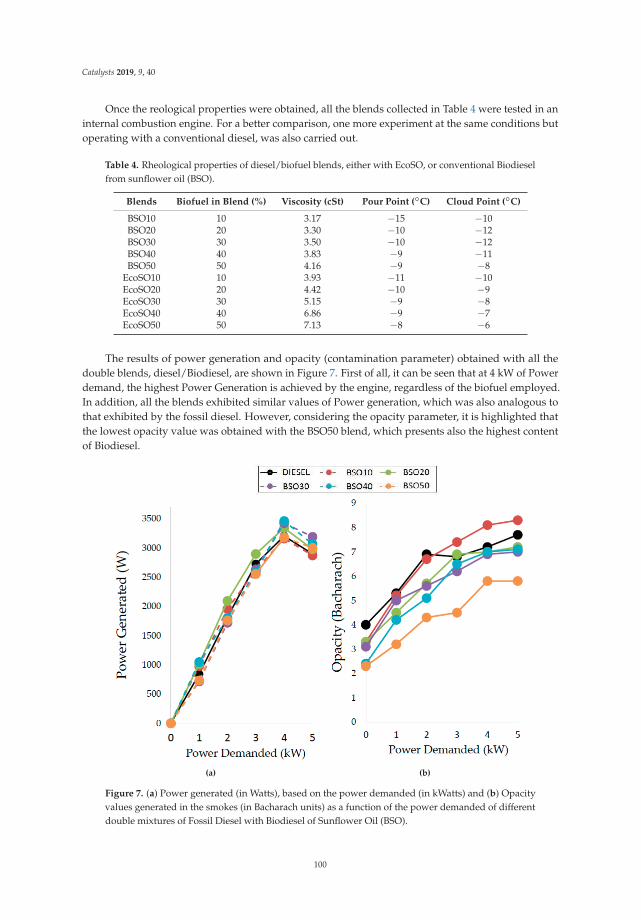
Catalysts 2019, 9, 40
Once the reological properties were obtained, all the blends collected in Table 4 were tested in aninternal combustion engine. For a better comparison, one more experiment at the same conditions butoperating with a conventional diesel, was also carried out.
Table 4. Rheological properties of diesel/biofuel blends, either with EcoSO, or conventional Biodieselfrom sunflower oil (BSO).
Blends Biofuel in Blend (%) Viscosity (cSt) Pour Point (◦C) Cloud Point (◦C)
BSO10 10 3.17 −15 −10BSO20 20 3.30 −10 −12BSO30 30 3.50 −10 −12BSO40 40 3.83 −9 −11BSO50 50 4.16 −9 −8
EcoSO10 10 3.93 −11 −10EcoSO20 20 4.42 −10 −9EcoSO30 30 5.15 −9 −8EcoSO40 40 6.86 −9 −7EcoSO50 50 7.13 −8 −6
The results of power generation and opacity (contamination parameter) obtained with all thedouble blends, diesel/Biodiesel, are shown in Figure 7. First of all, it can be seen that at 4 kW of Powerdemand, the highest Power Generation is achieved by the engine, regardless of the biofuel employed.In addition, all the blends exhibited similar values of Power generation, which was also analogous tothat exhibited by the fossil diesel. However, considering the opacity parameter, it is highlighted thatthe lowest opacity value was obtained with the BSO50 blend, which presents also the highest contentof Biodiesel.
(a) (b)
Figure 7. (a) Power generated (in Watts), based on the power demanded (in kWatts) and (b) Opacityvalues generated in the smokes (in Bacharach units) as a function of the power demanded of differentdouble mixtures of Fossil Diesel with Biodiesel of Sunflower Oil (BSO).
100
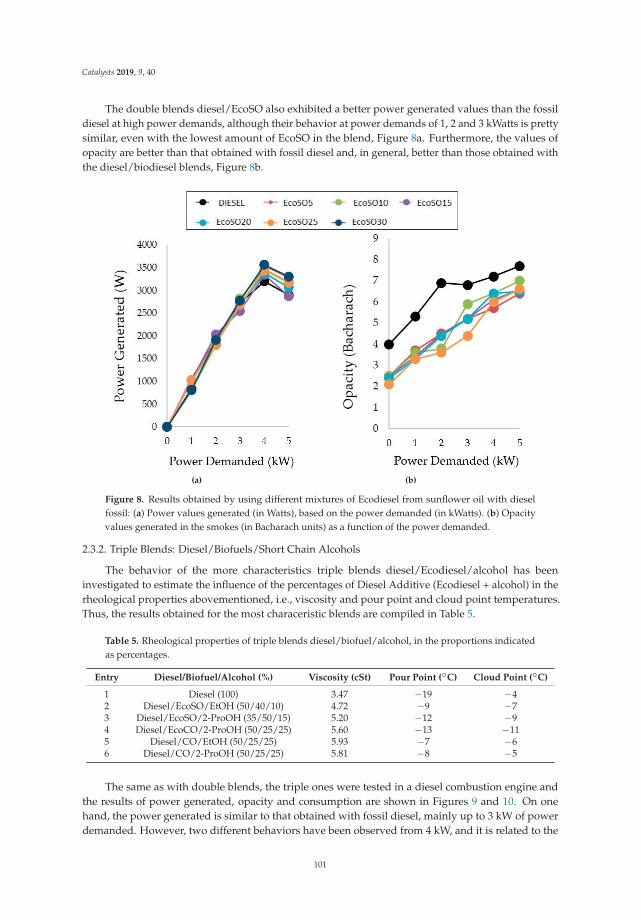
Catalysts 2019, 9, 40
The double blends diesel/EcoSO also exhibited a better power generated values than the fossildiesel at high power demands, although their behavior at power demands of 1, 2 and 3 kWatts is prettysimilar, even with the lowest amount of EcoSO in the blend, Figure 8a. Furthermore, the values ofopacity are better than that obtained with fossil diesel and, in general, better than those obtained withthe diesel/biodiesel blends, Figure 8b.
(a) (b)
Figure 8. Results obtained by using different mixtures of Ecodiesel from sunflower oil with dieselfossil: (a) Power values generated (in Watts), based on the power demanded (in kWatts). (b) Opacityvalues generated in the smokes (in Bacharach units) as a function of the power demanded.
2.3.2. Triple Blends: Diesel/Biofuels/Short Chain Alcohols
The behavior of the more characteristics triple blends diesel/Ecodiesel/alcohol has beeninvestigated to estimate the influence of the percentages of Diesel Additive (Ecodiesel + alcohol) in therheological properties abovementioned, i.e., viscosity and pour point and cloud point temperatures.Thus, the results obtained for the most characeristic blends are compiled in Table 5.
Table 5. Rheological properties of triple blends diesel/biofuel/alcohol, in the proportions indicatedas percentages.
Entry Diesel/Biofuel/Alcohol (%) Viscosity (cSt) Pour Point (◦C) Cloud Point (◦C)
1 Diesel (100) 3.47 −19 −42 Diesel/EcoSO/EtOH (50/40/10) 4.72 −9 −73 Diesel/EcoSO/2-ProOH (35/50/15) 5.20 −12 −94 Diesel/EcoCO/2-ProOH (50/25/25) 5.60 −13 −115 Diesel/CO/EtOH (50/25/25) 5.93 −7 −66 Diesel/CO/2-ProOH (50/25/25) 5.81 −8 −5
The same as with double blends, the triple ones were tested in a diesel combustion engine andthe results of power generated, opacity and consumption are shown in Figures 9 and 10. On onehand, the power generated is similar to that obtained with fossil diesel, mainly up to 3 kW of powerdemanded. However, two different behaviors have been observed from 4 kW, and it is related to the
101
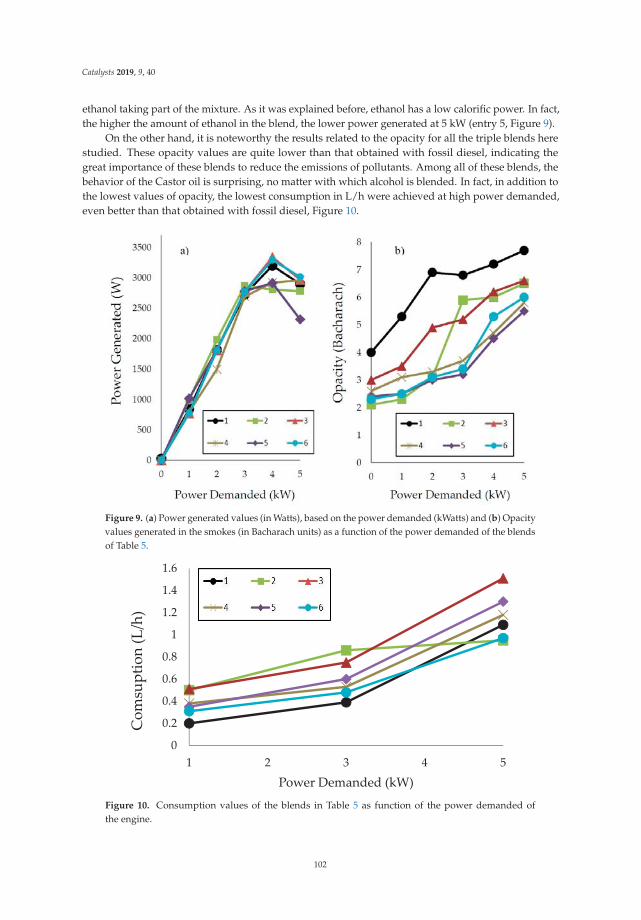
Catalysts 2019, 9, 40
ethanol taking part of the mixture. As it was explained before, ethanol has a low calorific power. In fact,the higher the amount of ethanol in the blend, the lower power generated at 5 kW (entry 5, Figure 9).
On the other hand, it is noteworthy the results related to the opacity for all the triple blends herestudied. These opacity values are quite lower than that obtained with fossil diesel, indicating thegreat importance of these blends to reduce the emissions of pollutants. Among all of these blends, thebehavior of the Castor oil is surprising, no matter with which alcohol is blended. In fact, in addition tothe lowest values of opacity, the lowest consumption in L/h were achieved at high power demanded,even better than that obtained with fossil diesel, Figure 10.
Figure 9. (a) Power generated values (in Watts), based on the power demanded (kWatts) and (b) Opacityvalues generated in the smokes (in Bacharach units) as a function of the power demanded of the blendsof Table 5.
0
0.2
0.4
0.6
0.8
1
1.2
1.4
1.6
1 2 3 4 5
Com
suption(L/h)
Power Demanded (kW)
Figure 10. Consumption values of the blends in Table 5 as function of the power demanded ofthe engine.
102

Catalysts 2019, 9, 40
3. Discussion
3.1. Synthesis of Ecodiesel by Kinetic Control of the Conventional Procedure of Biodiesel Production
From the results here obtained, we can conclude that among all the available procedures to reducethe viscosity of the oils by chemical reaction, the selective alcoholysis exhibits the greater atomicefficiency (100%), taking full advantage of the triglyceride molecule as biofuel [21,22]. As can beobserved from Tables 1–3, by this procedure, the viscosity of the Ecodiesel is slightly higher than thatexhibited by the biodiesel. This fact can be explained because the total alcoholysis generates threemolecules of FAME. But, in exchange, glycerol generation, in a 10% by weight of the total biodieselproduced, is avoided.
Another important aspect from the economical point of view is that the synthesis of biodieselneeds, in general, more energetic reaction conditions. In fact, complementary studies about theEcodiesel production [44], Table S2, have also shown that the reaction temperatures in the range of20 to 60 ◦C, produce very little influence on the biofuel obtained, since the viscosity in this rangeis reduced by less than 10%. This fact implies that the activation energy in the alcoholysis of thesecondary carbon of glycerol (position 2) is higher than corresponding to the activation of the primaryalcohols (positions 1 and 3 of glycerol). This, among other things, would justify that both processestake place through a different reaction mechanism. From a practical point of view, this implies that thesynthesis of Ecodiesel, regardless of other parameters involved, it should always be performed in therange 20–40 ◦C, usually at room temperature. Furthermore, as can be seen in Table 2, the use of EtOHtogether with MeOH allow the 1,3-selective transesterification over sodium methoxide, attaining anEcodiesel similar to that obtained with lipases, improving the process from an economic point of view.
In addition, another important aspect in the evaluation of the homogeneous catalytic synthesis ofEcodiesel here reported is related to its application to waste cooking oils. This process can be appliedto waste oils subjected to a very simple cleaning process, since after the synthesis reaction of theEcodiesel it is necessary to carry out a very simple filtering operation, to eliminate the salts of alkalinephosphates produced by the reaction with phosphoric acid. In the filtering process, the solid residuesusually mixed with the wasted oil are also easily eliminated. In other words, biofuels can be “cleaned”in the same synthesis process of Ecodiesel. Therefore, with pure oils, the only waste is practicallyreduced to the Na3PO4 salts produced in the last neutralization step. Furthermore, the presence ofethanol as a co-reactant or solvent of methanol, works very positively because it improves the viscosity,and prevents that methanol becomes separate of the biofuel.
Everything raised above leads us to conclude that the production of Ecodiesel in mild conditions,employing homogeneous basic catalysts improves by far the previous studies which implies the use oflipases [23–26] or heterogeneous basic catalysts [28,29], not only from a technical point of view but alsoform the economic one, above all if we consider that this Ecodiesel can be also employed as Biofuel indifferent double and triple blends.
3.2. Evaluation of Different Biofuels from Their Behavior in a Conventional Internal Combustion Engine
From the oils here studied as raw materials in the Ecodiesel production, sunflower oil and castoroil, both Ecodiesel produced, EcoSO and EcoCO, exhibited similar rheological properties as thosedescribed in the literature for the Biodiesel from Castor oil [41], as they can be mixed in a 25% withfossil diesel, Figure 2, to run in conventional diesel engines. However, it is possible to achieve similar,or even higher, replacement of fossil diesel using pure castor oil in triple mixtures with alcohols. Thepeculiar structure of Castor oil allows a high solubility with both, fossil diesel and alcohols, includingethanol (Figure 4). Thus, triple mixtures can be obtained with Castor oil (Figure 6) with a high level offossil diesel replacement, with no need of transforming the starting oil into Ecodiesel (Figures 4 and 5).
Taking into account the two different alcohols proposed in this research, and, according to theresults shown in Figures 5 and 6, if ethanol is employed in the triple mixtures, the EcoCO favors a highersubstitution of fossil diesel than the use of pure Castor oil, 60/20/20 and 80/10/10, respectively.
103
Catalysts 2019, 9, 40
However, if isopropanol is employed, similar results are obtained with EcoCO and pure CO. Anyway,a 40% of fossil diesel substitution was always achieved.
These double and triple blends have been evaluated according to the viscosity, as this parametergives information about which ones can be considered for its use in a diesel engine, as the limitsof viscosity required by conventional diesel engines are in the range 3–7 cSt, although Europeanregulations (EN 14214) establish the interval 3–5 cSt, Figures 3–6.
Regarding the behavior of the blends at low temperatures, Table 5, conventional biodiesel andecodiesel, in double and triple mixtures, solidify at temperatures around −10 ◦C and are completelyfrozen at temperatures around −12 ◦C. In contrast, the corresponding temperatures for diesel fossil arearound −16 to −18 ◦C, for pour point and cloud point, respectively. Thus, for the values here obtained,it can be observed that in blends whose percentage of biofuel is higher, the temperatures of pour pointand cloud point are higher, solidifying before. Independently on the slightly worst temperatures ofpour and cloud point than those exhibited by diesel, the blends studied in the present work gaveacceptable results for environmental conditions where the temperatures are not reduced below −10 ◦C.In addition, the use of any alcohol as an additive would influences positively these parameters, sinceits addition promotes a better performance against low temperatures.
The blends, which meet the requirements for being employed as fuel in diesel engines, weretested at different values of power demanded. As can be seen in Figures 7 and 8, independently ofthe biofuel tested, a stabilization of the generated power values takes place above 4 kW of demandedpower. Likewise, the values of power generated are slightly higher when blends with Ecodiesel wereemployed, especially in the proportions 20% and 30%, Figures 7a and 8a.
About the pollution produced during the combustion of the different samples, the results showthat the higher the power demanded, the higher the emission of pollutants, as it was expected. In fact,an increase in the power demand from a power equivalent to the engine working at idling speed tothe highest demand of 4 or 5 kW, the soot formation doubles. However, it is very remarkable thatfor blends diesel/biodiesel with biodiesel content higher than 10% (BS20, BS30, BS40 and BS50) andblends diesel/Ecodiesel with Ecodiesel content higher than 5%, the opacity values obtained werealways lower than that obtained with fossil diesel, Figures 7b and 8b.
Regarding the triple blends diesel/biofuel/alcohol, the power generated values and the opacityas a function of the power demanded are shown in Figure 9. On one hand, it should be noted that allthe samples exhibited similar values of power generated than diesel fuel (Figure 9a), although those inwhich ethanol is employed as alcohol showed the lower ones, especially the blend diesel/CO/EtOH(50/25/25). However, if 2-propanol is employed, independently on the biofuel, EcoSO, EcoCO or CO,very good results of power generated were obtained.
On the other hand, it must be remarked the surprisingly low opacity values obtained with all thetriple blends tested, more than 10% lower than the opacity obtained with diesel, Figure 9b.
According to the engine fuel consumption, the results in Figure 10 show that EcoSO in tripleblends with isopropanol exhibit higher consumption than diesel, whereas blended with ethanol exhibitlower consumption than diesel. For its part, the blends with EcoCO and CO behave the opposite, i.e.,a lower consumption was obtained using 2-propanol. Thus, considering the results previously exposed,the triple blend diesel/CO/2-proOH (50/25/25) exhibit the best performance, with higher powergeneration, lower emission of pollutants and also lower fuel consumption, indicating its feasibility forbeing employed in diesel engines.
4. Materials and Methods
4.1. Evaluation of Sodium Methoxide as Homogeneous Catalyst in the Selective Alcoholysis to Obtain Ecodiesel
The selective alcoholysis of the Sunflower oil (food quality) and Castor oil (Panreac, CastellarDel Valles, Spain) were carried out over commercial sodium methoxide (Panreac, Sodium methylatesolution 30% in methanol PS) as homogeneous catalyst. The reactions were performed in a 250 mL
104
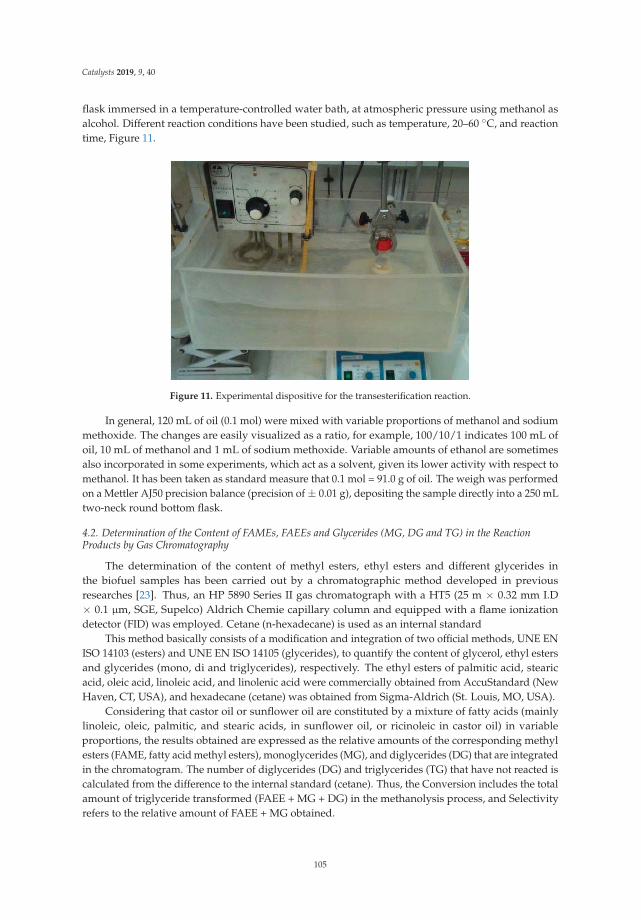
Catalysts 2019, 9, 40
flask immersed in a temperature-controlled water bath, at atmospheric pressure using methanol asalcohol. Different reaction conditions have been studied, such as temperature, 20–60 ◦C, and reactiontime, Figure 11.
Figure 11. Experimental dispositive for the transesterification reaction.
In general, 120 mL of oil (0.1 mol) were mixed with variable proportions of methanol and sodiummethoxide. The changes are easily visualized as a ratio, for example, 100/10/1 indicates 100 mL ofoil, 10 mL of methanol and 1 mL of sodium methoxide. Variable amounts of ethanol are sometimesalso incorporated in some experiments, which act as a solvent, given its lower activity with respect tomethanol. It has been taken as standard measure that 0.1 mol = 91.0 g of oil. The weigh was performedon a Mettler AJ50 precision balance (precision of ± 0.01 g), depositing the sample directly into a 250 mLtwo-neck round bottom flask.
4.2. Determination of the Content of FAMEs, FAEEs and Glycerides (MG, DG and TG) in the ReactionProducts by Gas Chromatography
The determination of the content of methyl esters, ethyl esters and different glycerides inthe biofuel samples has been carried out by a chromatographic method developed in previousresearches [23]. Thus, an HP 5890 Series II gas chromatograph with a HT5 (25 m × 0.32 mm I.D× 0.1 μm, SGE, Supelco) Aldrich Chemie capillary column and equipped with a flame ionizationdetector (FID) was employed. Cetane (n-hexadecane) is used as an internal standard
This method basically consists of a modification and integration of two official methods, UNE ENISO 14103 (esters) and UNE EN ISO 14105 (glycerides), to quantify the content of glycerol, ethyl estersand glycerides (mono, di and triglycerides), respectively. The ethyl esters of palmitic acid, stearicacid, oleic acid, linoleic acid, and linolenic acid were commercially obtained from AccuStandard (NewHaven, CT, USA), and hexadecane (cetane) was obtained from Sigma-Aldrich (St. Louis, MO, USA).
Considering that castor oil or sunflower oil are constituted by a mixture of fatty acids (mainlylinoleic, oleic, palmitic, and stearic acids, in sunflower oil, or ricinoleic in castor oil) in variableproportions, the results obtained are expressed as the relative amounts of the corresponding methylesters (FAME, fatty acid methyl esters), monoglycerides (MG), and diglycerides (DG) that are integratedin the chromatogram. The number of diglycerides (DG) and triglycerides (TG) that have not reacted iscalculated from the difference to the internal standard (cetane). Thus, the Conversion includes the totalamount of triglyceride transformed (FAEE + MG + DG) in the methanolysis process, and Selectivityrefers to the relative amount of FAEE + MG obtained.
105
Catalysts 2019, 9, 40
4.3. Determination of Kinematic Viscosity of Biofuels
The kinematic viscosity has been measured in an Ostwald-Cannon-Fenske capillary viscometer(Proton Routine Viscometer 33200, size 150), determining the time required for a certain volume ofliquid to pass between two marked points on the instrument, placed in an upright position. From theflow time (t), expressed in seconds, we obtain the kinematic viscosity expressed in centistokes, υ = C·t.Where C is the calibration constant of the measurement system in mm2/s2, which is specified by themanufacturer (0.040350 mm2/s2 at 40 ◦C, in this case). All measures have been carried out in duplicateand are presented as the average of both, proving that there is no greater variation of 0.35% betweenmeasures, as required by the standard ASTM (American Society for Testing and Materials) D2270-79,Method for calculating viscosity index from kinematic viscosity at 40 and 100 ◦C.
4.4. Determination of the Pour Point and Cloud Point of Biofuels
Cloud point and the Pour point are determined by introducing the different double or triplesamples, of different composition, in a digitally controlled temperature refrigerator for twenty-fourhours; after this time the loss of transparency of the solutions is evaluated. The appearance of turbidityin the samples is indicative that the cloud point temperature has been reached (cloud point). Aftera progressive decrease in temperature, the samples are kept under observation until they stop flowing(pour point).
4.5. Assessment of Energy Performance and Air Pollutant Emissions in a Diesel Engine Electric Generator,Fueled with Different Blends of Biofuels
The mechanical and environmental characterization of a compression ignition diesel engine hasbeen carried out, working at a rate of 3000 rpm coupled to an AYERBE electric generator, 5KVA, 230vtype AY4000MN, for the generation of electricity, operating at a crankshaft constant rotation rate andunder different degrees of demand for electrical power. This is achieved by connecting heating platesof 1000 watts each one (Figure 12a). This diesel engine will operate at a constant rate of rotation ofthe crankshaft and torque, so that the different values of electrical power obtained will be an exactconsequence of the mechanical power obtained after the combustion of the corresponding biofuel.Different tests are obtained by providing to the engine double and triple mixtures of different biofuelsin different percentages. The electrical power generated can be easily determined from the product ofthe potential difference (or voltage) and the electric current intensity (or amperage), equation (1), bothobtained by means of a voltmeter-ammeter [45,46].
Electrical Power Generated (Watts) = voltage (Volts) × amperage (Amps) (1)
The consumption of the diesel engine with the different biofuels employed was calculatedestimating the speed of consumption of the engine, with a given fuel, when operating undera determined demand of electric power.
On the other hand, the contamination degree is evaluated regarding the opacity of the smokegenerated in the combustion process. This is obtained by using an opacimeter—TESTO 308 opacitymeter—under the operating conditions studied (Figure 12b). All the results obtained with the biofuelsevaluated were compared with the corresponding measurements obtained with conventional diesel.The opacimeter, is a device designed to estimate the amount of soot emitted by diesel engines. Unlikegasoline engines, where the amount of carbon monoxide (CO) and hydrocarbons (HC) is measured toassess the quality of combustion and toxic emissions, only the amount of coal is analyzed in dieselengines (soot). These are tiny particles in suspension which can not be treated as a gas, that is, they cannot be quantified through the gas analyzer. The opacimeter is basically composed of three components:measuring chamber, analyzer and a portable terminal. The outlet of the exhaust pipe of the engine isconnected, through a pipe and a hose, with the measuring chamber and partial samples of the exhaustgases are taken. It is called partial since only part of the gases enter the machine and the rest is lost in
106
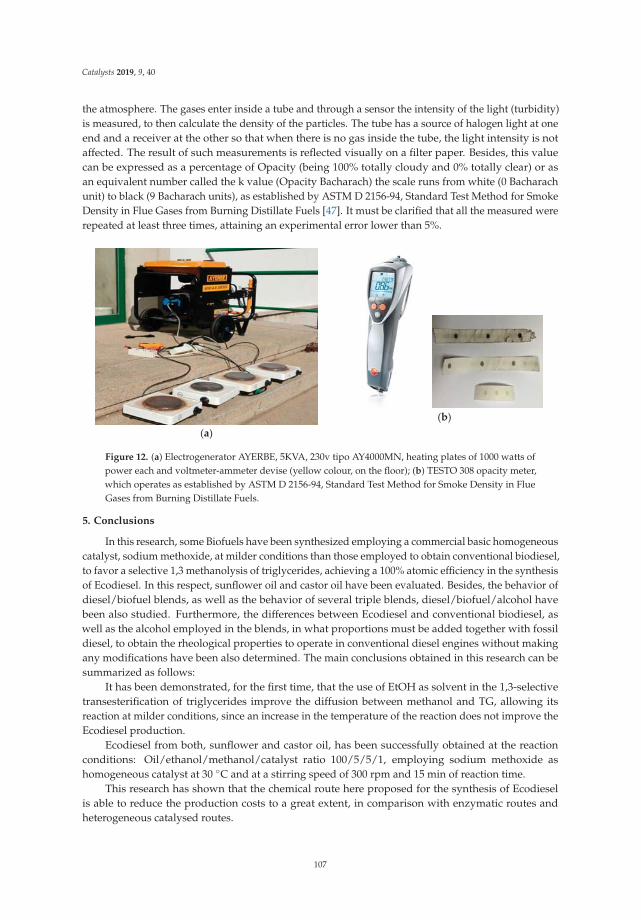
Catalysts 2019, 9, 40
the atmosphere. The gases enter inside a tube and through a sensor the intensity of the light (turbidity)is measured, to then calculate the density of the particles. The tube has a source of halogen light at oneend and a receiver at the other so that when there is no gas inside the tube, the light intensity is notaffected. The result of such measurements is reflected visually on a filter paper. Besides, this valuecan be expressed as a percentage of Opacity (being 100% totally cloudy and 0% totally clear) or asan equivalent number called the k value (Opacity Bacharach) the scale runs from white (0 Bacharachunit) to black (9 Bacharach units), as established by ASTM D 2156-94, Standard Test Method for SmokeDensity in Flue Gases from Burning Distillate Fuels [47]. It must be clarified that all the measured wererepeated at least three times, attaining an experimental error lower than 5%.
(a)(b)
Figure 12. (a) Electrogenerator AYERBE, 5KVA, 230v tipo AY4000MN, heating plates of 1000 watts ofpower each and voltmeter-ammeter devise (yellow colour, on the floor); (b) TESTO 308 opacity meter,which operates as established by ASTM D 2156-94, Standard Test Method for Smoke Density in FlueGases from Burning Distillate Fuels.
5. Conclusions
In this research, some Biofuels have been synthesized employing a commercial basic homogeneouscatalyst, sodium methoxide, at milder conditions than those employed to obtain conventional biodiesel,to favor a selective 1,3 methanolysis of triglycerides, achieving a 100% atomic efficiency in the synthesisof Ecodiesel. In this respect, sunflower oil and castor oil have been evaluated. Besides, the behavior ofdiesel/biofuel blends, as well as the behavior of several triple blends, diesel/biofuel/alcohol havebeen also studied. Furthermore, the differences between Ecodiesel and conventional biodiesel, aswell as the alcohol employed in the blends, in what proportions must be added together with fossildiesel, to obtain the rheological properties to operate in conventional diesel engines without makingany modifications have been also determined. The main conclusions obtained in this research can besummarized as follows:
It has been demonstrated, for the first time, that the use of EtOH as solvent in the 1,3-selectivetransesterification of triglycerides improve the diffusion between methanol and TG, allowing itsreaction at milder conditions, since an increase in the temperature of the reaction does not improve theEcodiesel production.
Ecodiesel from both, sunflower and castor oil, has been successfully obtained at the reactionconditions: Oil/ethanol/methanol/catalyst ratio 100/5/5/1, employing sodium methoxide ashomogeneous catalyst at 30 ◦C and at a stirring speed of 300 rpm and 15 min of reaction time.
This research has shown that the chemical route here proposed for the synthesis of Ecodieselis able to reduce the production costs to a great extent, in comparison with enzymatic routes andheterogeneous catalysed routes.
107

Catalysts 2019, 9, 40
About the rheological properties of the double and triple blends here studied, it has been verifiedthat the viscosity, Pour Point and Cloud Point values of the different samples allow their use as biofuelsin conventional diesel engines.
The results obtained using a compression ignition diesel engine show that 4 kW of power demandgives the greatest engine power generation, independently on the fuel employed.
With the blends diesel/biodiesel, a 50% of fossil diesel can be replaced by a biofuel obtained froma renewable source, whereas in the blends diesel/Ecodiesel, the amount of fossil diesel that can bereplaced is lower, 30%. This fact is due to the presence of MG in the Ecodiesel, which increase theviscosity above 6 cSt.
The use of triple blends diesel/biofuel/alcohol allows us to increase the diesel replacement, evenemploying directly Ecodiesel or Castor oil. Thus, it is possible to use pure Castor oil in the proportions50/25/25, diesel/CO/2-propanol, in conventional diesel engines, with a performance and level ofconsumption like fossil diesel, but with an appreciably lower emission of pollutants. In the case of theEcodiesel of sunflower oil, (and used cooking oils, for use as second generation biofuels) it is possibleto obtain triple mixtures with any ethanol in a proportion 50/40/10 diesel/EcoSO/ethanol which alsoexhibits very good results in terms of consumption and emission of pollutants.
Supplementary Materials: The following are available online at http://www.mdpi.com/2073-4344/9/1/40/s1,Figure S1: Chromatograms obtained in the sunflower oil alcoholysis (a). The initial sunflower oil is in black (a).Commercial diesel fuel chromatogram (b), Table S1: Viscosity values of different blends diesel/Ecodiesel fromCastor oil (EcoCO), Table S2: Viscosity and Selectivity values of Ecodiesel of Sunflower oil (EcoSO) and reactionproducts obtained at the same reaction conditions as in Table 2, after 60 min. The Conversion was also 100%. Sel.= FAE + MG, being FAE = FAME + FAEE.
Author Contributions: This research article is part of the doctoral thesis of B.H., and A.P., directed by D.L., J.M.Hand F.M.B., who in general conceived and designed the experiments. C.L., J.C., A.A.R. and R.E. made substantiveintellectual contributions to this study, making substantial contributions to conception and design of it, as well asto the acquisition, analysis and interpretation of data. Furthermore, D.L. and R.E wrote the paper. All the authorshave been also involved in drafting and revising the manuscript, so that everyone has given final approval of thecurrent version to be published in Catalysts Journal.
Funding: This research received no external funding.
Acknowledgments: This research is supported by the MEIC funds (Project ENE 2016-81013-R), Junta de Andalucíaand FEDER (P11-TEP-7723), that cover the costs to publish in open access.
Conflicts of Interest: The authors declare no conflict of interest.
Abbreviations
FAME fatty acids methyl esters, components of conventional biodieselDMC dimethyl carbonateFAEE Fatty Acid Ethyl EsterFAE esters of fatty acidsMG monoglycerides or monoacylglycerolsDG diacylglycerolsTG triacylglycerols or triglyceridesGC gas chromatographCO Castor oilSO Sunflower oilBCO Biodiesel obtained from Castor oilBSO Biodiesel obtained from Sunflower oilC.I. Compression Ignition enginesCP Cloud PointPP Pour pointCFPP Cold filter plugging point temperaturePOFF Point of occlusion of the cold filter
108

Catalysts 2019, 9, 40
References
1. Arutyunov, V.S.; Lisichkin, G.V. Energy resources of the 21st century: Problems and forecasts. Can renewableenergy sources replace fossil fuels? Russ. Chem. Rev. 2017, 86, 777–804. [CrossRef]
2. Nigam, P.S.; Singh, A. Production of liquid biofuels from renewable resources. Prog. Energy Comb. Sci. 2011,37, 52–68. [CrossRef]
3. Cheng, F.; Li, X. Preparation and Application of Biochar-Based Catalysts for Biofuel Production. Catalysts2018, 8, 346. [CrossRef]
4. Chu, S.; Majumdar, A. Opportunities and challenges for a sustainable energy future. Nature 2012, 488,294–303. [CrossRef] [PubMed]
5. Ridjan, I.; Mathiesen, B.V.; Connolly, D.; Dui, N. The feasibility of synthetic fuels in renewable energysystems. Energy 2013, 57, 76–84. [CrossRef]
6. Kumar, A.A.; Sharma, S. Potential non-edible oil resources as biodiesel feedstock: An Indian perspective.Renew. Sustain. Energy Rev. 2011, 15, 1791–1800. [CrossRef]
7. Rakopoulos, D.C.; Rakopoulos, C.D.; Giakoumis, E.G.; Dimaratos, A.M.; Founti, M.A. Comparativeenvironmental behaviour of bus engine operating on blends of diesel fuel with four straight vegetableoils of Greek origin: Sunflower, cottonseed, corn and olive. Fuel 2011, 90, 3439–3446. [CrossRef]
8. Lapuerta, M.; Armas, O.; Herreros, J.M. Emissions from a diesel–bioethanol blend in an automotive dieselengine. Fuel 2008, 87, 25–31. [CrossRef]
9. Karabektas, M.; Hosoz, M. Performance and emission characteristics of a diesel engine usingisobutanol–diesel fuel blends. Renew. Energy 2009, 34, 1554–1559. [CrossRef]
10. Atmanlı, A.; Ileri, E.; Yüksel, B. Experimental investigation of engine performance and exhaust emissions ofa diesel engine fueled with diesel–n-butanol–vegetable oil blends. Energy Convers. Manag. 2014, 81, 312–321.[CrossRef]
11. Campos-Fernández, J.; Arnal, J.M.; Gómez, J.; Dorado, M.P. A comparison of performance of higheralcohols/diesel fuel blends in a diesel engine. Appl. Energy 2012, 95, 267–275. [CrossRef]
12. Navaneethakrishnan, P.; Vasudevan, D. Experimental Study on Performance and Exhaust EmissionCharacteristics of a C.I. Engine Fueled with Tri Compound Oxygenated Diesel Fuel Blends. Indian J.Sci. Technol. 2015, 8, 96–102. [CrossRef]
13. Yilmaz, N. Comparative analysis of biodiesel-ethanol-diesel and biodiesel-methanol-diesel blends in a dieselengine. Energy 2012, 40, 210–213. [CrossRef]
14. Yilmaz, N.; Vigil, F.M.; Donaldson, A.B.; Darabseh, T. Investigation of CI engine emissions inbiodiesel–ethanol–diesel blends as a function of ethanol concentration. Fuel 2014, 115, 790–793. [CrossRef]
15. Shahir, S.A.; Masjuki, H.H.; Kalam, M.A.; Imran, A.; Ashraful, A.M. Performance and emission assessment ofdiesel–biodiesel–ethanol/bioethanol blend as a fuel in diesel engines: A review. Renew. Sustain. Energy Rev.2015, 48, 62–78. [CrossRef]
16. Aydın, F.; Ogüt, H. Effects of using ethanol-biodiesel-diesel fuel in single cylinder diesel engine to engineperformance and emissions. Renew. Energy 2017, 103, 688–694. [CrossRef]
17. Ghobadian, B.; Yusaf, T.; Najafi, G.; Khatamifar, M. Diesterol: An environment-friendly IC engine fuel.Renew. Energy 2009, 34, 335–342. [CrossRef]
18. Noorollahi, Y.; Azadbakht, M.; Ghobadian, B.; Noorollahi, Y. The effect of different diesterol(diesel–biodiesel–ethanol) blends on small air-cooled diesel engine performance and its exhaust gases.Energy 2018, 142, 196–200. [CrossRef]
19. Quispe, C.A.G.; Coronado, C.R.; Carvalho, J.A., Jr. Glycerol: Production, consumption, prices,characterization and new trends in combustion. Renew. Sustain. Energy Rev. 2013, 27, 475–493. [CrossRef]
20. Oh, P.P.; Lau, H.L.N.; Chen, J.; Chong, M.F.; Choo, Y.M. A review on conventional technologies and emergingprocess intensification (PI) methods for biodiesel production. Renew. Sustain. Energy Rev. 2012, 16, 5131–5145.[CrossRef]
21. Calero, J.; Luna, D.; Sancho, E.D.; Luna, C.; Bautista, F.M.; Romero, A.A.; Posadillo, A.; Berbel, J.;Verdugo-Escamilla, C. An overview on glycerol-free processes for the production of renewable liquidbiofuels, applicable in diesel engines. Renew. Sustain. Energy Rev. 2015, 42, 1437–1452. [CrossRef]
109
Catalysts 2019, 9, 40
22. Calero, J.; Luna, D.; Sancho, E.D.; Luna, C.; Posadillo, A.; Bautista, F.M.; Romero, A.A.; Berbel, J.; Verdugo, C.Technological challenges for the production of biodiesel in arid lands. J. Arid Environ. 2014, 102, 127–138.[CrossRef]
23. Verdugo, C.; Luque, R.; Luna, D.; Hidalgo, J.M.; Posadillo, A.; Sancho, E.D.; Rodriguez, S.; Ferreira-Dias, S.;Bautista, F.; Romero, A.A. A comprehensive study of reaction parameters in the enzymatic production ofnovel biofuels integrating glycerol into their composition. Bioresour. Technol. 2010, 101, 6657–6662. [CrossRef][PubMed]
24. Luna, C.; Sancho, E.; Luna, D.; Caballero, V.; Calero, J.; Posadillo, A.; Verdugo, C.; Bautista, F.M.; Romero, A.A.Biofuel that keeps glycerol as monoglyceride by 1,3-selective ethanolysis with pig pancreatic lipase covalentlyimmobilized on AlPO4 support. Energies 2013, 6, 3879–3900. [CrossRef]
25. Luna, C.; Verdugo, C.; Sancho, E.D.; Luna, D.; Calero, J.; Posadillo, A.; Bautista, F.M.; Romero, A.A.Production of a biodiesel-like biofuel without glycerol generation, by using Novozym 435, an immobilizedCandida antarctica lipase. Bioresour. Bioprocess. 2014, 1, 11. [CrossRef]
26. Luna, C.; Verdugo, C.; Sancho, E.D.; Luna, D.; Calero, J.; Posadillo, A.; Bautista, F.M.; Romero, A.A.Biocatalytic behaviour of immobilized Rhizopus oryzae lipase in the 1,3-selective ethanolysis of sunfloweroil to obtain a biofuel similar to biodiesel. Molecules 2014, 19, 11419–11439. [CrossRef] [PubMed]
27. Luna, C.; Luna, D.; Bautista, F.M.; Estevez, R.; Calero, J.; Posadillo, A.; Romero, A.A.; Sancho, E.D. Applicationof Enzymatic Extracts from a CALB Standard Strain as Biocatalyst within the Context of ConventionalBiodiesel Production Optimization. Molecules 2017, 22, 2025. [CrossRef]
28. Calero, J.; Cumplido, G.; Luna, D.; Sancho, E.D.; Luna, C.; Posadillo, A.; Bautista, F.M.; Romero, A.A.;Verdugo-Escamilla, C. Production of a Biofuel that Keeps the Glycerol as a Monoglyceride by UsingSupported KF as Heterogeneous Catalyst. Energies 2014, 7, 3764–3780. [CrossRef]
29. Calero, J.; Luna, D.; Sancho, E.D.; Luna, C.; Bautista, F.M.; Romero, A.A.; Posadillo, A.; Verdugo, C.develoment of a new biodiesel that integrates glycerol, by using CaO as heterogeneous catalyst, in the partialmethanolysis of sunflower oil. Fuel 2014, 7, 94–102. [CrossRef]
30. Dias, J.M.; Araújo, J.M.; Costa, J.F.; Alvim-Ferraz, M.C.M.; Almeida, M.F. Biodiesel production from rawcastor oil. Energy 2013, 53, 58–69. [CrossRef]
31. Kim, K.H.; Lee, O.K.; Lee, E.Y. Nano-Immobilized Biocatalysts for Biodiesel Production from Renewable andSustainable Resources. A review. Catalysts 2018, 8, 68. [CrossRef]
32. Bello, E.I.; Makanju, A. Production, Characterization and Evaluation of Castor oil Biodiesel as AlternativeFuel for Diesel Engines. J. Emerg. Trends Eng. Appl. Sci. 2011, 2, 525–530.
33. Scholz, V.; Silva, J.N. Prospects and risks of the use of castor oil as a fuel. A review. Biomass Bioenergy 2008,32, 95–100. [CrossRef]
34. Patel, V.R.; Dumancas, G.G.; Viswanath, L.C.K.; Maples, R.; Subong, B.J.J. Castor Oil: Properties, Uses, andOptimization of Processing Parameters in Commercial Production. Lipid Insights 2016, 9, 1–12. [CrossRef]
35. Knothe, G. “Designer” Biodiesel: Optimizing Fatty Ester Composition to Improve Fuel Properties.Energy Fuels 2008, 22, 1358–1364. [CrossRef]
36. Berman, P.; Nizri, S.; Wiesman, Z. Castor oil biodiesel and its blends as alternative fuel. Biomass Bioenergy2011, 35, 2861–2866. [CrossRef]
37. Panwar, N.L.; Shrirame, H.Y.; Rathore, N.S.; Jindal, S.; Kurchania, A.K. Performance evaluation of a dieselengine fueled with methyl ester of castor seed oil. Appl. Therm. Eng. 2010, 30, 245–249. [CrossRef]
38. Valente, O.S.; Silva, M.J.; Pasa, V.M.D.; Belchior, C.R.P.; Sodré, J.R. Fuel consumption and emissions froma diesel power generator fuelled with castor oil and soybean biodiesel. Fuel 2010, 89, 3637–3642. [CrossRef]
39. Nabi, M.N.; Akhter, M.S.; Shahadat, M.M.Z. Improvement of engine emissions with conventional diesel fueland diesel–biodiesel blends. Bioresour. Technol. 2006, 97, 372–378. [CrossRef]
40. Atabani, A.E.; Silitonga, A.S.; Ong, H.C.; Mahlia, T.M.I.; Masjuki, H.H. Non-edible vegetable oils: A criticalevaluation of oil extraction, fatty acid compositions, biodiesel production, characteristics, engine performanceand emissions production. Renew. Sustain. Energy Rev. 2013, 18, 211–245. [CrossRef]
41. Gokdogan, O.; Eryilmaz, T.; Yesilyurt, M.K. Thermophysical properties of castor oil (Ricinus communis L.)biodıesel and its blends. CT&F 2015, 6, 95–128.
42. Akanaw, T.T.; Moges, H.G.; Babu, R.; Bisrat, D. Castor Seed from Melkasa Agricultural Research Centre, EastShowa, Ethiopia and it’s biodiesel performance in Four Stroke Diesel Engine. Int. J. Renew. Energy Dev. 2014,3, 3–99. [CrossRef]
110
Catalysts 2019, 9, 40
43. Mobarak, H.M.; Mohamad, E.N.; Masjuki, H.H.; Kalam, M.A.; Mahmud, K.A.H.A.; Habibullah, M.;Ashraful, A.M. The prospects of biolubricants as alternatives in automotive applications. Renew. Sustain.Energy Rev. 2014, 33, 34–43. [CrossRef]
44. Posadillo, A. ptimization of Experimental Conditions for the Production of Second Generation Biofuels thatIntegrate Glycerol. Universidad de Córdoba, 2016. Available online: https://helvia.uco.es/handle/10396/13237 (accessed on 1 October 2015).
45. Lee, W.J.; Liu, Y.-C.; Mwangi, F.K.; Chen, W.H.; Lin, S.-L.; Fukushima, Y.; Liao, C.-N.; Wang, L.C. Assessmentof energy performance and air pollutant emissions in a diesel engine generator fueled with water-containingethanol–biodiesel–diesel blend of fuels. Energy 2011, 36, 5591–5599. [CrossRef]
46. Chaves, L.I.; de Souza, S.N.M.; Rosa, H.A.; Bariccatti, R.A.; Nogueira, C.E.C.; Secco, D.; Wazilewski, W.T.;Avaci, A.B.; Brenneisen, P.J.; da Silva, M.J. Comparative performance of a diesel cycle engine using blends ofdiesel and biodiesel. Afr. J. Biotechnol. 2012, 11, 14578–14585. [CrossRef]
47. Blanco, M.; Coello, J.; Maspoch, S.; Puigdomènech, A.; Peralta, X.; González, J.M.; Torres, J. CorrelatingBacharach opacity in fuel oil exhaust. prediction of the operating parameters that reduce it. Oil Gas Sci.Technol. IFP 2000, 55, 533–541.
© 2019 by the authors. Licensee MDPI, Basel, Switzerland. This article is an open accessarticle distributed under the terms and conditions of the Creative Commons Attribution(CC BY) license (http://creativecommons.org/licenses/by/4.0/).
111

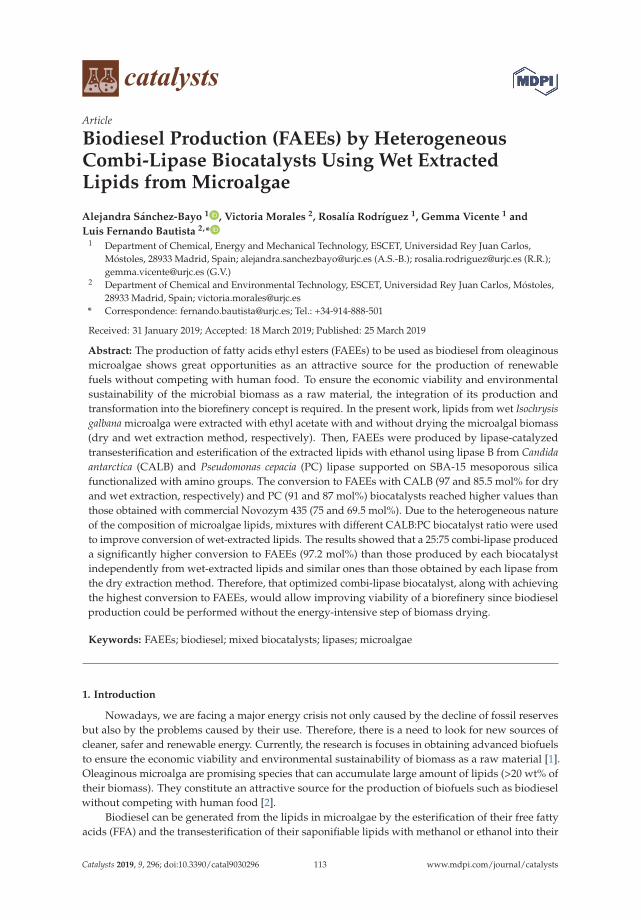
catalysts
Article
Biodiesel Production (FAEEs) by HeterogeneousCombi-Lipase Biocatalysts Using Wet ExtractedLipids from Microalgae
Alejandra Sánchez-Bayo 1 , Victoria Morales 2, Rosalía Rodríguez 1, Gemma Vicente 1 and
Luis Fernando Bautista 2,*1 Department of Chemical, Energy and Mechanical Technology, ESCET, Universidad Rey Juan Carlos,
Móstoles, 28933 Madrid, Spain; [email protected] (A.S.-B.); [email protected] (R.R.);[email protected] (G.V.)
2 Department of Chemical and Environmental Technology, ESCET, Universidad Rey Juan Carlos, Móstoles,28933 Madrid, Spain; [email protected]
* Correspondence: [email protected]; Tel.: +34-914-888-501
Received: 31 January 2019; Accepted: 18 March 2019; Published: 25 March 2019
Abstract: The production of fatty acids ethyl esters (FAEEs) to be used as biodiesel from oleaginousmicroalgae shows great opportunities as an attractive source for the production of renewablefuels without competing with human food. To ensure the economic viability and environmentalsustainability of the microbial biomass as a raw material, the integration of its production andtransformation into the biorefinery concept is required. In the present work, lipids from wet Isochrysisgalbana microalga were extracted with ethyl acetate with and without drying the microalgal biomass(dry and wet extraction method, respectively). Then, FAEEs were produced by lipase-catalyzedtransesterification and esterification of the extracted lipids with ethanol using lipase B from Candidaantarctica (CALB) and Pseudomonas cepacia (PC) lipase supported on SBA-15 mesoporous silicafunctionalized with amino groups. The conversion to FAEEs with CALB (97 and 85.5 mol% for dryand wet extraction, respectively) and PC (91 and 87 mol%) biocatalysts reached higher values thanthose obtained with commercial Novozym 435 (75 and 69.5 mol%). Due to the heterogeneous natureof the composition of microalgae lipids, mixtures with different CALB:PC biocatalyst ratio were usedto improve conversion of wet-extracted lipids. The results showed that a 25:75 combi-lipase produceda significantly higher conversion to FAEEs (97.2 mol%) than those produced by each biocatalystindependently from wet-extracted lipids and similar ones than those obtained by each lipase fromthe dry extraction method. Therefore, that optimized combi-lipase biocatalyst, along with achievingthe highest conversion to FAEEs, would allow improving viability of a biorefinery since biodieselproduction could be performed without the energy-intensive step of biomass drying.
Keywords: FAEEs; biodiesel; mixed biocatalysts; lipases; microalgae
1. Introduction
Nowadays, we are facing a major energy crisis not only caused by the decline of fossil reservesbut also by the problems caused by their use. Therefore, there is a need to look for new sources ofcleaner, safer and renewable energy. Currently, the research is focuses in obtaining advanced biofuelsto ensure the economic viability and environmental sustainability of biomass as a raw material [1].Oleaginous microalga are promising species that can accumulate large amount of lipids (>20 wt% oftheir biomass). They constitute an attractive source for the production of biofuels such as biodieselwithout competing with human food [2].
Biodiesel can be generated from the lipids in microalgae by the esterification of their free fattyacids (FFA) and the transesterification of their saponifiable lipids with methanol or ethanol into their
Catalysts 2019, 9, 296; doi:10.3390/catal9030296 www.mdpi.com/journal/catalysts113
Catalysts 2019, 9, 296
corresponding methyl or ethyl esters (FAMEs or FAEEs, respectively) in the presence of a catalyst.Due to its high content of free fatty acids in the lipids extracted from microalgae, the most commonway to carry out the biodiesel process is by using acid catalysts. This generates certain disadvantagesnot only in the process, such as high energy consumption, corrosion of materials and the difficultyof transesterifying triglycerides, but also in the post-reaction treatments, such as the recovery of thecatalyst [3]. In recent years, new catalysts based on enzymes (biocatalysts) are being developed toavoid these problems [4], achieving better selectivity and specificity. Immobilized lipases can be analternative because they are capable of carrying out the transesterification and esterification reactionsat lower temperatures energy cost, facilitating the recovery of the catalyst and the purification ofglycerol [5]. However, the main problem of biocatalysts is the presence of water in the reactionmedium that can cause the hydrolysis of esters. In addition, the use of certain solvents such asmethanol can lead to inactivation of the catalyst [6,7].
Due to the high cost of enzymes, the use of heterogeneous biocatalysts is required for the economicviability of the whole process since they can be reused. In addition, the immobilization of enzymesin solid carriers can increase thermal and chemical stability and protects enzyme molecules fromdenaturation. There are different techniques of enzymatic immobilization: binding to the support,confinement or encapsulation and cross-linking [8]. The most common technique is to bind the enzymeonto the support by covalent or ionic attachment or by physical adsorption [9]. To carry out thisimmobilization, materials such as mesoporous silicas (SBA-15, SBA-16, MCM-41, FDU-12) [4,10–13] orcarbon nanotubes [14,15] have been used. The above materials have large pores or cavities where theenzymes can be housed. However, it is usually necessary to modify the surface of support to achieve abetter anchorage by functionalization with amine, chloride, sulfur or phenol groups [10,13,16–19].
Because of the high specificity of lipases for different substrates, catalytic activity of lipasesdepends on the source organism producing the enzyme. Most of biodiesel production from microalgaloil has been done with lipases from Pseudomonas cepacia [15,20], P. fluorescens [15,21], Thermomyceslanuginosus [15,22], Candida rugosa [15,23] and C. antarctica [4,15]. The last one is frequently used inthe form of the commercial catalyst Novozym 435 [6,15,24,25]. Although most of studies reported theuse of single lipases, some authors showed that the yield of FAEE could increase when some lipasesare used in combination [5,20]. Therefore, the concept of combi-lipase biocatalysts have been recentlydeveloped to improve the biodiesel production processes [26–28]. However, these studies reportedthe lipase-catalyzed synthesis of biodiesel using vegetable oils such as palm, soybean or spent coffeegrounds, but they did not use the more complex microalgal oil as raw material for biodiesel production.
In this work, biodiesel (FAEEs) were produced using enzyme catalysis from lipids extractedwith ethyl acetate from both wet and dry biomass from microalgae. For this purpose, two enzymesfrom different origins were assessed, namely lipase B from the fungus Candida antarctica (CalB) andlipase from the bacterium Pseudomonas cepacia (PC) which were supported on amino-functionalizedSBA-15. The results were compared to those obtained with the commercial Novozym 435® catalyst.In addition, both enzymes were combined in different proportions to evaluate the synergistic activityand selectivity towards biodiesel production.
2. Results and Discussions
2.1. Characterization of the Synthesized Enzymatic Catalyst
This section contains the most relevant results of the synthesis of the mesoporous silica materialSBA-15 as well as the modifications thereof when incorporating amino groups, glutaraldehyde andthe enzymes.
The textural properties are shown in Table 1. The pore surface and diameter were reducedslightly after functionalization of the surface with amino groups and further glutaraldehyde linkageas spacer-arm to favor the subsequent binding of the enzyme. Before functionalization, pore size ofSBA-15 was 59.6 Å, and the surface area was the largest, 847.3 m2/g, and both parameters decreased to
114
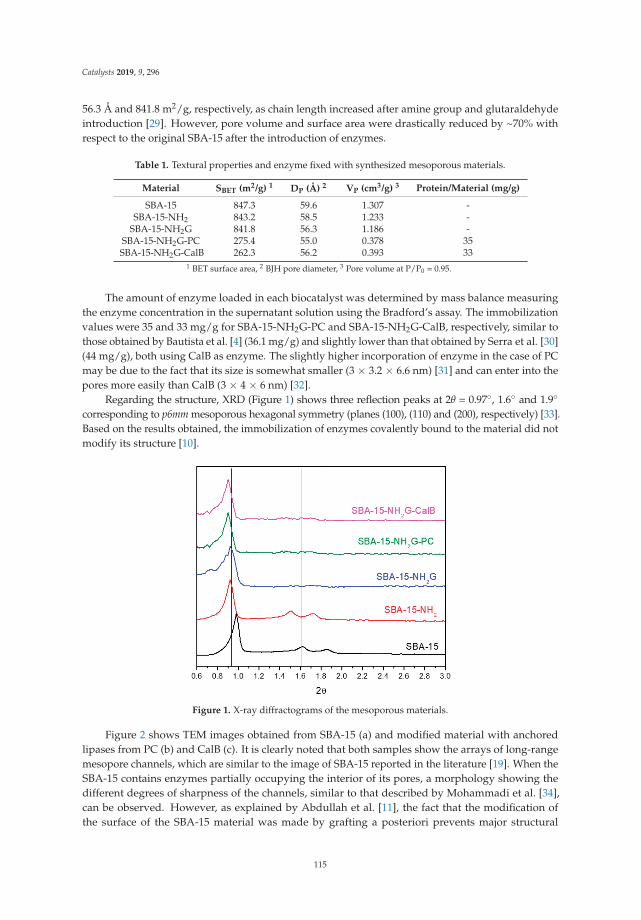
Catalysts 2019, 9, 296
56.3 Å and 841.8 m2/g, respectively, as chain length increased after amine group and glutaraldehydeintroduction [29]. However, pore volume and surface area were drastically reduced by ~70% withrespect to the original SBA-15 after the introduction of enzymes.
Table 1. Textural properties and enzyme fixed with synthesized mesoporous materials.
Material SBET (m2/g) 1 DP (Å) 2 VP (cm3/g) 3 Protein/Material (mg/g)
SBA-15 847.3 59.6 1.307 -SBA-15-NH2 843.2 58.5 1.233 -
SBA-15-NH2G 841.8 56.3 1.186 -SBA-15-NH2G-PC 275.4 55.0 0.378 35SBA-15-NH2G-CalB 262.3 56.2 0.393 33
1 BET surface area, 2 BJH pore diameter, 3 Pore volume at P/P0 = 0.95.
The amount of enzyme loaded in each biocatalyst was determined by mass balance measuringthe enzyme concentration in the supernatant solution using the Bradford’s assay. The immobilizationvalues were 35 and 33 mg/g for SBA-15-NH2G-PC and SBA-15-NH2G-CalB, respectively, similar tothose obtained by Bautista et al. [4] (36.1 mg/g) and slightly lower than that obtained by Serra et al. [30](44 mg/g), both using CalB as enzyme. The slightly higher incorporation of enzyme in the case of PCmay be due to the fact that its size is somewhat smaller (3 × 3.2 × 6.6 nm) [31] and can enter into thepores more easily than CalB (3 × 4 × 6 nm) [32].
Regarding the structure, XRD (Figure 1) shows three reflection peaks at 2θ = 0.97◦, 1.6◦ and 1.9◦
corresponding to p6mm mesoporous hexagonal symmetry (planes (100), (110) and (200), respectively) [33].Based on the results obtained, the immobilization of enzymes covalently bound to the material did notmodify its structure [10].
Figure 1. X-ray diffractograms of the mesoporous materials.
Figure 2 shows TEM images obtained from SBA-15 (a) and modified material with anchoredlipases from PC (b) and CalB (c). It is clearly noted that both samples show the arrays of long-rangemesopore channels, which are similar to the image of SBA-15 reported in the literature [19]. When theSBA-15 contains enzymes partially occupying the interior of its pores, a morphology showing thedifferent degrees of sharpness of the channels, similar to that described by Mohammadi et al. [34],can be observed. However, as explained by Abdullah et al. [11], the fact that the modification ofthe surface of the SBA-15 material was made by grafting a posteriori prevents major structural
115

Catalysts 2019, 9, 296
changes from taking place and only intervening in the formation of new links with Si-O-Si that are onthe surface.
(a)
(b) (c)
Figure 2. TEM micrographs: (a) SBA-15, (b) SBA-15-NH2G-PC, (c) SBA-15-NH2G-CalB.
The 29Si MAS-NMR spectrum (Figure 3) of pure silica shows one wide signal within the range−90 to −110 ppm that correspond to the Si(OSi)4 (Q4), HOSi(OSi)3 (Q3) and (HO)2Si(OSi)2 (Q2) sitesof the silica framework [35]. Around a displacement −60 to −78 ppm, a broad signal can be seen thatcorresponds to two signals created by the Si-C links corresponding to RSi(OSi)3 (T3) and RSi(HO)(OSi)2
(T2) [36]. These last two signals are due to the incorporation of the organic part (CH3CH2CH2NH2) bylinking on the surface of the material. The peak areas were calculated after Gaussian deconvolutionof the spectra considering the associated species and the respective intensities. The results of theintegrations (Table 2) show that the greatest contribution to the areas is given by the peak correspondingto a Si atom linked to four Si-O structures, i.e., corresponding to the Q4 signal. Overlapped with thispeak, two signals of smaller area corresponding to the formation of one or two Si-OH bonds, signalsQ3 and Q2 respectively. When the amino group was incorporated by grafting on the SBA-15 surfaceby using 3-aminopropyltriethoxysilane (APTES), the material SBA-15-NH2 was formed, showing asignificant increase in T signals (from 0% to ~10% for both T2 and T3) and a concomitant decrease inQ signals, which evidenced the formation of Si-C bonds. However, the addition of glutaraldehyde(SBA-15-NH2G) and CalB or PC lipases (SBA-15-NH2G-CalB and SBA-15-NH2G-PC, respectively) didnot modified the peak contribution of T and Q signals significantly, proving that these incorporationsare according to the immobilization scheme shown in Figure 4, where the silica framework was notaffected thereafter. These results confirm that the structure is not modified when both organic modifiersand lipases are introduced [37].
Table 2. Relative peak area in the 29Si NMR spectra.
Material Q4 (%) Q3 (%) Q2 (%) T3 (%) T2 (%)
SBA-15 83.8 13.4 2.77 - -SBA-15-NH2 66.0 10.2 3.42 10.32 10.23
SBA-15-NH2G 67.3 9.27 3.21 11.26 9.87SBA-15-NH2G-PC 68.5 7.9 2.8 10.76 9.96
SBA-15-NH2G-CalB 63.9 7.8 2.49 11.87 12.21
116
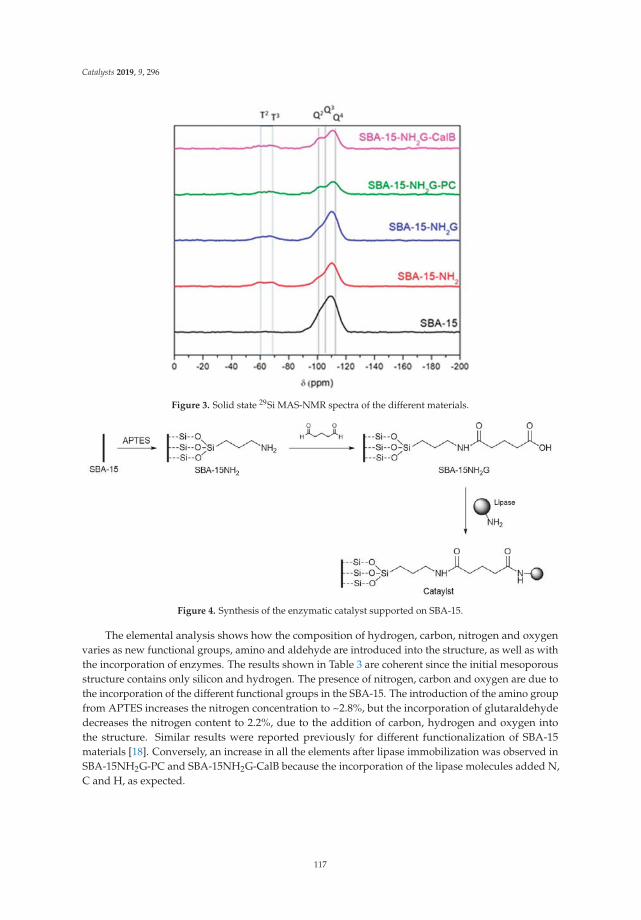
Catalysts 2019, 9, 296
Figure 3. Solid state 29Si MAS-NMR spectra of the different materials.
Figure 4. Synthesis of the enzymatic catalyst supported on SBA-15.
The elemental analysis shows how the composition of hydrogen, carbon, nitrogen and oxygenvaries as new functional groups, amino and aldehyde are introduced into the structure, as well as withthe incorporation of enzymes. The results shown in Table 3 are coherent since the initial mesoporousstructure contains only silicon and hydrogen. The presence of nitrogen, carbon and oxygen are due tothe incorporation of the different functional groups in the SBA-15. The introduction of the amino groupfrom APTES increases the nitrogen concentration to ~2.8%, but the incorporation of glutaraldehydedecreases the nitrogen content to 2.2%, due to the addition of carbon, hydrogen and oxygen intothe structure. Similar results were reported previously for different functionalization of SBA-15materials [18]. Conversely, an increase in all the elements after lipase immobilization was observed inSBA-15NH2G-PC and SBA-15NH2G-CalB because the incorporation of the lipase molecules added N,C and H, as expected.
117
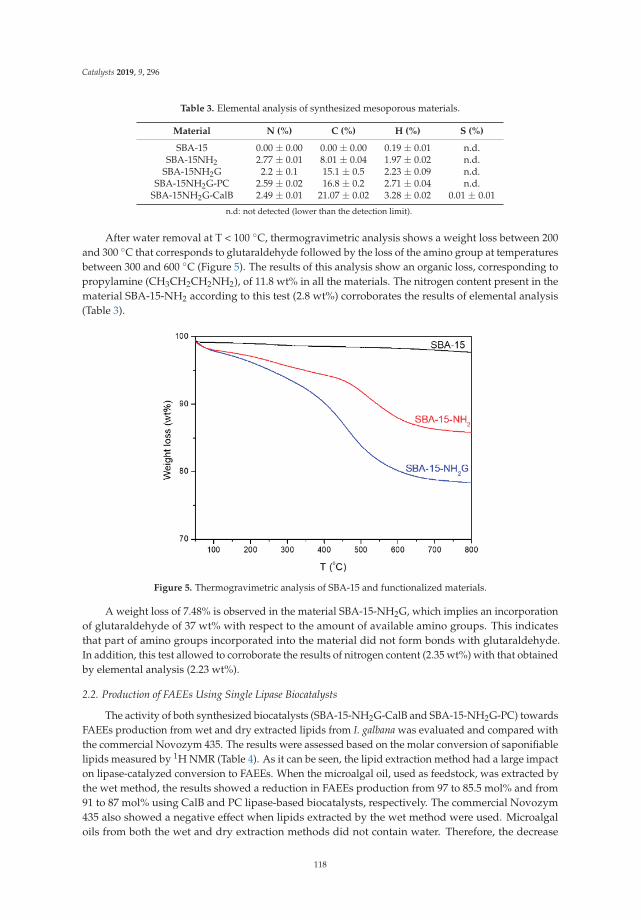
Catalysts 2019, 9, 296
Table 3. Elemental analysis of synthesized mesoporous materials.
Material N (%) C (%) H (%) S (%)
SBA-15 0.00 ± 0.00 0.00 ± 0.00 0.19 ± 0.01 n.d.SBA-15NH2 2.77 ± 0.01 8.01 ± 0.04 1.97 ± 0.02 n.d.
SBA-15NH2G 2.2 ± 0.1 15.1 ± 0.5 2.23 ± 0.09 n.d.SBA-15NH2G-PC 2.59 ± 0.02 16.8 ± 0.2 2.71 ± 0.04 n.d.
SBA-15NH2G-CalB 2.49 ± 0.01 21.07 ± 0.02 3.28 ± 0.02 0.01 ± 0.01
n.d: not detected (lower than the detection limit).
After water removal at T < 100 ◦C, thermogravimetric analysis shows a weight loss between 200and 300 ◦C that corresponds to glutaraldehyde followed by the loss of the amino group at temperaturesbetween 300 and 600 ◦C (Figure 5). The results of this analysis show an organic loss, corresponding topropylamine (CH3CH2CH2NH2), of 11.8 wt% in all the materials. The nitrogen content present in thematerial SBA-15-NH2 according to this test (2.8 wt%) corroborates the results of elemental analysis(Table 3).
Figure 5. Thermogravimetric analysis of SBA-15 and functionalized materials.
A weight loss of 7.48% is observed in the material SBA-15-NH2G, which implies an incorporationof glutaraldehyde of 37 wt% with respect to the amount of available amino groups. This indicatesthat part of amino groups incorporated into the material did not form bonds with glutaraldehyde.In addition, this test allowed to corroborate the results of nitrogen content (2.35 wt%) with that obtainedby elemental analysis (2.23 wt%).
2.2. Production of FAEEs Using Single Lipase Biocatalysts
The activity of both synthesized biocatalysts (SBA-15-NH2G-CalB and SBA-15-NH2G-PC) towardsFAEEs production from wet and dry extracted lipids from I. galbana was evaluated and compared withthe commercial Novozym 435. The results were assessed based on the molar conversion of saponifiablelipids measured by 1H NMR (Table 4). As it can be seen, the lipid extraction method had a large impacton lipase-catalyzed conversion to FAEEs. When the microalgal oil, used as feedstock, was extracted bythe wet method, the results showed a reduction in FAEEs production from 97 to 85.5 mol% and from91 to 87 mol% using CalB and PC lipase-based biocatalysts, respectively. The commercial Novozym435 also showed a negative effect when lipids extracted by the wet method were used. Microalgaloils from both the wet and dry extraction methods did not contain water. Therefore, the decrease
118
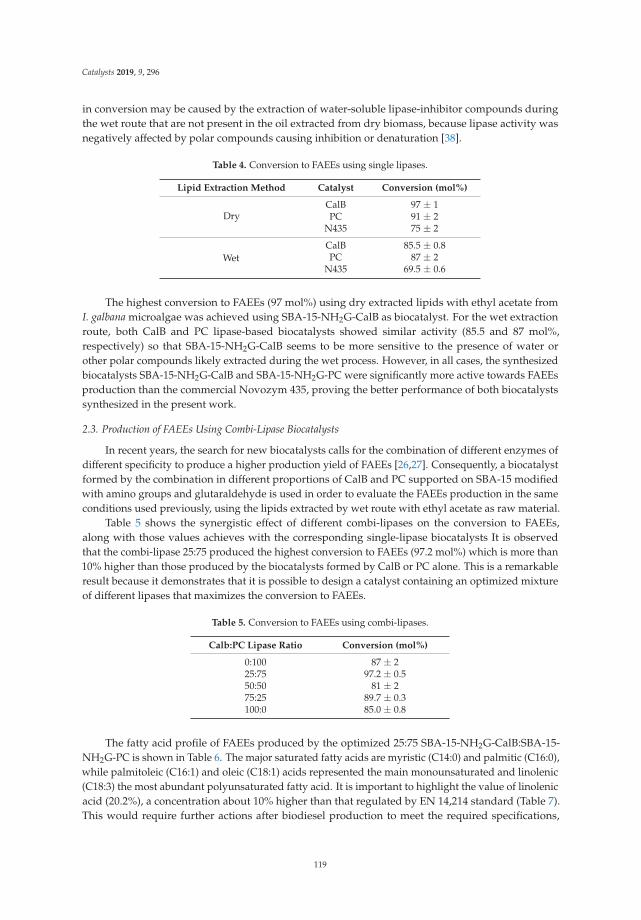
Catalysts 2019, 9, 296
in conversion may be caused by the extraction of water-soluble lipase-inhibitor compounds duringthe wet route that are not present in the oil extracted from dry biomass, because lipase activity wasnegatively affected by polar compounds causing inhibition or denaturation [38].
Table 4. Conversion to FAEEs using single lipases.
Lipid Extraction Method Catalyst Conversion (mol%)
DryCalB 97 ± 1PC 91 ± 2
N435 75 ± 2
WetCalB 85.5 ± 0.8PC 87 ± 2
N435 69.5 ± 0.6
The highest conversion to FAEEs (97 mol%) using dry extracted lipids with ethyl acetate fromI. galbana microalgae was achieved using SBA-15-NH2G-CalB as biocatalyst. For the wet extractionroute, both CalB and PC lipase-based biocatalysts showed similar activity (85.5 and 87 mol%,respectively) so that SBA-15-NH2G-CalB seems to be more sensitive to the presence of water orother polar compounds likely extracted during the wet process. However, in all cases, the synthesizedbiocatalysts SBA-15-NH2G-CalB and SBA-15-NH2G-PC were significantly more active towards FAEEsproduction than the commercial Novozym 435, proving the better performance of both biocatalystssynthesized in the present work.
2.3. Production of FAEEs Using Combi-Lipase Biocatalysts
In recent years, the search for new biocatalysts calls for the combination of different enzymes ofdifferent specificity to produce a higher production yield of FAEEs [26,27]. Consequently, a biocatalystformed by the combination in different proportions of CalB and PC supported on SBA-15 modifiedwith amino groups and glutaraldehyde is used in order to evaluate the FAEEs production in the sameconditions used previously, using the lipids extracted by wet route with ethyl acetate as raw material.
Table 5 shows the synergistic effect of different combi-lipases on the conversion to FAEEs,along with those values achieves with the corresponding single-lipase biocatalysts It is observedthat the combi-lipase 25:75 produced the highest conversion to FAEEs (97.2 mol%) which is more than10% higher than those produced by the biocatalysts formed by CalB or PC alone. This is a remarkableresult because it demonstrates that it is possible to design a catalyst containing an optimized mixtureof different lipases that maximizes the conversion to FAEEs.
Table 5. Conversion to FAEEs using combi-lipases.
Calb:PC Lipase Ratio Conversion (mol%)
0:100 87 ± 225:75 97.2 ± 0.550:50 81 ± 275:25 89.7 ± 0.3100:0 85.0 ± 0.8
The fatty acid profile of FAEEs produced by the optimized 25:75 SBA-15-NH2G-CalB:SBA-15-NH2G-PC is shown in Table 6. The major saturated fatty acids are myristic (C14:0) and palmitic (C16:0),while palmitoleic (C16:1) and oleic (C18:1) acids represented the main monounsaturated and linolenic(C18:3) the most abundant polyunsaturated fatty acid. It is important to highlight the value of linolenicacid (20.2%), a concentration about 10% higher than that regulated by EN 14,214 standard (Table 7).This would require further actions after biodiesel production to meet the required specifications,
119
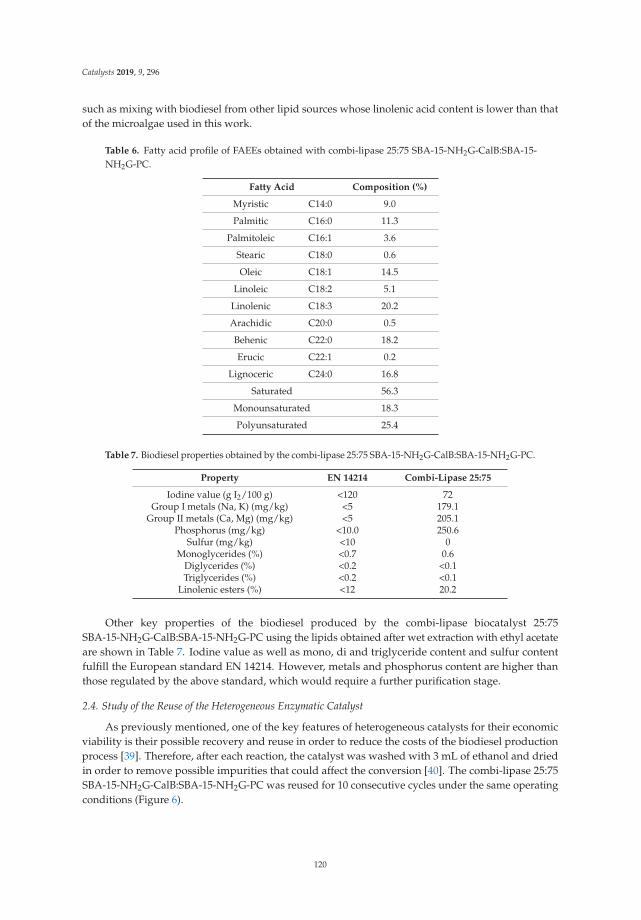
Catalysts 2019, 9, 296
such as mixing with biodiesel from other lipid sources whose linolenic acid content is lower than thatof the microalgae used in this work.
Table 6. Fatty acid profile of FAEEs obtained with combi-lipase 25:75 SBA-15-NH2G-CalB:SBA-15-NH2G-PC.
Fatty Acid Composition (%)
Myristic C14:0 9.0
Palmitic C16:0 11.3
Palmitoleic C16:1 3.6
Stearic C18:0 0.6
Oleic C18:1 14.5
Linoleic C18:2 5.1
Linolenic C18:3 20.2
Arachidic C20:0 0.5
Behenic C22:0 18.2
Erucic C22:1 0.2
Lignoceric C24:0 16.8
Saturated 56.3
Monounsaturated 18.3
Polyunsaturated 25.4
Table 7. Biodiesel properties obtained by the combi-lipase 25:75 SBA-15-NH2G-CalB:SBA-15-NH2G-PC.
Property EN 14214 Combi-Lipase 25:75
Iodine value (g I2/100 g) <120 72Group I metals (Na, K) (mg/kg) <5 179.1
Group II metals (Ca, Mg) (mg/kg) <5 205.1Phosphorus (mg/kg) <10.0 250.6
Sulfur (mg/kg) <10 0Monoglycerides (%) <0.7 0.6
Diglycerides (%) <0.2 <0.1Triglycerides (%) <0.2 <0.1
Linolenic esters (%) <12 20.2
Other key properties of the biodiesel produced by the combi-lipase biocatalyst 25:75SBA-15-NH2G-CalB:SBA-15-NH2G-PC using the lipids obtained after wet extraction with ethyl acetateare shown in Table 7. Iodine value as well as mono, di and triglyceride content and sulfur contentfulfill the European standard EN 14214. However, metals and phosphorus content are higher thanthose regulated by the above standard, which would require a further purification stage.
2.4. Study of the Reuse of the Heterogeneous Enzymatic Catalyst
As previously mentioned, one of the key features of heterogeneous catalysts for their economicviability is their possible recovery and reuse in order to reduce the costs of the biodiesel productionprocess [39]. Therefore, after each reaction, the catalyst was washed with 3 mL of ethanol and driedin order to remove possible impurities that could affect the conversion [40]. The combi-lipase 25:75SBA-15-NH2G-CalB:SBA-15-NH2G-PC was reused for 10 consecutive cycles under the same operatingconditions (Figure 6).
120

Catalysts 2019, 9, 296
Figure 6. Reuse of combi-lipase 25:75 SBA-15-NH2G-CalB:SBA-15-NH2G-PC.
The results showed that the conversion was above 80 mol% during the first five cycles, decreasingby 10% with respect to the first reaction. Subsequently, the conversion gradually decreased, reachinga conversion of around 70 mol% after the tenth reuse These results are comparable although betterthan others reported in the literature for the lipase from P. cepacia where after the first use, 10% of theactivity was lost and in the fourth cycle the activity was reduced by 53% [41]. This loss of activity canbe caused by a possible deterioration of the biocatalyst by enzyme poisoning [42].
3. Materials and Methods
3.1. Microalga
The microalga used in this work was Isochrysis galbana and it was supplied by AlgaEnergy S.A.(Madrid, Spain). This strain has been selected due to its high lipid content (33.5 wt%), which makes itfavorable for the production of FAEEs.
3.2. Lipid Extraction
The extraction of lipids from the microalga, in the dry biomass procedure, was carried out with adry microalga:solvent ratio of 1:20, using ethyl acetate as solvent. The samples were stirred vigorouslywith the help of a vortex (Finepcr, Gunpo-si, South Korea) for 5 min at 11,000 rpm at room temperatureto obtain the lipids contained in the microalgae. In the case of the extraction of lipids from wetbiomass, the same procedure was carried out starting from a suspension of microalga in water with aconcentration of 50 g/L. Lipid yields using ethyl acetate were 17.9 ± 0.7 wt% and 17.6 ± 0.1 wt% fromdry and wet microalgal biomass, respectively.
3.3. Synthesis of Lipase-Based Biocatalysts
The production of FAEEs was carried out using lipase B from Candida antarctica (CalB) and lipasefrom Pseudomonas cepacia (PC), both from Sigma-Aldrich (St. Louis, MO, USA), supported on SBA-15modified with amino groups and glutaraldehyde following protocols previously described [43–45](Figure 4).
In a typical synthesis for SBA-15, 8 g of block copolymer surfactant Pluronic 123 (Sigma-Aldrich.St. Louis, MO, USA) were dissolved at room temperature under stirring in 250 mL of 1.9 M HCl
121
Catalysts 2019, 9, 296
(Scharlab. Barcelona, Spain). The solution was heated up to 40 ◦C and 17.8 g of TEOS (tetraethylorthosilicate, Sigma-Aldrich) were added to the solution. The resultant mixture was then stirred at thattemperature for 20 h and hydrothermally aged at 110 ◦C for further 24 h. The template was removedby calcination at 550 ◦C for 5 h at a heating rate of 1.8 ◦C/min [44].
The protocol for covalent immobilization of lipases (Figure 4) was adapted from Wang’sprocedure [36]. Thus, 2 g of calcined mesoporous material SBA-15 were immersed into a solutionof 1 g of APTES (3-aminopropyltriethoxysilane, Sigma-Aldrich) in 30 mL of anhydrous toluene(Sigma-Aldrich). The mixture was refluxed at 110 ◦C for 24 h under inert nitrogen atmosphere. Then,the suspension was filtered and washed three times with anhydrous toluene. The solid was placed inglass vials and vacuum dried for 24 h at 110 ◦C, yielding the amine-functionalized support namedSBA-15-NH2. Then, 1 g of SBA-15-NH2 was blended with 1 mL of 25 vol% aqueous glutaraldehyde(Sigma-Aldrich) and 9 mL of 0.1 M phosphate buffer (Sigma-Aldrich. St. Louis, MO, USA) for 2 h.The solid material (SBA-15-NH2G) was filtered and washed with phosphate buffer.
The functionalized materials were used as carriers for lipase immobilization. 100 mg ofamino-functionalized and glutaraldehyde linked mesoporous material was blended with 1 mL of a2.5 mg/mL stock solution of lipase in 4 mL of 0.1 M phosphate buffer at pH = 7.0 and the mixturewas shaken at 200 rpm and 25 ◦C for 3 h. Then, the material was filtered and washed three timeswith 5 mL phosphate buffer. The final biocatalysts produced were named as SBA-15-NH2G-CalB andSBA-15-NH2G-PC, containing immobilized CalB and PC lipase, respectively.
3.4. Characterization of Biocatalysts
The evaluation of the textural properties of SBA-15 mesoporous materials was performed by N2
adsorption/desorption isotherms in a Tristar model 3000 equipment (Micromeritics, Norcross, GA,USA). Prior to the analysis, a degasification stage is carried out based on the controlled heatingof the samples up to 250 ◦C and 120 ◦C for inorganic and organically functionalized samples,respectively, and the use of a nitrogen flow in a SmartPrep type degasser. The specific surfacearea was calculated by the Brunauer-Emmett-Teller (BET) method, the pore diameter was measuredthrough the Barret-Joyner-Halenda technique (BJH) and pore volume was determined by using theHarkins-Jura technique.
X-ray diffraction experiments were performed in a X’Pert MPD (Philips, Amsterdam,The Netherlands) using monochromatic Cu Kα radiation, with a wavelength of 1.54 Å. The stepsize was 0.02◦ with an accumulation time per step of 5 s for a sweep of angles 2θ of 5–50◦.
Transmission electron microscopy (TEM) analysis was performed with a Tecnai 20 microscope(Philips, Amsterdam, The Netherlands) with a resolution of 0.27 nm and ±70◦ inclination of thesample, equipped with an EDX detector.
29Si NMR spectroscopy allow to determine the relationship between condensed andnon-condensed silicon species, obtaining structural information about the mesoporous siliceousmaterial [37]. Solid-state 29Si MAS-NMR experiments were performed on a Bruker Avance III/HD 400MHz spectrometer fitted with a 9.4 T magnetic field. These nuclei resonate at 79.41 MHz. An H/X7.5 mm MAS probe and ZrO2 rotors spinning at 6 kHz were used. In addition, to allow an accuratequantification of silicon groups, 29Si MAS-NMR spectra using one pulse with spinal-64 1H decouplingwere obtained. The 29Si experiments were performed for 500 scans, π/2 pulse of 4.0 μs, and 60 s ofrepetition time. 29Si chemical shifts were externally referenced to tetramethylsilane.
The content of hydrogen, carbon, nitrogen, sulfur and oxygen was measured in a Vario EL IIIelement analyzer (Elementar Analysensysteme GmbH, Langenselbold, Germany) using sulphanilicacid as standard.
To evaluate the thermal stability of the SBA-15 materials, thermogravimetric analysis (TGA)were carried out under inert atmosphere (nitrogen) in an 1100 TGA/DSC1 model (Mettler Toledo.Columbus, OH, USA). The thermal analysis ranged from 40 ◦C to 800 ◦C with a ramp of 10 ◦C/min.
122
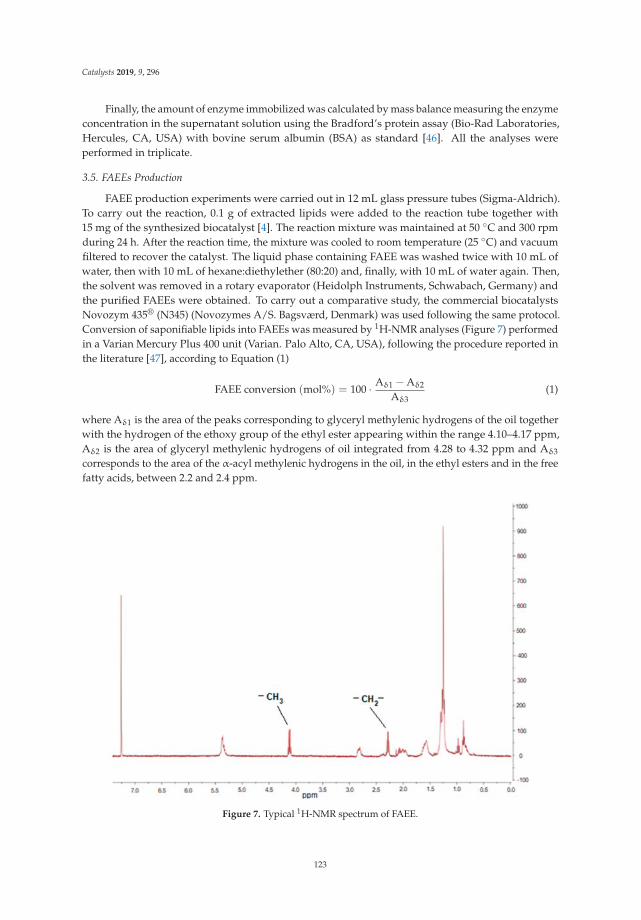
Catalysts 2019, 9, 296
Finally, the amount of enzyme immobilized was calculated by mass balance measuring the enzymeconcentration in the supernatant solution using the Bradford’s protein assay (Bio-Rad Laboratories,Hercules, CA, USA) with bovine serum albumin (BSA) as standard [46]. All the analyses wereperformed in triplicate.
3.5. FAEEs Production
FAEE production experiments were carried out in 12 mL glass pressure tubes (Sigma-Aldrich).To carry out the reaction, 0.1 g of extracted lipids were added to the reaction tube together with15 mg of the synthesized biocatalyst [4]. The reaction mixture was maintained at 50 ◦C and 300 rpmduring 24 h. After the reaction time, the mixture was cooled to room temperature (25 ◦C) and vacuumfiltered to recover the catalyst. The liquid phase containing FAEE was washed twice with 10 mL ofwater, then with 10 mL of hexane:diethylether (80:20) and, finally, with 10 mL of water again. Then,the solvent was removed in a rotary evaporator (Heidolph Instruments, Schwabach, Germany) andthe purified FAEEs were obtained. To carry out a comparative study, the commercial biocatalystsNovozym 435® (N345) (Novozymes A/S. Bagsværd, Denmark) was used following the same protocol.Conversion of saponifiable lipids into FAEEs was measured by 1H-NMR analyses (Figure 7) performedin a Varian Mercury Plus 400 unit (Varian. Palo Alto, CA, USA), following the procedure reported inthe literature [47], according to Equation (1)
FAEE conversion (mol%) = 100 · Aδ1 − Aδ2
Aδ3(1)
where Aδ1 is the area of the peaks corresponding to glyceryl methylenic hydrogens of the oil togetherwith the hydrogen of the ethoxy group of the ethyl ester appearing within the range 4.10–4.17 ppm,Aδ2 is the area of glyceryl methylenic hydrogens of oil integrated from 4.28 to 4.32 ppm and Aδ3
corresponds to the area of the α-acyl methylenic hydrogens in the oil, in the ethyl esters and in the freefatty acids, between 2.2 and 2.4 ppm.
Figure 7. Typical 1H-NMR spectrum of FAEE.
123
Catalysts 2019, 9, 296
FAEE production reactions were also carried out using combi-lipase biocatalysts with thefollowing SBA15-NH2G-CalB:SBA15-NH2G-PC ratios: 25:75, 50:50 and 75:25 wt%. Finally, successivereactions were carried out under the same conditions to assess the reuse capacity.
3.6. FAEE Characterization
The characteristics of the FAEE to be used as biodiesel must be according to EN 14,214 standard,in which the protocol for determining the iodine value of the biodiesel obtained is included. In addition,the content of mono-, di- and triglycerides was determined by thin layer chromatography (TLC)following the method described by Vicente et al. [2], where the sample was diluted with hexane.The TLC plate was developed, stained with iodine and digitized. The software Un-Scan-It Gel 6.1(Silk Scientific Inc., Orem, UT, USA) was used for the quantification of each lipid fraction using thecorresponding standards. The non-saponifiable extracted matter was determined by a gravimetricprocedure described elsewhere [48].
Fatty acid profile of FAEE was performed by gas chromatography in a CP-3900 gas chromatograph(Varian) fitted with flame ionization detector and a TRB-FFAP capillary column (60 m length, 0.32 mmI.D., 0.25 μm film thickness. Teknokroma, Barcelona, Spain) following EN 14,103 standard.
The sulfur content was measured by elemental analysis in a Vario EL III elemental analyzer andmetals were determined by inductively coupled plasma atomic emission spectroscopy in a Vista AXCCD simultaneous ICP-AES equipment coupled to a spectrophotometer (Varian. Palo Alto, CA, USA)following EN 14,538 (for Na, K, Ca and Mg) and EN 14,107 (for P) standards, respectively.
4. Conclusions
Lipids from Isochrysis galbana extracted with ethyl acetate using both dry and wet biomass wereused to produce biodiesel (FAEEs) with heterogeneous lipase-based biocatalysts. Lipase B fromCandida antarctica (CalB) and lipase from Pseudomonas cepacia (PC) were covalently immobilized onamino-functionalized SBA-15. Their catalytic activity was compared to that of the commercial catalystNovozym 435. The conversion to FAEEs using the synthesized biocatalysts SBA-15-NH2G-CalB (97and 85.5 mol% from dry and wet extraction, respectively) and SBA-15-NH2G-PC (91 and 87 mol%)resulted in higher conversions for both dry and wet ones than those obtained with the commercialcatalyst Novozym 435 (75 and 69.5 mol%, respectively). Due to the heterogeneous nature of the lipidcomposition of the microalgae, mixtures with different proportions of CALB:PC biocatalysts were usedto improve the conversion of wet extracted lipids. The results showed that a combi-lipase biocatalyst25:75 SBA-15-NH2G-CalB:SBA-15-NH2G-PC produced a conversion of FAEE (97.2 mol%) significantlyhigher than those from wet extracted oil by biocatalysts containing a single lipase and similar to themaximum conversion using oils from wet extraction. Therefore, the combi-lipase presented can help toimprove the viability of a microalgal biorefinery since the biomass-drying step for biodiesel productioncan be avoided.
Author Contributions: A.S.-B. performed the experimental work (synthesis of biocatalysts, catalytic experimentsand sample characterization) and made a first draft of the manuscript. V.M. and R.R. analyzed and discussed theresults of biocatalysts characterization and V.M. collaborated in the writing of the first draft of the manuscript.L.F.B. and G.V. devised the experimental work, analyzed the catalytic tests and wrote the final version of themanuscript. The listed authors have contributed substantially to this work.
Funding: The authors acknowledge the support from INSPIRA1 project (S2013/ABI-2783) financed byComunidad de Madrid and co-financed by FEDER “A way of making Europe”; and BIOHIDROALGA project(ENE2017-83696-R) financed by Ministerio de Ciencia, Innovación y Universidades and co-financed by FEDER “Away of making Europe”.
Conflicts of Interest: The authors declare no conflict of interest.
124
Catalysts 2019, 9, 296
References
1. Demirbas, A. Political, Economic and Environmental Impacts of Biofuels: A Review. Appl. Energy 2009, 86,S108–S117. [CrossRef]
2. Vicente, G.; Bautista, L.F.; Rodríguez, R.; Gutiérrez, F.J.; Sádaba, I.; Ruiz-Vázquez, R.M.; Torres-Martínez, S.;Garre, V. Biodiesel Production from Biomass of an Oleaginous Fungus. Biochem. Eng. J. 2009, 48, 22–27.[CrossRef]
3. Carrero, A.; Vicente, G.; Rodríguez, R.; del Peso, G.L.; Santos, C. Synthesis of Fatty Acids Methyl Esters(FAMEs) from Nannochloropsis gaditana Microalga Using Heterogeneous Acid Catalysts. Biochem. Eng. J.2015, 97, 119–124. [CrossRef]
4. Bautista, L.F.; Vicente, G.; Mendoza, Á.; González, S.; Morales, V. Enzymatic Production of Biodiesel fromNannochloropsis gaditana Microalgae Using Immobilized Lipases in Mesoporous Materials. Energy Fuels 2015,29, 4981–4989. [CrossRef]
5. Guldhe, A.; Singh, B.; Mutanda, T.; Permaul, K.; Bux, F. Advances in Synthesis of Biodiesel via EnzymeCatalysis: Novel and Sustainable Approaches. Renew. Sustain. Energy Rev. 2015, 41, 1447–1464. [CrossRef]
6. Navarro López, E.; Robles Medina, A.; Esteban Cerdán, L.; González Moreno, P.A.; Macías Sánchez, M.D.;Molina Grima, E. Fatty Acid Methyl Ester Production from Wet Microalgal Biomass by Lipase-CatalyzedDirect Transesterification. Biomass Bioenergy 2016, 93, 6–12. [CrossRef]
7. Park, J.-Y.; Park, M.S.; Lee, Y.-C. Advances in Direct Transesterification of Algal Oils from Wet Biomass.Bioresour. Technol. 2015, 184, 267–275. [CrossRef] [PubMed]
8. Dalla-Vecchia, R.; Nascimento, M.D.G.; Soldi, V. Aplicações Sintéticas de Lipases Imobilizadas Em Polímeros.Quim. Nova 2004, 27, 623–630. [CrossRef]
9. Hanefeld, U.; Gardossi, L.; Magner, E. Understanding Enzyme Immobilisation. Chem. Soc. Rev. 2009, 38,453–468. [CrossRef]
10. Rios, N.S.; Pinheiro, M.P.; dos Santos, J.C.S.; de S. Fonseca, T.; Lima, L.D.; de Mattos, M.C.; Freire, D.M.G.;da Silva, I.J.; Rodríguez-Aguado, E.; Gonçalves, L.R.B. Strategies of Covalent Immobilization of aRecombinant Candida antarctica Lipase B on Pore-Expanded SBA-15 and Its Application in the KineticResolution of (R,S)-Phenylethyl Acetate. J. Mol. Catal. B Enzym. 2016, 133, 246–258. [CrossRef]
11. Abdullah, A.Z.Z.; Sulaiman, N.S.S.; Kamaruddin, A.H.H. Biocatalytic Esterification of Citronellol withLauric Acid by Immobilized Lipase on Aminopropyl-Grafted Mesoporous SBA-15. Biochem. Eng. J. 2009, 44,263–270. [CrossRef]
12. Canilho, N.; Jacoby, J.; Pasc, A.; Carteret, C.; Dupire, F.; Stébé, M.J.; Blin, J.L. Isocyanate-Mediated CovalentImmobilization of Mucor miehei Lipase onto SBA-15 for Transesterification Reaction. Colloids Surf. B Biointerfaces2013, 112, 139–145. [CrossRef]
13. Zhou, Z.; Piepenbreier, F.; Marthala, V.R.R.; Karbacher, K.; Hartmann, M. Immobilization of Lipase inCage-Type Mesoporous Organosilicas via Covalent Bonding and Crosslinking. Catal. Today 2015, 243,173–183. [CrossRef]
14. Zniszczoł, A.; Herman, A.P.; Szymanska, K.; Mrowiec-Białon, J.; Walczak, K.Z.; Jarzebski, A.; Boncel, S.Covalently Immobilized Lipase on Aminoalkyl-, Carboxy- and Hydroxy-Multi-Wall Carbon Nanotubes inthe Enantioselective Synthesis of Solketal Esters. Enzym. Microb. Technol. 2016, 87–88, 61–69. [CrossRef]
15. Dhawane, S.H.; Kumar, T.; Halder, G. Recent Advancement and Prospective of Heterogeneous CarbonaceousCatalysts in Chemical and Enzymatic Transformation of Biodiesel. Energy Convers. Manag. 2018, 167, 176–202.[CrossRef]
16. Rios, N.S.; Pinheiro, M.P.; Lima, M.L.B.; Freire, D.M.G.; da Silva, I.J.; Rodríguez-Castellón, E.;de Sant’Ana, H.B.; Macedo, A.C.; Gonçalves, L.R.B. Pore-Expanded SBA-15 for the Immobilization of aRecombinant Candida antarctica Lipase B: Application in Esterification and Hydrolysis as Model Reactions.Chem. Eng. Res. Des. 2018, 129, 12–24. [CrossRef]
17. Ashjari, M.; Mohammadi, M.; Badri, R. Selective Concentration of Eicosapentaenoic Acid andDocosahexaenoic Acid from Fish Oil with Immobilized/Stabilized Preparations of Rhizopus oryzae Lipase.J. Mol. Catal. B Enzym. 2015, 122, 147–155. [CrossRef]
18. Lee, J.S.; Yim, J.H.; Jeon, J.K.; Ko, Y.S. Polymerization of Olefins with Single-Site Catalyst Anchored onAmine-Functionalized Surface of SBA-15. Catal. Today 2012, 185, 175–182. [CrossRef]
125
Catalysts 2019, 9, 296
19. Yiu, H.H.P.; Wright, P.A.; Botting, N.P. Enzyme Immobilisation Using SBA-15 Mesoporous Molecular Sieveswith Functionalised Surfaces. J. Mol. Catal. Enzym. 2001, 15, 81–92. [CrossRef]
20. Tongboriboon, K.; Cheirsilp, B.; H-Kittikun, A. Mixed Lipases for Efficient Enzymatic Synthesis of Biodieselfrom Used Palm Oil and Ethanol in a Solvent-Free System. J. Mol. Catal. B Enzym. 2010, 67, 52–59. [CrossRef]
21. Guldhe, A.; Singh, B.; Rawat, I.; Permaul, K.; Bux, F. Biocatalytic Conversion of Lipids from MicroalgaeScenedesmus obliquus to Biodiesel Using Pseudomonas fluorescens Lipase. Fuel 2015, 147, 117–124. [CrossRef]
22. He, Y.; Wu, T.; Wang, X.; Chen, B.; Chen, F. Cost-Effective Biodiesel Production from Wet Microalgal Biomassby a Novel Two-Step Enzymatic Process. Bioresour. Technol. 2018, 268, 583–591. [CrossRef]
23. Guldhe, A.; Singh, P.; Renuka, N.; Bux, F. Biodiesel Synthesis from Wastewater Grown Microalgal FeedstockUsing Enzymatic Conversion: A Greener Approach. Fuel 2019, 237, 1112–1118. [CrossRef]
24. Bauer, G.; Lima, S.; Chenevard, J.; Sugnaux, M.; Fischer, F. Biodiesel via in Situ Wet MicroalgaeBiotransformation: Zwitter-Type Ionic Liquid Supported Extraction and Transesterification. ACS Sustain.Chem. Eng. 2017, 5, 1391–1937. [CrossRef]
25. Castillo López, B.; Esteban Cerdán, L.; Robles Medina, A.; Navarro López, E.; Martín Valverde, L.;Hita Peña, E.; González Moreno, P.A.; Molina Grima, E. Production of Biodiesel from Vegetable Oil andMicroalgae by Fatty Acid Extraction and Enzymatic Esterification. J. Biosci. Bioeng. 2015, 119, 706–711.[CrossRef]
26. Banerjee, A.; Singh, V.; Solanki, K.; Mukherjee, J.; Gupta, M. Combi-Protein Coated Microcrystals of Lipasesfor Production of Biodiesel from Oil from Spent Coffee Grounds. Sustain. Chem. Process. 2013, 1, 1–14.[CrossRef]
27. Alves, J.S.; Vieira, N.S.; Cunha, A.S.; Silva, A.M.; Záchia Ayub, M.A.; Fernandez-Lafuente, R.; Rodrigues, R.C.Combi-Lipase for Heterogeneous Substrates: A New Approach for Hydrolysis of Soybean Oil Using Mixturesof Biocatalysts. RSC Adv. 2014, 4, 6863–6868. [CrossRef]
28. Bajaj, A.; Lohan, P.; Jha, P.N.; Mehrotra, R. Biodiesel Production through Lipase Catalyzed Transesterification:An Overview. J. Mol. Catal. B Enzym. 2010, 62, 9–14. [CrossRef]
29. Lee, H.W.; Cho, H.J.; Yim, J.H.; Kim, J.M.; Jeon, J.K.; Sohn, J.M.; Yoo, K.S.; Kim, S.S.; Park, Y.K. Removal ofCu(II)-Ion over Amine-Functionalized Mesoporous Silica Materials. J. Ind. Eng. Chem. 2011, 17, 504–509.[CrossRef]
30. Serra, E.; Mayoral, Á.; Sakamoto, Y.; Blanco, R.M.; Díaz, I. Immobilization of Lipase in Ordered MesoporousMaterials: Effect of Textural and Structural Parameters. Microporous Mesoporous Mater. 2008, 114, 201–213.[CrossRef]
31. Sun, Q.; Fu, C.W.; Aguila, B.; Perman, J.; Wang, S.; Huang, H.Y.; Xiao, F.S.; Ma, S. Pore Environment Controland Enhanced Performance of Enzymes Infiltrated in Covalent Organic Frameworks. J. Am. Chem. Soc. 2018,140, 984–992. [CrossRef] [PubMed]
32. Rabbani, G.; Ahmad, E.; Khan, M.V.; Ashraf, M.T.; Bhat, R.; Khan, R.H. Impact of Structural Stability ofCold Adapted Candida antarctica Lipase B (CaLB): In Relation to PH, Chemical and Thermal Denaturation.RSC Adv. 2015, 5, 20115–20131. [CrossRef]
33. Gómez-Orozco, S.Y.; Huirache-Acuña, R.; Pawelec, B.; Fierro, J.L.G.; Rivera-Muñoz, E.M.; Lara-Romero, J.;Alonso-Nuñez, G. Characterizations and HDS Performances of Sulfided NiMoW Catalysts Supported onMesoporous Titania-Modified SBA-15. Catal. Today 2018, 305, 152–161. [CrossRef]
34. Mohammadi, M.; Habibi, Z.; Gandomkar, S.; Yousefi, M. A Novel Approach for Bioconjugation of Rhizomucormiehei Lipase (RML) onto Amine-Functionalized Supports; Application for Enantioselective Resolution ofRac-Ibuprofen. Int. J. Biol. Macromol. 2018, 67, 139–146. [CrossRef] [PubMed]
35. Zhao, X.S.; Lu, G.Q.; Whittaker, A.K.; Millar, G.J.; Zhu, H.Y. Comprehensive Study of Surface Chemistry ofMCM-41 Using 29Si CP/MAS NMR, FTIR, Pyridine-TPD, and TGA. J. Phys. Chem. B 1997, 33, 6525–6531.[CrossRef]
36. Wang, C.; Zhou, G.; Li, Y.-J.; Lu, N.; Song, H.; Zhang, L. Biocatalytic Esterification of Caprylic Acid withCaprylic Alcohol by Immobilized Lipase on Amino-Functionalized Mesoporous Silica. Colloids Surfaces APhysicochem. Eng. Asp. 2012, 406, 75–83. [CrossRef]
37. Simonutti, R.; Comotti, A.; Bracco, S.; Sozzani, P. Surfactant Organization in MCM-41 Mesoporous MaterialsAs Studied by 13C and 29Si Solid-State NMR. Chem. Mater. 2001, 13, 771–777. [CrossRef]
38. Guncheva, M.; Yancheva, D.; Ossowicz, P.; Janus, E. Structural Basis for the Inactivation of Candida RugosaLipase in the Presence of Amino Acid Ionic Liquids. Bulg. Chem. Commun. 2017, 49, 132–136.
126

Catalysts 2019, 9, 296
39. Amini, Z.; Ilham, Z.; Ong, H.C.; Mazaheri, H.; Chen, W.-H. State of the Art and Prospective ofLipase-Catalyzed Transesterification Reaction for Biodiesel Production. Energy Convers. Manag. 2017,141, 339–353. [CrossRef]
40. Galgali, A.; Gawas, S.D.; Rathod, V.K. Ultrasound Assisted Synthesis of Citronellol Laurate by UsingNovozym 435. Catal. Today 2018, 309, 133–139. [CrossRef]
41. Piligaev, A.V.; Sorokina, K.N.; Samoylova, Y.V.; Parmon, V.N. Lipid Production by Microalga MicractiniumSp. IC-76 in a Flat Panel Photobioreactor and Its Transesterification with Cross-Linked Enzyme Aggregatesof Burkholderia Cepacia Lipase. Energy Convers. Manag. 2018, 156, 1–9. [CrossRef]
42. Navarro López, E.; Robles Medina, A.; González Moreno, P.A.; Esteban Cerdán, L.; Martín Valverde, L.;Molina Grima, E. Biodiesel Production from Nannochloropsis Gaditana Lipids through TransesterificationCatalyzed by Rhizopus Oryzae Lipase. Bioresour. Technol. 2016, 203, 236–244. [CrossRef] [PubMed]
43. Lai, J.Q.; Hu, Z.L.; Wang, P.W.; Yang, Z. Enzymatic Production of Microalgal Biodiesel in Ionic Liquid[BMIm][PF6]. Fuel 2012, 95, 329–333. [CrossRef]
44. Zhao, D.; Feng, J.; Huo, Q.; Melosh, N.; Glenn, H.; Chmelka, B.F.; Stucky, G.D.; Zhao, D.; Feng, J.; Huo, Q.;et al. Triblock Copolymer Syntheses of Mesoporous Silica with Periodic 50 to 300 Angstrom. Science 1998,279, 548–552. [CrossRef]
45. Salis, A.; Pinna, M.; Monduzzi, M.; Solinas, V. Biodiesel Production from Triolein and Short Chain Alcoholsthrough Biocatalysis. J. Biotechnol. 2005, 119, 291–299. [CrossRef] [PubMed]
46. Bradford, M.M. A Rapid and Sensitive Method for the Quantitation of Microgram Quantities of ProteinUtilizing the Principle of Protein-Dye Binding. Anal. Biochem. 1976, 72, 248–254. [CrossRef]
47. Jaiswal, S.K.; Tejo Prakash, N.; Prakash, R. 1H NMR Based Quantification of Ethyl Ester in Biodiesel: AComparative Study of Product-Dependent Derivations. Anal. Chem. Lett. 2016, 6, 518–525. [CrossRef]
48. Panreac Quimica. Métodos Analíticos En Alimentaria; Montplet & Esteban: Barcelona, Spain, 1999.
© 2019 by the authors. Licensee MDPI, Basel, Switzerland. This article is an open accessarticle distributed under the terms and conditions of the Creative Commons Attribution(CC BY) license (http://creativecommons.org/licenses/by/4.0/).
127


catalysts
Article
Use of Co/Fe-Mixed Oxides as HeterogeneousCatalysts in Obtaining Biodiesel
Norma Gutiérrez-Ortega 1,* , Esthela Ramos-Ramírez 2,*, Alma Serafín-Muñoz 1,
Adrián Zamorategui-Molina 1 and Jesús Monjaraz-Vallejo 2
1 Environmental Engineering Laboratory, Department of Civil Engineering, Engineering Division, Universityof Guanajuato, 36000 Guanajuato, México; [email protected] (A.S.-M.); [email protected] (A.Z.-M.)
2 Advanced Materials and Processes Laboratory, Department of Chemistry, Division of Natural and ExactSciences, University of Guanajuato, 36000 Guanajuato, México; [email protected]
* Correspondence: [email protected] (N.G.-O.); [email protected] (E.R.-R.);Tel.: +52-473-732-00-06 (ext. 2227) (N.G.-O.); +52-473-732-00-06 (ext. 1457) (E.R.-R.)
Received: 1 February 2019; Accepted: 26 April 2019; Published: 29 April 2019
Abstract: Catalyst-type mixed metal oxides with different compositions and Co/Fe ratios wereobtained from layered double hydroxides to be used as heterogeneous catalysts in the production ofbiodiesel. The effect of the Co/Fe ratio on the precursors of the catalysts was analyzed, consideringtheir thermal, textural and structural properties. The physicochemical properties of the catalysts weredetermined by thermogravimetric analysis (differential scanning calorimetry and thermogravimetric),X-ray diffraction, Fourier-transform infrared spectroscopy, Scanning Electron Microscopy-EnergyDispersive X-ray spectroscopy and N2-physisorption. The conversion to biodiesel using the differentcatalysts obtained was determined by diffuse reflectance infrared Fourier-transform spectroscopyand 1H-Nuclear magnetic resonance spectroscopy, allowing us to correlate the effect of the catalystcomposition with the catalytic capacity. The conditions for obtaining biodiesel were optimized byselecting the catalyst and varying the percentage of catalyst, the methanol/oil ratio and the reactiontime. The catalysts reached yields of conversion to biodiesel of up to 96% in 20 min of reactionusing only 2% catalyst. The catalyst that showed the best catalytic activity contains a mixture ofpredominant crystalline and amorphous phases of CoFe2O4 and NaxCoO2. The results suggest thatcobalt is a determinant in the activity of the catalyst when forming active sites in the crystallinenetwork of mixed oxides for the transesterification of triglycerides, with high conversion capacityand selectivity to biodiesel.
Keywords: Cobalt ferrite; layered double hydroxides; ethylesters; biofuels; hydrotalcite;transesterification
1. Introduction
Currently, one of the main challenges facing humanity is to reduce the use of petroleum fuelsand increase the production of fuels from low carbon sources [1]. A viable alternative is biofuels,which have the advantages of being easily extractable from biomass, biodegradable, non-toxic andenvironmentally friendly [2,3]. Biodiesel is a liquid fuel derived from triglycerides of animal, vegetableand even microbial origin [4,5]. Biodiesel can be obtained by a great variety of techniques such asdirect mixtures, microemulsions, pyrolysis and transesterification [6]. The transesterification techniqueis the most used because it is easy to carry out; however, the type of catalyst used is important toensure that the reaction has direct effects on the efficiency of the process and the quality of the products.The catalysts used can be homogeneous, heterogeneous or enzymatic (Figure 1) [7–9].
Catalysts 2019, 9, 403; doi:10.3390/catal9050403 www.mdpi.com/journal/catalysts129
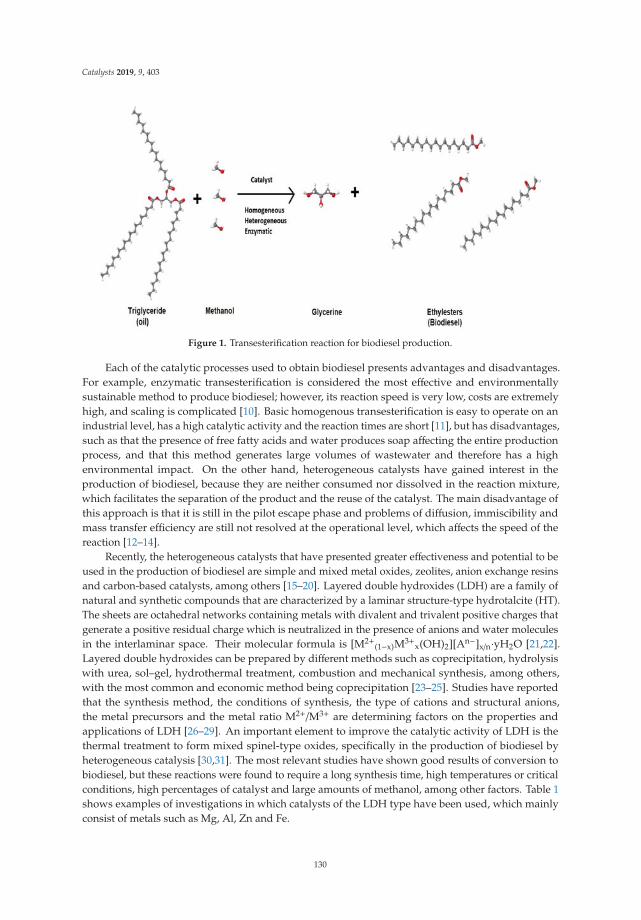
Catalysts 2019, 9, 403
Figure 1. Transesterification reaction for biodiesel production.
Each of the catalytic processes used to obtain biodiesel presents advantages and disadvantages.For example, enzymatic transesterification is considered the most effective and environmentallysustainable method to produce biodiesel; however, its reaction speed is very low, costs are extremelyhigh, and scaling is complicated [10]. Basic homogenous transesterification is easy to operate on anindustrial level, has a high catalytic activity and the reaction times are short [11], but has disadvantages,such as that the presence of free fatty acids and water produces soap affecting the entire productionprocess, and that this method generates large volumes of wastewater and therefore has a highenvironmental impact. On the other hand, heterogeneous catalysts have gained interest in theproduction of biodiesel, because they are neither consumed nor dissolved in the reaction mixture,which facilitates the separation of the product and the reuse of the catalyst. The main disadvantage ofthis approach is that it is still in the pilot escape phase and problems of diffusion, immiscibility andmass transfer efficiency are still not resolved at the operational level, which affects the speed of thereaction [12–14].
Recently, the heterogeneous catalysts that have presented greater effectiveness and potential to beused in the production of biodiesel are simple and mixed metal oxides, zeolites, anion exchange resinsand carbon-based catalysts, among others [15–20]. Layered double hydroxides (LDH) are a family ofnatural and synthetic compounds that are characterized by a laminar structure-type hydrotalcite (HT).The sheets are octahedral networks containing metals with divalent and trivalent positive charges thatgenerate a positive residual charge which is neutralized in the presence of anions and water moleculesin the interlaminar space. Their molecular formula is [M2+
(1−x)M3+x(OH)2][An−]x/n·yH2O [21,22].
Layered double hydroxides can be prepared by different methods such as coprecipitation, hydrolysiswith urea, sol–gel, hydrothermal treatment, combustion and mechanical synthesis, among others,with the most common and economic method being coprecipitation [23–25]. Studies have reportedthat the synthesis method, the conditions of synthesis, the type of cations and structural anions,the metal precursors and the metal ratio M2+/M3+ are determining factors on the properties andapplications of LDH [26–29]. An important element to improve the catalytic activity of LDH is thethermal treatment to form mixed spinel-type oxides, specifically in the production of biodiesel byheterogeneous catalysis [30,31]. The most relevant studies have shown good results of conversion tobiodiesel, but these reactions were found to require a long synthesis time, high temperatures or criticalconditions, high percentages of catalyst and large amounts of methanol, among other factors. Table 1shows examples of investigations in which catalysts of the LDH type have been used, which mainlyconsist of metals such as Mg, Al, Zn and Fe.
130

Catalysts 2019, 9, 403
Table 1. Obtaining biodiesel using different layered double hydroxides (LDH)-type catalysts.
Catalyst Synthesis ConditionsBiodiesel
Conversion (%)References
Mg/Al = 3 HT 1Soybean oil:methanol 1:12, 5 wt% of catalyst, at
180 ◦C, 700 rpm, 180 min, with microwaveirradiation
96 Coral, 2019 [30]
Mg/Fe = 5 HT calcined at 500 ◦C Rapeseed oil:methanol 1:9, 5% catalyst, 400 rpmat 120 ◦C for 8 h in Batch autoclave reactor 68 Hajek, 2018 [31]
Comercial Zn/Al = 3.3 HT-KFJatropha oil 1:30, 10% catalyst, reflux for 3 h and
30 min in Batch microwave reactor withoutreporting temperature
50 Fatimah, 2018 [32]
LDH at 300 ◦C Oil:alcohol, 50 mg cat:10 mmol oil, 1:30, 65 ◦C, 3 h 30 Tajuddi, 2018 [33]Mg/Al = 7 HT at 500 ◦C Oil:alcohol 1:48, 6% catalyst, 60 ◦C, 1 atm, 24 h 92 Navajas, 2018 [34]
Mg/Al = 3 HT at 500 ◦C Soybean oil:methanol 1:90, 1000 rpm, 150 ◦C, 0.4g cat:0.0045 mol oil, 180 min, autoclave pressure 97 Dhawan, 2018 [35]
Mg/Al = 2 HT nanoparticles at 500 ◦C Jatropha oil 1:40, 5%, 3.3–5.5 MPa, 200 ◦C, 4 h 54 Wang, 2015 [36]
Mg/Al = 3 HT Soybean oil:methanol 1:14, N2, 1380 kPa, 115 ◦C,4% catalyst, 2 h 95 Prado, 2014 [37]
Mg/Al = 3 HT-10% Fe at 480 ◦C Seed oil:methanol 1:6, 1% catalyst, 80 ◦C, 100 min 96 Macala, 2008 [38]
MgCoAl–LDH at 500 ◦C Canola oil: 1:16 methanol, 2% catalyst, 100 ◦C, 25atm and 300 min 95 Li, 2009 [39]
1 HT: hydrotalcite or layered double hydroxide
The above shows a panorama highlighting the need to continue looking for new materials thatachieve better efficiencies in the conversion to biodiesel in the shortest possible time and using thesmoothest and most controllable reaction conditions.
The modification that has been given to the LDH containing Fe, both in the laminar structure andimpregnated, have shown efficient conversion results, but with long reaction times or with systemsthat require pressure [31,38]. On the other hand, cobalt is a catalytically active element that has beenused in many catalytic processes, including transesterification. The use of catalysts with Co content toobtain biodiesel has given interesting results, with the case of the use of materials of type Co(II)-organiccompounds in microwave reactors that have reached 80% conversion in 12 h [40]. Other studies haveused cobalt supported, for example, in zeolite ZSM5 with in reaction times of 8 h to 95 ◦C and 80%conversion [41]. Additionally, a study reports the direct esterification of fatty acids to form biodieselby using a mixture of oxides with Co, Sn and Al with 1:32 oil/methanol ratio, 2% catalyst and 60 ◦C,reaching 65% conversion in 4 h [42].
The present work focuses on the obtaining of a new catalysts obtained by thermal activation oflayered double hydroxides Co/Fe, to be used in the esterification and transesterification reactions toproduce biodiesel. The use of Co and Fe as active metals in crystalline networks of the simple andmixed oxides type is proposed, considering mainly that the cobalt is a transition element that cancontribute to the formation of active sites for the simultaneous esterification and transesterification ofthe cooking oil to biodiesel. The effect of the variation of the Co/Fe ratio of the LDH precursor on thephysicochemical and catalytic properties of its calcination products at 700 ◦C for catalytic activation isstudied. Complementarily, the best operating conditions for obtaining biodiesel by heterogeneouscatalysis were determined, the foregoing to generate a viable alternative for the industrial productionof biodiesel under simple operating conditions.
2. Results
2.1. Catalyst Characterization
This section shows the results of the characterization of the catalytic precursors Layered DoubleHydroxides (LDH) identified as LDH1, LDH2, LDH3 and LDH4 corresponding to the ratio Co/Fe= 1, 2, 3 and 4 respectively, as well as the products of calcination of LDH identified as MO-LDH1,MO-LDH2, MO-LDH3 and MO-LDH4.
131

Catalysts 2019, 9, 403
2.1.1. Thermal Evolution of Layered Double Hydroxides (LDH) to Co/Fe-Mixed Oxides (MO-LDH)
Figure 2a shows the thermogravimetric analysis (TGA) of the LDH, corresponding to the differentprecursors of the mixed Co/Fe oxides. As can be seen, the LDH2 precursor presents a first major weightloss associated with the elimination of water around 200 ◦C corresponding to 12% of its original weight,while the LDH3 and LDH4 precursors present a weight loss of only 3.5% in that same temperaturerange. The second weight loss occurs between 600 and 700 ◦C which for the solid LDH1 amounts to aloss of 22%, LDH2 of 33%, LDH3 of 34.5% and LDH4 of 46.5%, the latter being the highest total lossreached before losing 50% of its mass at 1100 ◦C. Thermograms by differential scanning calorimetry(DSC) are shown in Figure 2b, where it can be seen that the different Co/Fe precursors synthesizedpresent similar thermal evolutions. The main signals correspond to the dehydration of the moleculeshoused in the interlaminar at 300 ◦C and the decarbonation and dehydroxylation at 680 ◦C associatedwith the weight loss described in the TGA, which forms the crystalline and amorphous phases of thesimple and mixed oxides. In the case of the LDH3 and LDH4 solids, an additional reaction can be seenat 998 ◦C associated with the sintering of the spinel of the cobalt ferrite (CoFe2O4).
(a) (b)
Figure 2. Thermal analysis thermograms by differential scanning and thermogravimetric calorimetryof synthesized catalytic precursors: (a) thermogravimetric analysis (TGA) and (b) differential scanningcalorimetry (DSC).
The thermal stability of the LDH synthesized associated with the evolution of the crystallinephases allows us to determine the temperature at which the materials must be activated in order to beused as catalysts in the transesterification of triglycerides to biodiesel. This temperature was found tobe 700 ◦C for the transition of the phases.
2.1.2. Modification of Functional Groups by Thermal Activation of the Catalyst
Figure 3 shows the FTIR spectra of the LDHs prior to activation (Figure 3a) compared to thespectra of the catalysts obtained by calcination at 700 ◦C (Figure 3b). As can be seen, the thermaldecomposition profiles are correlated to the activation temperature of the catalysts. A broad bandof low intensity close to 3300 cm−1 can be observed in all spectra of Figure 3b, which is associatedwith hydroxyl groups, where in the case of the catalysts MO-LDH1 and MO-LDH2 it is a double bandassociated with the interaction of hydroxyl and carbonates that could be reabsorbed on the surfacegiven the precursor reconstruction effect. This signal attributed to the hydroxyl groups is of lowintensity for the catalysts MO-LDH3 and MO-LDH4. With respect to the presence of carbonate groups,these signals are observed between 1200 and 1600 cm−1. In the case of MO-LDH1 the band belongingto carbonates is not observed, for MO-LDH2 most of the carbonates are interlaminar, in the MO-LDH3the carbonates are free, that is, they are adsorbed on the surface and the MO-LDH4 carbonates are notobserved. For the case of the modifications in the interlaminar bonds of the metals when evolving
132
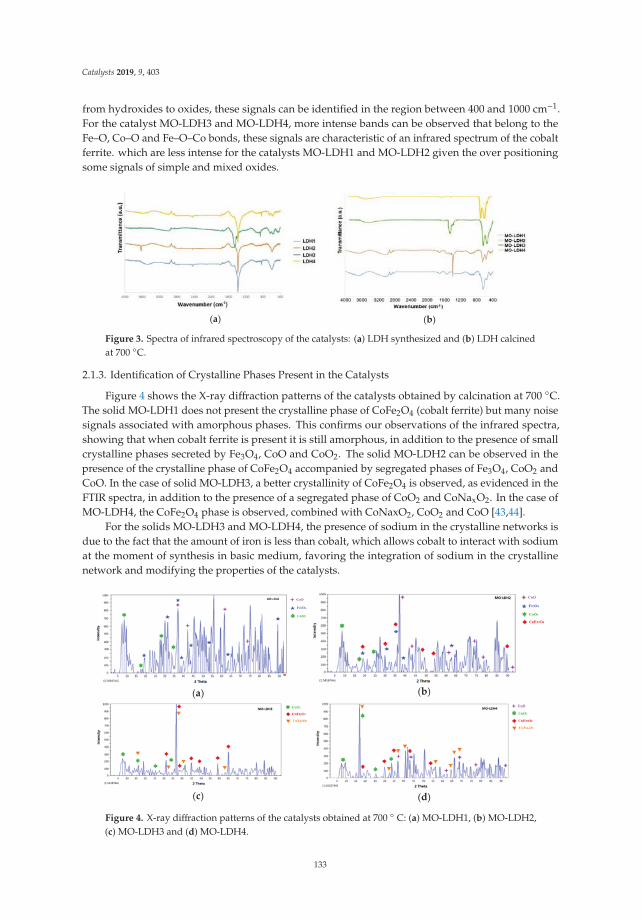
Catalysts 2019, 9, 403
from hydroxides to oxides, these signals can be identified in the region between 400 and 1000 cm−1.For the catalyst MO-LDH3 and MO-LDH4, more intense bands can be observed that belong to theFe–O, Co–O and Fe–O–Co bonds, these signals are characteristic of an infrared spectrum of the cobaltferrite. which are less intense for the catalysts MO-LDH1 and MO-LDH2 given the over positioningsome signals of simple and mixed oxides.
(a) (b)
Figure 3. Spectra of infrared spectroscopy of the catalysts: (a) LDH synthesized and (b) LDH calcinedat 700 ◦C.
2.1.3. Identification of Crystalline Phases Present in the Catalysts
Figure 4 shows the X-ray diffraction patterns of the catalysts obtained by calcination at 700 ◦C.The solid MO-LDH1 does not present the crystalline phase of CoFe2O4 (cobalt ferrite) but many noisesignals associated with amorphous phases. This confirms our observations of the infrared spectra,showing that when cobalt ferrite is present it is still amorphous, in addition to the presence of smallcrystalline phases secreted by Fe3O4, CoO and CoO2. The solid MO-LDH2 can be observed in thepresence of the crystalline phase of CoFe2O4 accompanied by segregated phases of Fe3O4, CoO2 andCoO. In the case of solid MO-LDH3, a better crystallinity of CoFe2O4 is observed, as evidenced in theFTIR spectra, in addition to the presence of a segregated phase of CoO2 and CoNaxO2. In the case ofMO-LDH4, the CoFe2O4 phase is observed, combined with CoNaxO2, CoO2 and CoO [43,44].
For the solids MO-LDH3 and MO-LDH4, the presence of sodium in the crystalline networks isdue to the fact that the amount of iron is less than cobalt, which allows cobalt to interact with sodiumat the moment of synthesis in basic medium, favoring the integration of sodium in the crystallinenetwork and modifying the properties of the catalysts.
(a) (b)
(c) (d)
Figure 4. X-ray diffraction patterns of the catalysts obtained at 700 ◦ C: (a) MO-LDH1, (b) MO-LDH2,(c) MO-LDH3 and (d) MO-LDH4.
133
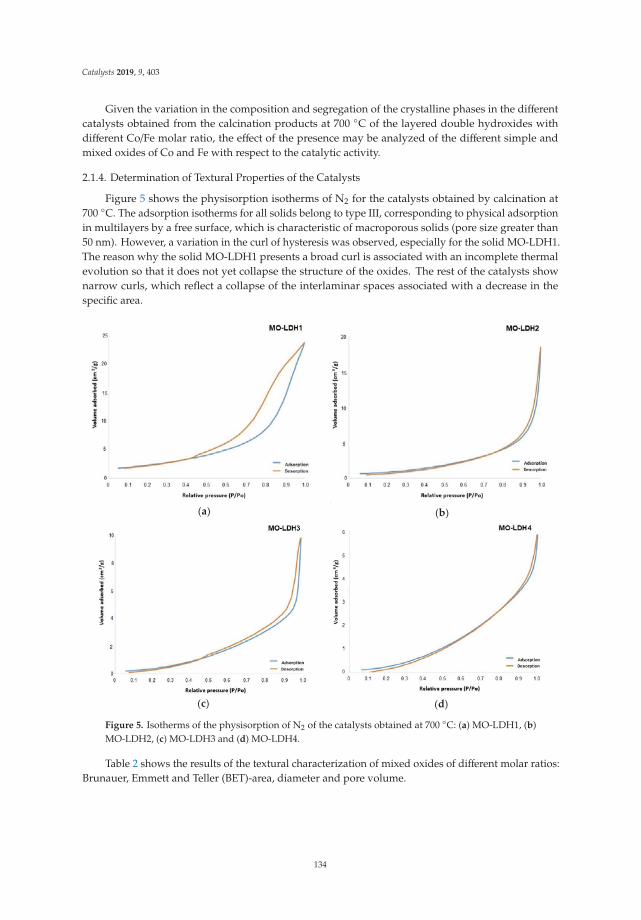
Catalysts 2019, 9, 403
Given the variation in the composition and segregation of the crystalline phases in the differentcatalysts obtained from the calcination products at 700 ◦C of the layered double hydroxides withdifferent Co/Fe molar ratio, the effect of the presence may be analyzed of the different simple andmixed oxides of Co and Fe with respect to the catalytic activity.
2.1.4. Determination of Textural Properties of the Catalysts
Figure 5 shows the physisorption isotherms of N2 for the catalysts obtained by calcination at700 ◦C. The adsorption isotherms for all solids belong to type III, corresponding to physical adsorptionin multilayers by a free surface, which is characteristic of macroporous solids (pore size greater than50 nm). However, a variation in the curl of hysteresis was observed, especially for the solid MO-LDH1.The reason why the solid MO-LDH1 presents a broad curl is associated with an incomplete thermalevolution so that it does not yet collapse the structure of the oxides. The rest of the catalysts shownarrow curls, which reflect a collapse of the interlaminar spaces associated with a decrease in thespecific area.
(a) (b)
(c) (d)
Figure 5. Isotherms of the physisorption of N2 of the catalysts obtained at 700 ◦C: (a) MO-LDH1, (b)MO-LDH2, (c) MO-LDH3 and (d) MO-LDH4.
Table 2 shows the results of the textural characterization of mixed oxides of different molar ratios:Brunauer, Emmett and Teller (BET)-area, diameter and pore volume.
134
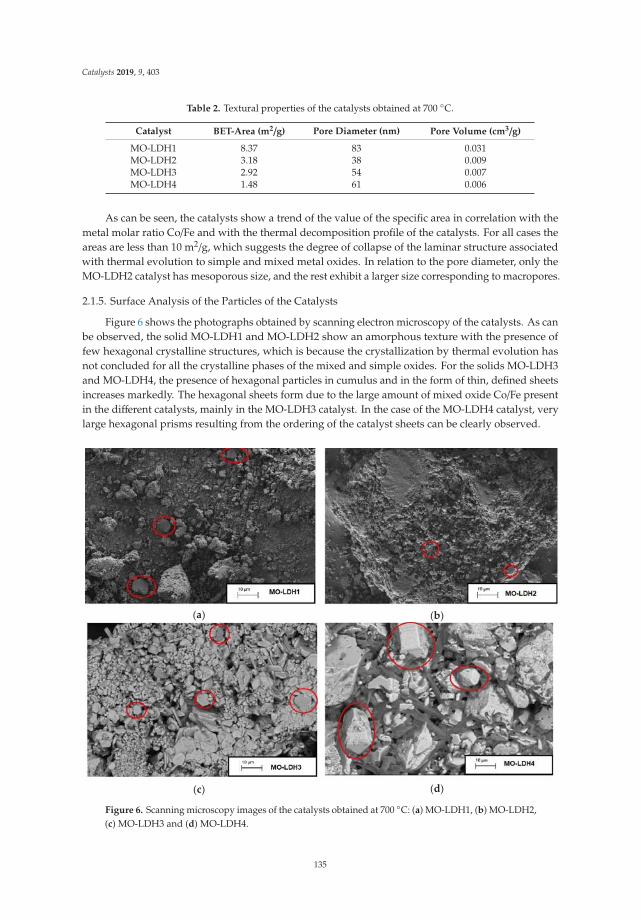
Catalysts 2019, 9, 403
Table 2. Textural properties of the catalysts obtained at 700 ◦C.
Catalyst BET-Area (m2/g) Pore Diameter (nm) Pore Volume (cm3/g)
MO-LDH1 8.37 83 0.031MO-LDH2 3.18 38 0.009MO-LDH3 2.92 54 0.007MO-LDH4 1.48 61 0.006
As can be seen, the catalysts show a trend of the value of the specific area in correlation with themetal molar ratio Co/Fe and with the thermal decomposition profile of the catalysts. For all cases theareas are less than 10 m2/g, which suggests the degree of collapse of the laminar structure associatedwith thermal evolution to simple and mixed metal oxides. In relation to the pore diameter, only theMO-LDH2 catalyst has mesoporous size, and the rest exhibit a larger size corresponding to macropores.
2.1.5. Surface Analysis of the Particles of the Catalysts
Figure 6 shows the photographs obtained by scanning electron microscopy of the catalysts. As canbe observed, the solid MO-LDH1 and MO-LDH2 show an amorphous texture with the presence offew hexagonal crystalline structures, which is because the crystallization by thermal evolution hasnot concluded for all the crystalline phases of the mixed and simple oxides. For the solids MO-LDH3and MO-LDH4, the presence of hexagonal particles in cumulus and in the form of thin, defined sheetsincreases markedly. The hexagonal sheets form due to the large amount of mixed oxide Co/Fe presentin the different catalysts, mainly in the MO-LDH3 catalyst. In the case of the MO-LDH4 catalyst, verylarge hexagonal prisms resulting from the ordering of the catalyst sheets can be clearly observed.
(a) (b)
(c) (d)
Figure 6. Scanning microscopy images of the catalysts obtained at 700 ◦C: (a) MO-LDH1, (b) MO-LDH2,(c) MO-LDH3 and (d) MO-LDH4.
135
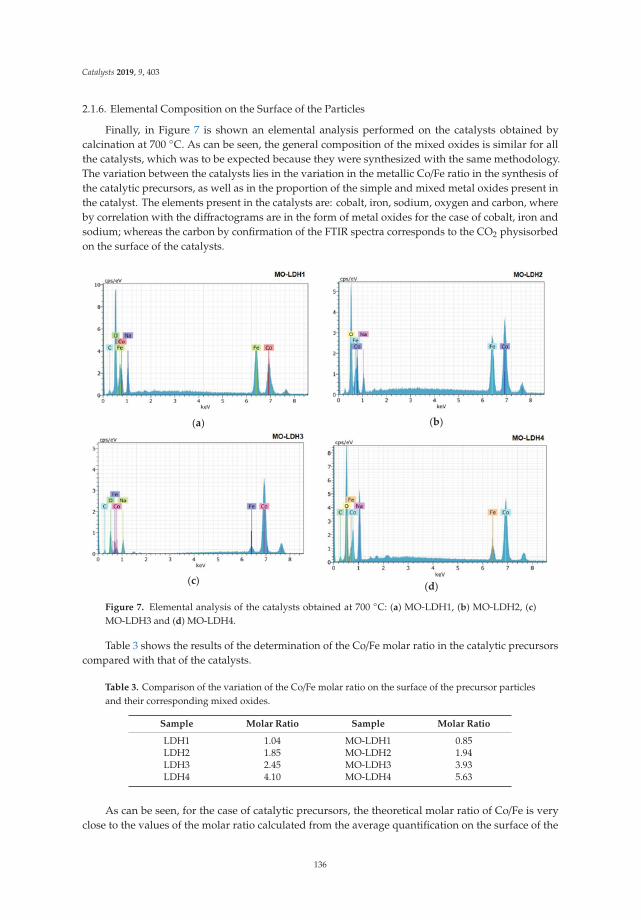
Catalysts 2019, 9, 403
2.1.6. Elemental Composition on the Surface of the Particles
Finally, in Figure 7 is shown an elemental analysis performed on the catalysts obtained bycalcination at 700 ◦C. As can be seen, the general composition of the mixed oxides is similar for allthe catalysts, which was to be expected because they were synthesized with the same methodology.The variation between the catalysts lies in the variation in the metallic Co/Fe ratio in the synthesis ofthe catalytic precursors, as well as in the proportion of the simple and mixed metal oxides present inthe catalyst. The elements present in the catalysts are: cobalt, iron, sodium, oxygen and carbon, whereby correlation with the diffractograms are in the form of metal oxides for the case of cobalt, iron andsodium; whereas the carbon by confirmation of the FTIR spectra corresponds to the CO2 physisorbedon the surface of the catalysts.
(a) (b)
(c) (d)
Figure 7. Elemental analysis of the catalysts obtained at 700 ◦C: (a) MO-LDH1, (b) MO-LDH2, (c)MO-LDH3 and (d) MO-LDH4.
Table 3 shows the results of the determination of the Co/Fe molar ratio in the catalytic precursorscompared with that of the catalysts.
Table 3. Comparison of the variation of the Co/Fe molar ratio on the surface of the precursor particlesand their corresponding mixed oxides.
Sample Molar Ratio Sample Molar Ratio
LDH1 1.04 MO-LDH1 0.85LDH2 1.85 MO-LDH2 1.94LDH3 2.45 MO-LDH3 3.93LDH4 4.10 MO-LDH4 5.63
As can be seen, for the case of catalytic precursors, the theoretical molar ratio of Co/Fe is veryclose to the values of the molar ratio calculated from the average quantification on the surface of the
136
Catalysts 2019, 9, 403
particles. After the heat treatment, it can be seen that for the case of the MO-LDH1 and MO-LDH2solids the Co/Fe ratio varies very little, which can be attributed to the homogeneity of the dispersion ofmetals in the particles. These solids were also homogeneous after thermal evolution. In the case of theMO-LDH3 and MO-LDH4 catalysts, a decrease in the Co/Fe molar ratio is observed, which can beattributed to the fact that the particles are more crystalline with defined edges, which concentrate theiron in the crystalline network, thus decreasing the amount of iron on the surface.
2.2. Evaluation of Biodiesel Quality
The physical and rapid qualitative parameter that was used to determine whethertransesterification was performed for the conversion of triglycerides to biodiesel was the kinematicviscosity, starting from the fact that the oil prior to transesterification had a viscosity of 32 cp, whilebiodiesel with a high percentage of conversion presents values below 6 cp according to ASTMD6751,implying that a decrease in viscosity is associated with the transesterification of the fatty acids presentin the oil [45].
Once it was confirmed that the viscosity had been reduced to values close to the norm, weproceeded to the quantification and confirmation of the conversion by diffuse reflectance infraredFourier-transform spectroscopy (DRIFTS) and 1H-Nuclear magnetic resonance (NMR) spectroscopy [46],as well as the verification of the international parameters of density, corrosion of the copper foil andturbidity. These parameters can be used to verify the feasibility of the products’ application as biofuelsin internal combustion engines.
Table 4 shows the best conversion percentages obtained in the shortest reaction times tested forobtaining biodiesel using a 3% catalyst, a molar oil/methanol ratio of 1:12, a reaction temperature of 65◦C and constant agitation at 1400 rpm.
Table 4. Quality parameters of biodiesel obtained using the different catalysts.
CatalystTime(min)
Viscosity(cp)
Density(kg/m3)
AcidityIndex
(mgKOH/g)
Corrosion ofCopper Foil
Turbidity(◦C)
DRIFTSConversion
(%)
1H-NMRConversion
(%)
MO-LDH1 60 6.92 ± 0.3 885 ± 6 0.18 1a <1 70.4 ± 3.4 63.3MO-LDH2 60 6.55 ± 0.1 883 ± 5 0.20 1a <1 80.1 ± 3.4 82.0MO-LDH3 30 3.71 ± 0.2 881 ± 2 0.19 1b <1 93.2 ± 3.3 92.7MO-LDH4 30 3.66 ± 0.1 875 ± 5 0.20 1a <1 96.2 ± 3.4 96.0
It can be seen that the four catalysts achieved a conversion of triglycerides to biodiesel by loweringthe viscosity of the 32 cp oil to values lower than 7 cp. In the case of the MO-LDH1 and MO-LDH2catalysts, at a reaction time of 30 min, the viscosities were 14.24 and 15.27 cp, respectively, whichindicated that the conversion had not yet finished. When the reaction time was extended to 60 min, adecrease in viscosity values close to 7 cp was observed, associated with conversion values greater than70%. On the other hand, for the case of the MO-LDH3 and MO-LDH4 catalysts, at 30 min they hadalready reached viscosities below 4 cp and achieved conversions greater than 90%.
Figure 8 shows the 1H-NMR spectra which were used to calculate the % conversion to biodieselfrom the M signal corresponding to the methyl group of the biodiesel methylesters that is formed as thereaction is carried out. Associated with the M signal is the G zone corresponding to the monoglycerides,diglycerides and triglycerides of the oil, which disappear in the conversion to methylesters.
137
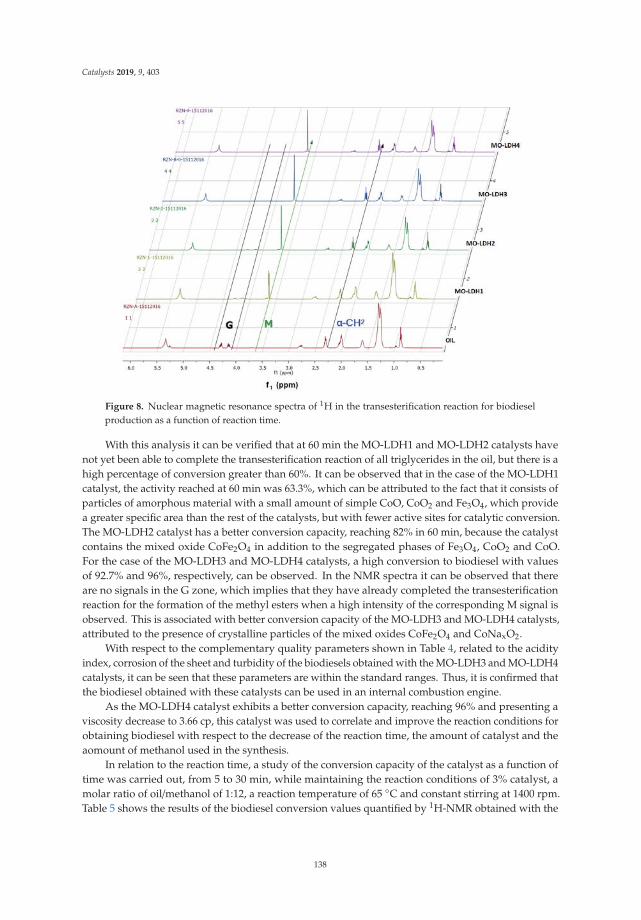
Catalysts 2019, 9, 403
Figure 8. Nuclear magnetic resonance spectra of 1H in the transesterification reaction for biodieselproduction as a function of reaction time.
With this analysis it can be verified that at 60 min the MO-LDH1 and MO-LDH2 catalysts havenot yet been able to complete the transesterification reaction of all triglycerides in the oil, but there is ahigh percentage of conversion greater than 60%. It can be observed that in the case of the MO-LDH1catalyst, the activity reached at 60 min was 63.3%, which can be attributed to the fact that it consists ofparticles of amorphous material with a small amount of simple CoO, CoO2 and Fe3O4, which providea greater specific area than the rest of the catalysts, but with fewer active sites for catalytic conversion.The MO-LDH2 catalyst has a better conversion capacity, reaching 82% in 60 min, because the catalystcontains the mixed oxide CoFe2O4 in addition to the segregated phases of Fe3O4, CoO2 and CoO.For the case of the MO-LDH3 and MO-LDH4 catalysts, a high conversion to biodiesel with valuesof 92.7% and 96%, respectively, can be observed. In the NMR spectra it can be observed that thereare no signals in the G zone, which implies that they have already completed the transesterificationreaction for the formation of the methyl esters when a high intensity of the corresponding M signal isobserved. This is associated with better conversion capacity of the MO-LDH3 and MO-LDH4 catalysts,attributed to the presence of crystalline particles of the mixed oxides CoFe2O4 and CoNaxO2.
With respect to the complementary quality parameters shown in Table 4, related to the acidityindex, corrosion of the sheet and turbidity of the biodiesels obtained with the MO-LDH3 and MO-LDH4catalysts, it can be seen that these parameters are within the standard ranges. Thus, it is confirmed thatthe biodiesel obtained with these catalysts can be used in an internal combustion engine.
As the MO-LDH4 catalyst exhibits a better conversion capacity, reaching 96% and presenting aviscosity decrease to 3.66 cp, this catalyst was used to correlate and improve the reaction conditions forobtaining biodiesel with respect to the decrease of the reaction time, the amount of catalyst and theaomount of methanol used in the synthesis.
In relation to the reaction time, a study of the conversion capacity of the catalyst as a function oftime was carried out, from 5 to 30 min, while maintaining the reaction conditions of 3% catalyst, amolar ratio of oil/methanol of 1:12, a reaction temperature of 65 ◦C and constant stirring at 1400 rpm.Table 5 shows the results of the biodiesel conversion values quantified by 1H-NMR obtained with the
138
Catalysts 2019, 9, 403
catalyst MO-LDH4 at times below 30 min, also indicating the viscosity values as a quality parameter ofthe biodiesel.
Table 5. Percentage of conversion of the biodiesel obtained with the MO-LDH4 catalyst at differentreaction times.
Time (min) Viscosity (cp) 1H-NMR Conversion (%)
5 4.14 81.3310 3.67 89.3315 3.26 90.0020 3.43 94.0025 2.88 91.3330 3.22 96.00
It can be seen that the MO-LDH4 catalyst has the capacity to convert the oil to biodiesel in only 5min with viscosity values that comply with the norm, reaching a conversion of 81%. These resultsexceed the capacity found for the MO-LDH2 catalyst, which required 60 min to reach the sameconversion capacity, thus confirming the fast selectivity and conversion capacity of the catalyst as wellas the important role of mixed oxides in the process. After 5 min, the biodiesel complies with theviscosity quality parameter. With respect to the variation of the conversion% as a function of time,it can be seen that from 5 to 30 min the values of the conversion increase gradually from 81.3% to96%. The activity of the MO-LDH4 catalyst, attributed to the presence of particles of the mixed oxidesCoFe2O4 and CoNaxO2 and of the simple oxides CoO2 and CoO, is favored by the crystalline structureof the catalyst particles, as well as by the macroporosity that allows access to active sites. An advantageof the catalyst is that the formation of catalytically active sites is favored by the formation of mixedcrystalline structures.
The combination of the different particles containing Co species with different oxidation statesin both the simple oxides and in the mixed with Fe and Na, as a catalytic composition, allows theformation of different acidic and basic sites for the esterification of the free fatty acids present in the oil,as well as for the transesterification of the fatty acids from triglycerides to biodiesel. The process thatcould be developing in the catalyst is proposed based on the recent kinetic model of transesterificationin two sites of the Eley–Rideal type, where the mechanism has three important steps, the first step isthe adsorption of both methanol and oil on the surface of the catalyst, in the second step a tetrahedralintermediate is produced from the alkoxide group which attacks the positively polarized carbon ofthe triacylglyceride in both the liquid phase and the catalyst surface, and the third step involves theproduction of a fatty acid ester and the release of a diacylglycerides. this procedure is repeated withthe following two fatty acids bound to the glycerol [47].
Table 6 shows the viscosity values obtained by decreasing the amount of methanol used in thesynthesis while preserving the synthesis conditions of 3% catalyst, a reaction temperature of 65 ◦C,constant agitation at 1400 rpm and a reaction time of 30 min. It can be seen that the efficiency of thecatalyst is not significantly affected by decreasing the oil/methanol ratio from 1:12 to 1:9 and to 1:6.This represents an operational advantage since an excess of methanol as a reagent is not required todisplace the reaction to products, as in most procedures reported by heterogeneous catalysis [8,22].In this case, the conversion capacity is even slightly improved by decreasing the volume of methanolin the reaction.
139
Catalysts 2019, 9, 403
Table 6. Percentage of conversion of the biodiesel obtained with the MO-LDH4 catalyst at differentoil/methanol ratios.
Molar ratio Viscosity (cp) 1H-NMR Conversion (%)
6 3.43 969 3.51 9612 3.57 95
The effect of the decrease of the amount of the catalyst used in the transesterification reactionwas tested, while maintaining the conditions of a reaction temperature of 65 ◦C, an oil/ethanol molarratio of 1:12, constant agitation at 1400 rpm and a reaction time of 30 min. Table 7 shows that theefficiency of the process is not significantly affected by decreasing the amount of the catalyst from 3 to2%, allowing a reduction of up to one third of the catalyst.
Table 7. Percentage of conversion of the biodiesel obtained with the MO-LDH4 catalyst at differentoil/methanol ratios.
% Catalyst Viscosity (cp) 1H-NMR Conversion (%)
1 5.27 902 3.52 953 3.57 96
Finally, to verify the best synthesis conditions considering the simultaneous decrease of thecatalyst, methanol and reaction time, biodiesel was obtained with 2% catalyst, a oil/methanol molarratio of 1:6 and a reaction time of 20 min. Thus, we achieved a biodiesel with quality parameters thatcomply with the ASTM standards, as reported in Table 8.
Table 8. Quality parameters of the biodiesel obtained using the MO-LDH4 catalyst under optimalsynthesis conditions.
Parameters Limits ASTM Biodiesel Obtained
Density (kg/m3) 860–900 884Viscosity (cp) 1.9–6.0 3.89
Corrosion of copper foil 1 class 1 classAcidity index (mgKOH/g) 0.5 0.2
Turbity not established <1% of biodiesel conversion not established 90.24%
Methylester composition by GasChromatography-Flame Ionization Detector
(GC-FID)not established C18:1 9C, C18:2 9C,12C, C18:3
9C,12C,15C
It can be seen that the biodiesel obtained by Gas Chromatography-Flame Ionization Detector(CG-FID) is mainly composed of the methyl esters of oleic acid (C18: 1 cis-9), linoleic acid (C18: 2cis-9,12) and linolenic acid (C18: 3 cis-9,12,15), and in a lower proportion of palmitic acid (C16: 0)and stearic acid (C18: 0), which were identified according to the chromatograms shown in Figure 9.These results confirm the high selectivity of MO-LDH4 towards unsaturated fatty acids.
140
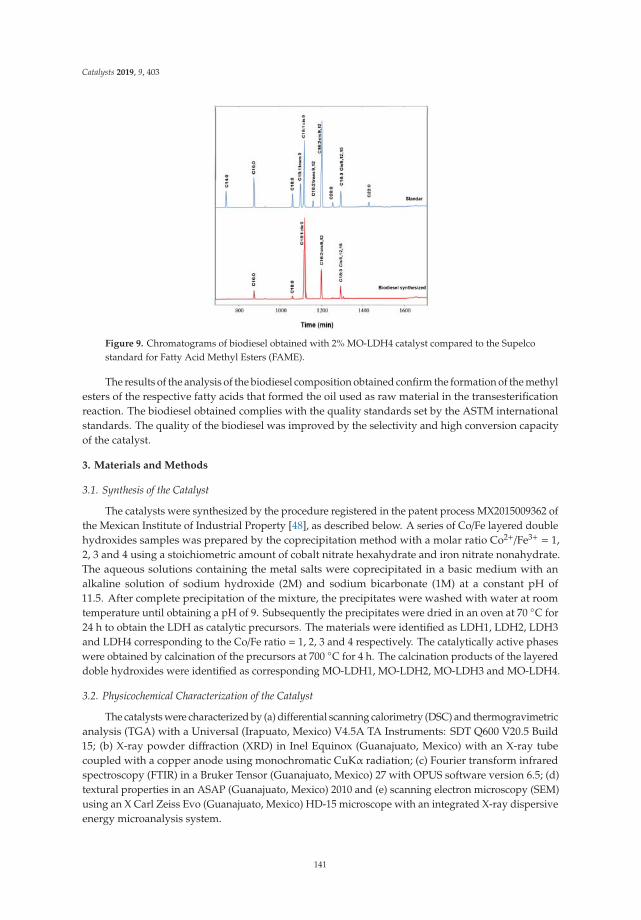
Catalysts 2019, 9, 403
Figure 9. Chromatograms of biodiesel obtained with 2% MO-LDH4 catalyst compared to the Supelcostandard for Fatty Acid Methyl Esters (FAME).
The results of the analysis of the biodiesel composition obtained confirm the formation of the methylesters of the respective fatty acids that formed the oil used as raw material in the transesterificationreaction. The biodiesel obtained complies with the quality standards set by the ASTM internationalstandards. The quality of the biodiesel was improved by the selectivity and high conversion capacityof the catalyst.
3. Materials and Methods
3.1. Synthesis of the Catalyst
The catalysts were synthesized by the procedure registered in the patent process MX2015009362 ofthe Mexican Institute of Industrial Property [48], as described below. A series of Co/Fe layered doublehydroxides samples was prepared by the coprecipitation method with a molar ratio Co2+/Fe3+ = 1,2, 3 and 4 using a stoichiometric amount of cobalt nitrate hexahydrate and iron nitrate nonahydrate.The aqueous solutions containing the metal salts were coprecipitated in a basic medium with analkaline solution of sodium hydroxide (2M) and sodium bicarbonate (1M) at a constant pH of11.5. After complete precipitation of the mixture, the precipitates were washed with water at roomtemperature until obtaining a pH of 9. Subsequently the precipitates were dried in an oven at 70 ◦C for24 h to obtain the LDH as catalytic precursors. The materials were identified as LDH1, LDH2, LDH3and LDH4 corresponding to the Co/Fe ratio = 1, 2, 3 and 4 respectively. The catalytically active phaseswere obtained by calcination of the precursors at 700 ◦C for 4 h. The calcination products of the layereddoble hydroxides were identified as corresponding MO-LDH1, MO-LDH2, MO-LDH3 and MO-LDH4.
3.2. Physicochemical Characterization of the Catalyst
The catalysts were characterized by (a) differential scanning calorimetry (DSC) and thermogravimetricanalysis (TGA) with a Universal (Irapuato, Mexico) V4.5A TA Instruments: SDT Q600 V20.5 Build15; (b) X-ray powder diffraction (XRD) in Inel Equinox (Guanajuato, Mexico) with an X-ray tubecoupled with a copper anode using monochromatic CuKα radiation; (c) Fourier transform infraredspectroscopy (FTIR) in a Bruker Tensor (Guanajuato, Mexico) 27 with OPUS software version 6.5; (d)textural properties in an ASAP (Guanajuato, Mexico) 2010 and (e) scanning electron microscopy (SEM)using an X Carl Zeiss Evo (Guanajuato, Mexico) HD-15 microscope with an integrated X-ray dispersiveenergy microanalysis system.
141
Catalysts 2019, 9, 403
3.3. Production of Biodiesel
The production of biodiesel was developed by the procedure registered in the patent processMX2015009362 of the Mexican Institute of Industrial Property [48], as described below. To obtainbiodiesel, a batch reactor was used with the operating conditions in a reflux system at 65 ◦C, constantagitation at 1400 rpm and a pressure atmosphere. The alcohol used in the synthesis was anhydrousmethanol (Golden Bell, Guadalajara, Mexico) and the source of triglycerides was commercial cookingoil. The variables used in the synthesis of biodiesel were the oil/methanol molar ratio (1:6, 1:9 and1:12), the percentage of oil/catalyst (1, 2 and 3% w/w) and the reaction time (30 and 60 min). Initially,3 g of calcined LDH was added to 50 mL methanol in a 500 mL three-necked glass flask equippedwith a reflux condenser. The mixture was vigorously mixed under atmospheric and heated until thetemperature reached 50 ◦C. Then, 100 mL of cooking oil, was added to the reactor and the temperaturewas increased to 65 ◦C. The mixture was stirred at 1400 rpm during the reaction time (30 min). At theend of the reaction, methanol was recovered by evaporation, catalyst was recovered by vacuumfiltration, and subsequently, glycerol, and biodiesel were separated by decantation.
3.4. Evaluation of the Quality of Biodiesel
The quality parameters of the biodiesel were evaluated in accordance with the ASTM internationalstandards to verify that the quality indicated in the ASTM D6751 standard was met. The viscosity wasdetermined in accordance with ASTM D445. The density was determined according to ASTM D121718.The ASTM D66419 standard was used for the acidity index. The corrosion of copper foil was evaluatedaccording to ASTM D13020. Turbidity was measured according to ASTM 250021. The quantification ofthe conversion of biodiesel by FTIR with diffuse reflectivity (DRIFTS) was conducted as established inASTM D7371, as well as by proton nuclear magnetic resonance (1H-MNR). The determination of themethyl esters contained in the biodiesel was carried out in accordance with the ASTM D6584 standard.
4. Conclusions
Catalytic precursors of the layered double hydroxides type with different Co/Fe ratios weresynthesized in a basic medium, which allowed us to obtain catalysts that showed a correlation betweentheir physicochemical properties and their catalytic capacity in the conversion of triglycerides tobiodiesel. The best conversion capacity was presented by the MO-LDH4 catalyst with a 96% conversionto biodiesel by transesterification using a molar alcohol/oil ratio of 6:1, with a reaction time of 20 minand the catalyst percentage of 2%, mainly formed by a mixture of crystalline particles in the formof stacked sheets. The high capacity and selectivity for the conversion of triglycerides to biodieselshown by the MO-LDH4 catalyst is attributed to the fact that it is a composite catalyst that contains acombination of the simple oxides CoO2 and CoO and the mixed oxides CoFe2O4 and CoNaxO2 wherethe Co with different oxidation states in combination with O, Fe and Na, favors the presence of acidicand basic sites for the transesterification esterification of the oil to biodiesel.
5. Patents
MX2015009362 Esthela Ramos Ramírez, Norma Leticia Gutiérrez-Ortega, José de Jesús MonjarazVallejo, "Obtaining Cobalt Ferrite for its application as a catalyst in the optimization of esterificationand transesterification reactions of fatty acids for the biodiesel production process" (“Obtenciónde Ferrita de Cobalto para su aplicación como catalizador en la optimización de las reacciones deesterificación y transesterificación de ácidos grasos para el proceso de producción de biodiesel” titule inspanish), request patent filed with the Mexican Institute of Industrial Property (IMPI Spanish acronym)Publication date: January 20, 2017.
Author Contributions: Conceptualization, G.-O.N. and R.-R.E.; methodology, G.-O.N. and M.-V.J.; validation,G.-O.N. and R.-R.E.; formal analysis, S.-M.A.; investigation, Z.-M.A.; resources, S.-M.A.; data curation, Z.-M.A.;
142
Catalysts 2019, 9, 403
writing—original draft preparation, G.-O.N.; writing—review and editing, R.-R.E.; project administration, R.-R.E.;funding acquisition, G.-O.N.
Funding: This research received no external funding. Funding was received from the resources of the universityof Guanajuato.
Acknowledgments: This work was supported by the Professors Improvement Program (PROMEP Spanishacronym) of the Public Education Secretary (SEP Spanish acronym), and the Direction of Research and PostgraduateCourse Support (DAIP Spanish acronym) from the University of Guanajuato. The authors thank the Directorate ofResearch Support and the Postgraduate Program of the University of Guanajuato for funding and CONACYTfor the scholarship received for the completion of postgraduate studies. In addition, Dr. Ramón Zarraga and Dr.Ricardo Navarro from the University of Guanajuato are thanked for the support with the NMR and SEM-EDXtechniques, respectively.
Conflicts of Interest: The authors declare no conflict of interest.
References
1. Oliveira, F.C.; Coelho, S.T. History, evolution, and environmental impact of biodiesel in Brazil: A review.Renew. Sust. Energ. Rev. 2017, 75, 168–179. [CrossRef]
2. García-Olivares, A.; Ballabrera-Poy, J. Energy and mineral peaks, and a future steady state economy. Technol.Forecast. Soc. Change 2015, 95, 587–598. [CrossRef]
3. Oh, Y.K. Recent developments and key barriers to advanced biofuels: A short review. Bioresour. Technol.2018. [CrossRef]
4. Semwal, S.; Arora, A.K.; Badoni, R.P.; Tuli, D.K. Biodiesel production using heterogeneous catalysts. Bioresour.Technol. 2011, 102, 2151–2161. [CrossRef] [PubMed]
5. Natarajan, Y.; Nabera, A.; Salike, S.; Tamilkkuricil, V.D.; Pandian, S.; Karuppan, M.; Appusamy, A. Anoverview on the process intensification of microchannel reactors for biodiesel production. Chem. Eng. Process.2019, 136, 163–176. [CrossRef]
6. Ge, J.C.; Yoon, S.K.; Choi, N.J. Using Canola Oil Biodiesel as an Alternative Fuel in Diesel Engines: A Review.Appl. Sci. 2017, 7, 881. [CrossRef]
7. Tariq, M.; Al, S.; Khalid, N. Activity of homogeneous and heterogeneous catalysts, spectroscopic andchromatographic characterization of biodiesel: A review. Renew. Sust. Energ. Rev. 2012, 16, 6303–6316.[CrossRef]
8. Shan, R.; Lu, L.; Shi, Y.; Yuan, H.; Shi, J. Catalysts from renewable resources for biodiesel production. J. Energ.Conver. Manage. 2018, 178, 277–289. [CrossRef]
9. Chang, C.C.; Teng, S.; Yuan, M.H.; Ji, D.R.; Chang, C.Y.; Chen, Y.H.; Shie, J.L.; Ho, C.; Tian, S.Y.;Andrade-Tacca, C.A.; et al. Esterification of Jatropha Oil with Isopropanol via Ultrasonic Irradiation.Energies 2018, 11, 1456. [CrossRef]
10. Christopher, L.P.; Kumar, H.; Zambare, V.P. Enzymatic biodiesel: Challenges and opportunities. Appl. Energ.2014, 119, 497–520. [CrossRef]
11. Reyero, I.; Arzamendi, G.; Zabala, S.; Gandía, L.M. Fuel Kinetics of the NaOH-catalyzed transesterificationof sunflower oil with ethanol to produce biodiesel. Process. Technol. 2015, 129, 147–155. [CrossRef]
12. Abdullah, S.H.Y.S.; Hanapi, N.H.M.; Azid, A.; Umar, R.; Juahir, H.; Khatoon, H.; Endut, A. A review ofbiomass-derived heterogeneous catalyst for a sustainable biodiesel production. Renew. Sust. Energ. Rev.2017, 70, 1040–1051. [CrossRef]
13. Yan, S.; Maggio, C.D.; Mohan, S.; Kim, M.; Salley, S.O.; Simon, K.Y. Advancements in Heterogeneous Catalysisfor Biodiesel Synthesis. Top. Catal. 2010, 53, 721–736. [CrossRef]
14. Dimian, A.C.; Srokol, Z.W.; Mittelmeijer-Hazeleger, M.C.; Rothenberg, G. Interrelation of Chemistry andProcess Design in Biodiesel Manufacturing by Heterogeneous Catalysis. Top. Catal. 2010, 53, 1197–1201.[CrossRef]
15. Chouhan, A.P.S.; Sarma, A.K. Modern heterogeneous catalysts for biodiesel production: A comprehensivereview. Renew. Sust. Energ. Rev. 2011, 15, 4378–4399. [CrossRef]
16. Lee, H.V.; Juan, J.C.; Hin, T.Y.Y.; Ong, H.C. Environment-Friendly Heterogeneous Alkaline-Based MixedMetal Oxide Catalysts for Biodiesel Production. Energies 2016, 9, 611. [CrossRef]
143
Catalysts 2019, 9, 403
17. Chang, K.L.; Lin, Y.C.; Jhang, S.R.; Cheng, W.L.; Chen, S.C.; Mao, S.Y. Rapid Jatropha-Castor BiodieselProduction with Microwave Heating and a Heterogeneous Base Catalyst Nano-Ca(OH)2/Fe3O4. Catalysts2017, 7, 203. [CrossRef]
18. Du, L.; Ding, S.; Li, Z.; Lv, E.; Lu, J.; Ding, J. Transesterification of castor oil to biodiesel using NaYzeolite-supported La2O3 catalysts. Energ. Convers. Manage. 2018, 173, 728–734. [CrossRef]
19. Jaya, N.; Selvan, B.K.; Vennison, S.J. Synthesis of biodiesel from pongamia oil using heterogeneousion-exchange resin catalyst. Ecotox. Environ. Safe. 2015, 121, 3–9. [CrossRef]
20. Tanga, Z.E.; Lima, S.; Panga, Y.L.; Ongb, H.C.; Lee, K.T. Synthesis of biomass as heterogeneous catalyst forapplication in biodiesel production: State of the art and fundamental review. Renew. Sust. Energ. Rev. 2018,92, 235–253. [CrossRef]
21. Cavani, F.; Trifiro, F.; Vaccari, A. Hydrotalcite–type anionic clays: Preparation, properties and applications.Catal. Today 1992, 11, 173–301. [CrossRef]
22. Mills, S.J.; Christy, A.G.; Génin, J.M.R.; Kameda, T.; Colombo, F. Nomenclature of the hydrotalcite supergroup:natural layered double hydroxides. Mineral. Mag. 2012, 76, 1289–1336. [CrossRef]
23. Othman, M.R.; Helwani, Z.; Martunus, W.J.N. Synthetic hydrotalcites from different routes and theirapplication as catalysts and gas adsorbents: a review. Appl. Organometal Chem. 2009, 23, 335–346. [CrossRef]
24. Jitianu, M.; Balasoiu, M.; Zaharescu, M.; Jitianu, A.; Ivanov, A. Comparative Study of Sol-Gel andCoprecipitated Ni-Al Hydrotalcites. J. Sol.-Gel. Sci. Techn. 2000, 19, 453–457. [CrossRef]
25. Qu, J.; Sha, L.; Wu, C.; Zhang, Q. Applications of Mechanochemically Prepared Layered Double Hydroxidesas Adsorbents and Catalysts: A Mini-Review. Nanomaterials 2019, 9, 80. [CrossRef]
26. Miyata, S. Physico-chemical properties of synthetic hydrotalcites in relation to composition. Clays. Clay.Miner. 1980, 28, 50–56. [CrossRef]
27. Roelofs, J.C.A.A.; Bokhoven, J.A.; Dillen, A.J.; Geus, J.W.; Jong, K.P. The Thermal Decomposition of Mg±AlHydrotalcites: Effects of Interlayer Anions and Characteristics of the Final Structure. Chem. Eur. J. 2002, 8,5571–5579. [CrossRef]
28. Iqbal, M.A.; Fedel, M. Effect of Synthesis Conditions on the Controlled Growth of MgAl–LDH CorrosionResistance Film: Structure and Corrosion Resistance Properties. Coatings 2019, 9, 30. [CrossRef]
29. Yan, A.L.; Wang, X.C.; Cheng, J.P. Research Progress of NiMn Layered Double Hydroxides for Supercapacitors:A Review. Nanomaterials 2018, 8, 747. [CrossRef]
30. Coral, N.; Brasil, H.; Rodrigues, E.; Costa, C.E.F.; Rumjanek, V. Microwave-modified hydrotalcites for thetransesterification of soybean oil. Sust. Chem. Pharm. 2019, 11, 49–53. [CrossRef]
31. Hájek, M.; Tomášová, A.; Kocík, J.; Podzemná, V. Statistical evaluation of the mutual relations of propertiesof Mg/Fe hydrotalcites and mixed oxides as transesterification catalysts. Appl. Clay. Sci. 2018, 154, 28–35.[CrossRef]
32. Fatimah, I.; Rubiyanto, D.; Nugraha, J. Preparation, characterization, and modelling activity of potassiumfluoride modified hydrotalcite for microwave assisted biodiesel conversion. Sust. Chem. Pharm. 2018, 8,63–70. [CrossRef]
33. Tajuddin, N.A.; Manayil, J.C.; Isaacs, M.A.; Parlett, C.M.A.; Lee, A.F.; Wilson, K. Alkali-Free Zn–Al LayeredDouble Hydroxide Catalysts for Triglyceride Transesterification. Catalysts 2018, 8, 667. [CrossRef]
34. Navajas, A.; Campo, I.; Moral, A.; Echave, J.; Sanz, O.; Montes, M.; Odriozola, J.A.; Arzamendi, G.;Gandía, L.M. Outstanding performance of rehydrated Mg-Al hydrotalcites as heterogeneous methanolysiscatalysts for the synthesis of biodiesel. Fuel 2018, 211, 173–181. [CrossRef]
35. Dhawan, M.S.; Yadav, G.D. Insight into a catalytic process for simultaneous production of biodiesel andglycerol carbonate from triglycerides. Catal. Today 2018, 309, 161–171. [CrossRef]
36. Wang, Y.T.; Fang, Z.; Zhang, F.; Xue, B.J. One-step production of biodiesel from oils with high acid value byactivated Mg–Al hydrotalcite nanoparticles. Bioresour. Technol. 2015, 193, 84–89. [CrossRef] [PubMed]
37. Prado, R.G.; Almeida, G.D.; Carvalho, M.M.O.; Galvao, L.M.; Bejan, C.C.C.; Costa, L.M.; Pinto, F.G.; Tronto, J.;Pasa, V.M.D. Multivariate Method for Transesterification Reaction of Soybean Oil Using Calcined Mg–AlLayered Double Hydroxide as Catalyst. Catal. Lett. 2014, 144, 1062–1073. [CrossRef]
38. Macala, G.S.; Robertson, A.W.; Johnson, C.L.; Day, Z.B.; Lewis, R.S.; White, M.G.; Iretskii, A.V.; Ford, P.C.Transesterification Catalysts from Iron Doped Hydrotalcite-like Precursors: Solid Bases for BiodieselProduction. Catal. Lett. 2008, 122, 205–209. [CrossRef]
144
Catalysts 2019, 9, 403
39. Li, E.; Ping Xu, Z.; Rudolph, V. MgCoAl–LDH derived heterogeneous catalysts for the ethanoltransesterification of canola oil to biodiesel. Appl. Catal. B 2009, 88, 42–49. [CrossRef]
40. Peña-Rodríguez, R.; Márquez-López, E.; Guerrero, A.; Chiñas, L.E. Hydrothermal synthesis of cobalt (II) 3Dmetal-organic framework acid catalyst applied in the transesterification process of vegetable oil. Mater. Lett.2018, 217, 117–119. [CrossRef]
41. Jamilah; Krisnandia, Y.K.; Sihombing, R. Synthesis and characterization of mesoporous Co/ZSM5 catalystand activity study on transesterification reaction. AIP Conf. Proc. 2016, 1729, 020042. [CrossRef]
42. Nuithitikul, K.; Prasitturattanachai, W.; Hasinc, W. Comparison in catalytics activities of sulfated Cobalt-Tinand sulfated aluminum-Tin mixed oxiddes for esterification of free fatty acis to produce methyl esteres.Energy Procedia 2017, 138, 75–80. [CrossRef]
43. Nasrollahzadeh, M.; Bagherzadeh, M.; Karimi, H. Preparation, characterization and catalytic activity ofCoFe2O4 nanoparticles as a magnetically recoverable catalyst for selective oxidation of benzyl alcohol tobenzaldehyde and reduction of organic dyes. J. Colloid. Interface Sci. 2016, 465, 271–278. [CrossRef] [PubMed]
44. Soares, J.M.; Conceição, O.L.A.; Machado, F.L.A.; Prakash, A.; Radha, S.; Nigam, A.K. Magnetic propertiesof the nanocomposite CoFe2O4/FeCo-FeO at a high H/T regime. J. Magn. Magn. Mater. 2015, 374, 192–196.[CrossRef]
45. Knothe, G.; Steidley, K.R. Kinematic viscosity of biodiesel fuel components and related compounds. Influenceof compound structure and comparison to petrodiesel fuel components. Fuel 2005, 84, 1059–1065. [CrossRef]
46. Kollar, S.R.M.; Novotny, E.H.; Nascimento, C.J.; Suarez, P.A.Z. Nuclear Magnetic Resonance (1.40 T) andMid Infrared (FTIR-ATR) Associated with Chemometrics as Analytical Methods for the Analysis of MethylEster Yield Obtained by Esterification Reaction. J. Braz. Chem. Soc. 2017, 28, 1917–1925. [CrossRef]
47. Olutoye, M.A.; Hameed, B.H. ScienceDirectKinetics and deactivation of a dual-site heterogeneous oxidecatalystduring the transesterification of crude jatropha oil with methanol. J. Taibah. Univ. Sci. 2016, 10,685–699. [CrossRef]
48. World Intellectual Property Organization. Patent Scope. Available online: https://patentscope.wipo.int/search/es/detail.jsf?docId=MX194961824&redirectedID=true (accessed on 31 January 2019).
© 2019 by the authors. Licensee MDPI, Basel, Switzerland. This article is an open accessarticle distributed under the terms and conditions of the Creative Commons Attribution(CC BY) license (http://creativecommons.org/licenses/by/4.0/).
145

catalysts
Article
Improved Etherification of Glycerol with Tert-ButylAlcohol by the Addition of Dibutyl Ether as Solvent
Carmen M. Dominguez * , Arturo Romero and Aurora Santos
Chemical Engineering and Materials, Faculty of Chemical Sciences, Universidad Complutense de Madrid,Ciudad Universitaria S/N, 28040 Madrid, Spain; [email protected] (A.R.); [email protected] (A.S.)* Correspondence: [email protected]; Tel.: +34-913-944-171
Received: 26 March 2019; Accepted: 17 April 2019; Published: 23 April 2019
Abstract: The etherification of glycerol with tert-butyl alcohol in the presence of acid catalysts givesrise to the production of ethers (monoethers, diethers and triethers) of high added-value, which canbe used as oxygenated additives in fuels. This reaction is limited by the thermodynamic equilibrium,which can be modified by the addition of solvents that selectively solubilize the products of interestalong with tert-butyl alcohol, leading to the progress of the reaction. In this work, it has beendemonstrated that the addition of dibutyl ether allows shifting the reaction equilibrium, increasingthe production of diethers. From the study of the main operating conditions, it was determinedthat an increase in the concentration of the solvent has a positive effect on the selectivity towardsthe production of diethers, the concentration of the catalyst (a commercial ion exchange resin,Amberlyst 15, named A-15) and the reaction temperature were also determining variables. Workingwith concentrations of tert-butyl alcohol above the stoichiometric one did not report great advantages.The optimal operating conditions to maximize the conversion of glycerol and the selectivity towardsdiethers were: 70 ◦C, 20% catalyst (referred to the total starting mass of the system), the stoichiometricratio of glycerol:tert-butyl alcohol (G:TB = 1:3) and 1:2 molar ratio of dibutyl ether:tert-butyl alcohol.A study of three consecutive reaction cycles showed the high stability of the catalyst, obtainingidentical results.
Keywords: etherification; glycerol; tert-butyl alcohol; dibutyl ether; A-15; catalyst stability
1. Introduction
The renewable and biodegradable character of biodiesel has made it an interesting alternative tothe use of conventional fuels [1–3]. Its use as combustible for diesel engines has greatly grown in recentdecades [4] and is expected to grow further in the next years [5,6]. Biodiesel is a mixture of methylesters of fatty acids [7], synthesized from animal or vegetable fats, which are non-toxic, biodegradableand renewable resources [8], obtaining glycerol (G) (about 1 kg of glycerol is generated for every 9 kgof biodiesel) as the main by-product of the process [4,9]. As a direct consequence of the increase inbiodiesel production, the price of glycerol has considerably dropped [6]. Therefore, finding solutionsfor the valorization of this by-product to added value chemicals could improve the economy of theprocess [10]. Thus, the production of biodiesel on a large scale will be aided if adequate technologiescapable of converting glycerol into added value chemicals are developed [11]. There are severalindustrial processes that use glycerol as raw material (oligomerization/polymerization, pyrolysisand gasification, selective oxidation, steam reforming, selective transesterification, etherification tofuel-oxygenates, etc.) [12,13]. Another alternative is the production of glycerol carbonate (an importantglycerol derivative commonly used as a solvent in cosmetics, personal care items and medicine) fromthe catalytic oxidative carbonylation of the parent compound [14]. Among the existing options, aninteresting alternative for the excess of glycerol generated is its transformation into oxygenated additives
Catalysts 2019, 9, 378; doi:10.3390/catal9040378 www.mdpi.com/journal/catalysts147
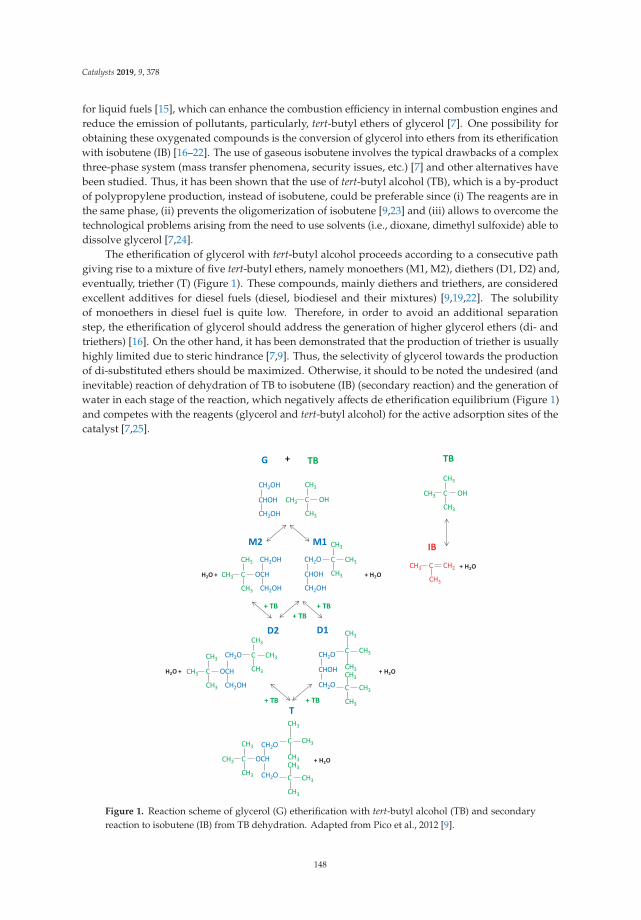
Catalysts 2019, 9, 378
for liquid fuels [15], which can enhance the combustion efficiency in internal combustion engines andreduce the emission of pollutants, particularly, tert-butyl ethers of glycerol [7]. One possibility forobtaining these oxygenated compounds is the conversion of glycerol into ethers from its etherificationwith isobutene (IB) [16–22]. The use of gaseous isobutene involves the typical drawbacks of a complexthree-phase system (mass transfer phenomena, security issues, etc.) [7] and other alternatives havebeen studied. Thus, it has been shown that the use of tert-butyl alcohol (TB), which is a by-productof polypropylene production, instead of isobutene, could be preferable since (i) The reagents are inthe same phase, (ii) prevents the oligomerization of isobutene [9,23] and (iii) allows to overcome thetechnological problems arising from the need to use solvents (i.e., dioxane, dimethyl sulfoxide) able todissolve glycerol [7,24].
The etherification of glycerol with tert-butyl alcohol proceeds according to a consecutive pathgiving rise to a mixture of five tert-butyl ethers, namely monoethers (M1, M2), diethers (D1, D2) and,eventually, triether (T) (Figure 1). These compounds, mainly diethers and triethers, are consideredexcellent additives for diesel fuels (diesel, biodiesel and their mixtures) [9,19,22]. The solubilityof monoethers in diesel fuel is quite low. Therefore, in order to avoid an additional separationstep, the etherification of glycerol should address the generation of higher glycerol ethers (di- andtriethers) [16]. On the other hand, it has been demonstrated that the production of triether is usuallyhighly limited due to steric hindrance [7,9]. Thus, the selectivity of glycerol towards the productionof di-substituted ethers should be maximized. Otherwise, it should to be noted the undesired (andinevitable) reaction of dehydration of TB to isobutene (IB) (secondary reaction) and the generation ofwater in each stage of the reaction, which negatively affects de etherification equilibrium (Figure 1)and competes with the reagents (glycerol and tert-butyl alcohol) for the active adsorption sites of thecatalyst [7,25].
Figure 1. Reaction scheme of glycerol (G) etherification with tert-butyl alcohol (TB) and secondaryreaction to isobutene (IB) from TB dehydration. Adapted from Pico et al., 2012 [9].
148
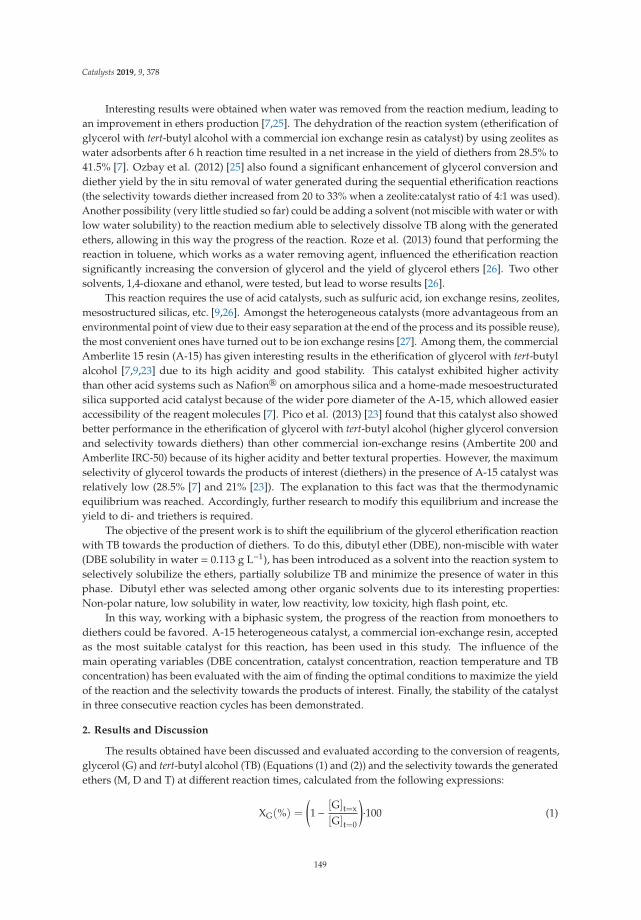
Catalysts 2019, 9, 378
Interesting results were obtained when water was removed from the reaction medium, leading toan improvement in ethers production [7,25]. The dehydration of the reaction system (etherification ofglycerol with tert-butyl alcohol with a commercial ion exchange resin as catalyst) by using zeolites aswater adsorbents after 6 h reaction time resulted in a net increase in the yield of diethers from 28.5% to41.5% [7]. Ozbay et al. (2012) [25] also found a significant enhancement of glycerol conversion anddiether yield by the in situ removal of water generated during the sequential etherification reactions(the selectivity towards diether increased from 20 to 33% when a zeolite:catalyst ratio of 4:1 was used).Another possibility (very little studied so far) could be adding a solvent (not miscible with water or withlow water solubility) to the reaction medium able to selectively dissolve TB along with the generatedethers, allowing in this way the progress of the reaction. Roze et al. (2013) found that performing thereaction in toluene, which works as a water removing agent, influenced the etherification reactionsignificantly increasing the conversion of glycerol and the yield of glycerol ethers [26]. Two othersolvents, 1,4-dioxane and ethanol, were tested, but lead to worse results [26].
This reaction requires the use of acid catalysts, such as sulfuric acid, ion exchange resins, zeolites,mesostructured silicas, etc. [9,26]. Amongst the heterogeneous catalysts (more advantageous from anenvironmental point of view due to their easy separation at the end of the process and its possible reuse),the most convenient ones have turned out to be ion exchange resins [27]. Among them, the commercialAmberlite 15 resin (A-15) has given interesting results in the etherification of glycerol with tert-butylalcohol [7,9,23] due to its high acidity and good stability. This catalyst exhibited higher activitythan other acid systems such as Nafion® on amorphous silica and a home-made mesoestructuratedsilica supported acid catalyst because of the wider pore diameter of the A-15, which allowed easieraccessibility of the reagent molecules [7]. Pico et al. (2013) [23] found that this catalyst also showedbetter performance in the etherification of glycerol with tert-butyl alcohol (higher glycerol conversionand selectivity towards diethers) than other commercial ion-exchange resins (Ambertite 200 andAmberlite IRC-50) because of its higher acidity and better textural properties. However, the maximumselectivity of glycerol towards the products of interest (diethers) in the presence of A-15 catalyst wasrelatively low (28.5% [7] and 21% [23]). The explanation to this fact was that the thermodynamicequilibrium was reached. Accordingly, further research to modify this equilibrium and increase theyield to di- and triethers is required.
The objective of the present work is to shift the equilibrium of the glycerol etherification reactionwith TB towards the production of diethers. To do this, dibutyl ether (DBE), non-miscible with water(DBE solubility in water = 0.113 g L−1), has been introduced as a solvent into the reaction system toselectively solubilize the ethers, partially solubilize TB and minimize the presence of water in thisphase. Dibutyl ether was selected among other organic solvents due to its interesting properties:Non-polar nature, low solubility in water, low reactivity, low toxicity, high flash point, etc.
In this way, working with a biphasic system, the progress of the reaction from monoethers todiethers could be favored. A-15 heterogeneous catalyst, a commercial ion-exchange resin, acceptedas the most suitable catalyst for this reaction, has been used in this study. The influence of themain operating variables (DBE concentration, catalyst concentration, reaction temperature and TBconcentration) has been evaluated with the aim of finding the optimal conditions to maximize the yieldof the reaction and the selectivity towards the products of interest. Finally, the stability of the catalystin three consecutive reaction cycles has been demonstrated.
2. Results and Discussion
The results obtained have been discussed and evaluated according to the conversion of reagents,glycerol (G) and tert-butyl alcohol (TB) (Equations (1) and (2)) and the selectivity towards the generatedethers (M, D and T) at different reaction times, calculated from the following expressions:
XG(%) =
(1− [G]t=x
[G]t=0
)·100 (1)
149

Catalysts 2019, 9, 378
XTB(%) =
(1− [TB]t=x
[TB]t=0
)·100 (2)
SM(%) =[M]t=x
[M]t=x + [D]t=x + [T]t=x·100 (3)
SD(%) =[D]t=x
[M]t=x + [D]t=x + [T]t=x·100 (4)
ST(%) =[T]t=x
[M]t=x + [D]t=x + [T]t=x·100 (5)
The terms SM and SD include the selectivity towards the two monoethers (M1 +M2) and diethers(D1 + D2), respectively (see Figure 1). The sum of selectivities (SM + SD + ST) is equal to 100%.The selectivity towards the triether (T) was in all the experiments below 1% (probably due to sterichindrance [7,9]) so it has not been considered in the discussion of results.
In addition to the parameters discussed above, the selectivity towards the production isobutene(IB), an undesired product of the reaction (Figure 1), and calculated from Equation (6) at 360 min ofreaction time, has also been taken into account:
SIB(%) =[IB]t=360
[M]t=360 + 2·[D]t=360 + 3·[T]t=360 + [IB]t=360·100 (6)
2.1. Preliminary Results: Solubility Study
The aim of introducing DBE as a solvent in the etherification reaction between TB and G is toimprove the production of diethers (compounds with higher added value than monoethers). For thatpurpose, it is necessary that the first products of the reaction (M1 and M2), as well as a fraction of TB(to continue the etherification reaction), are selectively solubilized in the organic phase (DBE), keepingmost of the water generated in the other phase. In this way, the reaction equilibrium could be modified.
The distribution of the different compounds selected to carry out this essay (see Section 4.3.1.Solubility test) in the two phases (named as hydrophilic and hydrophobic phases), determined bygas-chromatographic and Karl Fischer analyses, is collected in Table 1. As can be seen, 100% of Gremained in the hydrophilic phase, while most of TB (77%) and M1 (61%) were solubilized in thehydrophobic phase. Thus, the presence of DBE led to a different compounds-distribution, obtainingM1 (reaction product) and TB (reagent necessary for the progress of the reaction) preferentially in thehydrophobic phase. In view of these results, most of the water (84%) was removed from the reactionphase, an improvement in the selectivity towards the products of interest can be expected.
Table 1. Distribution of the compounds involved in the etherification of G in the hydrophilic andhydrophobic phases.
Compound Hydrophilic Phase (%) Hydrophobic Phase (%)
TB 23 77DBE 2 98M1 39 61G 100 0
water 84 16
TB (tert-butanol), DBE (dibutyl ether), M1 (monoether, 1-terbutoxipropano-2,3-diol), G (Glycerol).
2.2. Role of DBE as Solvent in the Etherification of Glycerol
To verify this hypothesis (modification of the reaction equilibrium and positive effect of DBE onthe etherification reaction of G with TB), the selectivity of G towards the reaction products (M and D)obtained in the presence of DBE (experiment R5, Table 3, Materials and Methods section) was compared,
150
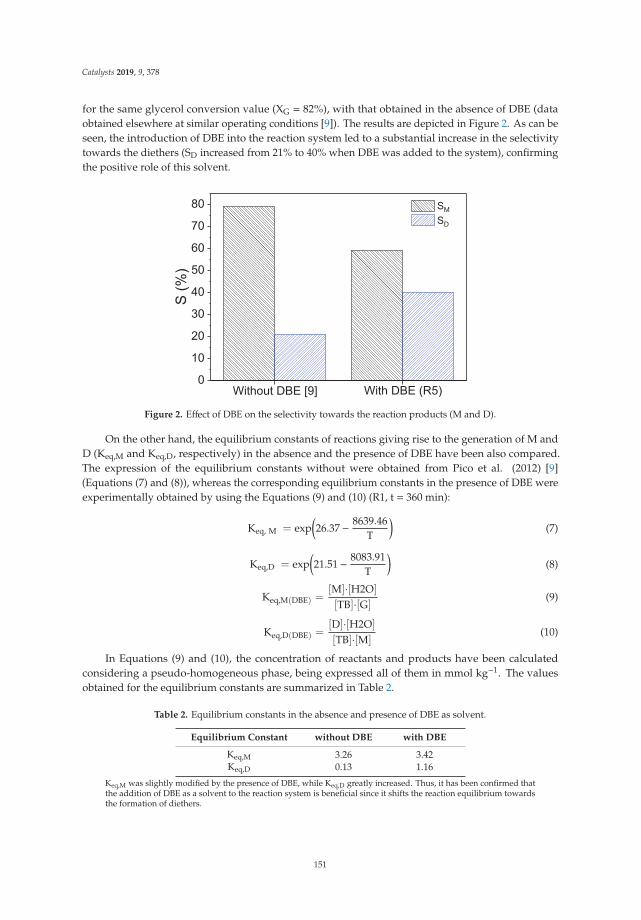
Catalysts 2019, 9, 378
for the same glycerol conversion value (XG = 82%), with that obtained in the absence of DBE (dataobtained elsewhere at similar operating conditions [9]). The results are depicted in Figure 2. As can beseen, the introduction of DBE into the reaction system led to a substantial increase in the selectivitytowards the diethers (SD increased from 21% to 40% when DBE was added to the system), confirmingthe positive role of this solvent.
Figure 2. Effect of DBE on the selectivity towards the reaction products (M and D).
On the other hand, the equilibrium constants of reactions giving rise to the generation of M andD (Keq,M and Keq,D, respectively) in the absence and the presence of DBE have been also compared.The expression of the equilibrium constants without were obtained from Pico et al. (2012) [9](Equations (7) and (8)), whereas the corresponding equilibrium constants in the presence of DBE wereexperimentally obtained by using the Equations (9) and (10) (R1, t = 360 min):
Keq, M = exp(26.37− 8639.46
T
)(7)
Keq,D = exp(21.51− 8083.91
T
)(8)
Keq,M(DBE) =[M]·[H2O]
[TB]·[G](9)
Keq,D(DBE) =[D]·[H2O]
[TB]·[M](10)
In Equations (9) and (10), the concentration of reactants and products have been calculatedconsidering a pseudo-homogeneous phase, being expressed all of them in mmol kg−1. The valuesobtained for the equilibrium constants are summarized in Table 2.
Table 2. Equilibrium constants in the absence and presence of DBE as solvent.
Equilibrium Constant without DBE with DBE
Keq,M 3.26 3.42Keq,D 0.13 1.16
Keq,M was slightly modified by the presence of DBE, while Keq,D greatly increased. Thus, it has been confirmed thatthe addition of DBE as a solvent to the reaction system is beneficial since it shifts the reaction equilibrium towardsthe formation of diethers.
151
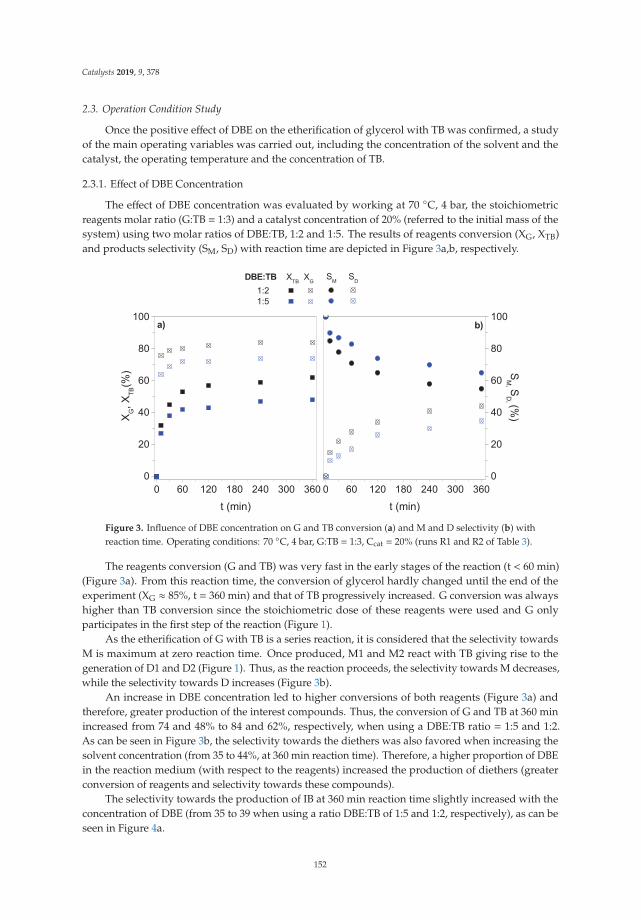
Catalysts 2019, 9, 378
2.3. Operation Condition Study
Once the positive effect of DBE on the etherification of glycerol with TB was confirmed, a studyof the main operating variables was carried out, including the concentration of the solvent and thecatalyst, the operating temperature and the concentration of TB.
2.3.1. Effect of DBE Concentration
The effect of DBE concentration was evaluated by working at 70 ◦C, 4 bar, the stoichiometricreagents molar ratio (G:TB = 1:3) and a catalyst concentration of 20% (referred to the initial mass of thesystem) using two molar ratios of DBE:TB, 1:2 and 1:5. The results of reagents conversion (XG, XTB)and products selectivity (SM, SD) with reaction time are depicted in Figure 3a,b, respectively.
Figure 3. Influence of DBE concentration on G and TB conversion (a) and M and D selectivity (b) withreaction time. Operating conditions: 70 ◦C, 4 bar, G:TB = 1:3, Ccat = 20% (runs R1 and R2 of Table 3).
The reagents conversion (G and TB) was very fast in the early stages of the reaction (t < 60 min)(Figure 3a). From this reaction time, the conversion of glycerol hardly changed until the end of theexperiment (XG ≈ 85%, t = 360 min) and that of TB progressively increased. G conversion was alwayshigher than TB conversion since the stoichiometric dose of these reagents were used and G onlyparticipates in the first step of the reaction (Figure 1).
As the etherification of G with TB is a series reaction, it is considered that the selectivity towardsM is maximum at zero reaction time. Once produced, M1 and M2 react with TB giving rise to thegeneration of D1 and D2 (Figure 1). Thus, as the reaction proceeds, the selectivity towards M decreases,while the selectivity towards D increases (Figure 3b).
An increase in DBE concentration led to higher conversions of both reagents (Figure 3a) andtherefore, greater production of the interest compounds. Thus, the conversion of G and TB at 360 minincreased from 74 and 48% to 84 and 62%, respectively, when using a DBE:TB ratio = 1:5 and 1:2.As can be seen in Figure 3b, the selectivity towards the diethers was also favored when increasing thesolvent concentration (from 35 to 44%, at 360 min reaction time). Therefore, a higher proportion of DBEin the reaction medium (with respect to the reagents) increased the production of diethers (greaterconversion of reagents and selectivity towards these compounds).
The selectivity towards the production of IB at 360 min reaction time slightly increased with theconcentration of DBE (from 35 to 39 when using a ratio DBE:TB of 1:5 and 1:2, respectively), as can beseen in Figure 4a.
152

Catalysts 2019, 9, 378
Finally, it must be pointed out that the addition of DBE to the reaction system is not a majorproblem because TB and DBE can be easily recycled from the hydrophobic phase (by distillation) andbeing reused in a new cycle. Besides, this leads to the recovery of purified ethers from the reactionmedia. Thus, it was decided to work with the highest concentration tested of this solvent in thefollowing experiments (DBE:TB = 1:2).
Figure 4. Effect of different operating variables on IB selectivity. Operating conditions: 70 ◦C, G:TB = 1:3,Ccat = 20% (a), 70 ◦C, G:TB = 1:3, DBE:TB = 1:2 (b), G:TB = 1:3, DBE:TB = 1:2, Ccat = 20% (c) 70 ◦C,DBE:TB = 1:2, Ccat = 20% (d).
2.3.2. Effect of Catalyst Concentration
In previous works, it was found that the optimal concentration of A-15 in the etherification of Gwith TB was 7.5% [9]. However, considering that the reaction equilibrium has been modified due tothe addition of DBE, this parameter may have been affected and it must be studied again.
Thus, the influence of A-15 concentration working with three catalyst loads (10, 20 and 30%) andmaintaining constant the other operating variables (70 ◦C, 4 bar, G:TB = 1:3, DBE:TB = 1:2) has beenevaluated. A control experiment without catalyst was also performed, obtaining negligible conversionsof the reagents during 360 min (data not shown), which is in agreement with the results previouslypublished in the absence of co-solvent [7]. As can be seen in Figure 5a, the conversion of G greatlyincreased by increasing the concentration of A-15 from 10 to 20%, but this increase was negligible forhigher concentrations. Surprisingly, the conversion of TB when using a catalyst concentration of 20%(R1) was higher than the corresponding to a catalyst load of 30% (R4). A catalyst content in the reactionmedium of 30% could be excessive, resulting probably in the formation of aggregates, which reducesthe active area of the catalyst and therefore, part of the catalytic surface could remain inaccessible tothe reagents.
Furthermore, the selectivity towards the diethers greatly improved (from 26 to 44% at 360 minreaction time) by increasing the concentration of the catalyst from 10 to 20%, but no improvement wasobtained when operating with higher catalyst concentrations (Figure 5b).
On the other hand, the concentration of catalyst seems to have no significant effect on theselectivity towards isobutene (Figure 4b). Consequently, it has been estimated that the optimal catalystconcentration in this system is 20%.
153
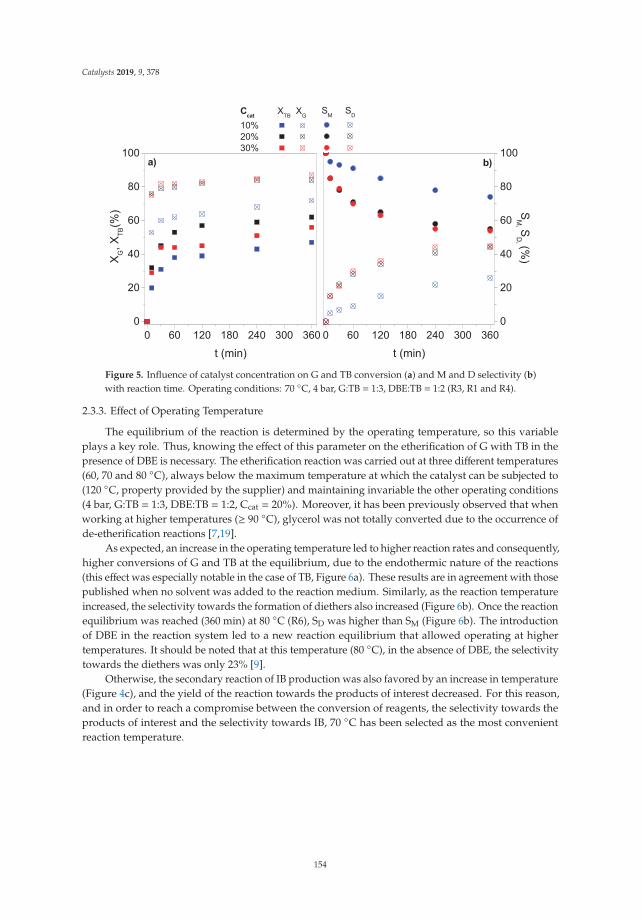
Catalysts 2019, 9, 378
Figure 5. Influence of catalyst concentration on G and TB conversion (a) and M and D selectivity (b)with reaction time. Operating conditions: 70 ◦C, 4 bar, G:TB = 1:3, DBE:TB = 1:2 (R3, R1 and R4).
2.3.3. Effect of Operating Temperature
The equilibrium of the reaction is determined by the operating temperature, so this variableplays a key role. Thus, knowing the effect of this parameter on the etherification of G with TB in thepresence of DBE is necessary. The etherification reaction was carried out at three different temperatures(60, 70 and 80 ◦C), always below the maximum temperature at which the catalyst can be subjected to(120 ◦C, property provided by the supplier) and maintaining invariable the other operating conditions(4 bar, G:TB = 1:3, DBE:TB = 1:2, Ccat = 20%). Moreover, it has been previously observed that whenworking at higher temperatures (≥ 90 ◦C), glycerol was not totally converted due to the occurrence ofde-etherification reactions [7,19].
As expected, an increase in the operating temperature led to higher reaction rates and consequently,higher conversions of G and TB at the equilibrium, due to the endothermic nature of the reactions(this effect was especially notable in the case of TB, Figure 6a). These results are in agreement with thosepublished when no solvent was added to the reaction medium. Similarly, as the reaction temperatureincreased, the selectivity towards the formation of diethers also increased (Figure 6b). Once the reactionequilibrium was reached (360 min) at 80 ◦C (R6), SD was higher than SM (Figure 6b). The introductionof DBE in the reaction system led to a new reaction equilibrium that allowed operating at highertemperatures. It should be noted that at this temperature (80 ◦C), in the absence of DBE, the selectivitytowards the diethers was only 23% [9].
Otherwise, the secondary reaction of IB production was also favored by an increase in temperature(Figure 4c), and the yield of the reaction towards the products of interest decreased. For this reason,and in order to reach a compromise between the conversion of reagents, the selectivity towards theproducts of interest and the selectivity towards IB, 70 ◦C has been selected as the most convenientreaction temperature.
154
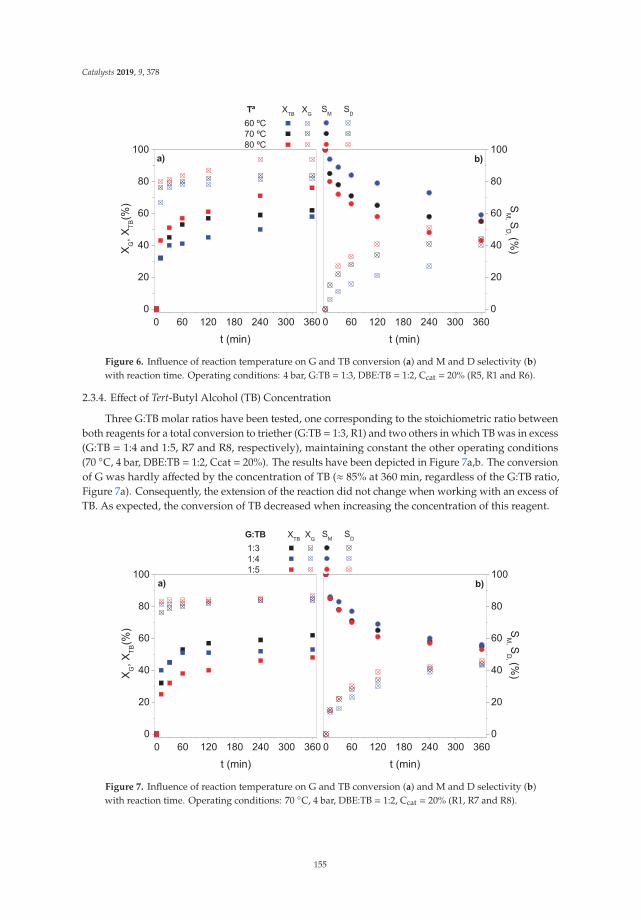
Catalysts 2019, 9, 378
Figure 6. Influence of reaction temperature on G and TB conversion (a) and M and D selectivity (b)with reaction time. Operating conditions: 4 bar, G:TB = 1:3, DBE:TB = 1:2, Ccat = 20% (R5, R1 and R6).
2.3.4. Effect of Tert-Butyl Alcohol (TB) Concentration
Three G:TB molar ratios have been tested, one corresponding to the stoichiometric ratio betweenboth reagents for a total conversion to triether (G:TB = 1:3, R1) and two others in which TB was in excess(G:TB = 1:4 and 1:5, R7 and R8, respectively), maintaining constant the other operating conditions(70 ◦C, 4 bar, DBE:TB = 1:2, Ccat = 20%). The results have been depicted in Figure 7a,b. The conversionof G was hardly affected by the concentration of TB (≈ 85% at 360 min, regardless of the G:TB ratio,Figure 7a). Consequently, the extension of the reaction did not change when working with an excess ofTB. As expected, the conversion of TB decreased when increasing the concentration of this reagent.
Figure 7. Influence of reaction temperature on G and TB conversion (a) and M and D selectivity (b)with reaction time. Operating conditions: 70 ◦C, 4 bar, DBE:TB = 1:2, Ccat = 20% (R1, R7 and R8).
155
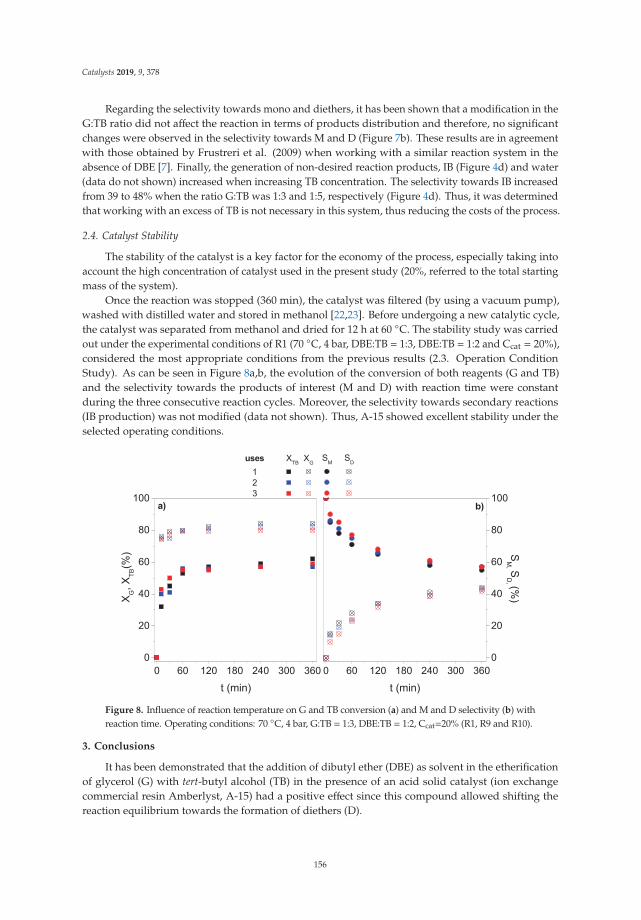
Catalysts 2019, 9, 378
Regarding the selectivity towards mono and diethers, it has been shown that a modification in theG:TB ratio did not affect the reaction in terms of products distribution and therefore, no significantchanges were observed in the selectivity towards M and D (Figure 7b). These results are in agreementwith those obtained by Frustreri et al. (2009) when working with a similar reaction system in theabsence of DBE [7]. Finally, the generation of non-desired reaction products, IB (Figure 4d) and water(data do not shown) increased when increasing TB concentration. The selectivity towards IB increasedfrom 39 to 48% when the ratio G:TB was 1:3 and 1:5, respectively (Figure 4d). Thus, it was determinedthat working with an excess of TB is not necessary in this system, thus reducing the costs of the process.
2.4. Catalyst Stability
The stability of the catalyst is a key factor for the economy of the process, especially taking intoaccount the high concentration of catalyst used in the present study (20%, referred to the total startingmass of the system).
Once the reaction was stopped (360 min), the catalyst was filtered (by using a vacuum pump),washed with distilled water and stored in methanol [22,23]. Before undergoing a new catalytic cycle,the catalyst was separated from methanol and dried for 12 h at 60 ◦C. The stability study was carriedout under the experimental conditions of R1 (70 ◦C, 4 bar, DBE:TB = 1:3, DBE:TB = 1:2 and Ccat = 20%),considered the most appropriate conditions from the previous results (2.3. Operation ConditionStudy). As can be seen in Figure 8a,b, the evolution of the conversion of both reagents (G and TB)and the selectivity towards the products of interest (M and D) with reaction time were constantduring the three consecutive reaction cycles. Moreover, the selectivity towards secondary reactions(IB production) was not modified (data not shown). Thus, A-15 showed excellent stability under theselected operating conditions.
Figure 8. Influence of reaction temperature on G and TB conversion (a) and M and D selectivity (b) withreaction time. Operating conditions: 70 ◦C, 4 bar, G:TB = 1:3, DBE:TB = 1:2, Ccat=20% (R1, R9 and R10).
3. Conclusions
It has been demonstrated that the addition of dibutyl ether (DBE) as solvent in the etherificationof glycerol (G) with tert-butyl alcohol (TB) in the presence of an acid solid catalyst (ion exchangecommercial resin Amberlyst, A-15) had a positive effect since this compound allowed shifting thereaction equilibrium towards the formation of diethers (D).
156
Catalysts 2019, 9, 378
The study of the main operating conditions revealed that an increase in the concentration of DBEimproved the conversion of reagents (G and TB) and the selectivity towards the products of interest(D) without modifying the production of isobutene (IB), an undesired by-product. The concentrationof catalyst played an important role, increasing the production and selectivity to diethers. It has beendetermined that the optimal concentration of A-15 was 20%. On the other hand, an increase in theoperating temperature (from 60 to 80 ◦C) greatly increased the selectivity towards diethers. However,it is necessary to reach a compromise value (Ta = 70 ◦C) to minimize the undesired productionof IB. Finally, the molar ratio G:TB had negligible influence on the performance of the reaction.Therefore, it has been concluded that working with the stoichiometric ratio (G:TB = 1:3) is the mostconvenient option.
The reuse of the catalyst in three consecutive reaction cycles showed its high stability, achievingidentical results in terms of reagents conversion and selectivity towards the products of interest.
4. Materials and Methods
4.1. Reagents
Anhydrous glycerol (G, C3H8O3, purity ≥ 99.8%), supplied by Fluka (Bucharest, Romania),and anhydrous tert-butyl alcohol (TB, C4H10O, purity≥ 99.5%), provided by Sigma-Aldrich (Darmstadt,Germany), were employed as reagents. Dibutyl ether (DBE, C8H18O, purity ≥ 99.3%), purchasedby Sigma-Aldrich was used as solvent to improve the performance of the etherification reaction.Pyridine reagent grade (C5H5N, purity ≥ 99.5%), supplied by Scharlau (Madrid, Spain), was used assolvent for the preparation of the samples before analysis. 1-terbutoxipropano-2,3-diol (M1) was usedfor the calibration of the gas chromatograph (GC). 1-Pentanol (C5H12O, purity ≥ 99%) supplied bySigma-Aldrich (Darmstadt, Germany), was employed as internal standard compound (ISTD) in the GCanalysis. Hydranal-Composite 5 and dry Hydranal-Methanol, both from Sigma-Aldrich (Darmstadt,Germany), were used as reactive compound and solvent, respectively, for the water analysis. Methanol(CH4O, purity ≥ 99.8%, Sigma-Aldrich, -Darmstadt, Germany) was used to wash the catalyst betweensuccessive reactions.
4.2. Catalyst
Commercial acid ion-exchange resin Amberlyst 15 (A-15) was supplied by Fluka (Bucharest,Romania) and used as received, without further treatments. This catalyst was selected byPico et al. (2012) as the most interesting material among three types of commercial ion exchange resins(i.e., Amberlyst 15, Amberlite 200 and Amberlite IRC-50) tested in the etherification of glycerol [9].The A-15 resin showed the highest activity (glycerol conversion) and selectivity towards the desiredproduct (diethers, D).
The BET surface area, average pore volume, external surface area, and average pore diameter areSBET = 44 m2 g−1, Vp = 0.338 cm3 g−1, At = 44 m2 g−1, and dp = 50 × 10−8 m, respectively. The exchangecapacity of the catalysts studied (NaCl 0.5 mol L−1 and NaOH 0.1 mol L−1) is 4.05 eq Kg−1. Furtherinformation and details about A-15 characterization can be found elsewhere [9].
4.3. Etherification Experiments
4.3.1. Solubility Test
Firstly, a solubility test of the compounds involved in the reaction (G, TB), as well as the onlyether commercially available (M1), was carried out in a water:DBE system (1:1). The aim of thispreliminary experiment is to study the distribution of reagents and products between both phasesaqueous (hydrophilic) and organic (hydrophobic). This test was carried out at atmospheric pressureand ambient temperature, so the quantitative results could not be directly extrapolated to those
157
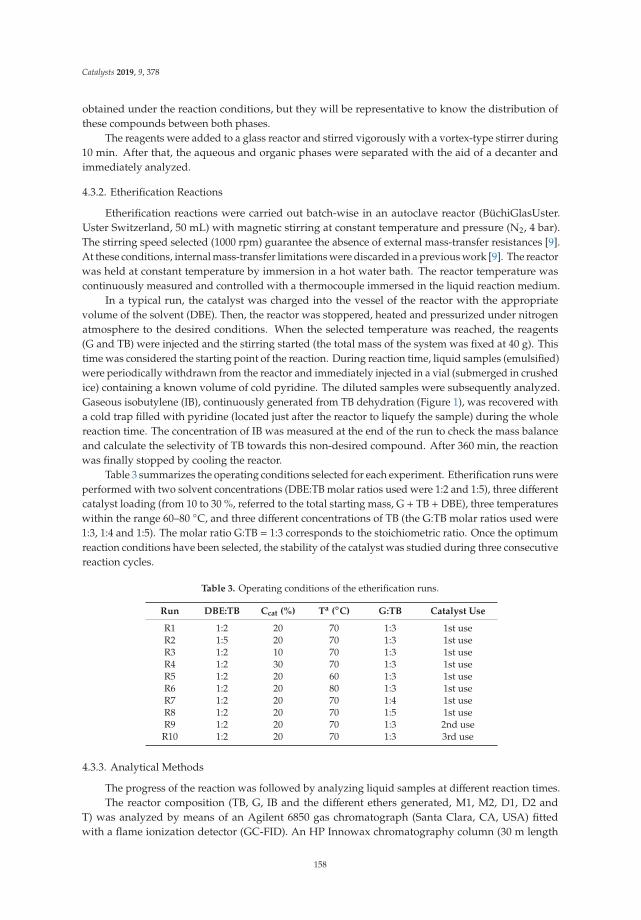
Catalysts 2019, 9, 378
obtained under the reaction conditions, but they will be representative to know the distribution ofthese compounds between both phases.
The reagents were added to a glass reactor and stirred vigorously with a vortex-type stirrer during10 min. After that, the aqueous and organic phases were separated with the aid of a decanter andimmediately analyzed.
4.3.2. Etherification Reactions
Etherification reactions were carried out batch-wise in an autoclave reactor (BüchiGlasUster.Uster Switzerland, 50 mL) with magnetic stirring at constant temperature and pressure (N2, 4 bar).The stirring speed selected (1000 rpm) guarantee the absence of external mass-transfer resistances [9].At these conditions, internal mass-transfer limitations were discarded in a previous work [9]. The reactorwas held at constant temperature by immersion in a hot water bath. The reactor temperature wascontinuously measured and controlled with a thermocouple immersed in the liquid reaction medium.
In a typical run, the catalyst was charged into the vessel of the reactor with the appropriatevolume of the solvent (DBE). Then, the reactor was stoppered, heated and pressurized under nitrogenatmosphere to the desired conditions. When the selected temperature was reached, the reagents(G and TB) were injected and the stirring started (the total mass of the system was fixed at 40 g). Thistime was considered the starting point of the reaction. During reaction time, liquid samples (emulsified)were periodically withdrawn from the reactor and immediately injected in a vial (submerged in crushedice) containing a known volume of cold pyridine. The diluted samples were subsequently analyzed.Gaseous isobutylene (IB), continuously generated from TB dehydration (Figure 1), was recovered witha cold trap filled with pyridine (located just after the reactor to liquefy the sample) during the wholereaction time. The concentration of IB was measured at the end of the run to check the mass balanceand calculate the selectivity of TB towards this non-desired compound. After 360 min, the reactionwas finally stopped by cooling the reactor.
Table 3 summarizes the operating conditions selected for each experiment. Etherification runs wereperformed with two solvent concentrations (DBE:TB molar ratios used were 1:2 and 1:5), three differentcatalyst loading (from 10 to 30 %, referred to the total starting mass, G + TB + DBE), three temperatureswithin the range 60–80 ◦C, and three different concentrations of TB (the G:TB molar ratios used were1:3, 1:4 and 1:5). The molar ratio G:TB = 1:3 corresponds to the stoichiometric ratio. Once the optimumreaction conditions have been selected, the stability of the catalyst was studied during three consecutivereaction cycles.
Table 3. Operating conditions of the etherification runs.
Run DBE:TB Ccat (%) Ta (◦C) G:TB Catalyst Use
R1 1:2 20 70 1:3 1st useR2 1:5 20 70 1:3 1st useR3 1:2 10 70 1:3 1st useR4 1:2 30 70 1:3 1st useR5 1:2 20 60 1:3 1st useR6 1:2 20 80 1:3 1st useR7 1:2 20 70 1:4 1st useR8 1:2 20 70 1:5 1st useR9 1:2 20 70 1:3 2nd useR10 1:2 20 70 1:3 3rd use
4.3.3. Analytical Methods
The progress of the reaction was followed by analyzing liquid samples at different reaction times.The reactor composition (TB, G, IB and the different ethers generated, M1, M2, D1, D2 and
T) was analyzed by means of an Agilent 6850 gas chromatograph (Santa Clara, CA, USA) fittedwith a flame ionization detector (GC-FID). An HP Innowax chromatography column (30 m length
158
Catalysts 2019, 9, 378
× 0.32 mm internal diameter) was used as stationary phase. The chromatographic conditionsselected were the following: Initial oven temperature 40 ◦C, final oven temperature 220 ◦C, programrate 20 ◦C min−1. 1-Pentanol was used as internal standard, ISTD, to minimize the error in thequantification of the different compounds. Commercial 1-tert-butoxypropane-2,3-diol (M1) wasemployed to obtain the corresponding response factor for this compound, which was extrapolated tothe non-commercial products such as 2-tert-butoxypropane-1,3-diol (M2), 1,3-di-tert-butoxypropan-2-ol(D1), 1,2-di-tert-butoxypropan-3-ol (D2), and 1,2,3- tri-tert-butoxypropane (T).
Water concentration (generated in the different steps of the reaction) was measured at the end of theexperiment (360 min) with a quantitative Karl Fischer analyzer (Titromatic 1S Crison, Barcelona, Spain).
Author Contributions: A.S. and A.R. made substantive intellectual contributions to this study, especially with theconceptualization and the methodology used. C.M.D. conceived and performed the experiments and wrote thepaper. All the authors have been also involved in drafting and revising the manuscript, so that everyone has givenfinal approval of the current version to be published in Catalysts Journal.
Funding: This research received no external funding.
Acknowledgments: Carmen M. Domínguez acknowledges the Spanish MICINN for the “Juan de la Cierva”post-doctoral grant (FJCI-2016-28462).
Conflicts of Interest: The authors declare no conflict of interest.
References
1. Demirbas, A. Progress and recent trends in biofuels. Prog. Energy Combust. Sci. 2007, 33, 1–18. [CrossRef]2. Sani, Y.M.; Daud, W.M.A.W.; Aziz, A.R.A. Activity of solid acid catalysts for biodiesel production: A critical
review. Appl. Catal. A 2014, 470, 140–161. [CrossRef]3. Knothe, G.; Krahl, J.; Van Gerpen, J. The Biodiesel Handbook; Elsevier: Amsterdam, The Netherlands, 2015.4. Meher, L.; Sagar, D.V.; Naik, S. Technical aspects of biodiesel production by transesterification—A review.
Renew. Sustain. Energy Rev. 2006, 10, 248–268. [CrossRef]5. Melero, J.A.; Vicente, G.; Paniagua, M.; Morales, G.; Muñoz, P. Etherification of biodiesel-derived glycerol
with ethanol for fuel formulation over sulfonic modified catalysts. Bioresour. Technol. 2012, 103, 142–151.[CrossRef]
6. Jaworski, M.A.; Vega, S.R.; Siri, G.J.; Casella, M.L.; Salvador, A.R.; López, A.S. Glycerol etherification withbenzyl alcohol over sulfated zirconia catalysts. Appl. Catal. A 2015, 505, 36–43. [CrossRef]
7. Frusteri, F.; Arena, F.; Bonura, G.; Cannilla, C.; Spadaro, L.; Di Blasi, O. Catalytic etherification of glycerol bytert-butyl alcohol to produce oxygenated additives for diesel fuel. Appl. Catal. A 2009, 367, 77–83. [CrossRef]
8. Bozbas, K. Biodiesel as an alternative motor fuel: Production and policies in the European Union.Renew. Sustain. Energy Rev. 2008, 12, 542–552. [CrossRef]
9. Pico, M.P.; Romero, A.; Rodríguez, S.; Santos, A. Etherification of glycerol by tert-butyl alcohol. Ind. Eng.Chem. Res. 2012, 51, 9500–9509. [CrossRef]
10. Pico, M.P.; Rodríguez, S.; Santos, A.; Romero, A. Etherification of glycerol with benzyl alcohol. Ind. Eng.Chem. Res. 2013, 52, 14545–14555. [CrossRef]
11. Marchetti, J.; Miguel, V.; Errazu, A. Possible methods for biodiesel production. Renew. Sustain. Energy Rev.2007, 11, 1300–1311. [CrossRef]
12. Silva, P.H.R.; Gonçalves, V.L.C.; Mota, C.J.A. Glycerol acetals as anti-freezing additives for biodiesel.Bioresour. Technol. 2010, 101, 6225–6229. [CrossRef]
13. Sivaiah, M.V.; Robles-Manuel, S.; Valange, S.; Barrault, J. Recent developments in acid and base-catalyzedetherification of glycerol to polyglycerols. Catal. Today 2012, 198, 305–313. [CrossRef]
14. Gabriele, B.; Mancuso, R.; Salerno, G.; Veltri, L.; Costa, M.; Dibenedetto, A. A general and expedient synthesisof 5-and 6-membered cyclic carbonates by palladium-catalyzed oxidative carbonylation of 1, 2-and 1, 3-diols.ChemSusChem 2011, 4, 1778–1786. [CrossRef]
15. Karinen, R.; Krause, A. New biocomponents from glycerol. Appl. Catal. A 2006, 306, 128–133. [CrossRef]16. Klepácová, K.; Mravec, D.; Kaszonyi, A.; Bajus, M. Etherification of glycerol and ethylene glycol by
isobutylene. Appl. Catal. A 2007, 328, 1–13. [CrossRef]
159
Catalysts 2019, 9, 378
17. Klepácová, K.; Mravec, D.; Bajus, M. Tert-butylation of glycerol catalysed by ion-exchange resins. Appl. Catal. A.2005, 294, 141–147. [CrossRef]
18. Izquierdo, J.F.; Montiel, M.; Pales, I.; Outon, P.R.; Galan, M.; Jutglar, L.; Villarrubia, M.; Izquierdo, M.;Hermo, M.P.; Ariza, X. Fuel additives from glycerol etherification with light olefins: State of the art.Renew. Sustain. Energy Rev. 2012, 16, 6717–6724. [CrossRef]
19. Melero, J.A.; Vicente, G.; Morales, G.; Paniagua, M.; Moreno, J.M.; Roldán, R.; Ezquerro, A.; Pérez, C.Acid-catalyzed etherification of bio-glycerol and isobutylene over sulfonic mesostructured silicas.Appl. Catal. A 2008, 346, 44–51. [CrossRef]
20. Zhao, W.; Yang, B.; Yi, C.; Lei, Z.; Xu, J. Etherification of glycerol with isobutylene to produce oxygenateadditive using sulfonated peanut shell catalyst. Ind. Eng. Chem. Res. 2010, 49, 12399–12404. [CrossRef]
21. Lee, H.J.; Seung, D.; Filimonov, I.N.; Kim, H. Etherification of glycerol by isobutylene. Effects of the densityof acidic sites in ion-exchange resin on the distribution of products. Korean J. Chem. Eng. 2011, 28, 756–762.[CrossRef]
22. Lee, H.J.; Seung, D.; Jung, K.S.; Kim, H.; Filimonov, I.N. Etherification of glycerol by isobutylene: Tuning theproduct composition. Appl. Catal. A 2010, 390, 235–244. [CrossRef]
23. Pico, M.P.; Rosas, J.M.; Rodríguez, S.; Santos, A.; Romero, A. Glycerol etherification over acid ion exchangeresins: Effect of catalyst concentration and reusability. J. Chem. Technol. Biotechnol. 2013, 88, 2027–2038.[CrossRef]
24. Chang, J.; Chen, D. Optimization on the etherification of glycerol with tert-butyl alcohol. J. Taiwan Inst. Chem.Eng. 2011, 42, 760–767. [CrossRef]
25. Ozbay, N.; Oktar, N.; Dogu, G.; Dogu, T. Effects of sorption enhancement and isobutene formation onetherification of glycerol with tert-butyl alcohol in a flow reactor. Ind. Eng. Chem. Res. 2012, 26, 8788–8795.[CrossRef]
26. Roze, M.; Kampars, V.; Teivena, K.; Kampare, R.; Liepin, š, E. Catalytic etherification of glycerol with alcohols.Mat. Sci. Appl. Chem. 2013, 28, 67–72. [CrossRef]
27. Melero, J.A.; Iglesias, J.; Morales, G. Heterogeneous acid catalysts for biodiesel production: Current statusand future challenges. Green Chem. 2009, 11, 1285–1308. [CrossRef]
© 2019 by the authors. Licensee MDPI, Basel, Switzerland. This article is an open accessarticle distributed under the terms and conditions of the Creative Commons Attribution(CC BY) license (http://creativecommons.org/licenses/by/4.0/).
160
catalysts
Article
Effect of Metal Loading in Unpromoted and PromotedCoMo/Al2O3–TiO2 Catalysts for theHydrodeoxygenation of Phenol
J. Andrés Tavizón-Pozos 1,2,*, Carlos E. Santolalla-Vargas 3 , Omar U. Valdés-Martínez 1 and
José Antonio de los Reyes Heredia 1,*
1 Departamento de Ingeniería de Procesos e Hidráulica, Universidad Autónoma Metropolitana-Iztapalapa,Av. San Rafael Atlixco No. 86, Col. Leyes de Reforma 1ª Secc., Iztapalapa, C.P. 09310 Ciudad de México,Mexico; [email protected]
2 Cátedras CONACyT-Área Académica de Química, Universidad Autónoma del Estado de 5 Hidalgo,Carr. Pachuca-Tulancingo Km. 4.5, C.P. 42184 Pachuca, Hidalgo, Mexico
3 Departamento de Biociencias e Ingeniería, Centro Interdisciplinario de Investigaciones y Estudios sobreMedio Ambiente y Desarrollo, Instituto Politécnico Nacional, C.P. 07340 Ciudad de Mexico, Mexico;[email protected]
* Correspondence: [email protected] (J.A.d.l.R.H.); [email protected] (J.A.T.-P.)
Received: 29 May 2019; Accepted: 14 June 2019; Published: 19 June 2019
Abstract: This paper reports the effects of changes in the supported active phase concentration overtitania containing mixed oxides catalysts for hydrodeoxygenation (HDO). Mo and CoMo supportedon sol–gel Al2O3–TiO2 (Al/Ti = 2) were synthetized and tested for the HDO of phenol in a batchreactor at 5.5 MPa, 593 K, and 100 ppm S. Characterization results showed that the increase in Moloading led to an increase in the amount of oxide Mo species with octahedral coordination (MoOh),which produced more active sites and augmented the catalytic activity. The study of the change ofCo concentration allowed prototypes of the oxide species and their relationship with the CoMo/AT2activity to be described. Catalysts were tested at four different Co/(Co + Mo) ratios. The resultspresented a correlation between the available fraction of CoOh and the catalytic performance. At lowCoOh fractions (Co/(Co +Mo) = 0.1), Co could not promote all MoS2 slabs and metallic sites from thislatter phase performed the reaction. Also, at high Co/(Co +Mo) ratios (0.3 and 0.4), there was a lossof Co species. The Co/(Co +Mo) = 0.2 ratio presented an optimum amount of available CoOh andcatalytic activity since the XPS results indicated a higher concentration of the CoMoS phase than at ahigher ratio.
Keywords: hydrodeoxygenation; phenol; Al2O3-TiO2; CoMo; CoMoS; biofuels; MoS2
1. Introduction
Studies on the transformation of fast pyrolysis oils from lignocellulosic biomass as an alternativeto produce clean and renewable transportation fuels have been increasing for the last years [1–3].Bio-oil, rich in oxygenated compounds (30%–40%), needs to be upgraded to enhance its heatingvalue, chemical and thermal stability, and miscibility with fossil fuels [4]. To achieve this, catalytichydrodeoxygenation (HDO) can be used to eliminate oxygen and to hydrogenate instaurations forhydrocarbons chains. HDO can proceed in a wide range of temperatures (200–400 ◦C) and pressure(1–7 MPa) [5,6]. Also, as some oxygenated molecules present in pyrolysis oils are soluble in water,aqueous phase reactions can be carried out in the presence of a catalyst [7,8]. However, the aqueoushydrodeoxygenation may only be effective for some fractions of the bio-oil. For the more refractorymolecules, this process could take advantage of the current technology of typical hydrotreatment
Catalysts 2019, 9, 550; doi:10.3390/catal9060550 www.mdpi.com/journal/catalysts161
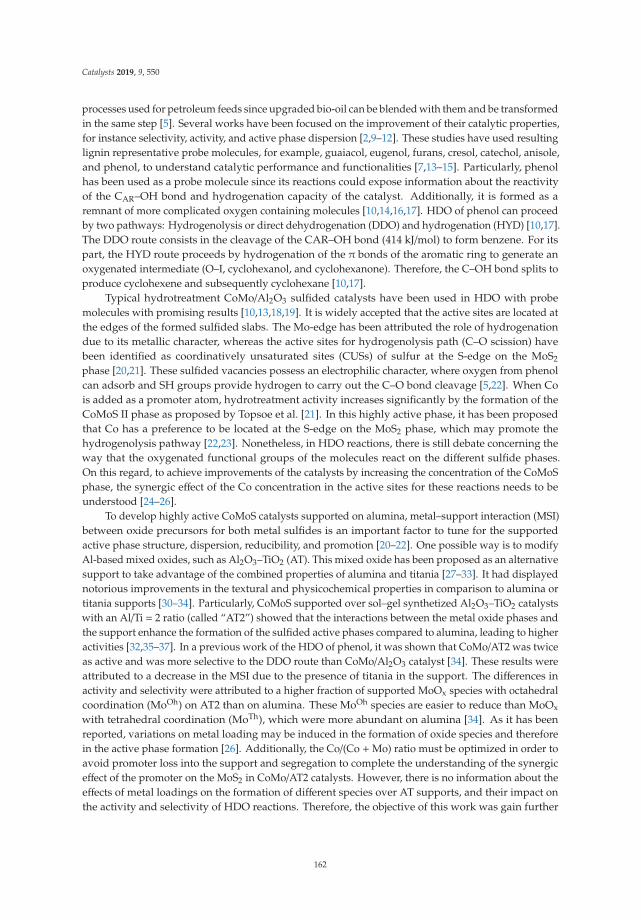
Catalysts 2019, 9, 550
processes used for petroleum feeds since upgraded bio-oil can be blended with them and be transformedin the same step [5]. Several works have been focused on the improvement of their catalytic properties,for instance selectivity, activity, and active phase dispersion [2,9–12]. These studies have used resultinglignin representative probe molecules, for example, guaiacol, eugenol, furans, cresol, catechol, anisole,and phenol, to understand catalytic performance and functionalities [7,13–15]. Particularly, phenolhas been used as a probe molecule since its reactions could expose information about the reactivityof the CAR–OH bond and hydrogenation capacity of the catalyst. Additionally, it is formed as aremnant of more complicated oxygen containing molecules [10,14,16,17]. HDO of phenol can proceedby two pathways: Hydrogenolysis or direct dehydrogenation (DDO) and hydrogenation (HYD) [10,17].The DDO route consists in the cleavage of the CAR–OH bond (414 kJ/mol) to form benzene. For itspart, the HYD route proceeds by hydrogenation of the π bonds of the aromatic ring to generate anoxygenated intermediate (O–I, cyclohexanol, and cyclohexanone). Therefore, the C–OH bond splits toproduce cyclohexene and subsequently cyclohexane [10,17].
Typical hydrotreatment CoMo/Al2O3 sulfided catalysts have been used in HDO with probemolecules with promising results [10,13,18,19]. It is widely accepted that the active sites are located atthe edges of the formed sulfided slabs. The Mo-edge has been attributed the role of hydrogenationdue to its metallic character, whereas the active sites for hydrogenolysis path (C–O scission) havebeen identified as coordinatively unsaturated sites (CUSs) of sulfur at the S-edge on the MoS2
phase [20,21]. These sulfided vacancies possess an electrophilic character, where oxygen from phenolcan adsorb and SH groups provide hydrogen to carry out the C–O bond cleavage [5,22]. When Cois added as a promoter atom, hydrotreatment activity increases significantly by the formation of theCoMoS II phase as proposed by Topsoe et al. [21]. In this highly active phase, it has been proposedthat Co has a preference to be located at the S-edge on the MoS2 phase, which may promote thehydrogenolysis pathway [22,23]. Nonetheless, in HDO reactions, there is still debate concerning theway that the oxygenated functional groups of the molecules react on the different sulfide phases.On this regard, to achieve improvements of the catalysts by increasing the concentration of the CoMoSphase, the synergic effect of the Co concentration in the active sites for these reactions needs to beunderstood [24–26].
To develop highly active CoMoS catalysts supported on alumina, metal–support interaction (MSI)between oxide precursors for both metal sulfides is an important factor to tune for the supportedactive phase structure, dispersion, reducibility, and promotion [20–22]. One possible way is to modifyAl-based mixed oxides, such as Al2O3–TiO2 (AT). This mixed oxide has been proposed as an alternativesupport to take advantage of the combined properties of alumina and titania [27–33]. It had displayednotorious improvements in the textural and physicochemical properties in comparison to alumina ortitania supports [30–34]. Particularly, CoMoS supported over sol–gel synthetized Al2O3–TiO2 catalystswith an Al/Ti = 2 ratio (called “AT2”) showed that the interactions between the metal oxide phases andthe support enhance the formation of the sulfided active phases compared to alumina, leading to higheractivities [32,35–37]. In a previous work of the HDO of phenol, it was shown that CoMo/AT2 was twiceas active and was more selective to the DDO route than CoMo/Al2O3 catalyst [34]. These results wereattributed to a decrease in the MSI due to the presence of titania in the support. The differences inactivity and selectivity were attributed to a higher fraction of supported MoOx species with octahedralcoordination (MoOh) on AT2 than on alumina. These MoOh species are easier to reduce than MoOx
with tetrahedral coordination (MoTh), which were more abundant on alumina [34]. As it has beenreported, variations on metal loading may be induced in the formation of oxide species and thereforein the active phase formation [26]. Additionally, the Co/(Co +Mo) ratio must be optimized in order toavoid promoter loss into the support and segregation to complete the understanding of the synergiceffect of the promoter on the MoS2 in CoMo/AT2 catalysts. However, there is no information about theeffects of metal loadings on the formation of different species over AT supports, and their impact onthe activity and selectivity of HDO reactions. Therefore, the objective of this work was gain further
162
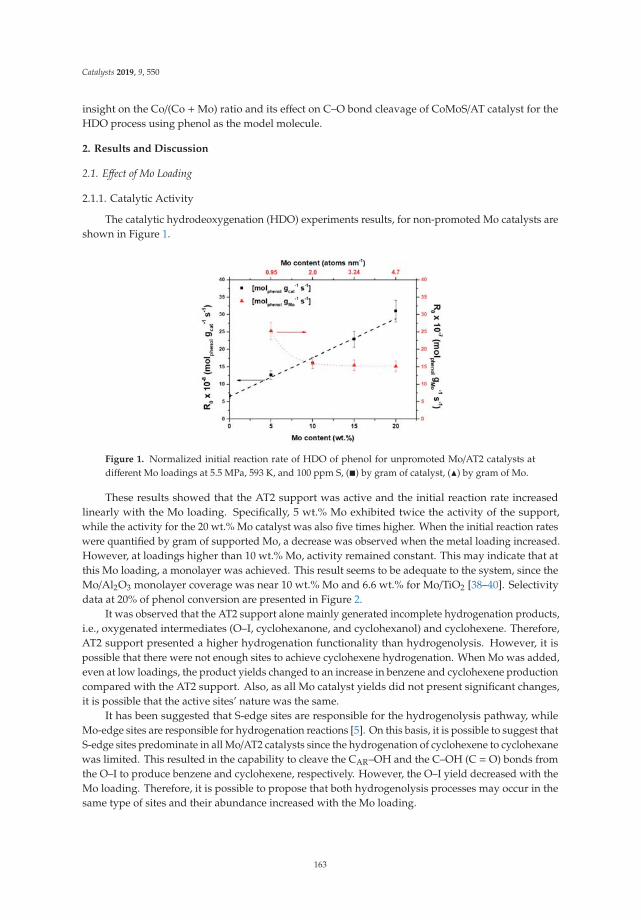
Catalysts 2019, 9, 550
insight on the Co/(Co +Mo) ratio and its effect on C–O bond cleavage of CoMoS/AT catalyst for theHDO process using phenol as the model molecule.
2. Results and Discussion
2.1. Effect of Mo Loading
2.1.1. Catalytic Activity
The catalytic hydrodeoxygenation (HDO) experiments results, for non-promoted Mo catalysts areshown in Figure 1.
Figure 1. Normalized initial reaction rate of HDO of phenol for unpromoted Mo/AT2 catalysts atdifferent Mo loadings at 5.5 MPa, 593 K, and 100 ppm S, (�) by gram of catalyst, (�) by gram of Mo.
These results showed that the AT2 support was active and the initial reaction rate increasedlinearly with the Mo loading. Specifically, 5 wt.% Mo exhibited twice the activity of the support,while the activity for the 20 wt.% Mo catalyst was also five times higher. When the initial reaction rateswere quantified by gram of supported Mo, a decrease was observed when the metal loading increased.However, at loadings higher than 10 wt.% Mo, activity remained constant. This may indicate that atthis Mo loading, a monolayer was achieved. This result seems to be adequate to the system, since theMo/Al2O3 monolayer coverage was near 10 wt.% Mo and 6.6 wt.% for Mo/TiO2 [38–40]. Selectivitydata at 20% of phenol conversion are presented in Figure 2.
It was observed that the AT2 support alone mainly generated incomplete hydrogenation products,i.e., oxygenated intermediates (O–I, cyclohexanone, and cyclohexanol) and cyclohexene. Therefore,AT2 support presented a higher hydrogenation functionality than hydrogenolysis. However, it ispossible that there were not enough sites to achieve cyclohexene hydrogenation. When Mo was added,even at low loadings, the product yields changed to an increase in benzene and cyclohexene productioncompared with the AT2 support. Also, as all Mo catalyst yields did not present significant changes,it is possible that the active sites’ nature was the same.
It has been suggested that S-edge sites are responsible for the hydrogenolysis pathway, whileMo-edge sites are responsible for hydrogenation reactions [5]. On this basis, it is possible to suggest thatS-edge sites predominate in all Mo/AT2 catalysts since the hydrogenation of cyclohexene to cyclohexanewas limited. This resulted in the capability to cleave the CAR–OH and the C–OH (C = O) bonds fromthe O–I to produce benzene and cyclohexene, respectively. However, the O–I yield decreased with theMo loading. Therefore, it is possible to propose that both hydrogenolysis processes may occur in thesame type of sites and their abundance increased with the Mo loading.
163
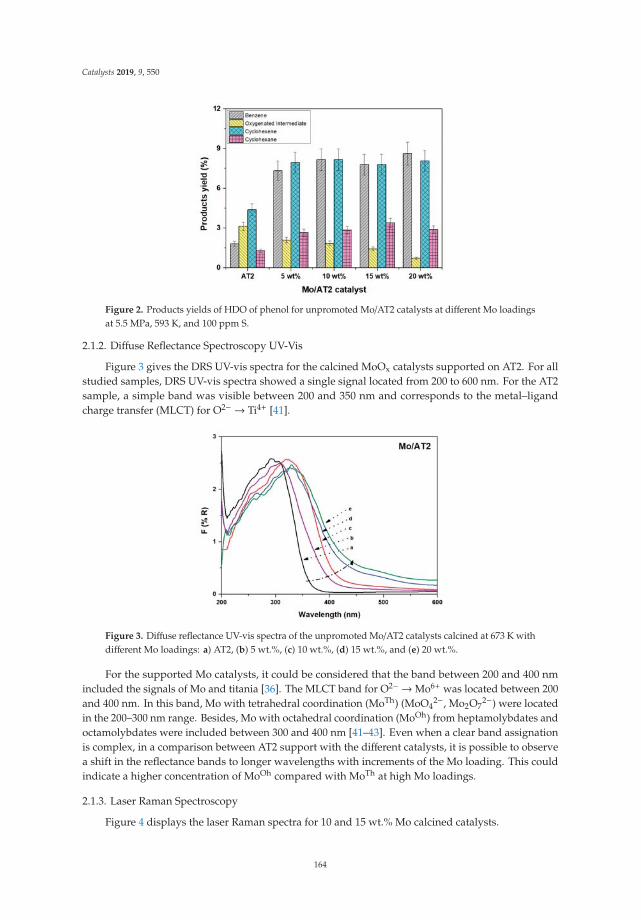
Catalysts 2019, 9, 550
Figure 2. Products yields of HDO of phenol for unpromoted Mo/AT2 catalysts at different Mo loadingsat 5.5 MPa, 593 K, and 100 ppm S.
2.1.2. Diffuse Reflectance Spectroscopy UV-Vis
Figure 3 gives the DRS UV-vis spectra for the calcined MoOx catalysts supported on AT2. For allstudied samples, DRS UV-vis spectra showed a single signal located from 200 to 600 nm. For the AT2sample, a simple band was visible between 200 and 350 nm and corresponds to the metal–ligandcharge transfer (MLCT) for O2− → Ti4+ [41].
Figure 3. Diffuse reflectance UV-vis spectra of the unpromoted Mo/AT2 catalysts calcined at 673 K withdifferent Mo loadings: a) AT2, (b) 5 wt.%, (c) 10 wt.%, (d) 15 wt.%, and (e) 20 wt.%.
For the supported Mo catalysts, it could be considered that the band between 200 and 400 nmincluded the signals of Mo and titania [36]. The MLCT band for O2− →Mo6+ was located between 200and 400 nm. In this band, Mo with tetrahedral coordination (MoTh) (MoO4
2−, Mo2O72−) were located
in the 200–300 nm range. Besides, Mo with octahedral coordination (MoOh) from heptamolybdates andoctamolybdates were included between 300 and 400 nm [41–43]. Even when a clear band assignationis complex, in a comparison between AT2 support with the different catalysts, it is possible to observea shift in the reflectance bands to longer wavelengths with increments of the Mo loading. This couldindicate a higher concentration of MoOh compared with MoTh at high Mo loadings.
2.1.3. Laser Raman Spectroscopy
Figure 4 displays the laser Raman spectra for 10 and 15 wt.% Mo calcined catalysts.
164
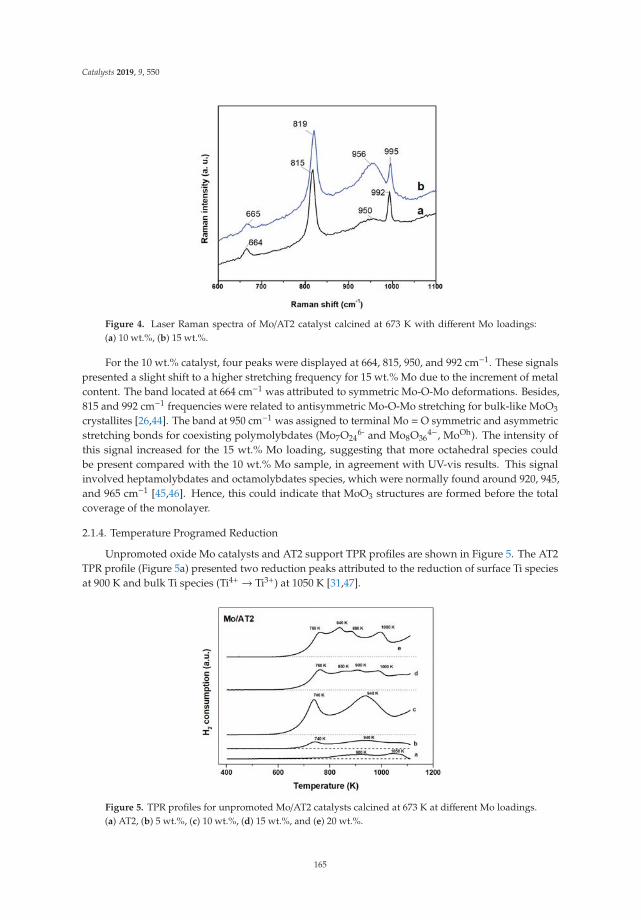
Catalysts 2019, 9, 550
Figure 4. Laser Raman spectra of Mo/AT2 catalyst calcined at 673 K with different Mo loadings:(a) 10 wt.%, (b) 15 wt.%.
For the 10 wt.% catalyst, four peaks were displayed at 664, 815, 950, and 992 cm−1. These signalspresented a slight shift to a higher stretching frequency for 15 wt.% Mo due to the increment of metalcontent. The band located at 664 cm−1 was attributed to symmetric Mo-O-Mo deformations. Besides,815 and 992 cm−1 frequencies were related to antisymmetric Mo-O-Mo stretching for bulk-like MoO3
crystallites [26,44]. The band at 950 cm−1 was assigned to terminal Mo = O symmetric and asymmetricstretching bonds for coexisting polymolybdates (Mo7O24
6- and Mo8O364−, MoOh). The intensity of
this signal increased for the 15 wt.% Mo loading, suggesting that more octahedral species couldbe present compared with the 10 wt.% Mo sample, in agreement with UV-vis results. This signalinvolved heptamolybdates and octamolybdates species, which were normally found around 920, 945,and 965 cm−1 [45,46]. Hence, this could indicate that MoO3 structures are formed before the totalcoverage of the monolayer.
2.1.4. Temperature Programed Reduction
Unpromoted oxide Mo catalysts and AT2 support TPR profiles are shown in Figure 5. The AT2TPR profile (Figure 5a) presented two reduction peaks attributed to the reduction of surface Ti speciesat 900 K and bulk Ti species (Ti4+→ Ti3+) at 1050 K [31,47].
Figure 5. TPR profiles for unpromoted Mo/AT2 catalysts calcined at 673 K at different Mo loadings.(a) AT2, (b) 5 wt.%, (c) 10 wt.%, (d) 15 wt.%, and (e) 20 wt.%.
165

Catalysts 2019, 9, 550
However, according to Platanitis et al. [47], only approximately 24% of anatase could be reduced onpure TiO2. Hence, it is expected that less than this percentage of titania could be reduced in the mixedoxide support. In the Mo containing samples, all catalysts showed reduction peaks corresponding toMo6+ →Mo4+ and Mo4+ →Mo0 at low temperatures (400–800 K) and high temperatures (>800 K),respectively [48–50]. Particularly, for the 5 wt.% Mo catalysts, a peak centered at 740 K correspondedto an easily reducible Mo species, possibly in octahedral coordination [50]. The signal located at 940 Kwas attributed to Mo strongly interacting with the support. Furthermore, the 10 wt.% Mo catalystsalso showed two signals at 740 and 940 K. However, it is possible that the 940 K peak could not only beassigned for the MoTh species reduction, but also to a contribution from the MoO3 species, as LRSresults showed. The TPR profile of 15 and 20 wt.% Mo catalysts presented four signals at 780, 850, 880,and 1000 K. The peaks located between 780 and 900 K could be attributed to the reduction of MoOh
and a mixture of MoOh and MoTh, respectively. The high temperature peaks (880 and 1000 K) couldbe caused by the presence of MoTh and bulk MoO3 [47,49,50]. The absence of an 850 K peak at 5 and10 wt.% Mo would indicate that at low Mo loadings, there may not be a notorious mixture of MoOh
and MoTh and more MoOh was formed when Mo loading was augmented.From the impregnation of Mo, the ammonium heptamolybdate solution for the 5 wt.% Mo catalyst’s
pH value was 5.2 and decreased to 4.5 for the 20 wt.% Mo catalyst. Consequently, ionic polymolybdatescomplexes, including [H3MoO24]3−, [H2Mo7O24]4−, [Mo7O24]6− [Mo8O26]4−, and [HMo7O24]5− species,were predominant in the solution as has been mentioned by the literature [46,51]. Additionally, since theAT2 isoelectric point value was 7.6, acid terminal OH groups were predominant on the surface at theimpregnation pH. Hence, anionic polymolybdates species could anchor to the support by electrostaticinteractions [52]. On this basis, at low metal loadings (5 wt.% Mo), the anionic Mo species couldbe well dispersed on the surface. As the metal loading increased, the anionic species were closer toeach other and conglomerated, generating large Mo species that would have a weaker metal–supportinteraction than those present at low metal loadings. Characterization analysis showed that MoOh
oxide species increased with the metal loading. However, as MoTh species are not clearly visible inthe DRS results, the Raman and TPR profiles confirmed the presence of a fraction of them and MoO3
crystallites. These results may indicate that Mo dispersion decreased at high Mo loadings.The presence of MoO3 at the 10 wt.% Mo catalyst, and the catalytic results shown in Figure 1,
indicated that the monolayer coverage would be complete at 20 wt.% Mo and that MoO3 can be formedbefore it [42,53]. This behavior seems to be quite similar to the Mo/Al2O3 catalyst, which due to theparallel configuration of the hydroxyl groups of the support, leads to a rearrangement of the Mo speciesduring calcination. In contrast, Mo/TiO2 tends to form MoO3 after total coverage of the monolayer,caused by the homogeneity of its hydroxyl groups [26]. Therefore, supported polymolybdates on AT2may present a configuration more alike to alumina than titania. However, due to the presence of thelatter, the generation of MoO3 was delayed. On this basis, it can be suggested that this could occur justbefore the total formation of the monolayer.
Catalytic evaluation indicated that the AT2 support was active and presented a selectivity topartial hydrogenation. In contrast, when Mo was supported, even at low metal loadings, the selectivitychanged to cyclohexane and benzene production. Nevertheless, since all unpromoted catalysts’selectivity did not present significant changes, it is possible to suggest that the generation of productswas due to a high number of active sites with the same nature. Consequently, the non-covered parts ofthe support could contribute slightly to the production of the O–I and cyclohexene, whereas the MoS2
phase contributed to the generation of DDO and HYD sites. Considering that MoOh were easier toreduce than MoTh, more MoS2 would be present at high Mo loadings (>10 wt.% Mo). In this sense,MoTh species may not change the selectivity; however, some of them would not be completely sulfided,i.e., only the number of active sites changed. This is deduced by the fact that even in the presence of CS2,benzene was still produced. Due to the presence of a sulfiding agent (CS2), the production of benzenewas limited by the competition of CS2 for the electrophilic sites located at the S-edge [5,10,34,54]. Then,as MoOh increased, more S-edge sites were formed, and the resistance to inhibition was improved.
166
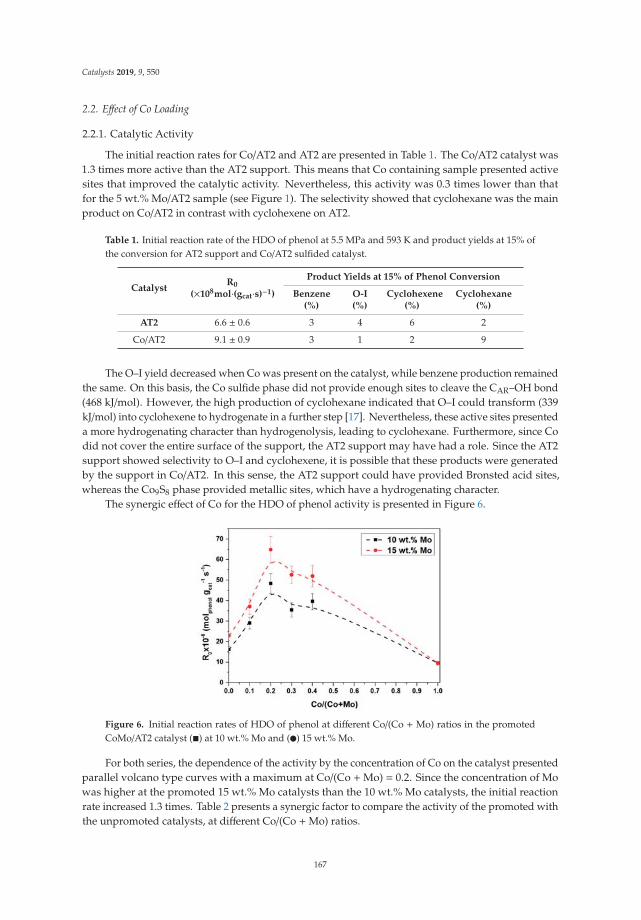
Catalysts 2019, 9, 550
2.2. Effect of Co Loading
2.2.1. Catalytic Activity
The initial reaction rates for Co/AT2 and AT2 are presented in Table 1. The Co/AT2 catalyst was1.3 times more active than the AT2 support. This means that Co containing sample presented activesites that improved the catalytic activity. Nevertheless, this activity was 0.3 times lower than thatfor the 5 wt.% Mo/AT2 sample (see Figure 1). The selectivity showed that cyclohexane was the mainproduct on Co/AT2 in contrast with cyclohexene on AT2.
Table 1. Initial reaction rate of the HDO of phenol at 5.5 MPa and 593 K and product yields at 15% ofthe conversion for AT2 support and Co/AT2 sulfided catalyst.
CatalystR0
(×108mol·(gcat·s)−1)
Product Yields at 15% of Phenol Conversion
Benzene(%)
O-I(%)
Cyclohexene(%)
Cyclohexane(%)
AT2 6.6 ± 0.6 3 4 6 2
Co/AT2 9.1 ± 0.9 3 1 2 9
The O–I yield decreased when Co was present on the catalyst, while benzene production remainedthe same. On this basis, the Co sulfide phase did not provide enough sites to cleave the CAR–OH bond(468 kJ/mol). However, the high production of cyclohexane indicated that O–I could transform (339kJ/mol) into cyclohexene to hydrogenate in a further step [17]. Nevertheless, these active sites presenteda more hydrogenating character than hydrogenolysis, leading to cyclohexane. Furthermore, since Codid not cover the entire surface of the support, the AT2 support may have had a role. Since the AT2support showed selectivity to O–I and cyclohexene, it is possible that these products were generatedby the support in Co/AT2. In this sense, the AT2 support could have provided Bronsted acid sites,whereas the Co9S8 phase provided metallic sites, which have a hydrogenating character.
The synergic effect of Co for the HDO of phenol activity is presented in Figure 6.
Figure 6. Initial reaction rates of HDO of phenol at different Co/(Co + Mo) ratios in the promotedCoMo/AT2 catalyst (�) at 10 wt.% Mo and (�) 15 wt.% Mo.
For both series, the dependence of the activity by the concentration of Co on the catalyst presentedparallel volcano type curves with a maximum at Co/(Co +Mo) = 0.2. Since the concentration of Mowas higher at the promoted 15 wt.% Mo catalysts than the 10 wt.% Mo catalysts, the initial reactionrate increased 1.3 times. Table 2 presents a synergic factor to compare the activity of the promoted withthe unpromoted catalysts, at different Co/(Co +Mo) ratios.
167
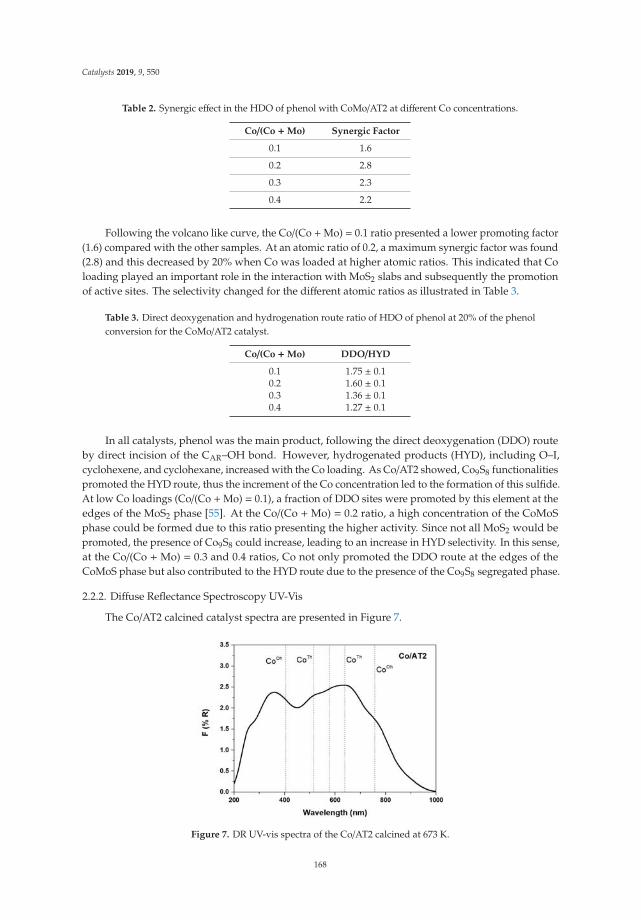
Catalysts 2019, 9, 550
Table 2. Synergic effect in the HDO of phenol with CoMo/AT2 at different Co concentrations.
Co/(Co +Mo) Synergic Factor
0.1 1.6
0.2 2.8
0.3 2.3
0.4 2.2
Following the volcano like curve, the Co/(Co +Mo) = 0.1 ratio presented a lower promoting factor(1.6) compared with the other samples. At an atomic ratio of 0.2, a maximum synergic factor was found(2.8) and this decreased by 20% when Co was loaded at higher atomic ratios. This indicated that Coloading played an important role in the interaction with MoS2 slabs and subsequently the promotionof active sites. The selectivity changed for the different atomic ratios as illustrated in Table 3.
Table 3. Direct deoxygenation and hydrogenation route ratio of HDO of phenol at 20% of the phenolconversion for the CoMo/AT2 catalyst.
Co/(Co +Mo) DDO/HYD
0.1 1.75 ± 0.10.2 1.60 ± 0.10.3 1.36 ± 0.10.4 1.27 ± 0.1
In all catalysts, phenol was the main product, following the direct deoxygenation (DDO) routeby direct incision of the CAR–OH bond. However, hydrogenated products (HYD), including O–I,cyclohexene, and cyclohexane, increased with the Co loading. As Co/AT2 showed, Co9S8 functionalitiespromoted the HYD route, thus the increment of the Co concentration led to the formation of this sulfide.At low Co loadings (Co/(Co +Mo) = 0.1), a fraction of DDO sites were promoted by this element at theedges of the MoS2 phase [55]. At the Co/(Co +Mo) = 0.2 ratio, a high concentration of the CoMoSphase could be formed due to this ratio presenting the higher activity. Since not all MoS2 would bepromoted, the presence of Co9S8 could increase, leading to an increase in HYD selectivity. In this sense,at the Co/(Co +Mo) = 0.3 and 0.4 ratios, Co not only promoted the DDO route at the edges of theCoMoS phase but also contributed to the HYD route due to the presence of the Co9S8 segregated phase.
2.2.2. Diffuse Reflectance Spectroscopy UV-Vis
The Co/AT2 calcined catalyst spectra are presented in Figure 7.
Figure 7. DR UV-vis spectra of the Co/AT2 calcined at 673 K.
168
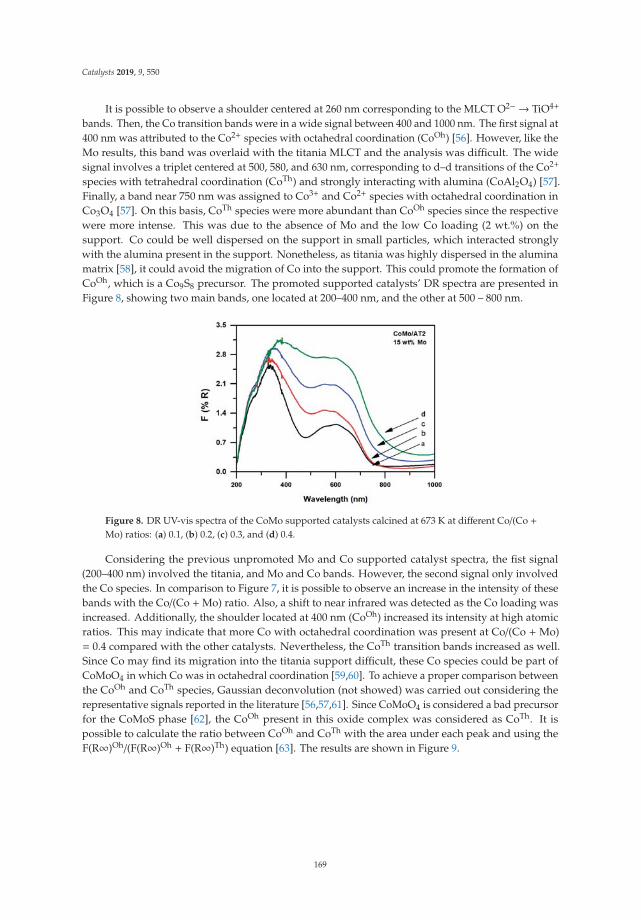
Catalysts 2019, 9, 550
It is possible to observe a shoulder centered at 260 nm corresponding to the MLCT O2− → TiO4+
bands. Then, the Co transition bands were in a wide signal between 400 and 1000 nm. The first signal at400 nm was attributed to the Co2+ species with octahedral coordination (CoOh) [56]. However, like theMo results, this band was overlaid with the titania MLCT and the analysis was difficult. The widesignal involves a triplet centered at 500, 580, and 630 nm, corresponding to d–d transitions of the Co2+
species with tetrahedral coordination (CoTh) and strongly interacting with alumina (CoAl2O4) [57].Finally, a band near 750 nm was assigned to Co3+ and Co2+ species with octahedral coordination inCo3O4 [57]. On this basis, CoTh species were more abundant than CoOh species since the respectivewere more intense. This was due to the absence of Mo and the low Co loading (2 wt.%) on thesupport. Co could be well dispersed on the support in small particles, which interacted stronglywith the alumina present in the support. Nonetheless, as titania was highly dispersed in the aluminamatrix [58], it could avoid the migration of Co into the support. This could promote the formation ofCoOh, which is a Co9S8 precursor. The promoted supported catalysts’ DR spectra are presented inFigure 8, showing two main bands, one located at 200–400 nm, and the other at 500 – 800 nm.
Figure 8. DR UV-vis spectra of the CoMo supported catalysts calcined at 673 K at different Co/(Co +Mo) ratios: (a) 0.1, (b) 0.2, (c) 0.3, and (d) 0.4.
Considering the previous unpromoted Mo and Co supported catalyst spectra, the fist signal(200–400 nm) involved the titania, and Mo and Co bands. However, the second signal only involvedthe Co species. In comparison to Figure 7, it is possible to observe an increase in the intensity of thesebands with the Co/(Co +Mo) ratio. Also, a shift to near infrared was detected as the Co loading wasincreased. Additionally, the shoulder located at 400 nm (CoOh) increased its intensity at high atomicratios. This may indicate that more Co with octahedral coordination was present at Co/(Co +Mo)= 0.4 compared with the other catalysts. Nevertheless, the CoTh transition bands increased as well.Since Co may find its migration into the titania support difficult, these Co species could be part ofCoMoO4 in which Co was in octahedral coordination [59,60]. To achieve a proper comparison betweenthe CoOh and CoTh species, Gaussian deconvolution (not showed) was carried out considering therepresentative signals reported in the literature [56,57,61]. Since CoMoO4 is considered a bad precursorfor the CoMoS phase [62], the CoOh present in this oxide complex was considered as CoTh. It ispossible to calculate the ratio between CoOh and CoTh with the area under each peak and using theF(R∞)Oh/(F(R∞)Oh + F(R∞)Th) equation [63]. The results are shown in Figure 9.
169
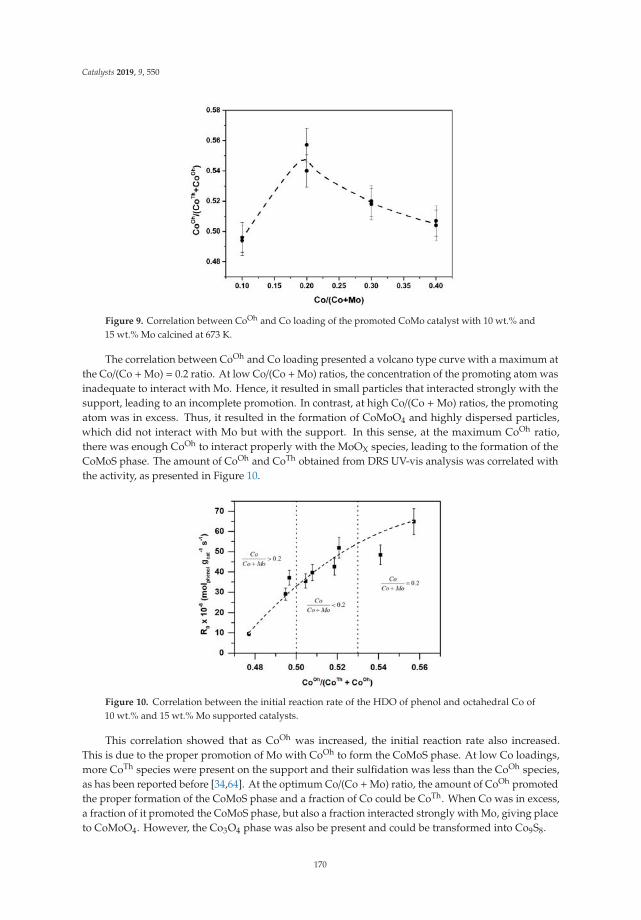
Catalysts 2019, 9, 550
Figure 9. Correlation between CoOh and Co loading of the promoted CoMo catalyst with 10 wt.% and15 wt.% Mo calcined at 673 K.
The correlation between CoOh and Co loading presented a volcano type curve with a maximum atthe Co/(Co +Mo) = 0.2 ratio. At low Co/(Co +Mo) ratios, the concentration of the promoting atom wasinadequate to interact with Mo. Hence, it resulted in small particles that interacted strongly with thesupport, leading to an incomplete promotion. In contrast, at high Co/(Co +Mo) ratios, the promotingatom was in excess. Thus, it resulted in the formation of CoMoO4 and highly dispersed particles,which did not interact with Mo but with the support. In this sense, at the maximum CoOh ratio,there was enough CoOh to interact properly with the MoOX species, leading to the formation of theCoMoS phase. The amount of CoOh and CoTh obtained from DRS UV-vis analysis was correlated withthe activity, as presented in Figure 10.
Figure 10. Correlation between the initial reaction rate of the HDO of phenol and octahedral Co of10 wt.% and 15 wt.% Mo supported catalysts.
This correlation showed that as CoOh was increased, the initial reaction rate also increased.This is due to the proper promotion of Mo with CoOh to form the CoMoS phase. At low Co loadings,more CoTh species were present on the support and their sulfidation was less than the CoOh species,as has been reported before [34,64]. At the optimum Co/(Co +Mo) ratio, the amount of CoOh promotedthe proper formation of the CoMoS phase and a fraction of Co could be CoTh. When Co was in excess,a fraction of it promoted the CoMoS phase, but also a fraction interacted strongly with Mo, giving placeto CoMoO4. However, the Co3O4 phase was also be present and could be transformed into Co9S8.
170
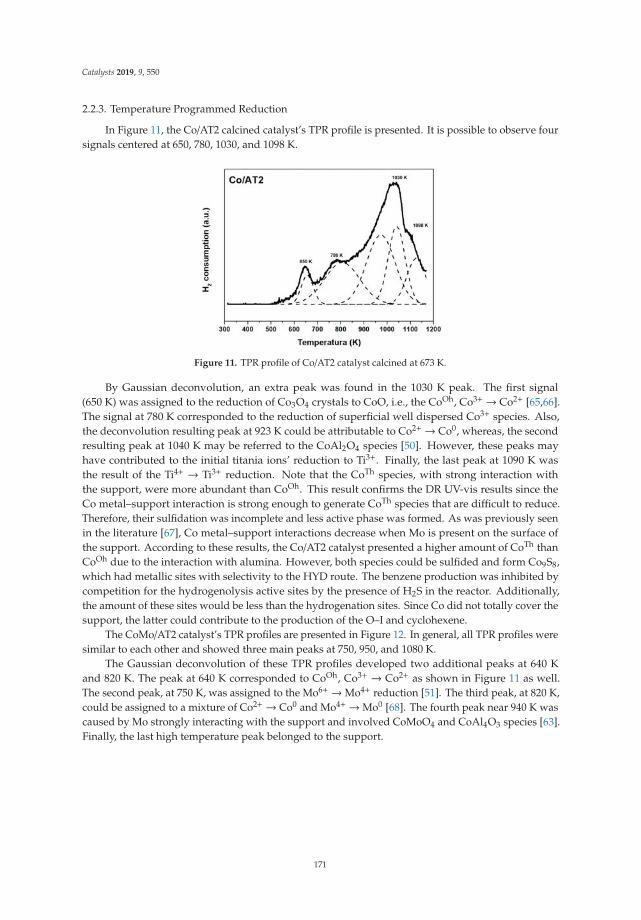
Catalysts 2019, 9, 550
2.2.3. Temperature Programmed Reduction
In Figure 11, the Co/AT2 calcined catalyst’s TPR profile is presented. It is possible to observe foursignals centered at 650, 780, 1030, and 1098 K.
Figure 11. TPR profile of Co/AT2 catalyst calcined at 673 K.
By Gaussian deconvolution, an extra peak was found in the 1030 K peak. The first signal(650 K) was assigned to the reduction of Co3O4 crystals to CoO, i.e., the CoOh, Co3+→ Co2+ [65,66].The signal at 780 K corresponded to the reduction of superficial well dispersed Co3+ species. Also,the deconvolution resulting peak at 923 K could be attributable to Co2+→ Co0, whereas, the secondresulting peak at 1040 K may be referred to the CoAl2O4 species [50]. However, these peaks mayhave contributed to the initial titania ions’ reduction to Ti3+. Finally, the last peak at 1090 K wasthe result of the Ti4+ → Ti3+ reduction. Note that the CoTh species, with strong interaction withthe support, were more abundant than CoOh. This result confirms the DR UV-vis results since theCo metal–support interaction is strong enough to generate CoTh species that are difficult to reduce.Therefore, their sulfidation was incomplete and less active phase was formed. As was previously seenin the literature [67], Co metal–support interactions decrease when Mo is present on the surface ofthe support. According to these results, the Co/AT2 catalyst presented a higher amount of CoTh thanCoOh due to the interaction with alumina. However, both species could be sulfided and form Co9S8,which had metallic sites with selectivity to the HYD route. The benzene production was inhibited bycompetition for the hydrogenolysis active sites by the presence of H2S in the reactor. Additionally,the amount of these sites would be less than the hydrogenation sites. Since Co did not totally cover thesupport, the latter could contribute to the production of the O–I and cyclohexene.
The CoMo/AT2 catalyst’s TPR profiles are presented in Figure 12. In general, all TPR profiles weresimilar to each other and showed three main peaks at 750, 950, and 1080 K.
The Gaussian deconvolution of these TPR profiles developed two additional peaks at 640 Kand 820 K. The peak at 640 K corresponded to CoOh, Co3+ → Co2+ as shown in Figure 11 as well.The second peak, at 750 K, was assigned to the Mo6+→Mo4+ reduction [51]. The third peak, at 820 K,could be assigned to a mixture of Co2+→ Co0 and Mo4+→Mo0 [68]. The fourth peak near 940 K wascaused by Mo strongly interacting with the support and involved CoMoO4 and CoAl4O3 species [63].Finally, the last high temperature peak belonged to the support.
171
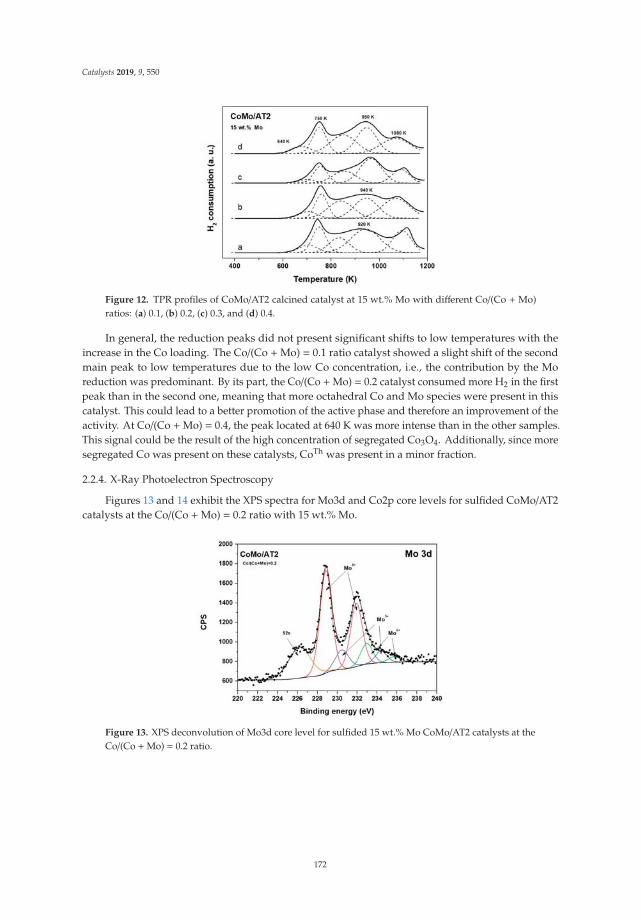
Catalysts 2019, 9, 550
Figure 12. TPR profiles of CoMo/AT2 calcined catalyst at 15 wt.% Mo with different Co/(Co + Mo)ratios: (a) 0.1, (b) 0.2, (c) 0.3, and (d) 0.4.
In general, the reduction peaks did not present significant shifts to low temperatures with theincrease in the Co loading. The Co/(Co +Mo) = 0.1 ratio catalyst showed a slight shift of the secondmain peak to low temperatures due to the low Co concentration, i.e., the contribution by the Moreduction was predominant. By its part, the Co/(Co +Mo) = 0.2 catalyst consumed more H2 in the firstpeak than in the second one, meaning that more octahedral Co and Mo species were present in thiscatalyst. This could lead to a better promotion of the active phase and therefore an improvement of theactivity. At Co/(Co +Mo) = 0.4, the peak located at 640 K was more intense than in the other samples.This signal could be the result of the high concentration of segregated Co3O4. Additionally, since moresegregated Co was present on these catalysts, CoTh was present in a minor fraction.
2.2.4. X-Ray Photoelectron Spectroscopy
Figures 13 and 14 exhibit the XPS spectra for Mo3d and Co2p core levels for sulfided CoMo/AT2catalysts at the Co/(Co +Mo) = 0.2 ratio with 15 wt.% Mo.
Figure 13. XPS deconvolution of Mo3d core level for sulfided 15 wt.% Mo CoMo/AT2 catalysts at theCo/(Co +Mo) = 0.2 ratio.
172
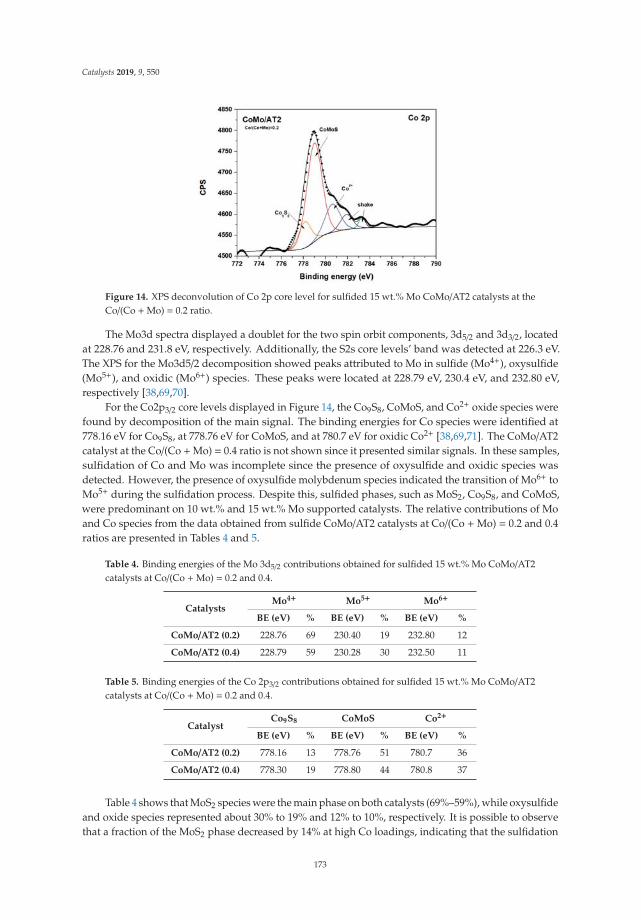
Catalysts 2019, 9, 550
Figure 14. XPS deconvolution of Co 2p core level for sulfided 15 wt.% Mo CoMo/AT2 catalysts at theCo/(Co +Mo) = 0.2 ratio.
The Mo3d spectra displayed a doublet for the two spin orbit components, 3d5/2 and 3d3/2, locatedat 228.76 and 231.8 eV, respectively. Additionally, the S2s core levels’ band was detected at 226.3 eV.The XPS for the Mo3d5/2 decomposition showed peaks attributed to Mo in sulfide (Mo4+), oxysulfide(Mo5+), and oxidic (Mo6+) species. These peaks were located at 228.79 eV, 230.4 eV, and 232.80 eV,respectively [38,69,70].
For the Co2p3/2 core levels displayed in Figure 14, the Co9S8, CoMoS, and Co2+ oxide species werefound by decomposition of the main signal. The binding energies for Co species were identified at778.16 eV for Co9S8, at 778.76 eV for CoMoS, and at 780.7 eV for oxidic Co2+ [38,69,71]. The CoMo/AT2catalyst at the Co/(Co +Mo) = 0.4 ratio is not shown since it presented similar signals. In these samples,sulfidation of Co and Mo was incomplete since the presence of oxysulfide and oxidic species wasdetected. However, the presence of oxysulfide molybdenum species indicated the transition of Mo6+ toMo5+ during the sulfidation process. Despite this, sulfided phases, such as MoS2, Co9S8, and CoMoS,were predominant on 10 wt.% and 15 wt.% Mo supported catalysts. The relative contributions of Moand Co species from the data obtained from sulfide CoMo/AT2 catalysts at Co/(Co +Mo) = 0.2 and 0.4ratios are presented in Tables 4 and 5.
Table 4. Binding energies of the Mo 3d5/2 contributions obtained for sulfided 15 wt.% Mo CoMo/AT2catalysts at Co/(Co +Mo) = 0.2 and 0.4.
CatalystsMo4+ Mo5+ Mo6+
BE (eV) % BE (eV) % BE (eV) %
CoMo/AT2 (0.2) 228.76 69 230.40 19 232.80 12
CoMo/AT2 (0.4) 228.79 59 230.28 30 232.50 11
Table 5. Binding energies of the Co 2p3/2 contributions obtained for sulfided 15 wt.% Mo CoMo/AT2catalysts at Co/(Co +Mo) = 0.2 and 0.4.
CatalystCo9S8 CoMoS Co2+
BE (eV) % BE (eV) % BE (eV) %
CoMo/AT2 (0.2) 778.16 13 778.76 51 780.7 36
CoMo/AT2 (0.4) 778.30 19 778.80 44 780.8 37
Table 4 shows that MoS2 species were the main phase on both catalysts (69%–59%), while oxysulfideand oxide species represented about 30% to 19% and 12% to 10%, respectively. It is possible to observethat a fraction of the MoS2 phase decreased by 14% at high Co loadings, indicating that the sulfidation
173
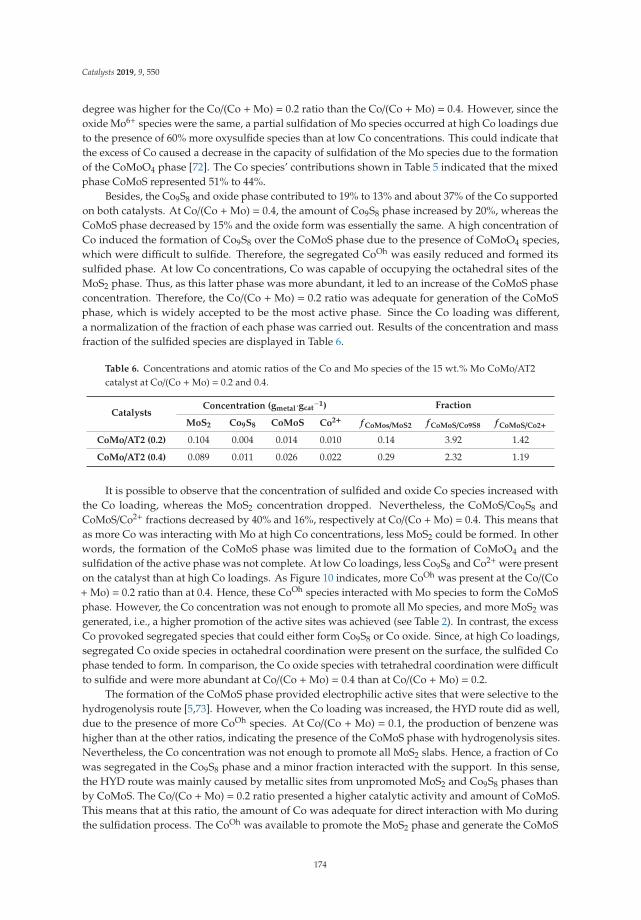
Catalysts 2019, 9, 550
degree was higher for the Co/(Co +Mo) = 0.2 ratio than the Co/(Co +Mo) = 0.4. However, since theoxide Mo6+ species were the same, a partial sulfidation of Mo species occurred at high Co loadings dueto the presence of 60% more oxysulfide species than at low Co concentrations. This could indicate thatthe excess of Co caused a decrease in the capacity of sulfidation of the Mo species due to the formationof the CoMoO4 phase [72]. The Co species’ contributions shown in Table 5 indicated that the mixedphase CoMoS represented 51% to 44%.
Besides, the Co9S8 and oxide phase contributed to 19% to 13% and about 37% of the Co supportedon both catalysts. At Co/(Co +Mo) = 0.4, the amount of Co9S8 phase increased by 20%, whereas theCoMoS phase decreased by 15% and the oxide form was essentially the same. A high concentration ofCo induced the formation of Co9S8 over the CoMoS phase due to the presence of CoMoO4 species,which were difficult to sulfide. Therefore, the segregated CoOh was easily reduced and formed itssulfided phase. At low Co concentrations, Co was capable of occupying the octahedral sites of theMoS2 phase. Thus, as this latter phase was more abundant, it led to an increase of the CoMoS phaseconcentration. Therefore, the Co/(Co +Mo) = 0.2 ratio was adequate for generation of the CoMoSphase, which is widely accepted to be the most active phase. Since the Co loading was different,a normalization of the fraction of each phase was carried out. Results of the concentration and massfraction of the sulfided species are displayed in Table 6.
Table 6. Concentrations and atomic ratios of the Co and Mo species of the 15 wt.% Mo CoMo/AT2catalyst at Co/(Co +Mo) = 0.2 and 0.4.
CatalystsConcentration (gmetal·gcat
−1) Fraction
MoS2 Co9S8 CoMoS Co2+ f CoMos/MoS2 f CoMoS/Co9S8 f CoMoS/Co2+
CoMo/AT2 (0.2) 0.104 0.004 0.014 0.010 0.14 3.92 1.42
CoMo/AT2 (0.4) 0.089 0.011 0.026 0.022 0.29 2.32 1.19
It is possible to observe that the concentration of sulfided and oxide Co species increased withthe Co loading, whereas the MoS2 concentration dropped. Nevertheless, the CoMoS/Co9S8 andCoMoS/Co2+ fractions decreased by 40% and 16%, respectively at Co/(Co +Mo) = 0.4. This means thatas more Co was interacting with Mo at high Co concentrations, less MoS2 could be formed. In otherwords, the formation of the CoMoS phase was limited due to the formation of CoMoO4 and thesulfidation of the active phase was not complete. At low Co loadings, less Co9S8 and Co2+ were presenton the catalyst than at high Co loadings. As Figure 10 indicates, more CoOh was present at the Co/(Co+Mo) = 0.2 ratio than at 0.4. Hence, these CoOh species interacted with Mo species to form the CoMoSphase. However, the Co concentration was not enough to promote all Mo species, and more MoS2 wasgenerated, i.e., a higher promotion of the active sites was achieved (see Table 2). In contrast, the excessCo provoked segregated species that could either form Co9S8 or Co oxide. Since, at high Co loadings,segregated Co oxide species in octahedral coordination were present on the surface, the sulfided Cophase tended to form. In comparison, the Co oxide species with tetrahedral coordination were difficultto sulfide and were more abundant at Co/(Co +Mo) = 0.4 than at Co/(Co +Mo) = 0.2.
The formation of the CoMoS phase provided electrophilic active sites that were selective to thehydrogenolysis route [5,73]. However, when the Co loading was increased, the HYD route did as well,due to the presence of more CoOh species. At Co/(Co + Mo) = 0.1, the production of benzene washigher than at the other ratios, indicating the presence of the CoMoS phase with hydrogenolysis sites.Nevertheless, the Co concentration was not enough to promote all MoS2 slabs. Hence, a fraction of Cowas segregated in the Co9S8 phase and a minor fraction interacted with the support. In this sense,the HYD route was mainly caused by metallic sites from unpromoted MoS2 and Co9S8 phases thanby CoMoS. The Co/(Co +Mo) = 0.2 ratio presented a higher catalytic activity and amount of CoMoS.This means that at this ratio, the amount of Co was adequate for direct interaction with Mo duringthe sulfidation process. The CoOh was available to promote the MoS2 phase and generate the CoMoS
174
Catalysts 2019, 9, 550
phase over the other sulfided phases. At Co/(Co +Mo) > 0.2, activity decreased; however, the HYDroute was enhanced. In these cases, there was enough Co to promote the MoS2 phase. Nonetheless,the excess Co led to the production of a more segregated Co9S8 phase than at lower ratios. Hence,the metallic sites responsible for hydrogenation reactions increased their number. As more Co wasadded, more CoTh and CoMoO4 phase could have been formed, which were difficult to sulfide andconsequently, sulfidation was not optimal.
3. Materials and Methods
3.1. Support and Catalysts Synthesis
3.1.1. Support Synthesis
Mixed oxide Al2O3–TiO2, (Al/Ti = 2 labelled as AT2) support was synthesized by the sol–gelmethod as described in a previous work [34]. As organic precursors, tri-sec-butoxide (Al (OCH(CH3)C2H5)3; Aldrich 99.9%, St. Louis, MI, USA) and titanium isopropoxide (Ti (OCH3H7)4; Aldrich 98%,St. Louis, MI, USA) were employed. As a solvent, 2-propanol (CH3)2CHOH; Baker 99.5%, Ecatepec,Estado de Mexico, Mexico), and, as hydrolysis catalyst, nitric acid (HNO3) were used. The nominalmolar ratio used in all supports was 2-proponol:H2O:alkoxide:HNO3 = 325:100:5:1 [30]. 2-Propanolwas cooled to 0 ◦C and under vigorous stirring, the theoretical amounts of Al and Ti were added.Then, HNO3 aqueous solution was added dropwise. The obtained gel was aged for 24 h at 273 K.Subsequently, it was dried at 333 K. Finally, the dried gel was calcined for 3 h at 773 K with a rate of3 K min−1. AT2 support textural properties were: SBET = 359 m2 g−1, Vp = 1.1 cm3 g−1, Dp = 7.7 nm,and PZC = 7.6, as previously reported by [32,34].
3.1.2. Catalyst Synthesis
The Al2O3–TiO2 support was impregnated by the successive wetness impregnation method usingan aqueous solution of ammonium heptamolybdate ((NH4)6Mo7O24·4H2O; Aldrich 99.9%, St. Louis,MI, USA) and cobalt nitrate ((Co(NO3)2·6H2O; Aldrich 99%, St. Louis, MI, USA). The non-promotedMo series were loaded at 5, 10, 15, and 20 wt.% Mo, while only Co catalyst was loaded at 2 wt.%.The promoted CoMo catalyst series were impregnated following four different molar Co/(Co +Mo)ratios: 0.1, 0.2, 0.3, and 0.4. For monometallic catalysts, the Mo (or Co) solution was impregnated onAT2 support and was macerated at room conditions for 12 h. After that, it was dried at 393 K andcalcinated at 673 K for 5 h. For the promoted catalyst, the Mo calcined materials were impregnatedwith the cobalt solution and the heat treatment was repeated. Before XPS analysis and the HDO ofphenol tests, calcined CoMo samples were sulfided ex-situ in a glass tube reactor with a 10 vol.-%H2S/H2 mixture at 673 K for 2 h. After this, sulfided catalysts were immediately immersed in dodecaneto avoid oxidation from air.
3.2. Materials Characterization
3.2.1. Diffuse Reflectance Ultraviolet-Visible Spectroscopy
The diffuse reflectance UV-Vis (DRS UV-Vis) spectra of the synthesized support and promotedand unpromoted oxide catalyst series were recorded with a Lambda 35 spectrometer equipped with anintegration sphere (Labsphere RSA-PE-20, North Sutton, NH, USA). The data acquisition was in the200–1000 nm range with an interval of 0.5 nm and a scan speed of 240 nm−1. The spectra were recordedin the reflectance mode for infinitely thick samples (R∞) using the reflectance of MgO as a reference.
3.2.2. Laser Raman Spectroscopy
Laser Raman spectroscopy (LRS) of unpromoted Mo catalyst at 10 and 15 wt.% were analyzedwith a Perkin Elmer GX Raman FT-IR (Waltham, MA, USA), equipped with an Nd: YAG (1064 nm)
175
Catalysts 2019, 9, 550
laser and InGaAs detector. The data acquisition was carried out with a laser power of 40 to 300 mW atthe 3600 to 100 cm−1 Raman shift range with a resolution of 2 to 4 cm−1.
3.2.3. Temperature Programmed Reduction
Temperature programmed reduction (TPR) experiments of the promoted and unpromoted oxidecatalysts series were carried out with in an Altamira Instruments AMI-80 (Pittsburgh, PA, USA)apparatus provided with a thermal conductivity detector (TCD) interfaced to a data station. For eachTPR test, 50 mg of catalyst precursor were set into a U-shaped quartz cell and pretreated in situ at 523 Kfor 1 h under 35 mL min−1 He flow. After this, the catalyst precursor was cooled to room temperature.TPR analysis was performed under a stream of 10 vol% of H2/Ar, with a heating rate of 15 ◦C min−1 upto 1100 K. A moisture trap was used to avoid measurement interference.
3.2.4. X-Ray Photoelectron Spectroscopy (XPS)
The sulfided catalyst were analyzed in a K-alpha Thermo Fischer Scientific spectrometer equipped(Waltham, MA, USA) with a hemispherical electron analyzer and an Al Kα (hν = 1486.6 eV) X-raysource. The residual pressure was kept below 7 × 10⁻⁷ Pa during data acquisition. The bindingenergies (BEs) were referenced to the C 1s peak (284.9 eV) to account for the charging effects. The areasof the peaks were computed after fitting the experimental spectra to Gaussian/Lorentzian curves andremoving the background (Shirley function). After that, surface atomic ratios were calculated from thepeak area ratios normalized by the corresponding atomic sensitivity factors. The spectra were analyzedfrom the 222 to 244 eV region where the Mo 3d levels were located. The surface relative abundancepercentages of the Mo and Co species were calculated according to the methodology proposed byChen et al. [38]. Moreover, we estimated the relative amount of the CoMoS mixed phase, consideringthe Co species in this phase:
[Mo4+
](%) =
AMo4+
AMo4+ + AMo5+ + AMo6+× 100, (1)
[CoMoS](%) =ACoMoS
ACoMoS + ACo9S8 + ACo2+×100, (2)
C(MoS2) = C(Mo)[Mo4+
]/100, (3)
C(CoMoS) = C(Co)[CoMoS]/100, (4)
f CoMoSMoS2
=C(CoMoS)C(MoS2)
, (5)
where AMo4+, AMo5+, AMo6+, ACoMoS, ACo9S8, and ACo2+ are the area of each species fitted from theMo3d and Co2p XPS spectra; C(Mo) and C(Co) are the theoretical mass concentrations of Mo andCo per gram of oxidic catalyst (gmetal/gcatalyts); C(MoS2) and C(CoMoS) are the mass concentrationsof MoS2 and CoMoS species per gram of catalyst; and fCoMoS/MoS2 is the mass ratio of the CoMoSand MoS2 species. The C(Co9S8) and C(Co2+) concentrations and mass ratios were quantified in thesame way.
3.2.5. Catalytic Performance
To evaluate the catalytic performance of the Mo, Co, and CoMo sulfided catalyst,hydrodeoxygenation of phenol was carried out. HDO of phenol facilitates an understanding ofthe functionality and reaction mechanisms in catalytic tests since it is a relatively simple molecule andit constitutes the main component in the remnant of the HDO of guaiacol [40]. The reaction took placein a Parr Series 4540 high-pressure batch reactor (Parr Instrument Co., Moline, IL, USA) equipped witha Parr 4842 controller, mechanic impeller, wall-baffles, liquid and gas inlet/outlet gas valves, internal
176
Catalysts 2019, 9, 550
thermocouple, and pressure gauge. The reaction mixture consisted of phenol (500 ppm of oxygen) andCS2 (100 ppm of sulfur) dissolved in 100 mL of n-dodecane and 0.1 g of freshly sulfide catalysts with aparticle size between 150 and 180 μm. Catalyst sulfidation was carried out as was described in the XPSmethodology. The reactor was pressurized up to 1.4 MPa with N2 to flush air and to prevent oxidationof the sulfide catalysts. After this, the reactor was heated up to 593 K and kept an isothermal operationmode during the reaction. Then, N2 was vented slowly, and hydrogen was introduced up to 5.5 MPa.The reactor operated in an isobaric mode during the reaction time with manual addition of H2 andvigorous agitation of 1000 rpm. The reaction time started from the incorporation of H2. Small sampleswere collected (0, 10, 20, 30, 45, 60, 90, 120, 180, 240, and 300 min), ensuring that the sum of the volumesamples was less than 5% of the initial volume. A gas chromatograph (Agilent 7820A, Santa Clara, CA,USA) equipped with a CP Sil-5 CB capillary column (100% dimethylpolysiloxane, 60 m × 0.32 mm)and a flame ionized detector (FID) were used for the quantification of the products’ concentrations.The initial reaction rates, reagent mol transformed per time of reaction, and mass of a sulfided catalyst(mol g−1s−1) were compared.
4. Conclusions
In the unpromoted catalysts at high Mo loadings, more easily reduced MoOh species were formed,and more active sites were present on these catalysts than at low Mo loadings. Nevertheless, a hardlyreduced MoO3 presence was detected at a high Mo content. On the other hand, the functionalitiesto produce benzene and cyclohexene did not change with the Mo content since all catalysts showedthe same selectivity. This indicated that the active sites could cleave the CAR–OH bond but could notproperly hydrogenate the π-bonds of the cyclic compounds, i.e., S-edges sites played a more major rolethan Mo-edges.
Catalytic activity and selectivity were related to the CoOh content. A Co/(Co +Mo) = 0.2 ratiopresented a maximum activity for these catalysts. At this Co concentration, CoOh was the mainCo oxide coordination species. These CoOh species properly promoted the Mo oxide species andsubsequently formed more CoMoS phase than at higher ratios. At a low Co content, it was insufficientto totally promote the Mo oxide species. Therefore, CoMoS phase formation was limited and the MoS2
phase was predominant since benzene was the main product. Plus, Co may have generated CoTh
species that were difficult to reduce. At high ratios, the excess Co concentration led to the CoMoO4
phase, and the formation of the CoMoS phase was inadequate. Hence, activity dropped compared withthe Co/(Co +Mo) = 0.2 ratio. Moreover, the surplus of Co was segregated and formed CoOh, whichtransformed into the Co9S8 phase, leading to an enhancement of the HYD route. Finally, the segregatedCo oxide species may have formed CoTh as well; thus, catalytic activity decreased.
Author Contributions: C.E.S.-V. and O.U.V.-M. performed and analyzed the characterization experiments and data;J.A.T.-P. conceived, designed, and performed experiments, analyzed the data, and wrote the manuscript; J.A.d.l.R.H.contributed to writing—review of the manuscript, funding acquisition, and was the project administrator andlaboratory chief.
Funding: This research was funded by Consejo Nacional de Ciencia y Tenología (CONACYT—Mexico),grant number 237857.
Acknowledgments: The authors are grateful to CONACYT for the financial support 237857 and for thescholarship of J.A. Tavizón-Pozos with number 221991. The authors acknowledge financial support fromInstituto Politénico Nacional (Proyecto SIP 20196722) and CONACYT for the projects CB-2017-2018 #A1-S-32418and the Cátedras-CONACYT number 216.
Conflicts of Interest: The authors declare no conflict of interest.
177
Catalysts 2019, 9, 550
References
1. Pourzolfaghar, H.; Abnisa, F.; Wan Daud, W.M.A.; Aroua, M.K. Atmospheric Hydrodeoxygenation of Bio-OilOxygenated Model Compounds: A Review. J. Anal. Appl. Pyrolysis 2018, 133, 117–127. [CrossRef]
2. Li, X.; Chen, G.; Liu, C.; Ma, W.; Yan, B.; Zhang, J. Hydrodeoxygenation of Lignin-Derived Bio-Oil UsingMolecular Sieves Supported Metal Catalysts: A Critical Review. Renew. Sustain. Energy Rev. 2017, 71,296–308. [CrossRef]
3. Dabros, T.M.H.; Stummann, M.Z.; Høj, M.; Jensen, P.A.; Grunwaldt, J.-D.; Gabrielsen, J.; Mortensen, P.M.;Jensen, A.D. Transportation Fuels from Biomass Fast Pyrolysis, Catalytic Hydrodeoxygenation, and CatalyticFast Hydropyrolysis. Prog. Energy Combust. Sci. 2018, 68, 268–309. [CrossRef]
4. Linck, M.; Felix, L.; Marker, T.; Roberts, M. Integrated Biomass Hydropyrolysis and Hydrotreating: A BriefReview. Wiley Interdiscip. Rev. Energy Environ. 2014, 3, 575–581. [CrossRef]
5. Furimsky, E. Hydroprocessing Challenges in Biofuels Production. Catal. Today 2013, 217, 13–56. [CrossRef]6. Huber, G.W.; Iborra, S.; Corma, A. Synthesis of Transportation Fuels from Biomass Chemistry Catalysts and
Enginneering. Chem. Rev. 2006, 106, 4044–4098. [CrossRef] [PubMed]7. Li, X.; Zhang, J.; Liu, B.; Liu, J.; Wang, C.; Chen, G. Hydrodeoxygenation of Lignin-Derived Phenols to
Produce Hydrocarbons over Ni/Al-SBA-15 Prepared with Different Impregnants. Fuel 2019, 243, 314–321.[CrossRef]
8. Jahromi, H.; Agblevor, F. Hydrogenation of Aqueous-Phase Catalytic Pyrolysis Oil to Liquid HydrocarbonsUsing Multifunctional Nickel Catalyst. Ind. Eng. Chem. Res. 2018, 57, 13257–13268. [CrossRef]
9. Bui, V.N.; Laurenti, D.; Delichère, P.; Geantet, C. Hydrodeoxygenation of Guaiacol: Part II: Support Effect forCoMoS Catalysts on HDO Activity and Selectivity. Appl. Catal. B Environ. 2011, 101, 246–255. [CrossRef]
10. Senol, O.I.; Ryymin, E.-M.; Viljava, T.-R.; Krause, A.O.I. Effect of Hydrogen Sulphide on theHydrodeoxygenation of Aromatic and Aliphatic Oxygenates on Sulphided Catalysts. J. Mol. Catal.A Chem. 2007, 277, 107–112. [CrossRef]
11. Bu, Q.; Lei, H.; Zacher, A.H.; Wang, L.; Ren, S.; Liang, J.; Wei, Y.; Liu, Y.; Tang, J.; Zhang, Q.; et al. A Reviewof Catalytic Hydrodeoxygenation of Lignin-Derived Phenols from Biomass Pyrolysis. Bioresour. Technol.2012, 124, 470–477. [CrossRef] [PubMed]
12. Echeandia, S.; Arias, P.L.; Barrio, V.L.; Pawelec, B.; Fierro, J.L.G. Synergy Effect in the HDO of Phenol overNi–W Catalysts Supported on Active Carbon: Effect of Tungsten Precursors. Appl. Catal. B Environ. 2010,101, 1–12. [CrossRef]
13. Bui, V.N.; Laurenti, D.; Afanasiev, P.; Geantet, C. Hydrodeoxygenation of Guaiacol with CoMo Catalysts.Part I: Promoting Effect of Cobalt on HDO Selectivity and Activity. Appl. Catal. B Environ. 2011, 101, 239–245.[CrossRef]
14. Honkela, M.L.; Viljava, T.-R.; Gutierrez, A.; Krause, A.O.I. Chapter 11 Hydrotreating for Bio-Oil Upgrading.In Thermochemical Conversion of Biomass to Liquid Fuels and Chemicals; Crocker, M., Ed.; The Royal Society ofChemistry: London, UK, 2010; pp. 288–306.
15. Zhang, J.; Dong, K.; Luo, W. PdCl2-Catalyzed Hydrodeoxygenation of 5-Hydroxymethylfurfural into2,5-Dimethylfuran at Room-Temperature using Polymethylhydrosiloxane as the Hydrogen Donor. Chem. Eng.Sci. 2019, 201, 467–474. [CrossRef]
16. Viljava, T.-R.; Komulainen, S.; Selvam, T.; Krause, A.O.I. Stability of CoMo/Al2O3 Catalysts: Effect of HDOCycles on HDS. In Studies in Surface Science and Catalysis: Hydrotreatment and Hydrocracking of Oil FractionsProceedings of the 2nd International Symposium/7th European Workshop; Delmon, B., Froment, G.F., Grange, P.,Eds.; Elsevier: Antwerpen, Belgium, 1999; Volume 127, pp. 145–152. [CrossRef]
17. Massoth, F.E.; Politzer, P.; Concha, M.C.; Murray, J.S.; Jakowski, J.; Simons, J. Catalytic Hydrodeoxygenationof Methyl-Substituted Phenols: Correlations of Kinetic Parameters with Molecular Properties. J. Phys. Chem.B 2006, 110, 14283–14291. [CrossRef] [PubMed]
18. Badawi, M.; Paul, J.F.; Cristol, S.; Payen, E.; Romero, Y.; Richard, F.; Brunet, S.; Lambert, D.; Portier, X.;Popov, A.; et al. Effect of Water on the Stability of Mo and CoMo Hydrodeoxygenation Catalysts: A CombinedExperimental and DFT Study. J. Catal. 2011, 282, 155–164. [CrossRef]
19. Wildschut, J.; Mahfud, F.H.; Venderbosch, R.H.; Heeres, H.J. Hydrotreatment of Fast Pyrolysis Oil UsingHeterogeneous Noble-Metal Catalysts. Ind. Eng. Chem. Res. 2009, 48, 10324–10334. [CrossRef]
178
Catalysts 2019, 9, 550
20. Lauritsen, J.V.; Besenbacher, F. Atom-Resolved Scanning Tunneling Microscopy Investigations of MolecularAdsorption on MoS2 and CoMoS Hydrodesulfurization Catalysts. J. Catal. 2015, 328, 49–58. [CrossRef]
21. Topsøe, H.; Clausen, B.S.; Massoth, F.E. Hydrotreating Catalysis BT—Catalysis: Science and Technology;Anderson, J.R., Boudart, M., Eds.; Springer Berlin Heidelberg: Berlin/Heidelberg, Germany, 1996; 269p.
22. Lauritsen, J.V.; Nyberg, M.; Nørskov, J.K.; Clausen, B.S.; Topsøe, H.; Lægsgaard, E.; Besenbacher, F.Hydrodesulfurization Reaction Pathways on MoS2 Nanoclusters Revealed by Scanning Tunneling Microscopy.J. Catal. 2004, 224, 94–106. [CrossRef]
23. Zhu, Y.; Ramasse, Q.M.; Brorson, M.; Moses, P.G.; Hansen, L.P.; Topsøe, H.; Kisielowski, C.F.; Helveg, S.Location of Co and Ni Promoter Atoms in Multi-Layer MoS2 Nanocrystals for Hydrotreating Catalysis.Catal. Today 2016, 261, 75–81. [CrossRef]
24. Liu, B.; Liu, L.; Chai, Y.; Zhao, J.; Liu, C. Essential Role of Promoter Co on the MoS2 Catalyst in SelectiveHydrodesulfurization of FCC Gasoline. J. Fuel Chem. Technol. 2018, 46, 441–450. [CrossRef]
25. Kim, D.S.; Segawa, K.; Soeya, T.; Wachs, I.E. Surface Structures of Supported Molybdenum Oxide Catalystsunder Ambient Conditions. J. Catal. 1992, 136, 539–553. [CrossRef]
26. Ng, K.Y.S.; Gulari, E. Molybdena on Titania: I. Preparation and Characterization by Raman and FourierTransform Infrared Spectroscopy. J. Catal. 1985, 92, 340–354. [CrossRef]
27. Cáceres, C.V.; Fierro, J.L.G.; Lázaro, J.; López Agudo, A.; Soria, J. Effect of Support on the SurfaceCharacteristics of Supported Molybdena Catalysts. J. Catal. 1990, 122, 113–125. [CrossRef]
28. Breysse, M.; Afanasiev, P.; Geantet, C.; Vrinat, M. Overview of Support Effects in Hydrotreating Catalysts.Catal. Today 2003, 86, 5–16. [CrossRef]
29. Gutiérrez-Alejandre, A.; Ramírez, J.; Val, I.J.; Peñuelas-Galaz, M.; Sánchez-Neri, P.; Torres-Mancera, P. Activityof NiW Catalysts Supported on TiO2-Al2O3 Mixed Oxides: Effect of Ti Incorporation Method on the HDS of4,6-DMDBT. Catal. Today 2005, 107–108, 879–884. [CrossRef]
30. Escobar, J.; Antonio De Los Reyes, J.; Viveros, T. Nickel on TiO2-Modified Al2O3 Sol–Gel Oxides: Effect ofSynthesis Parameters on the Supported Phase Properties. Appl. Catal. A Gen. 2003, 253, 151–163. [CrossRef]
31. Núñez, S.; Escobar, J.; Vázquez, A.; de los Reyes, J.A.; Hernández-Barrera, M. 4,6-Dimethyl-DibenzothiopheneConversion over Al2O3–TiO2-Supported Noble Metal Catalysts. Mater. Chem. Phys. 2011, 126, 237–247.[CrossRef]
32. Tavizón-Pozos, J.A.; Suárez-Toriello, V.A.; de los Reyes, J.A.; Guevara-Lara, A.; Pawelec, B.; Fierro, J.L.G.;Vrinat, M.; Geantet, C. Deep Hydrodesulfurization of Dibenzothiophenes Over NiW Sulfide CatalystsSupported on Sol–Gel Titania–Alumina. Top. Catal. 2016, 59, 241–251. [CrossRef]
33. Suárez-Toriello, V.A.; Santolalla-Vargas, C.E.; de los Reyes, J.A.; Vázquez-Zavala, A.; Vrinat, M.; Geantet, C.Influence of the Solution PH in Impregnation with Citric Acid and Activity of Ni/W/Al2O3 Catalysts. J. Mol.Catal. A Chem. 2015, 404–405, 36–46. [CrossRef]
34. Tavizón-Pozos, J.A.; Suárez-Toriello, V.A.; del Ángel, P.; de los Reyes, J.A. Hydrodeoxygenation of PhenolOver Sulfided CoMo Catalysts Supported on a Mixed Al2O3-TiO2 Oxide. Int. J. Chem. React. Eng. 2016, 14,1211–1223. [CrossRef]
35. Escobar, J.; Núñez, S.; Montesinos-Castellanos, A.; de los Reyes, J.A.; Rodríguez, Y.; González, O.A.Dibenzothiophene Hydrodesulfurization over PdPt/Al2O3–TiO2. Influence of Ti-Addition on HydrogenatingProperties. Mater. Chem. Phys. 2016, 171, 185–194. [CrossRef]
36. Olguin, E.; Vrinat, M.; Cedeño, L.; Ramirez, J.; Borque, M.; López-Agudo, A. The Use of TiO2—Al2O3 BinaryOxides as Supports for Mo-Based Catalysts in Hydrodesulfurization of Thiophene and Dibenzothiophene.Appl. Catal. A Gen. 1997, 165, 1–13. [CrossRef]
37. Ramírez, J.; Macías, G.; Cedeño, L.; Gutiérrez-Alejandre, A.; Cuevas, R.; Castillo, P. The Role of Titaniain Supported Mo, CoMo, NiMo, and NiW Hydrodesulfurization Catalysts: Analysis of Past and NewEvidences. Catal. Today 2004, 98, 19–30. [CrossRef]
38. Chen, W.; Long, X.; Li, M.; Nie, H.; Li, D. Influence of Active Phase Structure of CoMo/Al2O3 Catalyst on theSelectivity of Hydrodesulfurization and Hydrodearomatization. Catal. Today 2017, 292, 97–109. [CrossRef]
39. Wang, L.; Hall, W.K. On the Genesis of Molybdena-Alumina Catalyst. J. Catal. 1980, 66, 251–255. [CrossRef]40. Kim, D.S.; Kurusu, Y.; Wachs, I.E.; Hardcastle, F.D.; Segawa, K. Physicochemical Properties of MoO3 TiO2
Prepared by an Equilibrium Adsorption Method. J. Catal. 1989, 120, 325–336. [CrossRef]41. Afanasiev, P.; Geantet, C.; Breysse, M. Preparation of High-Surface-Area Mo/ZrO2 Catalysts by a Molten Salt
Method: Application to Hydrodesulfurization. J. Catal. 1995, 153, 17–24. [CrossRef]
179
Catalysts 2019, 9, 550
42. Williams, C.C.; Ekerdt, J.G.; Jehng, J.M.; Hardcastle, F.D.; Wachs, I.E. A Raman and Ultraviolet DiffuseReflectance Spectroscopic Investigation of Alumina-Supported Molybdenum Oxide. J. Phys. Chem. 1991, 95,8791–8797. [CrossRef]
43. Xiong, G.; Li, C.; Feng, Z.; Ying, P.; Xin, Q.; Liu, J. Surface Coordination Structure of Molybdate withExtremely Low Loading on γ-Alumina Characterized by UV Resonance Raman Spectroscopy. J. Catal. 1999,186, 234–237. [CrossRef]
44. Stencel, J.M. Raman Spectroscopy for Catalysis, 1st ed.; Davis, B., Ed.; Van Nostrand Reinhold: New York, NY,USA, 1990.
45. Lozano-Hernández, G.; Lozada-Ascencio, E.M.; Guevara-Lara, A. Support Composition Effect on SuperficialStructures of Nickel and Molybdenum Oxides Supported on TiO2-Al2O3 Mixed Oxides. Rev. Mex. Ing.Química 2006, 5, 311–320.
46. Aveston, J.; Anacker, E.W.; Johnson, J.S. Hydrolysis of Molybdenum(VI). Ultracentrifugation, AcidityMeasurements, and Raman Spectra of Polymolybdates. Inorg. Chem. 1964, 3, 735–746. [CrossRef]
47. Platanitis, P.; Panagiotou, G.D.; Bourikas, K.; Kordulis, C.; Fierro, J.L.G.; Lycourghiotis, A. Preparation ofUn-Promoted Molybdenum HDS Catalysts Supported on Titania by Equilibrium Deposition Filtration:Optimization of the Preparative Parameters and Investigation of the Promoting Action of Titania. J. Mol.Catal. A Chem. 2016, 412, 1–12. [CrossRef]
48. Vakros, J.; Lycourghiotis, A.; Voyiatzis, G.A.; Siokou, A.; Kordulis, C. CoMo/Al2O3-SiO2 CatalystsPrepared by Co-Equilibrium Deposition Filtration: Characterization and Catalytic Behavior for theHydrodesulphurization of Thiophene. Appl. Catal. B Environ. 2010, 96, 496–507. [CrossRef]
49. Malaibari, Z.O.; Croiset, E.; Amin, A.; Epling, W. Effect of Interactions between Ni and Mo on CatalyticProperties of a Bimetallic Ni-Mo/Al2O3 Propane Reforming Catalyst. Appl. Catal. A Gen. 2015, 490, 80–92.[CrossRef]
50. Arnoldy, P.; Franken, M.C.; Scheffer, B.; Moulijn, J.A. Temperature-Programmed Reduction of CoOMoO3Al2O3 Catalysts. J. Catal. 1985, 96, 381–395. [CrossRef]
51. Bergwerff, J.A.; Visser, T.; Weckhuysen, B.M. On the Interaction between Co- and Mo-Complexes inImpregnation Solutions Used for the Preparation of Al2O3-Supported HDS Catalysts: A CombinedRaman/UV–Vis–NIR Spectroscopy Study. Catal. Today 2008, 130, 117–125. [CrossRef]
52. Okamoto, Y.; Imanaka, T. Interaction Chemistry between Molybdena and Alumina: Infrared Studies ofSurface Hydroxyl Groups and Adsorbed Carbon Dioxide on Aluminas Modified with Molybdate, Sulfate,or Fluorine Anions. J. Phys. Chem. 1988, 92, 7102–7112. [CrossRef]
53. Topsoe, N.Y.; Topsoe, H. FTIR Studies of Mo/Al2O3-Based Catalysts: I. Morphology and Structure of Calcinedand Sulfided Catalysts. J. Catal. 1993, 139, 631–640. [CrossRef]
54. Besenbacher, F.; Brorson, M.; Clausen, B.S.; Helveg, S.; Hinnemann, B.; Kibsgaard, J.; Lauritsen, J.V.;Moses, P.G.; Nørskov, J.K.; Topsøe, H. Recent STM, DFT and HAADF-STEM Studies of Sulfide-BasedHydrotreating Catalysts: Insight into Mechanistic, Structural and Particle Size Effects. Catal. Today 2008, 130,86–96. [CrossRef]
55. Lauritsen, J.V.; Kibsgaard, J.; Olesen, G.H.; Moses, P.G.; Hinnemann, B.; Helveg, S.; Nørskov, J.K.; Clausen, B.S.;Topsøe, H.; Lægsgaard, E.; et al. Location and Coordination of Promoter Atoms in Co- and Ni-PromotedMoS2-Based Hydrotreating Catalysts. J. Catal. 2007, 249, 220–233. [CrossRef]
56. Vrinat, M.; Letourneur, D.; Bacaud, R.; Harlé, V.; Jouguet, B.; Leclercq, C. CoMo/Al2O3 and CoMo/TiO2-Al2O3
Catalysts in Hydrodesulfurization: Relationship between the Promoting Effect of Cobalt and the Natureof the Support. In Studies in Surface Science and Catalysis: Hydrotreatment and Hydrocracking of Oil FractionsProceedings ofthe 2nd International Symposium/7th European Workshop; Delmon, B., Froment, G.F., Grange, P.,Eds.; Elsevier: Antwerpen, Belgium, 1999; Volume 127, pp. 153–160.
57. Vakros, J.; Papadopoulou, C.; Lycourghiotis, A.; Kordulis, C. Hydrodesulfurization Catalyst Bodies withVarious Co and Mo Profiles. Appl. Catal. A Gen. 2011, 399, 211–220. [CrossRef]
58. Montoya, J.A.; del Angel, P.; Viveros, T. The Effect of Temperature on the Structural and Textural Evolutionof Sol-Gel AlO-TiO Mixed Oxides. J. Mater. Chem. 2001, 11, 944–950. [CrossRef]
59. Herrera, J.E.; Resasco, D.E. Loss of Single-Walled Carbon Nanotubes Selectivity by Disruption of the Co–MoInteraction in the Catalyst. J. Catal. 2004, 221, 354–364. [CrossRef]
180
Catalysts 2019, 9, 550
60. Vakros, J.; Bourikas, K.; Perlepes, S.; Kordulis, C.; Lycourghiotis, A. Adsorption of Cobalt Ions on the“Electrolytic Solution/γ-Alumina” Interface Studied by Diffuse Reflectance Spectroscopy (DRS). Langmuir2004, 20, 10542–10550. [CrossRef] [PubMed]
61. Papadopoulou, C.; Vakros, J.; Matralis, H.K.; Voyiatzis, G.A.; Kordulis, C. Preparation, Characterization,and Catalytic Activity of CoMo/γ-Al2O3 Catalysts Prepared by Equilibrium Deposition Filtration andConventional Impregnation Techniques. J. Colloid Interface Sci. 2004, 274, 159–166. [CrossRef]
62. Brito, J.L.; Barbosa, A.L. Effect of Phase Composition of the Oxidic Precursor on the HDS Activity of theSulfided Molybdates of Fe(II), Co(II), and Ni(II). J. Catal. 1997, 171, 467–475. [CrossRef]
63. Papadopoulou, C.; Vakros, J.; Matralis, H.K.; Kordulis, C.; Lycourghiotis, A. On the Relationshipbetween the Preparation Method and the Physicochemical and Catalytic Properties of the CoMo/γ-Al2O3
Hydrodesulfurization Catalysts. J. Colloid Interface Sci. 2003, 261, 146–153. [CrossRef]64. Zhang, Z.; Zhang, Q.; Jia, L.; Wang, W.; Zhang, T.; Han, Y.; Tsubaki, N.; Tan, Y. Effects of Tetrahedral
Molybdenum Oxide Species and MoOx Domains on the Selective Oxidation of Dimethyl Ether under MildConditions. Catal. Sci. Technol. 2016, 6, 2975–2983. [CrossRef]
65. Jermwongratanachai, T.; Jacobs, G.; Shafer, W.D.; Pendyala, V.R.R.; Ma, W.; Gnanamani, M.K.; Hopps, S.;Thomas, G.A.; Kitiyanan, B.; Khalid, S.; et al. Fischer–Tropsch Synthesis: TPR and XANES Analysis ofthe Impact of Simulated Regeneration Cycles on the Reducibility of Co/Alumina Catalysts with DifferentPromoters (Pt, Ru, Re, Ag, Au, Rh, Ir). Catal. Today 2014, 228, 15–21. [CrossRef]
66. Jacobs, G.; Ji, Y.; Davis, B.H.; Cronauer, D.; Kropf, A.J.; Marshall, C.L. Fischer–Tropsch Synthesis: TemperatureProgrammed EXAFS/XANES Investigation of the Influence of Support Type, Cobalt Loading, and NobleMetal Promoter Addition to the Reduction Behavior of Cobalt Oxide Particles. Appl. Catal. A Gen. 2007, 333,177–191. [CrossRef]
67. Yamada, M.; Kasahara, S.; Kawahara, K. Interaction between Co Species and Mo Species in C0O-M0O3/AI2O3.In Studies in Surface Science and Catalysis: New Aspects of Spillover Effect in Catalysis; lnui, T., Fujimoto, K.,Uchijima, T., Masai, M., Eds.; Elsevier: Kyoto, Japan, 1993; Volume 77, pp. 349–352. [CrossRef]
68. Guo, C.; Wu, Y.; Wang, X.; Yang, B. Effect of the Support Calcination Temperature on SelectiveHydrodesulfurization of TiO2 Nanotubes Supported CoMo Catalysts. J. Energy Chem. 2013, 22, 517–523.[CrossRef]
69. Gandubert, A.D.; Krebs, E.; Legens, C.; Costa, D.; Guillaume, D.; Raybaud, P. Optimal Promoter EdgeDecoration of CoMoS Catalysts: A Combined Theoretical and Experimental Study. Catal. Today 2008, 130,149–159. [CrossRef]
70. Ninh, T.K.T.; Laurenti, D.; Leclerc, E.; Vrinat, M. Support Effect for CoMoS and CoNiMoSHydrodesulfurization Catalysts Prepared by Controlled Method. Appl. Catal. A Gen. 2014, 487, 210–218.[CrossRef]
71. Laurenti, D.; Phung-Ngoc, B.; Roukoss, C.; Devers, E.; Marchand, K.; Massin, L.; Lemaitre, L.; Legens, C.;Quoineaud, A.-A.; Vrinat, M. Intrinsic Potential of Alumina-Supported CoMo Catalysts in HDS: Comparisonbetween Γc, ΓT, and δ-Alumina. J. Catal. 2013, 297, 165–175. [CrossRef]
72. La Parola, V.; Dragoi, B.; Ungureanu, A.; Dumitriu, E.; Venezia, A.M. New HDS Catalysts Based on ThiolFunctionalized Mesoporous Silica Supports. Appl. Catal. A Gen. 2010, 386, 43–50. [CrossRef]
73. Brorson, M.; Carlsson, A.; Topsøe, H. The Morphology of MoS2, WS2, Co–Mo–S, Ni–Mo–S and Ni–W–SNanoclusters in Hydrodesulfurization Catalysts Revealed by HAADF-STEM. Catal. Today 2007, 123, 31–36.[CrossRef]
© 2019 by the authors. Licensee MDPI, Basel, Switzerland. This article is an open accessarticle distributed under the terms and conditions of the Creative Commons Attribution(CC BY) license (http://creativecommons.org/licenses/by/4.0/).
181

catalysts
Article
Synthesis and Regeneration of Nickel-BasedCatalysts for Hydrodeoxygenation of Beech WoodFast Pyrolysis Bio-Oil
Caroline Carriel Schmitt 1,2,*, María Belén Gagliardi Reolon 1,3, Michael Zimmermann 1,
Klaus Raffelt 1, Jan-Dierk Grunwaldt 1,4 and Nicolaus Dahmen 1
1 Institute of Catalysis Research and Technology (IKFT), Karlsruhe Institute of Technology (KIT),76344 Eggenstein-Leopoldshafen, Germany; [email protected] (M.B.G.R.);[email protected] (M.Z.); [email protected] (K.R.); [email protected] (J.-D.G.);[email protected] (N.D.)
2 Institute of Microstructure Technology (IMT), Karlsruhe Institute of Technology (KIT),76344 Eggenstein-Leopoldshafen, Germany
3 Instituto Tecnologico de Buenos Aires (ITBA), Buenos Aires C1106ACD, Argentina4 Institute for Chemical Technology and Polymer Chemistry (ITCP), Karlsruhe Institute of Technology (KIT),
76131 Karlsruhe, Germany* Correspondence: [email protected]
Received: 17 August 2018; Accepted: 8 October 2018; Published: 12 October 2018
Abstract: Four nickel-based catalysts are synthesized by wet impregnation and evaluated for thehydrotreatment/hydrodeoxygenation of beech wood fast-pyrolysis bio-oil. Parameters such aselemental analysis, pH value, and water content, as well as the heating value of the upgradedbio-oils are considered for the evaluation of the catalysts’ activity and catalyst reuse in cyclesof hydrodeoxygenation after regeneration. The reduction temperature, selectivity and hydrogenconsumption are distinct among them, although all catalysts tested produce upgraded bio-oils withreduced oxygen concentration, lower water content and higher energy density. Ni/SiO2, in particular,can remove more than 50% of the oxygen content and reduce the water content by more than80%, with low coke and gas formation. The evaluation over four consecutive hydrotreatmentreactions and catalyst regeneration shows a slightly reduced hydrodeoxygenation activity of Ni/SiO2,mainly due to deactivation caused by sintering and adsorption of poisoning substances, such as sulfur.Following the fourth catalyst reuse, the upgraded bio-oil shows 43% less oxygen in comparison tothe feedstock and properties comparable to the upgraded bio-oil obtained with the fresh catalyst.Hence, nickel-based catalysts are promising for improving hardwood fast-pyrolysis bio-oil properties,especially monometallic nickel catalysts supported on silica.
Keywords: hydrodeoxygenation; fast-pyrolysis bio-oil; nickel catalyst; upgrading
1. Introduction
The increase in global energy demand, depletion of fossil fuel reserves and climate changeissues have drawn attention to renewable alternatives, particularly to biomass [1–3], considering itsCO2 neutrality for fuel applications and widespread availability [1,4]. Products such as heat,power, biomaterials, chemical compounds, and transportation fuels can be obtained frombiomass [5]. Considering this purpose, thermochemical, chemical-catalytical or biological processesare used. Regarding the first category, combustion, gasification and pyrolysis are most common.Although considered the simplest way to convert biomass in either power or heat, combustion showshigh emissions and ash generation [5]. Gasification is considered a very efficient method to obtainfuels, but it requires a high investment due to large-scale installations, storage and transportation [6].
Catalysts 2018, 8, 449; doi:10.3390/catal8100449 www.mdpi.com/journal/catalysts183
Catalysts 2018, 8, 449
Therewith, pyrolysis has been considered a promising process as it balances simple operationtechniques with reasonable costs.
Pyrolysis is a thermochemical process in which the biomass is heated and converted in aninert atmosphere into a liquid fraction called bio-oil, a carbon-rich solid (biochar) and a mixture ofnon-condensable gases [7]. The bio-oil obtained has poorer physical and chemical characteristicsif compared to liquid fossil fuels. The heating value is usually lower, only 40–50% comparedto conventional fossil fuels (42–45 MJ/Kg), mainly due to the high oxygen and water content.Additionally, it shows high viscosity, low chemical stability and solid particles [8–10] due to incompletesolid separation or polymerization reactions during storage, for example. Carboxylic acids presentin the bio-oil composition lead to high acidity (pH value around 2–3.7), resulting in a bio-oil withpotentially corrosive properties. Furthermore, it is highly unstable during storage due to ongoingchemical reactions, resulting in larger molecules by polymerization, etherification and esterification [9],for example. Additionally, it is immiscible with fossil fuels and tends to undergo phase separationwhen stored for a long time. Considering these poor fuel properties, the direct application of bio-oil islimited to furnaces and boilers, being unsuitable for application in gas turbines, diesel engines andother applications without further treatment [11]. Concerning bio-oil production today, wood withlow ash content is used, leading to relatively “well-natured” bio-oils. Using ash-rich feedstocks,bio-oil yield and quality is decreased, while the tendency for phase separation increases.
To improve these properties and obtain a product resembling diesel fuel, bio-oil requires anadditional upgrading treatment. Upgraded bio-oil can then be used as feedstock for producingchemicals, such as phenols for resin production, additives for fertilizers and pharmaceutical industries,as well as flavoring agents in the food industry [12]. Regarding terms of energetic use, upgradedbio-oil might be used as feedstock in oil refineries and fuels in engines [13].
A variety of upgrading techniques already have been proposed, such as catalytic cracking,hydrodeoxygenation (HDO) and esterification in supercritical fluids [14]. Among them, HDO appearsto be a propitious route, due to its flexibility with respect to the biomass feed, the goodeconomy of the input materials, and its compatibility with refinery infrastructures [15]. HDO isa high-pressure catalytic treatment in which oxygen is removed by hydrogen resulting in water,which is environmentally benign [16]. Usually, sulfides, noble metals and transition metal catalysts areused [17]. Noble metals such as Pt, Pd and Ru have been evaluated widely for HDO and are oftenthe first choice in hydrogenation reactions. Additionally, they have a low tendency to be poisoned bythe sulfur present in the bio-oil [18]. Their relatively high costs, however, prevent them from beingwidely used. Recently, nickel-based catalysts have become more attractive, considering their lowerprice, availability, activity and reduced hydrogen consumption [10,19]. Jin et al. [20] evaluated a seriesof nickel-based catalysts on different supports (SiO2, Al2O3, AC and SBA–15 mesoporous silica) for theHDO of anisole, used as a model compound. Boscagli et al. [21] investigated the HDO of the bio-oillight phase over a variety of nickel-based catalysts (NiCu/Al2O3, Ni/SiO2, Ni/ZrO2, Ni/TiO2 andNiW/AC). Dongil et al. [22] studied the HDO of guaiacol over nickel-based catalysts, using differentcarbon-based supports.
The combination of nickel in bimetallic catalysts has also attracted attention for HDO, especially incombination with copper. Ardiyanti et al. [23] evaluated the application of NiCu at different loadingssupported in δ–Al2O3 for upgrading of model compounds and fast-pyrolysis bio-oil. Dongil et al. [24]investigated the effect of Cu loading on nickel catalysts supported in carbon nanotubes over the HDOof guaiacol. Mortensen et al. [25] screened different catalysts, including NiCu/SiO2 for phenol HDOand, more recently, Boscagli et al. [26] tested NiCu/Al2O3 for the HDO of phenol and bio-oils reusingthe catalyst after a regeneration step.
The investigation of nickel and nickel–copper catalysts on SiO2 and ZrO2 supports with realfeedstock (fast-pyrolysis bio-oil) is of interest, especially with respect to the lower acidity in comparisonto Al2O3, a commonly studied support for HDO catalysts [27]. Many studies are focused onalumina-supported catalysts (Al2O3) [23,26] and upgrading applying model compounds [20,22] but
184
Catalysts 2018, 8, 449
supports with higher stability are required. The alumina-support is well known for its acidity, tendencyfor increased coke formation, low water tolerance, and conversion to boehmite, resulting in theoxidation and deactivation of the active metal [15,28,29]. According to He et al. [28], the selection ofthe support for HDO of bio-oils, must consider the resistance to the water content, the acidity of thesupports to reduce coke formation, the porosity and its ability to keep the active metal dispersed for theactivation of hydrogen. Hence, the investigation of different supports, such as SiO2 and ZrO2, appearsinteresting, especially when including catalyst regeneration in consecutive cycles of HDO-regeneration,evaluating the thermal stability of the catalyst [30]. Presently, only a few works have investigatedthe regeneration and evaluation of the reuse of the catalyst [26]. Most works, in fact, only considerone regeneration step and do not contemplate Ni catalysts [26,31,32]. It is an essential step to reducecosts, minimizing the waste generation at the same time helping to increase the reusability andrecyclability of the catalysts, extending its lifetime [33]. Additionally, previous studies consideredthe HDO of model compounds whereas others considered the application of fast pyrolysis bio-oil.Usually, different temperature, pressure and reactor designs are used, which makes the comparison ofthe performance of different nickel-based catalysts difficult.
The current work synthesizes, characterizes and evaluate four nickel-based catalysts for amulti-phase fast-pyrolysis bio-oil upgrading. Supports with higher stability (SiO2 and ZrO2) areselected. The catalyst with the best performance is then reused in subsequent HDO-regeneration steps,resulting in four consecutive reactions. Finally, the performance and the catalytic activity along theHDO-regeneration steps are assessed and discussed.
2. Results
2.1. Characterization of the Synthesized Catalysts
The results obtained from the temperature programmed reduction (H2–TPR), in Figure 1,were useful to identify the catalysts’ reduction temperatures before the hydrodeoxygenation (HDO)reactions. The H2–TPR profile for Ni/SiO2 showed a clear peak at 350 ◦C, while the peak for Ni/ZrO2
is found between 350–400 ◦C, in agreement with literature [21,34,35]. Since the reduction of bulk Nioxide occurs around 400–450 ◦C [36,37], the reduction temperature of Ni/SiO2 and Ni/ZrO2 was setto 500 ◦C to ensure a full reduction before hydrodeoxygenation (HDO) reactions. The addition of Cuto Ni [36,37], as well as the higher loading of Ni [38,39] seems to promote the reduction of Ni oxide,as for both bimetallic NiCu catalysts the temperature of reduction is lower compared to monometallicNi catalysts. Concerning NiCu/SiO2, it occurs at 300 ◦C, while for NiCu/ZrO2 it was closer to200 ◦C. Different peaks are present in the H2–TPR profiles, attributed to bulk nickel oxide reduction,reduction of Cu(II) to Cu(0) (below 250 ◦C), as well as reduction of bimetallic NiCu species which,according to Ardiyanti et al. [40], should occur approximately in the range of 290–390 ◦C. Regardingthe current catalysts, most of the reduction was observed at lower temperatures. Consequently,the reduction of NiCu catalyst was set at 350 ◦C.
Powder X-ray diffraction (XRD), provided information about the crystalline structure of thecatalyst (Figure 2). Both SiO2-supported catalysts show similar XRD patterns. The reflections locatedat 37.25◦ and 43.29◦ indicate the presence of Ni oxide (NiO) in the calcined catalysts. Additionally,metallic Ni was identified due to the reflections at 44.49◦, 51.85◦, 76.38◦, 92.93◦ and 98.44◦. Followingthe reduction, reflections attributed to NiO disappeared, remaining just metallic Ni reflections.A similar behavior can be seen for Ni/ZrO2 and NiCu/ZrO2 (Figure 2). Both NiO and metallicNi are present in the calcined catalyst. Subsequently, the reduction reflections of NiO are no longerobserved for Ni/ZrO2 and showed a reduced intensity for NiCu/ZrO2. Reflections attributed tocopper were not observed in the bimetallic catalysts, which can be a result of high dispersion of themetal, as well as low concentration [21,23].
185

Catalysts 2018, 8, 449
Figure 1. Temperature programmed reduction profile for the nickel-based catalysts. TCD: Thermalconductivity detector; a.u.: arbitrary units.
Figure 2. X-ray powder diffraction of the freshly synthesized catalysts, Ni/ZrO2, Ni/SiO2, NiCu/ZrO2
and NiCu/SiO2. a.u.: arbitrary units.
186
Catalysts 2018, 8, 449
The crystallite sizes were estimated using the Scherrer equation. The crystallite size was 17.7 nmfor Ni/SiO2, whereas for NiCu/SiO2, the value was estimated to be 21.4 nm. NiCu/ZrO2 showed acrystallite size of 43.3 nm and the crystallite size of Ni/ZrO2 was estimated at 9.7 nm.
The metal concentration, as well as the specific surface area, is compiled in Table 1. The Ni/SiO2
catalyst displays the highest specific surface area (215 m2/g), while NiCu/ZrO2 shows thelowest (50 m2/g). Usually, SiO2-supported catalysts show higher surface areas in comparison toZrO2-supported catalysts [41]. The BET surface area of the catalysts, as well as the micropore areaand volume, is reduced with the addition of Cu and higher nickel loading. This behavior was alsoobserved by Dongil et al. [24] and Zhang et al. [42]. Furthermore, no micropores were observed in thezirconia-supported catalysts.
Table 1. BET surface area, pore area, volume, diameter, and metal content in the freshlysynthesized catalysts.
Properties Ni/SiO2 Ni/ZrO2 NiCu/SiO2 NiCu/ZrO2
BET surface area (m2/g) 215 65 156 50Micropore area (m2/g) 24 0 12 0Micropore volume (cm3/g) 0.009 0 0.004 0Pore diameter (nm) 17.1 12.7 17.1 10.2Ni (wt.%) 7.9 8.0 27.9 27.3Cu (wt.%) - - 3.2 3.1
2.2. Hydrotreatment Reactions
2.2.1. Upgraded Bio-Oil Yields and Properties
The HDO reactions with Ni/SiO2 showed the highest yield of upgraded bio-oil (49.36 wt.%),and the lowest yields of the aqueous phase (35.57 wt.%) and solids (Table 2). These tendencies werenot clear for the remaining catalysts. The lowest yield of upgraded bio-oil (45.32 wt.%) was obtainedwith Ni/ZrO2, while NiCu/ZrO2 showed the highest production of solids (0.32 wt.%) and aqueousphase (43.52 wt.%). The highest production of gas was obtained with Ni/ZrO2 (4.54 wt.%) whereasthe lowest was obtained with NiCu/SiO2 (3.56 wt.%).
Table 2. Mass balance, elemental analysis and physicochemical properties of the upgraded bio-oilsobtained with fresh Ni-based catalysts.
Properties Ni/SiO2 Ni/ZrO2 NiCu/SiO2 NiCu/ZrO2
Mass balanceUpgraded bio-oil (wt.%) 49.36 ± 0.07 45.32 ± 0.03 49.03 ± 0.03 46.39 ± 0.04Aqueous phase (wt.%) 35.57 ± 0.07 42.72 ± 0.01 41.45 ± 0.01 43.52 ± 0.03Gas (wt.%) 4.29 ± 0.06 4.54 ± 0.05 3.56 ± 0.07 3.87 ± 0.03Solids (wt.%) 0.23 ± 0.11 0.31 ± 0.06 0.31 ± 0.22 0.32 ± 0.29Losses (wt.%) 10.54 ± 0.17 7.10 ± 0.05 5.65 ± 0.47 5.90 ± 0.49
Upgraded bio-oil (dry basis; wet basis)Carbon (wt.%) 73.15 ± 0.06; 69.75 ± 0.21 72.22 ± 0.01; 68.10 ± 0.21 72.37 ± 0.58; 66.80 ± 0.85 72.15 ± 1.01; 67.25 ± 0.21Hydrogen (wt.%) 8.42 ± 0.07; 8.55 ± 0.07 8.25± 0.01; 8.40± 0.01 8.51 ± 0.31; 8.70 ± 0.28 8.55 ± 0.31; 8.70 ± 0.28Oxygen (wt.%) 17.86 ± 0.05; 21.30 ± 0.01 19.46 ± 0.15; 23.00 ± 0.14 19.00 ± 0.91; 24.10 ± 1.13 20.35± 0.01; 23.60 ± 1.41Nitrogen (wt.%) 0.32 ± 0.01; 0.30 ± 0.01 0.32 ± 0.01; 0.30 ± 0.01 0.32 ± 0.01; 0.30 ± 0.01 0.32 ± 0.01; 0.30 ± 0.01
Physicochemical propertiesH2O (wt.%) 4.85 ± 0.07 5.10 ± 0.01 7.30 ± 0.42 5.95 ± 0.35HHV (MJ/kg) 31.18 ± 0.08 30.85 ± 0.02 29.86 ± 0.26 30.27 ± 0.31pH value 3.55 ± 0.35 3.05 ± 0.35 3.35 ± 0.07 3.20 ± 0.14Density (g/cm3) 1.11 ± 0.01 1.12 ± 0.01 1.09 ± 0.01 1.11 ± 0.01
The elemental composition of the upgraded bio-oils by the different nickel-based catalysts ispresented in Table 2. The concentration of carbon increases in all upgraded bio-oil in comparison to theconcentration in the feed (57.31 wt.% dry basis) [43]. The highest carbon content (73.15 wt.% dry basis)was obtained applying Ni/SiO2. The remaining oils upgraded with the other catalysts displaying a
187

Catalysts 2018, 8, 449
concentration of around 72.25 wt.% in dry and 67.38 wt.% in wet basis, respectively. The hydrogenconcentration was slightly higher in the upgraded bio-oils in comparison to the initial feed, while theoxygen content was reduced in comparison to the original beech wood bio-oil (35.84 wt.% in dry basis).The upgraded bio-oil over Ni/SiO2 shows the lowest oxygen concentration (17.86 wt.% dry basis),followed by NiCu/SiO2 (19.00 wt.% dry basis), Ni/ZrO2 (19.46 wt.% dry basis) and NiCu/ZrO2 (20.35wt.% dry basis).
The water content in the upgraded bio-oils was reduced significantly from 26.77 wt.% in theoriginal feed to values between 4.85 wt.% and 7.30 wt.% in the upgraded bio-oils. More than 70%of the water content in the original oil was removed by the hydrotreatment. The upgraded bio-oilover Ni/SiO2 showed the lowest water content (4.85 wt.%), while NiCu/SiO2 had the highest value(7.30 wt.%). The opposite was observed for the upgraded aqueous phase. While the upgradedaqueous phase obtained with Ni/SiO2 showed 74.35 wt.% of water, the aqueous phase obtainedwith NiCu/SiO2 showed 67.15 wt.% of H2O (Table S1). This is because the water removed from theupgraded bio-oils mainly was concentrated in the aqueous phase.
The higher heating value (HHV) also changed by the reactions. In the feedstock, this valuewas 24.33 MJ/kg, whereas, for the upgraded bio-oils, the HHV increased to values ranging from29.86 MJ/kg to 31.18 MJ/kg in the case of SiO2 supported catalysts. A slight increase in the pH valuewas observed, except for the upgraded bio-oil with Ni/ZrO2. The density of the upgraded bio-oilsdecreased after the hydrotreatment. Comparing the density of the upgraded bio-oils with the densityof the heavy phase, for example, the value was reduced from 1.19 g/cm3 to values between 1.09 g/cm3
and 1.12 g/cm3. The upgraded bio-oil over NiCu/SiO2 displayed the lowest density (1.09 g/cm3),while the highest corresponded to Ni/ZrO2 (1.12 g/cm3).
Further information regarding the upgraded bio-oils composition was obtained by proton nuclearmagnetic resonance (1H-NMR), depicted in Figure 3. Table 3 shows the assignment of chemical groupsto the integration range of the spectra [44]. The aqueous phases are compared to the light phase (LP)of the feedstock, whereas the upgraded bio-oil is compared to the heavy phase (HP) of the feedstock.
Figure 3. 1H-NMR spectra integrals of the bio-oil components, HP (top) and LP (bottom), in contrastto the products (upgraded bio-oil and aqueous phase) obtained by different catalysts.
188
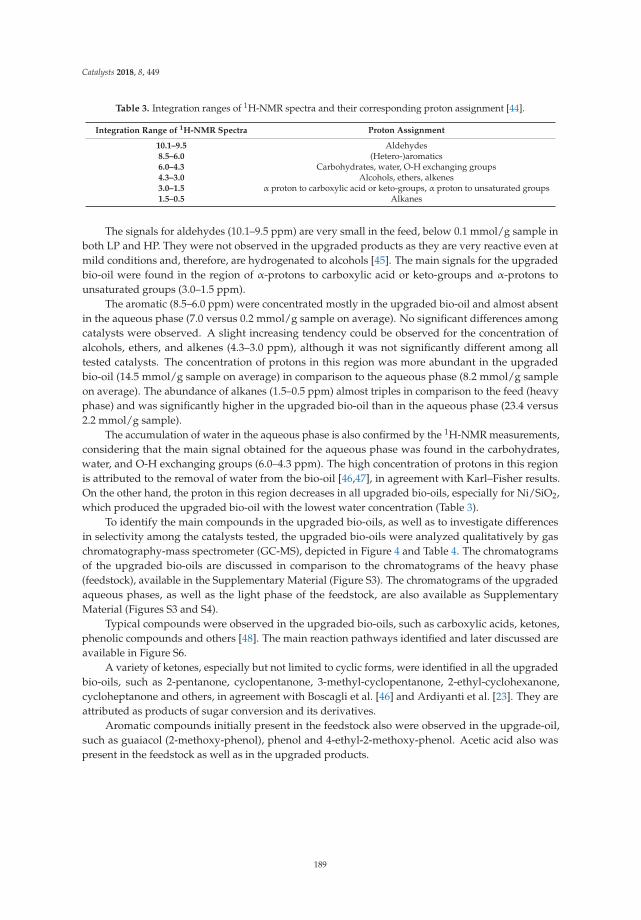
Catalysts 2018, 8, 449
Table 3. Integration ranges of 1H-NMR spectra and their corresponding proton assignment [44].
Integration Range of 1H-NMR Spectra Proton Assignment
10.1–9.5 Aldehydes8.5–6.0 (Hetero-)aromatics6.0–4.3 Carbohydrates, water, O-H exchanging groups4.3–3.0 Alcohols, ethers, alkenes3.0–1.5 α proton to carboxylic acid or keto-groups, α proton to unsaturated groups1.5–0.5 Alkanes
The signals for aldehydes (10.1–9.5 ppm) are very small in the feed, below 0.1 mmol/g sample inboth LP and HP. They were not observed in the upgraded products as they are very reactive even atmild conditions and, therefore, are hydrogenated to alcohols [45]. The main signals for the upgradedbio-oil were found in the region of α-protons to carboxylic acid or keto-groups and α-protons tounsaturated groups (3.0–1.5 ppm).
The aromatic (8.5–6.0 ppm) were concentrated mostly in the upgraded bio-oil and almost absentin the aqueous phase (7.0 versus 0.2 mmol/g sample on average). No significant differences amongcatalysts were observed. A slight increasing tendency could be observed for the concentration ofalcohols, ethers, and alkenes (4.3–3.0 ppm), although it was not significantly different among alltested catalysts. The concentration of protons in this region was more abundant in the upgradedbio-oil (14.5 mmol/g sample on average) in comparison to the aqueous phase (8.2 mmol/g sampleon average). The abundance of alkanes (1.5–0.5 ppm) almost triples in comparison to the feed (heavyphase) and was significantly higher in the upgraded bio-oil than in the aqueous phase (23.4 versus2.2 mmol/g sample).
The accumulation of water in the aqueous phase is also confirmed by the 1H-NMR measurements,considering that the main signal obtained for the aqueous phase was found in the carbohydrates,water, and O-H exchanging groups (6.0–4.3 ppm). The high concentration of protons in this regionis attributed to the removal of water from the bio-oil [46,47], in agreement with Karl–Fisher results.On the other hand, the proton in this region decreases in all upgraded bio-oils, especially for Ni/SiO2,which produced the upgraded bio-oil with the lowest water concentration (Table 3).
To identify the main compounds in the upgraded bio-oils, as well as to investigate differencesin selectivity among the catalysts tested, the upgraded bio-oils were analyzed qualitatively by gaschromatography-mass spectrometer (GC-MS), depicted in Figure 4 and Table 4. The chromatogramsof the upgraded bio-oils are discussed in comparison to the chromatograms of the heavy phase(feedstock), available in the Supplementary Material (Figure S3). The chromatograms of the upgradedaqueous phases, as well as the light phase of the feedstock, are also available as SupplementaryMaterial (Figures S3 and S4).
Typical compounds were observed in the upgraded bio-oils, such as carboxylic acids, ketones,phenolic compounds and others [48]. The main reaction pathways identified and later discussed areavailable in Figure S6.
A variety of ketones, especially but not limited to cyclic forms, were identified in all the upgradedbio-oils, such as 2-pentanone, cyclopentanone, 3-methyl-cyclopentanone, 2-ethyl-cyclohexanone,cycloheptanone and others, in agreement with Boscagli et al. [46] and Ardiyanti et al. [23]. They areattributed as products of sugar conversion and its derivatives.
Aromatic compounds initially present in the feedstock also were observed in the upgrade-oil,such as guaiacol (2-methoxy-phenol), phenol and 4-ethyl-2-methoxy-phenol. Acetic acid also waspresent in the feedstock as well as in the upgraded products.
189
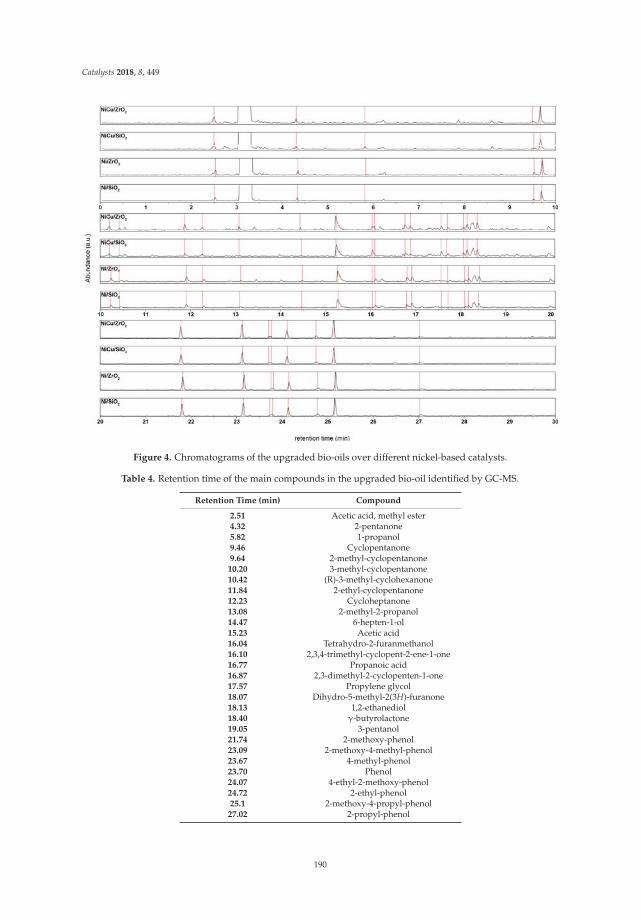
Catalysts 2018, 8, 449
Figure 4. Chromatograms of the upgraded bio-oils over different nickel-based catalysts.
Table 4. Retention time of the main compounds in the upgraded bio-oil identified by GC-MS.
Retention Time (min) Compound
2.51 Acetic acid, methyl ester4.32 2-pentanone5.82 1-propanol9.46 Cyclopentanone9.64 2-methyl-cyclopentanone
10.20 3-methyl-cyclopentanone10.42 (R)-3-methyl-cyclohexanone11.84 2-ethyl-cyclopentanone12.23 Cycloheptanone13.08 2-methyl-2-propanol14.47 6-hepten-1-ol15.23 Acetic acid16.04 Tetrahydro-2-furanmethanol16.10 2,3,4-trimethyl-cyclopent-2-ene-1-one16.77 Propanoic acid16.87 2,3-dimethyl-2-cyclopenten-1-one17.57 Propylene glycol18.07 Dihydro-5-methyl-2(3H)-furanone18.13 1,2-ethanediol18.40 γ-butyrolactone19.05 3-pentanol21.74 2-methoxy-phenol23.09 2-methoxy-4-methyl-phenol23.67 4-methyl-phenol23.70 Phenol24.07 4-ethyl-2-methoxy-phenol24.72 2-ethyl-phenol25.1 2-methoxy-4-propyl-phenol
27.02 2-propyl-phenol
190

Catalysts 2018, 8, 449
After the upgrading reaction, compounds initially present in the bio-oil mixtures, such asfurfural, were completely converted for all the catalysts tested. The same was observed for eugenoland compounds with GC retention times higher than 30 min, such as vanillin. Although verysimilar compositions of all upgraded bio-oils, some differences in selectivity were observed forthe catalysts. 1-propanol (5.82 min) was observed only in the bio-oils upgraded with bimetalliccatalysts, as well as the peak at 16.04 min, attributed to tetrahydro-2-furanmethanol (tetrahydrofurfurylalcohol), also observed in the bio-oils upgraded with NiCu catalysts. It shows that furfural iscompletely hydrogenated to tetrahydrofurfuryl alcohol over these catalysts [49]. Earlier studiesobserved the selectivity of copper-containing catalysts for furfural hydrogenation, particularly at hightemperatures [50]. Furfural also can be converted to cyclopentanone [48,49] and 2-pentanone [8,51],both identified in the products, as well as other cyclopentanones [52].Compounds such as methane,identified in the gas phase and later discussed, also can be derived from furfural conversion;the conversion of furfural to furfuryl alcohol and later to furan leads to methane formation [53].Furthermore, the peak at 17.57 min, attributed to propylene glycol, was observed only in the upgradedbio-oils as well as in the aqueous phases (Figure S5) upgraded with NiCu catalysts. Propylene glycolcan be obtained from hydrogenation of hydroxyacetone [54], which was converted completely afterthe HDO reactions (see peak at 12.46 min Figure S3). While copper-containing catalysts seem to favorthe production of propylene glycol in comparison to other catalysts [55], nickel catalysts seems tofollow a different pathway. Resulting from the C-O bond cleavage of propylene glycol [54], 1-propanolwas observed in the oils upgraded with bimetallic catalysts. Furthermore, compounds initiallyabsent in the feedstock, such as 2-methoxy-4-propyl-phenol, resulting from the hydrogenation of thedouble bond of eugenol, were identified in the upgraded bio-oil [47]. A peak at a retention time of26.9 min was observed in the upgraded aqueous phases obtained with bimetallic catalysts, althoughthe identification of the compound was not possible.
Differences among the feed (LP) and upgraded products (aqueous phases), as well as amongthe products obtained with different catalysts, were observed. For example, 2-methyl-propanol(13.08 min) was observed in all upgraded aqueous phases, except for NiCu/SiO2. The peak attributedto tetrahydro-2-furanmethanol increased significantly, mainly in the aqueous phases obtained bybimetallic catalysts, in the same way as observed in the upgraded bio-oils. Propanoic acid (16.77 min)was observed for all aqueous phases.
2.2.2. Hydrogen Consumption and Gaseous Products
The hydrogen consumption was considered for the evaluation of the different catalysts.NiCu/SiO2 presented the highest consumption (239.3 NL/kg bio-oil), followed by NiCu/ZrO2
(201.6 NL/kg bio-oil), Ni/SiO2 (186.2 NL/kg bio-oil) and Ni/ZrO2 (181.9 NL/kg bio-oil). Yin etal. [35] reported, higher hydrogenation activity can be seen when adding copper to Ni catalysts,due to changes in the catalytic activity and selectivity, favoring some hydrogenation reactions [56].The hydrogen consumption can be correlated with the H/C molar ratio. A higher H/C molar ratioand lower O/C molar ratio indicates an upgraded bio-oil with improved properties [15]. The catalystsevaluated resulted in H/C ratios between 1.37 (Ni/ZrO2) to 1.53 (NiCu/SiO2), showing a tendencybetween the hydrogen uptake and the H/C molar ratio. The same tendency was not observed forthe O/C ratio. The lowest ratio was observed using Ni/SiO2 (0.18) whereas the highest was forNiCu/ZrO2 (0.28). This indicates that a higher consumption of H2 does not reflect in the HDO ofthe feedstock.
Although a very similar total gas production (Figure 5) was obtained for all tested catalysts,Ni/ZrO2 showed the highest total gas production (1.06 mol/kg bio-oil), followed by Ni/SiO2
(0.99 mol/kg bio-oil), NiCu/ZrO2 (0.90 mol/kg bio-oil) and NiCu/SiO2 (0.86 mol/kg bio-oil). The totalgas production was determined mainly by the production of CO2, the most abundant gas productfor all four catalysts, in agreement with other studies [35,40,41,46]. Decarboxylation of carboxylic
191
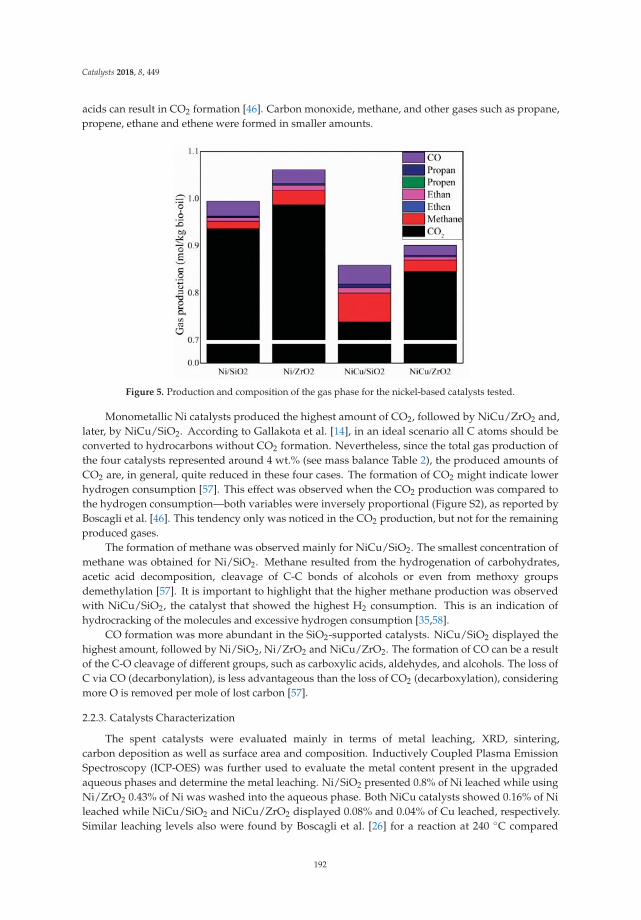
Catalysts 2018, 8, 449
acids can result in CO2 formation [46]. Carbon monoxide, methane, and other gases such as propane,propene, ethane and ethene were formed in smaller amounts.
Figure 5. Production and composition of the gas phase for the nickel-based catalysts tested.
Monometallic Ni catalysts produced the highest amount of CO2, followed by NiCu/ZrO2 and,later, by NiCu/SiO2. According to Gallakota et al. [14], in an ideal scenario all C atoms should beconverted to hydrocarbons without CO2 formation. Nevertheless, since the total gas production ofthe four catalysts represented around 4 wt.% (see mass balance Table 2), the produced amounts ofCO2 are, in general, quite reduced in these four cases. The formation of CO2 might indicate lowerhydrogen consumption [57]. This effect was observed when the CO2 production was compared tothe hydrogen consumption—both variables were inversely proportional (Figure S2), as reported byBoscagli et al. [46]. This tendency only was noticed in the CO2 production, but not for the remainingproduced gases.
The formation of methane was observed mainly for NiCu/SiO2. The smallest concentration ofmethane was obtained for Ni/SiO2. Methane resulted from the hydrogenation of carbohydrates,acetic acid decomposition, cleavage of C-C bonds of alcohols or even from methoxy groupsdemethylation [57]. It is important to highlight that the higher methane production was observedwith NiCu/SiO2, the catalyst that showed the highest H2 consumption. This is an indication ofhydrocracking of the molecules and excessive hydrogen consumption [35,58].
CO formation was more abundant in the SiO2-supported catalysts. NiCu/SiO2 displayed thehighest amount, followed by Ni/SiO2, Ni/ZrO2 and NiCu/ZrO2. The formation of CO can be a resultof the C-O cleavage of different groups, such as carboxylic acids, aldehydes, and alcohols. The loss ofC via CO (decarbonylation), is less advantageous than the loss of CO2 (decarboxylation), consideringmore O is removed per mole of lost carbon [57].
2.2.3. Catalysts Characterization
The spent catalysts were evaluated mainly in terms of metal leaching, XRD, sintering,carbon deposition as well as surface area and composition. Inductively Coupled Plasma EmissionSpectroscopy (ICP-OES) was further used to evaluate the metal content present in the upgradedaqueous phases and determine the metal leaching. Ni/SiO2 presented 0.8% of Ni leached while usingNi/ZrO2 0.43% of Ni was washed into the aqueous phase. Both NiCu catalysts showed 0.16% of Nileached while NiCu/SiO2 and NiCu/ZrO2 displayed 0.08% and 0.04% of Cu leached, respectively.Similar leaching levels also were found by Boscagli et al. [26] for a reaction at 240 ◦C compared
192
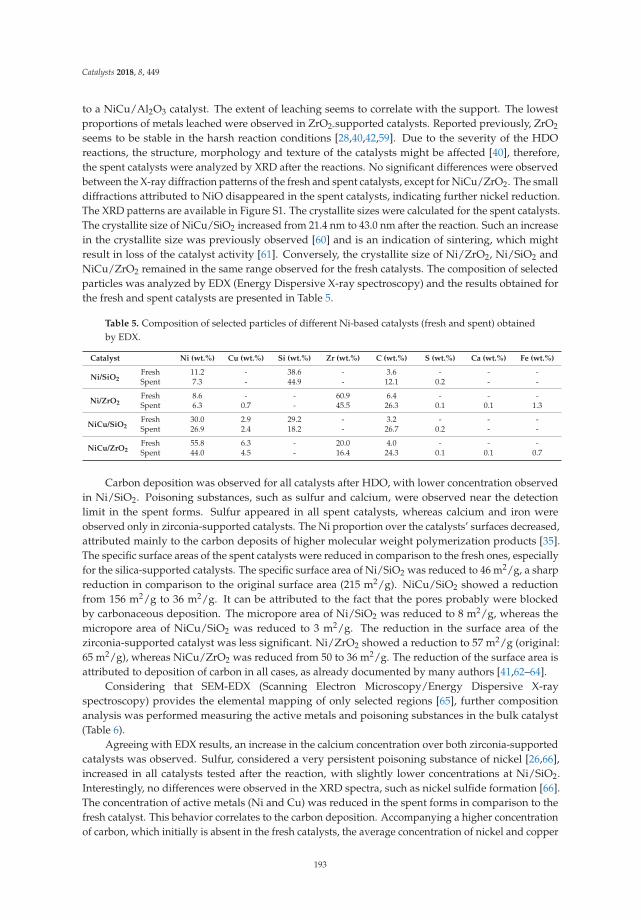
Catalysts 2018, 8, 449
to a NiCu/Al2O3 catalyst. The extent of leaching seems to correlate with the support. The lowestproportions of metals leached were observed in ZrO2-supported catalysts. Reported previously, ZrO2
seems to be stable in the harsh reaction conditions [28,40,42,59]. Due to the severity of the HDOreactions, the structure, morphology and texture of the catalysts might be affected [40], therefore,the spent catalysts were analyzed by XRD after the reactions. No significant differences were observedbetween the X-ray diffraction patterns of the fresh and spent catalysts, except for NiCu/ZrO2. The smalldiffractions attributed to NiO disappeared in the spent catalysts, indicating further nickel reduction.The XRD patterns are available in Figure S1. The crystallite sizes were calculated for the spent catalysts.The crystallite size of NiCu/SiO2 increased from 21.4 nm to 43.0 nm after the reaction. Such an increasein the crystallite size was previously observed [60] and is an indication of sintering, which mightresult in loss of the catalyst activity [61]. Conversely, the crystallite size of Ni/ZrO2, Ni/SiO2 andNiCu/ZrO2 remained in the same range observed for the fresh catalysts. The composition of selectedparticles was analyzed by EDX (Energy Dispersive X-ray spectroscopy) and the results obtained forthe fresh and spent catalysts are presented in Table 5.
Table 5. Composition of selected particles of different Ni-based catalysts (fresh and spent) obtainedby EDX.
Catalyst Ni (wt.%) Cu (wt.%) Si (wt.%) Zr (wt.%) C (wt.%) S (wt.%) Ca (wt.%) Fe (wt.%)
Ni/SiO2Fresh 11.2 - 38.6 - 3.6 - - -Spent 7.3 - 44.9 - 12.1 0.2 - -
Ni/ZrO2Fresh 8.6 - - 60.9 6.4 - - -Spent 6.3 0.7 - 45.5 26.3 0.1 0.1 1.3
NiCu/SiO2Fresh 30.0 2.9 29.2 - 3.2 - - -Spent 26.9 2.4 18.2 - 26.7 0.2 - -
NiCu/ZrO2Fresh 55.8 6.3 - 20.0 4.0 - - -Spent 44.0 4.5 - 16.4 24.3 0.1 0.1 0.7
Carbon deposition was observed for all catalysts after HDO, with lower concentration observedin Ni/SiO2. Poisoning substances, such as sulfur and calcium, were observed near the detectionlimit in the spent forms. Sulfur appeared in all spent catalysts, whereas calcium and iron wereobserved only in zirconia-supported catalysts. The Ni proportion over the catalysts’ surfaces decreased,attributed mainly to the carbon deposits of higher molecular weight polymerization products [35].The specific surface areas of the spent catalysts were reduced in comparison to the fresh ones, especiallyfor the silica-supported catalysts. The specific surface area of Ni/SiO2 was reduced to 46 m2/g, a sharpreduction in comparison to the original surface area (215 m2/g). NiCu/SiO2 showed a reductionfrom 156 m2/g to 36 m2/g. It can be attributed to the fact that the pores probably were blockedby carbonaceous deposition. The micropore area of Ni/SiO2 was reduced to 8 m2/g, whereas themicropore area of NiCu/SiO2 was reduced to 3 m2/g. The reduction in the surface area of thezirconia-supported catalyst was less significant. Ni/ZrO2 showed a reduction to 57 m2/g (original:65 m2/g), whereas NiCu/ZrO2 was reduced from 50 to 36 m2/g. The reduction of the surface area isattributed to deposition of carbon in all cases, as already documented by many authors [41,62–64].
Considering that SEM-EDX (Scanning Electron Microscopy/Energy Dispersive X-rayspectroscopy) provides the elemental mapping of only selected regions [65], further compositionanalysis was performed measuring the active metals and poisoning substances in the bulk catalyst(Table 6).
Agreeing with EDX results, an increase in the calcium concentration over both zirconia-supportedcatalysts was observed. Sulfur, considered a very persistent poisoning substance of nickel [26,66],increased in all catalysts tested after the reaction, with slightly lower concentrations at Ni/SiO2.Interestingly, no differences were observed in the XRD spectra, such as nickel sulfide formation [66].The concentration of active metals (Ni and Cu) was reduced in the spent forms in comparison to thefresh catalyst. This behavior correlates to the carbon deposition. Accompanying a higher concentrationof carbon, which initially is absent in the fresh catalysts, the average concentration of nickel and copper
193
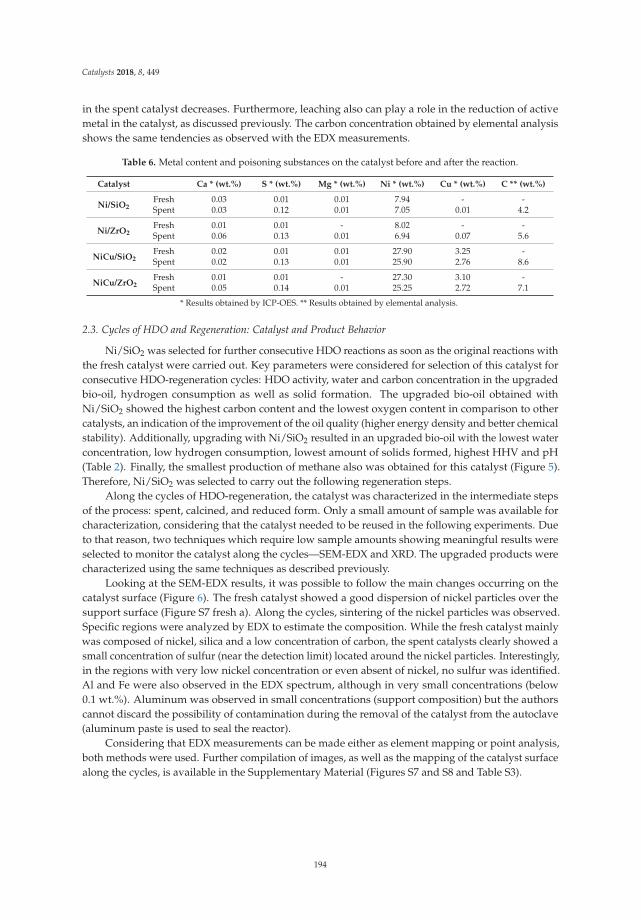
Catalysts 2018, 8, 449
in the spent catalyst decreases. Furthermore, leaching also can play a role in the reduction of activemetal in the catalyst, as discussed previously. The carbon concentration obtained by elemental analysisshows the same tendencies as observed with the EDX measurements.
Table 6. Metal content and poisoning substances on the catalyst before and after the reaction.
Catalyst Ca * (wt.%) S * (wt.%) Mg * (wt.%) Ni * (wt.%) Cu * (wt.%) C ** (wt.%)
Ni/SiO2Fresh 0.03 0.01 0.01 7.94 - -Spent 0.03 0.12 0.01 7.05 0.01 4.2
Ni/ZrO2Fresh 0.01 0.01 - 8.02 - -Spent 0.06 0.13 0.01 6.94 0.07 5.6
NiCu/SiO2Fresh 0.02 0.01 0.01 27.90 3.25 -Spent 0.02 0.13 0.01 25.90 2.76 8.6
NiCu/ZrO2Fresh 0.01 0.01 - 27.30 3.10 -Spent 0.05 0.14 0.01 25.25 2.72 7.1
* Results obtained by ICP-OES. ** Results obtained by elemental analysis.
2.3. Cycles of HDO and Regeneration: Catalyst and Product Behavior
Ni/SiO2 was selected for further consecutive HDO reactions as soon as the original reactions withthe fresh catalyst were carried out. Key parameters were considered for selection of this catalyst forconsecutive HDO-regeneration cycles: HDO activity, water and carbon concentration in the upgradedbio-oil, hydrogen consumption as well as solid formation. The upgraded bio-oil obtained withNi/SiO2 showed the highest carbon content and the lowest oxygen content in comparison to othercatalysts, an indication of the improvement of the oil quality (higher energy density and better chemicalstability). Additionally, upgrading with Ni/SiO2 resulted in an upgraded bio-oil with the lowest waterconcentration, low hydrogen consumption, lowest amount of solids formed, highest HHV and pH(Table 2). Finally, the smallest production of methane also was obtained for this catalyst (Figure 5).Therefore, Ni/SiO2 was selected to carry out the following regeneration steps.
Along the cycles of HDO-regeneration, the catalyst was characterized in the intermediate stepsof the process: spent, calcined, and reduced form. Only a small amount of sample was available forcharacterization, considering that the catalyst needed to be reused in the following experiments. Dueto that reason, two techniques which require low sample amounts showing meaningful results wereselected to monitor the catalyst along the cycles—SEM-EDX and XRD. The upgraded products werecharacterized using the same techniques as described previously.
Looking at the SEM-EDX results, it was possible to follow the main changes occurring on thecatalyst surface (Figure 6). The fresh catalyst showed a good dispersion of nickel particles over thesupport surface (Figure S7 fresh a). Along the cycles, sintering of the nickel particles was observed.Specific regions were analyzed by EDX to estimate the composition. While the fresh catalyst mainlywas composed of nickel, silica and a low concentration of carbon, the spent catalysts clearly showed asmall concentration of sulfur (near the detection limit) located around the nickel particles. Interestingly,in the regions with very low nickel concentration or even absent of nickel, no sulfur was identified.Al and Fe were also observed in the EDX spectrum, although in very small concentrations (below0.1 wt.%). Aluminum was observed in small concentrations (support composition) but the authorscannot discard the possibility of contamination during the removal of the catalyst from the autoclave(aluminum paste is used to seal the reactor).
Considering that EDX measurements can be made either as element mapping or point analysis,both methods were used. Further compilation of images, as well as the mapping of the catalyst surfacealong the cycles, is available in the Supplementary Material (Figures S7 and S8 and Table S3).
194
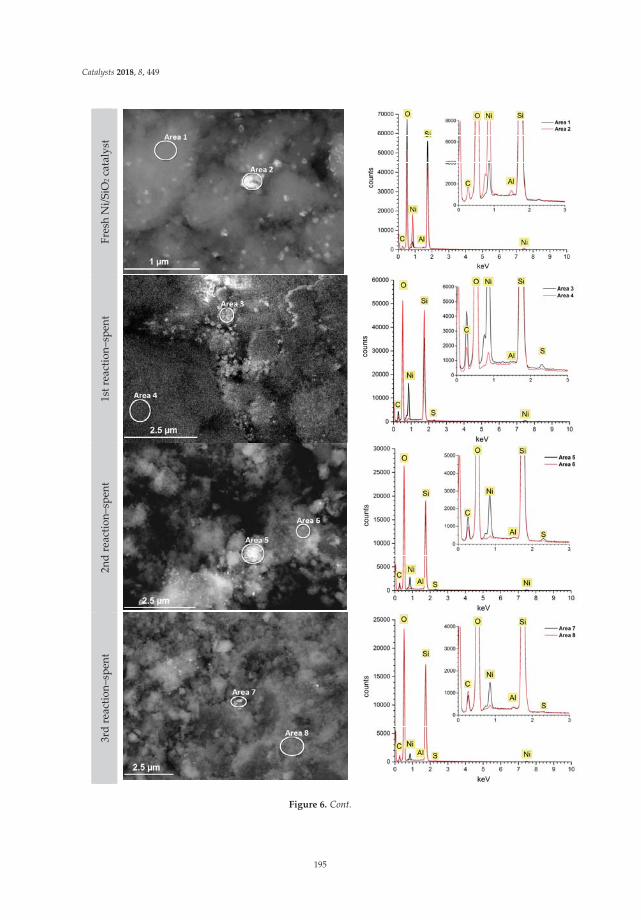
Catalysts 2018, 8, 449
Fres
h N
i/SiO
2 cat
alys
t
1st r
eact
ion–
spen
t
2nd
reac
tion–
spen
t
3rd
reac
tion–
spen
t
Figure 6. Cont.
195

Catalysts 2018, 8, 449
4th
reac
tion–
spen
t
4th
reac
tion–
calc
ined
4th
reac
tion–
redu
ced
Figure 6. SEM-EDX images and spectra of Ni/SiO2 along the consecutive cycles.
Following the fourth reaction, the catalyst was analyzed by SEM-EDX in three differentsituations—spent, after the calcination and, finally, after the reduction step. Although punctualanalyses were performed (Table 7), some trends could be observed. Regarding carbon, an expectedlower concentration was observed after the calcination step (spectrum 14–16), in comparison to thespent catalyst (spectrum 9–13). Furthermore, the sulfur remained over the reduced catalyst, mainly inthe regions with higher nickel concentration, indicating a persistent adsorption. Further structuralinvestigation along the cycles was obtained by XRD and, in this case, the catalyst was analyzed alongeach new regeneration cycle, in the spent, calcined, and reduced forms (Figure 7). Metallic Ni reflectionwas observed in the fresh, spent, and reduced catalysts along the consecutive reactions. Due to thecalcination step, reflections attributed to NiO were observed which disappeared after the reduction.Considering the low concentration of sulfur over the spent catalyst surface, reflections attributed toNi3S2 as found by other authors [26,67,68] were not observed, even after the fourth reaction.
196
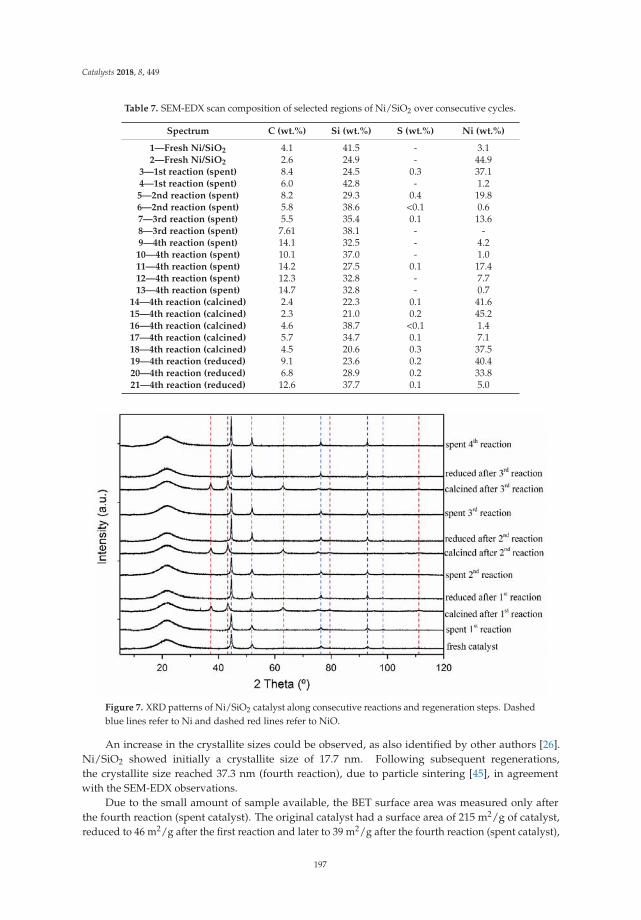
Catalysts 2018, 8, 449
Table 7. SEM-EDX scan composition of selected regions of Ni/SiO2 over consecutive cycles.
Spectrum C (wt.%) Si (wt.%) S (wt.%) Ni (wt.%)
1—Fresh Ni/SiO2 4.1 41.5 - 3.12—Fresh Ni/SiO2 2.6 24.9 - 44.9
3—1st reaction (spent) 8.4 24.5 0.3 37.14—1st reaction (spent) 6.0 42.8 - 1.25—2nd reaction (spent) 8.2 29.3 0.4 19.86—2nd reaction (spent) 5.8 38.6 <0.1 0.67—3rd reaction (spent) 5.5 35.4 0.1 13.68—3rd reaction (spent) 7.61 38.1 - -9—4th reaction (spent) 14.1 32.5 - 4.2
10—4th reaction (spent) 10.1 37.0 - 1.011—4th reaction (spent) 14.2 27.5 0.1 17.412—4th reaction (spent) 12.3 32.8 - 7.713—4th reaction (spent) 14.7 32.8 - 0.7
14—4th reaction (calcined) 2.4 22.3 0.1 41.615—4th reaction (calcined) 2.3 21.0 0.2 45.216—4th reaction (calcined) 4.6 38.7 <0.1 1.417—4th reaction (calcined) 5.7 34.7 0.1 7.118—4th reaction (calcined) 4.5 20.6 0.3 37.519—4th reaction (reduced) 9.1 23.6 0.2 40.420—4th reaction (reduced) 6.8 28.9 0.2 33.821—4th reaction (reduced) 12.6 37.7 0.1 5.0
Figure 7. XRD patterns of Ni/SiO2 catalyst along consecutive reactions and regeneration steps. Dashedblue lines refer to Ni and dashed red lines refer to NiO.
An increase in the crystallite sizes could be observed, as also identified by other authors [26].Ni/SiO2 showed initially a crystallite size of 17.7 nm. Following subsequent regenerations,the crystallite size reached 37.3 nm (fourth reaction), due to particle sintering [45], in agreementwith the SEM-EDX observations.
Due to the small amount of sample available, the BET surface area was measured only afterthe fourth reaction (spent catalyst). The original catalyst had a surface area of 215 m2/g of catalyst,reduced to 46 m2/g after the first reaction and later to 39 m2/g after the fourth reaction (spent catalyst),
197
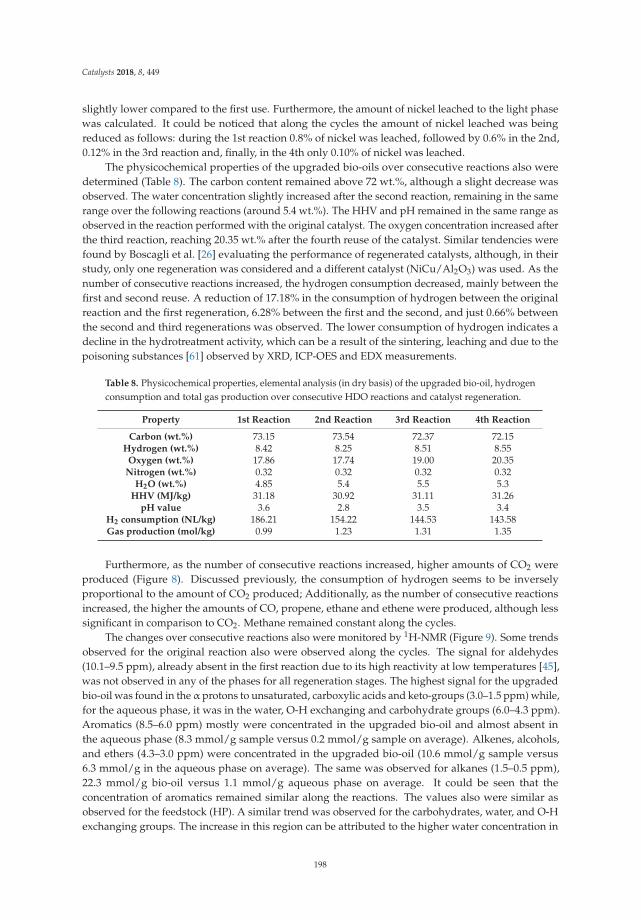
Catalysts 2018, 8, 449
slightly lower compared to the first use. Furthermore, the amount of nickel leached to the light phasewas calculated. It could be noticed that along the cycles the amount of nickel leached was beingreduced as follows: during the 1st reaction 0.8% of nickel was leached, followed by 0.6% in the 2nd,0.12% in the 3rd reaction and, finally, in the 4th only 0.10% of nickel was leached.
The physicochemical properties of the upgraded bio-oils over consecutive reactions also weredetermined (Table 8). The carbon content remained above 72 wt.%, although a slight decrease wasobserved. The water concentration slightly increased after the second reaction, remaining in the samerange over the following reactions (around 5.4 wt.%). The HHV and pH remained in the same range asobserved in the reaction performed with the original catalyst. The oxygen concentration increased afterthe third reaction, reaching 20.35 wt.% after the fourth reuse of the catalyst. Similar tendencies werefound by Boscagli et al. [26] evaluating the performance of regenerated catalysts, although, in theirstudy, only one regeneration was considered and a different catalyst (NiCu/Al2O3) was used. As thenumber of consecutive reactions increased, the hydrogen consumption decreased, mainly between thefirst and second reuse. A reduction of 17.18% in the consumption of hydrogen between the originalreaction and the first regeneration, 6.28% between the first and the second, and just 0.66% betweenthe second and third regenerations was observed. The lower consumption of hydrogen indicates adecline in the hydrotreatment activity, which can be a result of the sintering, leaching and due to thepoisoning substances [61] observed by XRD, ICP-OES and EDX measurements.
Table 8. Physicochemical properties, elemental analysis (in dry basis) of the upgraded bio-oil, hydrogenconsumption and total gas production over consecutive HDO reactions and catalyst regeneration.
Property 1st Reaction 2nd Reaction 3rd Reaction 4th Reaction
Carbon (wt.%) 73.15 73.54 72.37 72.15Hydrogen (wt.%) 8.42 8.25 8.51 8.55
Oxygen (wt.%) 17.86 17.74 19.00 20.35Nitrogen (wt.%) 0.32 0.32 0.32 0.32
H2O (wt.%) 4.85 5.4 5.5 5.3HHV (MJ/kg) 31.18 30.92 31.11 31.26
pH value 3.6 2.8 3.5 3.4H2 consumption (NL/kg) 186.21 154.22 144.53 143.58Gas production (mol/kg) 0.99 1.23 1.31 1.35
Furthermore, as the number of consecutive reactions increased, higher amounts of CO2 wereproduced (Figure 8). Discussed previously, the consumption of hydrogen seems to be inverselyproportional to the amount of CO2 produced; Additionally, as the number of consecutive reactionsincreased, the higher the amounts of CO, propene, ethane and ethene were produced, although lesssignificant in comparison to CO2. Methane remained constant along the cycles.
The changes over consecutive reactions also were monitored by 1H-NMR (Figure 9). Some trendsobserved for the original reaction also were observed along the cycles. The signal for aldehydes(10.1–9.5 ppm), already absent in the first reaction due to its high reactivity at low temperatures [45],was not observed in any of the phases for all regeneration stages. The highest signal for the upgradedbio-oil was found in the α protons to unsaturated, carboxylic acids and keto-groups (3.0–1.5 ppm) while,for the aqueous phase, it was in the water, O-H exchanging and carbohydrate groups (6.0–4.3 ppm).Aromatics (8.5–6.0 ppm) mostly were concentrated in the upgraded bio-oil and almost absent inthe aqueous phase (8.3 mmol/g sample versus 0.2 mmol/g sample on average). Alkenes, alcohols,and ethers (4.3–3.0 ppm) were concentrated in the upgraded bio-oil (10.6 mmol/g sample versus6.3 mmol/g in the aqueous phase on average). The same was observed for alkanes (1.5–0.5 ppm),22.3 mmol/g bio-oil versus 1.1 mmol/g aqueous phase on average. It could be seen that theconcentration of aromatics remained similar along the reactions. The values also were similar asobserved for the feedstock (HP). A similar trend was observed for the carbohydrates, water, and O-Hexchanging groups. The increase in this region can be attributed to the higher water concentration in
198
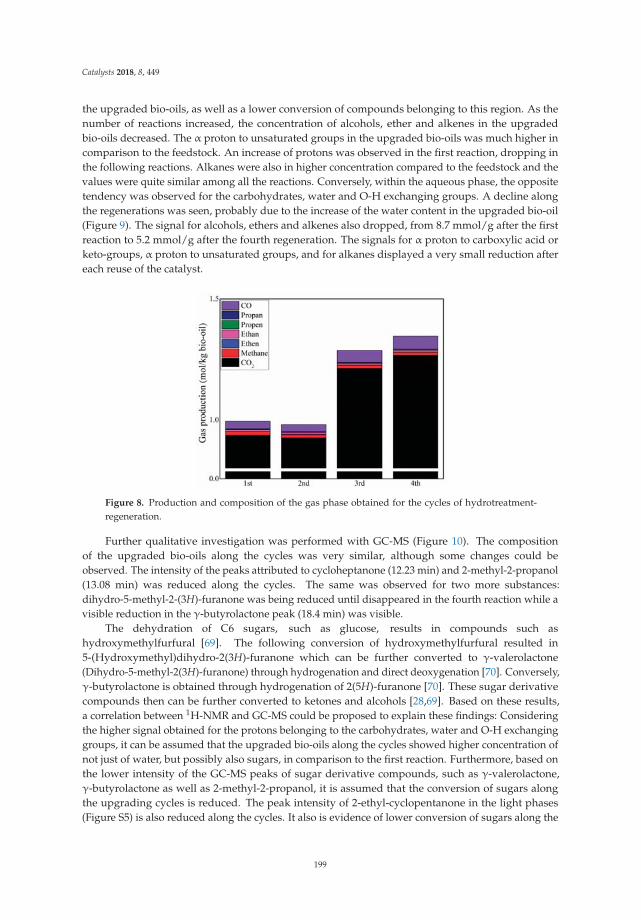
Catalysts 2018, 8, 449
the upgraded bio-oils, as well as a lower conversion of compounds belonging to this region. As thenumber of reactions increased, the concentration of alcohols, ether and alkenes in the upgradedbio-oils decreased. The α proton to unsaturated groups in the upgraded bio-oils was much higher incomparison to the feedstock. An increase of protons was observed in the first reaction, dropping inthe following reactions. Alkanes were also in higher concentration compared to the feedstock and thevalues were quite similar among all the reactions. Conversely, within the aqueous phase, the oppositetendency was observed for the carbohydrates, water and O-H exchanging groups. A decline alongthe regenerations was seen, probably due to the increase of the water content in the upgraded bio-oil(Figure 9). The signal for alcohols, ethers and alkenes also dropped, from 8.7 mmol/g after the firstreaction to 5.2 mmol/g after the fourth regeneration. The signals for α proton to carboxylic acid orketo-groups, α proton to unsaturated groups, and for alkanes displayed a very small reduction aftereach reuse of the catalyst.
Figure 8. Production and composition of the gas phase obtained for the cycles of hydrotreatment-regeneration.
Further qualitative investigation was performed with GC-MS (Figure 10). The compositionof the upgraded bio-oils along the cycles was very similar, although some changes could beobserved. The intensity of the peaks attributed to cycloheptanone (12.23 min) and 2-methyl-2-propanol(13.08 min) was reduced along the cycles. The same was observed for two more substances:dihydro-5-methyl-2-(3H)-furanone was being reduced until disappeared in the fourth reaction while avisible reduction in the γ-butyrolactone peak (18.4 min) was visible.
The dehydration of C6 sugars, such as glucose, results in compounds such ashydroxymethylfurfural [69]. The following conversion of hydroxymethylfurfural resulted in5-(Hydroxymethyl)dihydro-2(3H)-furanone which can be further converted to γ-valerolactone(Dihydro-5-methyl-2(3H)-furanone) through hydrogenation and direct deoxygenation [70]. Conversely,γ-butyrolactone is obtained through hydrogenation of 2(5H)-furanone [70]. These sugar derivativecompounds then can be further converted to ketones and alcohols [28,69]. Based on these results,a correlation between 1H-NMR and GC-MS could be proposed to explain these findings: Consideringthe higher signal obtained for the protons belonging to the carbohydrates, water and O-H exchanginggroups, it can be assumed that the upgraded bio-oils along the cycles showed higher concentration ofnot just of water, but possibly also sugars, in comparison to the first reaction. Furthermore, based onthe lower intensity of the GC-MS peaks of sugar derivative compounds, such as γ-valerolactone,γ-butyrolactone as well as 2-methyl-2-propanol, it is assumed that the conversion of sugars alongthe upgrading cycles is reduced. The peak intensity of 2-ethyl-cyclopentanone in the light phases(Figure S5) is also reduced along the cycles. It also is evidence of lower conversion of sugars along the
199
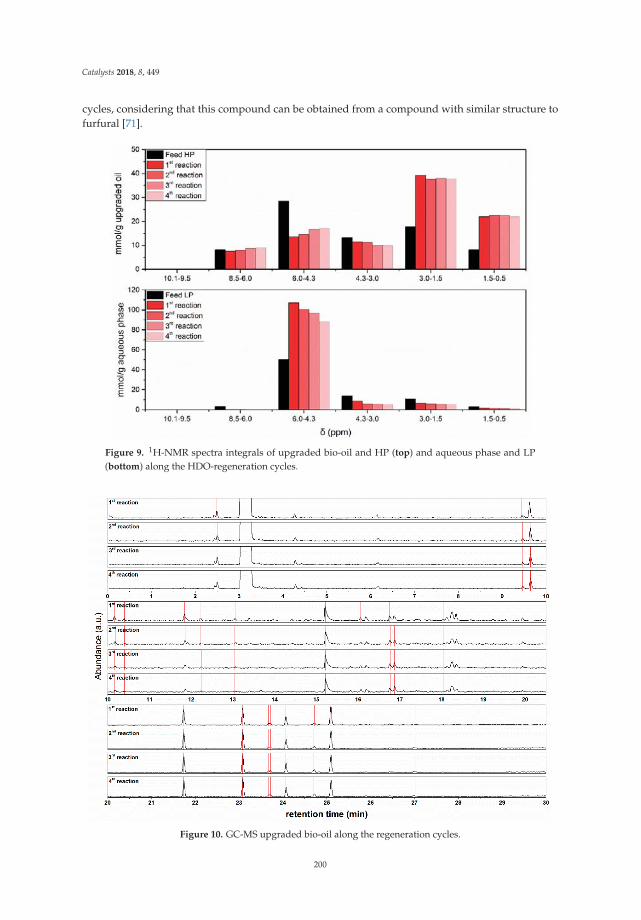
Catalysts 2018, 8, 449
cycles, considering that this compound can be obtained from a compound with similar structure tofurfural [71].
Figure 9. 1H-NMR spectra integrals of upgraded bio-oil and HP (top) and aqueous phase and LP(bottom) along the HDO-regeneration cycles.
Figure 10. GC-MS upgraded bio-oil along the regeneration cycles.
200
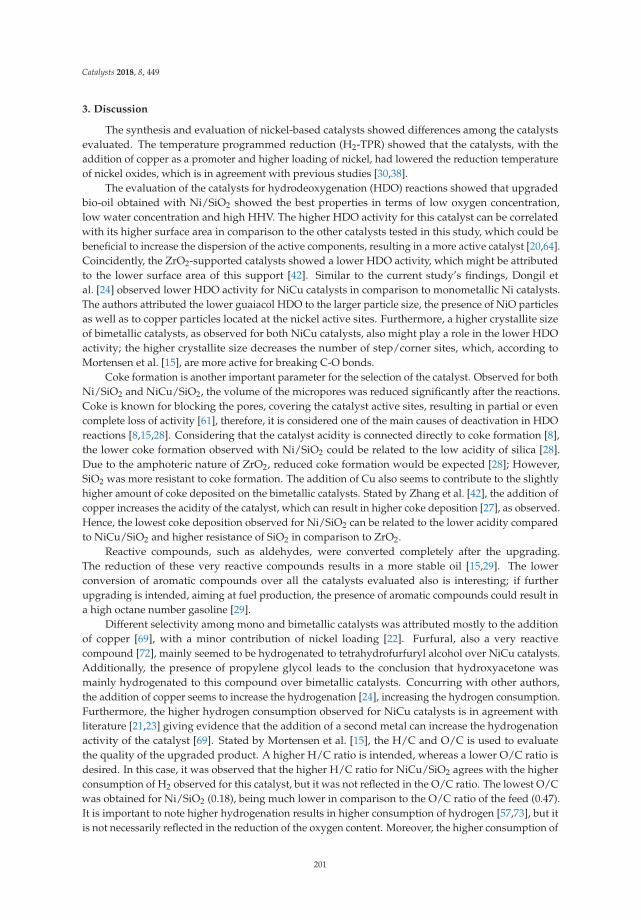
Catalysts 2018, 8, 449
3. Discussion
The synthesis and evaluation of nickel-based catalysts showed differences among the catalystsevaluated. The temperature programmed reduction (H2-TPR) showed that the catalysts, with theaddition of copper as a promoter and higher loading of nickel, had lowered the reduction temperatureof nickel oxides, which is in agreement with previous studies [30,38].
The evaluation of the catalysts for hydrodeoxygenation (HDO) reactions showed that upgradedbio-oil obtained with Ni/SiO2 showed the best properties in terms of low oxygen concentration,low water concentration and high HHV. The higher HDO activity for this catalyst can be correlatedwith its higher surface area in comparison to the other catalysts tested in this study, which could bebeneficial to increase the dispersion of the active components, resulting in a more active catalyst [20,64].Coincidently, the ZrO2-supported catalysts showed a lower HDO activity, which might be attributedto the lower surface area of this support [42]. Similar to the current study’s findings, Dongil etal. [24] observed lower HDO activity for NiCu catalysts in comparison to monometallic Ni catalysts.The authors attributed the lower guaiacol HDO to the larger particle size, the presence of NiO particlesas well as to copper particles located at the nickel active sites. Furthermore, a higher crystallite sizeof bimetallic catalysts, as observed for both NiCu catalysts, also might play a role in the lower HDOactivity; the higher crystallite size decreases the number of step/corner sites, which, according toMortensen et al. [15], are more active for breaking C-O bonds.
Coke formation is another important parameter for the selection of the catalyst. Observed for bothNi/SiO2 and NiCu/SiO2, the volume of the micropores was reduced significantly after the reactions.Coke is known for blocking the pores, covering the catalyst active sites, resulting in partial or evencomplete loss of activity [61], therefore, it is considered one of the main causes of deactivation in HDOreactions [8,15,28]. Considering that the catalyst acidity is connected directly to coke formation [8],the lower coke formation observed with Ni/SiO2 could be related to the low acidity of silica [28].Due to the amphoteric nature of ZrO2, reduced coke formation would be expected [28]; However,SiO2 was more resistant to coke formation. The addition of Cu also seems to contribute to the slightlyhigher amount of coke deposited on the bimetallic catalysts. Stated by Zhang et al. [42], the addition ofcopper increases the acidity of the catalyst, which can result in higher coke deposition [27], as observed.Hence, the lowest coke deposition observed for Ni/SiO2 can be related to the lower acidity comparedto NiCu/SiO2 and higher resistance of SiO2 in comparison to ZrO2.
Reactive compounds, such as aldehydes, were converted completely after the upgrading.The reduction of these very reactive compounds results in a more stable oil [15,29]. The lowerconversion of aromatic compounds over all the catalysts evaluated also is interesting; if furtherupgrading is intended, aiming at fuel production, the presence of aromatic compounds could result ina high octane number gasoline [29].
Different selectivity among mono and bimetallic catalysts was attributed mostly to the additionof copper [69], with a minor contribution of nickel loading [22]. Furfural, also a very reactivecompound [72], mainly seemed to be hydrogenated to tetrahydrofurfuryl alcohol over NiCu catalysts.Additionally, the presence of propylene glycol leads to the conclusion that hydroxyacetone wasmainly hydrogenated to this compound over bimetallic catalysts. Concurring with other authors,the addition of copper seems to increase the hydrogenation [24], increasing the hydrogen consumption.Furthermore, the higher hydrogen consumption observed for NiCu catalysts is in agreement withliterature [21,23] giving evidence that the addition of a second metal can increase the hydrogenationactivity of the catalyst [69]. Stated by Mortensen et al. [15], the H/C and O/C is used to evaluatethe quality of the upgraded product. A higher H/C ratio is intended, whereas a lower O/C ratio isdesired. In this case, it was observed that the higher H/C ratio for NiCu/SiO2 agrees with the higherconsumption of H2 observed for this catalyst, but it was not reflected in the O/C ratio. The lowest O/Cwas obtained for Ni/SiO2 (0.18), being much lower in comparison to the O/C ratio of the feed (0.47).It is important to note higher hydrogenation results in higher consumption of hydrogen [57,73], but itis not necessarily reflected in the reduction of the oxygen content. Moreover, the higher consumption of
201
Catalysts 2018, 8, 449
hydrogen can also result in higher methane formation [35], considering that during the hydrocrackingthe consumption of hydrogen is higher compared to hydrotreating [74]. This behavior was observed forNiCu/SiO2. The catalyst showed not just the higher hydrogen consumption, but also a higher methaneformation. The desired catalyst should be able to remove the larger amount of oxygen with minimalhydrogen consumption [24] as hydrogen consumption, bio-oil yield and catalyst deactivation areamong the most important parameters to be considered in the HDO process [75]. Ni/SiO2, therefore,was considered the more appropriate catalyst in terms of H2 consumption and HDO activity.
After the reaction, compounds such as calcium (only over ZrO2) and sulfur were observedon the spent catalysts by two different analytical techniques, Inductively Coupled PlasmaEmission Spectroscopy (ICP-OES) and Scanning Electron Microscopy/Energy Dispersive X-rayspectroscopy (SEM-EDX). Calcium, observed in higher concentrations in comparison to sulfur overthe zirconia-supported catalysts, on the one hand acts as a poisoning agent, reducing the mobility andre-dispersion of the active metal centers over the support and, on the other hand, can reduce sintering,due to the reduction in the atom mobility, resistance to dissociation and migration [61].
Despite the detection of sulfur on the catalyst’s surface, structural changes were not observed afterthe reactions by Powder XRD, as observed in previous investigations. Mortensen et al. [66] observeda reflection at approximately 2θ = 45.2◦, attributed to NiS during the evaluation of the influence ofsulfur over the conversion of guaiacol with Ni/ZrO2. Boscagli et al. [26] observed the formation ofNi3S2, which was persistent to regeneration and changed the catalyst structure. The concentration ofsulfur in the feed, in this case, varies significantly in both works. While Mortensen et al. used a modelmixture containing 0.05 wt.% of sulfur, Boscagli et al. used feedstocks with a higher concentration ofsulfur (light bio-oil phase with 0.05 wt.% of sulfur and straw bio-oil obtained at 450 ◦C with 0.3 wt.% ofsulfur). The high concentration of sulfur resulted in a spent catalyst with a much higher concentrationof sulfur on the catalyst (0.6–2.0 wt.%, SEM-EDX), in comparison to the current study’s findings(feed sulfur concentration = 0.012 wt.% and spent catalysts ≤0.1–0.4 wt.%, SEM-EDX). Even withoutstructural changes, sulfur is one of the most persistent poisons for nickel catalysts. It is irreversiblychemisorbed and responsible for blocking the reaction-adsorption active site, modifying electronicallythe neighbor atom of metals and, thereby, reducing the ability to adsorb and dissociate H2, at the sametime influencing the diffusion or reactants, blocking their contact with the active site [61].
Along with the consecutive reactions with Ni/SiO2, comparable carbon and hydrogenconcentrations and a slightly higher oxygen concentration was observed in the upgraded bio-oils.The oxygen concentration reached20.34 wt.% after the fourth reaction. It was higher compared to thefirst reaction (17.86 wt.%) but still much lower compared to the feed (35.84 wt.%, dry basis). It givesevidence of a low rate of deactivation and the possibility to reuse the catalyst. The increase in theoxygen concentration can be correlated with the reduction in the H2 uptake, in agreement with lowerHDO activity of Ni/SiO2 in comparison to the fresh catalyst [76]. The current authors assumed that thereduced activity can be correlated mainly to sintering, poisoning and coke deposition (although easilyremoved during the calcination step), as the leaching was negligible. The crystallite size increased overthe cycles in the same proportion that the HDO activity was reduced along the consecutive reactions.The fresh catalyst showed a crystallite size of 17.7 nm, reaching 37.3 nm after the fourth reuse. Thus,the number of active surfaces available were reduced with the increase of the crystallite size [61].Furthermore, the lower H2 uptake can also result in a higher amount of CO2 formation, as observedalong the cycles, considering the higher the hydrogen uptake, the lower the CO2 production [46].Curiously, the sulfur concentration remained approximately constant along the cycles. Furthermore,no differences were observed in the XRD diffractions. The current authors concluded that sulfur wasstrongly adsorbed on the catalyst, affecting surface-sensitive reactions, resulting only in partial loss ofactivity of the catalytic surface [61].
The results obtained by 1H-NMR showed that the concentration of protons in the region relatedto water and carbohydrates increased along the cycles in the upgraded bio-oils. Moreover, the gaschromatography-mass spectrometer (GC-MS), showed that the peak of some sugar derivatives became
202
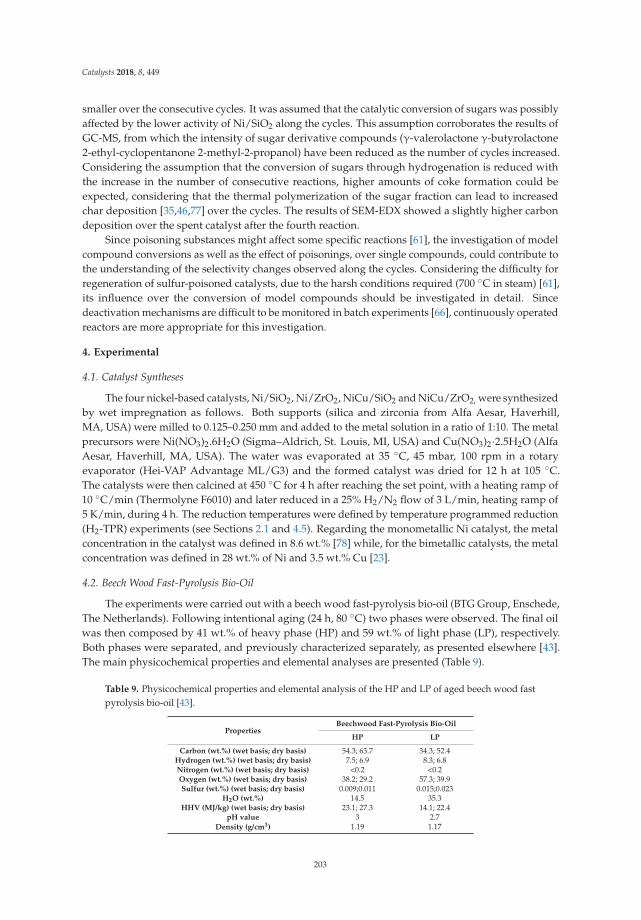
Catalysts 2018, 8, 449
smaller over the consecutive cycles. It was assumed that the catalytic conversion of sugars was possiblyaffected by the lower activity of Ni/SiO2 along the cycles. This assumption corroborates the results ofGC-MS, from which the intensity of sugar derivative compounds (γ-valerolactone γ-butyrolactone2-ethyl-cyclopentanone 2-methyl-2-propanol) have been reduced as the number of cycles increased.Considering the assumption that the conversion of sugars through hydrogenation is reduced withthe increase in the number of consecutive reactions, higher amounts of coke formation could beexpected, considering that the thermal polymerization of the sugar fraction can lead to increasedchar deposition [35,46,77] over the cycles. The results of SEM-EDX showed a slightly higher carbondeposition over the spent catalyst after the fourth reaction.
Since poisoning substances might affect some specific reactions [61], the investigation of modelcompound conversions as well as the effect of poisonings, over single compounds, could contribute tothe understanding of the selectivity changes observed along the cycles. Considering the difficulty forregeneration of sulfur-poisoned catalysts, due to the harsh conditions required (700 ◦C in steam) [61],its influence over the conversion of model compounds should be investigated in detail. Sincedeactivation mechanisms are difficult to be monitored in batch experiments [66], continuously operatedreactors are more appropriate for this investigation.
4. Experimental
4.1. Catalyst Syntheses
The four nickel-based catalysts, Ni/SiO2, Ni/ZrO2, NiCu/SiO2 and NiCu/ZrO2, were synthesizedby wet impregnation as follows. Both supports (silica and zirconia from Alfa Aesar, Haverhill,MA, USA) were milled to 0.125–0.250 mm and added to the metal solution in a ratio of 1:10. The metalprecursors were Ni(NO3)2.6H2O (Sigma–Aldrich, St. Louis, MI, USA) and Cu(NO3)2·2.5H2O (AlfaAesar, Haverhill, MA, USA). The water was evaporated at 35 ◦C, 45 mbar, 100 rpm in a rotaryevaporator (Hei-VAP Advantage ML/G3) and the formed catalyst was dried for 12 h at 105 ◦C.The catalysts were then calcined at 450 ◦C for 4 h after reaching the set point, with a heating ramp of10 ◦C/min (Thermolyne F6010) and later reduced in a 25% H2/N2 flow of 3 L/min, heating ramp of5 K/min, during 4 h. The reduction temperatures were defined by temperature programmed reduction(H2-TPR) experiments (see Sections 2.1 and 4.5). Regarding the monometallic Ni catalyst, the metalconcentration in the catalyst was defined in 8.6 wt.% [78] while, for the bimetallic catalysts, the metalconcentration was defined in 28 wt.% of Ni and 3.5 wt.% Cu [23].
4.2. Beech Wood Fast-Pyrolysis Bio-Oil
The experiments were carried out with a beech wood fast-pyrolysis bio-oil (BTG Group, Enschede,The Netherlands). Following intentional aging (24 h, 80 ◦C) two phases were observed. The final oilwas then composed by 41 wt.% of heavy phase (HP) and 59 wt.% of light phase (LP), respectively.Both phases were separated, and previously characterized separately, as presented elsewhere [43].The main physicochemical properties and elemental analyses are presented (Table 9).
Table 9. Physicochemical properties and elemental analysis of the HP and LP of aged beech wood fastpyrolysis bio-oil [43].
PropertiesBeechwood Fast-Pyrolysis Bio-Oil
HP LP
Carbon (wt.%) (wet basis; dry basis) 54.3; 63.7 34.3; 52.4Hydrogen (wt.%) (wet basis; dry basis) 7.5; 6.9 8.3; 6.8Nitrogen (wt.%) (wet basis; dry basis) <0.2 <0.2Oxygen (wt.%) (wet basis; dry basis) 38.2; 29.2 57.3; 39.9Sulfur (wt.%) (wet basis; dry basis) 0.009;0.011 0.015;0.023
H2O (wt.%) 14.5 35.3HHV (MJ/kg) (wet basis; dry basis) 23.1; 27.3 14.1; 22.4
pH value 3 2.7Density (g/cm3) 1.19 1.17
203
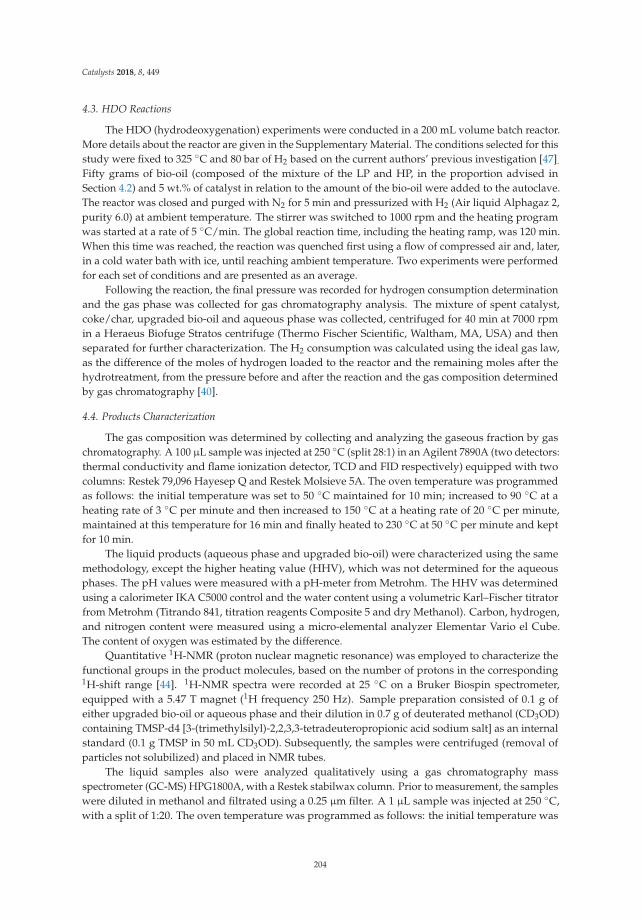
Catalysts 2018, 8, 449
4.3. HDO Reactions
The HDO (hydrodeoxygenation) experiments were conducted in a 200 mL volume batch reactor.More details about the reactor are given in the Supplementary Material. The conditions selected for thisstudy were fixed to 325 ◦C and 80 bar of H2 based on the current authors’ previous investigation [47].
Fifty grams of bio-oil (composed of the mixture of the LP and HP, in the proportion advised inSection 4.2) and 5 wt.% of catalyst in relation to the amount of the bio-oil were added to the autoclave.The reactor was closed and purged with N2 for 5 min and pressurized with H2 (Air liquid Alphagaz 2,purity 6.0) at ambient temperature. The stirrer was switched to 1000 rpm and the heating programwas started at a rate of 5 ◦C/min. The global reaction time, including the heating ramp, was 120 min.When this time was reached, the reaction was quenched first using a flow of compressed air and, later,in a cold water bath with ice, until reaching ambient temperature. Two experiments were performedfor each set of conditions and are presented as an average.
Following the reaction, the final pressure was recorded for hydrogen consumption determinationand the gas phase was collected for gas chromatography analysis. The mixture of spent catalyst,coke/char, upgraded bio-oil and aqueous phase was collected, centrifuged for 40 min at 7000 rpmin a Heraeus Biofuge Stratos centrifuge (Thermo Fischer Scientific, Waltham, MA, USA) and thenseparated for further characterization. The H2 consumption was calculated using the ideal gas law,as the difference of the moles of hydrogen loaded to the reactor and the remaining moles after thehydrotreatment, from the pressure before and after the reaction and the gas composition determinedby gas chromatography [40].
4.4. Products Characterization
The gas composition was determined by collecting and analyzing the gaseous fraction by gaschromatography. A 100 μL sample was injected at 250 ◦C (split 28:1) in an Agilent 7890A (two detectors:thermal conductivity and flame ionization detector, TCD and FID respectively) equipped with twocolumns: Restek 79,096 Hayesep Q and Restek Molsieve 5A. The oven temperature was programmedas follows: the initial temperature was set to 50 ◦C maintained for 10 min; increased to 90 ◦C at aheating rate of 3 ◦C per minute and then increased to 150 ◦C at a heating rate of 20 ◦C per minute,maintained at this temperature for 16 min and finally heated to 230 ◦C at 50 ◦C per minute and keptfor 10 min.
The liquid products (aqueous phase and upgraded bio-oil) were characterized using the samemethodology, except the higher heating value (HHV), which was not determined for the aqueousphases. The pH values were measured with a pH-meter from Metrohm. The HHV was determinedusing a calorimeter IKA C5000 control and the water content using a volumetric Karl–Fischer titratorfrom Metrohm (Titrando 841, titration reagents Composite 5 and dry Methanol). Carbon, hydrogen,and nitrogen content were measured using a micro-elemental analyzer Elementar Vario el Cube.The content of oxygen was estimated by the difference.
Quantitative 1H-NMR (proton nuclear magnetic resonance) was employed to characterize thefunctional groups in the product molecules, based on the number of protons in the corresponding1H-shift range [44]. 1H-NMR spectra were recorded at 25 ◦C on a Bruker Biospin spectrometer,equipped with a 5.47 T magnet (1H frequency 250 Hz). Sample preparation consisted of 0.1 g ofeither upgraded bio-oil or aqueous phase and their dilution in 0.7 g of deuterated methanol (CD3OD)containing TMSP-d4 [3-(trimethylsilyl)-2,2,3,3-tetradeuteropropionic acid sodium salt] as an internalstandard (0.1 g TMSP in 50 mL CD3OD). Subsequently, the samples were centrifuged (removal ofparticles not solubilized) and placed in NMR tubes.
The liquid samples also were analyzed qualitatively using a gas chromatography massspectrometer (GC-MS) HPG1800A, with a Restek stabilwax column. Prior to measurement, the sampleswere diluted in methanol and filtrated using a 0.25 μm filter. A 1 μL sample was injected at 250 ◦C,with a split of 1:20. The oven temperature was programmed as follows: the initial temperature was
204
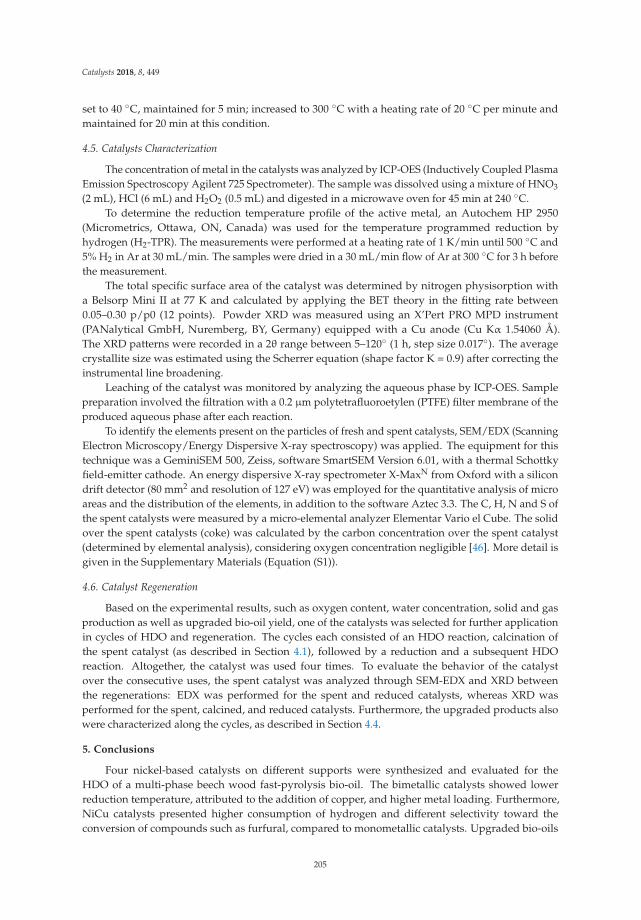
Catalysts 2018, 8, 449
set to 40 ◦C, maintained for 5 min; increased to 300 ◦C with a heating rate of 20 ◦C per minute andmaintained for 20 min at this condition.
4.5. Catalysts Characterization
The concentration of metal in the catalysts was analyzed by ICP-OES (Inductively Coupled PlasmaEmission Spectroscopy Agilent 725 Spectrometer). The sample was dissolved using a mixture of HNO3
(2 mL), HCl (6 mL) and H2O2 (0.5 mL) and digested in a microwave oven for 45 min at 240 ◦C.To determine the reduction temperature profile of the active metal, an Autochem HP 2950
(Micrometrics, Ottawa, ON, Canada) was used for the temperature programmed reduction byhydrogen (H2-TPR). The measurements were performed at a heating rate of 1 K/min until 500 ◦C and5% H2 in Ar at 30 mL/min. The samples were dried in a 30 mL/min flow of Ar at 300 ◦C for 3 h beforethe measurement.
The total specific surface area of the catalyst was determined by nitrogen physisorption witha Belsorp Mini II at 77 K and calculated by applying the BET theory in the fitting rate between0.05–0.30 p/p0 (12 points). Powder XRD was measured using an X’Pert PRO MPD instrument(PANalytical GmbH, Nuremberg, BY, Germany) equipped with a Cu anode (Cu Kα 1.54060 Å).The XRD patterns were recorded in a 2θ range between 5–120◦ (1 h, step size 0.017◦). The averagecrystallite size was estimated using the Scherrer equation (shape factor K = 0.9) after correcting theinstrumental line broadening.
Leaching of the catalyst was monitored by analyzing the aqueous phase by ICP-OES. Samplepreparation involved the filtration with a 0.2 μm polytetrafluoroetylen (PTFE) filter membrane of theproduced aqueous phase after each reaction.
To identify the elements present on the particles of fresh and spent catalysts, SEM/EDX (ScanningElectron Microscopy/Energy Dispersive X-ray spectroscopy) was applied. The equipment for thistechnique was a GeminiSEM 500, Zeiss, software SmartSEM Version 6.01, with a thermal Schottkyfield-emitter cathode. An energy dispersive X-ray spectrometer X-MaxN from Oxford with a silicondrift detector (80 mm2 and resolution of 127 eV) was employed for the quantitative analysis of microareas and the distribution of the elements, in addition to the software Aztec 3.3. The C, H, N and S ofthe spent catalysts were measured by a micro-elemental analyzer Elementar Vario el Cube. The solidover the spent catalysts (coke) was calculated by the carbon concentration over the spent catalyst(determined by elemental analysis), considering oxygen concentration negligible [46]. More detail isgiven in the Supplementary Materials (Equation (S1)).
4.6. Catalyst Regeneration
Based on the experimental results, such as oxygen content, water concentration, solid and gasproduction as well as upgraded bio-oil yield, one of the catalysts was selected for further applicationin cycles of HDO and regeneration. The cycles each consisted of an HDO reaction, calcination ofthe spent catalyst (as described in Section 4.1), followed by a reduction and a subsequent HDOreaction. Altogether, the catalyst was used four times. To evaluate the behavior of the catalystover the consecutive uses, the spent catalyst was analyzed through SEM-EDX and XRD betweenthe regenerations: EDX was performed for the spent and reduced catalysts, whereas XRD wasperformed for the spent, calcined, and reduced catalysts. Furthermore, the upgraded products alsowere characterized along the cycles, as described in Section 4.4.
5. Conclusions
Four nickel-based catalysts on different supports were synthesized and evaluated for theHDO of a multi-phase beech wood fast-pyrolysis bio-oil. The bimetallic catalysts showed lowerreduction temperature, attributed to the addition of copper, and higher metal loading. Furthermore,NiCu catalysts presented higher consumption of hydrogen and different selectivity toward theconversion of compounds such as furfural, compared to monometallic catalysts. Upgraded bio-oils
205
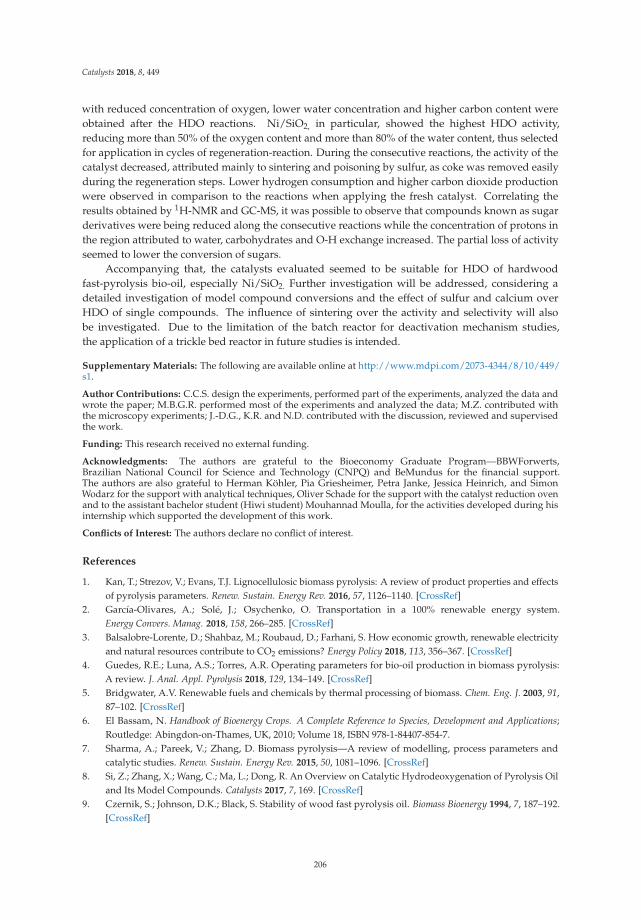
Catalysts 2018, 8, 449
with reduced concentration of oxygen, lower water concentration and higher carbon content wereobtained after the HDO reactions. Ni/SiO2, in particular, showed the highest HDO activity,reducing more than 50% of the oxygen content and more than 80% of the water content, thus selectedfor application in cycles of regeneration-reaction. During the consecutive reactions, the activity of thecatalyst decreased, attributed mainly to sintering and poisoning by sulfur, as coke was removed easilyduring the regeneration steps. Lower hydrogen consumption and higher carbon dioxide productionwere observed in comparison to the reactions when applying the fresh catalyst. Correlating theresults obtained by 1H-NMR and GC-MS, it was possible to observe that compounds known as sugarderivatives were being reduced along the consecutive reactions while the concentration of protons inthe region attributed to water, carbohydrates and O-H exchange increased. The partial loss of activityseemed to lower the conversion of sugars.
Accompanying that, the catalysts evaluated seemed to be suitable for HDO of hardwoodfast-pyrolysis bio-oil, especially Ni/SiO2. Further investigation will be addressed, considering adetailed investigation of model compound conversions and the effect of sulfur and calcium overHDO of single compounds. The influence of sintering over the activity and selectivity will alsobe investigated. Due to the limitation of the batch reactor for deactivation mechanism studies,the application of a trickle bed reactor in future studies is intended.
Supplementary Materials: The following are available online at http://www.mdpi.com/2073-4344/8/10/449/s1.
Author Contributions: C.C.S. design the experiments, performed part of the experiments, analyzed the data andwrote the paper; M.B.G.R. performed most of the experiments and analyzed the data; M.Z. contributed withthe microscopy experiments; J.-D.G., K.R. and N.D. contributed with the discussion, reviewed and supervisedthe work.
Funding: This research received no external funding.
Acknowledgments: The authors are grateful to the Bioeconomy Graduate Program—BBWForwerts,Brazilian National Council for Science and Technology (CNPQ) and BeMundus for the financial support.The authors are also grateful to Herman Köhler, Pia Griesheimer, Petra Janke, Jessica Heinrich, and SimonWodarz for the support with analytical techniques, Oliver Schade for the support with the catalyst reduction ovenand to the assistant bachelor student (Hiwi student) Mouhannad Moulla, for the activities developed during hisinternship which supported the development of this work.
Conflicts of Interest: The authors declare no conflict of interest.
References
1. Kan, T.; Strezov, V.; Evans, T.J. Lignocellulosic biomass pyrolysis: A review of product properties and effectsof pyrolysis parameters. Renew. Sustain. Energy Rev. 2016, 57, 1126–1140. [CrossRef]
2. García-Olivares, A.; Solé, J.; Osychenko, O. Transportation in a 100% renewable energy system.Energy Convers. Manag. 2018, 158, 266–285. [CrossRef]
3. Balsalobre-Lorente, D.; Shahbaz, M.; Roubaud, D.; Farhani, S. How economic growth, renewable electricityand natural resources contribute to CO2 emissions? Energy Policy 2018, 113, 356–367. [CrossRef]
4. Guedes, R.E.; Luna, A.S.; Torres, A.R. Operating parameters for bio-oil production in biomass pyrolysis:A review. J. Anal. Appl. Pyrolysis 2018, 129, 134–149. [CrossRef]
5. Bridgwater, A.V. Renewable fuels and chemicals by thermal processing of biomass. Chem. Eng. J. 2003, 91,87–102. [CrossRef]
6. El Bassam, N. Handbook of Bioenergy Crops. A Complete Reference to Species, Development and Applications;Routledge: Abingdon-on-Thames, UK, 2010; Volume 18, ISBN 978-1-84407-854-7.
7. Sharma, A.; Pareek, V.; Zhang, D. Biomass pyrolysis—A review of modelling, process parameters andcatalytic studies. Renew. Sustain. Energy Rev. 2015, 50, 1081–1096. [CrossRef]
8. Si, Z.; Zhang, X.; Wang, C.; Ma, L.; Dong, R. An Overview on Catalytic Hydrodeoxygenation of Pyrolysis Oiland Its Model Compounds. Catalysts 2017, 7, 169. [CrossRef]
9. Czernik, S.; Johnson, D.K.; Black, S. Stability of wood fast pyrolysis oil. Biomass Bioenergy 1994, 7, 187–192.[CrossRef]
206
Catalysts 2018, 8, 449
10. Olbrich, W.; Boscagli, C.; Raffelt, K.; Zang, H.; Dahmen, N.; Sauer, J. Catalytic hydrodeoxygenation ofpyrolysis oil over nickel-based catalysts under H2/CO2 atmosphere. Sustain. Chem. Process. 2016, 4, 9.[CrossRef]
11. Li, X.; Gunawan, R.; Wang, Y.; Chaiwat, W.; Hu, X.; Gholizadeh, M.; Mourant, D.; Bromly, J.; Li, C.-Z.Upgrading of bio-oil into advanced biofuels and chemicals. Part III. Changes in aromatic structure and cokeforming propensity during the catalytic hydrotreatment of a fast pyrolysis bio-oil with Pd/C catalyst. Fuel2014, 116, 642–649. [CrossRef]
12. Balat, M. An overview of the properties and applications of biomass pyrolysis oils. Energy Sources Part ARecover. Util. Environ. Eff. 2011, 33, 674–689. [CrossRef]
13. Bridgwater, A.V. Review of fast pyrolysis of biomass and product upgrading. Biomass Bioenergy 2012, 38,68–94. [CrossRef]
14. Gollakota, A.R.K.; Reddy, M.; Subramanyam, M.D.; Kishore, N. A review on the upgradation techniques ofpyrolysis oil. Renew. Sustain. Energy Rev. 2016, 58, 1543–1568. [CrossRef]
15. Mortensen, P.M.; Grunwaldt, J.-D.; Jensen, P.A.; Knudsen, K.G.; Jensen, A.D. A review of catalytic upgradingof bio-oil to engine fuels. Appl. Catal. A Gen. 2011, 407, 1–19. [CrossRef]
16. Furimsky, E. Catalytic hydrodeoxygenation. Appl. Catal. A Gen. 2000, 199, 147–190. [CrossRef]17. Song, H.; Gong, J.; Song, H.; Li, F. Applied Catalysis A: General A novel surface modification approach for
synthesizing supported nickel phosphide catalysts with high activity for hydrodeoxygenation of benzofuran.Appl. Catal. A Gen. 2015, 505, 267–275. [CrossRef]
18. Elliott, D.C. Biofuel from fast pyrolysis and catalytic hydrodeoxygenation. Curr. Opin. Chem. Eng. 2015, 9,59–65. [CrossRef]
19. Ewald, S.; Standl, S.; Hinrichsen, O. Characterization of nickel catalysts with transient methods. Appl. Catal.A Gen. 2018, 549, 93–101. [CrossRef]
20. Jin, S.; Xiao, Z.; Li, C.; Chen, X.; Wang, L.; Xing, J.; Li, W.; Liang, C. Catalytic hydrodeoxygenation of anisoleas lignin model compound over supported nickel catalysts. Catal. Today 2014, 234, 125–132. [CrossRef]
21. Boscagli, C.; Raffelt, K.; Zevaco, T.A.; Olbrich, W.; Otto, T.N.; Sauer, J.; Grunwaldt, J.-D. Mild hydrotreatmentof the light fraction of fast-pyrolysis oil produced from straw over nickel-based catalysts. Biomass Bioenergy2015, 83, 525–538. [CrossRef]
22. Dongil, A.B.; Ghampson, I.T.; García, R.; Fierro, J.L.G.; Escalona, N. Hydrodeoxygenation of guaiacol overNi/carbon catalysts: Effect of the support and Ni loading. RSC Adv. 2016, 6, 2611–2623. [CrossRef]
23. Ardiyani, A.R.; Khromova, S.A.; Venderbosch, R.H.; Yakovlev, V.A.; Heeres, H.J. Catalytic hydrotreatment offast-pyrolysis oil using non-sulfided bimetallic Ni-Cu catalysts on a δ-Al2O3 support. Appl. Catal. B Environ.2012, 117–118, 105–117. [CrossRef]
24. Dongil, A.B.; Bachiller-Baeza, B.; Rodriguez-Ramos, I.; Fierro, J.L.G.; Escalona, N. Effect of Cu loadingon Ni/carbon nanotubes catalyst for hydrodeoxygenation of guaiacol. RSC Adv. 2016, 3, 26658–26667.[CrossRef]
25. Mortensen, P.M.; Grunwaldt, J.-D.; Jensen, P.A.; Jensen, A.D. Screening of catalysts for hydrodeoxygenationof phenol as a model compound for bio-oil. ACS Catal. 2013, 3, 1774–1785. [CrossRef]
26. Boscagli, C.; Yang, C.; Welle, A.; Wang, W.; Behrens, S.; Raffelt, K.; Grunwaldt, J.-D. Effect of pyrolysis oilcomponents on the activity and selectivity of nickel-based catalysts during hydrotreatment. Appl. Catal.A Gen. 2017, 544, 161–172. [CrossRef]
27. Saidi, M.; Samimi, F.; Karimipourfard, D.; Nimmanwudipong, T.; Gates, B.C.; Rahimpour, M.R. Upgradingof lignin-derived bio-oils by catalytic hydrodeoxygenation. Energy Environ. Sci. 2014, 7, 103–129. [CrossRef]
28. He, Z.; Wang, X. Hydrodeoxygenation of model compounds and catalytic systems for pyrolysis bio-oilsupgrading. Catal. Sustain. Energy 2012, 1, 28–52. [CrossRef]
29. Elliott, D.C. Historical developments in hydroprocessing bio-oils. Energy Fuels 2007, 21, 1792–1815.[CrossRef]
30. Bykova, M.V.; Ermakov, D.Y.; Kaichev, V.V.; Bulavchenko, O.A.; Saraev, A.A.; Lebedev, M.Y.; Yakovlev, V.A.Applied Catalysis B: Environmental Ni-based sol–gel catalysts as promising systems for crude bio-oilupgrading: Guaiacol hydrodeoxygenation study. Appl. Catal. B Environ. 2012, 113–114, 296–307. [CrossRef]
31. Roldugina, E.A.; Naranov, E.R.; Maximov, A.L.; Karakhanov, E.A. Hydrodeoxygenation of guaiacol as amodel compound of bio-oil in methanol over mesoporous noble metal catalysts. Appl. Catal. A Gen. 2018.[CrossRef]
207
Catalysts 2018, 8, 449
32. Esmaeili, J.; Rahimpour, F. Regeneration of spent nickel catalyst from hydrogenation process of edible oils:Heat treatment with hydrogen injection. Int. J. Hydrogen Energy 2017, 42, 24197–24204. [CrossRef]
33. Ng, A.; Lup, K.; Abnisa, F.; Mohd, W.; Wan, A. A review on reactivity and stability of heterogeneous metalcatalysts for deoxygenation of bio-oil model compounds. J. Ind. Eng. Chem. 2017, 56, 1–34. [CrossRef]
34. Koike, N.; Hosokai, S.; Takagaki, A.; Nishimura, S.; Kikuchi, R.; Ebitani, K.; Suzuki, Y.; Oyama, S.T. Upgradingof pyrolysis bio-oil using nickel phosphide catalysts. J. Catal. 2016, 333, 115–126. [CrossRef]
35. Yin, W.; Hendrikus, R.; Alekseeva, M.V.; Bernardes, M.; Heeres, H.; Khromova, A.; Yakovlev, V.A.;Cannilla, C.; Bonura, G.; Frusteri, F.; et al. Hydrotreatment of the carbohydrate-rich fraction ofpyrolysis liquids using bimetallic Ni based catalyst: Catalyst activity and product property relations.Fuel Process. Technol. 2018, 169, 258–268. [CrossRef]
36. Rodríguez, J.C.; Marchi, A.J.; Borgna, A.; Romeo, E.; Monzón, A. Gas Phase Selective Hydrogenation ofAcetylene. Importance of the Formation of Ni-Co and Ni-Cu Bimetallic Clusters on the Selectivity and CokeDeposition. Stud. Surf. Sci. Catal. 2001, 139, 37–44. [CrossRef]
37. De Rogatis, L.; Montini, T.; Lorenzut, B.; Fornasiero, P. NixCuy/Al2O3 based catalysts for hydrogenproduction. Energy Environ. Sci. 2008, 1, 501–509. [CrossRef]
38. Li, X.; Cheng, H.; Liang, G.; He, L.; Lin, W.; Yu, Y.; Zhao, F. Effect of Phosphine Doping and the Surface MetalState of Ni on the Catalytic Performance of Ni/Al2O3 Catalyst. Catalysts 2015, 5, 759–773. [CrossRef]
39. Jahromi, H.; Agblevor, F.A. Hydrodeoxygenation of pinyon-juniper catalytic pyrolysis oil using redmud-supported nickel catalysts. Appl. Catal. B Environ. 2018, 236, 1–12. [CrossRef]
40. Ardiyanti, A.R.; Khromova, S.A.; Venderbosch, R.H.; Yakovlev, V.A.; Melián-Cabrera, I.V.; Heeres, H.J.Catalytic hydrotreatment of fast pyrolysis oil using bimetallic Ni-Cu catalysts on various supports.Appl. Catal. A Gen. 2012, 449, 121–130. [CrossRef]
41. Wang, Z.; Zeng, Y.; Lin, W.; Song, W. In-situ hydrodeoxygenation of phenol by supported Nicatalyst—Explanation for catalyst performance. Int. J. Hydrogen Energy 2017, 42, 21040–21047. [CrossRef]
42. Zhang, X.; Wang, T.; Ma, L.; Zhang, Q.; Yu, Y.; Liu, Q. Characterization and catalytic properties of Ni andNiCu catalysts supported on ZrO2–SiO2 for guaiacol hydrodeoxygenation. Catal. Commun. 2013, 33, 15–19.[CrossRef]
43. Carriel Schmitt, C.; Boscagli, C.; Rapp, M.; Raffelt, K.; Dahmen, N. Characterization of light and heavy phaseof pyrolysis-oil from distinct biomass for further upgrading reactions. In Proceedings of the 25th EuropeanBiomass Conference and Exhibition, Stockholm, Sweden, 12–15 June 2017. [CrossRef]
44. Mullen, C.A.; Strahan, G.D.; Boateng, A.A. Characterization of various fast-pyrolysis bio-oils by NMRspectroscopy. Energy Fuels 2009, 23, 2707–2718. [CrossRef]
45. Yin, W.; Kloekhorst, A.; Venderbosch, R.H.; Bykova, M.V.; Khromova, S.A.; Yakovlev, V.A.; Heeres, H.J.Catalytic hydrotreatment of fast pyrolysis liquids in batch and continuous set-ups using a bimetallic Ni–Cucatalyst with a high metal content. Catal. Sci. Technol. 2016, 6, 5899–5915. [CrossRef]
46. Boscagli, C.; Raffelt, K.; Grunwaldt, J.-D. Reactivity of platform molecules in pyrolysis oil and in waterduring hydrotreatment over nickel and ruthenium catalysts. Biomass Bioenergy 2017, 106, 63–73. [CrossRef]
47. Schmitt, C.C.; Raffelt, K.; Zimina, A.; Krause, B.; Otto, T.; Rapp, M.; Grunwaldt, J.-D.; Dahmen, N.Hydrotreatment of Fast Pyrolysis Bio-oil Fractions Over Nickel-Based Catalyst. Top. Catal. 2018, 61,1769–1782. [CrossRef]
48. Oh, S.; Choi, H.S.; Choi, I.-G.; Choi, J.W. Evaluation of hydrodeoxygenation reactivity of pyrolysis bio-oil withvarious Ni-based catalysts for improvement of fuel properties. RSC Adv. 2017, 7, 15116–15126. [CrossRef]
49. Nakagawa, Y.; Tamura, M.; Tomishige, K. Catalytic Conversions of Furfural to Pentanediols. Catal. Surv. Asia2015, 19, 249–256. [CrossRef]
50. Resasco, D.E.; Sitthisa, S.; Faria, J.; Prasomsri, T.; Ruiz, M.P. Furfurals as Chemical Platform for Biofuels Production;Kubicka, D., Kubicková, I., Eds.; Research S.: Kerala, India, 2011; Volume 661, ISBN 9788130804620.
51. Mariscal, R.; Maireles-Torres, P.; Ojeda, M.; Sádaba, I.; López Granados, M. Furfural: A renewable andversatile platform molecule for the synthesis of chemicals and fuels. Energy Environ. Sci. 2016, 9, 1144–1189.[CrossRef]
52. Feng, J.; Yang, Z.; Hse, C.Y.; Su, Q.; Wang, K.; Jiang, J.; Xu, J. In situ catalytic hydrogenation of modelcompounds and biomass-derived phenolic compounds for bio-oil upgrading. Renew. Energy 2017, 105,140–148. [CrossRef]
208
Catalysts 2018, 8, 449
53. Agblevor, F.A.; Jahromi, H. Aqueous phase synthesis of hydrocarbons from furfural reactions withlow molecular weight biomass oxygenates. Energy Fuels 2018, 32, 8552–8562. [CrossRef]
54. Vispute, T. Pyrolysis Oils: Characterization, Stability Analysis, and Catalytic Upgrading to Fuels andChemicals. Ph.D. Thesis, University of Massachussets Amherst, Amherst, MA, USA, 2011.
55. Deutsch, K.L. Copper Catalysts in the C-O Hydrogenolysis of Biorenewable Compounds. Ph.D. Thesis,Iowa State University, Ames, IA, USA, 2012.
56. Khromova, S.A.; Smirnov, A.A.; Bulavchenko, O.A.; Saraev, A.A.; Kaichev, V.V.; Reshetnikov, S.I.;Yakovlev, V.A. Anisole hydrodeoxygenation over Ni-Cu bimetallic catalysts: The effect of Ni/Cu ratioon selectivity. Appl. Catal. A Gen. 2014, 470, 261–270. [CrossRef]
57. French, R.J.; Stunkel, J.; Black, S.; Myers, M.; Yung, M.M.; Iisa, K. Evaluate impact of catalyst type on oil yieldand hydrogen consumption from mild hydrotreating. Energy Fuels 2014, 28, 3086–3095. [CrossRef]
58. Huynh, T.M. Development of Novel Bimetallic Nickel-Cobalt Catalysts for Hydrodeoxygenation ofBio-Oil Producing a Co-Feed for a Standard Refinery Unit. Ph.D. Thesis, University of Rostock, Rostock,Germany, 2015.
59. Ardiyanti, A.R.; Gutierrez, A.; Honkela, M.L.; Krause, A.O.I.I.; Heeres, H.J. Hydrotreatment of wood-basedpyrolysis oil using zirconia-supported mono- and bimetallic (Pt, Pd, Rh) catalysts. Appl. Catal. A Gen. 2011,407, 56–66. [CrossRef]
60. Van Haasterecht, T.; Ludding, C.C.I.; De Jong, K.P.; Bitter, J.H. Toward stable nickel catalysts for aqueousphase reforming of biomass-derived feedstock under reducing and alkaline conditions. J. Catal. 2014, 319,27–35. [CrossRef]
61. Argyle, M.D.; Bartholomew, C.H. Heterogeneous Catalyst Deactivation and Regeneration: A Review.Catalysts 2015, 5, 145–269. [CrossRef]
62. Oh, S.; Hwang, H.; Seok, H.; Weon, J. The effects of noble metal catalysts on the bio-oil quality during thehydrodeoxygenative upgrading process. Fuel 2015, 153, 535–543. [CrossRef]
63. Li, X.; Luo, X.; Jin, Y.; Li, J.; Zhang, H.; Zhang, A.; Xie, J. Heterogeneous sulfur-free hydrodeoxygenationcatalysts for selectively upgrading the renewable bio-oils to second generation biofuels. Renew. Sustain.Energy Rev. 2018, 82, 3762–3797. [CrossRef]
64. Chen, S.; Miao, C.; Luo, Y.; Zhou, G.; Xiong, K.; Jiao, Z. Study of catalytic hydrodeoxygenation performanceof Ni catalysts: Effects of prepared method. Renew. Energy 2018, 115, 1109–1117. [CrossRef]
65. González-Cobos, J.; de Lucas-Consuegra, A. A Review of Surface Analysis Techniques for the Investigationof the Phenomenon of Electrochemical Promotion of Catalysis with Alkaline Ionic Conductors. Catalysts2016, 6, 15. [CrossRef]
66. Mortensen, P.M.; Gardini, D.; de Carvalho, H.W.P.; Damsgaard, C.D.; Grunwaldt, J.-D.; Jensen, P.A.;Wagner, J.B.; Jensen, A.D. Catalysis Science & Technology of sulfur, potassium, and chlorine in the feed.Catal. Sci. Technol. 2014, 4, 3672–3686. [CrossRef]
67. Hou, L.; Bu, Q.; Li, S.; Wang, D.; Xie, T. Ni3S2-Decorated TiO2 nanotube arrays as effective photoanodes forphotoelectrochemical water splitting. RSC Adv. 2016, 6, 99081–99087. [CrossRef]
68. Xiong, X.; Zhao, B.; Ding, D.; Chen, D.; Yang, C.; Lei, Y.; Liu, M. One-step synthesis of architectural Ni3S2
nanosheet-on-nanorods array for use as high-performance electrodes for supercapacitors. NPG Asia Mater.2016, 8, e300. [CrossRef]
69. Alonso, D.M.; Wettstein, S.G.; Dumesic, J.A. Bimetallic catalysts for upgrading of biomass to fuels andchemicals. Chem. Soc. Rev. 2012, 41, 8075–8098. [CrossRef] [PubMed]
70. Sanna, A.; Vispute, T.P.; Huber, G.W. Hydrodeoxygenation of the aqueous fraction of bio-oil with Ru/C andPt/C catalysts. Appl. Catal. B Environ. 2015, 165, 446–456. [CrossRef]
71. Gunawan, R.; Li, X.; Lievens, C.; Gholizadeh, M.; Chaiwat, W.; Hu, X.; Mourant, D.; Bromly, J.; Li, C.Z.Upgrading of bio-oil into advanced biofuels and chemicals. Part I. Transformation of GC-detectable lightspecies during the hydrotreatment of bio-oil using Pd/C catalyst. Fuel 2013, 111, 709–717. [CrossRef]
72. Sitthisa, S.; An, W.; Resasco, D.E. Selective conversion of furfural to methylfuran over silica-supported NiFebimetallic catalysts. J. Catal. 2011, 284, 90–101. [CrossRef]
73. Jahromi, H.; Agblevor, F.A. Hydrotreating of guaiacol: A comparative study of Red mud-supported nickeland commercial Ni/SiO2-Al2O3 catalysts. Appl. Catal. A Gen. 2018, 558, 109–121. [CrossRef]
74. Narayanasamy, L.; Murugesan, T. Degradation of Alizarin Yellow R using UV/H2O2 Advanced OxidationProcess. Environ. Sci. Technol. 2014, 33, 482–489. [CrossRef]
209
Catalysts 2018, 8, 449
75. Srifa, A.; Faungnawakij, K.; Itthibenchapong, V.; Viriya-Empikul, N.; Charinpanitkul, T.; Assabumrungrat, S.Production of bio-hydrogenated diesel by catalytic hydrotreating of palm oil over NiMoS2/γ-Al2O3 catalyst.Bioresour. Technol. 2014, 158, 81–90. [CrossRef] [PubMed]
76. Elliott, D.C.; Hart, T.R.; Neuenschwander, G.G.; Rotness, L.J.; Olarte, M.V.; Zacher, A.H.; Solantausta, Y.Catalytic hydroprocessing of fast pyrolysis bio-oil from pine sawdust. Energy Fuels 2012, 26, 3891–3896.[CrossRef]
77. Venderbosch, R.H.; Ardiyanti, A.R.; Wildschut, J.; Oasmaa, A.; Heeres, H.J. Stabilization of biomass-derivedpyrolysis oils. J. Chem. Technol. Biotechnol. 2010, 85, 674–686. [CrossRef]
78. Zhao, H.Y.; Li, D.; Bui, P.; Oyama, S.T. Hydrodeoxygenation of guaiacol as model compound for pyrolysis oilon transition metal phosphide hydroprocessing catalysts. Appl. Catal. A Gen. 2011, 391, 305–310. [CrossRef]
© 2018 by the authors. Licensee MDPI, Basel, Switzerland. This article is an open accessarticle distributed under the terms and conditions of the Creative Commons Attribution(CC BY) license (http://creativecommons.org/licenses/by/4.0/).
210

catalysts
Article
Thermal and Catalytic Pyrolysis of Dodecanoic Acidon SAPO-5 and Al-MCM-41 Catalysts
Carolina Freitas 1, Marizania Pereira 2, Damari Souza 2, Noyala Fonseca 3, Emerson Sales 1,3 ,
Roger Frety 1,3, Camila Felix 4, Aroldo Azevedo Jr. 5 and Soraia Brandao 1,2,*
1 UFBA—Instituto de Química, Universidade Federal da Bahia, Rua Barão de Jeremoabo, 147, Ondina,Salvador CEP 40170-115, BA, Brazil; [email protected] (C.F.);[email protected] (E.S.); [email protected] (R.F.)
2 UFBA—Escola Politécnica, Universidade Federal da Bahia, Rua Professor Aristides Novis, 2, Federação,Salvador CEP 40210-630, BA, Brazil; [email protected] (M.P.); [email protected] (D.S.)
3 LABEC—Laboratório de Bioenergia e Catálise, Escola Politécnica, Universidade Federal da Bahia,Rua Professor Aristides Novis, 2, Federação, Salvador CEP 40210-630, BA, Brazil; [email protected]
4 IFBA—Instituto Federal da Bahia, Rua Vital Brazil, Pitanguinha, s. n, Simões Filho,Salvador CEP 43700-000, BA, Brazil; [email protected]
5 UFRB—Universidade Federal do Recôncavo da Bahia, Av. Centenário, 697,Feira de Santana CEP 44042-280, BA, Brazil; [email protected]
* Correspondence: [email protected]; Tel.: +55-71-3283-6882 (ext. 6889)
Received: 25 February 2019; Accepted: 27 April 2019; Published: 3 May 2019
Abstract: In this study, dodecanoic acid was decomposed during fast pyrolysis experiments eitherthermally or in the presence of SAPO-5 and Al-MCM-41catalysts. The catalysts were synthesized bya hydrothermal route and subsequently characterized by XRD, TPD-NH3, and TGA, and dodecanoicacid was characterized by TGA and DSC. Analysis of the post-pyrolysis products was performedonline by gas chromatography coupled with mass spectrometry (GC-MS). The results from pyrolysisat 650 ◦C indicated that the nature of the catalysts strongly influences the composition of theproducts. Linear alkenes were standard products for all pyrolysis experiments, but with Al-MCM-41,various alkene isomers with a linear and cyclic structure formed, as well as saturated and aromatichydrocarbons. As a whole, Al-MCM-41 led to a much higher dodecanoic acid conversion and higherdeoxygenation than SAPO-5. As these catalysts present small differences in strong acid site density,the difference in the global conversion of dodecanoic acid could be attributed to textural characteristicssuch as pore volume and surface area. In this case, the textural properties of the SAPO-5 are muchlower when compared to Al-MCM-41 and, due to a lower accessibility of the reactant molecule tothe acidic sites of SAPO-5, partially blocked for fatty acid molecules by the considerable amount ofamorphous material, as detected by XRD.
Keywords: fast pyrolysis; SAPO-5; Al-MCM-41; dodecanoic acid
1. Introduction
The global energy matrix is still based on non-renewable sources and fossil fuels. The use ofthese sources generates pollution and emissions of greenhouse gases, leaving environmental problemsfor future generations. Since the second half of the 20th Century, with oil crises, rising fuel demand,and growing environmental awareness, research into alternative energy sources has grown. Renewablesources are now much favored due to their full availability, biodegradability, and low cost [1].
Vegetable oils have a large amount of triacylglycerides (about 90%) and a lower amount of freefatty acids, mono-, and di-glycerides (8–10%). Among the acids present in the various oily compounds,saturated fatty acids, such as palmitic (C16:0) and stearic (C18:0), and unsaturated, such as linoleic
Catalysts 2019, 9, 418; doi:10.3390/catal9050418 www.mdpi.com/journal/catalysts211

Catalysts 2019, 9, 418
(C18:2) and oleic (C18:1), are the most common, but other acids, such as lauric (C12:0) and myristic(C14:0), exist in specific oils and fats [2].
Brazil has several sources for the supply of oily compounds, such as soybean (whose predominantfatty acid is linoleic acid), babassu (lauric acid), and animal fat (stearic acid). Research into oils fromother biomasses has been carried out, for example, castor oil, palm oil pulp, palm kernel almond,babassu coconut kernel, sunflower seeds, and other raw materials [3]. The country is the fourth largestproducer of coconut in the world with almost three million tons of fruit per year, and the State of Bahiais the largest producer. Coconut and coconut oil are relevant natural sources of saturated fats, basedmainly on dodecanoic acid (C12:0), also known as lauric acid. Coconut oil is obtained from the pulp ofmature fresh coconut (Cocos nucifera L.) and contains more than 80% of saturated fatty acids, such ascaproic, caprylic, capric, lauric, myristic, palmitic, and stearic acids. Coconut oil has a concentration oflauric acid above 40% [4].
Pyrolysis or thermal cracking of triglycerides is a well-known method for producing renewablefuels (Bressler, Maher). Pyrolysis operates in the absence of external O2, providing high yields in liquidswhen performed at elevated temperatures (400–600 ◦C), with vapor residence times lower than 5 s andheating rates between 10 and 200 ◦C/s [2]. Pyrolysis of triglycerides can be summarized by Reaction 1:
Reaction 1
Thermal cracking produces saturated, unsaturated linear hydrocarbons, or both, via thedeoxygenation of carboxylic acids, which can occur through two distinct reaction paths: decarboxylationand decarbonylation. In decarboxylation, the carboxyl group of the fatty acid is removed, forminga saturated hydrocarbon and CO2 (Reaction 2). The decarbonylation consists of the removal of thecarbonyl of the fatty acid forming CO, H2O, and olefins (Reaction 3) [1].
Reaction 2
Reaction 3
In addition to the formation of the primary pyrolysis products, many parallel and sequentialtransformations can occur, leading to a series of oxygenated and deoxygenated molecules with asmaller or higher number of carbon atoms, compared to the initial carbon chains, such as olefins,paraffins, ketones, aldehydes, and aromatics, among others [5].
One way of making pyrolysis more efficient is to promote the reaction in the presence of a suitablecatalyst. In recent years, studies dealing with the catalytic conversion of oily biomass feeds, throughthermochemical reactions, have reported impressive results, and many reviews have summarized
212

Catalysts 2019, 9, 418
the positive and negative aspects of such transformations [6–8]. Further, current research has beendone into the use of multi-element and multi-functional catalysts and complex mixtures of feedsin coprocessing strategies [9–12]. However, much essential work is still needed to understand thecomplexity of the reaction mechanism sequences, and therefore, studies with simpler systems, or modelmolecules, must be performed.
The interest of the petrochemical and chemical industries in the use of molecular sieves is dueto the application of these types of materials in catalytic cracking, isomerization, and alkylation.Molecular sieves have a combination of important properties, such as surface area, large ion exchangecapacity, and strong acidity, with high thermal and hydrothermal stability. Due to the regularity of theircrystalline channels, molecular sieves allow higher selectivity of the reagents, products, and transitionstates, on a molecular scale [13]. Catalysts based on molecular sieves with different crystallinestructures can induce changes in the product distribution, in the conversion of bio-oils and triglycerides.An example is the several zeolites, such as ZSM-5, Y, and beta, and silicoaluminophosphates studied inbio-oil cracking [3].
The SAPO-5 catalyst has one-dimensional 12-membered straight channel rings. It is a crystallineand microporous material, presenting excellent thermal and hydrothermal stability, and its acidityreaches intermediate values between the zeolite and the AlPO (aluminophosphate molecular sieves).Due to its topology, SAPO-5 provides potential catalytic applications, such as catalytic cracking,isomerization, and alkylation reactions [14].
The molecular sieve MCM-41 belongs to the class of materials known as M41S (Mobil 41 Synthesis).They are Si-based materials with highly-ordered mesopores and a high surface area. MCM-41, consistingof pure silica, presents low acidity. The incorporation of aluminum into the MCM-41 structure increasesthe number of acid sites, improving catalytic activity [15].
In this work, molecular sieves SAPO-5 and Al-MCM-41 were synthesized and evaluated ascatalysts in the fast pyrolysis of dodecanoic acid, a simple model molecule of fatty compounds.The differences between thermal and catalytic pyrolysis, as well as the distribution of the productsformed were analyzed.
2. Results and Discussion
Although the textural properties of the present samples were not determined, other samplesof SAPO-5 and Al-MCM-41 using the same synthesis procedures have been prepared by some ofus. In these cases, surface areas of SAPO-5 and Al-MCM-41 ranged from 247–261 and 485–510 m2/g,respectively, whereas pore volumes were in the order of 0.19 and 0.85 cm3/g, respectively. Therefore,Al-MCM-41 presented a higher surface area and a much larger pore volume than SAPO-5 [16].
2.1. X-ray Diffraction
Figure 1a shows the diffractogram of the SAPO-5 molecular sieve. The material presented acharacteristic diffractogram of the AFI structure, similar to that found in the literature [17]. The presenceof the intense halo at about 2θ = 15–35◦ was associated with some extra frame silica.
The diffractogram of the Al-MCM-41 catalyst shown in Figure 1b presented a strong reflectionat 2θ = 2.1◦, characteristic of the MCM-41 structure. The two peaks of lower intensity and greaterwidth observed at 2θ = 3–4◦ suggest a loss of homogeneity and hexagonal symmetry of the crystallinestructure due to the incorporation of aluminum in the structure of MCM-41 [18–20].
213
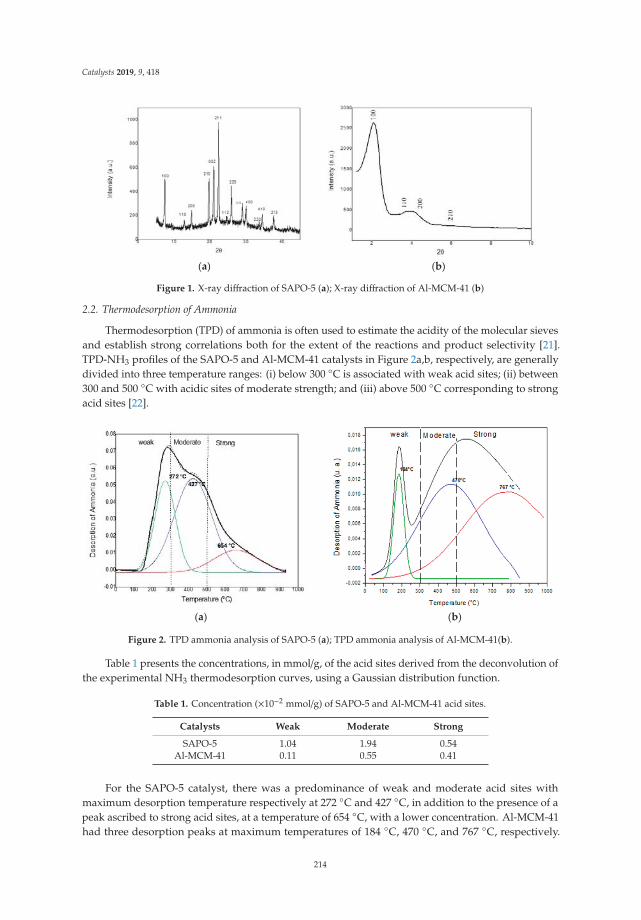
Catalysts 2019, 9, 418
(a) (b)
Figure 1. X-ray diffraction of SAPO-5 (a); X-ray diffraction of Al-MCM-41 (b)
2.2. Thermodesorption of Ammonia
Thermodesorption (TPD) of ammonia is often used to estimate the acidity of the molecular sievesand establish strong correlations both for the extent of the reactions and product selectivity [21].TPD-NH3 profiles of the SAPO-5 and Al-MCM-41 catalysts in Figure 2a,b, respectively, are generallydivided into three temperature ranges: (i) below 300 ◦C is associated with weak acid sites; (ii) between300 and 500 ◦C with acidic sites of moderate strength; and (iii) above 500 ◦C corresponding to strongacid sites [22].
(a) (b)
Figure 2. TPD ammonia analysis of SAPO-5 (a); TPD ammonia analysis of Al-MCM-41(b).
Table 1 presents the concentrations, in mmol/g, of the acid sites derived from the deconvolution ofthe experimental NH3 thermodesorption curves, using a Gaussian distribution function.
Table 1. Concentration (×10−2 mmol/g) of SAPO-5 and Al-MCM-41 acid sites.
Catalysts Weak Moderate Strong
SAPO-5 1.04 1.94 0.54Al-MCM-41 0.11 0.55 0.41
For the SAPO-5 catalyst, there was a predominance of weak and moderate acid sites withmaximum desorption temperature respectively at 272 ◦C and 427 ◦C, in addition to the presence of apeak ascribed to strong acid sites, at a temperature of 654 ◦C, with a lower concentration. Al-MCM-41had three desorption peaks at maximum temperatures of 184 ◦C, 470 ◦C, and 767 ◦C, respectively.
214
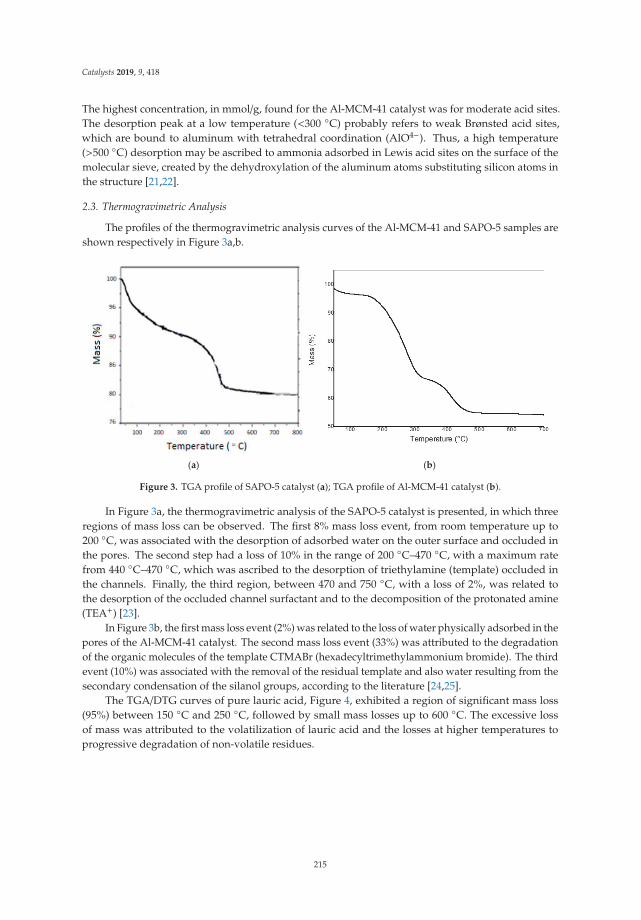
Catalysts 2019, 9, 418
The highest concentration, in mmol/g, found for the Al-MCM-41 catalyst was for moderate acid sites.The desorption peak at a low temperature (<300 ◦C) probably refers to weak Brønsted acid sites,which are bound to aluminum with tetrahedral coordination (AlO4−). Thus, a high temperature(>500 ◦C) desorption may be ascribed to ammonia adsorbed in Lewis acid sites on the surface of themolecular sieve, created by the dehydroxylation of the aluminum atoms substituting silicon atoms inthe structure [21,22].
2.3. Thermogravimetric Analysis
The profiles of the thermogravimetric analysis curves of the Al-MCM-41 and SAPO-5 samples areshown respectively in Figure 3a,b.
(a) (b)
Figure 3. TGA profile of SAPO-5 catalyst (a); TGA profile of Al-MCM-41 catalyst (b).
In Figure 3a, the thermogravimetric analysis of the SAPO-5 catalyst is presented, in which threeregions of mass loss can be observed. The first 8% mass loss event, from room temperature up to200 ◦C, was associated with the desorption of adsorbed water on the outer surface and occluded inthe pores. The second step had a loss of 10% in the range of 200 ◦C–470 ◦C, with a maximum ratefrom 440 ◦C–470 ◦C, which was ascribed to the desorption of triethylamine (template) occluded inthe channels. Finally, the third region, between 470 and 750 ◦C, with a loss of 2%, was related tothe desorption of the occluded channel surfactant and to the decomposition of the protonated amine(TEA+) [23].
In Figure 3b, the first mass loss event (2%) was related to the loss of water physically adsorbed in thepores of the Al-MCM-41 catalyst. The second mass loss event (33%) was attributed to the degradationof the organic molecules of the template CTMABr (hexadecyltrimethylammonium bromide). The thirdevent (10%) was associated with the removal of the residual template and also water resulting from thesecondary condensation of the silanol groups, according to the literature [24,25].
The TGA/DTG curves of pure lauric acid, Figure 4, exhibited a region of significant mass loss(95%) between 150 ◦C and 250 ◦C, followed by small mass losses up to 600 ◦C. The excessive lossof mass was attributed to the volatilization of lauric acid and the losses at higher temperatures toprogressive degradation of non-volatile residues.
215
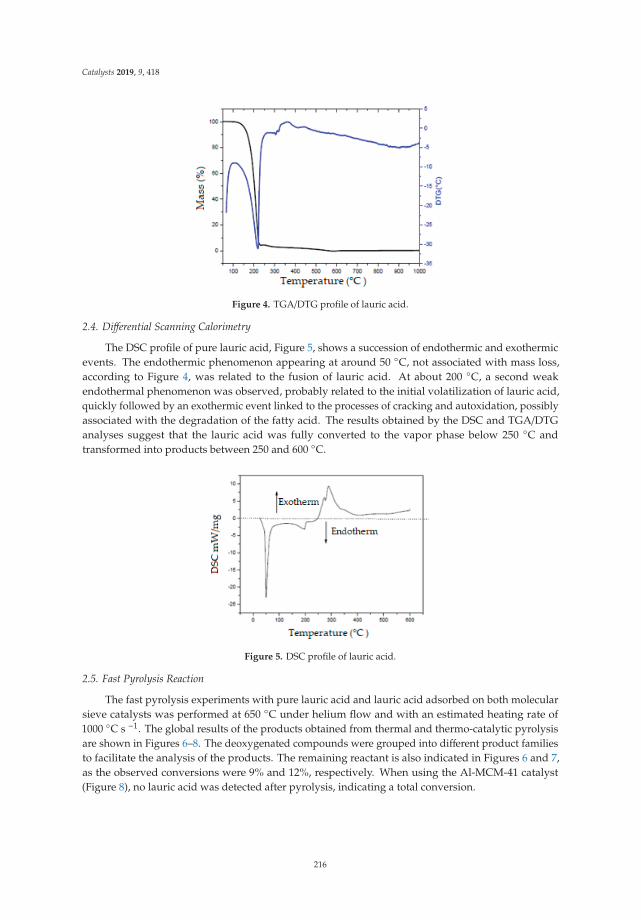
Catalysts 2019, 9, 418
Figure 4. TGA/DTG profile of lauric acid.
2.4. Differential Scanning Calorimetry
The DSC profile of pure lauric acid, Figure 5, shows a succession of endothermic and exothermicevents. The endothermic phenomenon appearing at around 50 ◦C, not associated with mass loss,according to Figure 4, was related to the fusion of lauric acid. At about 200 ◦C, a second weakendothermal phenomenon was observed, probably related to the initial volatilization of lauric acid,quickly followed by an exothermic event linked to the processes of cracking and autoxidation, possiblyassociated with the degradation of the fatty acid. The results obtained by the DSC and TGA/DTGanalyses suggest that the lauric acid was fully converted to the vapor phase below 250 ◦C andtransformed into products between 250 and 600 ◦C.
Figure 5. DSC profile of lauric acid.
2.5. Fast Pyrolysis Reaction
The fast pyrolysis experiments with pure lauric acid and lauric acid adsorbed on both molecularsieve catalysts was performed at 650 ◦C under helium flow and with an estimated heating rate of1000 ◦C s −1. The global results of the products obtained from thermal and thermo-catalytic pyrolysisare shown in Figures 6–8. The deoxygenated compounds were grouped into different product familiesto facilitate the analysis of the products. The remaining reactant is also indicated in Figures 6 and 7,as the observed conversions were 9% and 12%, respectively. When using the Al-MCM-41 catalyst(Figure 8), no lauric acid was detected after pyrolysis, indicating a total conversion.
216
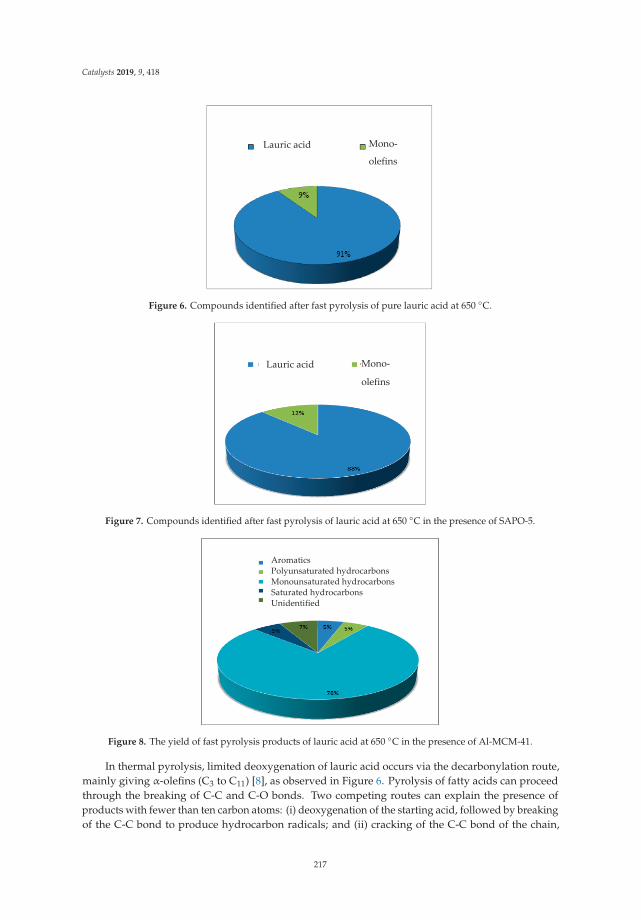
Catalysts 2019, 9, 418
Mono-
olefins
Lauric acid
Figure 6. Compounds identified after fast pyrolysis of pure lauric acid at 650 ◦C.
Lauric acid Mono-
olefins
Figure 7. Compounds identified after fast pyrolysis of lauric acid at 650 ◦C in the presence of SAPO-5.
Aromatics Polyunsaturated hydrocarbons Monounsaturated hydrocarbons Saturated hydrocarbons Unidentified
Figure 8. The yield of fast pyrolysis products of lauric acid at 650 ◦C in the presence of Al-MCM-41.
In thermal pyrolysis, limited deoxygenation of lauric acid occurs via the decarbonylation route,mainly giving α-olefins (C3 to C11) [8], as observed in Figure 6. Pyrolysis of fatty acids can proceedthrough the breaking of C-C and C-O bonds. Two competing routes can explain the presence ofproducts with fewer than ten carbon atoms: (i) deoxygenation of the starting acid, followed by breakingof the C-C bond to produce hydrocarbon radicals; and (ii) cracking of the C-C bond of the chain,
217
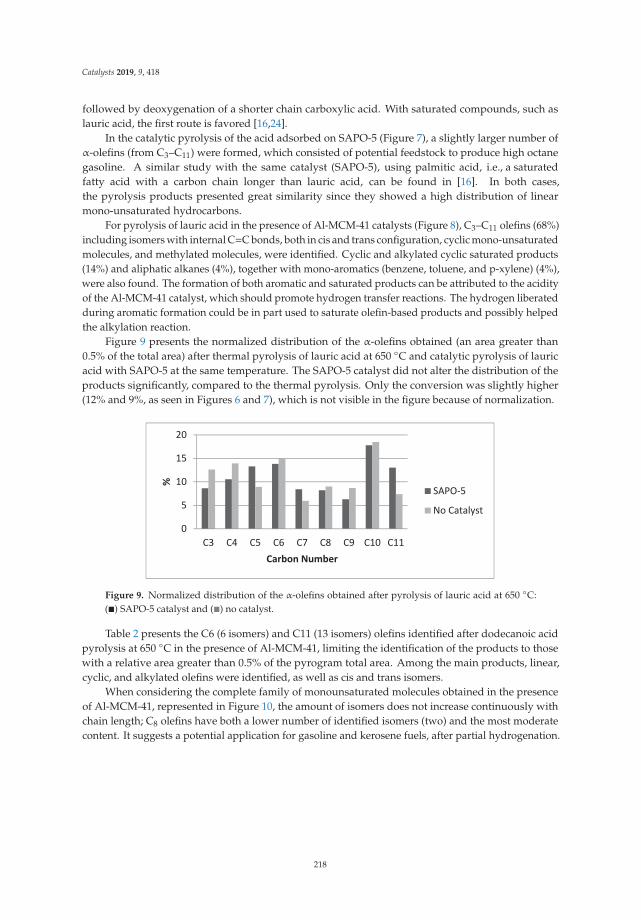
Catalysts 2019, 9, 418
followed by deoxygenation of a shorter chain carboxylic acid. With saturated compounds, such aslauric acid, the first route is favored [16,24].
In the catalytic pyrolysis of the acid adsorbed on SAPO-5 (Figure 7), a slightly larger number ofα-olefins (from C3–C11) were formed, which consisted of potential feedstock to produce high octanegasoline. A similar study with the same catalyst (SAPO-5), using palmitic acid, i.e., a saturatedfatty acid with a carbon chain longer than lauric acid, can be found in [16]. In both cases,the pyrolysis products presented great similarity since they showed a high distribution of linearmono-unsaturated hydrocarbons.
For pyrolysis of lauric acid in the presence of Al-MCM-41 catalysts (Figure 8), C3–C11 olefins (68%)including isomers with internal C=C bonds, both in cis and trans configuration, cyclic mono-unsaturatedmolecules, and methylated molecules, were identified. Cyclic and alkylated cyclic saturated products(14%) and aliphatic alkanes (4%), together with mono-aromatics (benzene, toluene, and p-xylene) (4%),were also found. The formation of both aromatic and saturated products can be attributed to the acidityof the Al-MCM-41 catalyst, which should promote hydrogen transfer reactions. The hydrogen liberatedduring aromatic formation could be in part used to saturate olefin-based products and possibly helpedthe alkylation reaction.
Figure 9 presents the normalized distribution of the α-olefins obtained (an area greater than0.5% of the total area) after thermal pyrolysis of lauric acid at 650 ◦C and catalytic pyrolysis of lauricacid with SAPO-5 at the same temperature. The SAPO-5 catalyst did not alter the distribution of theproducts significantly, compared to the thermal pyrolysis. Only the conversion was slightly higher(12% and 9%, as seen in Figures 6 and 7), which is not visible in the figure because of normalization.
Figure 9. Normalized distribution of the α-olefins obtained after pyrolysis of lauric acid at 650 ◦C:(�) SAPO-5 catalyst and (�) no catalyst.
Table 2 presents the C6 (6 isomers) and C11 (13 isomers) olefins identified after dodecanoic acidpyrolysis at 650 ◦C in the presence of Al-MCM-41, limiting the identification of the products to thosewith a relative area greater than 0.5% of the pyrogram total area. Among the main products, linear,cyclic, and alkylated olefins were identified, as well as cis and trans isomers.
When considering the complete family of monounsaturated molecules obtained in the presenceof Al-MCM-41, represented in Figure 10, the amount of isomers does not increase continuously withchain length; C8 olefins have both a lower number of identified isomers (two) and the most moderatecontent. It suggests a potential application for gasoline and kerosene fuels, after partial hydrogenation.
218

Catalysts 2019, 9, 418
Table 2. C6 and C11 mono-unsaturated main products observed during dodecanoic acid pyrolysis at650 ◦C using Al-MCM-41 catalyst.
Carbon Number Retention Time (min) Mono-Unsaturated
C6
1.686 2-Pentene, 4-methyl-1.785 1-Hexene1.883 3-Hexene, (E)-1.918 3-Hexene, (Z)-1.995 2-Pentene, 3-methyl-, (Z)-2.268 Cyclopentene, 1-methyl-
C11
8.383 4-Decene, 3-methyl-, (E)-8.426 2-Decene, 4-methyl-, (Z)-8.538 5-Undecene, (E)-8.608 4-Undecene, (Z)-8.671 2-Decene, 7-methyl-, (Z)-8.699 5-Undecene, (Z)-8.769 1-Decene, 5-methyl-8.825 4-Undecene, (e)-8.846 2-Decene, 6-methyl-, (Z)-8.916 3-Undecene, (Z)-8.973 3-Undecene, (E)-9.064 2-Undecene, (Z)-9.169 2-Undecene, (E)-
C3 C4 C5 C6 C7 C8 C9 C10 C11 C12Carbon Number
Figure 10. Mono-unsaturated isomers’ distribution from pyrolysis of lauric acid at 650 ◦C, in thepresence of Al-MCM-41.
2.6. Comparison between the SAPO-5 and Al-MCM-41 Catalytic Behavior
The extent of lauric acid conversion between the three pyrolysis reactions was different: 9%was observed during thermal pyrolysis, 12% when lauric acid was adsorbed on the SAPO-5 catalyst,and about 100% when the fatty acid was adsorbed on Al-MCM-41 catalyst. The results are consistentand close to those found in the literature regarding the pyrolysis of saturated fatty acids [4]. However,the results obtained for pyrolysis of unsaturated fatty acids on Al-MCM-41-based catalyst, similar tothose in the present work, showed that deoxygenation was not as effective as for saturated acids [19].
An essential point of the discussion is linked to the low conversion of lauric acid observed whenusing SAPO-5 catalyst compared to Al-MCM-41. The TPD of NH3 profiles are different for these twocatalysts, but small differences in the number of strong acid sites were observed; this alone cannotexplain the significant differences in conversion between both molecular sieves. Specific surfacearea and pore volume of SAPO-5 were much lower than the values for Al-MCM-41. Moreover,a large amount of amorphous material in SAPO-5 was revealed by XRD analysis, and this can causelower accessibility of the dodecanoic acid molecule to acid sites in SAPO-5 catalyst. These two lastcharacteristics are probably responsible for the observed differences in performances between both
219
Catalysts 2019, 9, 418
catalysts. The access of large lauric acid molecules to the acidic sites located inside the porous structureof SAPO-5 could be limited for two main reasons: (i) a lower mean diameter of SAPO-5 pores comparedto that of Al-MCM-41; (ii) the pore mouth in SAPO-5 can be partially blocked by the amorphousspecies. In other words, only a small proportion of SAPO-5 can interact with dodecanoic acid, limitingthe conversion of the fatty acid during pyrolysis experiments.
3. Materials and Methods
3.1. Catalyst Preparation
The synthesis of the SAPO-5 catalyst was carried out following the methodology found in [4],and some modifications were made to adjust the Si/Al ratio. Pseudoboehmite and orthophosphoricacid (85%, Sigma-Aldrich) were used as sources of Si and P, respectively. Then, the triethylamine(Sigma-Aldrich, St. Louis, MO, USA) template was added to tetraethyl orthosilicate (98%, Sigma-Aldrich,St. Louis, MO, USA) and the surfactant hexadecyltrimethylammonium bromide (Sigma-Aldrich,St. Louis, MO, USA), in solution with hexanol (Sigma-Aldrich, St. Louis, MO, USA). Initially, 19.56 mLof orthophosphoric acid (previously diluted in 20 mL of deionized water) were placed in a beakercontaining 22.4 g of pseudoboehmite (dispersed in 63 mL of H2O); this system was kept understirring for two hours. After that, 38.64 mL of triethylamine were added, and stirring was continuedfor a further two hours. After this time, a solution prepared by the addition of 4.82 mL of TEOS(Tetraethyl Orthosilicate) + 78.82 mL of hexanol + 3.8 g of CTMABr (hexadecyltrimethylammoniumbromide) was added and again stirred for another two hours. The mixture was partitioned intoautoclaves and put into an oven preheated to 170 ◦C, where it remained for 24 h. The material obtainedafter this period was centrifuged, washed with alcohol and distilled water, respectively, and againrouted to a drying oven at 100 ◦C for six hours.
A sample of Al-MCM-41 with a silica/alumina (SAR) ratio of 60 was prepared. Commercial silica(Aerosil 200) and sodium aluminate were used as sources of Si and Al, respectively. As a guideline ofthe mesoporous structure, hexadecyltrimethylammonium bromide (CTMABr) was used in the form of25% w/w aqueous solution. Sodium hydroxide solution (50% w/w) was used to maintain the basic pH.The molar composition of the synthesis gel was: 1 SiO2: 0.025 Al2O3: 0.08 Na2O: 0.3 CTMA: 26 H2O.
The samples were prepared from suspensions and solutions named as A, B, C. In Suspension A,20.2 g of silica (SiO2) were mixed in 38.3 g of distilled water. For Solution B, 2.8 g of sodium hydroxide(NaOH) were added to 2.8 g of distilled water, and in Solution C, 36.8 g of hexadecyltrimethylammoniumbromide (CTMABr) were dissolved in 110.5 g of distilled water.
In Solution B, the amount of 0.9 g of sodium aluminate and then Solution C were added undervigorous and constant stirring until complete dissolution of the sodium aluminate. Solution A wasthen added under vigorous stirring at room temperature. The mixture was then placed in autoclaveswithout stirring and heated at 150 ◦C for 48 h.
Then were added 0.9 g of sodium aluminate to Solution B and then Solution C added undervigorous and constant stirring until complete dissolution of the sodium aluminate. Suspension Awas submitted to vigorous stirring at room temperature. The mixture was then placed in autoclaveswithout stirring and heated at 150 ◦C for 48 h.
After this procedure, the product was washed with distilled water separated using a centrifugeand oven dried at 100 ◦C for 4 h. After this step, the material was calcined to remove the remainingtemplate in the porous structure.
Al-MCM-41 catalyst was calcined under an inert atmosphere (N2, 30 mL/min) to 370 ◦C for 1 h30 min to remove the remaining template in the porous structure. After this step, the N2 flux wasreplaced by a synthetic air flow (30 mL/min) maintaining the temperature of 550 ◦C for over ten hoursfor remaining burning of the template.
The SAPO-5 catalyst was calcined in an inert atmosphere (N2, 100 mL/min) to 450 ◦C (10 ◦C/min),remaining for one hour at this temperature, to remove the remaining template in the structure. After
220
Catalysts 2019, 9, 418
this stage, the N2 was replaced by synthetic air (100 mL/min), maintained at a temperature of 550 ◦Cfor 5 h to burn the coke formed with the decomposition of the template.
3.2. Catalyst Characterization
3.2.1. X-ray Diffraction
The X-ray diffraction measurements were conducted on a Shimadzu apparatus, model XRD-6000,using Cu Kα radiation (λ = 1.5418 Å) (Shimadzu, Kobe, Japan). The diffractograms were collected ina range from 1–50◦, with a scanning speed of 0.25◦ min−1. They were obtained at a constant powersource of 40 kV and 30 mA, at room temperature. The powder samples were analyzed without anyprevious treatment.
3.2.2. Temperature Programmed Desorption of Ammonia (TPD-NH3)
The measurement of the density and strength of the acid sites of the samples was carried out usingthe temperature programmed desorption (TPD-NH3). Initially, the ammonia was adsorbed at roomtemperature for 1 h. The samples were then heated at a rate of 10 ◦C/min to 150 ◦C for 1 h under Heflow to remove the poorly-adsorbed molecules. The ammonia desorption step was performed undera constant helium flow of 25 mL/min to 700 ◦C, using a heating rate of 10 ◦C/min. The equipmentused was the Chemisorb 2720, Pulse Chemisorption System, Micromeritics, equipped with a thermalconductivity detector (TCD), a quartz reactor, and gas supply system.
3.2.3. Thermogravimetric Analysis
The samples (2 mg of mass) were heated with a temperature ramp of 10◦C/min from ambienttemperature to 1000 ◦C in a Shimadzu apparatus, Model TGA-50 (Shimadzu, Kobe, Japan), under aconstant flow of 50 mL/min of nitrogen.
3.3. Catalytic Test
The pyrolysis experiments were performed on a multi-shot pyrolyzer model EGA/PY-3030D(Frontier Laboratories LTD, Fukushima, JPN) connected online with a GC-MS-5799 (Agilent, Santa Clara,CA, USA). In the thermal fast pyrolysis, 1.1 milligrams of pure lauric acid were used, whereas in thecatalytic pyrolysis tests, 1.1 mg of the lauric acid/catalyst mixture were used.
The mixture of the lauric acid with the catalyst was carried out with the addition of the fatty acidto the catalyst in the proportion 1:10 (m/m), by mechanical mixing. Subsequently, the mixture washeated to 60 ◦C, a temperature higher than the melting point of lauric acid (43 ◦C), and continuouslyhomogenized. This treatment allowed the lauric acid to migrate inside the pores of the catalysts.After this step, the mixture still in powder form was stored away from moisture, then added to thetitanium sample holder, and covered with quartz wool.
The samples were dropped by gravity into the pyrolysis furnace preheated to 650 ◦C under ahelium atmosphere and remained under these conditions for 20 s before an aliquot of the gaseousatmosphere was introduced into the analytical system. For the chromatographic analysis of theproducts, an HP-5MS column was used with a heating ramp comprising an initial temperature of40 ◦C for 3 minutes, followed by a ramp of 20 ◦C/min to 320 ◦C, with the temperature maintained for20 min. The rate of helium flow through the column was 2 mL/min. The temperature of the pyrolyzerinterface was 320 ◦C. The products obtained by GC/MS were identified based on the retention timesand by comparison with the standard mass spectral fragments of the National Institute of Standardsand Testing database.
4. Concluding Remarks
The presence of the catalysts modified the quantity and distribution of the products. The fastpyrolysis in the presence of catalysts based on mesoporous and microporous molecular sieves allowed
221
Catalysts 2019, 9, 418
the production of olefins in the gasoline range. Using both thermal and catalytic pyrolysis with theSAPO-5 catalyst, the conversion of dodecanoic acid was limited, 9% and 12%, respectively, and themain products were terminal olefins (C3–C11). In the presence of the Al-MCM-41 catalyst, the totalconversion of the lauric acid was observed, and the main products were internal and alkylated olefins,fundamental for both chemical and petrochemical industries.
Author Contributions: S.B. has conceived the project, funding acquisition, designed the experiments, analyzedthe data and written the paper. C.F. (Carolina Freitas), M.P., D.S. and N.F. have designed and performed theexperiments, analyzed the data and written the paper. E.S., R.F., C.F. (Camila Felix) and A.A.J. have designed theexperiments, analyzed the data and written the paper.
Funding: FAPESB (Bahia Research Foundation), project DTE 0043/2011, and CNPq, project 552367/2011-7 fundedthis research.
Acknowledgments: The authors are grateful to CNPq, FAPESB, and CAPES for scholarships and financial support.
Conflicts of Interest: The authors declare no conflict of interest.
References
1. De M. Araújo, A.M.; de O. Lima, R.; Gondim, A.D.; Diniz, J.; Di Souza, L.; de Araujo, A.S. Thermal andcatalytic pyrolysis of sunflower oil using AlMCM-41. Renew. Energy 2017, 101, 900–906.
2. Badoga, S.; Ganesan, A.; Dalai, A.K.; Chand, S. Effect of synthesis technique on the activity of CoNiMotri-metallic catalyst for hydrotreating of heavy gas oil. Catal. Today 2017, 291, 160–171. [CrossRef]
3. Rodrigues, T.O.; Rousset, P.; do Vale, A.T.; Broust, F. Bioóleo: Uma Alternativa para Valorização Energéticada Biomassa. Rev. Bras. Energ. 2011, 17, 39–56.
4. Maher, K.D.; Bressler, D.C. Pyrolysis of Triglyceride Materials for the Production of Renewable Fuels andChemicals. Bioresour. Technol. 2007, 98, 2351–2368. [CrossRef]
5. Wu, P.; Jiang, X.; Jin, Q.; Liu, F.; Zhang, J.; Zhu, Y.; Xia, L.; Shao, T.; Wang, K.; Li, T. Production of jet fuelrange biofuels by catalytic transformation of triglycerides based oils. Fuel 2017, 188, 205–211. [CrossRef]
6. Sonthalia, A.; Kumar, N. Hydroprocessed vegetable oil as a fuel for transportation sector: A review. J. EnergyInst. 2019, 82, 1–17. [CrossRef]
7. Bezergianni, S.; Dimitriadis, A.; Kikhtyanin, O.; Kubicka, D. Refinery co-processing of renewable feeds.Prog. Energy Comb. Sci. 2018, 68, 29–64. [CrossRef]
8. Kubicka, D.; Kikhtyanin, O. Opportunities for zeolites in biomass up-grading: Lessons from the refining andpetrochemical industry. Catal. Today 2015, 243, 10–22. [CrossRef]
9. Merdun, H.; Sezgin, I.V. Products distribution of catalytic co-pyrolysis of greenhouse vegetable waste andcoal. Energy 2018, 162, 953–963. [CrossRef]
10. Jahromi, H.; Agblevor, F.A. Hydrodeoxygenation of Aqueous-Phase Catalytic Pyrolysis Oil to LiquidHydrocarbons using Multifunctional Nickel catalysts. Ind. Eng. Chem. Res. 2018, 57, 13257–13268. [CrossRef]
11. Castille, A.; Bessette, C.; Thomas, F.; Eternad, M. Sustainable hydrocarbons production via simultaneouscondensation-hydrodeoxygenation of propionic acid with furfural over red mud-supported noble metalcatalysts. Catal. Commun. 2019, 121, 5–10. [CrossRef]
12. Wang, Y.; Dai, L.; Fan, L.; Cao, L.; Zhou, Y.; Zhao, Y.; Liu, Y.; Ruan, R. Catalytic co-pyrolysis of wastevegetable oil and high density polyethylene for hydrocarbon fuel production. Waste Manag. 2017, 61, 276–282.[CrossRef]
13. Abdelfattah, M.S.H.; Abu-Elyazeed, O.S.M.; Abdelazeem, M.A. On biodiesels from castor raw oil usingcatalytic pyrolysis. Energy 2018, 143, 950–960. [CrossRef]
14. Nash, C.P.; Ramanathan, A.; Ruddy, D.A.; Behl, M.; Gjersing, E.; Griffin, M.; Zhu, H.; Subramaniam, B.;Schaidle, J.A.; Hensley, J.E. Mixed alcohol dehydration over Brønsted and Lewis acidic catalysts. Appl. Catal.A Gen. 2016, 510, 110–124. [CrossRef]
15. Karnjanakom, G.; Suriya-umporn, S.; Bayu, T.; Kongparakul, A.; Samart, S.; Fushimi, C.; Abudula, C.;Guan, A. High selectivity and stability of Mg-doped Al-MCM-41 for in-situ catalytic upgrading fast pyrolysisbio-oil. Energy Convers. Manag. 2017, 142, 272–285. [CrossRef]
222
Catalysts 2019, 9, 418
16. De Azevedo, A.F., Jr. Desenvolvimento de Catalisadores a Base de SAPO-5 Para Avaliação na Reação deFast Pirólise de Compostos Graxos. Ph.D. Thesis, Universidade Federal da Bahia (UFBA), Salvador, Brazil,24 Auguest 2014.
17. Bandyopadhyay, R.; Bandyopadhyay, M.; Kubota, Y.; Sugi, Y. Synthesis of AlPO4 Molecular Sieves with AFIand AEL Structures by Dry-Gel Conversion Method and Catalytic Application of Their SAPO Counterpartson Isopropylation of Biphenyl. J. Porous Mat. 2002, 9, 83–95. [CrossRef]
18. Vieira, S.S. Produção de Biodiesel via Esterificação de Ácidos Graxos Livres Utilizando CatalisadoresHeterogêneos Ácidos. Ph.D. Thesis, Universidade Federal de Lavras (UFLA), Lavras, Brazil, 24 February 2011.
19. Yu, F.; Gao, L.; Wang, W.; Zhang, G.; Ji, J. Bio-fuel production from the catalytic pyrolysis of soybean oilover Me-Al-MCM-41 (Me = La, Ni or Fe) mesoporous materials. J. Anal. Appl. Pyrolysis 2013, 104, 325–329.[CrossRef]
20. Barbosa, F.A.; dos Santos, A.C.B.; da Silva, M.I.P.; Stumbo, A.M. Resistance to poisoning by nitrogencompounds of NiMo/Al-MCM-41 hydrocracking catalysts. Catal. Today 2004, 98, 109–113. [CrossRef]
21. Liu, C.W.; Hu, W.W.; Yang, B.H.; Tong, Y.; Zhu, D.M.; Zhang, L.F.; Zhao, R. N Study on the effect of metaltypes in (Me)-Al-MCM-41 on the mesoporous structure and catalytic behavior during the vapor-catalyzedco-pyrolysis of pubescens and LDPE. Appl. Catal. B Environ. 2013, 129, 202–213. [CrossRef]
22. Intana, T.; Föttinger, K.; Rupprechter, G.; Kongkachuichay, P. Physicochemical properties of Cu loaded ontocore-shell Al-MCM-41: Effect of loading methods. Colloids Surf. A Physicochem. Eng. Asp. 2015, 467, 157–165.[CrossRef]
23. Benítez-Guerrero, M.; López-Beceiro, J.; Sánchez-Jiménez, P.E.; Pascual-Cosp, J. Comparison of thermalbehavior of natural and hot-washed sisal fibers based on their main components: Cellulose, xylan and lignin.TG-FTIR analysis of volatile products. Thermochim. Acta 2014, 581, 70–86. [CrossRef]
24. Zafar, R.; Watson, J.S. Adsorption of tetradecanoic acid on kaolinite minerals: Using fast pyrolysis tocharacterize the catalytic efficiency of clay mineral adsorbed fatty acids. Chem. Geol. 2017, 471, 111–118.[CrossRef]
25. Souza, M.J.B.; Marinkovic, B.A.; Jardim, P.M.; Araujo, A.S.; Pedrosa, A.M.G.; Souza, R.R. HDS of thiopheneover CoMo/AlMCM-41 with different Si/Al ratios. Appl. Catal. A Gen. 2007, 316, 212–218. [CrossRef]
© 2019 by the authors. Licensee MDPI, Basel, Switzerland. This article is an open accessarticle distributed under the terms and conditions of the Creative Commons Attribution(CC BY) license (http://creativecommons.org/licenses/by/4.0/).
223

catalysts
Article
Dibenzothiophene Hydrodesulfurization overP-CoMo on Sol-Gel Alumina Modified by LaAddition. Effect of Rare-Earth Content
José Escobar 1,* , María C. Barrera 2, Jaime S. Valente 1 , Dora A. Solís-Casados 3,
Víctor Santes 4 , José E. Terrazas 2 and Benoit A.R. Fouconnier 2
1 Instituto Mexicano del Petróleo, Eje Central Lázaro Cárdenas 152, San Bartolo Atepehuacan, G.A. Madero,Cd. de México 07730, México; [email protected]
2 Facultad de Ciencias Químicas-Centro de Investigación en Recursos Energéticos y Sustentables, UniversidadVeracruzana, Campus Coatzacoalcos, Av. Universidad km. 7.5, Col. Santa Isabel, Coatzacoalcos, Veracruz96538, México; [email protected] (M.C.B.); [email protected] (J.E.T.); [email protected] (B.A.R.F.)
3 Universidad Autónoma del Estado de México. Centro Conjunto de Investigación en Química Sustentable,km. 14.5 Carretera Toluca-Atlacomulco, Toluca, Estado de México 50200, México;[email protected]
4 Departamento de Biociencias e Ingeniería, Centro Interdisciplinario de Investigaciones y Estudios en MedioAmbiente y Desarrollo (CIIEMAD), Instituto Politécnico Nacional, Ciudad de México C.P. 07340, México;[email protected]
* Correspondence: [email protected]
Received: 11 March 2019; Accepted: 9 April 2019; Published: 13 April 2019
Abstract: Alumina-lanthana (La at 1, 3, or 5 wt%) supports were prepared by sol-gel from Al alkoxidesol where La(NO3)3 was added. Annealed (550 ◦C) xerogels were characterized by N2 physisorption,thermal analysis (TG-DTA), X-ray diffraction (XRD), scanning electron microscopy- energy dispersivespectroscopy (SEM-EDS), CO2-adsorption studied in IR region, Raman and ultraviolet-vis (UV-vis)spectroscopies. The texture of amorphous binary matrices of high La dispersion was adequate toapplications in catalysts for middle distillates hydrodesulfurization (HDS). Generally, the amountand strength of surface basic sites increased with La content in solids. Mo (at 2.8 at. nm−2) and Co(at Co/(Co+Mo) = 0.3) were deposited over carriers by one-pot simultaneous impregnation in thepresence of PO4
3− (P2O5/(NiO+MoO3) = 0.2 mass ratio). Calcined (400 ◦C) Co-Mo-P impregnatedprecursors had decreased basicity as to that of corresponding carriers, suggesting strong La-depositedspecies interaction. As La content in carriers increased Mo=O Raman stretching vibrations shiftedto lower wave-numbers (949 to 935 cm−1) suggesting octahedral molybdates coordination changeto tetrahedral. Although La at the lowest concentration (1 wt%) enhanced dibenzothiophene, HDS(~38% higher as to the Al2O3-supported formulation) desulfurization was significantly diminished ataugmented content. Presence of hardly sulfidable tetrahedral Mo originated during impregnation atbasic conditions in pores of La-modified carriers seemed to dictate observed behavior. Rare earthcontent in formulations enhanced selectivity to biphenyl.
Keywords: hydrodesulfurization; CoMo/Al2O3; basic additive; lanthanum
1. Introduction
Improved catalytic formulations of enhanced properties in hydrodesulfurization (HDS) reactionsthat allow for compliance with ever stricter environmental regulations on S content in internalcombustion engine fuels remains a challenging research field. In this context, one of the most relevantlines of investigation involves preparation of improved catalyst supports, where conventional activephases used in formulations applied at the industrial hydrotreating scale (sulfided Mo or W promoted
Catalysts 2019, 9, 359; doi:10.3390/catal9040359 www.mdpi.com/journal/catalysts225
Catalysts 2019, 9, 359
by either Co or Ni) could have enhanced properties, including better dispersion and sulfidability ormore efficient promoter integration [1–3]. In this regard, the effects of using carriers with augmentedsurface basicity, as to that of conventionally used alumina, still remains a matter of debate. Some reportshave shown that over carriers of increased basicity, by alkaline [4] or alkaline-earth metal [5] speciesaddition, catalysts of enhanced selectivity to desulfurization and limited hydrogenating propertiescould be obtained. That effect has been attributed to several factors, for instance, decreased surfaceacidity by basic agent addition [4] or formation of oxidic species (magnesium molybdate and NiO-MgOsolid solution, [5]) that resulted after sulfiding in MoS2 (from MgMoO4, for example) phases ofincreased slab length and diminished saturation ability. However, decreased activity for organo-Sspecies desulfurization (thiophene) was also observed [4], although in a lower degree, as to thatregistered for alkenes hydrogenation. Formation of K-decorated and K-intercalated MoS2 phasessupported on SBA-15 mesoporous materials of enhanced activity and selectivity to methanethiol from aH2S-CH4 mixture have been recently reported [6]. According to the authors, electron donation from Katoms could enhance the electron density of sulfided Mo species that facilitated formation of increasedamounts of Mo-coordinatively unsaturated sites (CUS).
Environmentally friendly lanthanum is a cheap rare earth that has been added to catalyst carriersin order to increase their thermal resistance [7] and surface basicity [8]. For instance, decreased acidityof alumina-La oxides contributed to augmented stability in ethanol conversion, due to diminishedcoke formation [9]. Also, due to that diminished acidity, corresponding rare-earth-modified Al2O3 hadenhanced selectivity to ethylene (instead of to carbonaceous species) at high ethanol conversion [10].Augmented basicity provoked by La addition also resulted in improved activity in a rare-earth-modifiedNi/alumina formulation tested in CO2 methanation, that fact being originated by stronger carbondioxide adsorption as surface carbonates that acted as so-called reactant reservoirs [11]. Higherstability of La-modified HZSM-5 zeolite catalysts in methyl mercaptan decomposition, as to that of thenon-doped material, has been attributed to decreased Brønsted acidity [12].
Regarding lanthanum-containing formulations applied as HDS catalysts carriers, to our bestknowledge, the information available is rather scarce [13,14]. Diminished activity in thiophene HDSof sulfided CoMo/alumina catalysts modified by La has been attributed to enhanced proportions ofisolated MoO4
2− refractory and less-sulfidable species adsorbed on lanthana domains [14]. From theirstudies on molybdenum supported on La-modified alumina, Massoth et al. [13] found that stronginteraction of rare earth oxidic domains with Al2O3 resulted in LaO monolayer dispersion. At high Laloadings, however, a second lanthanum oxide layer could be formed right over the first, the latter beingpartially sulfidable under 10% H2S/H2 treatment (400 ◦C, 2 h). Higher activity, as to that of non-dopedalumina-supported sulfided Mo catalysts, in both thiophene conversion and hexene saturation wasfound for formulations of high-La content (≥ 10 wt%). Different trends in those reactions, as a functionof rare-earth concentration in tested formulations, were related to electronic support effects, whichaffected those reactions in distinctive ways. Also, a diminished proportion of disintegration reactionswas observed, decreased cracking being originated by the neutralization of surface acidic sites overalumina, due to the basic agent deposition. Considering those contradictory results, the influence ofbasic La as a carrier additive on HDS catalyst properties deserves further investigation.
Respecting HDS catalysts’ active phases (as opposed to corresponding supports), Chevrel phases(MxMo6S8, where M could be La) have been synthesized and tested in HDS reaction schemes [15].Different to conventional MoS2-based hydrodesulfurization catalysts, where Mo is in 4+ oxidation state,in Chevrel phases Mo is in either 2+ or 2.666+, depending on the type of second metal M. In general,HDS properties of Chevrel phases are not as good as those of MoS2-based catalysts, which explainswhy studies on those species (and particularly on those where La is the second metal) are very scarce.
In this work, lanthana modified-alumina at various rare-earth contents (1, 3, and 5 wt%) isused as CoMo-based HDS catalyst support. Textural, structural, and surface properties of carriersand corresponding impregnated materials, in an oxidic phase, were characterized through varioustechniques. Sulfided materials were tested in dibenzothiophene (most representative organo-S species
226
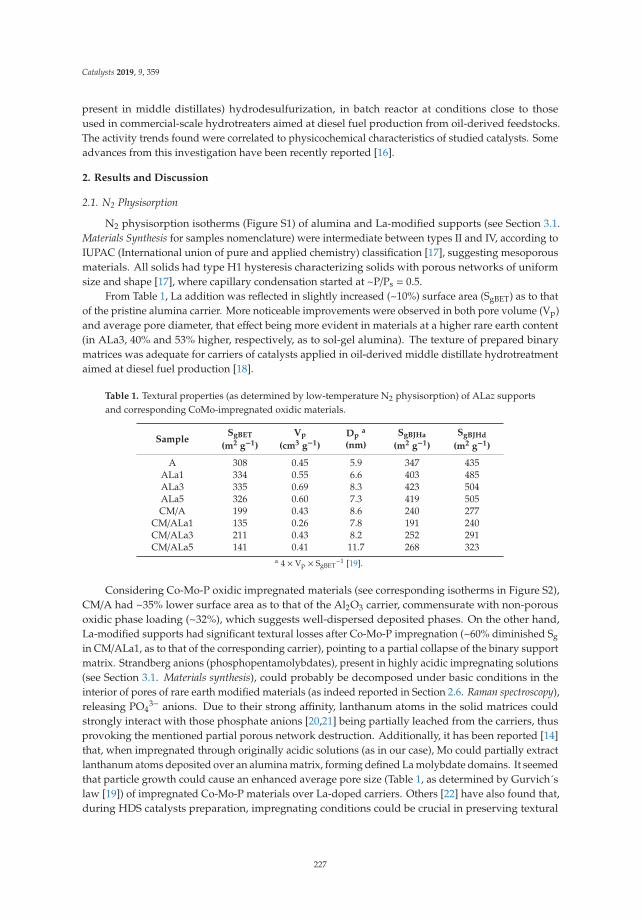
Catalysts 2019, 9, 359
present in middle distillates) hydrodesulfurization, in batch reactor at conditions close to thoseused in commercial-scale hydrotreaters aimed at diesel fuel production from oil-derived feedstocks.The activity trends found were correlated to physicochemical characteristics of studied catalysts. Someadvances from this investigation have been recently reported [16].
2. Results and Discussion
2.1. N2 Physisorption
N2 physisorption isotherms (Figure S1) of alumina and La-modified supports (see Section 3.1.Materials Synthesis for samples nomenclature) were intermediate between types II and IV, according toIUPAC (International union of pure and applied chemistry) classification [17], suggesting mesoporousmaterials. All solids had type H1 hysteresis characterizing solids with porous networks of uniformsize and shape [17], where capillary condensation started at ~P/Ps = 0.5.
From Table 1, La addition was reflected in slightly increased (~10%) surface area (SgBET) as to thatof the pristine alumina carrier. More noticeable improvements were observed in both pore volume (Vp)and average pore diameter, that effect being more evident in materials at a higher rare earth content(in ALa3, 40% and 53% higher, respectively, as to sol-gel alumina). The texture of prepared binarymatrices was adequate for carriers of catalysts applied in oil-derived middle distillate hydrotreatmentaimed at diesel fuel production [18].
Table 1. Textural properties (as determined by low-temperature N2 physisorption) of ALaz supportsand corresponding CoMo-impregnated oxidic materials.
SampleSgBET
(m2 g−1)
Vp
(cm3 g−1)
Dpa
(nm)
SgBJHa
(m2 g−1)
SgBJHd
(m2 g−1)
A 308 0.45 5.9 347 435ALa1 334 0.55 6.6 403 485ALa3 335 0.69 8.3 423 504ALa5 326 0.60 7.3 419 505CM/A 199 0.43 8.6 240 277
CM/ALa1 135 0.26 7.8 191 240CM/ALa3 211 0.43 8.2 252 291CM/ALa5 141 0.41 11.7 268 323
a 4 × Vp × SgBET−1 [19].
Considering Co-Mo-P oxidic impregnated materials (see corresponding isotherms in Figure S2),CM/A had ~35% lower surface area as to that of the Al2O3 carrier, commensurate with non-porousoxidic phase loading (~32%), which suggests well-dispersed deposited phases. On the other hand,La-modified supports had significant textural losses after Co-Mo-P impregnation (~60% diminished Sg
in CM/ALa1, as to that of the corresponding carrier), pointing to a partial collapse of the binary supportmatrix. Strandberg anions (phosphopentamolybdates), present in highly acidic impregnating solutions(see Section 3.1. Materials synthesis), could probably be decomposed under basic conditions in theinterior of pores of rare earth modified materials (as indeed reported in Section 2.6. Raman spectroscopy),releasing PO4
3− anions. Due to their strong affinity, lanthanum atoms in the solid matrices couldstrongly interact with those phosphate anions [20,21] being partially leached from the carriers, thusprovoking the mentioned partial porous network destruction. Additionally, it has been reported [14]that, when impregnated through originally acidic solutions (as in our case), Mo could partially extractlanthanum atoms deposited over an alumina matrix, forming defined La molybdate domains. It seemedthat particle growth could cause an enhanced average pore size (Table 1, as determined by Gurvich´slaw [19]) of impregnated Co-Mo-P materials over La-doped carriers. Others [22] have also found that,during HDS catalysts preparation, impregnating conditions could be crucial in preserving textural
227
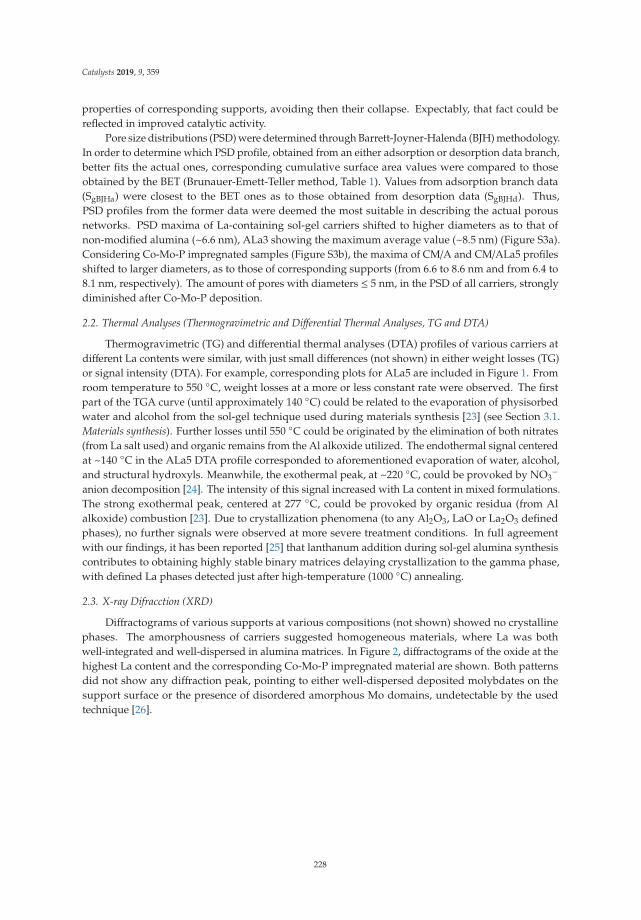
Catalysts 2019, 9, 359
properties of corresponding supports, avoiding then their collapse. Expectably, that fact could bereflected in improved catalytic activity.
Pore size distributions (PSD) were determined through Barrett-Joyner-Halenda (BJH) methodology.In order to determine which PSD profile, obtained from an either adsorption or desorption data branch,better fits the actual ones, corresponding cumulative surface area values were compared to thoseobtained by the BET (Brunauer-Emett-Teller method, Table 1). Values from adsorption branch data(SgBJHa) were closest to the BET ones as to those obtained from desorption data (SgBJHd). Thus,PSD profiles from the former data were deemed the most suitable in describing the actual porousnetworks. PSD maxima of La-containing sol-gel carriers shifted to higher diameters as to that ofnon-modified alumina (~6.6 nm), ALa3 showing the maximum average value (~8.5 nm) (Figure S3a).Considering Co-Mo-P impregnated samples (Figure S3b), the maxima of CM/A and CM/ALa5 profilesshifted to larger diameters, as to those of corresponding supports (from 6.6 to 8.6 nm and from 6.4 to8.1 nm, respectively). The amount of pores with diameters ≤ 5 nm, in the PSD of all carriers, stronglydiminished after Co-Mo-P deposition.
2.2. Thermal Analyses (Thermogravimetric and Differential Thermal Analyses, TG and DTA)
Thermogravimetric (TG) and differential thermal analyses (DTA) profiles of various carriers atdifferent La contents were similar, with just small differences (not shown) in either weight losses (TG)or signal intensity (DTA). For example, corresponding plots for ALa5 are included in Figure 1. Fromroom temperature to 550 ◦C, weight losses at a more or less constant rate were observed. The firstpart of the TGA curve (until approximately 140 ◦C) could be related to the evaporation of physisorbedwater and alcohol from the sol-gel technique used during materials synthesis [23] (see Section 3.1.Materials synthesis). Further losses until 550 ◦C could be originated by the elimination of both nitrates(from La salt used) and organic remains from the Al alkoxide utilized. The endothermal signal centeredat ~140 ◦C in the ALa5 DTA profile corresponded to aforementioned evaporation of water, alcohol,and structural hydroxyls. Meanwhile, the exothermal peak, at ~220 ◦C, could be provoked by NO3
−anion decomposition [24]. The intensity of this signal increased with La content in mixed formulations.The strong exothermal peak, centered at 277 ◦C, could be provoked by organic residua (from Alalkoxide) combustion [23]. Due to crystallization phenomena (to any Al2O3, LaO or La2O3 definedphases), no further signals were observed at more severe treatment conditions. In full agreementwith our findings, it has been reported [25] that lanthanum addition during sol-gel alumina synthesiscontributes to obtaining highly stable binary matrices delaying crystallization to the gamma phase,with defined La phases detected just after high-temperature (1000 ◦C) annealing.
2.3. X-ray Difracction (XRD)
Diffractograms of various supports at various compositions (not shown) showed no crystallinephases. The amorphousness of carriers suggested homogeneous materials, where La was bothwell-integrated and well-dispersed in alumina matrices. In Figure 2, diffractograms of the oxide at thehighest La content and the corresponding Co-Mo-P impregnated material are shown. Both patternsdid not show any diffraction peak, pointing to either well-dispersed deposited molybdates on thesupport surface or the presence of disordered amorphous Mo domains, undetectable by the usedtechnique [26].
228
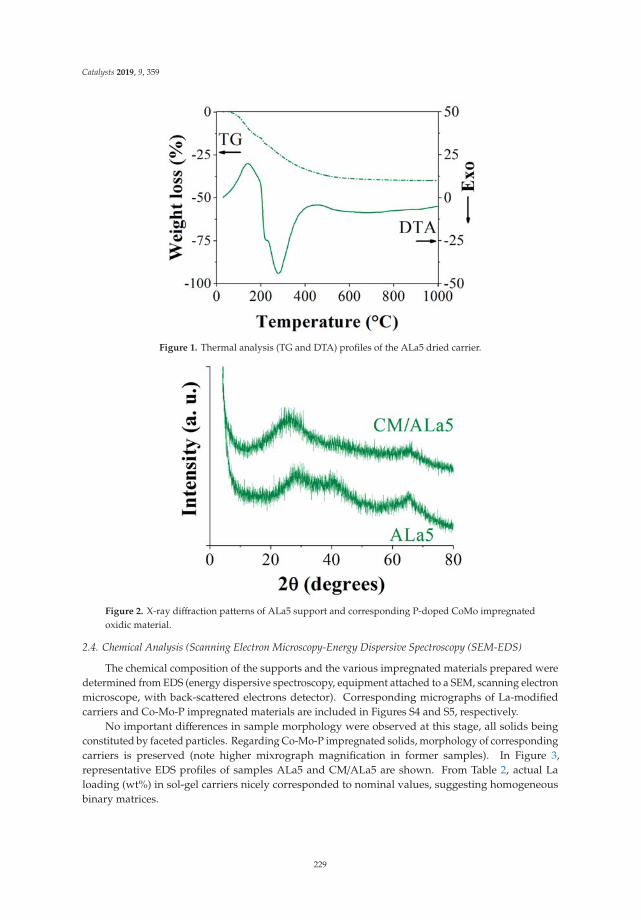
Catalysts 2019, 9, 359
Figure 1. Thermal analysis (TG and DTA) profiles of the ALa5 dried carrier.
Figure 2. X-ray diffraction patterns of ALa5 support and corresponding P-doped CoMo impregnatedoxidic material.
2.4. Chemical Analysis (Scanning Electron Microscopy-Energy Dispersive Spectroscopy (SEM-EDS)
The chemical composition of the supports and the various impregnated materials prepared weredetermined from EDS (energy dispersive spectroscopy, equipment attached to a SEM, scanning electronmicroscope, with back-scattered electrons detector). Corresponding micrographs of La-modifiedcarriers and Co-Mo-P impregnated materials are included in Figures S4 and S5, respectively.
No important differences in sample morphology were observed at this stage, all solids beingconstituted by faceted particles. Regarding Co-Mo-P impregnated solids, morphology of correspondingcarriers is preserved (note higher mixrograph magnification in former samples). In Figure 3,representative EDS profiles of samples ALa5 and CM/ALa5 are shown. From Table 2, actual Laloading (wt%) in sol-gel carriers nicely corresponded to nominal values, suggesting homogeneousbinary matrices.
229
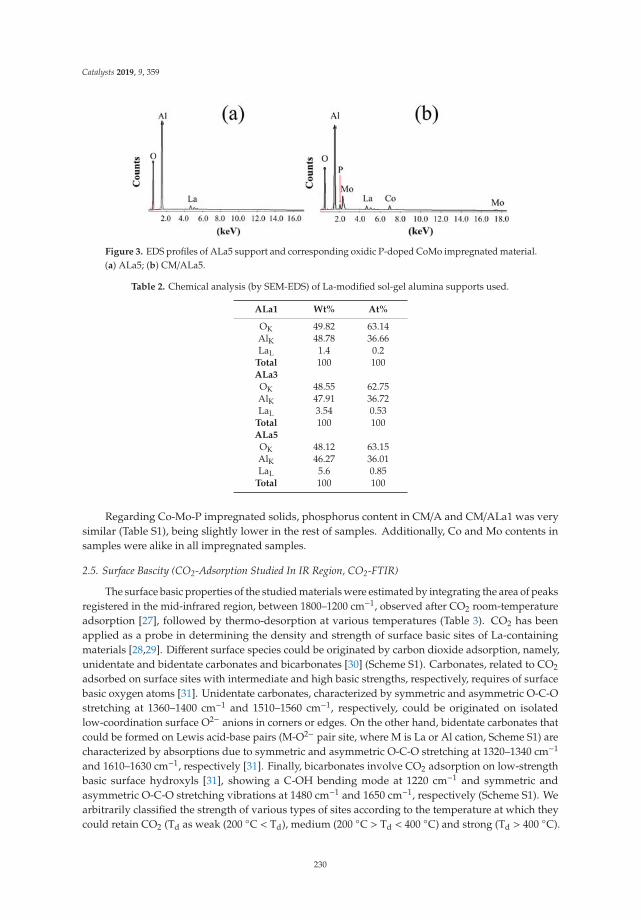
Catalysts 2019, 9, 359
Figure 3. EDS profiles of ALa5 support and corresponding oxidic P-doped CoMo impregnated material.(a) ALa5; (b) CM/ALa5.
Table 2. Chemical analysis (by SEM-EDS) of La-modified sol-gel alumina supports used.
ALa1 Wt% At%
OK 49.82 63.14AlK 48.78 36.66LaL 1.4 0.2
Total 100 100ALa3
OK 48.55 62.75AlK 47.91 36.72LaL 3.54 0.53
Total 100 100ALa5
OK 48.12 63.15AlK 46.27 36.01LaL 5.6 0.85
Total 100 100
Regarding Co-Mo-P impregnated solids, phosphorus content in CM/A and CM/ALa1 was verysimilar (Table S1), being slightly lower in the rest of samples. Additionally, Co and Mo contents insamples were alike in all impregnated samples.
2.5. Surface Bascity (CO2-Adsorption Studied In IR Region, CO2-FTIR)
The surface basic properties of the studied materials were estimated by integrating the area of peaksregistered in the mid-infrared region, between 1800–1200 cm−1, observed after CO2 room-temperatureadsorption [27], followed by thermo-desorption at various temperatures (Table 3). CO2 has beenapplied as a probe in determining the density and strength of surface basic sites of La-containingmaterials [28,29]. Different surface species could be originated by carbon dioxide adsorption, namely,unidentate and bidentate carbonates and bicarbonates [30] (Scheme S1). Carbonates, related to CO2
adsorbed on surface sites with intermediate and high basic strengths, respectively, requires of surfacebasic oxygen atoms [31]. Unidentate carbonates, characterized by symmetric and asymmetric O-C-Ostretching at 1360–1400 cm−1 and 1510–1560 cm−1, respectively, could be originated on isolatedlow-coordination surface O2− anions in corners or edges. On the other hand, bidentate carbonates thatcould be formed on Lewis acid-base pairs (M-O2− pair site, where M is La or Al cation, Scheme S1) arecharacterized by absorptions due to symmetric and asymmetric O-C-O stretching at 1320–1340 cm−1
and 1610–1630 cm−1, respectively [31]. Finally, bicarbonates involve CO2 adsorption on low-strengthbasic surface hydroxyls [31], showing a C-OH bending mode at 1220 cm−1 and symmetric andasymmetric O-C-O stretching vibrations at 1480 cm−1 and 1650 cm−1, respectively (Scheme S1). Wearbitrarily classified the strength of various types of sites according to the temperature at which theycould retain CO2 (Td as weak (200 ◦C < Td), medium (200 ◦C > Td < 400 ◦C) and strong (Td > 400 ◦C).
230
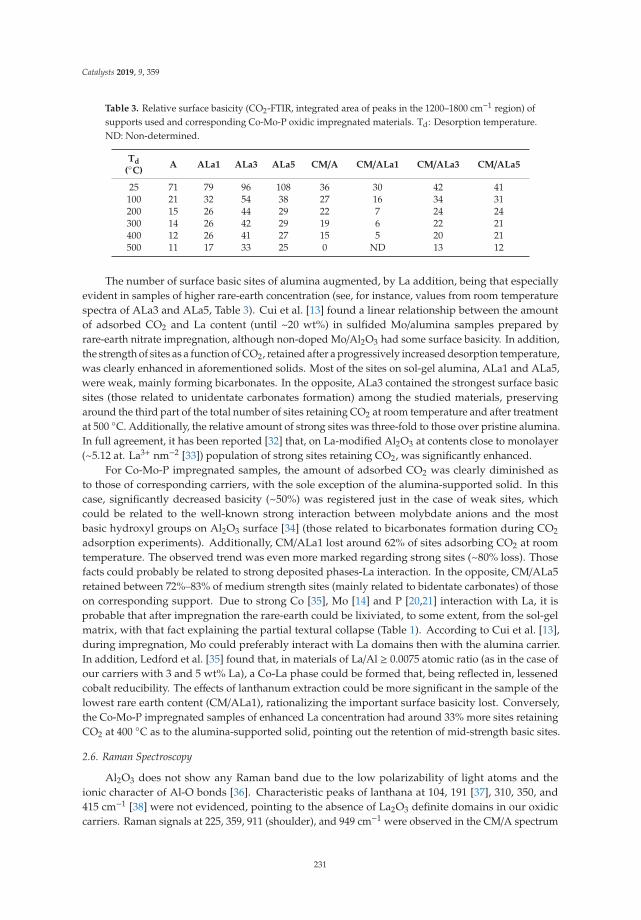
Catalysts 2019, 9, 359
Table 3. Relative surface basicity (CO2-FTIR, integrated area of peaks in the 1200–1800 cm−1 region) ofsupports used and corresponding Co-Mo-P oxidic impregnated materials. Td: Desorption temperature.ND: Non-determined.
Td
(◦C)A ALa1 ALa3 ALa5 CM/A CM/ALa1 CM/ALa3 CM/ALa5
25 71 79 96 108 36 30 42 41100 21 32 54 38 27 16 34 31200 15 26 44 29 22 7 24 24300 14 26 42 29 19 6 22 21400 12 26 41 27 15 5 20 21500 11 17 33 25 0 ND 13 12
The number of surface basic sites of alumina augmented, by La addition, being that especiallyevident in samples of higher rare-earth concentration (see, for instance, values from room temperaturespectra of ALa3 and ALa5, Table 3). Cui et al. [13] found a linear relationship between the amountof adsorbed CO2 and La content (until ~20 wt%) in sulfided Mo/alumina samples prepared byrare-earth nitrate impregnation, although non-doped Mo/Al2O3 had some surface basicity. In addition,the strength of sites as a function of CO2, retained after a progressively increased desorption temperature,was clearly enhanced in aforementioned solids. Most of the sites on sol-gel alumina, ALa1 and ALa5,were weak, mainly forming bicarbonates. In the opposite, ALa3 contained the strongest surface basicsites (those related to unidentate carbonates formation) among the studied materials, preservingaround the third part of the total number of sites retaining CO2 at room temperature and after treatmentat 500 ◦C. Additionally, the relative amount of strong sites was three-fold to those over pristine alumina.In full agreement, it has been reported [32] that, on La-modified Al2O3 at contents close to monolayer(~5.12 at. La3+ nm−2 [33]) population of strong sites retaining CO2, was significantly enhanced.
For Co-Mo-P impregnated samples, the amount of adsorbed CO2 was clearly diminished asto those of corresponding carriers, with the sole exception of the alumina-supported solid. In thiscase, significantly decreased basicity (~50%) was registered just in the case of weak sites, whichcould be related to the well-known strong interaction between molybdate anions and the mostbasic hydroxyl groups on Al2O3 surface [34] (those related to bicarbonates formation during CO2
adsorption experiments). Additionally, CM/ALa1 lost around 62% of sites adsorbing CO2 at roomtemperature. The observed trend was even more marked regarding strong sites (~80% loss). Thosefacts could probably be related to strong deposited phases-La interaction. In the opposite, CM/ALa5retained between 72%–83% of medium strength sites (mainly related to bidentate carbonates) of thoseon corresponding support. Due to strong Co [35], Mo [14] and P [20,21] interaction with La, it isprobable that after impregnation the rare-earth could be lixiviated, to some extent, from the sol-gelmatrix, with that fact explaining the partial textural collapse (Table 1). According to Cui et al. [13],during impregnation, Mo could preferably interact with La domains then with the alumina carrier.In addition, Ledford et al. [35] found that, in materials of La/Al ≥ 0.0075 atomic ratio (as in the case ofour carriers with 3 and 5 wt% La), a Co-La phase could be formed that, being reflected in, lessenedcobalt reducibility. The effects of lanthanum extraction could be more significant in the sample of thelowest rare earth content (CM/ALa1), rationalizing the important surface basicity lost. Conversely,the Co-Mo-P impregnated samples of enhanced La concentration had around 33% more sites retainingCO2 at 400 ◦C as to the alumina-supported solid, pointing out the retention of mid-strength basic sites.
2.6. Raman Spectroscopy
Al2O3 does not show any Raman band due to the low polarizability of light atoms and theionic character of Al-O bonds [36]. Characteristic peaks of lanthana at 104, 191 [37], 310, 350, and415 cm−1 [38] were not evidenced, pointing to the absence of La2O3 definite domains in our oxidiccarriers. Raman signals at 225, 359, 911 (shoulder), and 949 cm−1 were observed in the CM/A spectrum
231

Catalysts 2019, 9, 359
(Figure 4a). The former two signals could be assigned to Mo-O-Mo and O-Mo-O vibrations [39].Meanwhile, those at higher wavenumbers were related to Mo=O bands. They were ascribed toAnderson species Al(OH)6Mo6O18
3− [40], whose presence suggested partial support dissolutionduring contact with the acidic Co-Mo-P impregnating solution (pH ~2.5). Considering the Mo/P ratioin those solutions (~2.0) and their pH, H2P2Mo5O23
4− anions (two PO4 tetrahedrons surrounded byfive interconnected octahedral MoO6 species) could, very probably, be preferentially present [40,41].Although, due to their stability, those Strandberg heteropolyanions (HxP2Mo5O23
(6−x)−) [42] couldexist in various protonation states over a wide pH range [41], they could be decomposed to phosphatesand molybdates owing to their strong interaction with both basic hydroxyls and Al3+ coordinativelyunsaturated (CUS) Lewis acid sites on alumina surfaces [43].
Figure 4. Raman spectra of oxidic Co-Mo-P impregnated materials. (a) CM/A and CM/ALa5;(b) CM/ALa1 and CM/ALa3.
In spite of some fluorescence interference that decreased sensitivity of the technique used,CM/ALa1 and CM/ALa3, Raman spectra (Figure 4b) evidenced that the signal related to M=Ostretching vibrations progressively shifted to a lower wavelength as the rare earth concentrationincreased, being registered at 935 cm−1 for CM/ALa5 (as compared to 949 cm−1 observed in CM/Aspectrum, Figure 4a). That fact, accompanied by the apparition of a signal at 321 cm−1 (more evidentin CM/ALa5), strongly suggested the co-existence of both octahedral and tetrahedral Mo species inLa-containing samples. In full agreement, Payen et al. [14] reported that the Mo/ La ratio determined thetype of oxomolybdenum entities adsorbed on lanthanum-modified alumina. Monomeric tetrahedralspecies (MoO4
2−) could be preferably formed by an interaction with La-OH groups, whereas polymericoctahedral molybdates could be deposited on Al2O3 domains. For materials at a high La concentration(Mo/La~1), just tetrahedral molybdates were observed [14]. In the same line, tetrahedral Mo specieswere mainly found [44] on basic magnesium-modified sol-gel alumina supports. It seemed that thehigh point of zero charge values of carriers with basic properties determined that behavior, as in contactwith water those solids could produce high pH impregnating conditions where MoO4
2− species arefavored. Additionally, coordination state modifications of Mo6+ species, from octahedral to tetrahedral(as determined by corresponding Raman shifts), by basic additive doping of alumina-supportedunpromoted Mo (Mg, [5]) and CoMo formulations have been reported by others (K [45], Mg-Li [46]).
Definite domains (although not large enough to be detectable by X-ray diffraction) of lanthanummolybdate have also been registered [14] by impregnating La-modified alumina with acidic solutionsprepared from ammonium heptamolybdate. In our case, contributions of characteristic bands at 915and 940 cm−1 could not be discarded, although, due to the low intensity of the registered peaks, theycould remain masked. If existent, La2(Mo4)3-like domains could also be responsible for tetrahedralmolybdenum presence [47]. According to the peaks’ intensity in spectra, in Figure 4a,b, it seemed thatsamples CM/ALa1 and CM/ALa5 were the ones with the highest Mo dispersion (although with a high
232

Catalysts 2019, 9, 359
proportion of tetrahedral species). Small signals, at 1119 cm−1, could be related to C-C bond stretchingvibrations [48], probably originated by organic remains from either aluminum alkoxide used duringcarrier synthesis or due to acetate utilized during Co impregnation.
2.7. UV-Vis Spectroscopy
Being an insulator alumina does not absorb in ultraviolet-visible (UV-vis) region [49]. Absorptionsin the 267–306 nm range (more notable for ALa1, Figure 5) could be related to charge transfer fromO2− to framework La3+ ions [50]. Regarding Co-Mo-P impregnated materials, the O−2 →Mo6+ chargetransfer transition bands of tetrahedral (Mo(Th)
6+) and octahedral (Mo(Oh)6+) molybdenum species
were centered at ~280 and ~314 nm, respectively [51] (Figure 6). That fact suggests that, althoughbasic pH conditions that prevailed during Co-Mo-P impregnation of rare-earth-containing carriersstrongly contributed to formation of isolated monomeric Mo(Th)
6+ species (Figure 4a,b), Mo(Oh)6+
species co-existed with them, as already suggested by our Raman spectroscopy studies (Section 2.6).As proposed by Payen et al. [14], Mo(Th)
6+ species, related to molybdenum in strong interaction withthe support, could be related to La domains, whereas Mo(Oh)
6+ ones could be deposited on aluminasurfaces. As the former species were absent in the impregnating solutions (containing octahedral Mo6+
heteropolyanions) their presence strongly pointed to the decomposition of the Strandberg speciesthrough their interaction with basic OH groups and CUS (Lewis sites) on the Al2O3 carrier surface [43].As aforementioned, basic conditions prevalent in the pores of La-modified carriers could also play amajor role in tetrahedral Mo6+ species formation. The bathochromic shift of the Mo(Oh)
6+ low-energyabsorption edge strongly suggested an augmented oxomolybdates polymerization degree [52] inLa-containing formulations as to that in CM/A following the order: CM/ALa1 > CM/ALa3 > CM/ALa5> CM/A. The diminished surface area of lanthanum-modified CM materials (Table 1) could contributeto lowered octahedral Mo species dispersion. Indeed, a shoulder at ~370 nm, whose intensityincreased according to the order CM/ALa1 > CM/ALa3 > CM/ALa5, pointed to the formation of MoO3
domains [53].
Figure 5. UV-vis spectra of La-modified alumina supports.
233
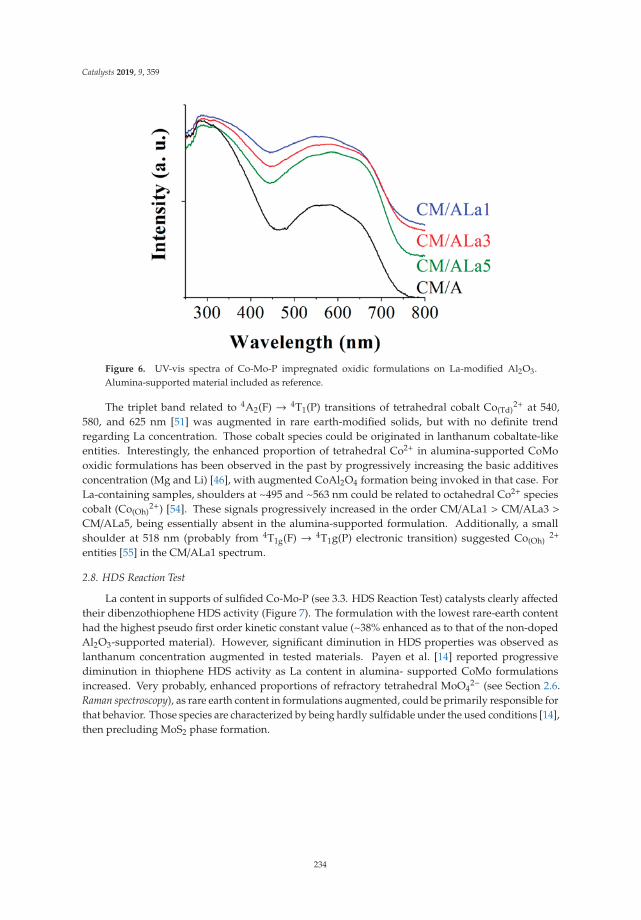
Catalysts 2019, 9, 359
Figure 6. UV-vis spectra of Co-Mo-P impregnated oxidic formulations on La-modified Al2O3.Alumina-supported material included as reference.
The triplet band related to 4A2(F) → 4T1(P) transitions of tetrahedral cobalt Co(Td)2+ at 540,
580, and 625 nm [51] was augmented in rare earth-modified solids, but with no definite trendregarding La concentration. Those cobalt species could be originated in lanthanum cobaltate-likeentities. Interestingly, the enhanced proportion of tetrahedral Co2+ in alumina-supported CoMooxidic formulations has been observed in the past by progressively increasing the basic additivesconcentration (Mg and Li) [46], with augmented CoAl2O4 formation being invoked in that case. ForLa-containing samples, shoulders at ~495 and ~563 nm could be related to octahedral Co2+ speciescobalt (Co(Oh)
2+) [54]. These signals progressively increased in the order CM/ALa1 > CM/ALa3 >CM/ALa5, being essentially absent in the alumina-supported formulation. Additionally, a smallshoulder at 518 nm (probably from 4T1g(F) → 4T1g(P) electronic transition) suggested Co(Oh)
2+
entities [55] in the CM/ALa1 spectrum.
2.8. HDS Reaction Test
La content in supports of sulfided Co-Mo-P (see 3.3. HDS Reaction Test) catalysts clearly affectedtheir dibenzothiophene HDS activity (Figure 7). The formulation with the lowest rare-earth contenthad the highest pseudo first order kinetic constant value (~38% enhanced as to that of the non-dopedAl2O3-supported material). However, significant diminution in HDS properties was observed aslanthanum concentration augmented in tested materials. Payen et al. [14] reported progressivediminution in thiophene HDS activity as La content in alumina- supported CoMo formulationsincreased. Very probably, enhanced proportions of refractory tetrahedral MoO4
2− (see Section 2.6.Raman spectroscopy), as rare earth content in formulations augmented, could be primarily responsible forthat behavior. Those species are characterized by being hardly sulfidable under the used conditions [14],then precluding MoS2 phase formation.
234

Catalysts 2019, 9, 359
Figure 7. Pseudo first order kinetic constant (DBT HDS) of various tested catalysts. Batch reactor,n-hexadecane as solvent, P = 5.67 MPa, T = 320 ◦C, 107 rad s−1 (1030 rpm) mixing speed.
The increased amount of MoO42− species by the addition of basic agents in alumina-supported
HDS catalysts has been reported in the past [14,56]. For instance, Malet et al. [56] found augmentedproportions of hardly-reducible tetrahedral molybdenum entities in Mo/TiO2 solids doped with Na(through NaOH impregnation) at various concentrations. The decreased reducibility of tetrahedralMo6+ species on Al2O3-supported oxidic Mo and CoMo formulations modified by basic agents (Mgand Li) was confirmed by temperature-programmed reduction studies [5,46]. Regarding sulfidedalumina-supported CoMo formulations modified by K addition (2.7 wt%), Maugé et al. [4] observed(by FTIR) decreased intensity in bands related to adsorbed CO as to that over the counterpart witha non-doped Al2O3 carrier. That could mean a lower proportion of sulfided phases, although theauthors mainly attributed that to adsorption sites poisoning provoked by augmented sulfided phaseelectron density that could be reflected in diminished CO adsorption strength, under tested conditions(−173 ◦C). Similar to our case, those authors identified enhanced surface basicity of K-doped solidsby formation of hydrogen carbonates and bidentate carbonates (weak and medium strength sites,respectively [30]), as studied by CO2 adsorption followed by FTIR). Decreased conversion in the2-methylthiophene in n-heptane was observed in the case of K-doped CoMo/alumina catalysts whentested in a model FCC (fluid catalytic cracking) naphtha mixture also containing 2,3-dimethylbut-2-eneand orthoxylene. Regarding unpromoted sulfided alumina-supported Mo catalysts, Cui et al. [13]observed unaltered activity in thiophene HDS for materials at low La content (2 wt%), which wasfollowed by decreased desulfurating properties in the solid modified with 5 wt% rare earth loading.Regarding the effect of basic additives on dibenzothiophene (DBT) HDS activity of alumina-supportedmaterials, strongly decreased activity was observed [44] in the case of NiMo formulations with aMgO-modified (5 mol%) Al2O3 carrier. As the HDS activity of sulfided Mo has often been related tosurface acidity [57], it seems reasonable to assume that diminished Brønsted or Lewis ones (or both) informulations doped with basic additives could provoke limited organo-S species conversion.
The high activity in DBT HDS of our sulfided alumina-supported Co-Mo-P formulation modifiedwith lanthanum at the lowest content could result from a combination of factors. Our UV-vis results(Figure 6) suggested that, in CM/ALa1, extant octahedral molybdenum species were at lower interactionwith the support. Although, according to Raman characterization (Figure 4), amount of refractory
235
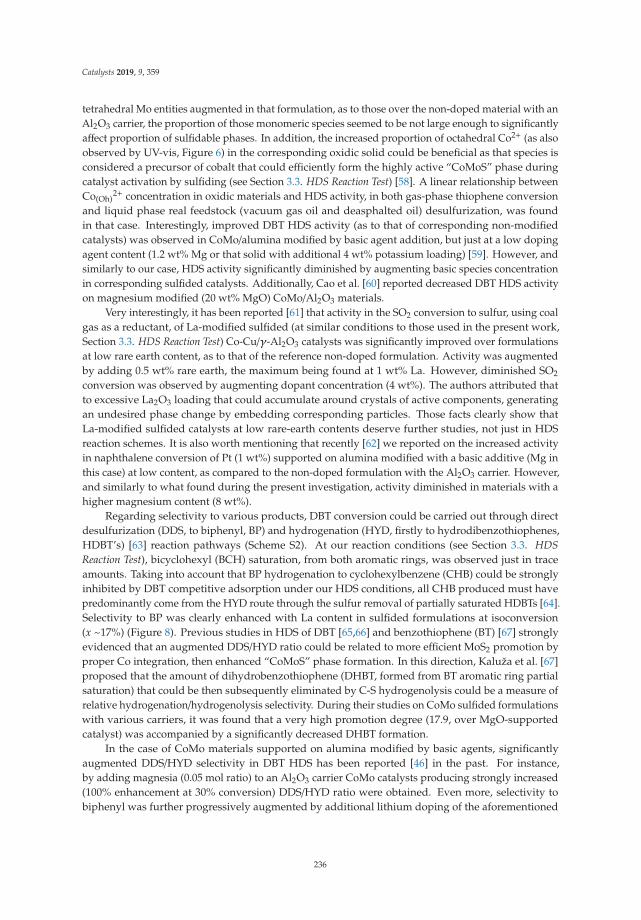
Catalysts 2019, 9, 359
tetrahedral Mo entities augmented in that formulation, as to those over the non-doped material with anAl2O3 carrier, the proportion of those monomeric species seemed to be not large enough to significantlyaffect proportion of sulfidable phases. In addition, the increased proportion of octahedral Co2+ (as alsoobserved by UV-vis, Figure 6) in the corresponding oxidic solid could be beneficial as that species isconsidered a precursor of cobalt that could efficiently form the highly active “CoMoS” phase duringcatalyst activation by sulfiding (see Section 3.3. HDS Reaction Test) [58]. A linear relationship betweenCo(Oh)
2+ concentration in oxidic materials and HDS activity, in both gas-phase thiophene conversionand liquid phase real feedstock (vacuum gas oil and deasphalted oil) desulfurization, was foundin that case. Interestingly, improved DBT HDS activity (as to that of corresponding non-modifiedcatalysts) was observed in CoMo/alumina modified by basic agent addition, but just at a low dopingagent content (1.2 wt% Mg or that solid with additional 4 wt% potassium loading) [59]. However, andsimilarly to our case, HDS activity significantly diminished by augmenting basic species concentrationin corresponding sulfided catalysts. Additionally, Cao et al. [60] reported decreased DBT HDS activityon magnesium modified (20 wt% MgO) CoMo/Al2O3 materials.
Very interestingly, it has been reported [61] that activity in the SO2 conversion to sulfur, using coalgas as a reductant, of La-modified sulfided (at similar conditions to those used in the present work,Section 3.3. HDS Reaction Test) Co-Cu/γ-Al2O3 catalysts was significantly improved over formulationsat low rare earth content, as to that of the reference non-doped formulation. Activity was augmentedby adding 0.5 wt% rare earth, the maximum being found at 1 wt% La. However, diminished SO2
conversion was observed by augmenting dopant concentration (4 wt%). The authors attributed thatto excessive La2O3 loading that could accumulate around crystals of active components, generatingan undesired phase change by embedding corresponding particles. Those facts clearly show thatLa-modified sulfided catalysts at low rare-earth contents deserve further studies, not just in HDSreaction schemes. It is also worth mentioning that recently [62] we reported on the increased activityin naphthalene conversion of Pt (1 wt%) supported on alumina modified with a basic additive (Mg inthis case) at low content, as compared to the non-doped formulation with the Al2O3 carrier. However,and similarly to what found during the present investigation, activity diminished in materials with ahigher magnesium content (8 wt%).
Regarding selectivity to various products, DBT conversion could be carried out through directdesulfurization (DDS, to biphenyl, BP) and hydrogenation (HYD, firstly to hydrodibenzothiophenes,HDBT’s) [63] reaction pathways (Scheme S2). At our reaction conditions (see Section 3.3. HDSReaction Test), bicyclohexyl (BCH) saturation, from both aromatic rings, was observed just in traceamounts. Taking into account that BP hydrogenation to cyclohexylbenzene (CHB) could be stronglyinhibited by DBT competitive adsorption under our HDS conditions, all CHB produced must havepredominantly come from the HYD route through the sulfur removal of partially saturated HDBTs [64].Selectivity to BP was clearly enhanced with La content in sulfided formulations at isoconversion(x ~17%) (Figure 8). Previous studies in HDS of DBT [65,66] and benzothiophene (BT) [67] stronglyevidenced that an augmented DDS/HYD ratio could be related to more efficient MoS2 promotion byproper Co integration, then enhanced “CoMoS” phase formation. In this direction, Kaluža et al. [67]proposed that the amount of dihydrobenzothiophene (DHBT, formed from BT aromatic ring partialsaturation) that could be then subsequently eliminated by C-S hydrogenolysis could be a measure ofrelative hydrogenation/hydrogenolysis selectivity. During their studies on CoMo sulfided formulationswith various carriers, it was found that a very high promotion degree (17.9, over MgO-supportedcatalyst) was accompanied by a significantly decreased DHBT formation.
In the case of CoMo materials supported on alumina modified by basic agents, significantlyaugmented DDS/HYD selectivity in DBT HDS has been reported [46] in the past. For instance,by adding magnesia (0.05 mol ratio) to an Al2O3 carrier CoMo catalysts producing strongly increased(100% enhancement at 30% conversion) DDS/HYD ratio were obtained. Even more, selectivity tobiphenyl was further progressively augmented by additional lithium doping of the aforementioned
236
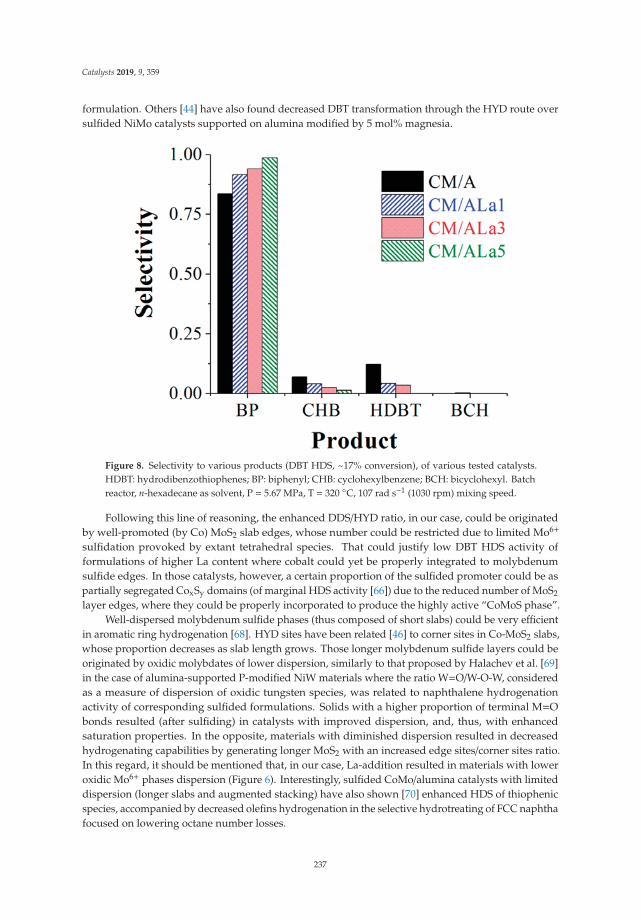
Catalysts 2019, 9, 359
formulation. Others [44] have also found decreased DBT transformation through the HYD route oversulfided NiMo catalysts supported on alumina modified by 5 mol% magnesia.
Figure 8. Selectivity to various products (DBT HDS, ~17% conversion), of various tested catalysts.HDBT: hydrodibenzothiophenes; BP: biphenyl; CHB: cyclohexylbenzene; BCH: bicyclohexyl. Batchreactor, n-hexadecane as solvent, P = 5.67 MPa, T = 320 ◦C, 107 rad s−1 (1030 rpm) mixing speed.
Following this line of reasoning, the enhanced DDS/HYD ratio, in our case, could be originatedby well-promoted (by Co) MoS2 slab edges, whose number could be restricted due to limited Mo6+
sulfidation provoked by extant tetrahedral species. That could justify low DBT HDS activity offormulations of higher La content where cobalt could yet be properly integrated to molybdenumsulfide edges. In those catalysts, however, a certain proportion of the sulfided promoter could be aspartially segregated CoxSy domains (of marginal HDS activity [66]) due to the reduced number of MoS2
layer edges, where they could be properly incorporated to produce the highly active “CoMoS phase”.Well-dispersed molybdenum sulfide phases (thus composed of short slabs) could be very efficient
in aromatic ring hydrogenation [68]. HYD sites have been related [46] to corner sites in Co-MoS2 slabs,whose proportion decreases as slab length grows. Those longer molybdenum sulfide layers could beoriginated by oxidic molybdates of lower dispersion, similarly to that proposed by Halachev et al. [69]in the case of alumina-supported P-modified NiW materials where the ratio W=O/W-O-W, consideredas a measure of dispersion of oxidic tungsten species, was related to naphthalene hydrogenationactivity of corresponding sulfided formulations. Solids with a higher proportion of terminal M=Obonds resulted (after sulfiding) in catalysts with improved dispersion, and, thus, with enhancedsaturation properties. In the opposite, materials with diminished dispersion resulted in decreasedhydrogenating capabilities by generating longer MoS2 with an increased edge sites/corner sites ratio.In this regard, it should be mentioned that, in our case, La-addition resulted in materials with loweroxidic Mo6+ phases dispersion (Figure 6). Interestingly, sulfided CoMo/alumina catalysts with limiteddispersion (longer slabs and augmented stacking) have also shown [70] enhanced HDS of thiophenicspecies, accompanied by decreased olefins hydrogenation in the selective hydrotreating of FCC naphthafocused on lowering octane number losses.
237
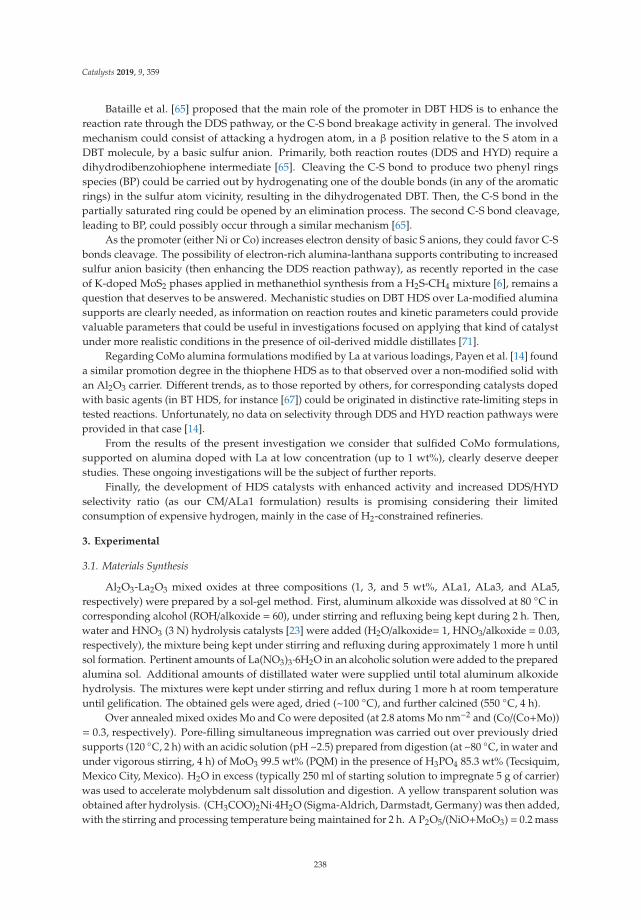
Catalysts 2019, 9, 359
Bataille et al. [65] proposed that the main role of the promoter in DBT HDS is to enhance thereaction rate through the DDS pathway, or the C-S bond breakage activity in general. The involvedmechanism could consist of attacking a hydrogen atom, in a β position relative to the S atom in aDBT molecule, by a basic sulfur anion. Primarily, both reaction routes (DDS and HYD) require adihydrodibenzohiophene intermediate [65]. Cleaving the C-S bond to produce two phenyl ringsspecies (BP) could be carried out by hydrogenating one of the double bonds (in any of the aromaticrings) in the sulfur atom vicinity, resulting in the dihydrogenated DBT. Then, the C-S bond in thepartially saturated ring could be opened by an elimination process. The second C-S bond cleavage,leading to BP, could possibly occur through a similar mechanism [65].
As the promoter (either Ni or Co) increases electron density of basic S anions, they could favor C-Sbonds cleavage. The possibility of electron-rich alumina-lanthana supports contributing to increasedsulfur anion basicity (then enhancing the DDS reaction pathway), as recently reported in the caseof K-doped MoS2 phases applied in methanethiol synthesis from a H2S-CH4 mixture [6], remains aquestion that deserves to be answered. Mechanistic studies on DBT HDS over La-modified aluminasupports are clearly needed, as information on reaction routes and kinetic parameters could providevaluable parameters that could be useful in investigations focused on applying that kind of catalystunder more realistic conditions in the presence of oil-derived middle distillates [71].
Regarding CoMo alumina formulations modified by La at various loadings, Payen et al. [14] founda similar promotion degree in the thiophene HDS as to that observed over a non-modified solid withan Al2O3 carrier. Different trends, as to those reported by others, for corresponding catalysts dopedwith basic agents (in BT HDS, for instance [67]) could be originated in distinctive rate-limiting steps intested reactions. Unfortunately, no data on selectivity through DDS and HYD reaction pathways wereprovided in that case [14].
From the results of the present investigation we consider that sulfided CoMo formulations,supported on alumina doped with La at low concentration (up to 1 wt%), clearly deserve deeperstudies. These ongoing investigations will be the subject of further reports.
Finally, the development of HDS catalysts with enhanced activity and increased DDS/HYDselectivity ratio (as our CM/ALa1 formulation) results is promising considering their limitedconsumption of expensive hydrogen, mainly in the case of H2-constrained refineries.
3. Experimental
3.1. Materials Synthesis
Al2O3-La2O3 mixed oxides at three compositions (1, 3, and 5 wt%, ALa1, ALa3, and ALa5,respectively) were prepared by a sol-gel method. First, aluminum alkoxide was dissolved at 80 ◦C incorresponding alcohol (ROH/alkoxide = 60), under stirring and refluxing being kept during 2 h. Then,water and HNO3 (3 N) hydrolysis catalysts [23] were added (H2O/alkoxide= 1, HNO3/alkoxide = 0.03,respectively), the mixture being kept under stirring and refluxing during approximately 1 more h untilsol formation. Pertinent amounts of La(NO3)3·6H2O in an alcoholic solution were added to the preparedalumina sol. Additional amounts of distillated water were supplied until total aluminum alkoxidehydrolysis. The mixtures were kept under stirring and reflux during 1 more h at room temperatureuntil gelification. The obtained gels were aged, dried (~100 ◦C), and further calcined (550 ◦C, 4 h).
Over annealed mixed oxides Mo and Co were deposited (at 2.8 atoms Mo nm−2 and (Co/(Co+Mo))= 0.3, respectively). Pore-filling simultaneous impregnation was carried out over previously driedsupports (120 ◦C, 2 h) with an acidic solution (pH ~2.5) prepared from digestion (at ~80 ◦C, in water andunder vigorous stirring, 4 h) of MoO3 99.5 wt% (PQM) in the presence of H3PO4 85.3 wt% (Tecsiquim,Mexico City, Mexico). H2O in excess (typically 250 ml of starting solution to impregnate 5 g of carrier)was used to accelerate molybdenum salt dissolution and digestion. A yellow transparent solution wasobtained after hydrolysis. (CH3COO)2Ni·4H2O (Sigma-Aldrich, Darmstadt, Germany) was then added,with the stirring and processing temperature being maintained for 2 h. A P2O5/(NiO+MoO3) = 0.2 mass
238
Catalysts 2019, 9, 359
ratio was fulfilled [72]. A transparent dark wine solution was thus finally obtained. The solutionvolume was then reduced by evaporation until reaching the suitable one for pore-filling impregnationof the given mass of support. The described one-pot impregnation method was chosen as it constitutesa readily scalable methodology during catalyst preparation at the commercial scale. After impregnationmaterials were left aging overnight at room temperature for the diffusion of the impregnated speciesinto the carrier porous network. Then, the materials were dried (2 h at 120 ◦C) and further calcined(400 ◦C for 5 h). Impregnated solids were identified by using the CM/ALaz key, where “z” representsLa loading in corresponding supports.
3.2. Materials Characterization
Textural properties of prepared materials were determined by N2 physisorption (at −198 ◦C,nitrogen saturation temperature at Mexico City barometric pressure) in a Micromeritics (Norcross, GA,USA) ASAP 2000 apparatus after ultra-high vacuum (133.32 × 10⁻⁵ Pa) degassing at 300 ◦C for 2 h toeliminate adsorbed molecules. The surface area (BET, Brunauer-Emett-Teller method), pore volume,and average pore size of the materials (BJH, Barrett-Joyner-Halenda method) were determined fromthe corresponding isotherms.
Thermal analyses (thermogravimetric and differential thermal analysis (TG and DTA, respectively)of dried (non-calcined) samples were carried out with a Netzsch Thermische Analyze (Burlington,MA, USA) STA 409 EP apparatus, under a static air atmosphere. The crystallographic order of thestudied samples was determined by powder X-ray diffraction (XRD, Siemens (Munich, Germany)D-500 Kristalloflex, copper anode, CuKα radiation, λ = 0.15406 nm, 35 kV, 25 mA), in the 5–80◦ 2θ range.
Scanning electron microscopy pictures and chemical analysis by energy dispersive spectroscopy(EDS) of the prepared samples were performed in an environmental scanning electron microscopeXL30 with an attached energy dispersive X-ray spectroscope (EDAX, Berwyn, PA, USA).
The surface basicity of alumina, alumina-lanthana supports, and the corresponding impregnatedmaterials were characterized by CO2 adsorption studied in the mid-infrared region. As an acidprobe, carbon dioxide interacts with basic catalysts’ surfaces, forming bidentate carbonates, unidentatecarbonates, and bicarbonates (Scheme S1, [30]), depending on surface basic site strength. Previously,to corresponding studies, all materials (carefully weighed) were submitted to thermal treatments(500 ◦C), under an inert atmosphere, to eliminate adsorbed species. Samples were cooled down toroom temperature with CO2 being then fed to the system (at room temperature). Once sampleswere saturated, the flow of probe gas was suspended, with excess CO2 being flushed by an inert gasstream. The corresponding spectra were acquired by using a Nicolet (Waltham, MA, USA) Magna560 FTIR spectrometer at 4 cm−1 resolution (50 scans) in diffuse reflectance mode. The analyzedsamples were treated at various progressively higher temperatures (25–500 ◦C) and detected peaks inthe 1800–1200 cm−1 wavenumbers infrared range (corresponding to formed surface bicarbonates andcarbonates) were then registered and integrated.
The Raman spectra of various impregnated samples were obtained using a Jobin Yvon Horiba(Northampton, UK) T64000 spectrometer, equipped with a CCD camera detector. As an excitationsource, the 514.5 nm line of a Spectra Physics 2018 Argon/Krypton ion laser system was focusedthrough an Olympus (Tokyo, Japan) BX41 microscope equipped with a 100×magnification objective.Laser power on the sample never exceeded 5 mW to avoid thermal effects on the samples studied.
3.3. HDS Reaction Test
Prepared catalysts were tested in sulfided form (see below) by using a batch reactor, as themain goal was to determine the effect of La content on the HDS properties of otherwise conventionalP-modified CoMo/Al2O3 catalysts. That approach allowed a simple, rapid comparison among thecatalytic activity of various studied materials [44,46], although commercial-scale HDS applications inrefineries are carried out in fixed-bed plug-flow reactors. Sulfided catalysts were obtained by submittingimpregnated precursors to treatment at 400 ◦C (heating rate 6 ◦C min−1), under H2/H2S (Praxair, Mexico
239
Catalysts 2019, 9, 359
City, Mexico) flow at 50/6 (ml min−1)/(ml min−1) during 2 h. The HDS activity of sulfided catalystswas studied in a tri-phasic slurry batch reactor (Parr 4575, Moline, IL, USA). The reaction mixturewas prepared by dissolving ~0.3 g of dibenzothiophene (representing S-bearing species present inoil-derived middle distillates) in 100 cm3 of n-hexadecane (98 mass % and 99+mass %, respectively, bothfrom Aldrich, Darmstadt, Germany). N-hexadecane (cetane) well-represented the hydrocarbons extantin aforementioned real feedstocks from which diesel fuel is produced. Approximately ~0.2 g of sievedsulfided catalyst (80–100 Tyler mesh, ~0.165 mm average particle diameter) were also added, avoidingcontact with atmospheric air, precluding sulfates formation. The HDS test reactions were carriedout at T = 320 ◦C, P = 5.67 MPa, and 1000 rpm (~105 rad s−1, mixing speed). Catalysts’ particle sizeand operating conditions were carefully chosen to avoid internal/external diffusional limitations [73].Liquid samples were taken from the reactor, periodically, then analyzed by gas chromatography(Agilent (Santa Clara, CA, USA) 6890N with flame ionization detector and Econo-Cap-5 capillarycolumn length: 30 m, 0.53 mm diameter, and film thickness of 1.2 μm, from Alltech (Nicholasville, KY,USA). The HDS kinetic constants were calculated assuming pseudo-first order model kinetics referredto DBT concentration and zero order with respect to excess H2, as follows:
k =− ln(1− x)
tr(1)
where x is DBT conversion and tr refers to reaction time. The k values for various catalysts werenormalized by considering the reaction volume and the mass of the catalyst used (k expressed inm3 kgcat
−1 s−1). It should be mentioned that H2S, a byproduct from S-C bond scission reactions,contributed in maintaning tested catalysts in sulfided form and then avoiding their reduction tocorresponding metallic phases, characterized by being prone to sintering [74].
4. Conclusions
Alumina-lantana (1, 3, or 5 wt% La) mixed oxides of suitable texture, to be applied assupports of catalysts for hydrotreatment of oil-derived middle-distillates, were prepared by asol-gel method. In general, the amount and strength of surface basic sites increased with rare-earthcontent in binary carriers. La at low content (1 wt%) was beneficial in sulfided P-doped CoMoformulations where enhanced dibenzothiophene hydrodesulfurization (HDS) activity (~38%), as tothat over the Al2O3-supported counterpart, was observed. However, increased La concentration insupports was detrimental on HDS properties. Hardly sulfidable tetrahedral Mo species, originatedduring impregnation at basic conditions, in pores of La-modified carriers seemed to dictate thatbehavior. Augmented rare earth concentrations in mixed supports of sulfided CoMo catalysts favoreddibenzothiophene conversion through the direct desulfurization (DDS) reaction pathway to biphenyl,over the hydrogenation (HYD) one. That fact, presumably originated in enhanced MoS2 promotionby efficient Co integration, seems to be promising in the development of alumina-supported HDTformulations at low La content of limited expensive hydrogen consumption.
Supplementary Materials: The following are available online at http://www.mdpi.com/2073-4344/9/4/359/s1,Figure S1: N2 adsorption isotherms (at −198 ◦C) of alumina support (A) and La-modified carriers at various rareearth contents (ALaz). Closed symbols: adsorption branch; open symbols: desorption branch. Figure S2: N2physisorption isotherms (at −198 ◦C) of oxidic P-doped CoMo materials impregnated over sol-gel alumina (A) andcorresponding La-modified (ALaz) carriers. Closed symbols: adsorption branch; open symbols: desorption branch.Figure S3: Pore size distributions of various prepared supports (a) and oxidic Co-Mo-P impregnated materials(b), as calculated by Barrett-Joyner-Halenda methodology with data from adsorption branch of correspondingN2 adsorption isotherms. Figure S4: SEM micrographs of La-modified supports. At 1000× magnification,back-scattered electrons detector. (a) ALa1; (b) ALa3; (c) ALa5. Figure S5: SEM micrographs of Co-Mo-Pimpregnated oxidic samples on alumina and La-modified supports. At 4000× magnification, back-scatteredelectrons detector. (a) CM/A; (b) CM/ALa1 (c) CM/ALa3; (d) CM/ALa5. Table S1: SEM-EDS chemical analysisof Co-Mo-P impregnated oxidic materials prepared. Scheme S1: Absorption bands in the infrared region ofCO2 species adsorbed on basic sites [from ref. S1]. Scheme S2: Dibenzothiophene HDS reaction network oversulfided CoMo/Al2O3 [from ref. S2]. HDBT´s: hydrodibenzothiophenes; BP: biphenyl; CHB: cyclohexylbenzene;BCH: bicyclohexyl.
240
Catalysts 2019, 9, 359
Author Contributions: Funding acquisition, J.E.; Investigation, J.E., M.C.B., J.S.V., D.A.S.-C., V.S., J.E.T., andB.A.R.F.; Project administration, J.E.; Validation, J.E. and M.C.B.; Writing, review and editing, J.E. and M.C.B.
Funding: 117086 SENER-CONACYT-Hidrocarburos grant and Y.00105 Project from IMP.
Acknowledgments: J. Escobar acknowledges financial support from IMP (Y.00105) and SENER-CONACYT-Hidrocarburos (115086) fund.
Conflicts of Interest: The authors declare no conflict of interest.
References
1. Xu, J.; Guo, Y.; Huang, T.; Fan, Y. Hexamethonium bromide-assisted synthesis of CoMo/graphene catalystsfor selective hydrodesulfurization. Appl. Catal. B Environ. 2019, 244, 385–395. [CrossRef]
2. Yang, L.; Peng, C.; Fang, X.; Cheng, Z.; Zhou, Z. Hierarchically macro-mesoporous Ni-Mo/Al2O3 catalystsfor hydrodesulfurization of dibenzothiophene. Catal. Commun. 2019, 121, 68–72. [CrossRef]
3. Zhang, C.; Brorson, M.; Li, P.; Liu, X.; Liu, T.; Jiang, Z.; Li, C. CoMo/Al2O3 catalysts prepared by tailoring thesurface properties of alumina for highly selective hydrodesulfurization of FCC gasoline. Appl. Catal. A Gen.2019, 570, 84–95. [CrossRef]
4. Mey, D.; Brunet, S.; Canaff, C.; Maugé, F.; Bouchy, C.; Diehl, F. HDS of a model FCC gasoline over a sulfidedCoMo/Al2O3 catalyst: Effect of the addition of potassium. J. Catal. 2004, 227, 436–447. [CrossRef]
5. Klimova, T.; Solís Casados, D.; Ramírez, J. New selective Mo and NiMo HDS catalysts supported onAl2O3-MgO(x) mixed oxides. Catal. Today 1998, 43, 135–146. [CrossRef]
6. Lu, J.; Luo, Y.; He, D.; Xu, Z.; He, S.; Xie, D.; Mei, Y. An exploration into potassium (K) containing MoS2 activephases and its transformation process over MoS2 based materials for producing methanethiol. Catal. Today2019. [CrossRef]
7. Alphonse, P.; Faure, B. Thermal stabilization of alumina modified by lanthanum. Microporous MesoporousMater. 2014, 196, 191–198. [CrossRef]
8. Lu, J.; Hao, H.; Zhang, L.; Xu, Z.; Zhong, L.; Zhao, Y.; He, D.; Liu, J.; Chen, D.; Pu, H.; et al. The investigationof the role of basic lanthanum (La) species on the improvement of catalytic activity and stability of HZSM-5material for eliminating methanethiol-(CH3SH). Appl. Catal. B Environ. 2018, 237, 185–197. [CrossRef]
9. Garbarino, G.; Vijayakumar, R.P.P.; Riani, P.; Finocchio, E.; Busca, G. Ethanol and diethyl ether catalyticconversion over commercial alumina and lanthanum-doped alumina: Reaction paths, catalyst structure andcoking. Appl. Catal. B Environ. 2018, 236, 490–500. [CrossRef]
10. Garbarino, G.; Wang, C.; Valsamakis, I.; Chitsazan, S.; Riani, P.; Finocchio, E.; Flytzani-Stephanopoulos, M.;Busca, G. Acido-basicity of lanthana/alumina catalysts and their activity in ethanol conversion. Appl. Catal.B Environ. 2017, 200, 458–468. [CrossRef]
11. Garbarino, G.; Wang, C.; Cavattoni, T.; Finocchio, E.; Riani, P.; Flytzani-Stephanopoulos, M.; Busca, G. Astudy of Ni/La-Al2O3 catalysts: A competitive system for CO2 methanation. Appl. Catal. B Environ. 2018.[CrossRef]
12. He, D.; Zhao, Y.; Yang, S.; Mei, Y.; Yu, J.; Liu, J.; Chen, D.; He, S.; Luo, Y. Enhancement of catalytic performanceand resistance to carbonaceous deposit of lanthanum (La) doped HZSM-5 catalysts for decomposition ofmethyl mercaptan. Chem. Eng. J. 2018, 336, 579–586. [CrossRef]
13. Cui, J.-W.; Massoth, F.E.; Topsøe, N.Y. Studies of Molybdena-Alumina Catalysts XVIII. Lanthanum-ModifiedSupports. J. Catal. 1992, 136, 361–377.
14. Blanchard, P.; Payen, E.; Grimblot, J.; Le Bihan, L.; Poulet, O.; Loutaty, R. Preparation of Co-Mo-basedhydrodesulphurization catalysts: Characterizations of deposited species on lanthanum modified γ-alumina.J. Mol. Catal. A Chem. 1998, 135, 143–153. [CrossRef]
15. Afanasiev, P.; Bezverkhyy, I. Ternary transition metals sulfides in hydrotreating catalysis. Appl. Catal. A Gen.2007, 322, 129–141. [CrossRef]
16. Escobar, J.; Barrera, M.C.; Solís-Casados, D.A.; Santes, V.; Sánchez-Valente, J.; Terrazas, J.E. Hidrodesulfuraciónde dibenzotiofeno sobre CoMo/Al2O3-La sol-gel. Effecto del contenido de tierra rara. In Proceedings of theLivro de atas XXVI Congresso Ibero-americano de Catálise (CICAT 2018), Coimbra, Portugal, 9–14 September2018; Gomes, H., Silva, A., Machado, B., Ribeiro, F., Fonseca, I., Faria, J., Pereira, M., Rocha, R., Eds.; Abstractnumber: P-IR21. Sociedade Portuguesa de Química: Coimbra, Portugal, 2018; pp. 1070–1075.
241
Catalysts 2019, 9, 359
17. Leofanti, G.; Padovan, M.; Tozzola, G.; Venturelli, B. Surface area and pore texture of catalysts. Catal. Today1998, 41, 207–219. [CrossRef]
18. Dicks, A.L.; Ensell, R.L.; Phillips, T.R.; Szczepura, A.K.; Thorley, M.; Williams, A.; Wragg, R.D. A study ofrelationships between pore size distribution, hydrogen chemisorption, and activity of hydrodesulphurisationcatalysts. J. Catal. 1981, 72, 266–273. [CrossRef]
19. Gurvich, L. Physico-chemical attractive force. J. Russ. Phys. Chem. Soc. 1915, 47, 805–827.20. Ou, E.; Zhou, J.; Mao, S.; Wang, J.; Xia, F.; Min, L. Highly efficient removal of phosphate by lanthanum-doped
mesoporous SiO2. Colloid Surf. A 2007, 308, 47–53. [CrossRef]21. Zhang, L.; Wan, L.; Chang, N.; Liu, J.; Duan, C.; Zhou, Q.; Li, X.; Wang, X. Removal of phosphate from water
by activated carbon fiber loaded with lanthanum oxide. J. Hazard. Mater. 2011, 190, 848–855. [CrossRef]22. Kaluža, L.; Gulková, D.; Vít, Z.; Zdražil, M. High-activity MgO-supported CoMo hydrodesulfurization
catalysts prepared by non-aqueous impregnation. Appl. Catal. B Environ. 2015, 162, 430–436. [CrossRef]23. Escobar, J.; De Los Reyes, J.A.; Viveros, T. Influence of the Synthesis Additive on the Textural and Structural
Characteristics of Sol-Gel Al2O3-TiO2. Ind. Eng. Chem. Res. 2000, 39, 666–672. [CrossRef]24. Chaturvedi, S.; Dave, P.N. Review on Thermal Decomposition of Ammonium Nitrate. J. Energ. Mater. 2013,
31, 1–26. [CrossRef]25. Barrera, A.; Fuentes, S.; Viniegra, M.; Avalos-Borja, M.; Bogdanchikova, N.; Campa-Molina, J. Structural
properties of Al2O3-La2O3 binary oxides prepared by sol-gel. Mater. Res. Bull. 2007, 42, 640–648. [CrossRef]26. Escobar, J.; Barrera, M.C.; De Los Reyes, J.A.; Cortés, M.A.; Santes, V.; Gómez, E.; Pacheco, J.G. Effect of Mo
and Co loading in HDS catalysts supported on solvo-thermally treated ZrO2-TiO2 mixed oxide. Catal. Today2008, 133–135, 282–291. [CrossRef]
27. Hattori, H. Heterogeneous Basic Catalysis. Chem. Rev. 1995, 95, 537–558. [CrossRef]28. Bálsamo, N.; Mendieta, S.; Heredia, A.; Crivello, M. Nanoclays as dispersing precursors of La and Ce oxide
catalysts to produce high-valued derivatives of biodiesel by-product. Mol. Catal. 2019. [CrossRef]29. Bernal, S.; Díaz, J.A.; García, J.R.; Rodríguez-Izquierdo, J.M. Study of some aspects of the reactivity of La2O3
with CO2 and H2O. J. Mater. Sci. 1985, 20, 537–541. [CrossRef]30. Morterra, C.; Ghiotti, G.; Boccuzzi, F.; Coluccia, S. An infrared spectroscopic investigation of the surface
properties of magnesium aluminate spinel. J. Catal. 1978, 51, 299–313. [CrossRef]31. Di Cosimo, J.I.; Diez, V.K.; Xu, M.; Iglesia, E.; Apesteguia, C.R. Structure and Surface and Catalytic Properties
of Mg-Al Basic Oxides. J. Catal. 1998, 78, 499–510. [CrossRef]32. Boukha, Z.; Fitian, L.; López-Haro, M.; Mora, M.; Ruiz, J.R.; Jiménez-Sanchidrián, C.; Blanco, G.; Calvino, J.J.;
Cifredo, G.A.; Trasobares, S.; et al. Influence of the calcination temperature on the nano-structural properties,surface basicity, and catalytic behavior of alumina-supported lanthana samples. J. Catal. 2010, 272, 121–130.[CrossRef]
33. Bettman, M.; Chase, R.E.; Otto, K.; Weber, W.H. Dispersion Studies on the System La2O3/γ-A12O3. J. Catal.1989, 117, 447–454. [CrossRef]
34. Kraus, H.; Prins, R. Proton NMR Investigations of Surface Hydroxyl Groups on Oxidic Mo-P/γ-Al2O3
Catalysts. J. Catal. 1996, 164, 260–267. [CrossRef]35. Ledford, J.S.; Kim, Y.-M.; Houalla, M.; Proctor, A.; Hercules, D.M. Surface Analysis of Lanthanum-modified
Cobalt Catalysts. Analyst 1992, 117, 323–327. [CrossRef]36. Wachs, I.E. Raman and IR studies of surface metal oxide species on oxide supports: Supported metal oxide
catalysts. Catal. Today 1996, 27, 437–455. [CrossRef]37. Scheithauer, M.; Knözinger, H.; Vannice, M.A. Raman Spectra of La2O3 Dispersed on γ-Al2O3. J. Catal. 1998,
178, 701–7005. [CrossRef]38. Dedov, A.G.; Loktev, A.S.; Moiseev, I.I.; Aboukais, A.; Lamonier, J.F.; Filimonov, I.N. Oxidative coupling of
methane catalyzed by rare earth oxides: Unexpected synergistic effect of the oxide mixtures. Appl. Catal.A Gen. 2003, 245, 209–220. [CrossRef]
39. Chen, J.; Mi, J.; Li, K.; Wang, X.; Dominguez Garcia, E.; Cao, Y.; Jiang, L.; Oliviero, L.; Mauge, F. The role ofcitric acid in preparing highly active CoMo/Al2O3 catalyst: From aqueous impregnation solution to activesite formation. Ind. Eng. Chem. Res. 2017, 56, 14172–14181. [CrossRef]
40. Nicosia, D.; Prins, R. 31P MAS NMR and Raman study of a Co(Zn)MoP/γ-Al2O3 HDS catalyst precursorcontaining triethylene glycol. J. Catal. 2005, 234, 414–420. [CrossRef]
242
Catalysts 2019, 9, 359
41. Bergwerff, J.A.; Visser, T.; Leliveld, B.R.G.; Rossenaar, B.D.; de Jong, K.P.; Weckhuysen, B.M. Envisagingthe physicochemical processes during the preparation of supported catalysts: Raman microscopy on theimpregnation of Mo onto Al2O3 extrudates. J. Am. Chem. Soc. 2004, 126, 14548–14556. [CrossRef]
42. Catita, L.; Quoineaud, A.-A.; Espinat, D.; Pichon, C.; Delpoux, O. Application of magnetic resonanceimaging and raman imaging to study the impact of phosphorus in impregnation of hydrotreatment catalysts.Appl. Catal. A Gen. 2017, 547, 164–175. [CrossRef]
43. Kraus, H.; Prins, R. Composition of impregnation solutions and wet impregnated Mo-P/γ-Al2O3 catalysts asinvestigated by 31P and 95Mo NMR. J. Catal. 1995, 164, 251–259. [CrossRef]
44. Vázquez-Garrido, I.; López-Benítez, A.; Berhault, G.; Guevara-Lara, A. Effect of support on theacidity of NiMo/Al2O3-MgO and NiMo/TiO2-Al2O3 catalysts and on the resulting competitivehydrodesulfurization/hydrodenitrogenation reactions. Fuel 2019, 236, 55–64. [CrossRef]
45. Ishutenko, D.; Nikulshin, P.; Pimerzin, A. Relation between composition and morphology of K(Co)MoSactive phase species and their performances in hydrotreating of model FCC gasoline. Catal. Today 2016, 271,16–27. [CrossRef]
46. Solís-Casados, D.A.; Escobar-Alarcón, L.; Klimova, T.; Escobar-Aguilar, J.; Rodríguez-Castellón, E.;Cecilia, J.A.; Morales-Ramírez, C. Catalytic performance of CoMo/Al2O3-MgO-Li(x) formulations in DBThydrodesulfurization. Catal. Today 2016, 271, 35–44. [CrossRef]
47. Sheik Saleem, S.; Aruldhas, G. Raman and Infrared Spectra of Lanthanum Molybdate. J. Solid State Chem.1982, 42, 158–162. [CrossRef]
48. Frank, C.J.; Redd, D.C.B.; Gansler, T.S.; McCreery, R.L. Characterization of Human Breast Biopsy withNear-IR Raman Spectroscopy Specimens. Anal. Chem. 1994, 66, 319–326. [CrossRef]
49. Ramírez, J.; Macías, G.; Cedeño, L.; Gutiérrez-Alejandre, A.; Cuevas, R.; Castillo, P. The role of titania insupported Mo, CoMo, NiMo, and NiW hydrodesulfurization catalysts: Analysis of past and new evidences.Catal. Today 2004, 98, 19–30. [CrossRef]
50. Liu, Y.; Liu, X.; Zhao, L.; Lyu, Y.; Xu, L.; Rood, M.J.; Wei, L.; Liu, Z.; Yan, Z. Effect of lanthanum species on thephysicochemical properties of La/SAPO-11 molecular sieve. J. Catal. 2017, 347, 170–184. [CrossRef]
51. Torres-Mancera, P.; Ramírez, J.; Cuevas, R.; Gutiérrez-Alejandre, A.; Murrieta, F.; Luna, R.Hydrodesulfurization of 4,6-DMDBT on NiMo and CoMo catalysts supported on B2O3-Al2O3. Catal.Today 2005, 107–108, 551–558. [CrossRef]
52. Weber, R.S. Effect of local structure on the UV-visible absorption edges of molybdenum oxide clusters andsupported molybdenum oxides. J. Catal. 1995, 151, 470–474. [CrossRef]
53. Sreedhara, M.B.; Ramakrishna Matte, H.S.S.; Govindaraj, A.; Rao, C.N.R. Synthesis, Characterization, andProperties of Few-Layer MoO3. Chem. Asian J. 2013, 8, 2430–2435. [CrossRef] [PubMed]
54. Makshina, E.V.; Zhilinskaya, E.A.; Siffert, S.; Mazo, G.N.; Aboukaïs, A.; Grünert, W.; Romanovsky, B.V.Nanostructured lanthanum cobaltate: Oxidation and coordination states of Co atoms. J. Exp. Nanosci. 2009,5, 427–437. [CrossRef]
55. Xie, L.L.; Gao, Q.M.; Li, Q.H. Nanoporous metal phosphate CoVSB-1 catalyst for oxidation of styrene withH2O2. In From Zeolites to Porous MOF Materials—The 40th Anniversary of International Zeolite Conference.Proceedings of the 15th International Zeolite Conference, Beijing, China, 12–17 August 2007; Xu, R., Gao, Z., Chen, J.,Yan, W., Eds.; Elsevier B.V.: Amsterdam, The Netherlands, 2007; pp. 1338–1343.
56. Martin, C.; Martin, I.; Rives, V.; Malet, P. Changes in the Struture of TiO2-supported Molybdena Induced byNa-doping. J. Catal. 1994, 147, 465–475. [CrossRef]
57. Topsøe, N.Y.; Topsøe, H. FTIR Studies of Mo/Al2O3-Based Catalysts: II. Evidence for the Presence of SHGroups and Their Role in Acidity and Activity. J. Catal. 1993, 139, 641–651. [CrossRef]
58. Morales, A.; Ramírez de Agudelo, M.M. Promoter Role of Octahedral Co (and Ni) in ModifiedCo(Ni)Mo-Al2O3 Catalysts for Hydrodesulfurization Reactions. Appl. Catal. 1986, 23, 23–34. [CrossRef]
59. Solís-Casados, D.; Escobar, J.; García Orozco, I.; Klimova, T. Effect of Potassium Content on the Performanceof CoMo/Al2O3-MgOK2O(x) Catalysts in Hydrodesulfurization of Dibenzothiophene. Ind. Eng. Chem. Res.2011, 50, 2755–2761. [CrossRef]
60. Wu, L.; Jiao, D.; Wang, J.; Chen, L.; Cao, F. The role of MgO in the formation of surface active phasesof CoMo/Al2O3-MgO catalysts for hydrodesulfurization of dibenzothiophene. Catal. Commun. 2009, 11,302–305. [CrossRef]
243
Catalysts 2019, 9, 359
61. Ge, T.; Zuo, C.; Chen, H.; Muhammad, Y.; Wei, L.; Li, C. Catalytic Activity and Molecular Behavior ofLanthanum Modified CoSx/γ-Al2O3 Catalysts for the Reduction of SO2 to Sulfur in Smelter Off-Gas UsingCO-H2 Mixture as Reductant. Ind. Eng. Chem. Res. 2019. [CrossRef]
62. Escobar, J.; Barrera, M.C.; Santes, V.; Terrazas, J.E. Naphthalene hydrogenation over Mg-doped Pt/Al2O3.Catal. Today 2017, 296, 197–204. [CrossRef]
63. Houalla, M.; Nag, N.K.; Sapre, A.V.; Broderick, D.H.; Gates, B.C. Hydrodesulfurization of dibenzothiophenecatalyzed by sulfided CoO-MoO3/γ-Al2O3: The reaction network. AIChEJ 1978, 24, 1015–1021. [CrossRef]
64. Hensen, E.J.M.; Kooyman, P.J.; van der Meer, Y.; van der Kraan, A.M.; de Beer, V.H.J.; van Veen, J.A.R.; vanSanten, R.A. The relation between morphology and hydrotreating activity for supported MoS2 particles.J. Catal. 2001, 199, 224–235. [CrossRef]
65. Bataille, F.; Lemberton, J.L.; Michaud, P.; Pérot, G.; Vrinat, M.; Lemaire, M.; Schulz, E.; Breysse, M.; Kasztelan, S.Alkyldibenzothiophenes hydrodesulfurization-promoter effect, reactivity, and reaction mechanism. J. Catal.2000, 191, 409–422. [CrossRef]
66. Wu, Z.; Whiffen, V.M.L.; Zhu, W.; Wang, D.; Smith, K.J. Effect of Annealing Temperature on Co-MoS2
Nanosheets for Hydrodesulfurization of Dibenzothiophene. Catal. Lett. 2014, 144, 261–267. [CrossRef]67. Kaluža, L.; Gulková, D.; Vít, Z.; Zdražil, M. Effect of support type on the magnitude of synergism and
promotion in CoMo sulphide hydrodesulphurisation catalyst. Appl. Catal. A Gen. 2007, 324, 30–35.[CrossRef]
68. Wu, H.; Duan, A.; Zhao, Z.; Qi, D.; Li, J.; Liu, B.; Jiang, G.; Liu, J.; Wei, Y.; Zhang, X. Preparation of NiMo/KIT-6hydrodesulfurization catalysts with tunable sulfidation and dispersion degrees of active phase by additionof citric acid as chelating agent. Fuel 2014, 130, 203–210. [CrossRef]
69. Halachev, T.; Atanasova, P.; Lopez Agudo, A.; Arias, M.G.; Ramirez, J. Activity of P-Ni-W/Al2O3 catalystswith varying phosphorus content in the hydrogenation of naphthalene. Appl. Catal. A Gen. 1996, 136,161–175. [CrossRef]
70. Wang, T.; Fan, Y.; Wang, X.; Chou, L.; Lin, H. Selectivity enhancement of CoMoS catalysts supported ontri-modal porous Al2O3 for the hydrodesulfurization of fluid catalytic cracking gasoline. Fuel 2015, 157,171–176. [CrossRef]
71. Jaf, Z.N.; Altarawneha, M.; Miran, H.A.; Jiang, Z.T.; Dlugogorski, B.Z. Hydrodesulfurization of Thiopheneover γ-Mo2N catalyst. Mol. Catal. 2018, 459, 21–30. [CrossRef]
72. Fujikawa, T.; Chiyoda, O.; Tsukagoshi, M.; Idei, K.; Takehara, S. Development of a high activity HDS catalystfor diesel fuel: From basic research to commercial experience. Catal. Today 1998, 45, 307–312. [CrossRef]
73. Escobar, J.; Gutiérrez, A.; Barrera, M.C.; Colín, J.A. NiMo/alumina hydrodesulphurization catalyst modifiedby saccharose: Effect of addition stage of organic modifier. Can. J. Chem. Eng. 2016, 94, 66–74. [CrossRef]
74. Shalagina, A.E.; Aleshina, G.I.; Startsev, A.N. Hydrogen occluded in sulfide catalysts: Evidence from thetemperature programmed heating Technique. React. Kinet. Catal. Lett. 2003, 78, 91–98. [CrossRef]
© 2019 by the authors. Licensee MDPI, Basel, Switzerland. This article is an open accessarticle distributed under the terms and conditions of the Creative Commons Attribution(CC BY) license (http://creativecommons.org/licenses/by/4.0/).
244
catalysts
Article
Assessment of Ag Nanoparticles Interaction overLow-Cost Mesoporous Silica in Deep Desulfurizationof Diesel
Rafael V. Sales 1, Heloise O. M. A. Moura 1, Anne B. F. Câmara 1, Enrique Rodríguez-Castellón 2 ,
José A. B. Silva 1, Sibele B. C. Pergher 1, Leila M. A. Campos 3, Maritza M. Urbina 4,
Tatiana C. Bicudo 1 and Luciene S. de Carvalho 1,*
1 Energetic Technologies Research Group, Institute of Chemistry and School of Science and Technology,Federal University of Rio Grande do Norte, Natal 59078-900, Brazil
2 Dpto. de Química Inorgánica, Cristalografía y Mineralogía, Facultad de Ciencias, Universidad de Málaga,29071 Málaga, Spain
3 Chemical Engineering Post-Graduate Program, Salvador University (UNIFACS), Salvador 40140-110, BA,Brazil
4 Chemical Engineering, Center for Technology, Federal University of Alagoas, Maceió 57072-900, AL, Brazil* Correspondence: [email protected]; Tel.: +55-849-8828-5261
Received: 5 July 2019; Accepted: 18 July 2019; Published: 30 July 2019
Abstract: Chemical interactions between metal particles (Ag or Ni) dispersed in a low-cost MCM-41M
produced from beach sand amorphous silica and sulfur compounds were evaluated in the deepadsorptive desulfurization process of real diesel fuel. N2 adsorption-desorption isotherms, X-raydiffraction (XRD), X-ray photoelectron spectroscopy (XPS), high-resolution transmission electronmicroscopy (HRTEM) and scanning transmission electron microscopy coupled to energy-dispersiveX-ray spectroscopy (STEM-EDX) were used for characterizing the adsorbents. HRTEM and XPSconfirmed the high dispersion of Ag nanoparticles on the MCM-41 surface, and its chemical interactionwith support and sulfur compounds by diverse mechanisms such as π-complexation and oxidation.Thermodynamic tests indicated that the adsorption of sulfur compounds over Ag(I)/MCM-41M is anendothermic process under the studied conditions. The magnitude of ΔH◦ (42.1 kJ/mol) indicatesthat chemisorptive mechanisms govern the sulfur removal. The best fit of kinetic and equilibriumdata to pseudo-second order (R2 > 0.99) and Langmuir models (R2 > 0.98), respectively, alongwith the results for intraparticle diffusion and Boyd’s film-diffusion kinetic models, suggest thatthe chemisorptive interaction between organosulfur compounds and Ag nanosites controls sulfuradsorption, as seen in the XPS results. Its adsorption capacity (qm = 31.25 mgS/g) was 10 times higherthan that obtained for pure MCM-41M and double the qm for the Ag(I)/MCM-41C adsorbent fromcommercial silica. Saturated adsorbents presented a satisfactory regeneration rate after a total of fivesulfur adsorption cycles.
Keywords: desulfurization; chemisorption; MPI silica; MCM-41; Ag nanoparticles; XPS assessment
1. Introduction
The demand for clean energy has attracted great attention in recent years and has generated anincreasing focus on sulfur compounds removal from fuels [1]. The combustion of these compoundsresults in liberating sulfur oxides (SOx), which poison catalytic converters and are corrosive to fuelcell electrodes [2], in addition to polluting the environment; therefore, governments worldwide haveadopted standards to decrease sulfur concentration to 10 ppm for diesel fuel [3]. The current techniquefor sulfur removal in oil refineries is the highly expensive hydrodesulfurization (HDS), performed
Catalysts 2019, 9, 651; doi:10.3390/catal9080651 www.mdpi.com/journal/catalysts245
Catalysts 2019, 9, 651
at hard conditions (>573 K, >4 MPa) using sophisticated Co-Mo/Al2O3 or Ni-Mo/Al2O3 catalysts.However, some recalcitrant organosulfur such as thiophene derivatives are not removed by thismethod [4].
Methods based on membrane separation [5], catalytic oxidation [3], biological desulfurization [6],and adsorption [1,7–11] have been developed for desulfurizing fuels. Among these techniques,adsorptive desulfurization stands out due to its simplicity, efficiency and low-cost according to the solidchosen as the adsorbent. Activated carbon [1], MOFs [9], KIT-6 [10], SBA-15 [8], and MCM-41 [7,11]are currently being investigated for sulfur adsorption from liquid fuels, among other materials.
These molecular sieves, especially MCM-41, are extensively applied as supports for adsorbentsand heterogeneous catalysts due to their high surface area, ordered structure, and uniform pore size [12].In general, heterogeneous micrometric size catalysts present low catalytic activity due to slow diffusionof reagents [13]. Therefore, active metal nanoparticles (NPs), which have high catalytic activity due totheir high surface-volume ratio and chemical reactivity, have been incorporated into solid supports forincreasing their efficiency, recyclability and stability, thus providing more sustainable processes [14–16].When unsupported, the high surface energy of nanocatalysts increases system instability and leads toaggregation, thus resulting in the loss of its catalytic properties. The use of molecular sieve supports isfundamental to prevent the undesirable aggregation and loss of nanocatalysts [17,18].
Moreover, MCM-41 has gained attention for its flexibility regarding the silica feedstock forsynthesis. Recently, it has been produced from greener sources of silica such as coal fly ash (CFA) [12],rice husk ash [19], iron ore residues [20], wheat stem ash (WSA) [21], and MPI silica from beachsand [22,23], used in this study. This material has been functionalized by adding active sites to itssurface for promoting new chemical interactions in the support-site-adsorbate system and improvingthe adsorptive treatment [24]. Researchers have observed that adsorbents functionalized withtransition metals are capable of capturing aromatic sulfur compounds refractory to HDS processes viaπ-complexation [25,26]. Furthermore, Ag species dispersed onto metal and semi-metal oxide adsorbentsgenerate materials described as high activity catalysts for oxidation of several toxic compounds suchas formaldehyde [27], benzene [28], toluene [29] and carbon monoxide [24], among others.
The Ag(0) sites present high reactivity both by adsorbing and activating atmospheric O2 atambient conditions (300 K, 1 atm) [30] and by increasing the mobility of lattice oxygens from theadsorbent structure. This increase in mobility can occur by bridging bonds between Ag(0) and themetal oxide molecules [28], but it is also reported by covalent bonding in the case of a more oxidizedstate of silver as Ag(I), and in a cation exchange of hydrolyzed silica silanol groups (Si-O-H) [31]. Thus,an instrumental technique such as X-ray photoemission spectroscopy (XPS) is required to identifythe chemical species in the sample and to indicate what kind of interactions could be involved inimpregnation and chemisorptions processes. This analysis is able to capture chemical changes inthe adsorbent surface after metal deposition and adsorption by recording displacements in bindingenergies of the atoms and ions involved in the mechanisms [32].
This paper proposes a low-cost method for mitigating sulfur content in diesel fuel based on theadsorption of organosulfur compounds over Ag and Ni impregnated MCM-41 supports from beachsand silica, in a complementary process to the hydrodesulfurzation (HDS) applied in refineries with agreener and effective approach. Furthermore, high-efficiency characterization techniques such as X-rayphotoelectron spectroscopy (XPS) and high-resolution transmission electron microscopy (HRTEM)were used to enable the more accurate analysis of the different species and interaction mechanisms inthe metal-support-organosulfur system, and were associated with a deep evaluation of the kinetic andthermodynamic features.
246
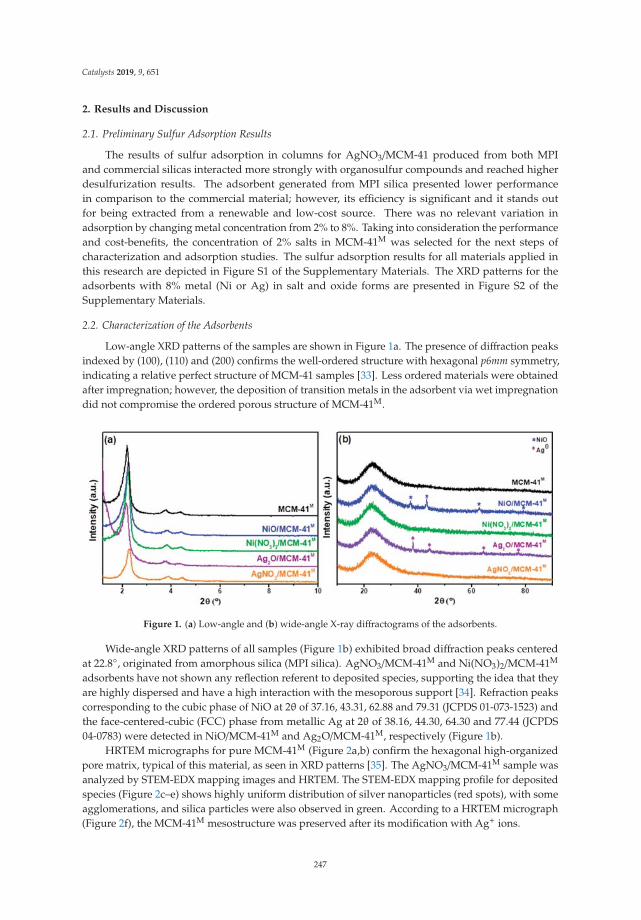
Catalysts 2019, 9, 651
2. Results and Discussion
2.1. Preliminary Sulfur Adsorption Results
The results of sulfur adsorption in columns for AgNO3/MCM-41 produced from both MPIand commercial silicas interacted more strongly with organosulfur compounds and reached higherdesulfurization results. The adsorbent generated from MPI silica presented lower performancein comparison to the commercial material; however, its efficiency is significant and it stands outfor being extracted from a renewable and low-cost source. There was no relevant variation inadsorption by changing metal concentration from 2% to 8%. Taking into consideration the performanceand cost-benefits, the concentration of 2% salts in MCM-41M was selected for the next steps ofcharacterization and adsorption studies. The sulfur adsorption results for all materials applied inthis research are depicted in Figure S1 of the Supplementary Materials. The XRD patterns for theadsorbents with 8% metal (Ni or Ag) in salt and oxide forms are presented in Figure S2 of theSupplementary Materials.
2.2. Characterization of the Adsorbents
Low-angle XRD patterns of the samples are shown in Figure 1a. The presence of diffraction peaksindexed by (100), (110) and (200) confirms the well-ordered structure with hexagonal p6mm symmetry,indicating a relative perfect structure of MCM-41 samples [33]. Less ordered materials were obtainedafter impregnation; however, the deposition of transition metals in the adsorbent via wet impregnationdid not compromise the ordered porous structure of MCM-41M.
Figure 1. (a) Low-angle and (b) wide-angle X-ray diffractograms of the adsorbents.
Wide-angle XRD patterns of all samples (Figure 1b) exhibited broad diffraction peaks centeredat 22.8◦, originated from amorphous silica (MPI silica). AgNO3/MCM-41M and Ni(NO3)2/MCM-41M
adsorbents have not shown any reflection referent to deposited species, supporting the idea that theyare highly dispersed and have a high interaction with the mesoporous support [34]. Refraction peakscorresponding to the cubic phase of NiO at 2θ of 37.16, 43.31, 62.88 and 79.31 (JCPDS 01-073-1523) andthe face-centered-cubic (FCC) phase from metallic Ag at 2θ of 38.16, 44.30, 64.30 and 77.44 (JCPDS04-0783) were detected in NiO/MCM-41M and Ag2O/MCM-41M, respectively (Figure 1b).
HRTEM micrographs for pure MCM-41M (Figure 2a,b) confirm the hexagonal high-organizedpore matrix, typical of this material, as seen in XRD patterns [35]. The AgNO3/MCM-41M sample wasanalyzed by STEM-EDX mapping images and HRTEM. The STEM-EDX mapping profile for depositedspecies (Figure 2c–e) shows highly uniform distribution of silver nanoparticles (red spots), with someagglomerations, and silica particles were also observed in green. According to a HRTEM micrograph(Figure 2f), the MCM-41M mesostructure was preserved after its modification with Ag+ ions.
247
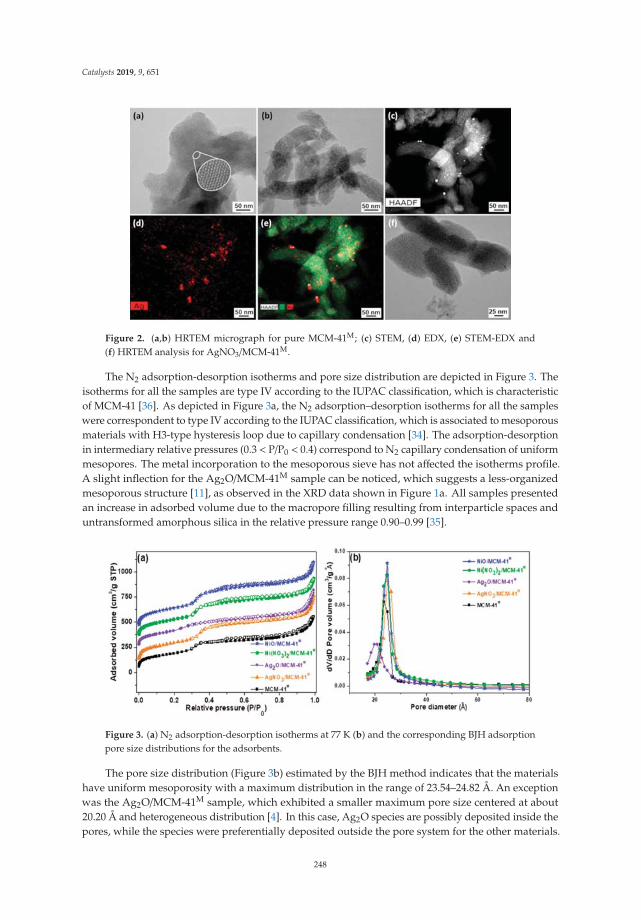
Catalysts 2019, 9, 651
Figure 2. (a,b) HRTEM micrograph for pure MCM-41M; (c) STEM, (d) EDX, (e) STEM-EDX and(f) HRTEM analysis for AgNO3/MCM-41M.
The N2 adsorption-desorption isotherms and pore size distribution are depicted in Figure 3. Theisotherms for all the samples are type IV according to the IUPAC classification, which is characteristicof MCM-41 [36]. As depicted in Figure 3a, the N2 adsorption–desorption isotherms for all the sampleswere correspondent to type IV according to the IUPAC classification, which is associated to mesoporousmaterials with H3-type hysteresis loop due to capillary condensation [34]. The adsorption-desorptionin intermediary relative pressures (0.3 < P/P0 < 0.4) correspond to N2 capillary condensation of uniformmesopores. The metal incorporation to the mesoporous sieve has not affected the isotherms profile.A slight inflection for the Ag2O/MCM-41M sample can be noticed, which suggests a less-organizedmesoporous structure [11], as observed in the XRD data shown in Figure 1a. All samples presentedan increase in adsorbed volume due to the macropore filling resulting from interparticle spaces anduntransformed amorphous silica in the relative pressure range 0.90–0.99 [35].
Figure 3. (a) N2 adsorption-desorption isotherms at 77 K (b) and the corresponding BJH adsorptionpore size distributions for the adsorbents.
The pore size distribution (Figure 3b) estimated by the BJH method indicates that the materialshave uniform mesoporosity with a maximum distribution in the range of 23.54–24.82 Å. An exceptionwas the Ag2O/MCM-41M sample, which exhibited a smaller maximum pore size centered at about20.20 Å and heterogeneous distribution [4]. In this case, Ag2O species are possibly deposited inside thepores, while the species were preferentially deposited outside the pore system for the other materials.
248
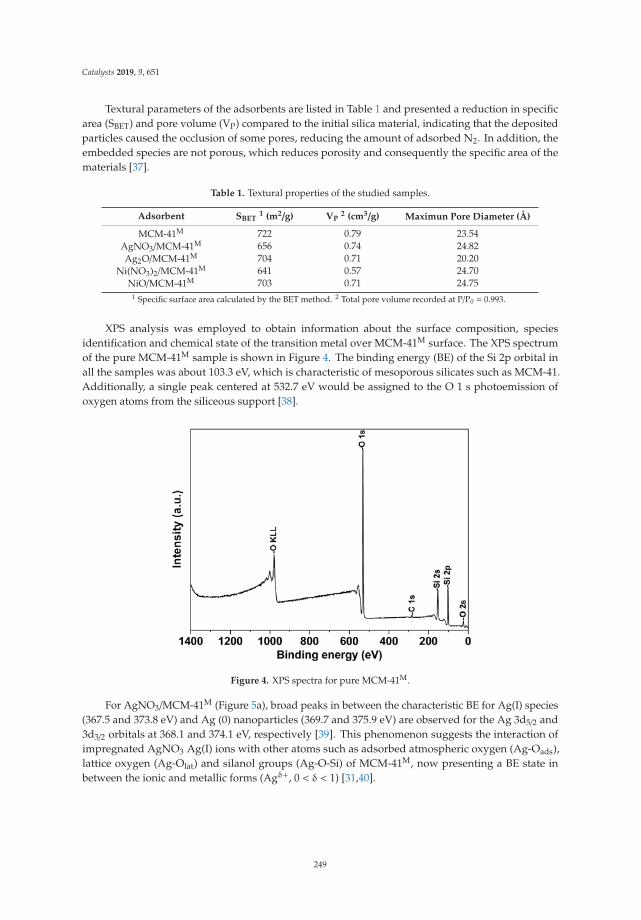
Catalysts 2019, 9, 651
Textural parameters of the adsorbents are listed in Table 1 and presented a reduction in specificarea (SBET) and pore volume (VP) compared to the initial silica material, indicating that the depositedparticles caused the occlusion of some pores, reducing the amount of adsorbed N2. In addition, theembedded species are not porous, which reduces porosity and consequently the specific area of thematerials [37].
Table 1. Textural properties of the studied samples.
Adsorbent SBET1 (m2/g) VP
2 (cm3/g) Maximun Pore Diameter (Å)
MCM-41M 722 0.79 23.54AgNO3/MCM-41M 656 0.74 24.82Ag2O/MCM-41M 704 0.71 20.20
Ni(NO3)2/MCM-41M 641 0.57 24.70NiO/MCM-41M 703 0.71 24.75
1 Specific surface area calculated by the BET method. 2 Total pore volume recorded at P/P0 = 0.993.
XPS analysis was employed to obtain information about the surface composition, speciesidentification and chemical state of the transition metal over MCM-41M surface. The XPS spectrumof the pure MCM-41M sample is shown in Figure 4. The binding energy (BE) of the Si 2p orbital inall the samples was about 103.3 eV, which is characteristic of mesoporous silicates such as MCM-41.Additionally, a single peak centered at 532.7 eV would be assigned to the O 1 s photoemission ofoxygen atoms from the siliceous support [38].
Figure 4. XPS spectra for pure MCM-41M.
For AgNO3/MCM-41M (Figure 5a), broad peaks in between the characteristic BE for Ag(I) species(367.5 and 373.8 eV) and Ag (0) nanoparticles (369.7 and 375.9 eV) are observed for the Ag 3d5/2 and3d3/2 orbitals at 368.1 and 374.1 eV, respectively [39]. This phenomenon suggests the interaction ofimpregnated AgNO3 Ag(I) ions with other atoms such as adsorbed atmospheric oxygen (Ag-Oads),lattice oxygen (Ag-Olat) and silanol groups (Ag-O-Si) of MCM-41M, now presenting a BE state inbetween the ionic and metallic forms (Agδ+, 0 < δ < 1) [31,40].
249
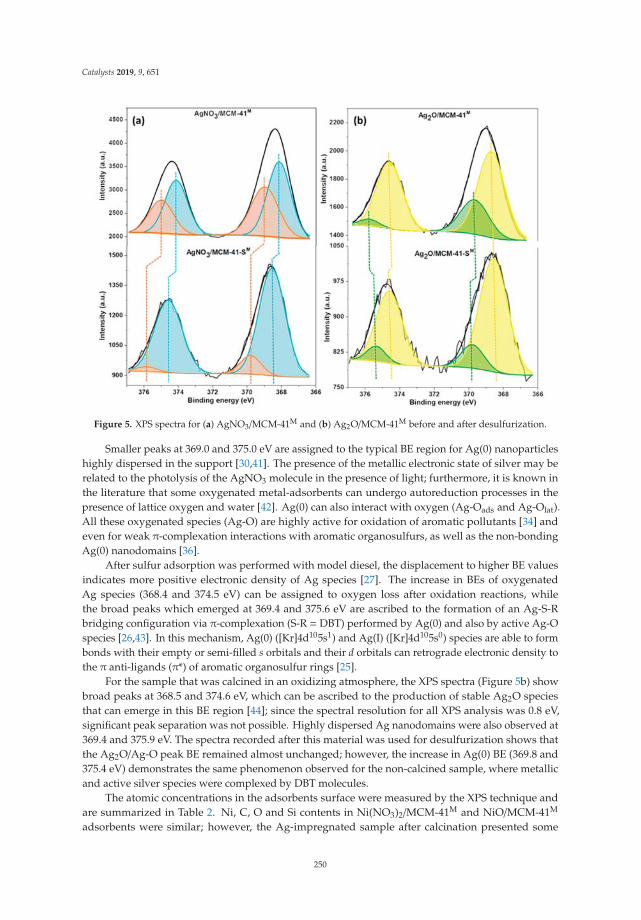
Catalysts 2019, 9, 651
Figure 5. XPS spectra for (a) AgNO3/MCM-41M and (b) Ag2O/MCM-41M before and after desulfurization.
Smaller peaks at 369.0 and 375.0 eV are assigned to the typical BE region for Ag(0) nanoparticleshighly dispersed in the support [30,41]. The presence of the metallic electronic state of silver may berelated to the photolysis of the AgNO3 molecule in the presence of light; furthermore, it is known inthe literature that some oxygenated metal-adsorbents can undergo autoreduction processes in thepresence of lattice oxygen and water [42]. Ag(0) can also interact with oxygen (Ag-Oads and Ag-Olat).All these oxygenated species (Ag-O) are highly active for oxidation of aromatic pollutants [34] andeven for weak π-complexation interactions with aromatic organosulfurs, as well as the non-bondingAg(0) nanodomains [36].
After sulfur adsorption was performed with model diesel, the displacement to higher BE valuesindicates more positive electronic density of Ag species [27]. The increase in BEs of oxygenatedAg species (368.4 and 374.5 eV) can be assigned to oxygen loss after oxidation reactions, whilethe broad peaks which emerged at 369.4 and 375.6 eV are ascribed to the formation of an Ag-S-Rbridging configuration via π-complexation (S-R = DBT) performed by Ag(0) and also by active Ag-Ospecies [26,43]. In this mechanism, Ag(0) ([Kr]4d105s1) and Ag(I) ([Kr]4d105s0) species are able to formbonds with their empty or semi-filled s orbitals and their d orbitals can retrograde electronic density tothe π anti-ligands (π*) of aromatic organosulfur rings [25].
For the sample that was calcined in an oxidizing atmosphere, the XPS spectra (Figure 5b) showbroad peaks at 368.5 and 374.6 eV, which can be ascribed to the production of stable Ag2O speciesthat can emerge in this BE region [44]; since the spectral resolution for all XPS analysis was 0.8 eV,significant peak separation was not possible. Highly dispersed Ag nanodomains were also observed at369.4 and 375.9 eV. The spectra recorded after this material was used for desulfurization shows thatthe Ag2O/Ag-O peak BE remained almost unchanged; however, the increase in Ag(0) BE (369.8 and375.4 eV) demonstrates the same phenomenon observed for the non-calcined sample, where metallicand active silver species were complexed by DBT molecules.
The atomic concentrations in the adsorbents surface were measured by the XPS technique andare summarized in Table 2. Ni, C, O and Si contents in Ni(NO3)2/MCM-41M and NiO/MCM-41M
adsorbents were similar; however, the Ag-impregnated sample after calcination presented some
250
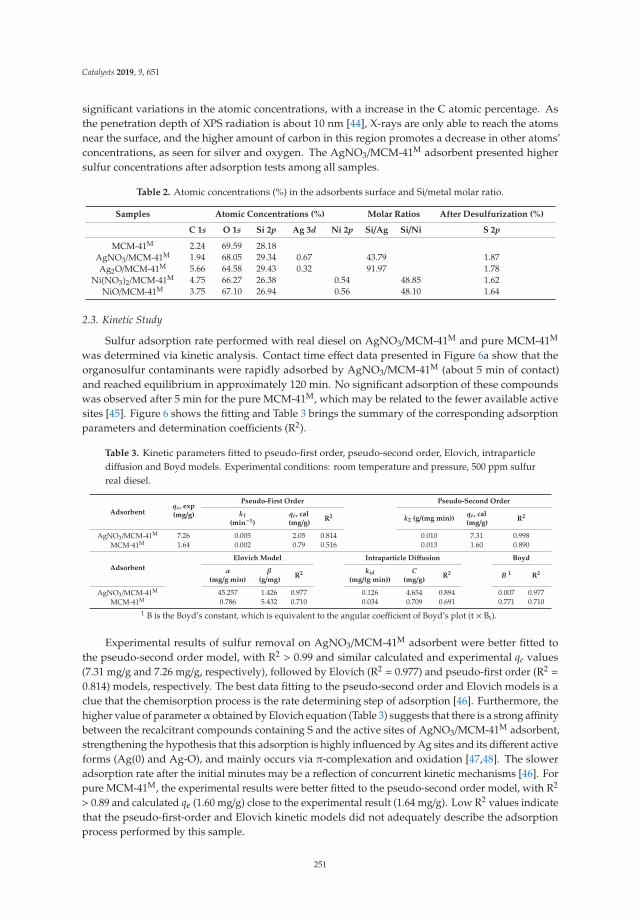
Catalysts 2019, 9, 651
significant variations in the atomic concentrations, with a increase in the C atomic percentage. Asthe penetration depth of XPS radiation is about 10 nm [44], X-rays are only able to reach the atomsnear the surface, and the higher amount of carbon in this region promotes a decrease in other atoms’concentrations, as seen for silver and oxygen. The AgNO3/MCM-41M adsorbent presented highersulfur concentrations after adsorption tests among all samples.
Table 2. Atomic concentrations (%) in the adsorbents surface and Si/metal molar ratio.
Samples Atomic Concentrations (%) Molar Ratios After Desulfurization (%)
C 1s O 1s Si 2p Ag 3d Ni 2p Si/Ag Si/Ni S 2p
MCM-41M 2.24 69.59 28.18AgNO3/MCM-41M 1.94 68.05 29.34 0.67 43.79 1.87Ag2O/MCM-41M 5.66 64.58 29.43 0.32 91.97 1.78
Ni(NO3)2/MCM-41M 4.75 66.27 26.38 0.54 48.85 1.62NiO/MCM-41M 3.75 67.10 26.94 0.56 48.10 1.64
2.3. Kinetic Study
Sulfur adsorption rate performed with real diesel on AgNO3/MCM-41M and pure MCM-41M
was determined via kinetic analysis. Contact time effect data presented in Figure 6a show that theorganosulfur contaminants were rapidly adsorbed by AgNO3/MCM-41M (about 5 min of contact)and reached equilibrium in approximately 120 min. No significant adsorption of these compoundswas observed after 5 min for the pure MCM-41M, which may be related to the fewer available activesites [45]. Figure 6 shows the fitting and Table 3 brings the summary of the corresponding adsorptionparameters and determination coefficients (R2).
Table 3. Kinetic parameters fitted to pseudo-first order, pseudo-second order, Elovich, intraparticlediffusion and Boyd models. Experimental conditions: room temperature and pressure, 500 ppm sulfurreal diesel.
Adsorbentqe, exp(mg/g)
Pseudo-First Order Pseudo-Second Order
k1(min−1)
qe, cal(mg/g)
R2 k2 (g/(mg min))qe, cal(mg/g)
R2
AgNO3/MCM-41M 7.26 0.005 2.05 0.814 0.010 7.31 0.998MCM-41M 1.64 0.002 0.79 0.516 0.013 1.60 0.890
Adsorbent
Elovich Model Intraparticle Diffusion Boyd
α(mg/g min)
β(g/mg)
R2 kid(mg/(g min))
C(mg/g)
R2 B 1 R2
AgNO3/MCM-41M 45.257 1.426 0.977 0.126 4.654 0.894 0.007 0.977MCM-41M 0.786 5.432 0.710 0.034 0.709 0.691 0.771 0.710
1 B is the Boyd’s constant, which is equivalent to the angular coefficient of Boyd’s plot (t × Bt).
Experimental results of sulfur removal on AgNO3/MCM-41M adsorbent were better fitted tothe pseudo-second order model, with R2 > 0.99 and similar calculated and experimental qe values(7.31 mg/g and 7.26 mg/g, respectively), followed by Elovich (R2 = 0.977) and pseudo-first order (R2 =
0.814) models, respectively. The best data fitting to the pseudo-second order and Elovich models is aclue that the chemisorption process is the rate determining step of adsorption [46]. Furthermore, thehigher value of parameterα obtained by Elovich equation (Table 3) suggests that there is a strong affinitybetween the recalcitrant compounds containing S and the active sites of AgNO3/MCM-41M adsorbent,strengthening the hypothesis that this adsorption is highly influenced by Ag sites and its different activeforms (Ag(0) and Ag-O), and mainly occurs via π-complexation and oxidation [47,48]. The sloweradsorption rate after the initial minutes may be a reflection of concurrent kinetic mechanisms [46]. Forpure MCM-41M, the experimental results were better fitted to the pseudo-second order model, with R2
> 0.89 and calculated qe (1.60 mg/g) close to the experimental result (1.64 mg/g). Low R2 values indicatethat the pseudo-first-order and Elovich kinetic models did not adequately describe the adsorptionprocess performed by this sample.
251
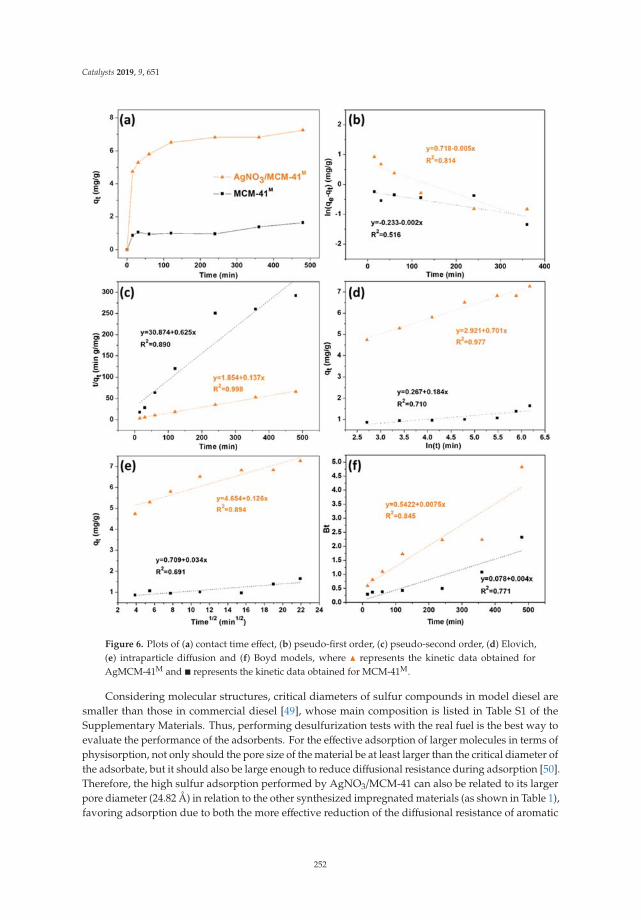
Catalysts 2019, 9, 651
Figure 6. Plots of (a) contact time effect, (b) pseudo-first order, (c) pseudo-second order, (d) Elovich,(e) intraparticle diffusion and (f) Boyd models, where � represents the kinetic data obtained forAgMCM-41M and � represents the kinetic data obtained for MCM-41M.
Considering molecular structures, critical diameters of sulfur compounds in model diesel aresmaller than those in commercial diesel [49], whose main composition is listed in Table S1 of theSupplementary Materials. Thus, performing desulfurization tests with the real fuel is the best way toevaluate the performance of the adsorbents. For the effective adsorption of larger molecules in terms ofphysisorption, not only should the pore size of the material be at least larger than the critical diameter ofthe adsorbate, but it should also be large enough to reduce diffusional resistance during adsorption [50].Therefore, the high sulfur adsorption performed by AgNO3/MCM-41 can also be related to its largerpore diameter (24.82 Å) in relation to the other synthesized impregnated materials (as shown in Table 1),favoring adsorption due to both the more effective reduction of the diffusional resistance of aromatic
252
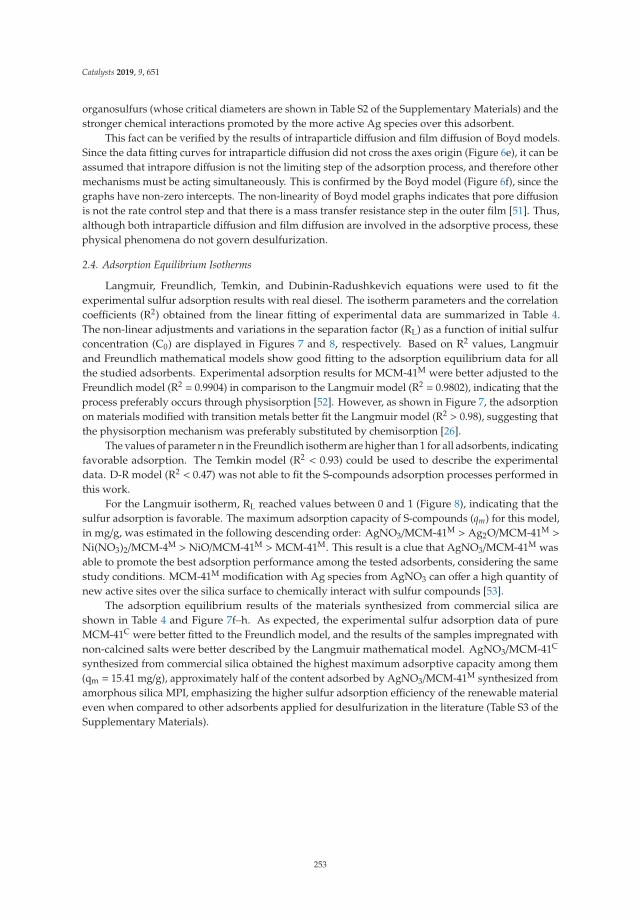
Catalysts 2019, 9, 651
organosulfurs (whose critical diameters are shown in Table S2 of the Supplementary Materials) and thestronger chemical interactions promoted by the more active Ag species over this adsorbent.
This fact can be verified by the results of intraparticle diffusion and film diffusion of Boyd models.Since the data fitting curves for intraparticle diffusion did not cross the axes origin (Figure 6e), it can beassumed that intrapore diffusion is not the limiting step of the adsorption process, and therefore othermechanisms must be acting simultaneously. This is confirmed by the Boyd model (Figure 6f), since thegraphs have non-zero intercepts. The non-linearity of Boyd model graphs indicates that pore diffusionis not the rate control step and that there is a mass transfer resistance step in the outer film [51]. Thus,although both intraparticle diffusion and film diffusion are involved in the adsorptive process, thesephysical phenomena do not govern desulfurization.
2.4. Adsorption Equilibrium Isotherms
Langmuir, Freundlich, Temkin, and Dubinin-Radushkevich equations were used to fit theexperimental sulfur adsorption results with real diesel. The isotherm parameters and the correlationcoefficients (R2) obtained from the linear fitting of experimental data are summarized in Table 4.The non-linear adjustments and variations in the separation factor (RL) as a function of initial sulfurconcentration (C0) are displayed in Figures 7 and 8, respectively. Based on R2 values, Langmuirand Freundlich mathematical models show good fitting to the adsorption equilibrium data for allthe studied adsorbents. Experimental adsorption results for MCM-41M were better adjusted to theFreundlich model (R2 = 0.9904) in comparison to the Langmuir model (R2 = 0.9802), indicating that theprocess preferably occurs through physisorption [52]. However, as shown in Figure 7, the adsorptionon materials modified with transition metals better fit the Langmuir model (R2 > 0.98), suggesting thatthe physisorption mechanism was preferably substituted by chemisorption [26].
The values of parameter n in the Freundlich isotherm are higher than 1 for all adsorbents, indicatingfavorable adsorption. The Temkin model (R2 < 0.93) could be used to describe the experimentaldata. D-R model (R2 < 0.47) was not able to fit the S-compounds adsorption processes performed inthis work.
For the Langmuir isotherm, RL reached values between 0 and 1 (Figure 8), indicating that thesulfur adsorption is favorable. The maximum adsorption capacity of S-compounds (qm) for this model,in mg/g, was estimated in the following descending order: AgNO3/MCM-41M > Ag2O/MCM-41M >
Ni(NO3)2/MCM-4M > NiO/MCM-41M >MCM-41M. This result is a clue that AgNO3/MCM-41M wasable to promote the best adsorption performance among the tested adsorbents, considering the samestudy conditions. MCM-41M modification with Ag species from AgNO3 can offer a high quantity ofnew active sites over the silica surface to chemically interact with sulfur compounds [53].
The adsorption equilibrium results of the materials synthesized from commercial silica areshown in Table 4 and Figure 7f–h. As expected, the experimental sulfur adsorption data of pureMCM-41C were better fitted to the Freundlich model, and the results of the samples impregnated withnon-calcined salts were better described by the Langmuir mathematical model. AgNO3/MCM-41C
synthesized from commercial silica obtained the highest maximum adsorptive capacity among them(qm = 15.41 mg/g), approximately half of the content adsorbed by AgNO3/MCM-41M synthesized fromamorphous silica MPI, emphasizing the higher sulfur adsorption efficiency of the renewable materialeven when compared to other adsorbents applied for desulfurization in the literature (Table S3 of theSupplementary Materials).
253

Catalysts 2019, 9, 651
Figure 7. Non-linear adjustments of Langmuir, Freundlich, Temkin and Dubinin-Radushkevich(D-R) equilibrium isotherms of S-compounds adsorption over (a) AgNO3/MCM-41M,(b) Ag2O/MCM-41M, (c) Ni(NO3)2/MCM-41M, (d) NiO/MCM-41M, (e) MCM-41M, (f) AgNO3/MCM-41C,(g) Ni(NO3)2/MCM-41C and (h) MCM-41C. Experimental conditions: room temperature and pressure,real diesel with sulfur concecntration ranging from 25 to 1000 ppm.
254
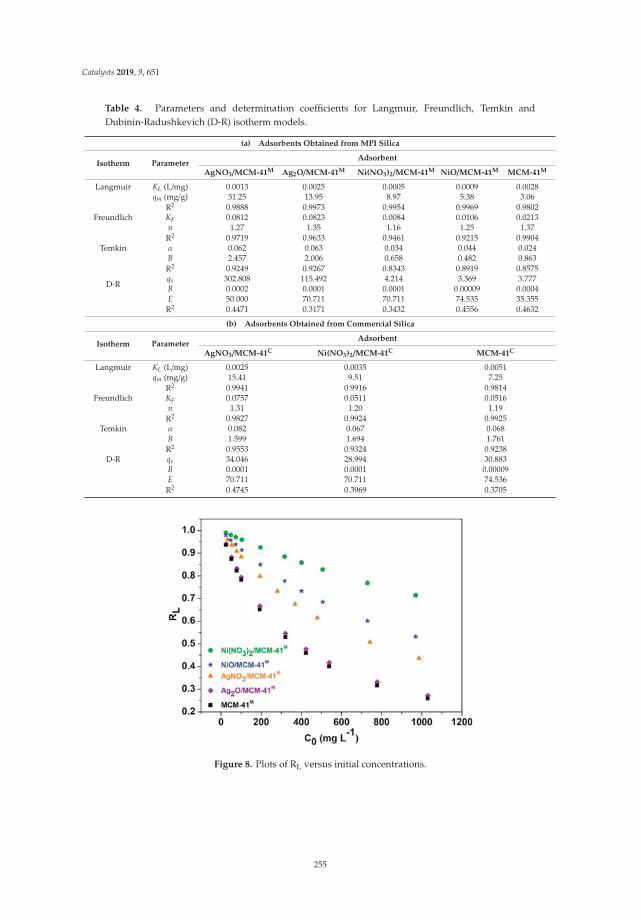
Catalysts 2019, 9, 651
Table 4. Parameters and determination coefficients for Langmuir, Freundlich, Temkin andDubinin-Radushkevich (D-R) isotherm models.
(a) Adsorbents Obtained from MPI Silica
Isotherm ParameterAdsorbent
AgNO3/MCM-41M Ag2O/MCM-41M Ni(NO3)2/MCM-41M NiO/MCM-41M MCM-41M
Langmuir KL (L/mg) 0.0013 0.0025 0.0005 0.0009 0.0028qm (mg/g) 31.25 13.95 8.97 5.38 3.06
R2 0.9888 0.9973 0.9954 0.9969 0.9802Freundlich KF 0.0812 0.0823 0.0084 0.0106 0.0213
n 1.27 1.35 1.16 1.25 1.37R2 0.9719 0.9633 0.9461 0.9215 0.9904
Temkin α 0.062 0.063 0.034 0.044 0.024B 2.457 2.006 0.658 0.482 0.863
R2 0.9249 0.9267 0.8343 0.8919 0.8575
D-Rqs 302.808 115.492 4.214 3.369 3.777B 0.0002 0.0001 0.0001 0.00009 0.0004E 50.000 70.711 70.711 74.535 35.355
R2 0.4471 0.3171 0.3432 0.4556 0.4632
(b) Adsorbents Obtained from Commercial Silica
Isotherm ParameterAdsorbent
AgNO3/MCM-41C Ni(NO3)2/MCM-41C MCM-41C
Langmuir KL (L/mg) 0.0025 0.0035 0.0051qm (mg/g) 15.41 9.51 7.25
R2 0.9941 0.9916 0.9814Freundlich KF 0.0757 0.0511 0.0516
n 1.31 1.20 1.19R2 0.9827 0.9924 0.9925
Temkin α 0.082 0.067 0.068B 1.599 1.694 1.761
R2 0.9553 0.9324 0.9238D-R qs 34.046 28.994 30.883
B 0.0001 0.0001 0.00009E 70.711 70.711 74.536
R2 0.4745 0.3969 0.3705
Figure 8. Plots of RL versus initial concentrations.
255
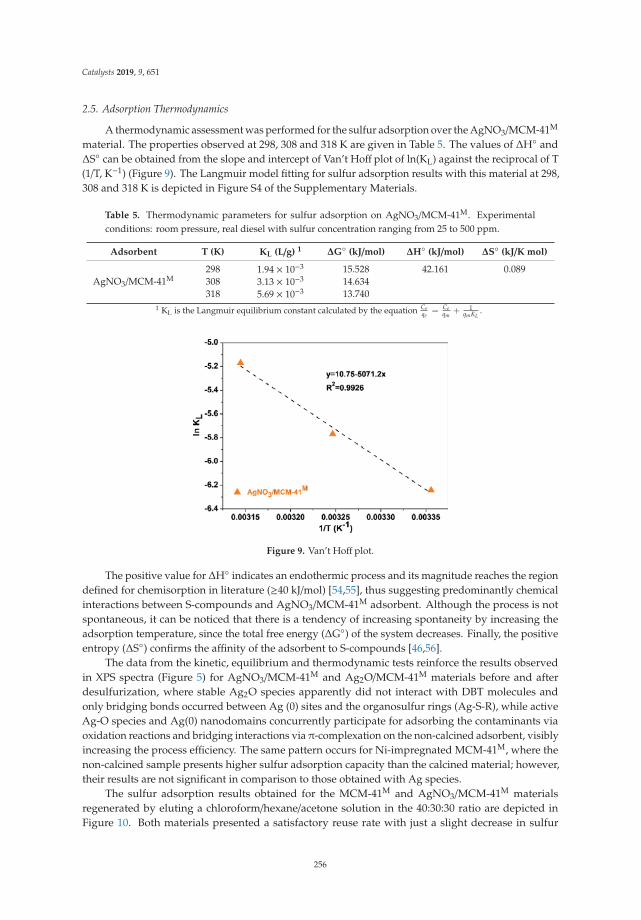
Catalysts 2019, 9, 651
2.5. Adsorption Thermodynamics
A thermodynamic assessment was performed for the sulfur adsorption over the AgNO3/MCM-41M
material. The properties observed at 298, 308 and 318 K are given in Table 5. The values of ΔH◦ andΔS◦ can be obtained from the slope and intercept of Van’t Hoff plot of ln(KL) against the reciprocal of T(1/T, K−1) (Figure 9). The Langmuir model fitting for sulfur adsorption results with this material at 298,308 and 318 K is depicted in Figure S4 of the Supplementary Materials.
Table 5. Thermodynamic parameters for sulfur adsorption on AgNO3/MCM-41M. Experimentalconditions: room pressure, real diesel with sulfur concentration ranging from 25 to 500 ppm.
Adsorbent T (K) KL (L/g) 1 ΔG◦ (kJ/mol) ΔH◦ (kJ/mol) ΔS◦ (kJ/K mol)
AgNO3/MCM-41M298 1.94 × 10⁻³ 15.528 42.161 0.089308 3.13 × 10⁻³ 14.634318 5.69 × 10⁻³ 13.740
1 KL is the Langmuir equilibrium constant calculated by the equation Ceqe
= Ceqm
+ 1qmKL
.
Figure 9. Van’t Hoff plot.
The positive value for ΔH◦ indicates an endothermic process and its magnitude reaches the regiondefined for chemisorption in literature (≥40 kJ/mol) [54,55], thus suggesting predominantly chemicalinteractions between S-compounds and AgNO3/MCM-41M adsorbent. Although the process is notspontaneous, it can be noticed that there is a tendency of increasing spontaneity by increasing theadsorption temperature, since the total free energy (ΔG◦) of the system decreases. Finally, the positiveentropy (ΔS◦) confirms the affinity of the adsorbent to S-compounds [46,56].
The data from the kinetic, equilibrium and thermodynamic tests reinforce the results observedin XPS spectra (Figure 5) for AgNO3/MCM-41M and Ag2O/MCM-41M materials before and afterdesulfurization, where stable Ag2O species apparently did not interact with DBT molecules andonly bridging bonds occurred between Ag (0) sites and the organosulfur rings (Ag-S-R), while activeAg-O species and Ag(0) nanodomains concurrently participate for adsorbing the contaminants viaoxidation reactions and bridging interactions via π-complexation on the non-calcined adsorbent, visiblyincreasing the process efficiency. The same pattern occurs for Ni-impregnated MCM-41M, where thenon-calcined sample presents higher sulfur adsorption capacity than the calcined material; however,their results are not significant in comparison to those obtained with Ag species.
The sulfur adsorption results obtained for the MCM-41M and AgNO3/MCM-41M materialsregenerated by eluting a chloroform/hexane/acetone solution in the 40:30:30 ratio are depicted inFigure 10. Both materials presented a satisfactory reuse rate with just a slight decrease in sulfur
256

Catalysts 2019, 9, 651
adsorption after five regeneration cycles, thus indicating that the methodology was successful inremoving the adsorbed organosulfurs without compromising their adsorption efficiency.
Figure 10. Sulfur adsorption results for the regenerated materials. Experimental conditions: roomtemperature and pressure.
3. Materials and Methods
3.1. Synthesis
Amorphous silica (MPI) was synthesized from beach sand following a new methodology describedin our previous publication [23]. This silica presents isotherm type III, typical of some porous solidswith meso and macroporosity, 33.54 m2/g surface area (SBET), 130.3 Å pore diameter and 0.18 cm3/gpore volume. In addition, this material presents a chemical composition of 96.05% SiO2 and mainimpurities such as K2O, Fe2O3 and CaO with average contents of 1.84%, 1.12% and 0.81%, respectively.
MCM-41 was synthesized by the hydrothermal method described in [22,23] using MPI silica,with some modifications. The reaction system was composed of two initial solutions: (I) a mixturecontaining 14.75 g of MPI silica, 4.66 g of sodium hydroxide (PA, Vetec|Sigma-Aldrich, Duque deCaxias, RJ, Brazil) and 105.0 mL of distillated water, which was stirred for 2 h at 333 K; and (II) amixture containing 21.68 g of cetyltrimethylammonium bromide (CTAB) (98.0%, Vetec|Sigma-Aldrich,Duque de Caxias, RJ, Brazil) and 105.0 mL of distillated water, stirred for 1 h at room temperature.Then, mixture (I) was added to (II) and stirred for 1 h at room temperature. The final gel had a molarcomposition of 1.0 CTAB:4.0 SiO2:2.0 NaOH:200.0 H2O, and was added into a teflon autoclave at 373 Kfor 96 h. The pH was adjusted daily with a 30% acetic acid (99.8%, Proquímios, Bangu, RJ, Brazil)solution until achieving a range of 9.5–10.0 pH. Then, the gel was washed with distilled water and 37%HCl (PA, Proquímios, Bangu, RJ, Brazil) solution in ethanol (99.5%, NEON, São Paulo, SP, Brazil) at 2%.The material was recovered by vacuum filtration and then dried at 393 K for 2 h. Finally, the solid wascalcinated in air flow at 823 K with 278 K/min heating rate for 5 h. MCM-41 was also synthesized withcommercial silica (silica gel 60, Macherey-Nagel, Düren, Germany), MCM-41C, by following the samemethodology for comparison with MCM-41M in sulfur adsorption tests.
3.2. Adsorbent Modification
The mesoporous MCM-41 silica was modified with Ag+ and Ni2+ cations from silver nitrate(99.8%, Vetec|Sigma-Aldrich, Duque de Caxias, RJ, Brazil) and hexa-hydrated nickel nitrate (99.999%,Sigma-Aldrich, St. Louis, MO, USA) salts via wet impregnation. Ethanolic solutions of AgNO3
(0.03 mol/L for 2% (w/w) and 0.12 mol/L for 8% (w/w) concentrations) and Ni(NO3)2·6H2O (0.05 mol/Lfor 2% (w/w) and 0.22 for 8% (w/w)) salts were prepared and added to 3.0 g of calcinated MCM-41. Thefunctionalizations were performed in rotary evaporators at 120 rpm for 1 h at room temperature and3.5 h under progressive heating (283 K/30 min) in a water bath until the solvent completely evaporated.
257

Catalysts 2019, 9, 651
The modified adsorbents were dried in an oven at 393 K for 2h [57]. Next, 50% of the materialwas separated and denominated AgNO3/MCM-41 and Ni(NO3)2/MCM-41, while the other 50% wascalcinated at 773 K during 4 h in an oven at 278 K/min heating rate and denominated Ag2O/MCM-41and NiO/MCM-41.
3.3. Adsorbent Characterization
X-ray diffraction analyses (XRD) were performed using a Bruker D2 Phaser (Bruker AXS, Madison,WI, USA) with CuKα radiation (λ = 1.5406 Å), 30 kV filament, 10 mA current, Ni filter and aLYNXEYE detector. The XRD patterns were obtained in the range of 1◦–10◦ (low-angle) and 10◦–90◦(wide-angle) 2θ.
The textural parameters were evaluated via nitrogen adsorption–desorption isotherms at 77 K,as determined by an automatic ASAP 2420 system from Micrometrics (Micrometrics, Norcross, GA,USA). Prior to the measurements, the samples were previously degassed at 473 K and 10−4 mbar. Thepore size distribution was calculated by applying the Barrett–Joyner–Halenda (BJH) method to thedesorption branch of the N2 isotherm.
MCM-41M and AgNO3/MCM-41M were evaluated by high-resolution transmission electronmicroscopy (HRTEM) using a Philips CCCM 200 Supertwin-DX4 microscope. Scanning transmissionelectron microscopy (STEM) analysis and mapping data were recorded in a Helios Nanolab 650 (FEI,Brno, Czech Republic) instrument with a high-angle annular dark field (HAADF) detector, at 200 kVand 200 nA. The microanalysis was carried out with energy dispersive X-ray (EDAX) spectroscopySuper-X system provided with four X-ray detectors and an X-FEG beam.
X-ray photoelectron spectra (XPS) was collected using a Physical Electronics PHI 5700 (PhysicalElectronic, Minneapolis, MN, USA) spectrometer with non-monochromatic Al Kα radiation (95.2 W,15 kV, and 1486.6 eV) and a multi-channel detector. C1s peaks were used as an inner standardcalibration peak at 284.8 eV. The Multipack software version 9.6.0.15 was used for data analysis. Therecorded spectra were fitted using Gaussian–Lorentzian curves to more accurately determine thebinding energies of the different element core levels.
3.4. Real and Model Fuels
Diesel fuel samples containing 1234.9 ppm (high-sulfur) and 5.1 ppm (low-sulfur) sulfur werekindly donated by the Clara Camarão Potiguar Refinery (Guamaré/RN, Brazil). This material was usedfor equilibrium, kinetic and thermodynamic evaluation of sulfur adsorption tests performed in a batchsystem. Moreover, model diesel solutions prepared with dibenzothiophene (98.0%, Sigma-Aldrich, Co.,St. Louis, MO, USA) and n-decane (99.0%, Sigma-Aldrich, Co., St. Louis, MO, USA) in a concentrationof around 2000 ppm sulfur were used in a set of adsorption tests in fixed bed columns, exclusively forevaluating the composition of the adsorbents after desulfurization via XPS analysis, since real dieselhas many interferents in its composition and would generate noisy spectra.
3.5. Preliminary Adsorption Tests
All materials prepared in this work were subjected to initial sulfur adsorption tests with real dieselfuel samples (1234.9 ppm sulfur). The tests were performed in adsorption columns (0.61 cm × 30.0 cm)with downward flow. Each adsorbent was added to the glass columns up to 9.0 cm in height (about0.5 g of material), and a volume of 5.0 mL of diesel was kept constant during the experiments. The firstaliquots (0.3 mL) were collected and the sulfur content data were recorded using a total sulfur analyzervia ultraviolet fluorescence (UVF) spectrometry (Antek Multitek, PAC, L.P, Houston, TX, USA).
258
Catalysts 2019, 9, 651
3.6. Batch Adsorption
The adsorptive desulphurization tests were performed using the finite bath method at ambienttemperature and pressure. An amount of 0.3 g of adsorbent and 8.0 mL of diluted real diesel preparedby a solution of the high and low-sulfur samples were placed in erlenmeyer flasks under constantstirring (100 rpm) in a stirring table (SL 180/DT, Solab, Piracicaba, SP, Brazil). Different proportions ofreal diesel samples were used to produce the solutions with distinct sulfur concentrations which wereapplied in each test. The solids were separated by centrifugation and the residual sulfur contents inthe liquid phase were collected for quantification following ASTM D5453 methodology. Adsorptioneffectivity was measured by the UVF sulfur analyzer and the sulfur adsorption capacity per gram ofadsorbent at equilibrium (qe) was calculated using the following expression:
qe = (Ci −Ce)V/W (1)
where V is the diesel solution volume (L), W is the adsorbent mass (g) and Ci and Ce are the initialsulfur content in the fuel (mg/L) and at equilibrium, respectively.
3.6.1. Kinetic Tests
Kinetic tests were performed for MCM-41M and AgNO3/MCM-41M samples following themethodology described for batch adsorption using a real diesel solution with 500 ppm sulfur content.The supernatant fluid was collected at predetermined times between 5 and 180 min of stirring. Thegenerated models are used to explain the adsorption mechanism characteristics. Pseudo-first-order(Equation (2)), pseudo-second-order (Equation (3)), Elovich (Equation (4)), intra-particle diffusion(Equation (5)) and the film-diffusion model of Boyd (Equation (6)) were used to analyze the experimentaldata using the following equations [46]:
ln(qe − qt) = lnqe − k1t (2)
tqt
=1
k2q2e+
tqe
(3)
qt =1β
lnαβ+1β
lnt (4)
qt = kidt12 + C (5)
F = 1− 6π2
∞∑n=1
1n2 exp
(−n2Bt
)(6)
where qt and qe are the amounts of sulfur adsorbed (mg/g) at time t (min) and at equilibrium, respectively,k1 is the pseudo-first-order constant (min−1), k2 is the pseudo-second-order adsorption constant (mg/gmin), the parameter α is the initial adsorption rate of Elovich equation (mg/g min) and β is thedesorption constant (g/mg) and kid is the rate constant of the intra-particle diffusion models (mg/gmin1/2). F is fractional uptake (qt/qe) at a certain time and Bt is a mathematical function of F calculatedby Equations (7) and (8) [58]:
For F > 0.85, Bt = f (F) = −0.4977− ln(1− F) (7)
For F < 0.85, Bt = f (F) =
⎛⎜⎜⎜⎜⎜⎜⎜⎜⎝√π−
√π−
√π2F
3
⎞⎟⎟⎟⎟⎟⎟⎟⎟⎠2
(8)
259

Catalysts 2019, 9, 651
3.6.2. Adsorption Equilibrium Tests
The evaluation of sulfur adsorption equilibrium was performed in a batch system during 24 hwith samples of real diesel containing sulfur concentrations in the 25–1000 ppm range. Langmuir,Freundlich, Temkin and Dubinin-Radushkevich mathematical models were used to fit the experimentaldata of sulfur adsorption in order to explain the adsorption on the adsorbent/adsorbate system, aswell as predict their equilibrium parameters. The adsorption equilibrium of MCM-41C produced fromcommercial silica and impregnated with non-calcined salts was also evaluated for comparison with therenewable material. The Langmuir model (Equations (9) and (10)) was used to quantify and contrastthe performance of various adsorbents [59]:
qe =qmKLCe
1 + KLCe(9)
Ce
qe=
1qmKL
+Ce
qm(10)
where Ce (g/L) and qe (mg/g) are the equilibrium concentration of the adsorbate and adsorption capacityof the adsorbent, respectively; Langmuir qm is a constant expressing the maximum absorption of theadsorbate (mg/g) and KL is the Langmuir constant (L/g), also related to the adsorption energy and theaffinity of the adsorbent. Dimensionless constant commonly known as a separation factor (RL) definedby Weber and Chakravorti (1974) [60], can be given by the following equation:
RL = 1/(1 + KLC0) (11)
where C0 in mg/L is the initial concentration of the analytes and KL in L/mg is Langmuir constant. RL >
1 indicates an unfavorable process, RL = 1 indicates linearity, 0 < RL < 1 indicates a favorable processand RL = 0 signifies an irreversible adsorption.
The Freundlich model (Equations (12) and (13)) describes non-ideal and reversible adsorption,not being restricted to the formation of a monolayer [61]. This empirical model can be applied to theadsorption of multiple layers, with a non-uniform distribution of adsorption heat and affinities of theheterogeneous surface:
qe = KFC1ne (12)
lnqe = lnKF +1n
lnCe (13)
The Freundlich expression is an exponential equation and therefore assumes that the adsorbentconcentration in the surface increases with the concentration of adsorbate. With the use of thisexpression, an infinite amount of adsorption can theoretically occur [62]. The equation is widely usedin heterogeneous systems, where KF (L/g) and n are characteristic constants of Freundlich, whichindicate the adsorption capacity and adsorption intensity, respectively, where values of n in the range1 < n < 10 indicate favorable adsorption.
The Temkin isotherm model takes into consideration the effects of indirect adsorbate/adsorbateinteractions which suggest that the adsorption heat of all adsorbed molecules in the layer decreaseslinearly with coverage [47]. The model can be expressed according to Equation (14):
qe = βlnαCe (14)
where β is related to the heat of adsorption (J/mol) and α is the Temkin isotherm constant (L/g). TheTemkin linearized equation is given in Equation (15):
qe = βlnα+ βlnCe (15)
260
Catalysts 2019, 9, 651
The Dubinin-Radushkevich (D-R) isotherm expresses the adsorption mechanism on aheterogeneous and porous surface with variable parameters [63]. The D-R model is describedby Equation (16), and the linearized equation is presented in Equation (17):
qe = qse−βε2
(16)
lnqe = lnqs − βε2 (17)
where qs is the theoretical saturation capacity (mg/g), β is the D-R constant (mol2/kJ2) and ε is thePolanyi potential, and can be expressed as follows:
ε = RTln(1 + 1/Ce) (18)
where R is the universal gas constant (8.314 J/mol K), and T is the absolute temperature (K).The β constant is related to the mean free energy of adsorption which is computed through
Equation (19):E = 1/
√2β (19)
where E is the mean adsorption energy (kJ/mol). The values of E< 40 kJ/mol implies physical adsorptionwhile E > 40 kJ/mol suggests chemical adsorption [64].
Origin 2018 software (Origin Labs) was used to adjust the linearized equations of the models forcalculating the equilibrium parameters.
3.6.3. Sulfur Adsorption Thermodynamics
The effect of temperature in S-compounds adsorption was studied by varying the temperaturefrom 298, 308 and 318 K. The obtained thermodynamics parameters describe the variation or thetransformation of a system. The standard free energy (ΔG◦, kJ/mol), standard enthalpy change(ΔH◦, kJ/mol) and standard entropy change (ΔS◦, kJ/mol K) can be calculated from the followingEquations [54]:
ΔG◦ = −RTln(KL) = ΔH◦ − TΔS◦ (20)
ln(KL) = −ΔH◦RT
+ΔS◦
R(21)
where KL is the Langmuir isotherm constant, R is the gas constant (8.314 J/K mol) and T is temperaturein Kelvin.
3.6.4. Regeneration Tests
The regeneration methodology consisted of packing 1 g of residual adsorbent collected from thesulfur adsorption tests in a column with ~10 mm diameter and 50 cm length, forming a fixed bedwith about 8 cm adsorbent. Next, 25 mL of a chloroform/hexane/acetone solution in a ratio of 40:30:30(chosen after some preliminary tests using various proportions) at 323 K were added to the column.When the entire solution was completely eluted, the washed adsorbent was heated to 343 K in a rotaryevaporator for 1 h to evaporate the solvent residue and replaced in a column for a new adsorptiontest. This evaluation was repeated for 5 regeneration cycles. A process flow diagram of the overallmethodology is presented in Scheme 1.
261
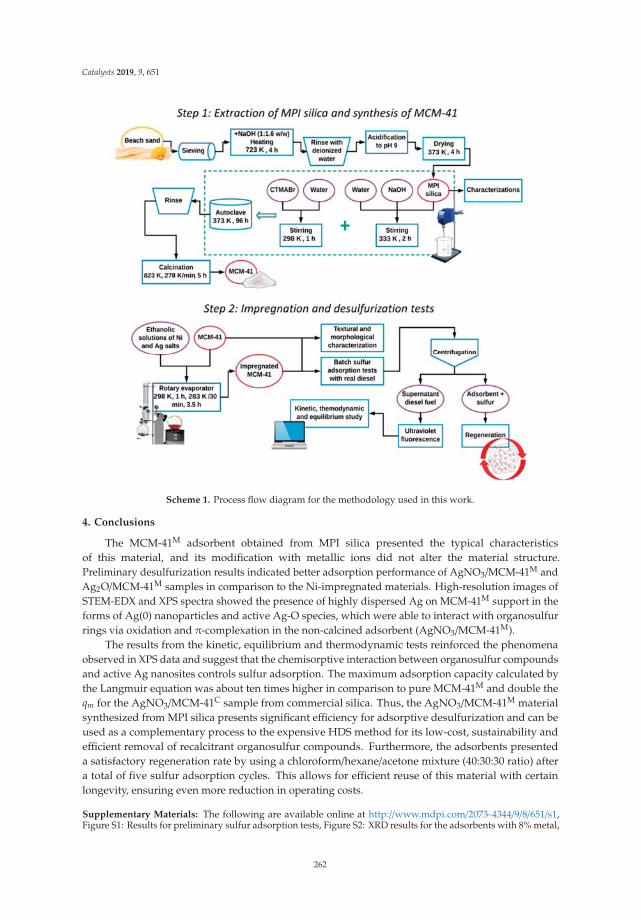
Catalysts 2019, 9, 651
Scheme 1. Process flow diagram for the methodology used in this work.
4. Conclusions
The MCM-41M adsorbent obtained from MPI silica presented the typical characteristicsof this material, and its modification with metallic ions did not alter the material structure.Preliminary desulfurization results indicated better adsorption performance of AgNO3/MCM-41M andAg2O/MCM-41M samples in comparison to the Ni-impregnated materials. High-resolution images ofSTEM-EDX and XPS spectra showed the presence of highly dispersed Ag on MCM-41M support in theforms of Ag(0) nanoparticles and active Ag-O species, which were able to interact with organosulfurrings via oxidation and π-complexation in the non-calcined adsorbent (AgNO3/MCM-41M).
The results from the kinetic, equilibrium and thermodynamic tests reinforced the phenomenaobserved in XPS data and suggest that the chemisorptive interaction between organosulfur compoundsand active Ag nanosites controls sulfur adsorption. The maximum adsorption capacity calculated bythe Langmuir equation was about ten times higher in comparison to pure MCM-41M and double theqm for the AgNO3/MCM-41C sample from commercial silica. Thus, the AgNO3/MCM-41M materialsynthesized from MPI silica presents significant efficiency for adsorptive desulfurization and can beused as a complementary process to the expensive HDS method for its low-cost, sustainability andefficient removal of recalcitrant organosulfur compounds. Furthermore, the adsorbents presenteda satisfactory regeneration rate by using a chloroform/hexane/acetone mixture (40:30:30 ratio) aftera total of five sulfur adsorption cycles. This allows for efficient reuse of this material with certainlongevity, ensuring even more reduction in operating costs.
Supplementary Materials: The following are available online at http://www.mdpi.com/2073-4344/9/8/651/s1,Figure S1: Results for preliminary sulfur adsorption tests, Figure S2: XRD results for the adsorbents with 8% metal,
262
Catalysts 2019, 9, 651
Figure S3: Langmuir model fitting for sulfur adsorption results over AgNO3/MCM-41M material at differenttemperatures, Table S1: Sulfur compound distribution in a straight run diesel oil sample (Hua et al., 2003), Table S2:Critical diameter data for the main aromatic organosulfurs in real diesel, Table S3: Sulfur adsorption performanceof some materials studied in literature for comparison.
Author Contributions: Conceptualization, R.V.S. and L.S.d.C.; methodology, R.V.S., A.B.F.C. and J.A.B.S.; formalanalysis, E.R.-C., L.M.A.C., M.M.U. and S.B.C.P.; investigation, R.V.S., L.S.d.C., H.O.M.A.M., and A.B.F.C.;resources, L.M.A.C., J.A.B.S. and T.C.B.; data curation, E.R.-C. and S.B.C.P.; writing—original draft preparation,R.V.S., H.O.M.A.M., A.B.F.C., J.A.B.S. and L.S.d.C.; writing—review and editing, R.V.S., H.O.M.A.M., A.B.F.C.,E.R.-C. and L.S.d.C.; supervision, R.V.S. and L.S.d.C.; project administration, L.S.d.C.; funding acquisition, S.B.C.P.and E.R.-C.
Funding: This research was funded by the Coordenação de Aperfeiçoamento de Pessoal de Nível Superior(CAPES—Brazil), grant number 001.
Acknowledgments: The authors thank the Energetic Technologies Laboratory (LTEN) and the Clara CamarãoPotiguar Refinery (RPCC—Petrobras) for the diesel samples. The authors thank the Coordenação deAperfeiçoamento de Pessoal de Nível Superior (CAPES—Brazil). ERC thanks to Ministerio de Ciencia, Innovacióny Universidades, Project RTI2018-099668-B-C22 and FEDER funds.
Conflicts of Interest: The authors declare no conflict of interest.
References
1. Saleh, T.A.; Sulaiman, K.O.; AL-Hammadi, S.A.; Dafalla, H.; Danmaliki, G.I. Adsorptive desulfurization ofthiophene, benzothiophene and dibenzothiophene over activated carbon manganese oxide nanocomposite:With column system evaluation. J. Clean. Prod. 2017, 154, 401–412. [CrossRef]
2. Pouladi, B.; Fanaei, M.A.; Baghmisheh, G. Optimization of oxidative desulfurization of gas condensate viaresponse surface methodology approach. J. Clean. Prod. 2019, 209, 965–977. [CrossRef]
3. Andevary, H.H.; Akbari, A.; Omidkhah, M. High efficient and selective oxidative desulfurization of dieselfuel using dual-function [Omim]FeCl4 as catalyst/extractant. Fuel Process. Technol. 2011, 185, 8–17. [CrossRef]
4. Subhan, F.; Aslam, S.; Yan, Z.; Ikram, M.; Rehman, S. Enhanced desulfurization characteristics of Cu-KIT-6for thiophene. Microporous Mesoporous Mater. 2014, 199, 108–116. [CrossRef]
5. Yang, D.; Yang, S.; Jiang, Z.; Yu, S.; Zhang, J.; Pan, F.; Cao, X.; Wang, B.; Yang, J. Polydimethyl siloxane–graphenenanosheets hybrid membranes with enhanced pervaporative desulfurization performance. J. Membr. Sci.2015, 487, 152–161. [CrossRef]
6. Etemadi, N.; Sepahy, A.A.; Mohebali, G.; Yazdian, F.; Omidi, M. Enhancement of bio-desulfurizationcapability of a newly isolated thermophilic bacterium using starch/iron nanoparticles in a controlled system.Int. J. Biol. Macromol. 2018, 120, 1801–1809. [CrossRef]
7. Song, L.; Duan, Z.; Zhu, L.; Zhou, Y.; Xiang, Y.; Xia, D. Selective functionalization of external and internalsurface of MCM-41 for adsorptive desulfurization. J. Porous Mater. 2016, 23, 1181–1187. [CrossRef]
8. Subhan, F.; Aslam, S.; Yan, Z.; Zhen, L.; Ikram, M.; Ullah, R.; Etim, U.J.; Ahmad, A. Ammonia assistedfunctionalization of cuprous oxide within confined spaces of SBA-15 for adsorptive desulfurization. Chem.Eng. J. 2018, 339, 557–565. [CrossRef]
9. Zhao, Z.; Zuhra, Z.; Qin, L.; Zhou, Y.; Zhang, L.; Tang, F.; Mu, C. Confinement of microporous MOF-74(Ni)within mesoporous γ-Al2O3 beads for excellent ultra-deep and selective adsorptive desulfurizationperformance. Fuel Process. Technol. 2018, 176, 276–282. [CrossRef]
10. Aslam, S.; Subhan, F.; Yan, Z.; Xing, W.; Zeng, J.; Liu, Y.; Ikram, M.; Rehman, S.; Ullah, R. Rapidfunctionalization of as-synthesized KIT-6 with nickel species occluded with template for adsorptivedesulfurization. Microporous Mesoporous Mater. 2015, 214, 54–63. [CrossRef]
11. Teymouri, M.; Samadi-Maybodi, A.; Vahid, A.; Miranbeigi, A. Adsorptive desulfurization of low sulfurdiesel using palladium containing mesoporous silica synthesized via a novel in-situ approach. Fuel Process.Technol. 2013, 116, 257–264. [CrossRef]
12. Sikarwar, P.; Kumar, U.K.A.; Gosu, V.; Subbaramaiah, V. Catalytic oxidative desulfurization of DBT usinggreen catalyst (Mo/MCM-41) derived from coal fly ash. J. Environ. Chem. Eng. 2018, 6, 1736–1744. [CrossRef]
13. Shokouhimehr, M.; Kim, T.; Jun, S.W.; Shin, K.; Jang, Y.; Kim, B.H.; Kim, J.; Hyeon, T. Magnetically separablecarbon nanocomposite catalysts for efficient nitroarene reduction and Suzuki reactions. Appl. Catal. A Gen.2014, 476, 133–139. [CrossRef]
263
Catalysts 2019, 9, 651
14. Ahadi, A.; Rostamnia, S.; Panahi, P.; Wilson, L.D.; Kong, Q.; An, Z.; Shokouhimehr, M. Palladium comprisingdicationic bipyridinium supported periodic mesoporous organosilica (PMO): Pd@Bipy–PMO as an efficienthybrid catalyst for Suzuki–Miyaura Cross-Coupling Reaction in Water. Catalysts 2019, 9, 140. [CrossRef]
15. Shokouhimehr, M.; Hong, K.; Lee, T.H.; Moon, C.H.; Hong, S.P.; Zhang, K.; Suh, J.M.; Choi, K.S.; Varma, R.S.;Jang, H.W. Magnetically retrievable nanocomposite adorned with Pd nanocatalysts: Efficient reduction ofnitroaromatics in aqueous media. Green Chem. 2018, 20, 3809–3817. [CrossRef]
16. Shokouhimehr, M.; Shin, K.Y.; Lee, J.S.; Hackett, M.J.; Jun, S.W.; Oh, M.H.; Jang, J.; Hyeon, T. Magneticallyrecyclable core–shell nanocatalysts for efficient heterogeneous oxidation of alcohols. J. Mater. Chem. A 2014,2, 7593–7599. [CrossRef]
17. Zhang, K.; Suh, J.M.; Choi, J.W.; Jang, H.W.; Shokouhimehr, M.; Varma, R.S. Recent Advances in theNanocatalyst-Assisted NaBH4 Reduction of Nitroaromatics in Water. ACS Omega 2019, 4, 483–495. [CrossRef][PubMed]
18. Shokouhimehr, M. Magnetically separable and sustainable nanostructured catalysts for heterogeneousreduction of nitroaromatics. Catalysts 2015, 5, 534–560. [CrossRef]
19. Siriworarat, K.; Deerattrakul, V.; Dittanet, P.; Kongkachuichay, P. Production of methanol from carbon dioxideusing palladium-copperzinc loaded on MCM-41: Comparison of catalysts synthesized from flame spraypyrolysis and sol-gel method using silica source from rice husk ash. J. Clean. Prod. 2017, 142, 1234–1243.[CrossRef]
20. Yu, H.; Xue, X.; Huang, D. Synthesis of mesoporous silica materials (MCM-41) from iron ore tailings. Mater.Res. Bull. 2009, 44, 2112–2115. [CrossRef]
21. Sohrabnezhad, S.; Jafarzadeh, A.; Pourahmad, A. Synthesis and characterization of MCM-41 ropes. Mater.Lett. 2018, 212, 16–19. [CrossRef]
22. Santos, L.S.; Silva, J.A.B.; Urbina, M.M.; Silva, E.G.; Andrade, J.C.F.; Silva, V.L. Processo de Produção deSílica Proveniente da Areia de Praia. BR Patent 1020140252835, 2 August 2016.
23. Carvalho, L.S.; Silva, E.; Andrade, J.C.; Silva, J.A.; Urbina, M.; Nascimento, P.F.; Carvalho, F.; Ruiz, J.A.Low-cost mesoporous adsorbents amines-impregnated for CO2 capture. Adsorption 2015, 21, 597–609.[CrossRef]
24. Dutov, V.V.; Mamontov, G.V.; Zaikovskii, V.I.; Liotta, L.F.; Vodyankina, O.V. Low-temperature CO oxidationover Ag/SiO2 catalysts: Effect of OH/Ag ratio. Appl. Catal. B Environ. 2018, 221, 598–609. [CrossRef]
25. Hernández-Maldonado, A.J.; Yang, F.H.; Qi, G.; Yang, R.T. Desulfurization of transportation fuels byπ-complexation sorbents: Cu(I)-, Ni(II)-, and Zn(II)- zeolites. Appl. Catal. B Environ. 2005, 56, 111–126.[CrossRef]
26. Tang, H.; Li, W.; Zhang, T.; Li, Q.; Xing, J.; Liu, H. Improvement in diesel desulfurization capacity byequilibrium isotherms analysis. Sep. Purif. Technol. 2011, 78, 352–356. [CrossRef]
27. Hu, P.; Amghouz, Z.; Huang, Z.; Xu, F.; Chen, Y.; Tang, X. Surface-confined atomic silver centers catalyzingformaldehyde oxidation. Environ. Sci. Technol. 2015, 49, 2384–2390. [CrossRef] [PubMed]
28. Chen, Y.; Huang, Z.; Zhou, M.; Ma, Z.; Chen, J.; Tang, X. Single silver adatoms on nanostructured manganeseoxide surfaces: Boosting oxygen activation for benzene abatement. Environ. Sci. Technol. 2017, 51, 2304–2311.[CrossRef]
29. Santos, V.P.; Pereira, M.F.R.; Órfão, J.J.M.; Figueiredo, J.L. The role of lattice oxygen on the activity ofmanganese oxides towards the oxidation of volatile organic compounds. Appl. Catal. B Environ. 2010, 99,353–363. [CrossRef]
30. Losurdo, M.; Bergmair, I.; Dastmalchi, B.; Kim, T.H.; Giangregroio, M.M.; Jiao, W.; Bianco, G.V.; Brown, A.S.;Hingerl, K.; Bruno, G. Graphene as an electron shuttle for silver deoxidation: Removing a key barrier toplasmonics and metamaterials for SERS in the visible. Adv. Funct. Mater. 2014, 24, 1864–1878. [CrossRef]
31. Dutov, V.V.; Mamontov, G.V.; Zaikovskii, V.I.; Vodyankina, O.V. The effect of support pretreatment on activityof Ag/SiO2 catalysts in low-temperature CO oxidation. Catal. Today 2016, 278, 150–156. [CrossRef]
32. Padin, J.; Yang, R.T. New sorbents for olefin/paraffin separations by adsorption via π-complexation: Synthesisand effects of substrates. Chem. Eng. Sci. 2000, 55, 2607–2616. [CrossRef]
33. Beck, J.S.; Vartulli, J.C.; Roth, W.J.; Leonowicz, M.E.; Kresge, C.T.; Schmitt, K.D.; Chu, C.T.W.; Olson, D.H.;Sheppard, E.W.; McCullen, S.B.; et al. A new family of mesoporous molecular sieves prepared with liquidcrystal templates. J. Am. Chem. Soc. 1992, 114, 10834–10843. [CrossRef]
264
Catalysts 2019, 9, 651
34. Kowalczyk, A.; Borcuch, A.; Michalik, M.; Rutkowska, M.; Gil, B.; Sojka, Z.; Indyka, P.; Chmielarz, L. MCM-41modified with transition metals by template ion-exchange method as catalysts for selective catalytic oxidationof ammonia to dinitrogen. Microporous Mesoporous Mater. 2017, 240, 9–21. [CrossRef]
35. Qin, J.; Li, B.; Zhang, W.; Lv, W.; Han, C.; Liu, J. Synthesis, characterization and catalytic performance ofwell-ordered mesoporous Ni-MCM-41 with high nickel content. Microporous Mesoporous Mater. 2015, 208,181–187. [CrossRef]
36. Sing, K.S.W.; Everett, D.H.; Haul, R.A.W.; Moscou, L.; Pierotti, R.A.; Rouquerol, J.; Siemieniewska, T.Reporting physisorption data for gas/solid systems with special reference to the determination of surfacearea and porosity. Pure Appl. Chem. 1985, 57, 603–619. [CrossRef]
37. Carraro, P.M.; Blanco, A.A.G.; Soria, F.A.; Lener, G.; Sapag, K.; Eimer, G.A.; Oliva, M.I. Understanding therole of nickel on the hydrogen storage capacity of Ni/MCM-41 materials. Microporous Mesoporous Mater. 2016,231, 31–39. [CrossRef]
38. Shen, S.; Chen, J.; Koodali, R.T.; Hu, Y.; Xiao, Q.; Zhou, J.; Wang, X.; Guo, L. Activation of MCM-41mesoporous silica by transition-metal incorporation for photocatalytic hydrogen production. Appl. Catal. BEnviron. 2014, 150, 138–146. [CrossRef]
39. Hoflund, G.B.; Weaver, J.F.; Epling, W.S. AgO XPS Spectra. Surf. Sci. Spectra 1995, 3, 163–168. [CrossRef]40. Huang, Z.; Gu, X.; Cao, Q.; Hu, P.; Hao, J.; Li, J.; Tang, X. Catalytically active single-atom sites fabricated
from silver particles. Angew. Chem. 2012, 124, 4274–4279. [CrossRef]41. Cao, Y.; Dai, W.L.; Deng, J.F. The oxidative dehydrogenation of methanol over a novel Ag/SiO2 catalyst. Appl.
Catal. A Gen. 1997, 158, L27–L34. [CrossRef]42. Yang, R.T. Adsorbents: Fundamentals and Applications; Wiley: Hoboken, NJ, USA, 2003.43. Battocchio, C.; Meneghini, C.; Fratoddi, I.; Venditti, I.; Russo, M.V.; Aquilanti, G.; Maurizio, C.; Bondino, F.;
Matassa, R.; Rossi, M.; et al. Silver nanoparticles stabilized with thiols: A close look at the local chemistryand chemical structure. J. Phys. Chem. C 2012, 116, 19571–19578. [CrossRef]
44. Brobbey, K.J.; Haapanen, J.; Gunell, M.; Toivakka, M.; Mäkelä, J.M.; Eerola, E.; Ali, R.; Saleem, M.R.;Honkanen, S.; Bobacka, J.; et al. Controlled time release and leaching of silver nanoparticles using a thinimmobilizing layer of aluminum oxide. Thin Solid Films 2018, 645, 166–172. [CrossRef]
45. Haro, N.K.; Vecchio, P.D.; Marcilio, N.R.; Féris, L.A. Removal of atenolol by adsorption—Study of kineticsand equilibrium. J. Clean. Prod. 2017, 154, 214–219. [CrossRef]
46. Habibi, A.; Belaroui, L.S.; Bengueddach, A.; Galindo, A.L.; Díaz, C.I.S.; Peña, A. Adsorption of metronidazoleand spiramycin by an Algerian palygorskite. Effect of modification with tin. Microporous Mesoporous Mater.2018, 268, 293–302. [CrossRef]
47. Choi, A.E.S.; Roces, S.; Dugos, N.; Arcega, A.; Wan, M. Adsorptive removal of dibenzothiophene sulfonefrom fuel oil using clay material adsorbents. J. Clean. Prod. 2017, 161, 267–276. [CrossRef]
48. Ho, Y.S.; McKay, G. Pseudo second-order model for sorption process. Process Biochem. 1999, 34, 451–465.[CrossRef]
49. Jeon, H.J.; Ko, C.H.; Kim, S.H.; Kim, J.N. Removal of Refractory Sulfur Compounds in Diesel Using ActivatedCarbon with Controlled Porosity. Energy Fuels 2009, 23, 2537–2543. [CrossRef]
50. Bu, J.; Loh, G.; Gwie, C.G.; Dewiyanti, S.; Tasrif, M.; Borgna, A. Desulfurization of diesel fuels by selectiveadsorption on activated carbons: Competitive adsorption of polycyclic aromatic sulfur heterocycles andpolycyclic aromatic hydrocarbons. Chem. Eng. J. 2011, 166, 207–217. [CrossRef]
51. Oliveira, M.F.; Silva, M.G.C.; Vieira, M.G.A. Equilibrium and kinetic studies of caffeine adsorption fromaqueous solutions on thermally modified Verde-lodo bentonite. Appl. Clay Sci. 2019, 168, 366–373. [CrossRef]
52. Meng, C.; Fang, Y.; Jin, L.; Hu, H. Deep desulfurization of model gasoline by selective adsorption onAg+/Al-MSU-S. Catal. Today 2010, 149, 138–142. [CrossRef]
53. Muzic, M.; Sertic-Bionda, K.; Gomzi, Z.; Podolski, S.; Telen, S. Study of diesel fuel desulfurization byadsorption. Chem. Eng. Res. Des. 2010, 88, 487–495. [CrossRef]
54. Adelodun, A.A.; Ngila, J.C.; Kim, D.; Jo, Y.M. Isotherm, thermodynamic and kinetic studies of selective CO2adsorption on chemically modified carbon surfaces. Aerosol Air Qual. Res. 2016, 16, 3312–3329. [CrossRef]
55. Raganati, F.; Alfe, M.; Gargiulo, V.; Chirone, R.; Ammendola, P. Isotherms and thermodynamics of CO2adsorptionon a novel carbon-magnetite composite sorbent. Chem. Eng. Res. Des. 2018, 134, 540–552.[CrossRef]
265
Catalysts 2019, 9, 651
56. Ben-Ali, S.; Jaouali, I.; Souissi-Najar, S.; Ouederni, A. Characterization and adsorption capacity of rawpomegranate peel biosorbent for copper removal. J. Clean. Prod. 2017, 142, 3809–3821. [CrossRef]
57. Sales, R.V.; Moura, H.O.M.A.; Silva, S.R.B.; Souza, M.A.F.; Campos, L.M.A.; Rodriguez-Castellon, E.;Carvalho, L.S. Experimental and theoretical study of adsorptive interactions in diesel fuel desulfurizationover Ag/MCM-41 adsorbent. Adsorption 2019, 25, 1–13. [CrossRef]
58. Reichenberg, D. Properties of ion-exchange resins in relation to their structure. III. Kinetics of exchange. J.Am. Chem. Soc. 1953, 75, 589–597. [CrossRef]
59. Langmuir, I. The constitution and fundamental properties of solids and liquids. Part I. Solids. J. Am. Chem.Soc. 1916, 38, 2221–2295. [CrossRef]
60. Weber, T.W.; Chakravorti, R.K. Pore and solid diffusion models for fixed-bed adsorbers. AIChE J. 1974, 20,228–238. [CrossRef]
61. Freundlich, H. Über die adsorption in Lösungen. Z. Phys. Chem. 1907, 57, 385–470. [CrossRef]62. Pérez-Marín, A.B.; Zapata, V.M.; Ortuño, J.F.; Aguilar, M.; Sáez, J.; Lloréns, M. Removal of cadmium from
aqueous solutions by adsorption onto orange waste. J. Hazard. Mater. B 2007, 139, 122–131. [CrossRef][PubMed]
63. Dubinin, M. The potential theory of adsorption of gases and vapors for adsorbents with energeticallynonuniform surfaces. Chem. Rev. 1960, 60, 235–241. [CrossRef]
64. Al-Anber, M.A. Thermodynamics approach in the adsorption of heavy metals. In Thermodynamics—InteractionStudies—Solids, Liquids and Gases; Moreno-Pirajan, J.C., Ed.; InTech: Rijeka, Croatia, 2011; pp. 737–764.
© 2019 by the authors. Licensee MDPI, Basel, Switzerland. This article is an open accessarticle distributed under the terms and conditions of the Creative Commons Attribution(CC BY) license (http://creativecommons.org/licenses/by/4.0/).
266
catalysts
Article
A New Tool in the Quest for BiocompatiblePhthalocyanines: Palladium CatalyzedAminocarbonylation for Amide SubstitutedPhthalonitriles and IllustrativePhthalocyanines Thereof
Vanessa A. Tomé, Mário J. F. Calvete * , Carolina S. Vinagreiro , Rafael T. Aroso and
Mariette M. Pereira *
Centro de Química de Coimbra (CQC), Department of Chemistry, University of Coimbra,Coimbra 3004-535, Portugal; [email protected] (V.A.T.);[email protected] (C.S.V.); [email protected] (R.T.A.)* Correspondence: [email protected] (M.J.F.C.); [email protected] (M.M.P.);
Tel.: +351-966-174744 (M.J.F.C.); +351-239-854474 (M.M.P.)
Received: 1 October 2018; Accepted: 17 October 2018; Published: 20 October 2018
Abstract: The amide peptide bond type linkage is one of the most natural conjugations available,present in many biological synthons and pharmaceutical drugs. Hence, aiming the direct conjugationof potentially biologically active compounds to phthalocyanines, herein we disclose a new strategyfor direct modulation of phthalonitriles, inspired by an attractive synthetic strategy for thepreparation of carboxamides based on palladium-catalyzed aminocarbonylation of aryl halidesin the presence of carbon monoxide (CO) which, to our knowledge, has never been used to prepareamide-substituted phthalonitriles, the natural precursors for the synthesis of phthalocyanines. Someexamples of phthalocyanines prepared thereof are also reported, along with their full spectroscopiccharacterization and photophysical properties initial assessment.
Keywords: peptide bond; phthalonitriles; phthalocyanines; aminocarbonylation; palladium catalysts
1. Introduction
Molecules of the tetrapyrrole family (e.g., porphyrin and phthalocyanine derivatives) areprobably the most appealing chromophores for a vast array of photoactivated processes, suchas phototherapy [1–3], photodiagnosis [4–6], photocatalysis [7,8], solar energy conversion [9,10],and also as photomaterials [11–13]. In particular, phthalocyanines largely fulfil a crucial opticalrequisite, necessary for photomedicinal applications, which is a strong absorption in near-infrared(NIR) spectral region (600–900 nm), as light in this region affords the deepest penetration in softtissue. These highly stable compounds, possessing high molar absorptivity, high quantum yieldsof fluorescence and structural versatility [4,13,14], can be conveniently modified to grant suitablebiological solubility [15–18], by introduction of hydrophilic moieties in the structure. The majority ofthe moieties used so far are negatively charged, such as sulfonates or carboxylates [15,19] or positivelycharged, like quaternized amines [15,20]. These ionic features present some important drawbackslike low cellular uptake and/or cellular internalization, due to the negatively-charged character ofthe cell plasma membranes, in the case of anionic phthalocyanines [21], or exaggerated phospholipidaffinity, leading to phospholipidosis, in the case of cationic phthalocyanines [22]. Thus, in the searchfor biocompatibility, the amide peptide bond type linkage is one of the most natural conjugationsavailable, present in many biological synthons, such as peptides, proteins, or amino acids [23], as well in
Catalysts 2018, 8, 480; doi:10.3390/catal8100480 www.mdpi.com/journal/catalysts267
Catalysts 2018, 8, 480
pharmaceutical drugs [24,25]. Nevertheless, amide-substituted phthalocyanines are rare [26–35], whencompared with other functionalities, including a few reports of phthalocyanines conjugated with aminoacids [27–30] and peptides [31–35]. The main reason for the scarcity in phthalocyanine-amino acidconjugates arises from the difficult synthetic manipulation, which relies in troublesome transformationsand purification procedures using highly polluting chemicals [25,27–30,36,37].
Apparently, phthalocyanine post-synthetic modulation would not be a very straightforwardoption, due to the chemical stability owned by phthalocyanines, which are quite stable against thistype of structural variation. On the other hand, modification of precursory phthalonitriles bearingcarboxylic acids is also demanding, given the sensitiveness of nitrile functions. It is worth mentioningthat we have tested the strategies ourselves, to explain our points, and results were as described in thetext. Whether in case of post-synthetic phthalocyanine modification or phthalonitrile modulation, noreproducible results could be obtained, always leading to cumbersome work-up approaches.
Palladium-catalyzed carbonylation reactions were first described by Heck almost 40 years ago [38].Since then, many developments have been reported [6,39–46] and nowadays carbonylation hasbecome an indispensable alternative to the classic organic synthesis of carbonyl compounds, includingcarboxylic acid derivatives (e.g., amides, esters) with valuable application in both industrial and finechemistry. Among these reactions, aminocarbonylation [47–50], carried out using Ar–X substrates(X = I, Br, Cl, OTf, OTs, etc.), in the presence of N-nucleophiles, emerges as a sustainable, one-stepsynthetic approach, for the efficient, selective and mild synthesis of amides.
Herein we disclose a new strategy for direct modulation of phthalonitriles, inspired by an attractivesynthetic strategy for the preparation of carboxamides based on optimized palladium-catalyzedaminocarbonylation of aryl halides in the presence of carbon monoxide (CO) [38,51] which, to ourknowledge, has never been used to prepare amide-substituted phthalonitriles, the natural precursors forthe synthesis of phthalocyanines. Furthermore, transformation thereof to the desired phthalocyaninesis also described.
2. Results and Discussion
Modification of phthalonitriles is usually the chosen methodology when attempting to introducesignificant changes at the phthalocyanine periphery, instead of phthalocyanine post-syntheticmodulation [52], due to the known chemical stability owned by phthalocyanines. A conceivableexample would be, for instance, to synthesize a phthalocyanine bearing peripheral four carboxylicacid groups, followed by acyl chloride formation, using a hazardous chlorinating agent, and thenfunctionalization with an amine. The main issue regarding this strategy would be the proneness toform mixtures of mono-, di-, tri-, and tetra-amide substituted phthalocyanines requiring the use ofexcessive amounts of nucleophile, giving raise to cumbersome purification and low yields.
Our herein envisaged strategy uses 4-iodophthalonitrile (1) [53] as substrate and a rangeof amines as nucleophiles, in presence of a palladium catalyst formed in situ by addition ofpalladium(II) acetate to triphenylphosphine (in 1:2 molar ratio), together with Et3N as base andcarbon monoxide as reagent (Table 1) [54,55]. Our studies began with the aminocarbonylation of4-iodophthalonitrile (1) using glycine methyl ester hydrochloride (2a) as model nucleophile, tooptimize reaction conditions (temperature, pressure of CO and time reaction parameters) in thepalladium-catalyzed aminocarbonylation reaction (Table 1).
The first reaction conditions employed (PCO = 10 bar and T = 65 ◦C) (Table 1, entry 1) affordedonly 25% substrate conversion, after 24 h. Then, we investigated the effect of increasing temperature,keeping the CO pressure at 10 bar, and it was found that, at 85 ◦C, the reaction proceeded faster, andfull conversion of substrate 1 within 24 h was obtained (Table 1, entry 2). Keeping CO pressure at10 bar and temperature at 85 ◦C, the reaction was not complete when reaction time was decreased to12 h, reaching only 70% conversion of 1 (Table 1, entry 3). Conversely, when the reaction temperaturewas increased to 100 ◦C, keeping the pressure at 10 bar and reaction time at 12 h, substrate 1 wastotally transformed into the desired amide (Table 1, entry 4). In addition, when the CO pressure was
268
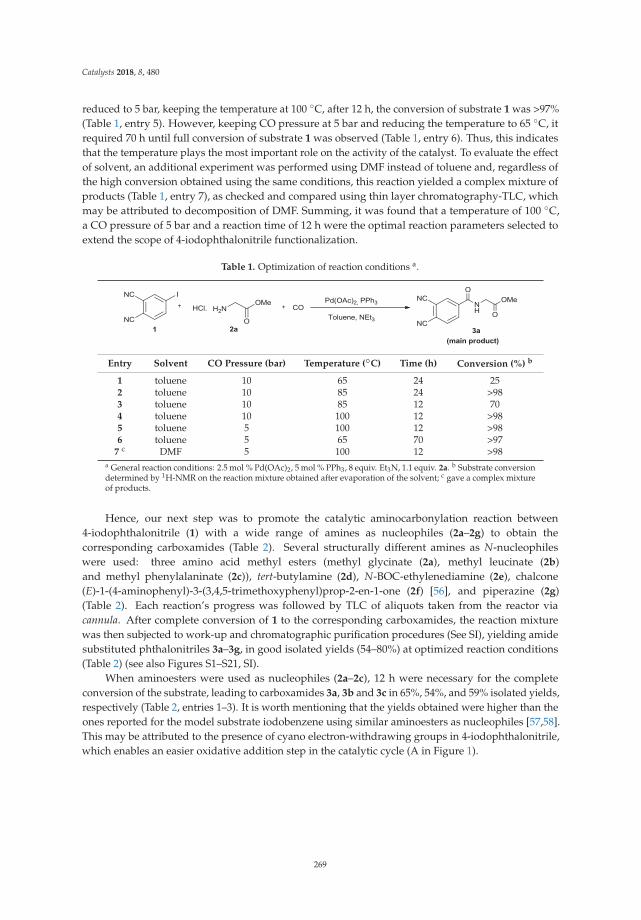
Catalysts 2018, 8, 480
reduced to 5 bar, keeping the temperature at 100 ◦C, after 12 h, the conversion of substrate 1 was >97%(Table 1, entry 5). However, keeping CO pressure at 5 bar and reducing the temperature to 65 ◦C, itrequired 70 h until full conversion of substrate 1 was observed (Table 1, entry 6). Thus, this indicatesthat the temperature plays the most important role on the activity of the catalyst. To evaluate the effectof solvent, an additional experiment was performed using DMF instead of toluene and, regardless ofthe high conversion obtained using the same conditions, this reaction yielded a complex mixture ofproducts (Table 1, entry 7), as checked and compared using thin layer chromatography-TLC, whichmay be attributed to decomposition of DMF. Summing, it was found that a temperature of 100 ◦C,a CO pressure of 5 bar and a reaction time of 12 h were the optimal reaction parameters selected toextend the scope of 4-iodophthalonitrile functionalization.
Table 1. Optimization of reaction conditions a.
Entry Solvent CO Pressure (bar) Temperature (◦C) Time (h) Conversion (%) b
1 toluene 10 65 24 252 toluene 10 85 24 >983 toluene 10 85 12 704 toluene 10 100 12 >985 toluene 5 100 12 >986 toluene 5 65 70 >97
7 c DMF 5 100 12 >98a General reaction conditions: 2.5 mol % Pd(OAc)2, 5 mol % PPh3, 8 equiv. Et3N, 1.1 equiv. 2a. b Substrate conversiondetermined by 1H-NMR on the reaction mixture obtained after evaporation of the solvent; c gave a complex mixtureof products.
Hence, our next step was to promote the catalytic aminocarbonylation reaction between4-iodophthalonitrile (1) with a wide range of amines as nucleophiles (2a–2g) to obtain thecorresponding carboxamides (Table 2). Several structurally different amines as N-nucleophileswere used: three amino acid methyl esters (methyl glycinate (2a), methyl leucinate (2b)and methyl phenylalaninate (2c)), tert-butylamine (2d), N-BOC-ethylenediamine (2e), chalcone(E)-1-(4-aminophenyl)-3-(3,4,5-trimethoxyphenyl)prop-2-en-1-one (2f) [56], and piperazine (2g)(Table 2). Each reaction’s progress was followed by TLC of aliquots taken from the reactor viacannula. After complete conversion of 1 to the corresponding carboxamides, the reaction mixturewas then subjected to work-up and chromatographic purification procedures (See SI), yielding amidesubstituted phthalonitriles 3a–3g, in good isolated yields (54–80%) at optimized reaction conditions(Table 2) (see also Figures S1–S21, SI).
When aminoesters were used as nucleophiles (2a–2c), 12 h were necessary for the completeconversion of the substrate, leading to carboxamides 3a, 3b and 3c in 65%, 54%, and 59% isolated yields,respectively (Table 2, entries 1–3). It is worth mentioning that the yields obtained were higher than theones reported for the model substrate iodobenzene using similar aminoesters as nucleophiles [57,58].This may be attributed to the presence of cyano electron-withdrawing groups in 4-iodophthalonitrile,which enables an easier oxidative addition step in the catalytic cycle (A in Figure 1).
269
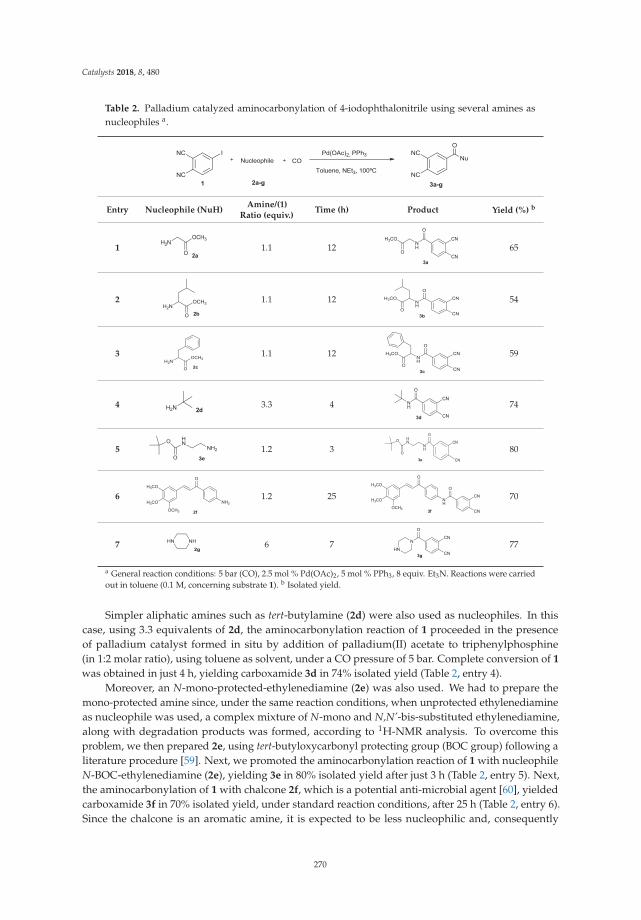
Catalysts 2018, 8, 480
Table 2. Palladium catalyzed aminocarbonylation of 4-iodophthalonitrile using several amines asnucleophiles a.
Entry Nucleophile (NuH)Amine/(1)
Ratio (equiv.)Time (h) Product Yield (%) b
1
1.1 12
65
2
1.1 12
54
3
1.1 12 59
4
3.3 4
74
5
1.2 3
80
6 1.2 25
70
7
6 7
77
a General reaction conditions: 5 bar (CO), 2.5 mol % Pd(OAc)2, 5 mol % PPh3, 8 equiv. Et3N. Reactions were carriedout in toluene (0.1 M, concerning substrate 1). b Isolated yield.
Simpler aliphatic amines such as tert-butylamine (2d) were also used as nucleophiles. In thiscase, using 3.3 equivalents of 2d, the aminocarbonylation reaction of 1 proceeded in the presenceof palladium catalyst formed in situ by addition of palladium(II) acetate to triphenylphosphine(in 1:2 molar ratio), using toluene as solvent, under a CO pressure of 5 bar. Complete conversion of 1
was obtained in just 4 h, yielding carboxamide 3d in 74% isolated yield (Table 2, entry 4).Moreover, an N-mono-protected-ethylenediamine (2e) was also used. We had to prepare the
mono-protected amine since, under the same reaction conditions, when unprotected ethylenediamineas nucleophile was used, a complex mixture of N-mono and N,N’-bis-substituted ethylenediamine,along with degradation products was formed, according to 1H-NMR analysis. To overcome thisproblem, we then prepared 2e, using tert-butyloxycarbonyl protecting group (BOC group) following aliterature procedure [59]. Next, we promoted the aminocarbonylation reaction of 1 with nucleophileN-BOC-ethylenediamine (2e), yielding 3e in 80% isolated yield after just 3 h (Table 2, entry 5). Next,the aminocarbonylation of 1 with chalcone 2f, which is a potential anti-microbial agent [60], yieldedcarboxamide 3f in 70% isolated yield, under standard reaction conditions, after 25 h (Table 2, entry 6).Since the chalcone is an aromatic amine, it is expected to be less nucleophilic and, consequently
270

Catalysts 2018, 8, 480
a prolonged period of time was necessary for the complete conversion of the substrate 1 into thecorresponding carboxamide.
Figure 1. Simplified catalytic cycle describing the formation of 4-amide substituted phthalonitriles.L = PPh3.
Using similar conditions, we also investigated the use of cyclic diamines in the palladiumcatalyzed aminocarbonylation reaction for the synthesis of N-mono-substituted diamines. Unprotecteddiamine piperazine (2g) is quite useful and interesting because the presence of two amine groups couldenable the conjugation with bioactive molecules or functionalization with other relevant chemicalgroups. In order to attain the desired N-mono-substituted diamine we have selected an excess of6 equiv. of the diamine 2g. In the presence of palladium catalyst formed in situ by addition ofpalladium(II) acetate to triphenylphosphine (in 1:2 molar ratio), together with Et3N as base in toluenesolvent, under a CO pressure of 5 bar, complete conversion of 1 was obtained, after 7 h, yieldingcarboxamide 3g after work-up and purification in 77% isolated yield (Table 2, entry 7).
According to previously described [49,51,61–64], a simplified mechanism for the formationof 4-amide substituted phthalonitrile is proposed in Figure 1. The catalytic cycle begins withthe oxidative addition of the in situ formed Pd(0)Ln active species to the 4-iodophthalonitrile,resulting in an arylpalladium(II) intermediate A, which is able to coordinate to carbon monoxide,leading to intermediate B. Then, this complex undergoes a nucleophilic attack by the desired amine(N-nucleophile), affording C. Through HI elimination with the aid of Et3N, intermediate D is formed,yielding the desired 4-amide substituted phthalonitrile, upon reductive elimination.
All carboxamide substituted phthalonitriles were characterized by 1H, 13C-NMR and massspectrometry and their structures confirmed. It is worth mentioning that, under the reaction conditionsemployed (100 ◦C and 5 bar), 100% chemoselectivity toward the mono-carboxamide products wasobtained, since no double carbon monoxide insertion product was observed, using these amines asnucleophiles [55,65].
Having established a methodology for the synthesis of several carboxamide-containingphthalonitriles 3a–3g, we have then prepared, as selected examples, phthalocyanines 4a, 4c, and 4d,
271
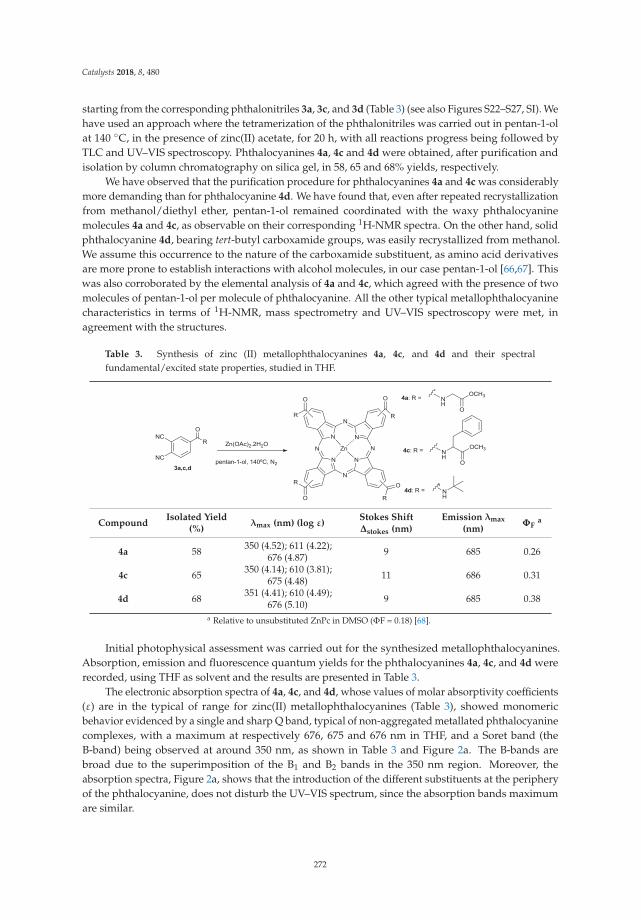
Catalysts 2018, 8, 480
starting from the corresponding phthalonitriles 3a, 3c, and 3d (Table 3) (see also Figures S22–S27, SI). Wehave used an approach where the tetramerization of the phthalonitriles was carried out in pentan-1-olat 140 ◦C, in the presence of zinc(II) acetate, for 20 h, with all reactions progress being followed byTLC and UV–VIS spectroscopy. Phthalocyanines 4a, 4c and 4d were obtained, after purification andisolation by column chromatography on silica gel, in 58, 65 and 68% yields, respectively.
We have observed that the purification procedure for phthalocyanines 4a and 4c was considerablymore demanding than for phthalocyanine 4d. We have found that, even after repeated recrystallizationfrom methanol/diethyl ether, pentan-1-ol remained coordinated with the waxy phthalocyaninemolecules 4a and 4c, as observable on their corresponding 1H-NMR spectra. On the other hand, solidphthalocyanine 4d, bearing tert-butyl carboxamide groups, was easily recrystallized from methanol.We assume this occurrence to the nature of the carboxamide substituent, as amino acid derivativesare more prone to establish interactions with alcohol molecules, in our case pentan-1-ol [66,67]. Thiswas also corroborated by the elemental analysis of 4a and 4c, which agreed with the presence of twomolecules of pentan-1-ol per molecule of phthalocyanine. All the other typical metallophthalocyaninecharacteristics in terms of 1H-NMR, mass spectrometry and UV–VIS spectroscopy were met, inagreement with the structures.
Table 3. Synthesis of zinc (II) metallophthalocyanines 4a, 4c, and 4d and their spectralfundamental/excited state properties, studied in THF.
CompoundIsolated Yield
(%)λmax (nm) (log ε)
Stokes ShiftΔstokes (nm)
Emission λmax
(nm)ΦF
a
4a 58 350 (4.52); 611 (4.22);676 (4.87) 9 685 0.26
4c 65 350 (4.14); 610 (3.81);675 (4.48) 11 686 0.31
4d 68 351 (4.41); 610 (4.49);676 (5.10) 9 685 0.38
a Relative to unsubstituted ZnPc in DMSO (ΦF = 0.18) [68].
Initial photophysical assessment was carried out for the synthesized metallophthalocyanines.Absorption, emission and fluorescence quantum yields for the phthalocyanines 4a, 4c, and 4d wererecorded, using THF as solvent and the results are presented in Table 3.
The electronic absorption spectra of 4a, 4c, and 4d, whose values of molar absorptivity coefficients(ε) are in the typical of range for zinc(II) metallophthalocyanines (Table 3), showed monomericbehavior evidenced by a single and sharp Q band, typical of non-aggregated metallated phthalocyaninecomplexes, with a maximum at respectively 676, 675 and 676 nm in THF, and a Soret band (theB-band) being observed at around 350 nm, as shown in Table 3 and Figure 2a. The B-bands arebroad due to the superimposition of the B1 and B2 bands in the 350 nm region. Moreover, theabsorption spectra, Figure 2a, shows that the introduction of the different substituents at the peripheryof the phthalocyanine, does not disturb the UV–VIS spectrum, since the absorption bands maximumare similar.
272
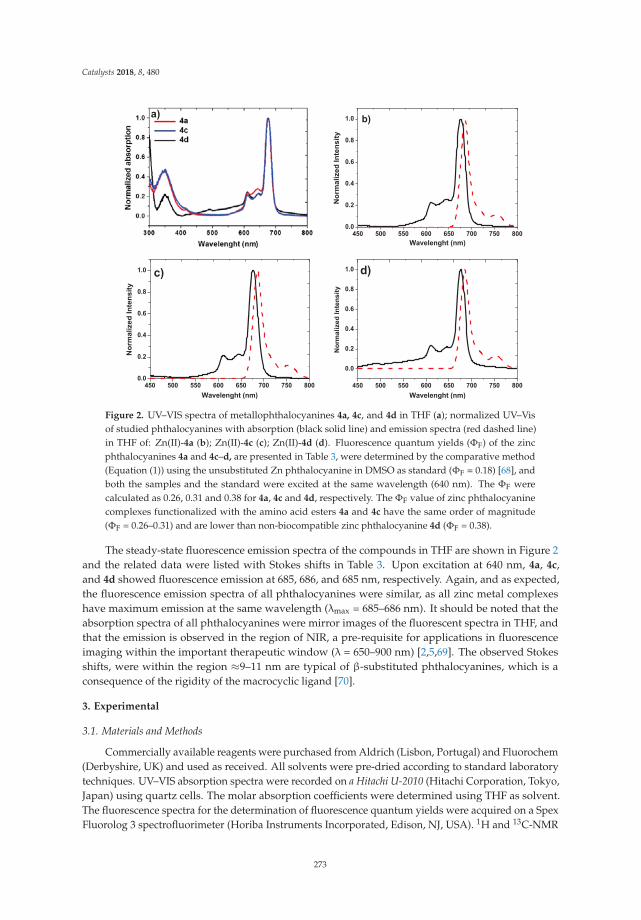
Catalysts 2018, 8, 480
450 500 550 600 650 700 750 8000.0
0.2
0.4
0.6
0.8
1.0 b)
Nor
mal
ized
Inte
nsity
Wavelenght (nm)
450 500 550 600 650 700 750 8000.0
0.2
0.4
0.6
0.8
1.0
Nor
mal
ized
Inte
nsity
Wavelenght (nm)
c)
450 500 550 600 650 700 750 800
0.0
0.2
0.4
0.6
0.8
1.0
Nor
mal
ized
Inte
nsity
Wavelenght (nm)
d)
Nor
mal
ized
Inte
nsity
Figure 2. UV–VIS spectra of metallophthalocyanines 4a, 4c, and 4d in THF (a); normalized UV–Visof studied phthalocyanines with absorption (black solid line) and emission spectra (red dashed line)in THF of: Zn(II)-4a (b); Zn(II)-4c (c); Zn(II)-4d (d). Fluorescence quantum yields (ΦF) of the zincphthalocyanines 4a and 4c–d, are presented in Table 3, were determined by the comparative method(Equation (1)) using the unsubstituted Zn phthalocyanine in DMSO as standard (ΦF = 0.18) [68], andboth the samples and the standard were excited at the same wavelength (640 nm). The ΦF werecalculated as 0.26, 0.31 and 0.38 for 4a, 4c and 4d, respectively. The ΦF value of zinc phthalocyaninecomplexes functionalized with the amino acid esters 4a and 4c have the same order of magnitude(ΦF = 0.26–0.31) and are lower than non-biocompatible zinc phthalocyanine 4d (ΦF = 0.38).
The steady-state fluorescence emission spectra of the compounds in THF are shown in Figure 2and the related data were listed with Stokes shifts in Table 3. Upon excitation at 640 nm, 4a, 4c,and 4d showed fluorescence emission at 685, 686, and 685 nm, respectively. Again, and as expected,the fluorescence emission spectra of all phthalocyanines were similar, as all zinc metal complexeshave maximum emission at the same wavelength (λmax = 685–686 nm). It should be noted that theabsorption spectra of all phthalocyanines were mirror images of the fluorescent spectra in THF, andthat the emission is observed in the region of NIR, a pre-requisite for applications in fluorescenceimaging within the important therapeutic window (λ = 650–900 nm) [2,5,69]. The observed Stokesshifts, were within the region ≈9–11 nm are typical of β-substituted phthalocyanines, which is aconsequence of the rigidity of the macrocyclic ligand [70].
3. Experimental
3.1. Materials and Methods
Commercially available reagents were purchased from Aldrich (Lisbon, Portugal) and Fluorochem(Derbyshire, UK) and used as received. All solvents were pre-dried according to standard laboratorytechniques. UV–VIS absorption spectra were recorded on a Hitachi U-2010 (Hitachi Corporation, Tokyo,Japan) using quartz cells. The molar absorption coefficients were determined using THF as solvent.The fluorescence spectra for the determination of fluorescence quantum yields were acquired on a SpexFluorolog 3 spectrofluorimeter (Horiba Instruments Incorporated, Edison, NJ, USA). 1H and 13C-NMR
273
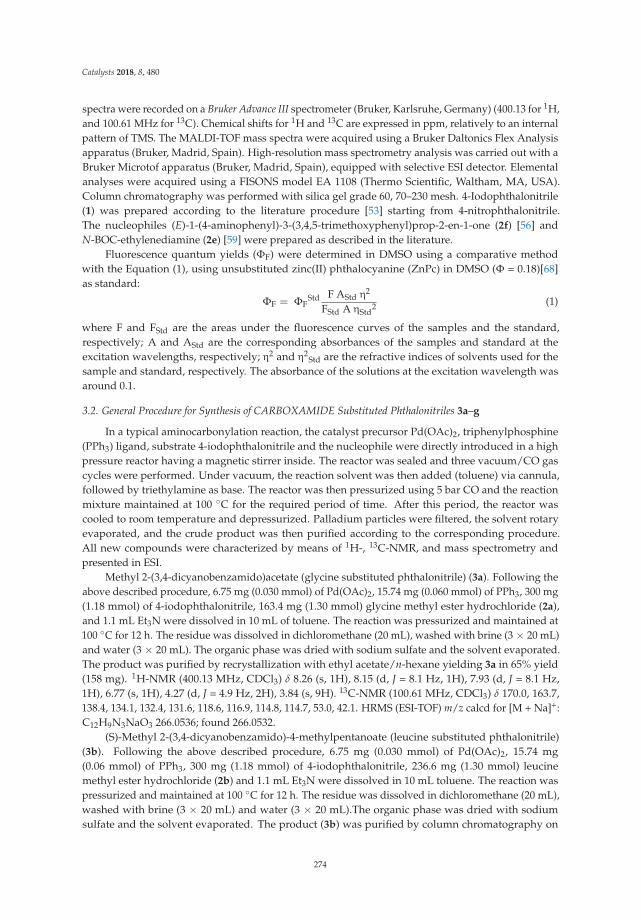
Catalysts 2018, 8, 480
spectra were recorded on a Bruker Advance III spectrometer (Bruker, Karlsruhe, Germany) (400.13 for 1H,and 100.61 MHz for 13C). Chemical shifts for 1H and 13C are expressed in ppm, relatively to an internalpattern of TMS. The MALDI-TOF mass spectra were acquired using a Bruker Daltonics Flex Analysisapparatus (Bruker, Madrid, Spain). High-resolution mass spectrometry analysis was carried out with aBruker Microtof apparatus (Bruker, Madrid, Spain), equipped with selective ESI detector. Elementalanalyses were acquired using a FISONS model EA 1108 (Thermo Scientific, Waltham, MA, USA).Column chromatography was performed with silica gel grade 60, 70–230 mesh. 4-Iodophthalonitrile(1) was prepared according to the literature procedure [53] starting from 4-nitrophthalonitrile.The nucleophiles (E)-1-(4-aminophenyl)-3-(3,4,5-trimethoxyphenyl)prop-2-en-1-one (2f) [56] andN-BOC-ethylenediamine (2e) [59] were prepared as described in the literature.
Fluorescence quantum yields (ΦF) were determined in DMSO using a comparative methodwith the Equation (1), using unsubstituted zinc(II) phthalocyanine (ZnPc) in DMSO (Φ = 0.18)[68]as standard:
ΦF = ΦFStd F AStd η2
FStd A ηStd2 (1)
where F and FStd are the areas under the fluorescence curves of the samples and the standard,respectively; A and AStd are the corresponding absorbances of the samples and standard at theexcitation wavelengths, respectively; η2 and η2
Std are the refractive indices of solvents used for thesample and standard, respectively. The absorbance of the solutions at the excitation wavelength wasaround 0.1.
3.2. General Procedure for Synthesis of CARBOXAMIDE Substituted Phthalonitriles 3a–g
In a typical aminocarbonylation reaction, the catalyst precursor Pd(OAc)2, triphenylphosphine(PPh3) ligand, substrate 4-iodophthalonitrile and the nucleophile were directly introduced in a highpressure reactor having a magnetic stirrer inside. The reactor was sealed and three vacuum/CO gascycles were performed. Under vacuum, the reaction solvent was then added (toluene) via cannula,followed by triethylamine as base. The reactor was then pressurized using 5 bar CO and the reactionmixture maintained at 100 ◦C for the required period of time. After this period, the reactor wascooled to room temperature and depressurized. Palladium particles were filtered, the solvent rotaryevaporated, and the crude product was then purified according to the corresponding procedure.All new compounds were characterized by means of 1H-, 13C-NMR, and mass spectrometry andpresented in ESI.
Methyl 2-(3,4-dicyanobenzamido)acetate (glycine substituted phthalonitrile) (3a). Following theabove described procedure, 6.75 mg (0.030 mmol) of Pd(OAc)2, 15.74 mg (0.060 mmol) of PPh3, 300 mg(1.18 mmol) of 4-iodophthalonitrile, 163.4 mg (1.30 mmol) glycine methyl ester hydrochloride (2a),and 1.1 mL Et3N were dissolved in 10 mL of toluene. The reaction was pressurized and maintained at100 ◦C for 12 h. The residue was dissolved in dichloromethane (20 mL), washed with brine (3 × 20 mL)and water (3 × 20 mL). The organic phase was dried with sodium sulfate and the solvent evaporated.The product was purified by recrystallization with ethyl acetate/n-hexane yielding 3a in 65% yield(158 mg). 1H-NMR (400.13 MHz, CDCl3) δ 8.26 (s, 1H), 8.15 (d, J = 8.1 Hz, 1H), 7.93 (d, J = 8.1 Hz,1H), 6.77 (s, 1H), 4.27 (d, J = 4.9 Hz, 2H), 3.84 (s, 9H). 13C-NMR (100.61 MHz, CDCl3) δ 170.0, 163.7,138.4, 134.1, 132.4, 131.6, 118.6, 116.9, 114.8, 114.7, 53.0, 42.1. HRMS (ESI-TOF) m/z calcd for [M + Na]+:C12H9N3NaO3 266.0536; found 266.0532.
(S)-Methyl 2-(3,4-dicyanobenzamido)-4-methylpentanoate (leucine substituted phthalonitrile)(3b). Following the above described procedure, 6.75 mg (0.030 mmol) of Pd(OAc)2, 15.74 mg(0.06 mmol) of PPh3, 300 mg (1.18 mmol) of 4-iodophthalonitrile, 236.6 mg (1.30 mmol) leucinemethyl ester hydrochloride (2b) and 1.1 mL Et3N were dissolved in 10 mL toluene. The reaction waspressurized and maintained at 100 ◦C for 12 h. The residue was dissolved in dichloromethane (20 mL),washed with brine (3 × 20 mL) and water (3 × 20 mL).The organic phase was dried with sodiumsulfate and the solvent evaporated. The product (3b) was purified by column chromatography on
274
Catalysts 2018, 8, 480
silica gel (stationary phase) first using chloroform and then a mixture of chloroform/ethyl acetate(20/1) and obtained in 54% yield (120 mg), after being washed with n-hexane. 1H-NMR (400.13 MHz,CDCl3) δ 8.24 (d, J = 8.1 Hz, 1H), 8.14 (dd, J = 1.7 Hz, J = 8.1 Hz, 1H), 7.91 (d, J = 8.1 Hz, 1H), 6.77 (brs, 1H), 4.86–4.80 (m, 1H), 3.79 (s, 3H), 1.80–1.66 (2 m, 3H), 1.00–0.97 (m, 6H). 13C-NMR (100.61 MHz,CDCl3) δ 173.4, 163.5, 138.6, 134.1, 132.4, 131.9, 118.3, 116.6, 114.9, 52.9, 51.8, 41.6, 25.1, 22.9, 22.0. HRMS(ESI-TOF) m/z calcd for [M + Na]+: C16H17N3NaO3 322.1162; found 322.1153.
(S)-Methyl 2-(3,4-dicyanobenzamido)-3-phenylpropanoate (phenyl alanine substitutedphthalonitrile) (3c). Following the above described procedure, 6.75 mg (0.030 mmol) of Pd(OAc)2,15.74 mg (0.06 mmol) of PPh3, 300 mg (1.18 mmol) of 4-iodophthalonitrile, 280.4 mg (1.30 mmol)phenyl alanine methyl ester hydrochloride (2c) and 1.1 mL Et3N were dissolved in 10 mL toluene.The reaction was pressurized and maintained at 100 ◦C for 12 h. The residue was dissolved indichloromethane (20 mL), washed with brine (3 × 20 mL) and water (3 × 20 mL). The organicphase was dried with sodium sulfate and the solvent evaporated. The product (3c) was purified bycolumn chromatography on silica gel (stationary phase) first using chloroform and then a mixtureof chloroform/ethyl acetate (10/1) and obtained in 59.0% yield (192 mg), after being washed withn-hexane. 1H-NMR (400.13 MHz, CDCl3) δ 8.12 (d, J = 1.7 Hz, 1H), 8.00 (dd, J = 8.1, 1.7 Hz, 1H), 7.88(d, J = 8.1 Hz, 1H), 7.30–7.29 (m, 3H), 7.10–7.08 (m, 2H), 6.64 (br s, 1H), 5.09–5.04 (m, 1H), 3.82 (s,3H), 3.34–3.21 (m, 2H). 13C-NMR (100.61 MHz, CDCl3) δ 171.7, 163.3, 138.6, 135.4, 134.1, 132.4, 131.6,129.3, 128.9, 127.6, 118.4, 116.6, 114.8, 114.8, 54.0, 52.9, 37.7. HRMS (ESI-TOF) m/z calcd for [M + Na]+:C19H15N3NaO3 356.1003; found 356.1006.
N-Tert-butyl-3,4-dicyanobenzamide (3d). Following the above described procedure, 4.4 mg(0.020 mmol) of Pd(OAc)2, 10.5 mg (0.040 mmol) of PPh3, 200 mg (0.79 mmol) of 4-iodophthalonitrile,0.28 mL (2.6 mmol) of tert-butyl amine (2d) and 0.8 mL Et3N were dissolved in 6 mL of toluene.The reaction was pressurized and maintained at 100 ◦C for 4 h. The residue was dissolved indichloromethane (20 mL), washed with brine (3 × 20 mL) and water (3 × 20 mL). The organicphase was dried with sodium sulfate and the solvent evaporated. The product (3d) was purified bycolumn chromatography on silica gel (stationary phase) using a mixture of dichloromethane/ethylacetate (20/1) and obtained in 74% yield (132.9 mg). 1H-NMR (400.13 MHz, CDCl3) δ 8.14 (bs, 1H),8.06 (d, J = 8.1 Hz, 1H), 7.88 (d, J = 8.1 Hz, 1H), 5.94 (br s, 1H), 1.49 (s, 9H). 13C-NMR (100.61 MHz,CDCl3) δ 163.1, 140.6, 134.0, 132.1, 131.6, 117.8, 116.4, 115.0, 53.0, 28.8. HRMS (EI) m/z calcd for [M]+:C13H13N3O 227.1059; found: 227.1060.
N-BOC-Ethylenediamine-3,4-dicyanobenzamide (3e). Following the above described procedure,4.4 mg (0.020 mmol) of Pd(OAc)2, 10.5 mg (0.040 mmol) of PPh3, 200 mg (0.79 mmol) of4-iodophthalonitrile, 151 mg (0.94 mmol) of N-BOC-ethylenediamine (2e) and 0.8 mL Et3N weredissolved in 6 mL toluene. The reaction was pressurized and maintained at 100 ◦C for 3 h. The product(3e) precipitated in the middle of the reaction and then was washed with n-hexane and obtained in80% yield (198.5 mg). 1H-NMR (400.13 MHz, CDCl3) δ 8.31 (sl, 1H), 8.21 (dd, J = 8.1, 1.1 Hz, 1H), 8.17(br s, 1H), 7.89 (d, J = 8.1 Hz, 1H), 5.18 (br s, 1H), 3.56–3.53 (m, 2H), 3.43–3.41 (m, 2H), 1.43 (s, 9H).13C-NMR (100.61 MHz, CDCl3) δ 163.6, 158.7, 138.9, 133.9, 132.4, 131.7, 117.9, 116.4, 115.0, 114.9, 80.9,43.6, 39.7, 28.4. HRMS (ESI-TOF) m/z calcd for [M + H]+: C16H18N4NaO3 337.1271; found 337.1271.
(E)-3,4-Dicyano-N-(4-(3-(3,4,5-trimethoxyphenyl)acryloyl)phenyl)benzamide (3f). Followingthe above described procedure, 4.4 mg (0.020 mmol) of Pd(OAc)2, 10.5 mg (0.040 mmol) ofPPh3, 200 mg (0.79 mmol) of 4-iodophthalonitrile, 296 mg (0.94 mmol) of (E)-1-(4-aminophenyl)-3-(3,4,5-trimethoxyphenyl)prop-2-en-1-one (2f), and 0.8 mL Et3N were dissolved in 6 mL toluene. Thereaction was pressurized and maintained at 100 ◦C for 25 h. The product (3f) precipitated in the middleof reaction and was washed with methanol and cyclohexane and obtained in 70% yield (256 mg).1H-NMR (400.13 MHz, acetone-d6) δ 10.23 (s, 1H), 8.64 (d, J = 1.5 Hz, 1H), 8.51 (dd, J = 8.2, 1.6 Hz, 1H),8.26 (d, J = 8.2 Hz, 1H), 8.18 (d, J = 8.7 Hz, 2H), 8.01 (d, J = 8.7 Hz, 2H), 7.84 (d, J = 15.5 Hz, 1H), 7.73 (d,J = 15.5 Hz, 1H), 7.19 (s, 2H), 3.91 (s, 6H), 3.79 (s, 3H). 13C-NMR (100.61 MHz, acetone-d6) δ188.7, 163.9,
275
Catalysts 2018, 8, 480
154.9, 145.3, 143.8, 141.8, 140.6, 135.4, 133.9, 133.8, 131.8, 130.7, 122.1, 120.8, 120.7, 118.9, 117.0, 116.3,107.4, 60.9, 56.8. HRMS (ESI-TOF) m/z calcd for [M]+: C27H21N3O5 468.1554; found 468.1555.
N-Piperazine-3,4-dicyanobenzamide (3g). Following the above described procedure, 4.4 mg(0.020 mmol) of Pd(OAc)2, 10.5 mg (0.040 mmol) of PPh3, 200 mg (0.79 mmol) of 4-iodophthalonitrile,407 mg (4.72 mmol) piperazine (2g), and 0.8 mL Et3N were dissolved in 6 mL toluene. The reaction waspressurized and maintained at 100 ◦C for 7 h. The product (3g) was purified by column chromatographyon silica gel (stationary phase) using ethanol as eluent and obtained in 77% yield (146 mg). 1H-NMR(400.13 MHz, CDCl3) δ 7.87 (d, J = 8.0 Hz, 1H), 7.83 (d, J = 1.3 Hz, 1H), 7.75 (dd, J = 8.0, 1.3 Hz, 1H),3.75 (s, 2H), 3.32 (s, 2H), 2.90 (d, J = 49.8 Hz, 4H). 13C-NMR (100.61 MHz, CDCl3) δ 166.1, 141.1, 134.0,132.2, 131.7, 116.8, 116.7, 114.9, 114.8, 49.01, 46.6, 45.9, 43.6. HRMS (ESI-TOF) m/z calcd for [M + H]+:C13H13N4O 241.1084; found 241.1081.
3.3. General Procedure for Synthesis of Carboxamide Substituted Phthalocyanines
In a typical experiment, the desired phthalonitrile and Zn(OAc)2·2H2O were dissolved in highboiling solvent pentan-1-ol and the mixture heated to reflux temperature for the required time fortotal consumption of the substrate (checked by TLC) under nitrogen atmosphere. After distillingoff most of the solvent, the mixture was cooled to room temperature, and n-hexane was added toprecipitate the crude compound. The solid was filtered, washed with water and purified according tothe corresponding procedure. All new compounds were characterized by means of 1H-NMR, UV–VIS,fluorescence and mass spectrometry and presented in ESI.
2(3)-Tetra-(keto-N-glycinyl) phthalocyaninato zinc(II) (4a). Following the procedure describedabove, 100 mg of phthalonitrile 3a (0.41 mmol) and 29.7 mg Zn(OAc)2·2H2O (0.14 mmol) weredissolved in 1 mL of pentan-1-ol. The mixture was heated to 140 ◦C and stirred for 20 h. After workupprocedure, the zinc(II) phthalocyanine complex 4a was purified by column chromatography on silicagel first using dichloromethane/ethyl acetate (1/1) and then a mixture of dichloromethane/ethanol(20/1) as eluent to obtain 62 mg of 4a (58% yield), as a waxy dark blue solid. UV–VIS (THF) λmax
(log ε) 350 (4.52), 611 (4.22), 676 (4.87). 1H-NMR (400.13 MHz, acetone-d6, 30 ◦C) δ 8.46 (br s, 4H),8.34 (d, J = 7.7 Hz, 4H), 8.29 (s, 4H), 7.94 (d, J = 7.7 Hz, 4H), 4.04–3.94 (m, 8H), 2.76 (s, 12H). MS(MALDI-TOF-INFUSION) m/z calcd for [M + Li]+: C48H36N12O12LiZn 1043.2023; found 1043.2050. EAcalcd for C48H36N12O12Zn·2C5H12O·2H2O C, 55.70; H, 5.16; N, 13.44; found C, 55.55; H, 5.35; N, 13.50.
(S,S,S,S)-2(3)-Tetra-(keto-N-phenyl alaninyl) phthalocyaninato zinc(II) (4c). Following theprocedure described above, 45 mg of phthalonitrile 3c (0.14 mmol) and 11 mg Zn(OAc)2·2H2O(0.05 mmol) were dissolved in 0.5 mL of pentan-1-ol. The mixture was heated to 140 ◦C and stirredfor 20 h. After workup procedure, the zinc(II) phthalocyanine complex 4c was purified by columnchromatography on silica gel first using dichloromethane/ethyl acetate (5/1) and then a mixture ofdichloromethane/ethanol (20/1) as eluent to obtain 32 mg of 4c (65% yield), as a waxy dark blue solid.UV–VIS (THF) λmax (log ε) 350 (4.14), 610 (3.81), 675 (4.48). 1H-NMR (400.13 MHz, acetone-d6) δ 8.34(br s, 4H), 8.24 (d, J = 7.8 Hz 4H), 8.20 (s, 4H), 7.89 (d, J = 7.7 Hz, 4H), 7.27 (2m, 20H), 4.93 (m, 4H), 3.31(m, 4H), 3.19 (m, 4H), 2.86 (s, 12H). MS (ESI-TOF-INFUSION) m/z calcd for [M]+: C76H60N12O12Zn1396.3745; found 1396.3754. EA calcd for C76H60N12O12Zn·2C5H12O·H2O C, 64.84; H, 5.44; N, 10.55;found C, 64.59; H, 5.75; N, 10.83.
2(3)-Tetra-(tert-butyl-carboxamidyl) phthalocyaninato zinc(II) (4d). Following the proceduredescribed above, 100 mg of phthalonitrile 3d (0.44 mmol) and 32.9 mg Zn(OAc)2·2H2O (0.15 mmol)were dissolved in 0.5 mL of pentan-1-ol. The mixture was heated to 140 ◦C and stirred for 20 h. Afterworkup procedure, the zinc(II) phthalocyanine complex (4d) was purified by column chromatographyon silica gel using a mixture dichloromethane/methanol (20/1) as eluent to obtain 74 mg of (4d) (68%yield) as a dark blue solid, after recrystallization from methanol. UV–VIS (THF) λmax (log ε) 351 (4.41),610 (4.49), 676 (5.10). 1H-NMR (400.13 MHz, acetone-d6) δ 8.26–8.20 (br s, 8H), 7.88–7.86 (br s, 4H),7.58 (s, 4H), 1.48 (sl, 36H). MS (MALDI-TOF) m/z calcd for [M]+: C52H52N12O4Zn 972.3; found 972.3;
276

Catalysts 2018, 8, 480
[M + Na]+, m/z: 995.3. EA calcd for C52H52N12O4Zn·2H2O C, 61.81; H, 5.59; N, 16.63; found C, 62.06;H, 5.50; N, 16.43.
4. Conclusions
In conclusion, we have established a straightforward methodology to prepare carboxamidesubstituted phthalonitriles, using the well-known palladium-catalyzed aminocarbonylation of arylhalides in the presence of carbon monoxide (CO) to our advantage. In virtue of this direct modificationof phthalonitriles, a more accessible preparation of biocompatible phthalocyanines is, hence, achieved.Current efforts are being devoted to extending the methodology to other phthalonitriles andphthalocyanines thereof. Initial assessment of the photophysical properties led us to conclude that thistype of phthalocyanines may be usable in medicinal applications, namely optical fluorescence imaging,given the high fluorescence quantum yields (ΦF = 0.31 for biocompatible amino acid ester substitutedphthalocyanine 4c) and acceptable Stokes shifts.
Supplementary Materials: The following are available online at http://www.mdpi.com/2073-4344/8/10/480/s1,1. Experimental procedures for the synthesis of phthalonitriles 3a–g and copies of 1H, 13C NMR and Mass Spectra,2. Experimental procedures for the synthesis of phthalocyanines and copies of 1H NMR and Mass Spectra.
Author Contributions: Conceptualization: M.J.F.C. and M.M.P.; investigation: V.A.T., M.J.F.C., C.S.V. and R.T.A.;methodology: M.M.P.; supervision: M.J.F.C.; validation: V.A.T., C.S.V. and R.T.A.; writing—original draft: V.A.T.,M.J.F.C. and M.M.P.; writing—review and editing: M.J.F.C. and M.M.P.
Funding: This research was funded by FCT-Portugal (Portuguese Foundation for Science andTechnology) and FEDER (ERDF)—European Regional Development Fund through the COMPETEProgramme (Operational Programme for Competitiveness) with grants PEst-OE/QUI/UI0313/2014, toPT2020 POCI-01-0145-FEDER-027996, PTDC/QEQ-MED/3521/2014 and PTDC/QUI-OUT/27996/2017. M.J.F.C.post-doctoral grant SFRH/BPD/99698/2014 funded by FCT-Portugal. C.S.V., V.A.T. and R.T.A. PhD grants(PD/BD/128317/2017, PD/BD/128318/2017 and PD/BI/135341/2017, respectively) funded by FCT-Portugal.APC waived by MDPI.
Conflicts of Interest: There are no conflicts to declare.
References and Notes
1. Lovell, J.F.; Liu, T.W.B.; Chen, J.; Zheng, G. Activatable Photosensitizers for Imaging and Therapy. Chem. Rev.2010, 110, 2839–2857. [CrossRef] [PubMed]
2. Josefsen, L.B.; Boyle, R.W. Unique Diagnostic and Therapeutic Roles of Porphyrins and Phthalocyanines inPhotodynamic Therapy, Imaging and Theranostics. Theranostics 2012, 2, 916–966. [CrossRef] [PubMed]
3. Jiblaoui, A.; Leroy-Lhez, S.; Ouk, T.S.; Grenier, K.; Sol, V. Novel polycarboxylate porphyrins: Synthesis,characterization, photophysical properties and preliminary antimicrobial study against Gram-positivebacteria. Bioorg. Med. Chem. Lett. 2015, 25, 355–362. [CrossRef] [PubMed]
4. Calvete, M.J.F.; Pinto, S.M.A.; Pereira, M.M.; Geraldes, C.F.G.C. Metal coordinated pyrrole-based macrocyclesas contrast agents for magnetic resonance imaging technologies: Synthesis and applications. Coordin. Chem.Rev. 2017, 333, 82–107. [CrossRef]
5. Calvete, M.J.F.; Simoes, A.V.C.; Henriques, C.A.; Pinto, S.M.A.; Pereira, M.M. Tetrapyrrolic Macrocycles:Potentialities in Medical Imaging Technologies. Curr. Org. Synth. 2014, 11, 127–140. [CrossRef]
6. Tekdas, D.A.; Garifullin, R.; Senturk, B.; Zorlu, Y.; Gundogdu, U.; Atalar, E.; Tekinay, A.B.; Chernonosov, A.A.;Yerli, Y.; Dumoulin, F.; et al. Design of a Gd-DOTA-Phthalocyanine Conjugate Combining MRI ContrastImaging and Photosensitization Properties as a Potential Molecular Theranostic. Photochem. Photobiol. 2014,90, 1376–1386. [CrossRef] [PubMed]
7. Sorokin, A.B. Phthalocyanine Metal Complexes in Catalysis. Chem. Rev. 2013, 113, 8152–8191. [CrossRef][PubMed]
8. Calvete, M.J.F.; Silva, M.; Pereira, M.M.; Burrows, H.D. Inorganic helping organic: Recent advances incatalytic heterogeneous oxidations by immobilised tetrapyrrolic macrocycles in micro and mesoporoussupports. RSC Adv. 2013, 3, 22774–22789. [CrossRef]
9. Li, L.L.; Diau, E.W.G. Porphyrin-sensitized solar cells. Chem. Soc. Rev. 2013, 42, 291–304. [CrossRef][PubMed]
277
Catalysts 2018, 8, 480
10. Urbani, M.; Gratzel, M.; Nazeeruddin, M.K.; Torres, T. Meso-Substituted Porphyrins for Dye-Sensitized SolarCells. Chem. Rev. 2014, 114, 12330–12396. [CrossRef] [PubMed]
11. Bayda, M.; Dumoulin, F.; Hug, G.L.; Koput, J.; Gorniaka, R.; Wojcik, A. Fluorescent H-aggregates of anasymmetrically substituted mono-amino Zn(II) phthalocyanine. Dalton Trans. 2017, 46, 1914–1926. [CrossRef][PubMed]
12. Jiblaoui, A.; Brevier, J.; Ducourthial, G.; Gonzalez-Nunez, H.; Baudequin, C.; Sol, V.; Leroy-Lhez, S.Modulation of intermolecular interactions in new pyrimidine-porphyrin system as two-photon absorbingphotosensitizers. Tetrahedron 2015, 71, 2428–2434. [CrossRef]
13. Dini, D.; Calvete, M.J.F.; Hanack, M. Nonlinear Optical Materials for the Smart Filtering of Optical Radiation.Chem. Rev. 2016, 116, 13043–13233. [CrossRef] [PubMed]
14. Calvete, M.J.F.; Dini, D. Conjugated macrocyclic materials with photoactivated optical absorption for thecontrol of energy transmission delivered by pulsed radiations. J. Photochem. Photobiol. C Photochem. Rev.2018, 35, 56–73. [CrossRef]
15. Dumoulin, F.; Durmus, M.; Ahsen, V.; Nyokong, T. Synthetic pathways to water-soluble phthalocyaninesand close analogs. Coord. Chem. Rev. 2010, 254, 2792–2847. [CrossRef]
16. Pinto, S.M.A.; Tome, V.A.; Calvete, M.J.F.; Pereira, M.M.; Burrows, H.D.; Cardoso, A.M.S.; Pallier, A.;Castro, M.M.C.A.; Toth, E.; Geraldes, C.F.G.C. The quest for biocompatible phthalocyanines for molecularimaging: Photophysics, relaxometry and cytotoxicity studies. J. Inorg. Biochem. 2016, 154, 50–59. [CrossRef][PubMed]
17. Hanack, M.; Crucius, G.; Calvete, M.J.F.; Ziegler, T. Glycosylated Metal Phthalocyanines. Curr. Org. Synth.2014, 11, 59–66. [CrossRef]
18. Lobo, A.C.S.; Silva, A.D.; Tome, V.A.; Pinto, S.M.A.; Silva, E.F.F.; Calvete, M.J.F.; Gomes, C.M.F.; Pereira, M.M.;Arnaut, L.G. Phthalocyanine Labels for Near-Infrared Fluorescence Imaging of Solid Tumors. J. Med. Chem.2016, 59, 4688–4696. [CrossRef] [PubMed]
19. Simoes, A.V.C.; Adamowicz, A.; Dabrowski, J.M.; Calvete, M.J.F.; Abreu, A.R.; Stochel, G.; Arnaut, L.G.;Pereira, M.M. Amphiphilic meso(sulfonate ester fluoroaryl)porphyrins: Refining the substituents ofporphyrin derivatives for phototherapy and diagnostics. Tetrahedron 2012, 68, 8767–8772. [CrossRef]
20. Roffey, S.J.; Obach, R.S.; Gedge, J.I.; Smith, D.A. What is the objective of the mass balance study?A retrospective analysis of data in animal and human excretion studies employing radiolabeled drugs.Drug Metab. Rev. 2007, 39, 17–43. [CrossRef] [PubMed]
21. Ball, D.J.; Mayhew, S.; Wood, S.R.; Griffiths, J.; Vernon, D.I.; Brown, S.B. A comparative study of the cellularuptake and photodynamic efficacy of three novel zinc phthalocyanines of differing charge. Photochem.Photobiol. 1999, 69, 390–396. [CrossRef]
22. Anderson, N.; Borlak, J. Drug-induced phospholipidosis. FEBS Lett. 2006, 580, 5533–5540. [CrossRef][PubMed]
23. El-Faham, A.; Albericio, F. Peptide Coupling Reagents, More than a Letter Soup. Chem. Rev. 2011, 111,6557–6602. [CrossRef] [PubMed]
24. Dunetz, J.R.; Magano, J.; Weisenburger, G.A. Large-Scale Applications of Amide Coupling Reagents for theSynthesis of Pharmaceuticals. Org. Process. Res. Dev. 2016, 20, 140–177. [CrossRef]
25. Pattabiraman, V.R.; Bode, J.W. Rethinking amide bond synthesis. Nature 2011, 480, 471–479. [CrossRef][PubMed]
26. Osburn, E.J.; Chau, L.K.; Chen, S.Y.; Collins, N.; OBrien, D.F.; Armstrong, N.R. Novel amphiphilicphthalocyanines: Formation of Langmuir-Blodgett and cast thin films. Langmuir 1996, 12, 4784–4796.[CrossRef]
27. Dong, R.N.; Qiu, Y.; Tian, S.F.; Wang, S.Q.; Song, X.Q. Oxidative biomacromolecular damage from novelphthalocyanine. Sci. China Ser. B 1998, 41, 45–49. [CrossRef]
28. Mikhalenko, S.A.; Solov’eva, L.I.; Luk’yanets, E.A. Phthalocyanines and related compounds: XXXVII.Synthesis of covalent conjugates of carboxy-substituted phthalocyanines with alpha-amino acids. Russ. J.Gen. Chem. 2004, 74, 451–459. [CrossRef]
29. Haywood-Small, S.L.; Vernon, D.I.; Griffiths, J.; Schofield, J.; Brown, S.B. Phthalocyanine-mediatedphotodynamic therapy induces cell death and a G(0)/G(1) cell cycle arrest in cervical cancer cells. Biochem.Biophys. Res. Commun. 2006, 339, 569–576. [CrossRef] [PubMed]
278
Catalysts 2018, 8, 480
30. Drechsler, U.; Pfaff, M.; Hanack, M. Synthesis of novel functionalised zinc phthalocyanines applicable inphotodynamic therapy. Eur. J. Org. Chem. 1999, 3441–3453. [CrossRef]
31. Sibrian-Vazquez, M.; Ortiz, J.; Nesterova, I.V.; Fernandez-Lazaro, F.; Sastre-Santos, A.; Soper, S.A.;Vicente, M.G.H. Synthesis and properties of cell-targeted Zn(II)-phthalocyanine-peptide conjugates.Bioconjugate Chem. 2007, 18, 410–420. [CrossRef] [PubMed]
32. Ongarora, B.G.; Fontenot, K.R.; Hu, X.K.; Sehgal, I.; Satyanarayana-Jois, S.D.; Vicente, D.G.H.Phthalocyanine-Peptide Conjugates for Epidermal Growth Factor Receptor Targeting. J. Med. Chem. 2012, 55,3725–3738. [CrossRef] [PubMed]
33. Dubuc, C.; Langlois, R.; Benard, F.; Cauchon, N.; Klarskov, K.; Tone, P.; van Lier, J.E. Targetinggastrin-releasing peptide receptors of prostate cancer cells for photodynamic therapy with aphthalocyanine-bombesin conjugate. Bioorg. Med. Chem. Lett. 2008, 18, 2424–2427. [CrossRef] [PubMed]
34. Ali, H.; Ait-Mohand, S.; Gosselin, S.; van Lier, J.E.; Guerin, B. Phthalocyanine-Peptide Conjugates viaPalladium-Catalyzed Cross-Coupling Reactions. J. Org. Chem. 2011, 76, 1887–1890. [CrossRef] [PubMed]
35. Chen, Z.; Zhou, S.Y.; Chen, J.C.; Deng, Y.C.; Luo, Z.P.; Chen, H.W.; Hamblin, M.R.; Huang, M.D. Pentalysinebeta-Carbonylphthalocyanine Zinc: An Effective Tumor-Targeting Photosensitizer for PhotodynamicTherapy. Chemmedchem 2010, 5, 890–898. [CrossRef] [PubMed]
36. Montalbetti, C.A.G.N.; Falque, V. Amide bond formation and peptide coupling. Tetrahedron 2005, 61,10827–10852. [CrossRef]
37. Han, S.Y.; Kim, Y.A. Recent development of peptide coupling reagents in organic synthesis. Tetrahedron 2004,60, 2447–2467. [CrossRef]
38. Schoenberg, A.; Heck, R.F. Palladium-Catalyzed Formylation of Aryl, Heterocyclic, and Vinylic Halides.J. Am. Chem. Soc. 1974, 96, 7761–7764. [CrossRef]
39. Gabriele, B.; Veltri, L.; Mancuso, R.; Carfagna, C. Cascade Reactions: A Multicomponent Approach toFunctionalized Indane Derivatives by a Tandem Palladium- Catalyzed Carbamoylation/CarbocylizationProcess. Adv. Synth. Catal. 2014, 356, 2547–2558. [CrossRef]
40. Veltri, L.; Mancuso, R.; Altomare, A.; Gabriele, B. Divergent Multicomponent Tandem Palladium-CatalyzedAminocarbonylation-Cyclization Approaches to Functionalized Imidazothiazinones and Imidazothiazoles.ChemCatChem 2015, 7, 2206–2213. [CrossRef]
41. Veltri, L.; Grasso, G.; Rizzi, R.; Mancuso, R.; Gabriele, B. Palladium-Catalyzed Carbonylative MulticomponentSynthesis of Functionalized Benzimidazothiazoles. Asian J. Org. Chem. 2016, 5, 560–567. [CrossRef]
42. Veltri, L.; Giofrè, S.V.; Devo, P.; Romeo, R.; Dobbs, A.P.; Gabriele, B. A Palladium Iodide-Catalyzed OxidativeAminocarbonylation–Heterocyclization Approach to Functionalized Benzimidazoimidazoles. J. Org. Chem.2018, 83, 1680–1685. [CrossRef] [PubMed]
43. Gabriele, B.; Mancuso, R.; Salerno, G. Oxidative Carbonylation as a Powerful Tool for the Direct Synthesis ofCarbonylated Heterocycles. Eur. J. Org. Chem. 2012, 2012, 6825–6839. [CrossRef]
44. Wu, X.-F.; Neumann, H.; Beller, M. Synthesis of Heterocycles via Palladium-Catalyzed Carbonylations.Chem. Rev. 2013, 113, 1–35. [CrossRef] [PubMed]
45. Wu, X.-F.; Neumann, H.; Beller, M. Palladium-Catalyzed Oxidative Carbonylation Reactions. Chemsuschem2013, 6, 229–241. [CrossRef] [PubMed]
46. Gadge, S.T.; Bhanage, B.M. Recent developments in palladium catalysed carbonylation reactions. RSC Adv.2014, 4, 10367–10389. [CrossRef]
47. Wu, L.; Fang, X.; Liu, Q.; Jackstell, R.; Beller, M.; Wu, X.-F. Palladium-Catalyzed CarbonylativeTransformation of C(sp3)–X Bonds. ACS Catal. 2014, 4, 2977–2989. [CrossRef]
48. Kalck, P.; Urrutigoïty, M. Recent improvements in the alkoxycarbonylation reaction catalyzed by transitionmetal complexes. Inorg. Chim. Acta 2015, 431, 110–121. [CrossRef]
49. Wu, X.-F. Palladium-catalyzed carbonylative transformation of aryl chlorides and aryl tosylates. RSC Adv.2016, 6, 83831–83837. [CrossRef]
50. Shen, C.; Wu, X.-F. Palladium-Catalyzed Carbonylative Multicomponent Reactions. Chem.A Eur. J. 2017, 23,2973–2987. [CrossRef] [PubMed]
51. Kollar, L. Modern Carbonylation Methods; Kollar, L., Ed.; Wiley VCH: Weinheim, Germany, 2008.52. Nemykin, V.N.; Lukyanets, E.A. Synthesis of substituted phthalocyanines. Arkivoc 2010, 136–208.
279
Catalysts 2018, 8, 480
53. Yang, S.I.; Li, J.Z.; Cho, H.S.; Kim, D.; Bocian, D.F.; Holten, D.; Lindsey, J.S. Synthesis and excited-statephotodynamics of phenylethyne-linked porphyrin-phthalocyanine dyads. J. Mater. Chem. 2000, 10, 283–296.[CrossRef]
54. Carrilho, R.M.B.; Heguaburu, V.; Schapiro, V.; Pandolfi, E.; Kollar, L.; Pereira, M.M. An efficient route forthe synthesis of chiral conduritol-derivative carboxamides via palladium-catalyzed aminocarbonylation ofbromocyclohexenetetraols. Tetrahedron 2012, 68, 6935–6940. [CrossRef]
55. Carrilho, R.M.B.; Pereira, M.M.; Takacs, A.; Kollar, L. Systematic study on the catalytic synthesisof unsaturated 2-ketocarboxamides: Palladium-catalyzed double carbonylation of 1-iodocyclohexene.Tetrahedron 2012, 68, 204–207. [CrossRef]
56. Fun, H.K.; Kobkeatthawin, T.; Ruanwas, P.; Chantrapromma, S. (E)-1-(4-Aminophenyl)-3-(2,4,5-trimethoxyphenyl)prop-2-en-1-one. Acta Crystallogr. E 2010, 66, O1973-U1802. [CrossRef] [PubMed]
57. Muller, E.; Peczely, G.; Skoda-Foldes, R.; Takacs, E.; Kokotos, G.; Bellis, E.; Kollar, L. Homogeneous catalyticaminocarbonylation of iodoalkenes and iodobenzene with amino acid esters under conventional conditionsand in ionic liquids. Tetrahedron 2005, 61, 797–802. [CrossRef]
58. Takacs, A.; Abreu, A.R.; Peixoto, A.F.; Pereira, M.; Kollar, L. Synthesis of Ortho-alkoxy-aryl Carboxamidesvia Palladium-Catalyzed Aminocarbonylation. Synth. Commun. 2009, 39, 1534–1548. [CrossRef]
59. Li, B.Y.; Zhang, Y.M.; Ma, D.X.; Li, L.; Li, G.H.; Li, G.D.; Shi, Z.; Feng, S.H. A strategy toward constructing abifunctionalized MOF catalyst: Post-synthetic modification of MOFs on organic ligands and coordinativelyunsaturated metal sites. Chem. Commun. 2012, 48, 6151–6153. [CrossRef] [PubMed]
60. Prasad, Y.R.; Rao, A.S.; Rambabu, R. Synthesis of Some 4′-Amino Chalcones and their Antiinflammatoryand Antimicrobial Activity. Asian J. Chem. 2009, 21, 907–914.
61. Fang, W.W.; Zhu, H.B.; Deng, Q.Y.; Liu, S.L.; Liu, X.Y.; Shen, Y.J.; Tu, T. Design and Development of Ligandsfor Palladium-Catalyzed Carbonylation Reactions. Synthesis-Stuttgart 2014, 46, 1689–1708. [CrossRef]
62. De la Fuente, V.; Godard, C.; Claver, C.; Castillon, S. Highly Selective Palladium-CatalysedAminocarbonylation of Aryl Iodides using a Bulky Diphosphine Ligand. Adv. Synth. Catal. 2012, 354,1971–1979. [CrossRef]
63. Brennfuhrer, A.; Neumann, H.; Beller, M. Palladium-Catalyzed Carbonylation Reactions of Aryl Halides andRelated Compounds. Angew. Chem. Int. Ed. 2009, 48, 4114–4133. [CrossRef] [PubMed]
64. Wu, X.F.; Neumann, H.; Beller, M. Selective Palladium-Catalyzed Aminocarbonylation of Aryl Halides withCO and Ammonia. Chem. Eur. J. 2010, 16, 9750–9753. [CrossRef] [PubMed]
65. Carrilho, R.M.B.; Almeida, A.R.; Kiss, M.; Kollar, L.; Skoda-Foldes, R.; Dabrowski, J.M.; Moreno, M.J.S.M.;Pereira, M.M. One-Step Synthesis of Dicarboxamides through Pd-Catalysed Aminocarbonylation withDiamines as N-Nucleophiles. Eur. J. Org. Chem. 2015, 1840–1847. [CrossRef]
66. Dwyer, D.S.; Bradley, R.J. Chemical properties of alcohols and their protein binding sites. Cell. Mol. Life Sci.2000, 57, 265–275. [CrossRef] [PubMed]
67. Graton, J.; Besseau, F.; Brossard, A.M.; Charpentier, E.; Deroche, A.; Le Questel, J.Y. Hydrogen-Bond Acidityof OH Groups in Various Molecular Environments (Phenols, Alcohols, Steroid Derivatives, and AminoAcids Structures): Experimental Measurements and Density Functional Theory Calculations. J. Phys. Chem.A 2013, 117, 13184–13193. [CrossRef] [PubMed]
68. Atilla, D.; Durmus, M.; Gurek, A.G.; Ahsen, V.; Nyokong, T. Synthesis, photophysical and photochemicalproperties of poly(oxyethylene)-substituted zinc phthalocyanines. Dalton Trans. 2007, 1235–1243. [CrossRef][PubMed]
69. Sekkat, N.; van den Bergh, H.; Nyokong, T.; Lange, N. Like a Bolt from the Blue: Phthalocyanines inBiomedical Optics. Molecules 2012, 17, 98–144. [CrossRef] [PubMed]
70. Isago, H. Optical Spectra of Phthalocyanines and Related Compounds: A Guide for Beginners; Springer: Tokyo,Japan, 2015.
© 2018 by the authors. Licensee MDPI, Basel, Switzerland. This article is an open accessarticle distributed under the terms and conditions of the Creative Commons Attribution(CC BY) license (http://creativecommons.org/licenses/by/4.0/).
280
catalysts
Communication
Layered Double Hydroxides as Bifunctional Catalystsfor the Aryl Borylation under Ligand-Free Conditions
Lorenna C. L. L. F. Silva 1, Vinícius A. Neves 1, Vitor S. Ramos 2, Raphael S. F. Silva 3,
José B. de Campos 2, Alexsandro A. da Silva 4, Luiz F. B. Malta 1,* and Jaqueline D. Senra 1,4,*1 Laboratório de Química Supramolecular e de Sólidos, Instituto de Química, Universidade Federal do Rio de
Janeiro, Rio de Janeiro 21941-909, Brazil; [email protected] (L.C.L.L.F.S.);[email protected] (V.A.N.)
2 Faculdade de Engenharia, Universidade do Estado do Rio de Janeiro, Rio de Janeiro 20550-900, Brazil;[email protected] (V.S.R.); [email protected] (J.B.d.C.)
3 Instituto Federal do Rio de Janeiro, Campus Rio de Janeiro, Rio de Janeiro 20270-021, Brazil;[email protected]
4 Instituto de Química, Universidade do Estado do Rio de Janeiro, Rio de Janeiro 20550-900, Brazil;[email protected]
* Correspondence: [email protected] (L.F.B.M.); [email protected] (J.D.S.);Tel.: +55-21-3938-7738 (L.F.B.M.); +55-21-2334-0563 (J.D.S.)
Received: 29 January 2019; Accepted: 18 March 2019; Published: 27 March 2019
Abstract: Organic derivatives of boron, such as boronic esters and acids, are important precursorsfor a wide range of environmental, energy, and health applications. Several catalytic methods fortheir synthesis have been reported, even though with the use of toxic and structurally complexligands. Herein, we demonstrate preliminary studies envisaging the synthesis of boronic esters froman inexpensive catalytic system based on Cu/Al layered double hydroxides (LDH) in the presence ofNa2PdCl4. The Cu/ Al LDHs were prepared according to coprecipitation method and characterizedby X-ray diffraction (XRD) (with Rietveld refinement) to evaluate the contamination with malachiteand other phases. Preliminary catalytic results suggest that pure Cu/Al LDH has potential for theborylation of aryl iodides/ bromides in the absence of base. Indeed, a synergic effect between copperand palladium is possibly related to the catalytic efficiency.
Keywords: boronic esters; borylation; Suzuki–Miyaura; layered double hydroxides;copper; palladium
1. Introduction
Organoboron compounds have received great attention in last years due to significant impactin analytical [1], technological [2], and medicinal fields [3]. Particularly, low-weight compoundscontaining boronic acid/ester moieties have played an important role in the synthesis of new hybridmaterials, sensors and complex organic molecules, through synthetic protocols such as Suzuki–Miyaurareactions. However, mild and selective synthesis of boronic acids and esters still represent a challenge.In general, the classic reactions involving the generation of organometallics (e.g., arylmagnesium oraryllithium) followed by the reaction with a borate have been substituted by catalytic protocols [4].Recently, new methods involving metal-free conditions have also been discovered [5,6]. However,most of them suffer from low reactivity/selectivity along with relatively high costs of the boronreagents. Some advantages of the catalytic protocols are the improved reaction selectivity andthe possibility of the whole system reuse. Since the general steps for the catalytic synthesis ofboronic acids and esters involve a sequence of oxidative addition and reductive elimination, severalsemihomogenous or heterogeneous systems are described based on the employment of noble metals(e.g., Pd and Ir) as catalysts [7].
Catalysts 2019, 9, 302; doi:10.3390/catal9040302 www.mdpi.com/journal/catalysts281
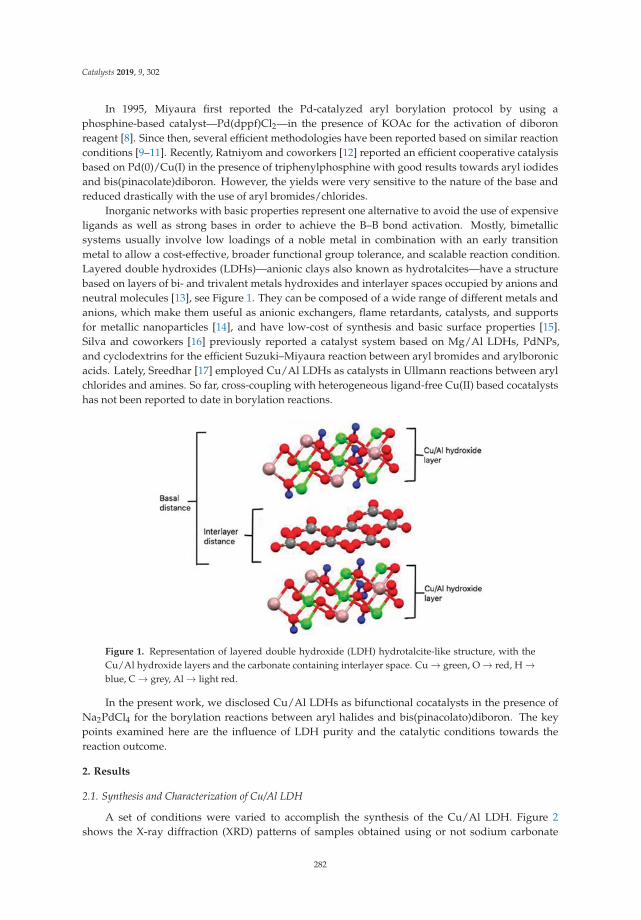
Catalysts 2019, 9, 302
In 1995, Miyaura first reported the Pd-catalyzed aryl borylation protocol by using aphosphine-based catalyst—Pd(dppf)Cl2—in the presence of KOAc for the activation of diboronreagent [8]. Since then, several efficient methodologies have been reported based on similar reactionconditions [9–11]. Recently, Ratniyom and coworkers [12] reported an efficient cooperative catalysisbased on Pd(0)/Cu(I) in the presence of triphenylphosphine with good results towards aryl iodidesand bis(pinacolate)diboron. However, the yields were very sensitive to the nature of the base andreduced drastically with the use of aryl bromides/chlorides.
Inorganic networks with basic properties represent one alternative to avoid the use of expensiveligands as well as strong bases in order to achieve the B–B bond activation. Mostly, bimetallicsystems usually involve low loadings of a noble metal in combination with an early transitionmetal to allow a cost-effective, broader functional group tolerance, and scalable reaction condition.Layered double hydroxides (LDHs)—anionic clays also known as hydrotalcites—have a structurebased on layers of bi- and trivalent metals hydroxides and interlayer spaces occupied by anions andneutral molecules [13], see Figure 1. They can be composed of a wide range of different metals andanions, which make them useful as anionic exchangers, flame retardants, catalysts, and supportsfor metallic nanoparticles [14], and have low-cost of synthesis and basic surface properties [15].Silva and coworkers [16] previously reported a catalyst system based on Mg/Al LDHs, PdNPs,and cyclodextrins for the efficient Suzuki–Miyaura reaction between aryl bromides and arylboronicacids. Lately, Sreedhar [17] employed Cu/Al LDHs as catalysts in Ullmann reactions between arylchlorides and amines. So far, cross-coupling with heterogeneous ligand-free Cu(II) based cocatalystshas not been reported to date in borylation reactions.
Figure 1. Representation of layered double hydroxide (LDH) hydrotalcite-like structure, with theCu/Al hydroxide layers and the carbonate containing interlayer space. Cu → green, O → red, H →blue, C → grey, Al → light red.
In the present work, we disclosed Cu/Al LDHs as bifunctional cocatalysts in the presence ofNa2PdCl4 for the borylation reactions between aryl halides and bis(pinacolato)diboron. The keypoints examined here are the influence of LDH purity and the catalytic conditions towards thereaction outcome.
2. Results
2.1. Synthesis and Characterization of Cu/Al LDH
A set of conditions were varied to accomplish the synthesis of the Cu/Al LDH. Figure 2shows the X-ray diffraction (XRD) patterns of samples obtained using or not sodium carbonate
282
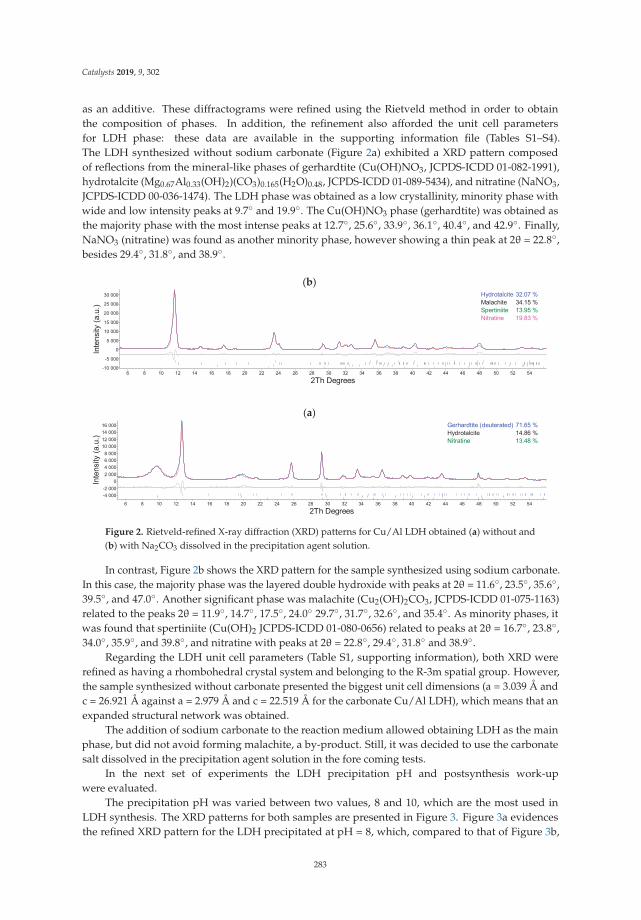
Catalysts 2019, 9, 302
as an additive. These diffractograms were refined using the Rietveld method in order to obtainthe composition of phases. In addition, the refinement also afforded the unit cell parametersfor LDH phase: these data are available in the supporting information file (Tables S1–S4).The LDH synthesized without sodium carbonate (Figure 2a) exhibited a XRD pattern composedof reflections from the mineral-like phases of gerhardtite (Cu(OH)NO3, JCPDS-ICDD 01-082-1991),hydrotalcite (Mg0.67Al0.33(OH)2)(CO3)0.165(H2O)0.48, JCPDS-ICDD 01-089-5434), and nitratine (NaNO3,JCPDS-ICDD 00-036-1474). The LDH phase was obtained as a low crystallinity, minority phase withwide and low intensity peaks at 9.7◦ and 19.9◦. The Cu(OH)NO3 phase (gerhardtite) was obtained asthe majority phase with the most intense peaks at 12.7◦, 25.6◦, 33.9◦, 36.1◦, 40.4◦, and 42.9◦. Finally,NaNO3 (nitratine) was found as another minority phase, however showing a thin peak at 2θ = 22.8◦,besides 29.4◦, 31.8◦, and 38.9◦.
(b)
(a)
Figure 2. Rietveld-refined X-ray diffraction (XRD) patterns for Cu/Al LDH obtained (a) without and(b) with Na2CO3 dissolved in the precipitation agent solution.
In contrast, Figure 2b shows the XRD pattern for the sample synthesized using sodium carbonate.In this case, the majority phase was the layered double hydroxide with peaks at 2θ = 11.6◦, 23.5◦, 35.6◦,39.5◦, and 47.0◦. Another significant phase was malachite (Cu2(OH)2CO3, JCPDS-ICDD 01-075-1163)related to the peaks 2θ = 11.9◦, 14.7◦, 17.5◦, 24.0◦ 29.7◦, 31.7◦, 32.6◦, and 35.4◦. As minority phases, itwas found that spertiniite (Cu(OH)2 JCPDS-ICDD 01-080-0656) related to peaks at 2θ = 16.7◦, 23.8◦,34.0◦, 35.9◦, and 39.8◦, and nitratine with peaks at 2θ = 22.8◦, 29.4◦, 31.8◦ and 38.9◦.
Regarding the LDH unit cell parameters (Table S1, supporting information), both XRD wererefined as having a rhombohedral crystal system and belonging to the R-3m spatial group. However,the sample synthesized without carbonate presented the biggest unit cell dimensions (a = 3.039 Å andc = 26.921 Å against a = 2.979 Å and c = 22.519 Å for the carbonate Cu/Al LDH), which means that anexpanded structural network was obtained.
The addition of sodium carbonate to the reaction medium allowed obtaining LDH as the mainphase, but did not avoid forming malachite, a by-product. Still, it was decided to use the carbonatesalt dissolved in the precipitation agent solution in the fore coming tests.
In the next set of experiments the LDH precipitation pH and postsynthesis work-upwere evaluated.
The precipitation pH was varied between two values, 8 and 10, which are the most used inLDH synthesis. The XRD patterns for both samples are presented in Figure 3. Figure 3a evidencesthe refined XRD pattern for the LDH precipitated at pH = 8, which, compared to that of Figure 3b,
283
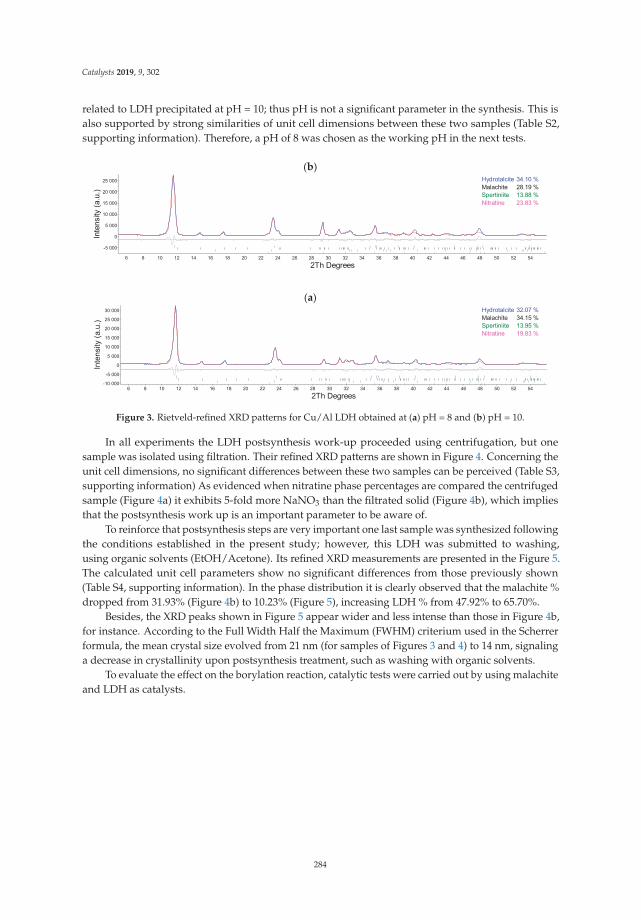
Catalysts 2019, 9, 302
related to LDH precipitated at pH = 10; thus pH is not a significant parameter in the synthesis. This isalso supported by strong similarities of unit cell dimensions between these two samples (Table S2,supporting information). Therefore, a pH of 8 was chosen as the working pH in the next tests.
(b)
(a)
Figure 3. Rietveld-refined XRD patterns for Cu/Al LDH obtained at (a) pH = 8 and (b) pH = 10.
In all experiments the LDH postsynthesis work-up proceeded using centrifugation, but onesample was isolated using filtration. Their refined XRD patterns are shown in Figure 4. Concerning theunit cell dimensions, no significant differences between these two samples can be perceived (Table S3,supporting information) As evidenced when nitratine phase percentages are compared the centrifugedsample (Figure 4a) it exhibits 5-fold more NaNO3 than the filtrated solid (Figure 4b), which impliesthat the postsynthesis work up is an important parameter to be aware of.
To reinforce that postsynthesis steps are very important one last sample was synthesized followingthe conditions established in the present study; however, this LDH was submitted to washing,using organic solvents (EtOH/Acetone). Its refined XRD measurements are presented in the Figure 5.The calculated unit cell parameters show no significant differences from those previously shown(Table S4, supporting information). In the phase distribution it is clearly observed that the malachite %dropped from 31.93% (Figure 4b) to 10.23% (Figure 5), increasing LDH % from 47.92% to 65.70%.
Besides, the XRD peaks shown in Figure 5 appear wider and less intense than those in Figure 4b,for instance. According to the Full Width Half the Maximum (FWHM) criterium used in the Scherrerformula, the mean crystal size evolved from 21 nm (for samples of Figures 3 and 4) to 14 nm, signalinga decrease in crystallinity upon postsynthesis treatment, such as washing with organic solvents.
To evaluate the effect on the borylation reaction, catalytic tests were carried out by using malachiteand LDH as catalysts.
284
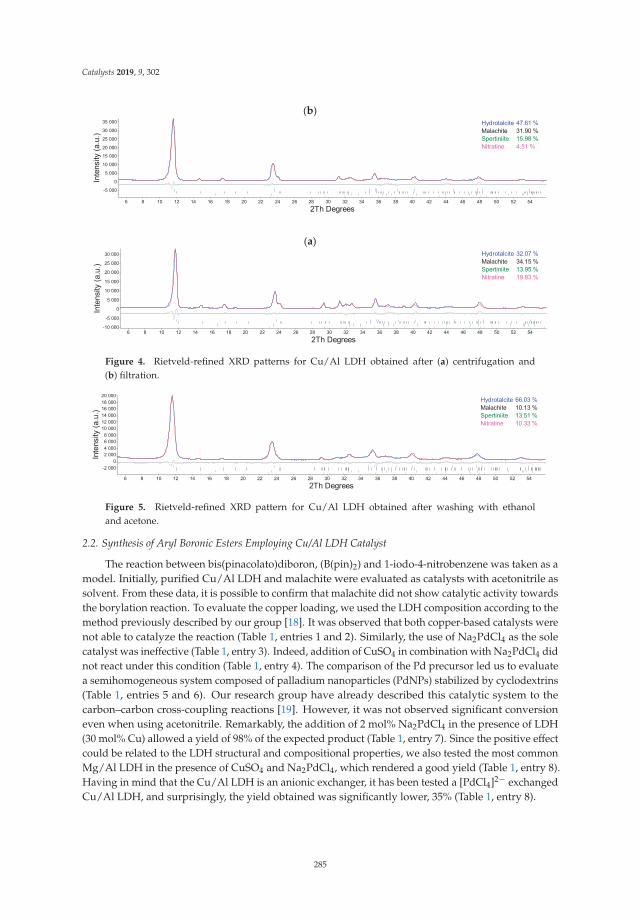
Catalysts 2019, 9, 302
(b)
(a)
Figure 4. Rietveld-refined XRD patterns for Cu/Al LDH obtained after (a) centrifugation and(b) filtration.
Figure 5. Rietveld-refined XRD pattern for Cu/Al LDH obtained after washing with ethanoland acetone.
2.2. Synthesis of Aryl Boronic Esters Employing Cu/Al LDH Catalyst
The reaction between bis(pinacolato)diboron, (B(pin)2) and 1-iodo-4-nitrobenzene was taken as amodel. Initially, purified Cu/Al LDH and malachite were evaluated as catalysts with acetonitrile assolvent. From these data, it is possible to confirm that malachite did not show catalytic activity towardsthe borylation reaction. To evaluate the copper loading, we used the LDH composition according to themethod previously described by our group [18]. It was observed that both copper-based catalysts werenot able to catalyze the reaction (Table 1, entries 1 and 2). Similarly, the use of Na2PdCl4 as the solecatalyst was ineffective (Table 1, entry 3). Indeed, addition of CuSO4 in combination with Na2PdCl4 didnot react under this condition (Table 1, entry 4). The comparison of the Pd precursor led us to evaluatea semihomogeneous system composed of palladium nanoparticles (PdNPs) stabilized by cyclodextrins(Table 1, entries 5 and 6). Our research group have already described this catalytic system to thecarbon–carbon cross-coupling reactions [19]. However, it was not observed significant conversioneven when using acetonitrile. Remarkably, the addition of 2 mol% Na2PdCl4 in the presence of LDH(30 mol% Cu) allowed a yield of 98% of the expected product (Table 1, entry 7). Since the positive effectcould be related to the LDH structural and compositional properties, we also tested the most commonMg/Al LDH in the presence of CuSO4 and Na2PdCl4, which rendered a good yield (Table 1, entry 8).Having in mind that the Cu/Al LDH is an anionic exchanger, it has been tested a [PdCl4]2− exchangedCu/Al LDH, and surprisingly, the yield obtained was significantly lower, 35% (Table 1, entry 8).
285
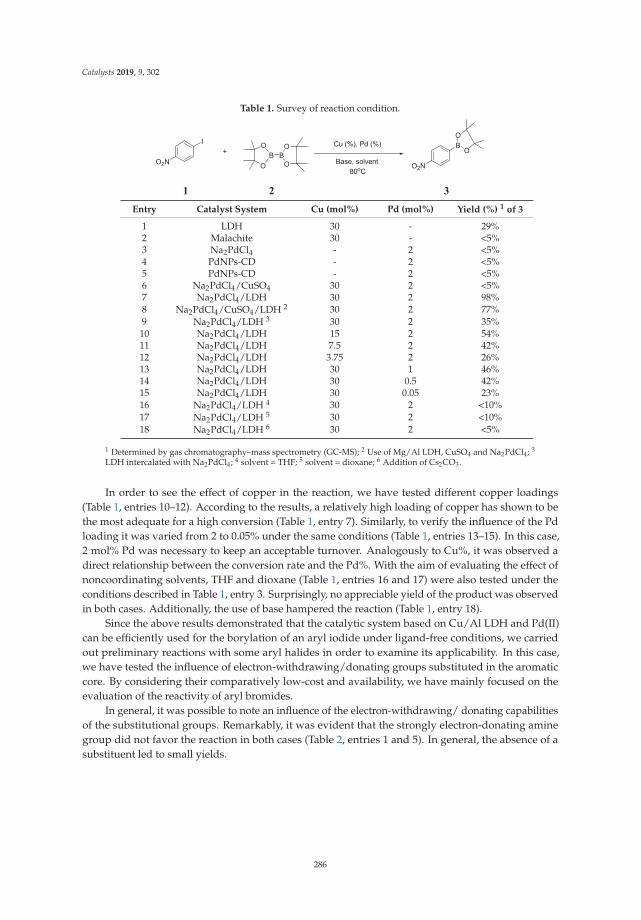
Catalysts 2019, 9, 302
Table 1. Survey of reaction condition.
Entry Catalyst System Cu (mol%) Pd (mol%) Yield (%) 1 of 3
1 LDH 30 - 29%2 Malachite 30 - <5%3 Na2PdCl4 - 2 <5%4 PdNPs-CD - 2 <5%5 PdNPs-CD - 2 <5%6 Na2PdCl4/CuSO4 30 2 <5%7 Na2PdCl4/LDH 30 2 98%8 Na2PdCl4/CuSO4/LDH 2 30 2 77%9 Na2PdCl4/LDH 3 30 2 35%
10 Na2PdCl4/LDH 15 2 54%11 Na2PdCl4/LDH 7.5 2 42%12 Na2PdCl4/LDH 3.75 2 26%13 Na2PdCl4/LDH 30 1 46%14 Na2PdCl4/LDH 30 0.5 42%15 Na2PdCl4/LDH 30 0.05 23%16 Na2PdCl4/LDH 4 30 2 <10%17 Na2PdCl4/LDH 5 30 2 <10%18 Na2PdCl4/LDH 6 30 2 <5%
1 Determined by gas chromatography–mass spectrometry (GC-MS); 2 Use of Mg/Al LDH, CuSO4 and Na2PdCl4; 3
LDH intercalated with Na2PdCl4; 4 solvent = THF; 5 solvent = dioxane; 6 Addition of Cs2CO3.
In order to see the effect of copper in the reaction, we have tested different copper loadings(Table 1, entries 10–12). According to the results, a relatively high loading of copper has shown to bethe most adequate for a high conversion (Table 1, entry 7). Similarly, to verify the influence of the Pdloading it was varied from 2 to 0.05% under the same conditions (Table 1, entries 13–15). In this case,2 mol% Pd was necessary to keep an acceptable turnover. Analogously to Cu%, it was observed adirect relationship between the conversion rate and the Pd%. With the aim of evaluating the effect ofnoncoordinating solvents, THF and dioxane (Table 1, entries 16 and 17) were also tested under theconditions described in Table 1, entry 3. Surprisingly, no appreciable yield of the product was observedin both cases. Additionally, the use of base hampered the reaction (Table 1, entry 18).
Since the above results demonstrated that the catalytic system based on Cu/Al LDH and Pd(II)can be efficiently used for the borylation of an aryl iodide under ligand-free conditions, we carriedout preliminary reactions with some aryl halides in order to examine its applicability. In this case,we have tested the influence of electron-withdrawing/donating groups substituted in the aromaticcore. By considering their comparatively low-cost and availability, we have mainly focused on theevaluation of the reactivity of aryl bromides.
In general, it was possible to note an influence of the electron-withdrawing/ donating capabilitiesof the substitutional groups. Remarkably, it was evident that the strongly electron-donating aminegroup did not favor the reaction in both cases (Table 2, entries 1 and 5). In general, the absence of asubstituent led to small yields.
286
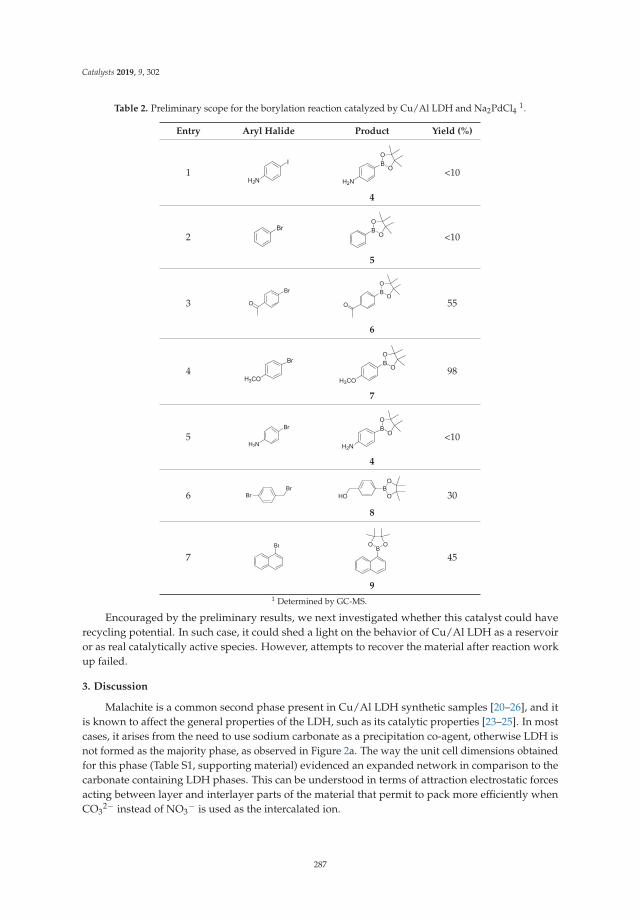
Catalysts 2019, 9, 302
Table 2. Preliminary scope for the borylation reaction catalyzed by Cu/Al LDH and Na2PdCl4 1.
Entry Aryl Halide Product Yield (%)
1
4
<10
2
5
<10
3
6
55
4
7
98
5
4
<10
6
8
30
7
9
45
1 Determined by GC-MS.
Encouraged by the preliminary results, we next investigated whether this catalyst could haverecycling potential. In such case, it could shed a light on the behavior of Cu/Al LDH as a reservoiror as real catalytically active species. However, attempts to recover the material after reaction workup failed.
3. Discussion
Malachite is a common second phase present in Cu/Al LDH synthetic samples [20–26], and itis known to affect the general properties of the LDH, such as its catalytic properties [23–25]. In mostcases, it arises from the need to use sodium carbonate as a precipitation co-agent, otherwise LDH isnot formed as the majority phase, as observed in Figure 2a. The way the unit cell dimensions obtainedfor this phase (Table S1, supporting material) evidenced an expanded network in comparison to thecarbonate containing LDH phases. This can be understood in terms of attraction electrostatic forcesacting between layer and interlayer parts of the material that permit to pack more efficiently whenCO3
2− instead of NO3− is used as the intercalated ion.
287
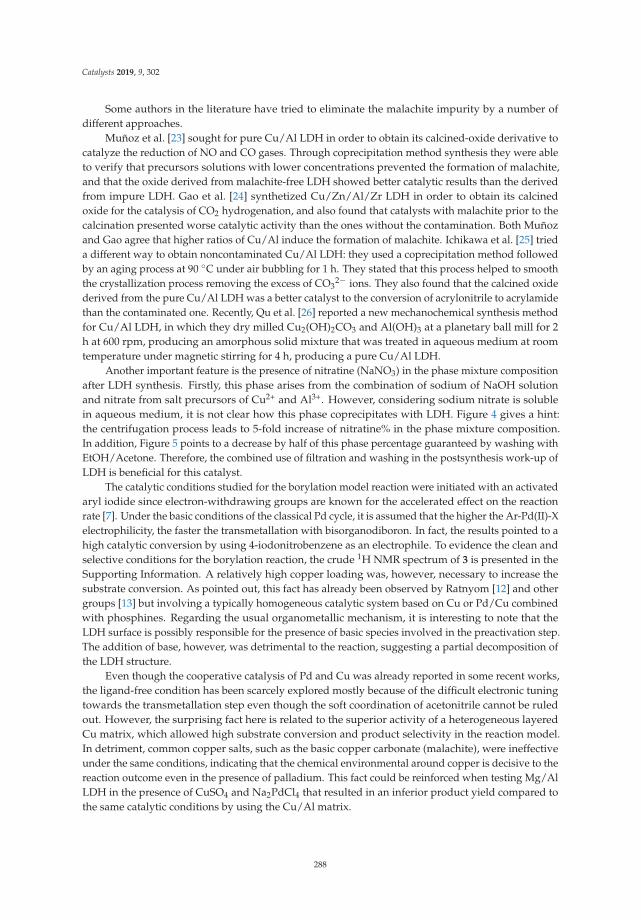
Catalysts 2019, 9, 302
Some authors in the literature have tried to eliminate the malachite impurity by a number ofdifferent approaches.
Muñoz et al. [23] sought for pure Cu/Al LDH in order to obtain its calcined-oxide derivative tocatalyze the reduction of NO and CO gases. Through coprecipitation method synthesis they were ableto verify that precursors solutions with lower concentrations prevented the formation of malachite,and that the oxide derived from malachite-free LDH showed better catalytic results than the derivedfrom impure LDH. Gao et al. [24] synthetized Cu/Zn/Al/Zr LDH in order to obtain its calcinedoxide for the catalysis of CO2 hydrogenation, and also found that catalysts with malachite prior to thecalcination presented worse catalytic activity than the ones without the contamination. Both Muñozand Gao agree that higher ratios of Cu/Al induce the formation of malachite. Ichikawa et al. [25] trieda different way to obtain noncontaminated Cu/Al LDH: they used a coprecipitation method followedby an aging process at 90 ◦C under air bubbling for 1 h. They stated that this process helped to smooththe crystallization process removing the excess of CO3
2− ions. They also found that the calcined oxidederived from the pure Cu/Al LDH was a better catalyst to the conversion of acrylonitrile to acrylamidethan the contaminated one. Recently, Qu et al. [26] reported a new mechanochemical synthesis methodfor Cu/Al LDH, in which they dry milled Cu2(OH)2CO3 and Al(OH)3 at a planetary ball mill for 2h at 600 rpm, producing an amorphous solid mixture that was treated in aqueous medium at roomtemperature under magnetic stirring for 4 h, producing a pure Cu/Al LDH.
Another important feature is the presence of nitratine (NaNO3) in the phase mixture compositionafter LDH synthesis. Firstly, this phase arises from the combination of sodium of NaOH solutionand nitrate from salt precursors of Cu2+ and Al3+. However, considering sodium nitrate is solublein aqueous medium, it is not clear how this phase coprecipitates with LDH. Figure 4 gives a hint:the centrifugation process leads to 5-fold increase of nitratine% in the phase mixture composition.In addition, Figure 5 points to a decrease by half of this phase percentage guaranteed by washing withEtOH/Acetone. Therefore, the combined use of filtration and washing in the postsynthesis work-up ofLDH is beneficial for this catalyst.
The catalytic conditions studied for the borylation model reaction were initiated with an activatedaryl iodide since electron-withdrawing groups are known for the accelerated effect on the reactionrate [7]. Under the basic conditions of the classical Pd cycle, it is assumed that the higher the Ar-Pd(II)-Xelectrophilicity, the faster the transmetallation with bisorganodiboron. In fact, the results pointed to ahigh catalytic conversion by using 4-iodonitrobenzene as an electrophile. To evidence the clean andselective conditions for the borylation reaction, the crude 1H NMR spectrum of 3 is presented in theSupporting Information. A relatively high copper loading was, however, necessary to increase thesubstrate conversion. As pointed out, this fact has already been observed by Ratnyom [12] and othergroups [13] but involving a typically homogeneous catalytic system based on Cu or Pd/Cu combinedwith phosphines. Regarding the usual organometallic mechanism, it is interesting to note that theLDH surface is possibly responsible for the presence of basic species involved in the preactivation step.The addition of base, however, was detrimental to the reaction, suggesting a partial decomposition ofthe LDH structure.
Even though the cooperative catalysis of Pd and Cu was already reported in some recent works,the ligand-free condition has been scarcely explored mostly because of the difficult electronic tuningtowards the transmetallation step even though the soft coordination of acetonitrile cannot be ruledout. However, the surprising fact here is related to the superior activity of a heterogeneous layeredCu matrix, which allowed high substrate conversion and product selectivity in the reaction model.In detriment, common copper salts, such as the basic copper carbonate (malachite), were ineffectiveunder the same conditions, indicating that the chemical environmental around copper is decisive to thereaction outcome even in the presence of palladium. This fact could be reinforced when testing Mg/AlLDH in the presence of CuSO4 and Na2PdCl4 that resulted in an inferior product yield compared tothe same catalytic conditions by using the Cu/Al matrix.
288
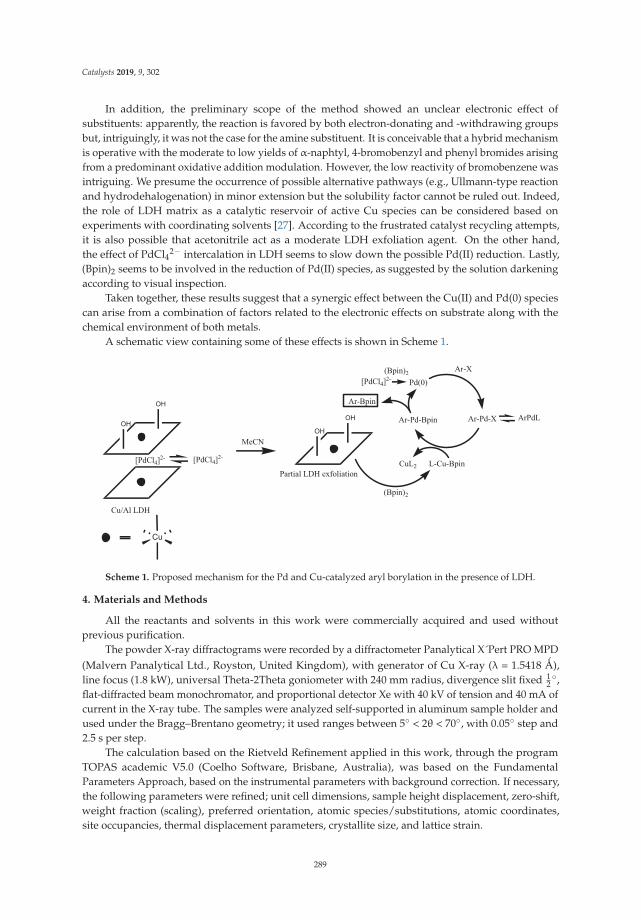
Catalysts 2019, 9, 302
In addition, the preliminary scope of the method showed an unclear electronic effect ofsubstituents: apparently, the reaction is favored by both electron-donating and -withdrawing groupsbut, intriguingly, it was not the case for the amine substituent. It is conceivable that a hybrid mechanismis operative with the moderate to low yields of α-naphtyl, 4-bromobenzyl and phenyl bromides arisingfrom a predominant oxidative addition modulation. However, the low reactivity of bromobenzene wasintriguing. We presume the occurrence of possible alternative pathways (e.g., Ullmann-type reactionand hydrodehalogenation) in minor extension but the solubility factor cannot be ruled out. Indeed,the role of LDH matrix as a catalytic reservoir of active Cu species can be considered based onexperiments with coordinating solvents [27]. According to the frustrated catalyst recycling attempts,it is also possible that acetonitrile act as a moderate LDH exfoliation agent. On the other hand,the effect of PdCl42− intercalation in LDH seems to slow down the possible Pd(II) reduction. Lastly,(Bpin)2 seems to be involved in the reduction of Pd(II) species, as suggested by the solution darkeningaccording to visual inspection.
Taken together, these results suggest that a synergic effect between the Cu(II) and Pd(0) speciescan arise from a combination of factors related to the electronic effects on substrate along with thechemical environment of both metals.
A schematic view containing some of these effects is shown in Scheme 1.
Scheme 1. Proposed mechanism for the Pd and Cu-catalyzed aryl borylation in the presence of LDH.
4. Materials and Methods
All the reactants and solvents in this work were commercially acquired and used withoutprevious purification.
The powder X-ray diffractograms were recorded by a diffractometer Panalytical X´Pert PRO MPD(Malvern Panalytical Ltd., Royston, United Kingdom), with generator of Cu X-ray (λ = 1.5418 Ǻ),line focus (1.8 kW), universal Theta-2Theta goniometer with 240 mm radius, divergence slit fixed 1
2◦,
flat-diffracted beam monochromator, and proportional detector Xe with 40 kV of tension and 40 mA ofcurrent in the X-ray tube. The samples were analyzed self-supported in aluminum sample holder andused under the Bragg–Brentano geometry; it used ranges between 5◦ < 2θ < 70◦, with 0.05◦ step and2.5 s per step.
The calculation based on the Rietveld Refinement applied in this work, through the programTOPAS academic V5.0 (Coelho Software, Brisbane, Australia), was based on the FundamentalParameters Approach, based on the instrumental parameters with background correction. If necessary,the following parameters were refined; unit cell dimensions, sample height displacement, zero-shift,weight fraction (scaling), preferred orientation, atomic species/substitutions, atomic coordinates,site occupancies, thermal displacement parameters, crystallite size, and lattice strain.
289
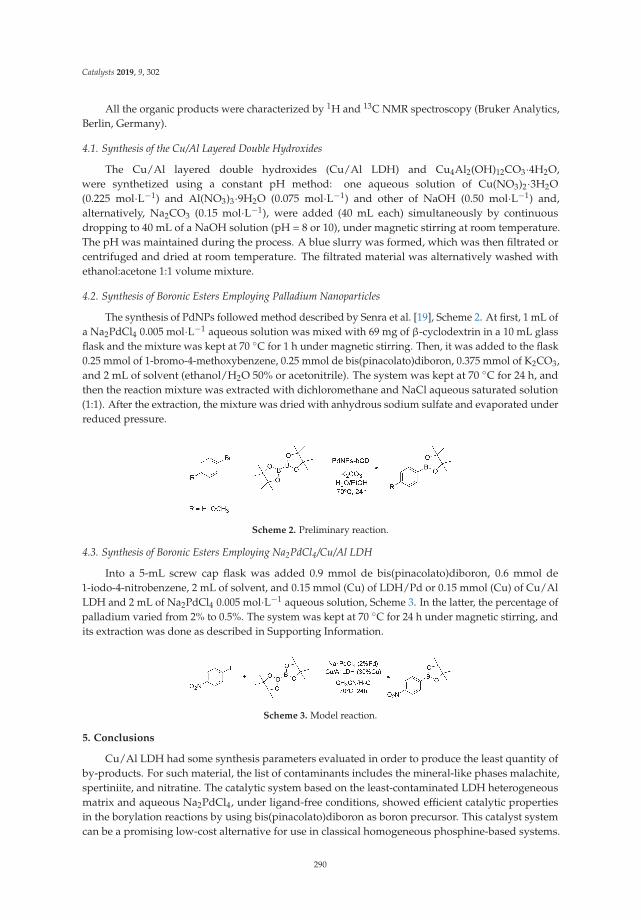
Catalysts 2019, 9, 302
All the organic products were characterized by 1H and 13C NMR spectroscopy (Bruker Analytics,Berlin, Germany).
4.1. Synthesis of the Cu/Al Layered Double Hydroxides
The Cu/Al layered double hydroxides (Cu/Al LDH) and Cu4Al2(OH)12CO3·4H2O,were synthetized using a constant pH method: one aqueous solution of Cu(NO3)2·3H2O(0.225 mol·L−1) and Al(NO3)3·9H2O (0.075 mol·L−1) and other of NaOH (0.50 mol·L−1) and,alternatively, Na2CO3 (0.15 mol·L−1), were added (40 mL each) simultaneously by continuousdropping to 40 mL of a NaOH solution (pH = 8 or 10), under magnetic stirring at room temperature.The pH was maintained during the process. A blue slurry was formed, which was then filtrated orcentrifuged and dried at room temperature. The filtrated material was alternatively washed withethanol:acetone 1:1 volume mixture.
4.2. Synthesis of Boronic Esters Employing Palladium Nanoparticles
The synthesis of PdNPs followed method described by Senra et al. [19], Scheme 2. At first, 1 mL ofa Na2PdCl4 0.005 mol·L−1 aqueous solution was mixed with 69 mg of β-cyclodextrin in a 10 mL glassflask and the mixture was kept at 70 ◦C for 1 h under magnetic stirring. Then, it was added to the flask0.25 mmol of 1-bromo-4-methoxybenzene, 0.25 mmol de bis(pinacolato)diboron, 0.375 mmol of K2CO3,and 2 mL of solvent (ethanol/H2O 50% or acetonitrile). The system was kept at 70 ◦C for 24 h, andthen the reaction mixture was extracted with dichloromethane and NaCl aqueous saturated solution(1:1). After the extraction, the mixture was dried with anhydrous sodium sulfate and evaporated underreduced pressure.
Scheme 2. Preliminary reaction.
4.3. Synthesis of Boronic Esters Employing Na2PdCl4/Cu/Al LDH
Into a 5-mL screw cap flask was added 0.9 mmol de bis(pinacolato)diboron, 0.6 mmol de1-iodo-4-nitrobenzene, 2 mL of solvent, and 0.15 mmol (Cu) of LDH/Pd or 0.15 mmol (Cu) of Cu/AlLDH and 2 mL of Na2PdCl4 0.005 mol·L−1 aqueous solution, Scheme 3. In the latter, the percentage ofpalladium varied from 2% to 0.5%. The system was kept at 70 ◦C for 24 h under magnetic stirring, andits extraction was done as described in Supporting Information.
Scheme 3. Model reaction.
5. Conclusions
Cu/Al LDH had some synthesis parameters evaluated in order to produce the least quantity ofby-products. For such material, the list of contaminants includes the mineral-like phases malachite,spertiniite, and nitratine. The catalytic system based on the least-contaminated LDH heterogeneousmatrix and aqueous Na2PdCl4, under ligand-free conditions, showed efficient catalytic propertiesin the borylation reactions by using bis(pinacolato)diboron as boron precursor. This catalyst systemcan be a promising low-cost alternative for use in classical homogeneous phosphine-based systems.
290
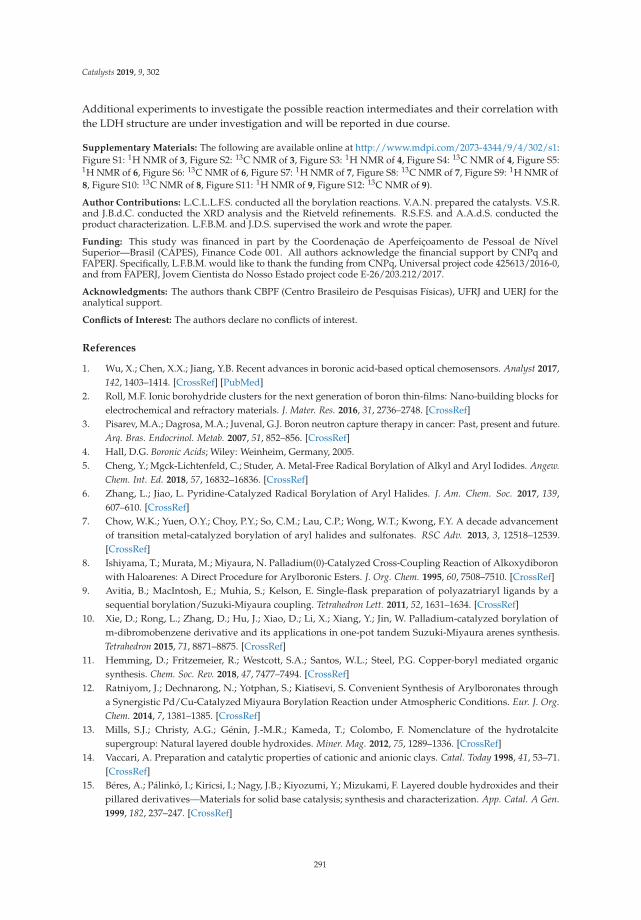
Catalysts 2019, 9, 302
Additional experiments to investigate the possible reaction intermediates and their correlation withthe LDH structure are under investigation and will be reported in due course.
Supplementary Materials: The following are available online at http://www.mdpi.com/2073-4344/9/4/302/s1:Figure S1: 1H NMR of 3, Figure S2: 13C NMR of 3, Figure S3: 1H NMR of 4, Figure S4: 13C NMR of 4, Figure S5:1H NMR of 6, Figure S6: 13C NMR of 6, Figure S7: 1H NMR of 7, Figure S8: 13C NMR of 7, Figure S9: 1H NMR of8, Figure S10: 13C NMR of 8, Figure S11: 1H NMR of 9, Figure S12: 13C NMR of 9).
Author Contributions: L.C.L.L.F.S. conducted all the borylation reactions. V.A.N. prepared the catalysts. V.S.R.and J.B.d.C. conducted the XRD analysis and the Rietveld refinements. R.S.F.S. and A.A.d.S. conducted theproduct characterization. L.F.B.M. and J.D.S. supervised the work and wrote the paper.
Funding: This study was financed in part by the Coordenação de Aperfeiçoamento de Pessoal de NívelSuperior—Brasil (CAPES), Finance Code 001. All authors acknowledge the financial support by CNPq andFAPERJ. Specifically, L.F.B.M. would like to thank the funding from CNPq, Universal project code 425613/2016-0,and from FAPERJ, Jovem Cientista do Nosso Estado project code E-26/203.212/2017.
Acknowledgments: The authors thank CBPF (Centro Brasileiro de Pesquisas Físicas), UFRJ and UERJ for theanalytical support.
Conflicts of Interest: The authors declare no conflicts of interest.
References
1. Wu, X.; Chen, X.X.; Jiang, Y.B. Recent advances in boronic acid-based optical chemosensors. Analyst 2017,142, 1403–1414. [CrossRef] [PubMed]
2. Roll, M.F. Ionic borohydride clusters for the next generation of boron thin-films: Nano-building blocks forelectrochemical and refractory materials. J. Mater. Res. 2016, 31, 2736–2748. [CrossRef]
3. Pisarev, M.A.; Dagrosa, M.A.; Juvenal, G.J. Boron neutron capture therapy in cancer: Past, present and future.Arq. Bras. Endocrinol. Metab. 2007, 51, 852–856. [CrossRef]
4. Hall, D.G. Boronic Acids; Wiley: Weinheim, Germany, 2005.5. Cheng, Y.; Mgck-Lichtenfeld, C.; Studer, A. Metal-Free Radical Borylation of Alkyl and Aryl Iodides. Angew.
Chem. Int. Ed. 2018, 57, 16832–16836. [CrossRef]6. Zhang, L.; Jiao, L. Pyridine-Catalyzed Radical Borylation of Aryl Halides. J. Am. Chem. Soc. 2017, 139,
607–610. [CrossRef]7. Chow, W.K.; Yuen, O.Y.; Choy, P.Y.; So, C.M.; Lau, C.P.; Wong, W.T.; Kwong, F.Y. A decade advancement
of transition metal-catalyzed borylation of aryl halides and sulfonates. RSC Adv. 2013, 3, 12518–12539.[CrossRef]
8. Ishiyama, T.; Murata, M.; Miyaura, N. Palladium(0)-Catalyzed Cross-Coupling Reaction of Alkoxydiboronwith Haloarenes: A Direct Procedure for Arylboronic Esters. J. Org. Chem. 1995, 60, 7508–7510. [CrossRef]
9. Avitia, B.; MacIntosh, E.; Muhia, S.; Kelson, E. Single-flask preparation of polyazatriaryl ligands by asequential borylation/Suzuki-Miyaura coupling. Tetrahedron Lett. 2011, 52, 1631–1634. [CrossRef]
10. Xie, D.; Rong, L.; Zhang, D.; Hu, J.; Xiao, D.; Li, X.; Xiang, Y.; Jin, W. Palladium-catalyzed borylation ofm-dibromobenzene derivative and its applications in one-pot tandem Suzuki-Miyaura arenes synthesis.Tetrahedron 2015, 71, 8871–8875. [CrossRef]
11. Hemming, D.; Fritzemeier, R.; Westcott, S.A.; Santos, W.L.; Steel, P.G. Copper-boryl mediated organicsynthesis. Chem. Soc. Rev. 2018, 47, 7477–7494. [CrossRef]
12. Ratniyom, J.; Dechnarong, N.; Yotphan, S.; Kiatisevi, S. Convenient Synthesis of Arylboronates througha Synergistic Pd/Cu-Catalyzed Miyaura Borylation Reaction under Atmospheric Conditions. Eur. J. Org.Chem. 2014, 7, 1381–1385. [CrossRef]
13. Mills, S.J.; Christy, A.G.; Génin, J.-M.R.; Kameda, T.; Colombo, F. Nomenclature of the hydrotalcitesupergroup: Natural layered double hydroxides. Miner. Mag. 2012, 75, 1289–1336. [CrossRef]
14. Vaccari, A. Preparation and catalytic properties of cationic and anionic clays. Catal. Today 1998, 41, 53–71.[CrossRef]
15. Béres, A.; Pálinkó, I.; Kiricsi, I.; Nagy, J.B.; Kiyozumi, Y.; Mizukami, F. Layered double hydroxides and theirpillared derivatives—Materials for solid base catalysis; synthesis and characterization. App. Catal. A Gen.1999, 182, 237–247. [CrossRef]
291
Catalysts 2019, 9, 302
16. Silva, A.C.; Senra, J.D.; de Souza, A.L.F.; Malta, L.F.B. A Ternary Catalytic System for the Room TemperatureSuzuki-Miyaura Reaction in Water. Sci. World J. 2013. [CrossRef]
17. Sreedhar, B.; Arundhathi, R.; Reddy, P.L.; Reddy, M.A.; Kantam, M.L. Cu-Al Hydrotalcite: An efficient andreusable ligant-free catalyst for the coupling of aryl chlorides with aliphatic, aromatic, and N(H)-heterocyclicamines. Synthesis 2009, 15, 2517–2522. [CrossRef]
18. Neves, V.A.; Costa, M.V.; Senra, J.D.; Aguiar, L.C.S.; Malta, L.F.B. Thermal behavior of LDH 2CuAl.CO3 and2CuAl.CO3/Pd. J. Therm. Anal. Calorim. 2017, 130, 689–694. [CrossRef]
19. Senra, J.D.; Malta, L.F.B.; Michel, R.C.; Cordeiro, Y.; Simão, R.A.; Simas, A.B.C.; Aguiar, L.C.S. Hydrophiliccyclodextrin protected Pd nanoclusters: Insights into their size control and host–guest behavior. J. Mater.Chem. 2011, 21, 13516–13523. [CrossRef]
20. Segal, S.R.; Carrado, K.A.; Marshall, C.L.; Anderson, K.B. Catalytic decomposition of alcohols, includingethanol, for in situ H2 generation in a fuel stream using a layered double hydroxide-derived catalyst. Appl.Catal. A Gen. 2003, 248, 33–45. [CrossRef]
21. Manivannan, R.; Pandurangan, A. Formation of ethyl benzene and styrene by side chain methylation oftoluene over calcined LDHs. Appl. Clay Sci. 2009, 44, 137–143. [CrossRef]
22. Lwin, Y.; Yarmo, M.A.; Yaakob, Z.; Mohamad, A.B.; Daud, W.R.W. Synthesis and characterization of Cu/Allayered double hydroxides. Mater. Res. Bull. 2001, 36, 193–198. [CrossRef]
23. Muñoz, V.; Zotin, F.M.Z.; Palacio, L.A. Copper-aluminum hydrotalcite type precursors for NOx abatement.Catal. Today 2015, 250, 173–179. [CrossRef]
24. Gao, P.; Xie, R.; Wang, H.; Zhong, L.; Xia, L.; Zhang, Z.; Wei, W.; Sun, Y. Cu/Zn/Al/Zr catalyst viaphase-pure hydrotalcite-like compounds for methanol synthesis from carbon dioxide. J. CO2 Util. 2015, 11,41–48. [CrossRef]
25. Ichikawa, S.; Miyazoe, S.; Matsuoka, O. A highly efficient Cu/Al(OH)3 catalyst for the hydration ofacrylonitrile to acrylamide. Chem. Lett. 2011, 40, 512–514. [CrossRef]
26. Qu, J.; He, X.; Chen, M.; Hu, H.; Zhang, Q.; Liu, X. Mechanochemical synthesis of Cu/Al and methyl orangeintercalated Cu/Al layered double hydroxides. Mater. Chem. Phys. 2017, 191, 173–180. [CrossRef]
27. Neves, V.A. Nanostructured Materials Based on Cu/Al Layered Double Hydroxides, Pd and Cyclodextrinas Catalysts for Cross-Coupling Reactions. Master’s Thesis, Federal University of Rio de Janeiro, Rio deJaneiro, Brazil, 2018.
© 2019 by the authors. Licensee MDPI, Basel, Switzerland. This article is an open accessarticle distributed under the terms and conditions of the Creative Commons Attribution(CC BY) license (http://creativecommons.org/licenses/by/4.0/).
292
catalysts
Article
Aldol Condensation of Furfural with Acetone OverMg/Al Mixed Oxides. Influence of Water andSynthesis Method
Almudena Parejas, Daniel Cosano, Jesús Hidalgo-Carrillo *, José Rafael Ruiz, Alberto Marinas ,
César Jiménez-Sanchidrián and Francisco J. Urbano
Departamento de Química Orgánica, Instituto Universitario de Investigación en Química Fina y NanoquímicaIUIQFN, Universidad de Córdoba, Campus de Rabanales, Edificio Marie Curie, E-14071 Córdoba, Spain;[email protected] (A.P.); [email protected] (D.C.); [email protected] (J.R.R.); [email protected] (A.M.);[email protected] (C.J.-S.); [email protected] (F.J.U.)* Correspondence: [email protected]; Tel.:+34-957-218-638
Received: 23 January 2019; Accepted: 20 February 2019; Published: 23 February 2019
Abstract: Aldol condensation of furfural and acetone (an important initial step to obtain diesel frombiomass) was studied over MgAl mixed oxides. The influence of the utilization of microwaves and/ora surfactant (Pluronic 123) during the synthesis as well as the use of water (either pre-hydrating thesolids before catalytic studies or in water/toluene mixtures as the reaction medium) is discussed.The combined use of Pluronic 123 and microwaves led to solids with bigger pore sizes, exhibitinglower basicity and higher acidity than the conventional synthetic method, thus resulting in an increasein the yield of the desired product of condensation, comprising two molecules of furfural and oneof acetone (F2Ac). As for the influence of water, re-hydration of the mixed oxides was detrimentalto activity, probably as a result of the partial blocking (solvation) of active sites. On the contrary,the increase in water percentage in the reaction medium resulted in higher conversions, thoughselectivity to F2Ac decreased. The weakening of the C=O bond of furfural in the presence of water aswell as the higher solubility of the first condensation product (FAc) in toluene, as compared to water,could account for that. A 44.5% yield of F2Ac (66% conversion) after 16 h was obtained with the mostactive solid, which maintained the activity for three consecutive reactions.
Keywords: aldol condensation; biomass valorization; Mg/Al mixed oxides; surfactant; microwaves;influence of water
1. Introduction
Fossil fuel depletion and environmental concern have boosted the search for renewable energies,one of the possible sources being biomass [1,2]. Furfural is a so-called platform molecule from biomassobtained through xylose dehydration [3,4] and can be transformed into a wide range of chemicals viahydrogenation, oxidation, decarbonylation, nitration, or condensation processes, just to cite some ofthem [5]. For instance, aldol condensation and subsequent hydrogenation and hydrodeoxygenationcan lead to liquid hydrocarbons for use as diesel [6–8].
Aldol condensation is a well-known C–C bond formation process which can occur in acidic orbasic sites, the latter being more frequently reported in the literature [6–15]. It requires the existenceof a reactive hydrogen in alpha position, with respect to a carbonyl compound able to form anenol, which reacts with another carbonyl compound, and after dehydration, yields a conjugatedenone. Focusing on aldol condensation between furfural and acetone (Figure 1), it can initially lead to4-(2-furanyl)-3-buten-2-one (FAc), a subsequent aldol condensation with another furfural molecule,forming 1,5-bis-(2-furanyl)-1,4-pentadien-3-one (F2Ac) (Figure 1a) [16,17]. Some side reactions include
Catalysts 2019, 9, 203; doi:10.3390/catal9020203 www.mdpi.com/journal/catalysts293
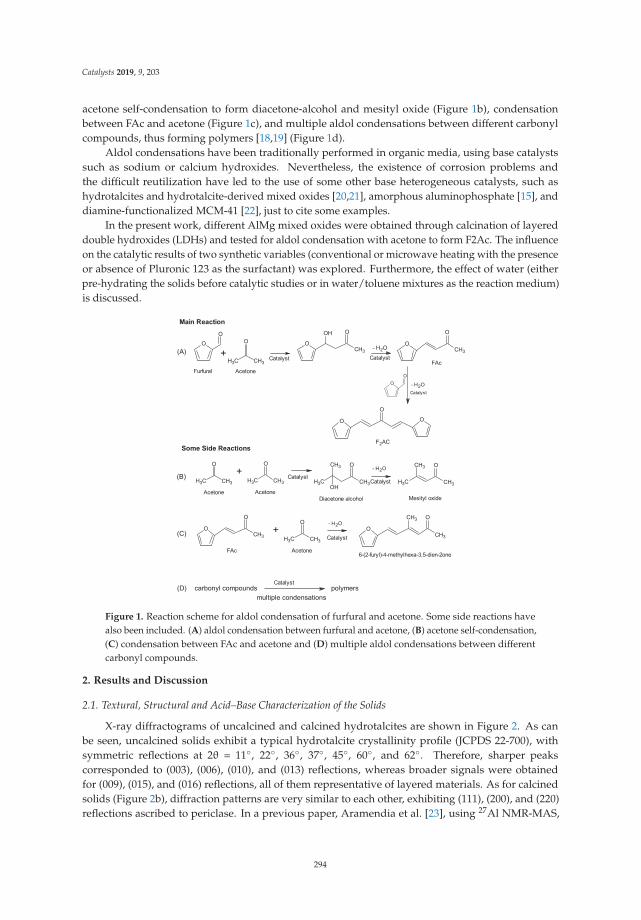
Catalysts 2019, 9, 203
acetone self-condensation to form diacetone-alcohol and mesityl oxide (Figure 1b), condensationbetween FAc and acetone (Figure 1c), and multiple aldol condensations between different carbonylcompounds, thus forming polymers [18,19] (Figure 1d).
Aldol condensations have been traditionally performed in organic media, using base catalystssuch as sodium or calcium hydroxides. Nevertheless, the existence of corrosion problems andthe difficult reutilization have led to the use of some other base heterogeneous catalysts, such ashydrotalcites and hydrotalcite-derived mixed oxides [20,21], amorphous aluminophosphate [15], anddiamine-functionalized MCM-41 [22], just to cite some examples.
In the present work, different AlMg mixed oxides were obtained through calcination of layereddouble hydroxides (LDHs) and tested for aldol condensation with acetone to form F2Ac. The influenceon the catalytic results of two synthetic variables (conventional or microwave heating with the presenceor absence of Pluronic 123 as the surfactant) was explored. Furthermore, the effect of water (eitherpre-hydrating the solids before catalytic studies or in water/toluene mixtures as the reaction medium)is discussed.
Figure 1. Reaction scheme for aldol condensation of furfural and acetone. Some side reactions havealso been included. (A) aldol condensation between furfural and acetone, (B) acetone self-condensation,(C) condensation between FAc and acetone and (D) multiple aldol condensations between differentcarbonyl compounds.
2. Results and Discussion
2.1. Textural, Structural and Acid–Base Characterization of the Solids
X-ray diffractograms of uncalcined and calcined hydrotalcites are shown in Figure 2. As canbe seen, uncalcined solids exhibit a typical hydrotalcite crystallinity profile (JCPDS 22-700), withsymmetric reflections at 2θ = 11◦, 22◦, 36◦, 37◦, 45◦, 60◦, and 62◦. Therefore, sharper peakscorresponded to (003), (006), (010), and (013) reflections, whereas broader signals were obtainedfor (009), (015), and (016) reflections, all of them representative of layered materials. As for calcinedsolids (Figure 2b), diffraction patterns are very similar to each other, exhibiting (111), (200), and (220)reflections ascribed to periclase. In a previous paper, Aramendia et al. [23], using 27Al NMR-MAS,
294

Catalysts 2019, 9, 203
demonstrated that the coordination of Al3+ changed from octahedral to tetrahedral upon calcination ofhydrotalcites, Al3+ ions thus isomorphically substituting Mg2+ ions, forming MgAlOx periclase.
(a) (b)θ θ
Figure 2. X-ray diffractograms of the different solids synthesized in the present work. (a) Uncalcinedsolids. (b) Solids calcined at 450 ◦C.
Thermal stability of hydrotalcites was determined by TG-DTA (Figure 3). In all cases, weight losspercentage is in the 42–45% range (Figure 3a). HTCON and HTMW thermogravimetric profiles areconsistent with those reported in the literature for hydrotalcites [24,25]. Therefore, two main weightlosses are observed. The first one at 100–200 ◦C is ascribed to the loss of intercalated water molecules,whereas nitrate coming from both the precursor and hydroxyl groups can account for the second lossat higher temperatures (250–500 ◦C). For the solids synthesized using the surfactant (HTCONP andHTMWP), the second weight loss seems to be produced quicker (i.e., at lower temperatures), thussuggesting that for those systems, re-structuration to form periclase is somehow favored by Pluronic123. Heat flow profiles (Figure 3b) seem to confirm this hypothesis, the exothermal peak centeredat 450 ◦C in HTCON and HTMW being shifted to lower temperatures (300–350 ◦C) for HTCONPand HTMWP.
(a) (b)
Figure 3. TG analyses (a) and heat flow (b) of hydrotalcites.
Raman spectra of uncalcined solids (i.e., hydrotalcites) are represented in Figure 4. The bandappearing at 557 cm−1 can be assigned to vibrations of brucite-like octahedral layers, Al-O-Mg,which are present in all Mg-Al hydrotalcites [26]. Moreover, the spectra also exhibit bands at 710and 1055 cm−1, corresponding to nitrate vibrations [27] and bands at ca. 3500 cm−1, due to surfacehydroxyl groups. In the case of HTCONP and HTMWP solids, there are also some intense bands ofC-H stretching Pluronic 123 at 2986, 2941, and 2933 cm−1 [28].
295
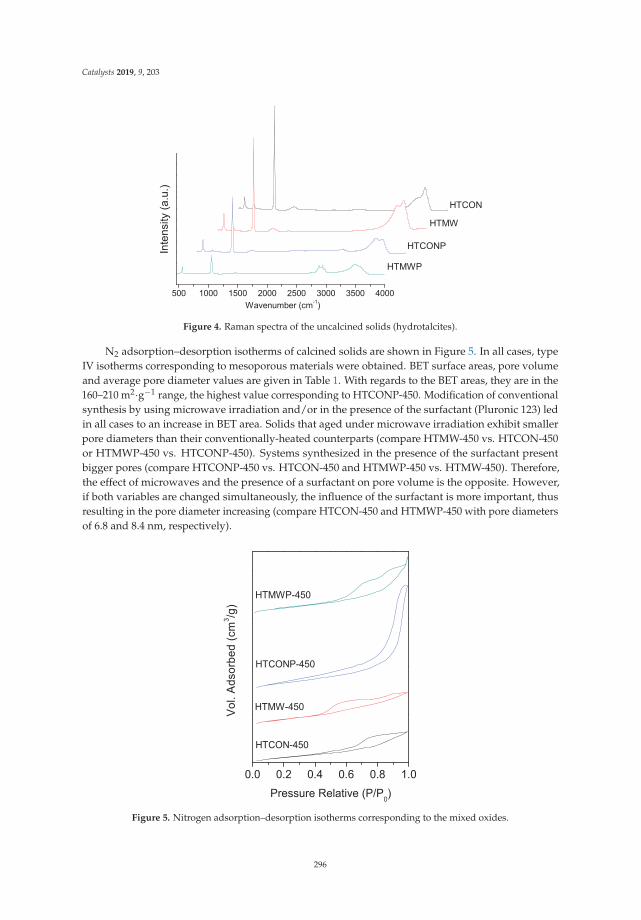
Catalysts 2019, 9, 203
Figure 4. Raman spectra of the uncalcined solids (hydrotalcites).
N2 adsorption–desorption isotherms of calcined solids are shown in Figure 5. In all cases, typeIV isotherms corresponding to mesoporous materials were obtained. BET surface areas, pore volumeand average pore diameter values are given in Table 1. With regards to the BET areas, they are in the160–210 m2·g−1 range, the highest value corresponding to HTCONP-450. Modification of conventionalsynthesis by using microwave irradiation and/or in the presence of the surfactant (Pluronic 123) ledin all cases to an increase in BET area. Solids that aged under microwave irradiation exhibit smallerpore diameters than their conventionally-heated counterparts (compare HTMW-450 vs. HTCON-450or HTMWP-450 vs. HTCONP-450). Systems synthesized in the presence of the surfactant presentbigger pores (compare HTCONP-450 vs. HTCON-450 and HTMWP-450 vs. HTMW-450). Therefore,the effect of microwaves and the presence of a surfactant on pore volume is the opposite. However,if both variables are changed simultaneously, the influence of the surfactant is more important, thusresulting in the pore diameter increasing (compare HTCON-450 and HTMWP-450 with pore diametersof 6.8 and 8.4 nm, respectively).
Figure 5. Nitrogen adsorption–desorption isotherms corresponding to the mixed oxides.
296
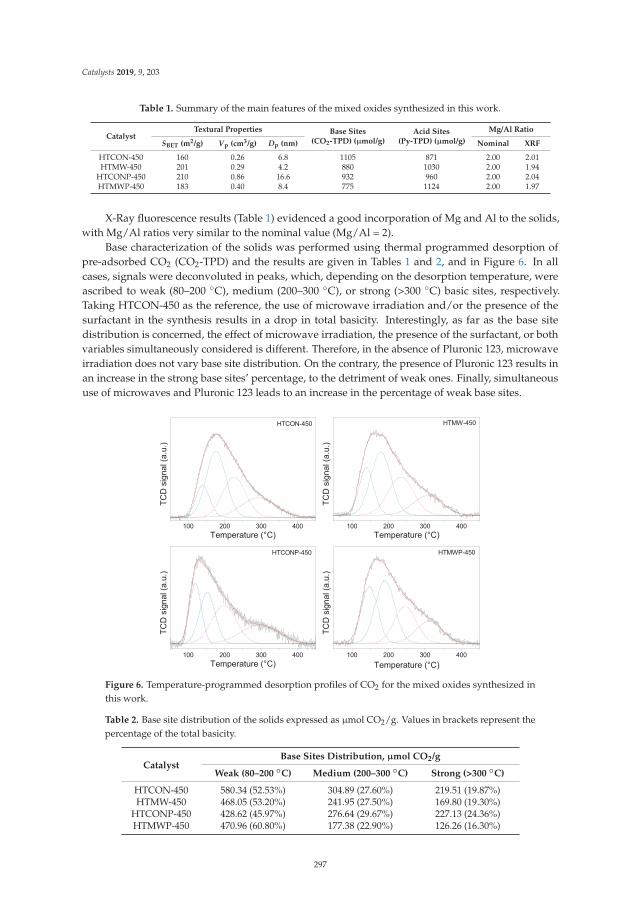
Catalysts 2019, 9, 203
Table 1. Summary of the main features of the mixed oxides synthesized in this work.
CatalystTextural Properties Base Sites
(CO2-TPD) (μmol/g)Acid Sites
(Py-TPD) (μmol/g)
Mg/Al Ratio
SBET (m2/g) Vp (cm3/g) Dp (nm) Nominal XRF
HTCON-450 160 0.26 6.8 1105 871 2.00 2.01HTMW-450 201 0.29 4.2 880 1030 2.00 1.94
HTCONP-450 210 0.86 16.6 932 960 2.00 2.04HTMWP-450 183 0.40 8.4 775 1124 2.00 1.97
X-Ray fluorescence results (Table 1) evidenced a good incorporation of Mg and Al to the solids,with Mg/Al ratios very similar to the nominal value (Mg/Al = 2).
Base characterization of the solids was performed using thermal programmed desorption ofpre-adsorbed CO2 (CO2-TPD) and the results are given in Tables 1 and 2, and in Figure 6. In allcases, signals were deconvoluted in peaks, which, depending on the desorption temperature, wereascribed to weak (80–200 ◦C), medium (200–300 ◦C), or strong (>300 ◦C) basic sites, respectively.Taking HTCON-450 as the reference, the use of microwave irradiation and/or the presence of thesurfactant in the synthesis results in a drop in total basicity. Interestingly, as far as the base sitedistribution is concerned, the effect of microwave irradiation, the presence of the surfactant, or bothvariables simultaneously considered is different. Therefore, in the absence of Pluronic 123, microwaveirradiation does not vary base site distribution. On the contrary, the presence of Pluronic 123 results inan increase in the strong base sites’ percentage, to the detriment of weak ones. Finally, simultaneoususe of microwaves and Pluronic 123 leads to an increase in the percentage of weak base sites.
Figure 6. Temperature-programmed desorption profiles of CO2 for the mixed oxides synthesized inthis work.
Table 2. Base site distribution of the solids expressed as μmol CO2/g. Values in brackets represent thepercentage of the total basicity.
CatalystBase Sites Distribution, μmol CO2/g
Weak (80–200 ◦C) Medium (200–300 ◦C) Strong (>300 ◦C)
HTCON-450 580.34 (52.53%) 304.89 (27.60%) 219.51 (19.87%)HTMW-450 468.05 (53.20%) 241.95 (27.50%) 169.80 (19.30%)
HTCONP-450 428.62 (45.97%) 276.64 (29.67%) 227.13 (24.36%)HTMWP-450 470.96 (60.80%) 177.38 (22.90%) 126.26 (16.30%)
297

Catalysts 2019, 9, 203
Acid characterization of the solids was performed by thermal programmed desorptionof pre-adsorbed pyridine (Py-TPD), results being given in Tables 1 and 3, and in Figure 7.Taking HTCON-450 as the reference, contrary to basicity, total acidity increases when the solidsare synthesized utilizing a microwave and/or in the presence of Pluronic 123. Furthermore, withregards to acid site distribution, only microwave irradiation has some effect (acid strength decreases),whereas the presence of Pluronic 123, either under conventional heating or microwave irradiation,does not vary acid site distribution.
Figure 7. Temperature-programmed desorption profiles of pyridine for the solids synthesized inthis work.
Table 3. Acid site distribution of the solids expressed as μmol Py/g. Values in brackets represent thepercentage of the total basicity.
CatalystAcid Site Distribution, μmol Py/g
Weak (80–200 ◦C) Medium (200–300 ◦C) Strong (>300 ◦C)
HTCON-450 296.36 (34.01%) 320.14 (36.74%) 254.88 (29.25%)HTMW-450 447.56 (43.44%) 329.59 (31.99%) 253.14 (24.57%)
HTCONP-450 320.58 (33.39%) 365.71 (38.09%) 273.82 (28.52%)HTMWP-450 397.24 (35.33%) 398.70 (35.46%) 328.43 (29.21%)
All in all, microwave irradiation and/or the use of Pluronic 123 as the surfactant result in anincrease in total acidity and a decrease in total basicity together with an increase in BET areas.
2.2. Catalytic Activity
The solid synthesized under conventional heating and in the absence of the surfactant(HTCON-450) was used as the reference material in order to study the influence of reaction temperatureand the presence of water in the reaction medium on catalytic activity.
298
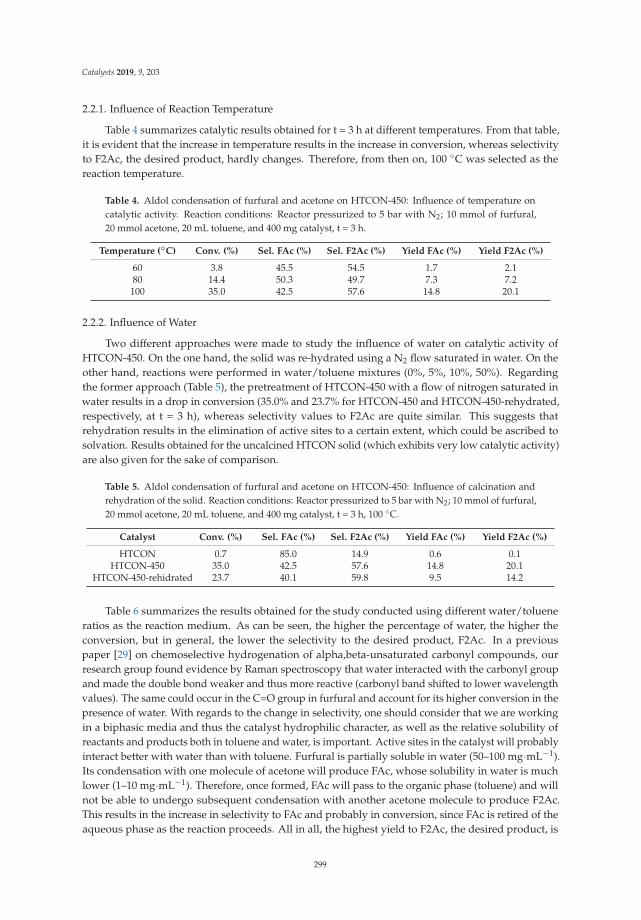
Catalysts 2019, 9, 203
2.2.1. Influence of Reaction Temperature
Table 4 summarizes catalytic results obtained for t = 3 h at different temperatures. From that table,it is evident that the increase in temperature results in the increase in conversion, whereas selectivityto F2Ac, the desired product, hardly changes. Therefore, from then on, 100 ◦C was selected as thereaction temperature.
Table 4. Aldol condensation of furfural and acetone on HTCON-450: Influence of temperature oncatalytic activity. Reaction conditions: Reactor pressurized to 5 bar with N2; 10 mmol of furfural,20 mmol acetone, 20 mL toluene, and 400 mg catalyst, t = 3 h.
Temperature (◦C) Conv. (%) Sel. FAc (%) Sel. F2Ac (%) Yield FAc (%) Yield F2Ac (%)
60 3.8 45.5 54.5 1.7 2.180 14.4 50.3 49.7 7.3 7.2100 35.0 42.5 57.6 14.8 20.1
2.2.2. Influence of Water
Two different approaches were made to study the influence of water on catalytic activity ofHTCON-450. On the one hand, the solid was re-hydrated using a N2 flow saturated in water. On theother hand, reactions were performed in water/toluene mixtures (0%, 5%, 10%, 50%). Regardingthe former approach (Table 5), the pretreatment of HTCON-450 with a flow of nitrogen saturated inwater results in a drop in conversion (35.0% and 23.7% for HTCON-450 and HTCON-450-rehydrated,respectively, at t = 3 h), whereas selectivity values to F2Ac are quite similar. This suggests thatrehydration results in the elimination of active sites to a certain extent, which could be ascribed tosolvation. Results obtained for the uncalcined HTCON solid (which exhibits very low catalytic activity)are also given for the sake of comparison.
Table 5. Aldol condensation of furfural and acetone on HTCON-450: Influence of calcination andrehydration of the solid. Reaction conditions: Reactor pressurized to 5 bar with N2; 10 mmol of furfural,20 mmol acetone, 20 mL toluene, and 400 mg catalyst, t = 3 h, 100 ◦C.
Catalyst Conv. (%) Sel. FAc (%) Sel. F2Ac (%) Yield FAc (%) Yield F2Ac (%)
HTCON 0.7 85.0 14.9 0.6 0.1HTCON-450 35.0 42.5 57.6 14.8 20.1
HTCON-450-rehidrated 23.7 40.1 59.8 9.5 14.2
Table 6 summarizes the results obtained for the study conducted using different water/tolueneratios as the reaction medium. As can be seen, the higher the percentage of water, the higher theconversion, but in general, the lower the selectivity to the desired product, F2Ac. In a previouspaper [29] on chemoselective hydrogenation of alpha,beta-unsaturated carbonyl compounds, ourresearch group found evidence by Raman spectroscopy that water interacted with the carbonyl groupand made the double bond weaker and thus more reactive (carbonyl band shifted to lower wavelengthvalues). The same could occur in the C=O group in furfural and account for its higher conversion in thepresence of water. With regards to the change in selectivity, one should consider that we are workingin a biphasic media and thus the catalyst hydrophilic character, as well as the relative solubility ofreactants and products both in toluene and water, is important. Active sites in the catalyst will probablyinteract better with water than with toluene. Furfural is partially soluble in water (50–100 mg·mL−1).Its condensation with one molecule of acetone will produce FAc, whose solubility in water is muchlower (1–10 mg·mL−1). Therefore, once formed, FAc will pass to the organic phase (toluene) and willnot be able to undergo subsequent condensation with another acetone molecule to produce F2Ac.This results in the increase in selectivity to FAc and probably in conversion, since FAc is retired of theaqueous phase as the reaction proceeds. All in all, the highest yield to F2Ac, the desired product, is
299

Catalysts 2019, 9, 203
achieved with pure toluene. Therefore, this reaction medium was selected for subsequent studies onother catalysts.
Table 6. Aldol condensation of furfural and acetone on HTCON-450: Influence of the presence of waterin water/toluene mixtures. Reaction conditions: Reactor pressurized to 5 bar with N2; 10 mmol offurfural, 20 mmol acetone, 20 mL (toluene + water) and 400 mg catalyst, t = 3 h, 100 ◦C.
Water (%) Conv. (%) Sel. FAc (%) Sel. F2Ac (%) Yield FAc (%) Yield F2Ac (%)
0 35.0 42.5 57.6 14.8 20.15 37.6 60.8 39.2 22.9 14.710 53.2 70.3 29.6 37.4 15.850 80.4 88.1 11.9 70.8 9.6
2.3. Catalytic Activity of the Other Mixed Oxides
Once pure toluene and 100 ◦C had been selected as the reaction conditions for aldol condensationof furfural and acetone in order to obtain F2Ac, the study was extended to the other mixed oxides.Reactions were conducted at 3 h and 16 h, the main catalytic results being summarized in Table 7.
A first conclusion from that table is that the lowest conversion values correspond to HTMW-450.It is important to note that this solid was the one exhibiting the lowest pore diameter (4.2 nm, Table 1),which could account for that. Focusing on the other solids, the highest conversion value at 3 his achieved for HTCON-450, whereas as the reaction proceeds, the rate is higher for the systemssynthesized using Pluronic 123, which together with their higher selectivity to F2Ac results in F2Acyields of 24.6%, 28.3%, and 44.5% for HTCON-450, HTCONP-450, and HTMWP-450, respectively, att = 16 h. As evidenced by thermal-programmed desorption of pyridine and CO2, the use of microwaveirradiation and/or the presence of Pluronic 123 in the reaction medium during the synthesis resultedin an increase in total acidity and a decrease in total basicity. In a previous paper, Climent et al. [15]described the cooperative effect of weak acid and base sites of an amorphous aluminophosphate inaldol condensation, thus resulting in higher selectivities than those presented by stronger acid or basecatalysts. This effect together with the increase in pore size could explain the higher yields obtainedfor the solids synthesized using the surfactant.
Table 7. Results obtained for aldol condensation of furfural and acetone on the different solids. Reactionconditions: Reactor pressurized to 5 bar with N2; 10 mmol of furfural, 20 mmol acetone, 20 mL tolueneand 400 mg catalyst, 100 ◦C.
Time (h) CatalystConv.(%)
Sel. FAc(%)
Sel. F2Ac(%)
Yield FAc(%)
Yield F2Ac(%)
3
HTCON-450 35.0 42.5 57.6 14.8 20.1HTMW-450 19.5 63.2 36.8 12.3 7.2
HTCONP-450 28.4 47.6 52.4 13.5 14.9HTMWP-450 32.9 32.9 67.1 10.8 22.1
16
HTCON-450 46.9 47.6 52.4 22.4 24.6HTMW-450 27.4 42.9 57.1 11.8 15.7
HTCONP-450 45.2 37.4 62.6 18.9 28.3HTMWP-450 66.2 32.8 67.2 21.7 44.5
2.4. Reutilization of HTCON-450 and HTMWP-450
Finally, some reutilization studies were conducted on HTCON-450 and HTMWP-450 solids,results being summarized in Table 8. In all cases, the Mg/Al ratio of the solids was quite similar tothe nominal value (Mg/Al = 2). Moreover, after the reactions, the reaction medium was analyzed byinductively coupled plasma mass spectrometry (ICP-MS). No Mg or Al was detected which is evidenceof the stability of the solids, which do not undergo leaching.
300
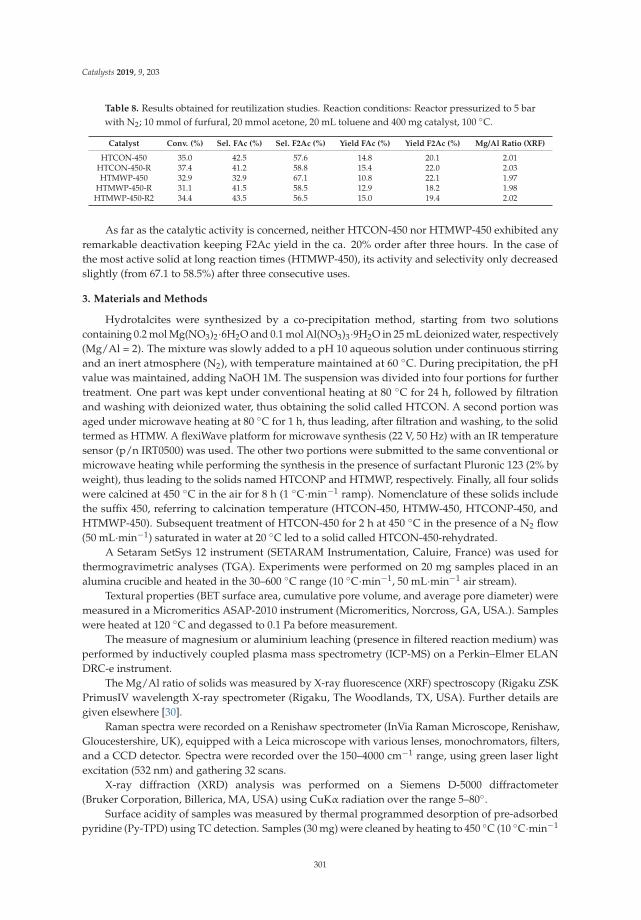
Catalysts 2019, 9, 203
Table 8. Results obtained for reutilization studies. Reaction conditions: Reactor pressurized to 5 barwith N2; 10 mmol of furfural, 20 mmol acetone, 20 mL toluene and 400 mg catalyst, 100 ◦C.
Catalyst Conv. (%) Sel. FAc (%) Sel. F2Ac (%) Yield FAc (%) Yield F2Ac (%) Mg/Al Ratio (XRF)
HTCON-450 35.0 42.5 57.6 14.8 20.1 2.01HTCON-450-R 37.4 41.2 58.8 15.4 22.0 2.03HTMWP-450 32.9 32.9 67.1 10.8 22.1 1.97
HTMWP-450-R 31.1 41.5 58.5 12.9 18.2 1.98HTMWP-450-R2 34.4 43.5 56.5 15.0 19.4 2.02
As far as the catalytic activity is concerned, neither HTCON-450 nor HTMWP-450 exhibited anyremarkable deactivation keeping F2Ac yield in the ca. 20% order after three hours. In the case ofthe most active solid at long reaction times (HTMWP-450), its activity and selectivity only decreasedslightly (from 67.1 to 58.5%) after three consecutive uses.
3. Materials and Methods
Hydrotalcites were synthesized by a co-precipitation method, starting from two solutionscontaining 0.2 mol Mg(NO3)2·6H2O and 0.1 mol Al(NO3)3·9H2O in 25 mL deionized water, respectively(Mg/Al = 2). The mixture was slowly added to a pH 10 aqueous solution under continuous stirringand an inert atmosphere (N2), with temperature maintained at 60 ◦C. During precipitation, the pHvalue was maintained, adding NaOH 1M. The suspension was divided into four portions for furthertreatment. One part was kept under conventional heating at 80 ◦C for 24 h, followed by filtrationand washing with deionized water, thus obtaining the solid called HTCON. A second portion wasaged under microwave heating at 80 ◦C for 1 h, thus leading, after filtration and washing, to the solidtermed as HTMW. A flexiWave platform for microwave synthesis (22 V, 50 Hz) with an IR temperaturesensor (p/n IRT0500) was used. The other two portions were submitted to the same conventional ormicrowave heating while performing the synthesis in the presence of surfactant Pluronic 123 (2% byweight), thus leading to the solids named HTCONP and HTMWP, respectively. Finally, all four solidswere calcined at 450 ◦C in the air for 8 h (1 ◦C·min−1 ramp). Nomenclature of these solids includethe suffix 450, referring to calcination temperature (HTCON-450, HTMW-450, HTCONP-450, andHTMWP-450). Subsequent treatment of HTCON-450 for 2 h at 450 ◦C in the presence of a N2 flow(50 mL·min−1) saturated in water at 20 ◦C led to a solid called HTCON-450-rehydrated.
A Setaram SetSys 12 instrument (SETARAM Instrumentation, Caluire, France) was used forthermogravimetric analyses (TGA). Experiments were performed on 20 mg samples placed in analumina crucible and heated in the 30–600 ◦C range (10 ◦C·min−1, 50 mL·min−1 air stream).
Textural properties (BET surface area, cumulative pore volume, and average pore diameter) weremeasured in a Micromeritics ASAP-2010 instrument (Micromeritics, Norcross, GA, USA.). Sampleswere heated at 120 ◦C and degassed to 0.1 Pa before measurement.
The measure of magnesium or aluminium leaching (presence in filtered reaction medium) wasperformed by inductively coupled plasma mass spectrometry (ICP-MS) on a Perkin–Elmer ELANDRC-e instrument.
The Mg/Al ratio of solids was measured by X-ray fluorescence (XRF) spectroscopy (Rigaku ZSKPrimusIV wavelength X-ray spectrometer (Rigaku, The Woodlands, TX, USA). Further details aregiven elsewhere [30].
Raman spectra were recorded on a Renishaw spectrometer (InVia Raman Microscope, Renishaw,Gloucestershire, UK), equipped with a Leica microscope with various lenses, monochromators, filters,and a CCD detector. Spectra were recorded over the 150–4000 cm−1 range, using green laser lightexcitation (532 nm) and gathering 32 scans.
X-ray diffraction (XRD) analysis was performed on a Siemens D-5000 diffractometer(Bruker Corporation, Billerica, MA, USA) using CuKα radiation over the range 5–80◦.
Surface acidity of samples was measured by thermal programmed desorption of pre-adsorbedpyridine (Py-TPD) using TC detection. Samples (30 mg) were cleaned by heating to 450 ◦C (10 ◦C·min−1
301
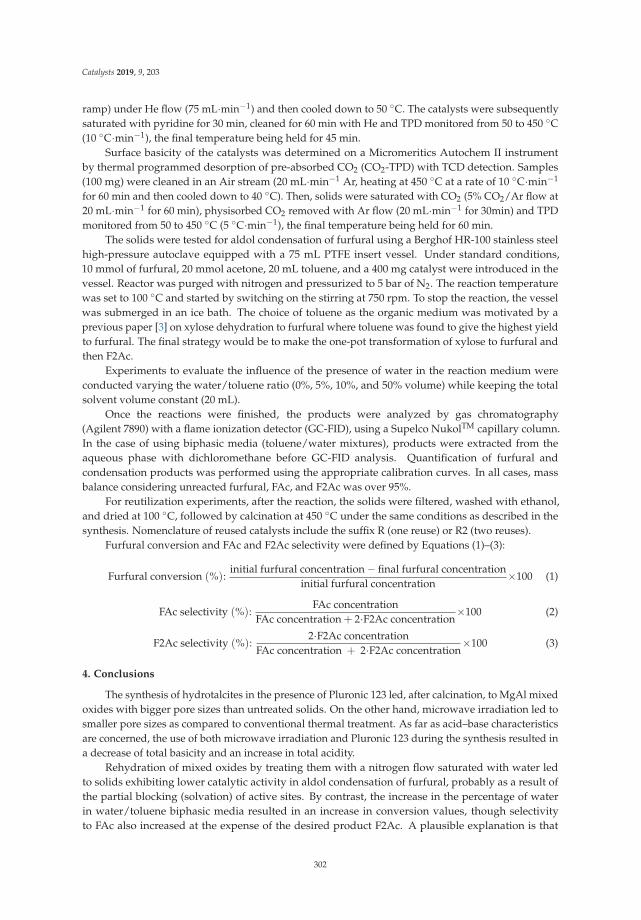
Catalysts 2019, 9, 203
ramp) under He flow (75 mL·min−1) and then cooled down to 50 ◦C. The catalysts were subsequentlysaturated with pyridine for 30 min, cleaned for 60 min with He and TPD monitored from 50 to 450 ◦C(10 ◦C·min−1), the final temperature being held for 45 min.
Surface basicity of the catalysts was determined on a Micromeritics Autochem II instrumentby thermal programmed desorption of pre-absorbed CO2 (CO2-TPD) with TCD detection. Samples(100 mg) were cleaned in an Air stream (20 mL·min−1 Ar, heating at 450 ◦C at a rate of 10 ◦C·min−1
for 60 min and then cooled down to 40 ◦C). Then, solids were saturated with CO2 (5% CO2/Ar flow at20 mL·min−1 for 60 min), physisorbed CO2 removed with Ar flow (20 mL·min−1 for 30min) and TPDmonitored from 50 to 450 ◦C (5 ◦C·min−1), the final temperature being held for 60 min.
The solids were tested for aldol condensation of furfural using a Berghof HR-100 stainless steelhigh-pressure autoclave equipped with a 75 mL PTFE insert vessel. Under standard conditions,10 mmol of furfural, 20 mmol acetone, 20 mL toluene, and a 400 mg catalyst were introduced in thevessel. Reactor was purged with nitrogen and pressurized to 5 bar of N2. The reaction temperaturewas set to 100 ◦C and started by switching on the stirring at 750 rpm. To stop the reaction, the vesselwas submerged in an ice bath. The choice of toluene as the organic medium was motivated by aprevious paper [3] on xylose dehydration to furfural where toluene was found to give the highest yieldto furfural. The final strategy would be to make the one-pot transformation of xylose to furfural andthen F2Ac.
Experiments to evaluate the influence of the presence of water in the reaction medium wereconducted varying the water/toluene ratio (0%, 5%, 10%, and 50% volume) while keeping the totalsolvent volume constant (20 mL).
Once the reactions were finished, the products were analyzed by gas chromatography(Agilent 7890) with a flame ionization detector (GC-FID), using a Supelco NukolTM capillary column.In the case of using biphasic media (toluene/water mixtures), products were extracted from theaqueous phase with dichloromethane before GC-FID analysis. Quantification of furfural andcondensation products was performed using the appropriate calibration curves. In all cases, massbalance considering unreacted furfural, FAc, and F2Ac was over 95%.
For reutilization experiments, after the reaction, the solids were filtered, washed with ethanol,and dried at 100 ◦C, followed by calcination at 450 ◦C under the same conditions as described in thesynthesis. Nomenclature of reused catalysts include the suffix R (one reuse) or R2 (two reuses).
Furfural conversion and FAc and F2Ac selectivity were defined by Equations (1)–(3):
Furfural conversion (%):initial furfural concentration − final furfural concentration
initial furfural concentration×100 (1)
FAc selectivity (%):FAc concentration
FAc concentration + 2·F2Ac concentration×100 (2)
F2Ac selectivity (%):2·F2Ac concentration
FAc concentration + 2·F2Ac concentration×100 (3)
4. Conclusions
The synthesis of hydrotalcites in the presence of Pluronic 123 led, after calcination, to MgAl mixedoxides with bigger pore sizes than untreated solids. On the other hand, microwave irradiation led tosmaller pore sizes as compared to conventional thermal treatment. As far as acid–base characteristicsare concerned, the use of both microwave irradiation and Pluronic 123 during the synthesis resulted ina decrease of total basicity and an increase in total acidity.
Rehydration of mixed oxides by treating them with a nitrogen flow saturated with water ledto solids exhibiting lower catalytic activity in aldol condensation of furfural, probably as a result ofthe partial blocking (solvation) of active sites. By contrast, the increase in the percentage of waterin water/toluene biphasic media resulted in an increase in conversion values, though selectivityto FAc also increased at the expense of the desired product F2Ac. A plausible explanation is that
302
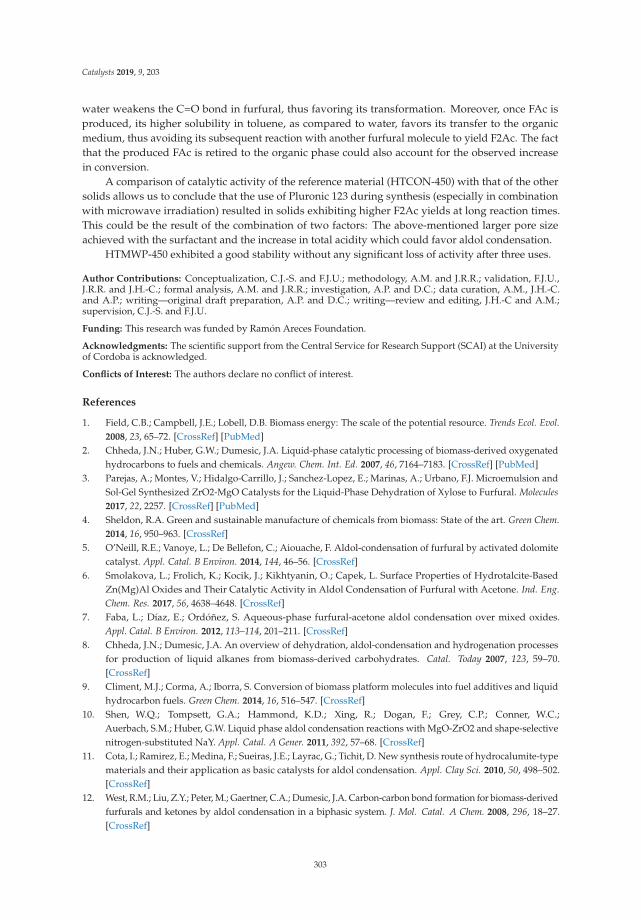
Catalysts 2019, 9, 203
water weakens the C=O bond in furfural, thus favoring its transformation. Moreover, once FAc isproduced, its higher solubility in toluene, as compared to water, favors its transfer to the organicmedium, thus avoiding its subsequent reaction with another furfural molecule to yield F2Ac. The factthat the produced FAc is retired to the organic phase could also account for the observed increasein conversion.
A comparison of catalytic activity of the reference material (HTCON-450) with that of the othersolids allows us to conclude that the use of Pluronic 123 during synthesis (especially in combinationwith microwave irradiation) resulted in solids exhibiting higher F2Ac yields at long reaction times.This could be the result of the combination of two factors: The above-mentioned larger pore sizeachieved with the surfactant and the increase in total acidity which could favor aldol condensation.
HTMWP-450 exhibited a good stability without any significant loss of activity after three uses.
Author Contributions: Conceptualization, C.J.-S. and F.J.U.; methodology, A.M. and J.R.R.; validation, F.J.U.,J.R.R. and J.H.-C.; formal analysis, A.M. and J.R.R.; investigation, A.P. and D.C.; data curation, A.M., J.H.-C.and A.P.; writing—original draft preparation, A.P. and D.C.; writing—review and editing, J.H.-C and A.M.;supervision, C.J.-S. and F.J.U.
Funding: This research was funded by Ramón Areces Foundation.
Acknowledgments: The scientific support from the Central Service for Research Support (SCAI) at the Universityof Cordoba is acknowledged.
Conflicts of Interest: The authors declare no conflict of interest.
References
1. Field, C.B.; Campbell, J.E.; Lobell, D.B. Biomass energy: The scale of the potential resource. Trends Ecol. Evol.2008, 23, 65–72. [CrossRef] [PubMed]
2. Chheda, J.N.; Huber, G.W.; Dumesic, J.A. Liquid-phase catalytic processing of biomass-derived oxygenatedhydrocarbons to fuels and chemicals. Angew. Chem. Int. Ed. 2007, 46, 7164–7183. [CrossRef] [PubMed]
3. Parejas, A.; Montes, V.; Hidalgo-Carrillo, J.; Sanchez-Lopez, E.; Marinas, A.; Urbano, F.J. Microemulsion andSol-Gel Synthesized ZrO2-MgO Catalysts for the Liquid-Phase Dehydration of Xylose to Furfural. Molecules2017, 22, 2257. [CrossRef] [PubMed]
4. Sheldon, R.A. Green and sustainable manufacture of chemicals from biomass: State of the art. Green Chem.2014, 16, 950–963. [CrossRef]
5. O’Neill, R.E.; Vanoye, L.; De Bellefon, C.; Aiouache, F. Aldol-condensation of furfural by activated dolomitecatalyst. Appl. Catal. B Environ. 2014, 144, 46–56. [CrossRef]
6. Smolakova, L.; Frolich, K.; Kocik, J.; Kikhtyanin, O.; Capek, L. Surface Properties of Hydrotalcite-BasedZn(Mg)Al Oxides and Their Catalytic Activity in Aldol Condensation of Furfural with Acetone. Ind. Eng.Chem. Res. 2017, 56, 4638–4648. [CrossRef]
7. Faba, L.; Díaz, E.; Ordóñez, S. Aqueous-phase furfural-acetone aldol condensation over mixed oxides.Appl. Catal. B Environ. 2012, 113–114, 201–211. [CrossRef]
8. Chheda, J.N.; Dumesic, J.A. An overview of dehydration, aldol-condensation and hydrogenation processesfor production of liquid alkanes from biomass-derived carbohydrates. Catal. Today 2007, 123, 59–70.[CrossRef]
9. Climent, M.J.; Corma, A.; Iborra, S. Conversion of biomass platform molecules into fuel additives and liquidhydrocarbon fuels. Green Chem. 2014, 16, 516–547. [CrossRef]
10. Shen, W.Q.; Tompsett, G.A.; Hammond, K.D.; Xing, R.; Dogan, F.; Grey, C.P.; Conner, W.C.;Auerbach, S.M.; Huber, G.W. Liquid phase aldol condensation reactions with MgO-ZrO2 and shape-selectivenitrogen-substituted NaY. Appl. Catal. A Gener. 2011, 392, 57–68. [CrossRef]
11. Cota, I.; Ramirez, E.; Medina, F.; Sueiras, J.E.; Layrac, G.; Tichit, D. New synthesis route of hydrocalumite-typematerials and their application as basic catalysts for aldol condensation. Appl. Clay Sci. 2010, 50, 498–502.[CrossRef]
12. West, R.M.; Liu, Z.Y.; Peter, M.; Gaertner, C.A.; Dumesic, J.A. Carbon-carbon bond formation for biomass-derivedfurfurals and ketones by aldol condensation in a biphasic system. J. Mol. Catal. A Chem. 2008, 296, 18–27.[CrossRef]
303
Catalysts 2019, 9, 203
13. Daniel, E.; Resasco, S.S.; Faria, J.; Prasomsri, T.; Ruiz, A.M.P. Furfurals as chemical platform forbiofuelsproduction. In Heterogeneous Catalysis in Biomass to Chemicals and Fuels; D.K.A.I., Ed.; Stanford Court:Irvine, CA, USA, 2011.
14. Bao, Q.; Qi, H.; Zhang, C.; Ning, C.; Zhang, Y.; Wu, Y.; Gui, W.; Wang, Z. Highly Catalytic Activity ofBa/γ-Ti–Al2O3 Catalyst for Aldol Condensation of Methyl Acetate with Formaldehyde. Catal. Lett. 2018,148, 3402–3412. [CrossRef]
15. Climent, M.J.; Corma, A.; Fornés, V.; Guil-Lopez, R.; Iborra, S. Aldol condensations on solid catalysts: Acooperative effect between weak acid and base catalysts. Adv. Synth. Catal. 2002, 344, 1090–1096. [CrossRef]
16. Fakhfakh, N.; Cognet, P.; Cabassud, M.; Lucchese, Y.; Rios, M.D.D.L. Stoichio-kinetic modeling andoptimization of chemical synthesis: Application to the aldolic condensation of furfural on acetone.Chem. Eng. Process. 2008, 47, 349–362. [CrossRef]
17. Xing, R.; Subrahmanyam, A.V.; Olcay, H.; Qi, W.; van Walsum, G.P.; Pendse, H.; Huber, G.W. Production ofjet and diesel fuel range alkanes from waste hemicellulose-derived aqueous solutions. Green Chem. 2010, 12,1933–1946. [CrossRef]
18. Patel, A.A.; Patel, S.R. Synthesis and characterization of furfural-acetone polymers. Eur. Polym. J. 1983, 19,231–234. [CrossRef]
19. Gandini, A.; Belgacem, M.N. Furans in polymer chemistry. Prog. Polym. Sci. 1997, 22, 1203–1379. [CrossRef]20. Hora, L.; Kelbichova, V.; Kikhtyanin, O.; Bortnovskiy, O.; Kubicka, D. Aldol condensation of furfural and
acetone over Mg-Al layered double hydroxides and mixed oxides. Catal. Today 2014, 223, 138–147. [CrossRef]21. Ordonez, S.; Diaz, E.; Leon, M.; Faba, L. Hydrotalcite-derived mixed oxides as catalysts for different C-C
bond formation reactions from bioorganic materials. Catal. Today 2011, 167, 71–76. [CrossRef]22. Choudary, B.M.; Kantam, M.L.; Sreekanth, P.; Bandopadhyay, T.; Figueras, F.; Tuel, A. Knoevenagel and
aldol condensations catalysed by a new diamino-functionalised mesoporous material. J. Mol. Cataly. A Chem.1999, 142, 361–365. [CrossRef]
23. Aramendia, M.A.; Aviles, Y.; Borau, V.; Luque, J.M.; Marinas, J.M.; Ruiz, J.R.; Urbano, F.J. Thermaldecomposition of Mg Al and Mg Ga layered-double hydroxides: A spectroscopic study. J. Mater. Chem. 1999,9, 1603–1607. [CrossRef]
24. Morato, A.; Alonso, C.; Medina, F.; Cesteros, Y.; Salagre, P.; Sueiras, J.E.; Tichit, D.; Coq, B. Palladiumhydrotalcites as precursors for the catalytic hydroconversion of CCl2F2 (CFC-12) and CHClF2 (HCFC-22).Appl. Catal. B Environ. 2001, 32, 167–179. [CrossRef]
25. Xu, C.; Gao, Y.; Liu, X.; Xin, R.; Wang, Z. Hydrotalcite reconstructed by in situ rehydration as a highly activesolid base catalyst and its application in aldol condensations. RSC Adv. 2013, 3, 793–801. [CrossRef]
26. Frost, R.L.; Palmer, S.J.; Theiss, F. Synthesis and Raman spectroscopic characterisation of hydrotalcites basedon the formula Ca6Al2(CO3)(OH)16·4H2O. J. Raman Spectrosc. 2010, 42, 1163–1167. [CrossRef]
27. Frost, R.L.; Erickson, K.L. Vibrational spectroscopic study of the nitrate containing hydrotalciteMbobomkulite, Spectrochim. Acta Part A 2005, 61, 2919–2925. [CrossRef] [PubMed]
28. Mahtab, P.; Seyed-Rasulzade, S.K.; Nikzad-Kojanag, B. Effect of Preparation Methods and Pluronic Templateon the Catalytic Activity of Ca/SBA-15. Iran. J. Chem. Chem. Eng. 2018, 37, 53–60.
29. Hidalgo-Carrillo, J.; Marinas, A.; Marinas, J.M.; Delgado, J.J.; Raya-Miranda, R.; Urbano, F.J. Water as solventin the liquid-phase selective hydrogenation of crotonaldehyde to crotyl alcohol over Pt/ZnO: A factorialdesign approach. Appl. Catal. B Environ. 2014, 154, 369–378. [CrossRef]
30. Cosano, D.; Esquivel, D.; Mateos, L.D.; Quesada, E.; Jiménez-Sanchidrián, C.; Ruiz, J.R. Spectroscopicanalysis of corrosion products in a bronze cauldron from the Late Iberian Iron Age. Spectrochim. Acta Part AMol. Biomol. Spectrosc. 2018, 205, 489–496. [CrossRef] [PubMed]
© 2019 by the authors. Licensee MDPI, Basel, Switzerland. This article is an open accessarticle distributed under the terms and conditions of the Creative Commons Attribution(CC BY) license (http://creativecommons.org/licenses/by/4.0/).
304

MDPISt. Alban-Anlage 66
4052 BaselSwitzerland
Tel. +41 61 683 77 34Fax +41 61 302 89 18
www.mdpi.com
Catalysts Editorial OfficeE-mail: [email protected]
www.mdpi.com/journal/catalysts


MDPI St. Alban-Anlage 66 4052 Basel Switzerland
Tel: +41 61 683 77 34 Fax: +41 61 302 89 18
www.mdpi.com ISBN 978-3-03928-891-5