High performance supercapacitor using catalysis free porous carbon nanoparticles
7
This content has been downloaded from IOPscience. Please scroll down to see the full text. Download details: IP Address: 88.200.27.31 This content was downloaded on 18/11/2014 at 15:08 Please note that terms and conditions apply. High performance supercapacitor using catalysis free porous carbon nanoparticles View the table of contents for this issue, or go to the journal homepage for more 2014 J. Phys. D: Appl. Phys. 47 495307 (http://iopscience.iop.org/0022-3727/47/49/495307) Home Search Collections Journals About Contact us My IOPscience
-
Upload
independent -
Category
Documents
-
view
6 -
download
0
Transcript of High performance supercapacitor using catalysis free porous carbon nanoparticles
This content has been downloaded from IOPscience. Please scroll down to see the full text.
Download details:
IP Address: 88.200.27.31
This content was downloaded on 18/11/2014 at 15:08
Please note that terms and conditions apply.
High performance supercapacitor using catalysis free porous carbon nanoparticles
View the table of contents for this issue, or go to the journal homepage for more
2014 J. Phys. D: Appl. Phys. 47 495307
(http://iopscience.iop.org/0022-3727/47/49/495307)
Home Search Collections Journals About Contact us My IOPscience
1 © 2014 IOP Publishing Ltd Printed in the UK
1. Introduction
Carbon materials have been playing a significant role in the development of alternative clean and sustainable energy technologies. Energy density, power density, size, weight, initial cost and life are the most important requirements for energy storage devices. In terms of power and energy den-sity, the supercapacitor fills up the gap between the battery and classical capacitor, allowing new applications. Many carbon-based materials are reported as energy storage super-capacitors due to their high power density, high energy den-sity, low cost, short charging time and long cycle life. These materials include activated carbon, carbon nanotubes, carbon nanospheres and graphene [1–4]. The carbon-based elec-trical double layer capacitor (EDLC) utilizes the double layer formed at the interface between the nanoporous carbonaceous electrode and the electrolyte solution. The supercapacitance depends on pore size distribution of the carbon materials. The carbon materials with large pores are more suitable to high-power supercapacitor applications because the ions transport into the pores easily. Among all carbon materials, spherical
carbon nanospheres are attractive candidates for functional materials due to high heat stability and excellent conduc-tivity [2, 5]. Electrochemical supercapacitors have a wide range of applications in telecommunication devices, such as cell phones and pagers, stand-by power systems and electric hybrid vehicles [6, 7].
On the other hand, producing high quality porous carbon nanoparticles is a difficult challenge since they require lots of care and attention [8]. Additionally, PCNs are very attractive materials due to their wide variety of applications [8]. One of the prime interests that has recently arisen is to produce PCNs using biowaste materials which not only reduce the burden to the environment but can also be more effective as com-pared with available PCNs. Most of nanoparticle synthesis, including catalysis, is a necessary phenomena but an excep-tion to this has been reported recently by our group where catalyst free PCNs were obtained using biowaste materials [9]. Excellent quality of the PCNs were characterized and the reported small particle sizes ranged from 30–50 nm.
To further extend this work, we here conduct detailed elec-trochemical studies on newly synthesized PCNs by cyclic
Journal of Physics D: Applied Physics
High performance supercapacitor using catalysis free porous carbon nanoparticles
Gomaa A M Ali1,2, Shoriya Aruni Bt Abdul Manaf1, Anuj Kumar3, Kwok Feng Chong1 and Gurumurthy Hegde1,4
1 Faculty of Industrial Sciences and Technology, UMP, 26300, Gambang, Kuantan, Pahang, Malaysia2 Chemistry Department, Faculty of Science, Al-Azhar University, Assiut, 71524, Egypt3 Department of Building Structures, Faculty of Civil Engineering Czech Technical Universit in Prague, Thákurova 7, 166 29 Praha 6; Czech Republic4 BMS R and D Centre, BMS College of Engineering, Basavanagudi, Bangalore, India
E-mail: [email protected]
Received 7 August 2014, revised 21 October 2014Accepted for publication 24 October 2014Published 18 November 2014
AbstractVery high supercapacitance values are obtained using catalyst free porous carbon nanoparticles (PCNs). The obtained PCNs have a porous structure with fine particles 35 nm in size. The specific capacitance of PCNs is 343 F g−1 and 309 F g−1 at 5 mV s−1 and 0.06 A g−1, respectively. PCNs shows a high cyclic stability of about 90% and high columbic efficiency of 95% over 2500 cycles at 1 A g−1. Impedance spectra show low resistance of PCNs, supporting their suitability for supercapacitor electrode application.
Keywords: carbon nanoparticles, supercapacitor, porous, catalyst free
(Some figures may appear in colour only in the online journal)
G A M Ali et al
Printed in the UK
495307
JPD
© 2014 IOP Publishing Ltd
2014
47
J. Phys. D: Appl. Phys.
JPD
0022-3727
10.1088/0022-3727/47/49/495307
Papers
49
Journal of Physics D: Applied Physics
IOP
0022-3727/14/495307+6$33.00
doi:10.1088/0022-3727/47/49/495307J. Phys. D: Appl. Phys. 47 (2014) 495307 (6pp)
G A M Ali et al
2
voltammetry (CV), charge–discharge galvanostatic tests and electrochemical impedance spectroscopy.
2. Experimental procedures and techniques
2.1. Sample preparation
PCNs with a porous structure were obtained using single step pyrolysis in nitrogen atmosphere from biowaste. The dry oil palm fronds were collected from a local oil palm estate in Malaysia, the leaves were separated from the fronds and dried in an oven at 60 °C for two days to remove all the moisture. The dry oil palm leaves (OPL) was crushed to a small size, then grinded at a speed of 12 000 rpm using a grinder (Retsch, ZM 200, Germany). The ground OPL was then sieved to achieve a particle size of 62 µm. The OPL was pyrolysed in a tube furnace (Nabertherm, EW-33334–36) at 500 and 600 °C for 2 h under a continuous flow of N2 (150 ml cm−3) at a heating rate of 5 °C m−1 and simultaneously cooled down to room temperature in N2 atmosphere to get the pyrolysed product. The aqueous NaOH, 2.5M was employed to remove the silica from the pyrolysed product and generate the PCNs. More detail of the experimental procedure has been discussed in our recent publication [9].
2.2. Porous carbon nanosphere characterization
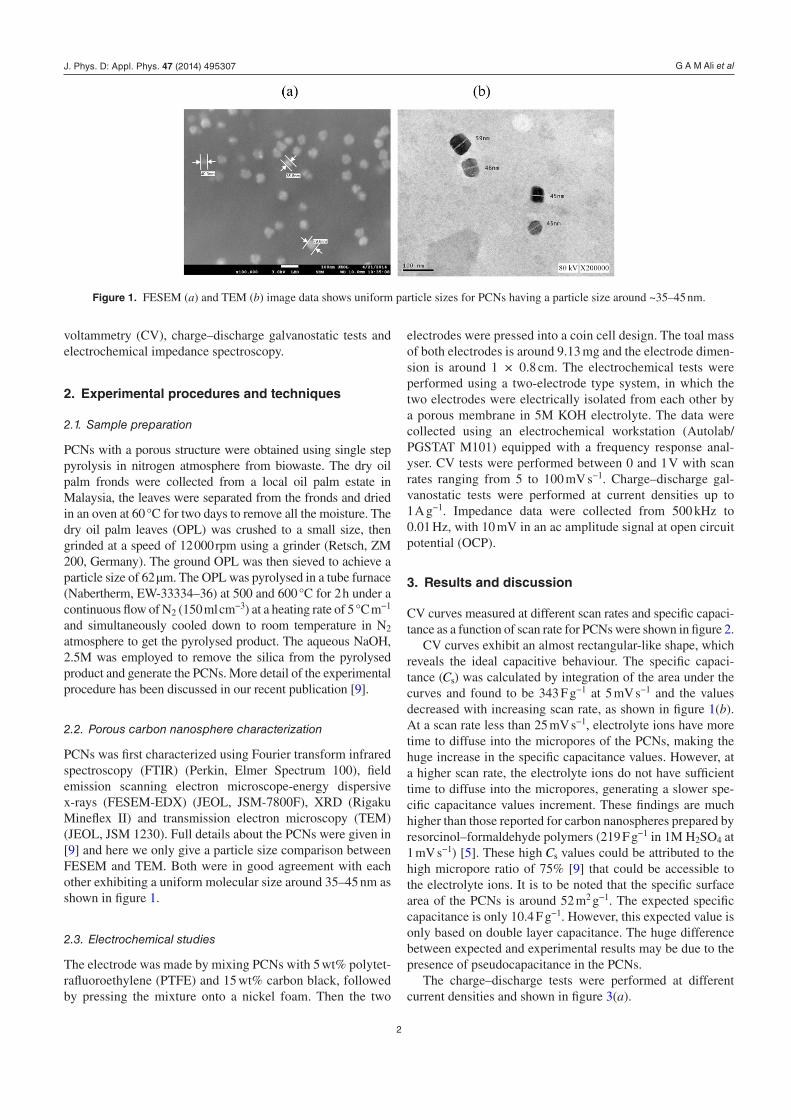
PCNs was first characterized using Fourier transform infrared spectroscopy (FTIR) (Perkin, Elmer Spectrum 100), field emission scanning electron microscope-energy dispersive x-rays (FESEM-EDX) (JEOL, JSM-7800F), XRD (Rigaku Mineflex II) and transmission electron microscopy (TEM) (JEOL, JSM 1230). Full details about the PCNs were given in [9] and here we only give a particle size comparison between FESEM and TEM. Both were in good agreement with each other exhibiting a uniform molecular size around 35–45 nm as shown in figure 1.
2.3. Electrochemical studies
The electrode was made by mixing PCNs with 5 wt% polytet-rafluoroethylene (PTFE) and 15 wt% carbon black, followed by pressing the mixture onto a nickel foam. Then the two
electrodes were pressed into a coin cell design. The toal mass of both electrodes is around 9.13 mg and the electrode dimen-sion is around 1 × 0.8 cm. The electrochemical tests were performed using a two-electrode type system, in which the two electrodes were electrically isolated from each other by a porous membrane in 5M KOH electrolyte. The data were collected using an electrochemical workstation (Autolab/PGSTAT M101) equipped with a frequency response anal-yser. CV tests were performed between 0 and 1 V with scan rates ranging from 5 to 100 mV s−1. Charge–discharge gal-vanostatic tests were performed at current densities up to 1 A g−1. Impedance data were collected from 500 kHz to 0.01 Hz, with 10 mV in an ac amplitude signal at open circuit potential (OCP).
3. Results and discussion
CV curves measured at different scan rates and specific capaci-tance as a function of scan rate for PCNs were shown in figure 2.
CV curves exhibit an almost rectangular-like shape, which reveals the ideal capacitive behaviour. The specific capaci-tance (Cs) was calculated by integration of the area under the curves and found to be 343 F g−1 at 5 mV s−1 and the values decreased with increasing scan rate, as shown in figure 1(b). At a scan rate less than 25 mV s−1, electrolyte ions have more time to diffuse into the micropores of the PCNs, making the huge increase in the specific capacitance values. However, at a higher scan rate, the electrolyte ions do not have sufficient time to diffuse into the micropores, generating a slower spe-cific capacitance values increment. These findings are much higher than those reported for carbon nanospheres prepared by resorcinol–formaldehyde polymers (219 F g−1 in 1M H2SO4 at 1 mV s−1) [5]. These high Cs values could be attributed to the high micropore ratio of 75% [9] that could be accessible to the electrolyte ions. It is to be noted that the specific surface area of the PCNs is around 52 m2 g−1. The expected specific capacitance is only 10.4 F g−1. However, this expected value is only based on double layer capacitance. The huge difference between expected and experimental results may be due to the presence of pseudocapacitance in the PCNs.
The charge–discharge tests were performed at different current densities and shown in figure 3(a).
Figure 1. FESEM (a) and TEM (b) image data shows uniform particle sizes for PCNs having a particle size around ~35–45 nm.
J. Phys. D: Appl. Phys. 47 (2014) 495307

G A M Ali et al
3
The data displays nearly a straight line with neglected iR drop of 1.4% at 0.06 A g−1, indicating a good current–voltage response. The specific capacitance was calculated from charge–discharge data using the equation reported else-where [1]. The calculated specific capacitance decreased with increasing discharge current and the highest specific capaci-tance of 309 F g−1 was obtained at 0.06 A g−1. This is higher than the specific capacitance obtained for nitrogen-doped porous carbon nanospheres (190 F g−1 in 6M KOH at 0.05 A g−1 [10]) due to smaller particle size (35 nm) of the PCNs.
The cycling stability of PCNs was performed using galva-nostatic charge–discharge at 1 A g−1 for 2500 cycles and the result is presented in figure 4.
PCNs showed very good cycling stability where it still maintained more than 90% of its original capacitance after
2500 cycles. The inset shows some charge–discharge cycles during the test. In addition, PCNs showed high Coulombic efficiency of 95%. Moreover, the long term stability of these PCNs had been tested by running the CV before and after the charge–discharge cycles, as shown in figure 5. The data showed that at 10 mV s−1, the Cs was 280 and 270 F g−1 before and after 2500 cycles, respectively. Therefore PCNs still possessed around 96% of their capacitance after 2500 cycles. Such high capacitance retention up to 2500 cycles suggests that the PCNs are a good candidate for superca-pacitor application.
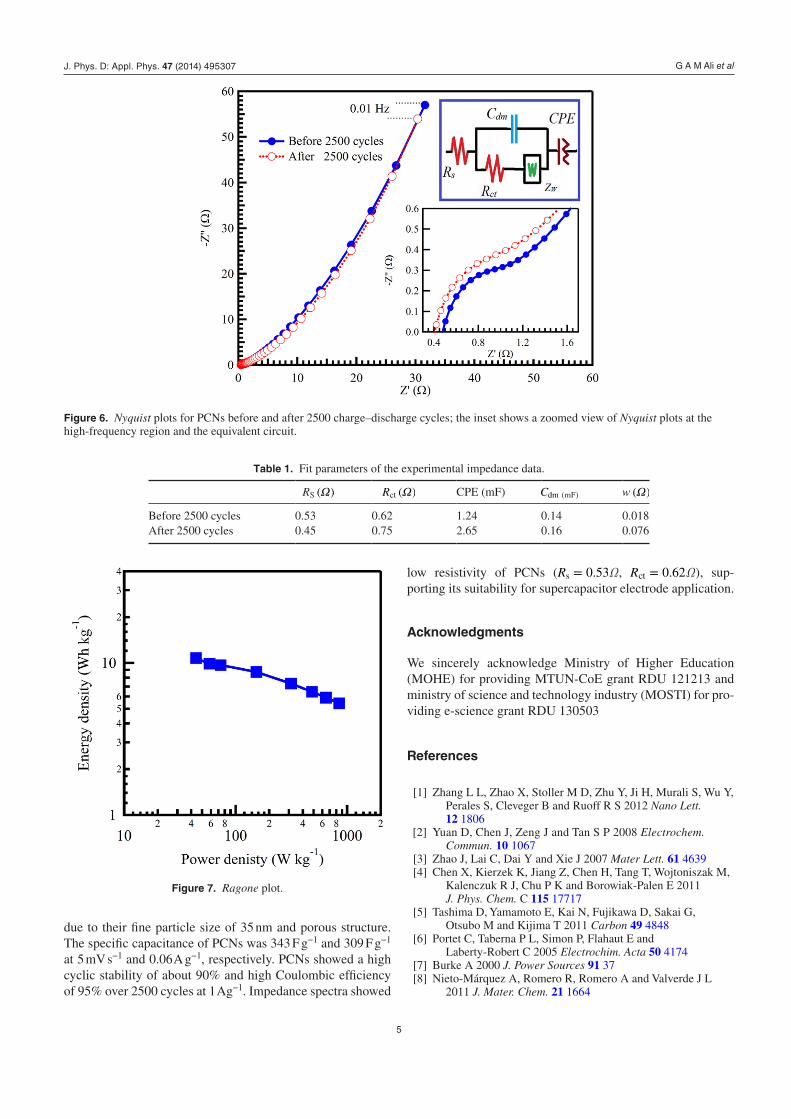
The electrochemical impedance spectroscopy (EIS) data was done to further investigate the electrochemical proper-ties for PCNs. Nyquist plots for PCNs before and after 2500 charge–discharge cycles are shown in figure 5. The insets of
Figure 2. CV curves (a) at different scan rates and specific capacitance, (b) as a function of scan rate.
Figure 3. Galvanostatic charge–discharge curves (a) at different current densities and specific capacitance, (b) as a function of current density.
J. Phys. D: Appl. Phys. 47 (2014) 495307

G A M Ali et al
4
figure 6 represent the high-frequency region of the recorded full impedance plot and the equivalent circuit.
A small semicircle in the high-frequency region and a vertically straight line in the low-frequency region can be seen. The solution resistance (Rs) was found to be very small (0.53 Ω), indicating high electrical conductivity of PCNs. The charge transfer resistance (Rct) associated with the surface electrode properties was found to be 0.62 Ω.
The Warburg (W) impedance due to the solid-state diffu-sion was obtained using the equivalent circuit fitting. The ver-tical linear section in the low-frequency region demonstrated a pure capacitive behaviour and represented an ideal superca-pacitor. The result of the EIS measurement indicated that the
PCNs have good capacitive performance. All fitting param-eters before and after 2500 charge–discharge cycles are sum-marized in table 1. As we can see, all parameters after 2500 charge–discharge cycles were close to those before testing, indicating good electrochemical stability for PCNs.
The increase in Cdm and constant phase elements (CPE) as well as the decrease in Rs are quiet surprising. We attribute these to the activation of the PCNs after the long cycling process. Such a phenomenon has been explained in the literature [11, 12].
Potassium hydroxide (KOH) plays an important role in the activation of graphene and all carbon materials. There was a large increase in specific capacitance of graphene and acti-vated carbon when they were treated with KOH. In our case the electrolyte KOH supposly goes through the same activa-tion process under this long charge–discharge cycling.
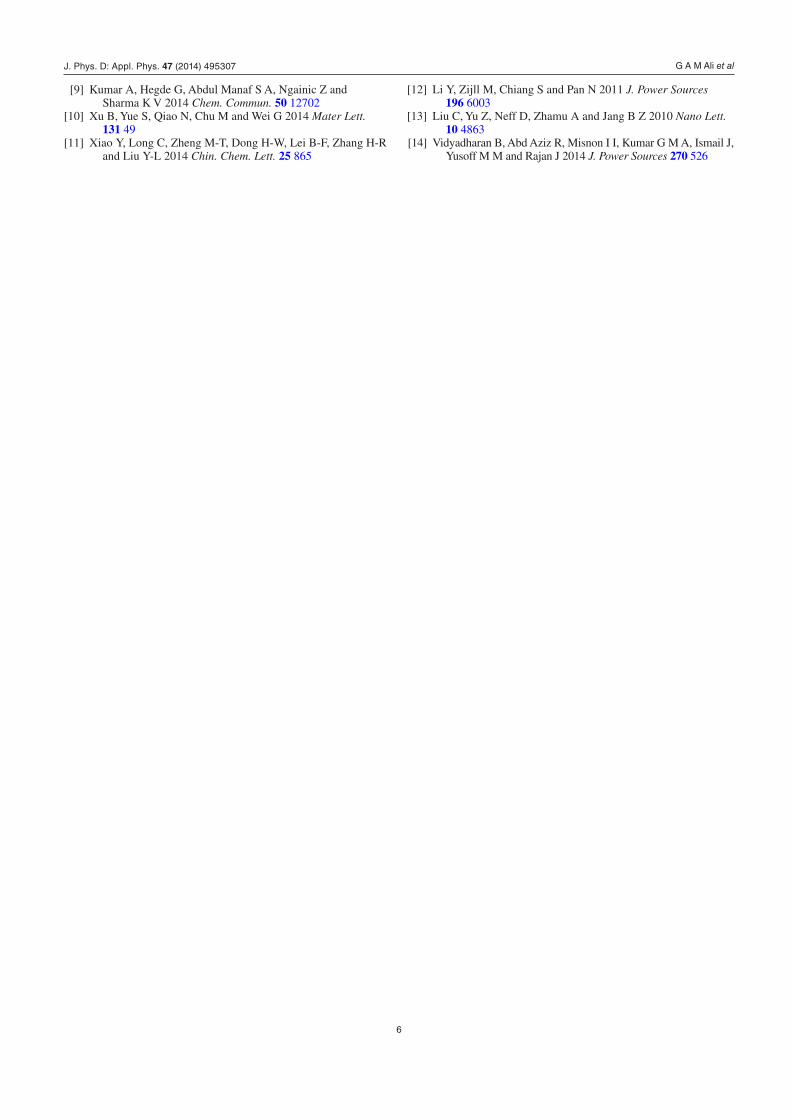
The Ragone plot for PCNs is shown in figure 7, showing the maximum energy density of 11 Wh kg−1 and maximum power density of 44 W kg−1. The energy and power densities were calculated using the equation reported elsewhere [13]. The energy density was found to be higher than those obtained for activated carbon [14].
The obtained high values of supercapacitance may be due to the template formed in porous carbon nanoparticles as dis-cussed in detail in our earlier paper [9].
4. Conclusion
In conclusion, very high supercapacitance values were reported for the first time using catalyst free porous carbon nanoparticles. The obtained electrochemical behaviour in 5 M KOH indicates excellent supercapacitor performance. That is
Figure 5. CV curves before and after 2500 charge–discharge cycles at 10 mV s−1.
Figure 4. Cycle life stability curve (left versus bottom) and Coulombic efficiency (right versus bottom) at 1 A g−1 current density, the inset shows the charge–discharge curves for different cycles.
J. Phys. D: Appl. Phys. 47 (2014) 495307
G A M Ali et al
5
due to their fine particle size of 35 nm and porous structure. The specific capacitance of PCNs was 343 F g−1 and 309 F g−1 at 5 mV s−1 and 0.06 A g−1, respectively. PCNs showed a high cyclic stability of about 90% and high Coulombic efficiency of 95% over 2500 cycles at 1 Ag−1. Impedance spectra showed
low resistivity of PCNs ( =R 0.53s Ω, =R 0.62ct Ω), sup-porting its suitability for supercapacitor electrode application.
Acknowledgments
We sincerely acknowledge Ministry of Higher Education (MOHE) for providing MTUN-CoE grant RDU 121213 and ministry of science and technology industry (MOSTI) for pro-viding e-science grant RDU 130503
References
[1] Zhang L L, Zhao X, Stoller M D, Zhu Y, Ji H, Murali S, Wu Y, Perales S, Cleveger B and Ruoff R S 2012 Nano Lett. 12 1806
[2] Yuan D, Chen J, Zeng J and Tan S P 2008 Electrochem. Commun. 10 1067
[3] Zhao J, Lai C, Dai Y and Xie J 2007 Mater Lett. 61 4639 [4] Chen X, Kierzek K, Jiang Z, Chen H, Tang T, Wojtoniszak M,
Kalenczuk R J, Chu P K and Borowiak-Palen E 2011 J. Phys. Chem. C 115 17717
[5] Tashima D, Yamamoto E, Kai N, Fujikawa D, Sakai G, Otsubo M and Kijima T 2011 Carbon 49 4848
[6] Portet C, Taberna P L, Simon P, Flahaut E and Laberty-Robert C 2005 Electrochim. Acta 50 4174
[7] Burke A 2000 J. Power Sources 91 37 [8] Nieto-Márquez A, Romero R, Romero A and Valverde J L
2011 J. Mater. Chem. 21 1664
Table 1. Fit parameters of the experimental impedance data.
RS Ω( ) Rct Ω( ) CPE (mF) Cdm (mF) w Ω( )
Before 2500 cycles 0.53 0.62 1.24 0.14 0.018After 2500 cycles 0.45 0.75 2.65 0.16 0.076
Figure 6. Nyquist plots for PCNs before and after 2500 charge–discharge cycles; the inset shows a zoomed view of Nyquist plots at the high-frequency region and the equivalent circuit.
Figure 7. Ragone plot.
J. Phys. D: Appl. Phys. 47 (2014) 495307
G A M Ali et al
6
[9] Kumar A, Hegde G, Abdul Manaf S A, Ngainic Z and Sharma K V 2014 Chem. Commun. 50 12702
[10] Xu B, Yue S, Qiao N, Chu M and Wei G 2014 Mater Lett. 131 49
[11] Xiao Y, Long C, Zheng M-T, Dong H-W, Lei B-F, Zhang H-R and Liu Y-L 2014 Chin. Chem. Lett. 25 865
[12] Li Y, Zijll M, Chiang S and Pan N 2011 J. Power Sources 196 6003
[13] Liu C, Yu Z, Neff D, Zhamu A and Jang B Z 2010 Nano Lett. 10 4863
[14] Vidyadharan B, Abd Aziz R, Misnon I I, Kumar G M A, Ismail J, Yusoff M M and Rajan J 2014 J. Power Sources 270 526
J. Phys. D: Appl. Phys. 47 (2014) 495307