Bulletin of Chemical Reaction Engineering & Catalysis - RP2U ...
49
Department of Chemical Engineering, DIPONEGORO UNIVERSITY Bulletin of Chemical Reaction Chemical Reaction Engineering & Catalysis (CREC) Group Bull. Chem. React. Eng. Catal. Vol. 3 No. 1-3 1— 62 Semarang December 2008 ISSN 1978-2993 Masyarakat Katalisis Indonesia—Indonesian Catalyst Society (MKICS) Volume 4, Number 2, Year 2009, 31 December 2009 Bulletin of Chemical Reaction Engineering & Catalysis ISSN 1978-2993 An Electronic Journal. Available online at: http://bcrec.undip.ac.id/ Bull. Chem. React. Eng. Catal. Vol. 4 No. 2 37— 78 Semarang December 2009 ISSN 1978-2993 Department of Chemical Engineering, DIPONEGORO UNIVERSITY Masyarakat Katalisis Indonesia— Indonesian Catalyst Society (MKICS)
-
Upload
khangminh22 -
Category
Documents
-
view
3 -
download
0
Transcript of Bulletin of Chemical Reaction Engineering & Catalysis - RP2U ...

Available online at: http://www.undip.ac.id/bcrec
Department of Chemical Engineering,
DIPONEGORO UNIVERSITY
Bulletin of Chemical Reaction Engineering & Catalysis
ISSN 1978-2993
Chemical Reaction Engineering & Catalysis
(CREC) Group
Bull. Chem. React. Eng. Catal. Vol. 3 No. 1-3 1— 62
Semarang December 2008
ISSN 1978-2993
Masyarakat Katalisis Indonesia—Indonesian
Catalyst Society (MKICS)
Secondary Story Headline
Volume 4, Number 2, Year 2009, 31 December 2009
Bulletin of Chemical Reaction Engineering & Catalysis
ISSN 1978-2993
An Electronic Journal. Available online at: http://bcrec.undip.ac.id/
Bull. Chem. React. Eng. Catal. Vol. 4 No. 2 37— 78
Semarang December 2009
ISSN 1978-2993
Department of Chemical Engineering,
DIPONEGORO UNIVERSITY
Masyarakat Katalisis Indonesia—
Indonesian Catalyst Society (MKICS)

This page intentionally left blank

Bulletin of Chemical Reaction Engineering & Catalysis, 4(2), 2009, i
BULLETIN OF CHEMICAL REACTION ENGINEERING and CATALYSIS (ISSN 1978-2993), an electronic journal, provides a forum for publishing the novel technology related to chemical reaction engi-neering and catalysis engineering. Scientific articles dealing with chemical reaction engineering, catalysis engineering, catalyst characteriza-tion, novel innovation of chemical reactor, etc. are particularly welcome. The journal encompasses research articles, original research report, review articles, short communications, and scientific commentaries in chemical reaction engineering and catalysis, including: fundamental of catalysis, fundamental of chemical reaction engineering, chemistry of catalyst, applied chemical reaction engineering, applied catalysis, ap-plied bio-catalysis, applied bio-reactor, chemical reactor design, catalyst regeneration, and industrial prac-tice of catalysis and chemical reactor engineering. The article can be submitted electronically in MS Word / OpenOffice file to Editorial Office email ( [email protected] ). Please read the author guidelines for the manuscript submission.
AIMS AND SCOPE
ABSTRACTING & INDEXING Bulletin of Chemical Reaction Engineering and Catalysis (BCREC) covered by following services: • CHEMICAL ABSTRACT SERVICES (CAS), (http://www.cas.org) • GOOGLE SCHOLAR (http://scholar.google.com) • EPRINTS UNDIP (http://eprints.undip.ac.id) • DIRECTORY OF OPEN ACCESS JOURNAL (DOAJ) (http://www.doaj.org) • GENEVA FOUNDATION FOR MEDICAL EDUCATION AND RESEARCH (http://www.gfmer.ch/
Medical_journals/Biochemistry_chemistry_physics.htm) • DMOZ OPEN DIRECTORY PROJECT (http://www.dmoz.org/Science/Chemistry/Publications/Journals/) • RESEARCHGATE - SCIENTIFIC NETWORK (https://www.researchgate.net/application.Index.html ) • SOCOLAR, PR China (http://www.socolar.com ) • NCSU LIBRARIES, (http://www.lib.ncsu.edu/journals/browse.php?search=b&page=116) • JOURNAL FINDER, THE UNIVERSITY OF NORTH CAROLINA (http://journalfinder.wtcox.com/uncg/search-
subj.asp?subj=7&lastrec=200&sortord=ASC ) • ALUMNI E-LIBRARY (http://sunzi1.lib.hku.hk/ER/detail/cof/4196022 ) • HINDU WEBSITE SEARCH - SCIENCE CHEMISTRY PUBLICATIONS JOURNALS (http://
www.hinduwebsite.com/utilities/webDir/webDir.asp?/Science/Chemistry/Publications/Journals )
PUBLICATION INFORMATION Bulletin of Chemical Reaction Engineering and Catalysis (ISSN 1978-2993) Short journal title: Bull. Chem. React. Eng. Catal. For year 2009, Volume 4, Number 1 — 2 are scheduled for publication. Bulletin of Chemical Reaction Engineering and Catalysis is electronically published via journal web-site (http://bcrec.undip.ac.id). The journal contents are open access system and free of charge. The BCREC journal is published by: • Department of Chemical Engineering, Diponegoro University, and • Masyarakat Katalis Indonesia—Indonesian Catalyst Society (MKICS)
Commencement of publication: January 2006
Copyright © 2009, BCREC, ISSN 1978-2993

Bulletin of Chemical Reaction Engineering & Catalysis, 4(2), 2009, ii
Editor in Chief: Dr. Istadi Department of Chemical Engineering, Diponegoro University, Jln. Prof. Sudharto, Kampus UNDIP Tembalang, Sema-rang, Central Java, INDONESIA 50239; E-mail: [email protected] Editorial Member: Prof. Dr. Purwanto, Department of Chemical Engineering, Diponegoro University, Jln. Prof. Sudharto, Kampus UN-DIP Tembalang, Semarang, INDONESIA 50239, E-mail: [email protected] Dr. Didi Dwi Anggoro, Department of Chemical Engineering, Diponegoro University, Jln. Prof. Sudharto, Kampus UNDIP Tembalang, Semarang, INDONESIA 50239, E-mail: [email protected] Dr. Mohammad Djaeni , Department of Chemical Engineering, Diponegoro University, Jln. Prof. Sudharto, Kampus UNDIP Tembalang, Semarang, Central Java, INDONESIA 50239, E-mail: mzaini98[at]yahoo.com
EDITORIAL BOARD
Prof. Mostafa Barigou School of Chemical Engineering, University of Birmingham, Edgbaston, Birmingham B15 2TT, United Kingdom, Tel: +44 (0) 121 414 5277, Fax: +44 (0) 121 414 5324 , Email: [email protected] Prof. Dr. Raghunath V. Chaudhari Center for Environmental Beneficial Catalysis, Department of Chemical and Petroleum Engineering, The University of Kansas, 1501 Wakarusa Dr., Building B-Room 112B, Law-rence, KS 66047-1803, USA, Phone: 785 864 1634; Fax: 785 864 6051, Email: rvc1948[at]ku.edu Prof. Dr. Dmitry Yu. Murzin Laboratory of Industrial Chemistry and Reaction Engineer-ing, Abo Akademi University, Biskopsgatan 8, 20500, Turku/Åbo, Finland, ph: + 358 2 215 4985 fax:+ 358 2 215 4479, e-mail: dmurzin[at]abo.fi Dr. Yibo Zhou 2351 Gilman Hall, Department of Chemistry, Iowa State Uni-versity, USA, Phone: 1-515-294-6986, Email: yibozhou[at]iastate.edu Prof. Dr. Ram Prasad Department of Chemical Engineering and Technology, Insti-tute of Technology, Banaras Hindu University, India, E-mail: rprasad.che[at]itbhu.ac.in Assoc. Prof. Dr. Subagjo Department of Chemical Engineering, Institut Teknologi Bandung, Jl. Ganesha 10, Bandung, Indonesia, E-mail: [email protected] Assoc. Prof. Dr. Abdullah Department of Chemical Engineering, Diponegoro , Univer-sity, Semarang, Indonesia, E-mail: [email protected]
Prof. Dr. Nor Aishah Saidina Amin Chemical Reaction Engineering Group (CREG), Faculty of Chemical and Natural Resources Engineering, Universiti Teknologi Malaysia, 81310 UTM Skudai, Johor, Malaysia , E-mail: [email protected] Assoc. Prof. Dr. Y. H. Taufiq-Yap Putra Centre for Catalysis Science and Technology, Depart-ment of Chemistry, Faculty of Science, Universiti Putra Ma-laysia, 43400 UPM Serdang, Selangor, Malaysia , E-mail: [email protected] Assoc. Prof. Dr. Hadi Nur Ibnu Sina Institute for Fundamental Science Studies, Univer-siti Teknologi Malaysia , 81310 UTM Skudai, Johor, Malay-sia , E-mail: [email protected] Prof. Dr. Abdul Rahman Mohamed School of Chemical Engineering, Universiti Sains , Malaysia, 14300 Nibong Tebal, Pulau Penang, Malaysia , E-mail: [email protected] Dr. Hery Haerudin Research Center for Chemistry, Indonesian Institute Of Sci-ences (PP Kimia – LIPI), Kawasan PUSPIPTEK, Tangerang, Banten, Indonesia Assoc. Prof. Dr. Sibudjing Kawi Department of Chemical and Biochemical Engineering, Na-tional University of Singapore, Singapore, E-mail:[email protected] Dr. Yang Hong Dalian Institute of Chemical Physics, Chinese Academy of Sciences, 457 Zhongshan Road, Dalian 116023, China E-mail: [email protected]
ADVISORY INTERNATIONAL EDITORIAL BOARDS
Copyright © 2009, BCREC, ISSN 1978-2993
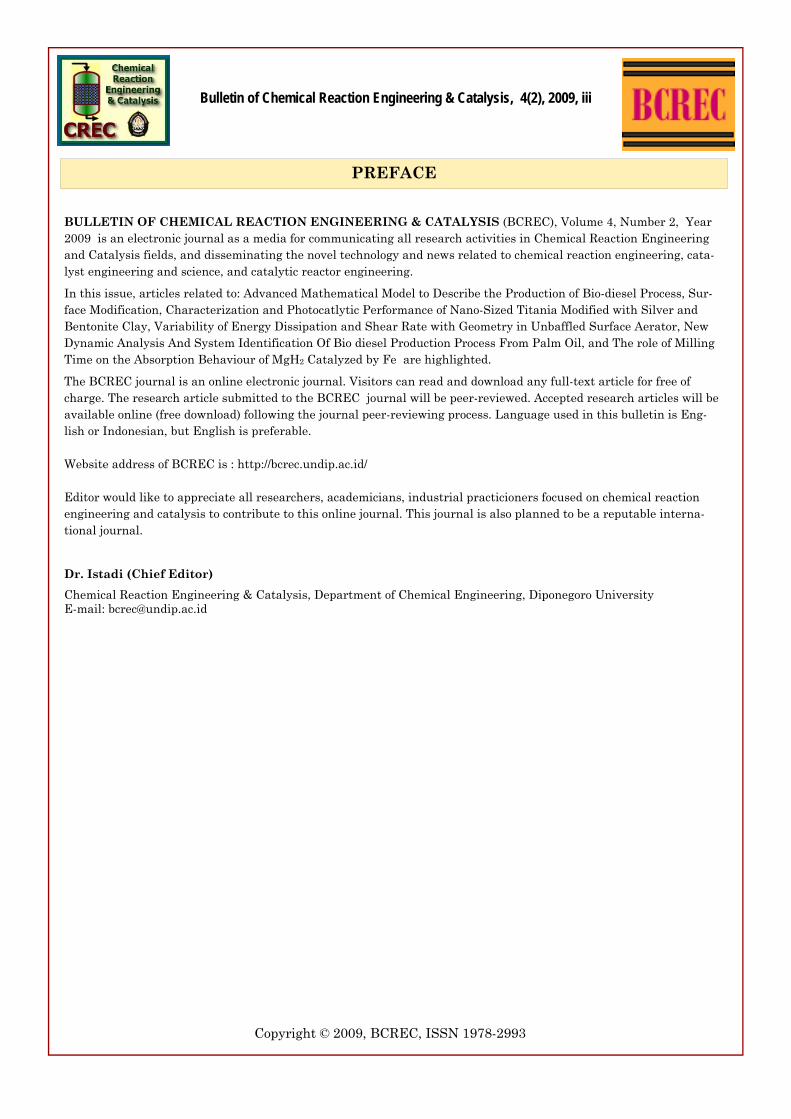
BULLETIN OF CHEMICAL REACTION ENGINEERING & CATALYSIS (BCREC), Volume 4, Number 2, Year 2009 is an electronic journal as a media for communicating all research activities in Chemical Reaction Engineering and Catalysis fields, and disseminating the novel technology and news related to chemical reaction engineering, cata-lyst engineering and science, and catalytic reactor engineering.
In this issue, articles related to: Advanced Mathematical Model to Describe the Production of Bio-diesel Process, Sur-face Modification, Characterization and Photocatlytic Performance of Nano-Sized Titania Modified with Silver and Bentonite Clay, Variability of Energy Dissipation and Shear Rate with Geometry in Unbaffled Surface Aerator, New Dynamic Analysis And System Identification Of Bio diesel Production Process From Palm Oil, and The role of Milling Time on the Absorption Behaviour of MgH2 Catalyzed by Fe are highlighted.
The BCREC journal is an online electronic journal. Visitors can read and download any full-text article for free of charge. The research article submitted to the BCREC journal will be peer-reviewed. Accepted research articles will be available online (free download) following the journal peer-reviewing process. Language used in this bulletin is Eng-lish or Indonesian, but English is preferable. Website address of BCREC is : http://bcrec.undip.ac.id/ Editor would like to appreciate all researchers, academicians, industrial practicioners focused on chemical reaction engineering and catalysis to contribute to this online journal. This journal is also planned to be a reputable interna-tional journal.
Dr. Istadi (Chief Editor) Chemical Reaction Engineering & Catalysis, Department of Chemical Engineering, Diponegoro University E-mail: [email protected]
PREFACE
Bulletin of Chemical Reaction Engineering & Catalysis, 4(2), 2009, iii
Copyright © 2009, BCREC, ISSN 1978-2993

TABLE OF CONTENTS
Bulletin of Chemical Reaction Engineering & Catalysis, 4(2), 2009, iv
1. Aims and Scope ……………………………………………………………………………………. (i)
2. Indexing and Abstracting …………………………………………………………………………(i)
3. Editorial Board ……………………………………………………………………………………..(ii)
4. Preface ……………………………………………………………………………………………… (iii)
5. Table of Content ………………………………………………………………………………….. (iv)
6. Advanced Mathematical Model to Describe the Production of Biodiesel Process (Ahmmed S. Ibrehem, and Hikmat S Al-Salim ) …...…………………………………………. ……... (37 - 42)
7. Surface Modification, Characterization and Photocatlytic Performance of Nano-Sized Titania Modified with Silver and Bentonite Clay (Neetu Divya, Ajay Bansal, Asim K. Jana ) …................................................................................................................................... 43 - 53)
8. Variability of Energy Dissipation and Shear Rate with Geometry in Unbaffled Surface Aera-tor (Bimlesh Kumar ) …………………………………………………………………….. (55 - 60)
9. New Dynamic Analysis And System Identification Of Bio diesel Production Process From Palm Oil (Ahmmed S. Ibrehem, and Hikmat S. Al-Salim ) ...……………………….. (61 - 68)
10. Pengaruh Lama Miling Terhadap Sifat Absorpsi Material Penyimpan Hidrogen MgH2 yang Dikatalisasi Dengan Fe (The Role of Milling Time on the Absorption Behaviour of MgH2 Catalyzed by Fe) (Mustanir, and Zulkarnain Jalil ) ...……………………………………... (69 - 72)
11. Author Guidelines …………………….……...…………………………..………….. (73 - 75)
12. Copyright Transfer Agreement ………………………………………………………….. (76 - 77)
13. Submission Information
Copyright © 2009, BCREC, ISSN 1978-2993

1. Introduction A new mathematical model was derived to de-
scribe production processes by the most active in-put variables inside batch reactor. The model was applied to a process of production of bio-diesel from vegetable oils. Production of bio diesel from vegeta-ble oils received a lot of attention and may be one day will become one of the most important renew-able energy sources for transport and household uses. Both Malaysia and Indonesia have recently started developing bio-diesel derived from vegeta-ble oils (Antaresti. et.al 2005) in large quantities using different sources for the oil. What makes bio diesel important is attributed to its chemical and physical properties which closely resemble those of
Advanced Mathematical Model To Describe The Production Of Biodiesel Process
Ahmmed S. Ibrehem *, Hikmat S. Al-Salim
Chemical & Petroleum Engineering Department, University of Sedaya, Kuala
Lumpur,50603, Malaysia
* Corresponding Author. E-mail: [email protected] Tel: +061-0149360913, Fax: +061-98-9985241
Bulletin of Chemical Reaction Engineering & Catalysis, 4(2), 2009, 37-42
Received: 12 August 2009, Revised: 15 October 2009; Accepted: 18 October 2009
Abstract Advanced mathematical model was used to capture the batch reactor characteristics of reacting compounds. The model was applied to batch reactor for the production of bio-diesel from palm and kapok oils. Results of the model were compared with experimental data in terms of conversion of transesterification reaction for the production of bio-diesel under unsteady state. A good agreement was obtained between our model predictions and the experimental data. Both experimental and modeling results showed that the conversion of triglycerides to methyl ester was affected by the process conditions. The transesterification process with temperature of about 70 oC, and methanol ratio to the triglyceride of about 5 times its stoichiometry, and the NAOH catalyst of wt 0.4%, appear to be acceptable process conditions for bio diesel process production from palm oil and kapok oil. The model can be applied for endothermic batch process. © 2009 BCREC UNDIP. All rights reserved. . Keywords: Mathematical model, Bio diesel. Vegetable oil, Catalytic reactor, Process production
diesel fuel. This has been documented by many authors (Clark et al., Mittelbach and Tritthart, 1988; Pakpahan 2001; Legowo E.,2001). The bio-diesel cetane number, energy content, viscosity and phase changes are similar to those of petroleum based diesel fuel, but is essentially sulfur free. Bio-diesel offers enhanced safety characteristics when compared to diesel fuel. It has a higher flash point and does not produce explosive air/fuel vapors. Generally bio-diesel fuel less toxic than petroleum fuel due to the absence of aromatics hydrocarbons. Bio-diesel is made by transesterification of triglyc-eride found in natural oils with methanol in the presence of a catalyst.
Transesterification of a vegetable oil was con-
Copyright © 2009, BCREC, ISSN 1978-2993
Available online at BCREC Website: http://bcrec.undip.ac.id

ducted as early as 1853 by scientists E. Duffy and J. Patrick, many years before the first diesel en-gine became functional. Rudolf Diesel's prime model, a single 10 ft (3 m) iron cylinder with a flywheel at its base, ran on its own power for the first time in Augsburg, Germany, on August 10, 1893.
In remembrance of this event, August 10 has been declared "International Biodiesel Day.The French Otto Company (at the request of the French government) demonstrated a Diesel en-gine running on peanut oil at the World Fair in Paris, France in 1900, where it received the Grand Prix (highest prize). This engine stood as an example of Diesel's vision because it was pow-ered by peanut oil a biofuel, though not biodiesel, since it was not transesterified. He believed that the utilization of biomass fuel was the real future of his engine. In a 1912 speech Diesel said, "the use of vegetable oils for engine fuels may seem insignificant today but such oils may become, in the course of time, as important as petroleum and the coal-tar products of the present time."
During the 1920s, diesel engine manufactur-ers altered their engines to utilize the lower vis-cosity of petrodiesel (a fossil fuel), rather than vegetable oil (a biomass fuel). The petroleum in-dustries were able to make inroads in fuel mar-kets because their fuel was much cheaper to pro-duce than the biomass alternatives. The result, for many years, was a near elimination of the bio-mass fuel production infrastructure. Only re-cently have environmental impact concerns and a decreasing price differential made biomass fuels such as biodiesel a growing alternative.
Despite the widespread use of fossil petro-leum-derived diesel fuels, interest in vegetable oils as fuels for internal combustion engines was reported in several countries during the 1920s and 1930s and later during World War II. Bel-gium, France, Italy, the United Kingdom, Portu-gal, Germany, Brazil, Argentina, Japan and China were reported to have tested and used vegetable oils as diesel fuels during this time. Some operational problems were reported due to the high viscosity of vegetable oils compared to petroleum diesel fuel, which results in poor at-omization of the fuel in the fuel spray and often leads to deposits and coking of the injectors, com-bustion chamber and valves. Attempts to over-come these problems included heating of the vege-table oil, blending it with petroleum-derived die-sel fuel or ethanol, pyrolysis and cracking of the oils.
On August 31, 1937, G. Chavanne of the Uni-versity of Brussels (Belgium) was granted a pat-
ent for a "Procedure for the transformation of vegetable oils for their uses as fuels" (fr. "Procédé de Transformation d’Huiles Végétales en Vue de Leur Utilisation comme Carburants") Belgian Patent 422,877. This patent described the alco-holysis (often referred to as transesterification) of vegetable oils using ethanol (and mentions methanol) in order to separate the fatty acids from the glycerol by replacing the glycerol with short linear alcohols. This appears to be the first account of the production of what is known as "biodiesel" today.
More recently, in 1977, Brazilian scientist Ex-pedito Parente invented and submitted for patent, the first industrial process for the production of biodiesel. This process is classified as biodiesel by international norms, conferring a "standardized identity and quality. No other proposed biofuel has been validated by the motor industry." Cur-rently, Parente's company Tecbio is working with Boeing and NASA to certify bioquerosene (bio-kerosene), another product produced and pat-ented by the Brazilian scientist.
Research into the use of transesterified sun-flower oil, and refining it to diesel fuel standards, was initiated in South Africa in 1979. By 1983, the process for producing fuel-quality, engine-tested biodiesel was completed and published in-ternationally. An Austrian company, Gaskoks, obtained the technology from the South African Agricultural Engineers; the company erected the first biodiesel pilot plant in November 1987, and the first industrial-scale plant in April 1989 (with a capacity of 30,000 tons of rapeseed per annum).
Throughout the 1990s, plants were opened in many European countries, including the Czech Republic, Germany and Sweden. France launched local production of biodiesel fuel (referred to as diester) from rapeseed oil, which is mixed into regular diesel fuel at a level of 5%, and into the diesel fuel used by some captive fleets (e.g. public transportation) at a level of 30%. Renault, Peu-geot and other manufacturers have certified truck engines for use with up to that level of partial bio-diesel; experiments with 50% biodiesel are under-way. During the same period, nations in other parts of the world also saw local production of bio-diesel starting up: by 1998, the Austrian Biofuels Institute had identified 21 countries with com-mercial biodiesel projects. 100% Biodiesel is now available at many normal service stations across Europe.
In September 2005 Minnesota became the first U.S. state to mandate that all diesel fuel sold in the state contain part biodiesel, requiring a content of at least 2% biodiesel. In 2008, ASTM
Bulletin of Chemical Reaction Engineering & Catalysis, 4(2), 2009, 38
Copyright © 2009, BCREC, ISSN 1978-2993

published new Biodiesel Blend Specifications Standards.
In 2005 Gaia Franceschini and Sandro Mac-chietto derived model-based experiment design techniques for bio-diesel process based on experi-mental data only, while Dunn, R.O. 2008 derived a mathematical model to calculate the tempera-ture effects on the system. The two models did not include the effect of catalysts and concentration of reactants unlike our model which takes into it all variables such as temperature, concentration of reactants, and catalyst. New mathematical model calculates the effects of concentrations of triglyc-erides, methanol, catalyst weight percent and temperature of reaction on the percent of conver-sion.
Designing a complete mathematical model of the system by using computer software such as MATLAB is developed based on experimental work by the Antaresti et.al. (2005) at various con-ditions. The system is simulated and compared between new model predictions and the experi-mental data
2. Methodology
A mathematical model was applied to Antar-esti. et.al experimental work which deals with the relationship between rate coefficient (k) of the reaction with weight percent of NaOH as a cata-lyst (cat). A numerical polynomial relationship depending on experimental results was developed in our model by using version seven MATLAB software to give high accuracy (more than 99%) in calculating the rate coefficient (k) of the reaction which makes it suitable to use in calculating the rate of reaction (rA), mass balance (CA) and (CB) for the reactor, as well as energy balance (Treact) for reactor and the jacket (Tjacket) as shown in Fig-ure (1). The estimation of the reactor model pa-rameters are given in Table (1). The relationship between rate coefficients of the reaction with weight percent of NaOH as a catalyst is given by:
(1) Reactor mole balances for triglycerides (A) in vol-ume (v):
Mole in – Mole out + Generation = Rate of ac-cumulation of mass
(2)
Reactor mole balance for methanol (B) in volume (v):
Mole in – Mole out + Generation = Rate of accu-mulation of mass
(3)
Reactor Energy Balance: Energy in – Energy out + Energy generated - En-ergy observed = Rate of accumulation
(4)
Jacket Energy Balance: Energy in – Energy out + Energy generated = Rate of accumulation
(5)
3. Results and Discussion Figures (2-4) show the results of our model
along with (Antaresti et. al, 2005) results. The comparison between the results of the model pre-sented in this work with the actual experimental data (Antaresti. et.al, 2005) is made and shown in Figures (2) to (4) for the system of triglycerides conversion for different catalyst weight percent. Meanwhile, Figures (5) to (7) show the effects dif-ferent weight ratio of methanol (MET) to triglyc-erides (TRI) on triglycerides conversion. Figures (8) and (9) show the effects different concentra-tion step changes of TRI on the temperature of reaction with the time and different weight per-
Bulletin of Chemical Reaction Engineering & Catalysis, 4(2), 2009, 39
Copyright © 2009, BCREC, ISSN 1978-2993
0065714.003952.0011905.0101562.4 2316
++−×= −
catcatcatk
dtdCvvr A
A =−− 00 BAA CkC
dtdC
−=
dtdCvvr B
A =−−00 BAB CkC
dtdC
−=
dtdT
VCHVrTTUA reactpAreactjacket ρ=∆+−+− )()(00
dtdTHVCkCTTUA BAreactjacket =∆−− )()(
p
BAreactjacket
VCHVCkCTTUA
dtdT
ρ)]()([ ∆−−
=
dtdT
CVTTUA
TCFTCF
jacketpcccreactorjacket
coutpccccinpccc
ρ
ρρ
=−
−−
)(

cent of catalyst step change on the concentration of TRI with the time respectively. Once again
there is a good agreement between the new model and the actual experimental data.
Bulletin of Chemical Reaction Engineering & Catalysis, 4(2), 2009, 40
Copyright © 2009, BCREC, ISSN 1978-2993
Figure 2. Effect of time on the transesterification process of vegetable oil for different percentage of weight catalyst.
0 10 20 30 40 50 600
10
20
30
40
50
60
70
80
Time,(min)
Trig
lyce
ride
conv
ersi
on %
Exp data for 0.1% catalystData predicted for 0.1% catalystExp data for 0.2% catalytstData predicted for 0.2% catalystExp data for 0.5% catalytstData predicted for 0.5% catalyst

Bulletin of Chemical Reaction Engineering & Catalysis, 4(2), 2009, 41
Copyright © 2009, BCREC, ISSN 1978-2993
Figure 3. Effect of time on the transesterification process of vegetable oil for different ratio of MET/ TRI stoichiometry.
Figure 4. Effect of concentration step change of TRI on the temperature of reaction with the time (concentration of TRI=2 kmol/m3 from time=0 min until 14 min then concentration of TRI=0.5 kmol/m3 at time 14.5 min)
0 10 20 30 40 50 600
10
20
30
40
50
60
70
80
90
Time,(min)
Trig
lyce
ride
conv
ersi
on %
Exp data for 1 ratio MET/TRIData predicted for 1 ratio MET/TRIExp data for 3 ratio MET/TRData predicted for 3 ratio MET/TRIExp data for 5 ratio MET/TRData predicted for 5 ratio MET/TRI
0 10 20 30 40 50 60320
325
330
335
340
345
350
355
360
365
Time (min)
Tem
pera
ture
k
0 10 20 30 40 50 600.75
0.8
0.85
0.9
0.95
1
Time (min)
Con
cent
ratio
n m
ol/m
3
Figure 5. Effect of weight percent of catalyst step change on the concentration of TRI with the time (weight percent of catalyst =0.5 from time=0 min until 15 min then weight percent of catalyst =0.1 at time 14 min).
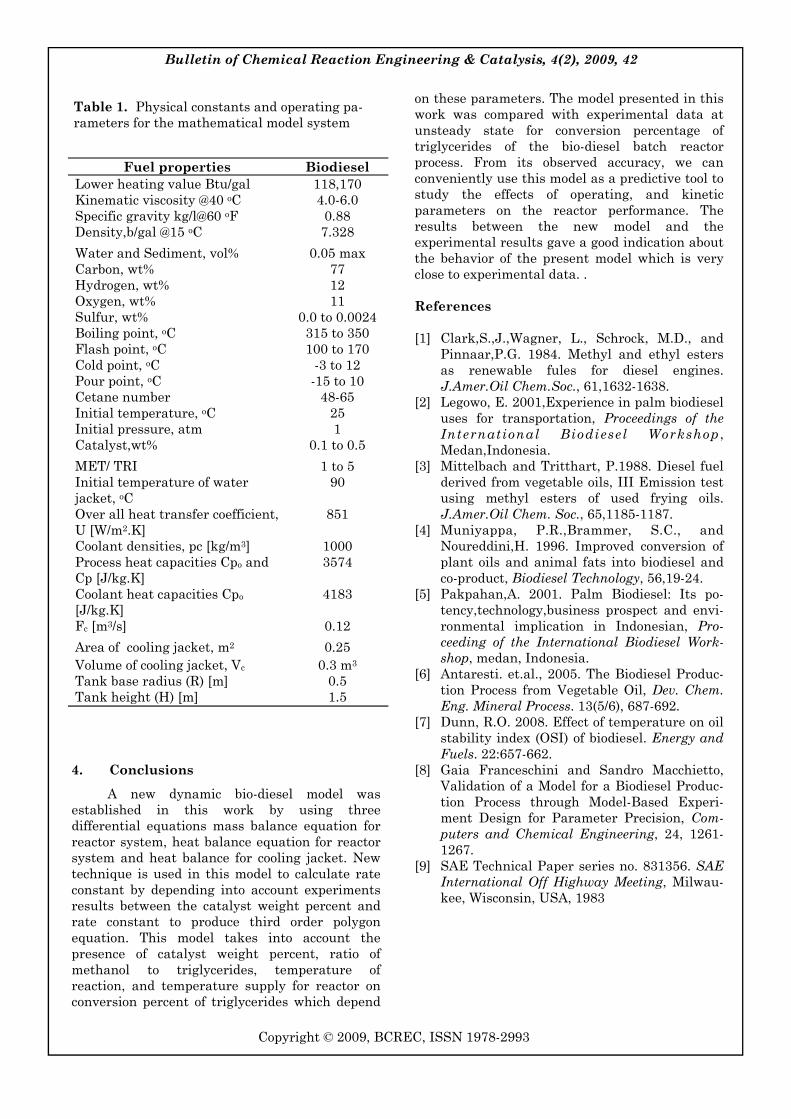
4. Conclusions
A new dynamic bio-diesel model was established in this work by using three differential equations mass balance equation for reactor system, heat balance equation for reactor system and heat balance for cooling jacket. New technique is used in this model to calculate rate constant by depending into account experiments results between the catalyst weight percent and rate constant to produce third order polygon equation. This model takes into account the presence of catalyst weight percent, ratio of methanol to triglycerides, temperature of reaction, and temperature supply for reactor on conversion percent of triglycerides which depend
on these parameters. The model presented in this work was compared with experimental data at unsteady state for conversion percentage of triglycerides of the bio-diesel batch reactor process. From its observed accuracy, we can conveniently use this model as a predictive tool to study the effects of operating, and kinetic parameters on the reactor performance. The results between the new model and the experimental results gave a good indication about the behavior of the present model which is very close to experimental data. .
References [1] Clark,S.,J.,Wagner, L., Schrock, M.D., and
Pinnaar,P.G. 1984. Methyl and ethyl esters as renewable fules for diesel engines. J.Amer.Oil Chem.Soc., 61,1632-1638.
[2] Legowo, E. 2001,Experience in palm biodiesel uses for transportation, Proceedings of the International Biodiesel Workshop , Medan,Indonesia.
[3] Mittelbach and Tritthart, P.1988. Diesel fuel derived from vegetable oils, III Emission test using methyl esters of used frying oils. J.Amer.Oil Chem. Soc., 65,1185-1187.
[4] Muniyappa, P.R.,Brammer, S.C., and Noureddini,H. 1996. Improved conversion of plant oils and animal fats into biodiesel and co-product, Biodiesel Technology, 56,19-24.
[5] Pakpahan,A. 2001. Palm Biodiesel: Its po-tency,technology,business prospect and envi-ronmental implication in Indonesian, Pro-ceeding of the International Biodiesel Work-shop, medan, Indonesia.
[6] Antaresti. et.al., 2005. The Biodiesel Produc-tion Process from Vegetable Oil, Dev. Chem. Eng. Mineral Process. 13(5/6), 687-692.
[7] Dunn, R.O. 2008. Effect of temperature on oil stability index (OSI) of biodiesel. Energy and Fuels. 22:657-662.
[8] Gaia Franceschini and Sandro Macchietto, Validation of a Model for a Biodiesel Produc-tion Process through Model-Based Experi-ment Design for Parameter Precision, Com-puters and Chemical Engineering, 24, 1261-1267.
[9] SAE Technical Paper series no. 831356. SAE International Off Highway Meeting, Milwau-kee, Wisconsin, USA, 1983
Bulletin of Chemical Reaction Engineering & Catalysis, 4(2), 2009, 42
Copyright © 2009, BCREC, ISSN 1978-2993
Table 1. Physical constants and operating pa-rameters for the mathematical model system
Fuel properties Biodiesel Lower heating value Btu/gal 118,170 Kinematic viscosity @40 oC 4.0-6.0 Specific gravity kg/l@60 oF 0.88 Density,b/gal @15 oC 7.328 Water and Sediment, vol% 0.05 max Carbon, wt% 77 Hydrogen, wt% 12 Oxygen, wt% 11 Sulfur, wt% 0.0 to 0.0024 Boiling point, oC 315 to 350 Flash point, oC 100 to 170 Cold point, oC -3 to 12 Pour point, oC -15 to 10 Cetane number 48-65 Initial temperature, oC 25 Initial pressure, atm 1 Catalyst,wt% 0.1 to 0.5 MET/ TRI 1 to 5 Initial temperature of water jacket, oC
90
Over all heat transfer coefficient, U [W/m2.K]
851
Coolant densities, pc [kg/m3] 1000 Process heat capacities Cpo and Cp [J/kg.K]
3574
Coolant heat capacities Cpo [J/kg.K]
4183
Fc [m3/s] 0.12 Area of cooling jacket, m2 0.25 Volume of cooling jacket, Vc 0.3 m3 Tank base radius (R) [m] 0.5 Tank height (H) [m] 1.5
1. Introduction In many textile industries dyes are used as col-
oring agents and large amount of water is con-sumed between 25-250 m3 per ton of product de-pending on the operating processes [1].The effluent comes from these industries containing a large amount of organic compounds, that raises environ-
Surface Modification, Characterization and Photocatlytic Performance of Nano-Sized Titania modified with Silver and
Bentonite clay
Neetu Divya11, Ajay Bansal1*, and Asim K Jana 2
1 Department of Chemical Engineering National Institute of Technology, Jalandhar, 1440011, Punjab, INDIA
2 Department of Biotechnology National Institute of Technology, Jalandhar, 1440011, Punjab, INDIA
* Corresponding Author, E-mail: E-mail: [email protected] Tel: +91-181-2690301; Fax: +91-181-2690320.
Bulletin of Chemical Reaction Engineering & Catalysis, 4(2), 2009, 43-53
Received: 30 October 2009, Revised: 20 November 2009, Accepted: 21 November 2009
Abstract
In many textile industries dyes are used as coloring agents. Advanced oxidation processes are used for de-grading or removing color from dye baths. Catalysts play a key role in these industries for the treatment of water. Solid catalysts are usually composed of metals that form supports onto the surface and create metal particles with high surface areas. TiO2 composites containing transition metal ions (silver) and/or bentonite clay were prepared. Photocatalytic efficiencies have been investigated for the degradation of Orange G an azo dye. Various analytical techniques were used to characterize the surface properties of nano-sized tita-nia modified using silver and/or bentonite clay. Scanning electron microscopy (SEM), Transmission electron microscopy (TEM), X-ray diffraction (XRD) and FTIR analyses showed that TiO2 (10 ± 2 nm) and Ag (2 to 3 nm) particles were supported on the surface of the bentonite clay and the size was in the range of 100 ± 2 nm. The modified catalysts P-25 TiO2/Bentonite/Ag and P-25 TiO2/Ag were found to be very active for the photocatalytic decomposition of Orange G. The percent decolorization in 60 min was 98% with both P-25 TiO2/Ag and P-25 TiO2/Bentonite/Ag modified catalysts. Whereas mineralization achieved in 9 hr were 68% and 71% with P-25 TiO2/Bentonite/Ag and P-25 TiO2/Ag catalyst respectively. © 2009 BCREC. All rights reserved. . Keywords: Decolorization; Mineralization; Orange G; Nano-composite catalyst; Catalyst-characterization
mental concerns. Advanced oxidation processes are used for degrading and removing color from dye baths. The treated water can be reused. Photocata-lytic reaction using semiconductors in the powder form can effectively degrade many organic pollut-ants, and even makes the compounds completely mineralized. Modifying the properties of one mate-
Copyright © 2009, BCREC, ISSN 1978-2993
Available online at BCREC Website: http://bcrec.undip.ac.id

rial by doping it with another type of material seems to be a popular approach [2, 3, 4, 5, 6].
Menesi et al. [2] prepared montmorillonite-TiO2 composites containing various transition metal ions (silver, copper, or nickel). Photocata-lytic efficiencies of composite catalysts were tested and found more efficient for the degrada-tion of ethanol under UV-C (λ = 254 nm) than in visible light. Furthermore, these samples contain-ing silver or copper ions were, in each case, about twice more efficient than P-25 TiO2 (Degussa AG) used as a reference. In photooxidation by visible light, TiO2/clay samples doped with silver or cop-per were also more efficient.
Li et al. [4] used the TiO2 pillared bentonite catalyst to degrade 2,4-dichlorophenol and Or-ange II under UV light irradiation. It was found that the color and COD removal of the organic compound by P-25 TiO2, Ti-pillared bentonite SCD (super critical drying) and Ti- pillared ben-tonite catalyst indicating that the degradation rate of the pollutant by P-25 TiO2 was the fastest, while the photocatalytic efficiency of Ti-pilb. SCD was much better than that of Ti- pillared ben-tonite for this degradation under UV irradiation. Although the catalytic activity of Ti- pillared ben-tonite SCD was slightly lower than that of P-25 TiO2.
Sun et al. [5] prepared titanium dioxide/bentonite clay nano-composite by acid-catalyzed sol–gel method for the cationic azo dye decomposi-tion under UV irradiations. They observed that the doping metal ions can also be delivered to the surface of the support by ion exchange and sig-nificantly altered the optical characteristics of the TiO2/clay composite.
Zhao et al. [7] coated nano-sized titanium diox-ide (TiO2) crystal particles onto the surface of pa-lygorskite fibrous clay which had been modified by silver ions and apply various analytical tech-niques (TEM, XRD and XPS) to characterize the surface properties of titanium dioxide particles on the palygorskite. TiO2 particles were supported on the surface of the palygorskite clays and found that their size was in the range of 3–6 nm. The titanium oxide coatings were found to be very ac-tive for the photocatalytic decomposition of me-thylene blue.
Arabatzis et al. [8] prepared silver modified titanium dioxide thin film to degrade methyl Or-ange. Doctor-blade procedure was used for the film preparation. It was found that the silver modified titanium dioxide thin film enhanced photocatalytic efficiency and degraded the organic pollutant three-times faster than the undoped original films (Degussa P-25). It was concluded
that the enhancement is attributed to the action of Ag+ cations, which attract the conduction band photoelectrons and prevent electron–hole recom-bination.
Bentonite is colloidal, alumino-silicate clay derived from weathered volcanic ash and largely composed of montmorillonite. It consists of an ag-gregate of flat platelets, has a high specific sur-face area, high plasticity, non-toxic and expands when wet. If used in combination with nano-sized titania makes it easier to separate the titania based photocatalysts [6].
It is therefore interesting to investigate the photocatalytic activity of composite photocatalysts comprising of Ag, titania and bentonite. Keeping this in view catalysts such as P-25 TiO2, P-25 TiO2/Bentonite, P-25 TiO2/Bentonite/Ag and P-25 TiO2/Ag were prepared. The catalysts thus formed were used for the photocatalytic degradation of OG. The catalysts have also been characterization to record the surface modifications
2. Materials and Methods
2.1 Chemicals The azo dye Orange G (OG) 90%, H2O2 (30% w/
v), HCl (34%), Sodium hydroxide pellets purified (NaOH), ethanol (99.9%), HNO3 (60-70%), ferrous ammonium sulphate (NH3(FeSO4)2.6H2O), potas-sium dichromate (K2Cr2O7), silver sulphate (AgSO4), mercury sulphate (HgSO4), ferroin indi-cator, Sulphuric acid (H2SO4) were all purchased from S. D. Fine Chemicals Limited, Mumbai, In-dia. AgNO3 reagent used for catalyst modification was purchased from Qualigens Fine Chemicals Limited, Mumbai, India. P-25 TiO2 (80% anatase, 20% rutile) with a specific surface of 50 m2/g, was purchased from Evonic (Degussa), Germany. They were used without any further treatment.
2.2 Preparation of catalyst composite 2.2.1. P-25 TiO2/Ag catalyst
Modification of catalyst was done using im-
pregnation method. Impregnation occurs when metal attached to the oxides. The titania based photocatalyst employed was commercial titanium dioxide powder (Degussa P-25) with a BET surfa-ce area of 50 m2/g and an average particle size of 10 ± 2 nm. Metal ion doped TiO2 (Degussa P-25) was prepared using the following procedure. The doping was done using transition metal salt Ag-NO3. 0.3120 g of AgNO3 was dissolved in 30 ml of distilled water in a porcelain bowl. 7.9105 g of
Bulletin of Chemical Reaction Engineering & Catalysis, 4(2), 2009, 44
Copyright © 2009, BCREC, ISSN 1978-2993

TiO2 was then added to the solution. The solution was stirred well and was allowed to stand for 24 hr. The contents were heated at 100 ± 5 oC to eva-porate all the water. The dried solids were first ground and then calcined at 400 oC for 6 hr in a muffle furnace.
2.2.2. P-25 TiO2/Bentonite catalyst
For the preparation of P-25 TiO2/Bentonite ca-talyst acid- catalyzed sol-gel process was used. In a porcelain bowl 3 g of P-25 TiO2 was mixed with 33 ml of ethanol and stand for 2 hr under continuous stirring. Then 1M HNO3 was added drop wise un-der continuous stirring. 3 g bentonite clay satura-ted with water for half an hour was then mixed with P-25 TiO2 solution and live for 2 hr under con-tinuous stirring. The solution was stirred well and was allowed to stand for 24 hr (maturation period). The contents were heated at 100 ± 5 oC to evapora-te all the water. The dried solids were first ground and then calcined at 500 oC for 3 hr in a muffle fur-nace. The scheme for preparation of composites catalyst was suggested in Figure 1.
2.2.3. P-25 TiO2/Bentonite/Ag catalyst P-25 TiO2/Bentonite/Ag catalyst was prepared
by following procedure. In a porcelain bowl trans-parent solution of 0.5 g AgNO3 was prepared and 10 ml ethanol was added drop wise. 3 g P-25 TiO2 and 20 ml 1M HNO3 (dropwise) was mixed simul-taneously in AgNO3 and ethanol mixture under continuous stirring. 3 g bentonite was added. The rest of the procedure was same as that for P-25 TiO2/Bentonite catalyst. For different concentra-
Bulletin of Chemical Reaction Engineering & Catalysis, 4(2), 2009, 45
tion of AgNO3 similarly method was used. The composites preparation scheme was proposed in Figure 1.
2.3. Photocatalytic degradation of azo dye Spectrophotometer was used for the measure-
ment of decolorization. A calibration plot based on Beer–Lambert’s law was established by relating the absorbance to the concentration. The measure-ment of maximum absorbance was taken for Oran-ge G was 490 nm. The degradation studies are re-ported as ‘η’ called photodegradation efficiency and was discussed in previous article [10].
Chemical Oxygen Demand (COD) of the treated sample was measured by the dichromate titration method (APHA). The efficiency of dye mineraliza-tion was estimated using the following expressions
[11]: (1)
Where CODt correspond to time t and CODi
correspond to initial conditions. Eutech pH/lon 510, pH meter was used for the measurement of pH of solution.
Stock solution of the dye (1000 ppm) was prepa-red with double distilled water from which working solution (50 ppm) was prepared. Then solution pH value was adjusted to 3 using 0.1 N NaOH and 0.1N HCl. For homogeneous photocatalytic degra-dation, twenty milliliters of the working solution of the dye (50 ppm) was taken in a beaker then H2O2 was added. The zero time reading was taken and the solution was then subjected to irradiation. Ali-quots were taken at regular intervals to analyze the percent degradation of the dye. In case of hete-rogeneous photocatalysts, TiO2 based catalyst was added along with H2O2.The solution was then sub-jected for continuous stirring for 60 min in dark and the rest of the procedure was same as that for homogeneous photocatalysis. The decolorization and mineralization studies were carried out under pre-optimized conditions discussed elsewhere [10].
3. Results and Discussion
3.1. Decolorization The degradation of OG was investigated with
different combination of P-25 TiO2, bentonite and silver metal ion. The amount of silver metal ion was varied from 0.3120 to 0.9360 g for doping. Whereas the amount of bentonite considered was 1
Copyright © 2009, BCREC, ISSN 1978-2993
Figure 1. Schematic diagram for preparation of P-25 TiO2/Bentonite/Ag composites
COD% 1 100COD
t
i
Mineralization⎛ ⎞
= − ×⎜ ⎟⎝ ⎠

and 3 g. The developed modified catalyst-combinations are P-25 TiO2/Bentonite, P-25 TiO2/Bentonite/Ag, and P-25 TiO2/Ag. The decoloriza-tion of OG under 60 min UV irradiation was ob-served as 96%, 95%, 98% and 98% for P-25 TiO2, P-25 TiO2/Bentonite, P-25 TiO2/Bentonite/Ag and P-25 TiO2/Ag catalysts respectively [Figure 2].
The doses of Ag were varied to find out the op-timum dose of Ag. As such Ag was varied from 0.312 g to 0.936 g. The decolorization efficiencies under 60 min UV irradiation were observed 82%, 98%, 88% and 86% for P-25 TiO2/Bentonite/Ag 0.312 g, P-25 TiO2/Bentonite/Ag 0.5 g, P-25 TiO2/Bentonite/Ag 0.624 g and P-25 TiO2/Bentonite/Ag 0.936 g catalysts, respectively [Figure 3].
With an increase in Ag concentration the de-colorization efficiency increased up to 0.5 g Ag but above it the efficiency decreased. Probably it hap-pened due to shading of the available photocata-lyst surface (i.e. P-25 TiO2 and Bentonite) by the silver layer [8].
The decolorization efficiency using P-25 TiO2/Bentonite was 95%, which was a little less than 96% that was obtained with the catalyst with out bentonite (i.e. P-25 TiO2). It could be for the rea-son that some of the photoactive surface of P-25 TiO2 particles might not be exposed to radiations as TiO2 particles might have been trapped be-tween bentonite layers [Figure 2.]. It was, how-ever found that the combination of P-25 TiO2/bentonite/Ag and P-25 TiO2/Ag catalyst efficiently decolorized OG to 98% [Tables 1 and 2].
3.2. Mineralization For the mineralization studies percent COD
removal was recorded at different time intervals. The mineralization efficiency was observed to be 56%, 35%, 68% and 71% with P-25 TiO2, P-25 TiO2/Bentonite, P-25 TiO2/Bentonite/Ag and P-25 TiO2/Ag catalysts, respectively [Figure 4.]. Fur-ther with variation of silver ion doses the COD removal was observed as 33%, 68%, 13% and 25% for P-25 TiO2/Bentonite/Ag 0.312 g, P-25 TiO2/Bentonite/Ag 0.5 g, P-25 TiO2/Bentonite/Ag 0.624 g and P-25 TiO2/Bentonite/Ag 0.936 g catalysts, respectively [Figure 5.].The results show that the P-25 TiO2/Ag catalyst resulted in better minerali-zation efficiency in terms of COD removal when compared with the other combinations of photo-catalysts [Figure 4.]. However, where the separa-tion of catalysts from process solution is critical and economic factor (inexpensive catalysts) is
Bulletin of Chemical Reaction Engineering & Catalysis, 4(2), 2009, 46
Figure 2. Percent decolorization of OG with dif-ferent modified catalysts
Copyright © 2009, BCREC, ISSN 1978-2993
0 10 20 30 40 50 60 700
10
20
30
40
50
60
70
80
90
100
% D
ecol
oriz
atio
n Ef
ficie
ncy
t,min
P-25 TiO2 P-25 TiO2/Bentonite P-25 TiO2/Bentonite 3g/Ag 0.5g P-25 TiO2/Ag 0.3120g
0 10 20 30 40 50 60 700
10
20
30
40
50
60
70
80
90
100
% D
ecol
oriz
atio
n ef
ficie
ncy
t,min
P-25 TiO2/Bentonite 3g/Ag 0.5g P-25 TiO2/Bentonite 1g/Ag 0.3120g P-25 TiO2/Bentonite 1g/Ag 0.6240g P-25 TiO2/Bentonite 1g/Ag 0.9360g
Figure 3. Percent decolorization of OG with dif-ferent modified catalysts with different doses of Ag
Table 1. Percent decolorization of OG with dif-ferent modified catalysts
Catalysts Catalysts composi-tions, g
% Decol-orization efficiency (60 min)
% Miner-alization efficiency
(9 hr)
P-25 TiO2 Pure 96 56
P-25 TiO2/Bentonite 3:3 95 35
P-25 TiO2/Bentonite
/Ag 0.5 g 3:3:0.5 98 68
P-25 TiO2/Ag 7.1905: 0.312 98 71

more important then P-25 TiO2/Bentonite/Ag 0.5 g modified catalysts can be considered as an alterna-tive to P-25 TiO2/Ag photocatalyst.
3.3 Catalysts Characterization
3.3.1 SEM analysis The structures of P-25 TiO2, P-25 TiO2/
Bentonite,P-25 TiO2/Bentonite/Ag, P-25 TiO2/Ag were observed by scanning electron microscope JSM 6100 ( JEOL) operated at 20 kV at SAIF, Pan-
Bulletin of Chemical Reaction Engineering & Catalysis, 4(2), 2009, 47
jab University, Chandigarh. The observed struc-tures of catalysts are shown in Figure 6. Scattered clusters of P-25 TiO2 at x25000 magnification were observed as shown in Figure 6a. The SEM picture, Figure 6b, for bentonite at x30000 magnification showed layered structure of bentonite. SEM pic-ture, Figure 6c, at x4300 magnification, corre-sponding to modified catalysts of P-25 TiO2/Bentonite clearly shows the deposition of TiO2 par-ticles on bentonite. Whereas, Fig 6d. corresponding to P-25 TiO2/Bentonite/Ag at x4000 magnification shows the Ag and P-25 TiO2 particles on the sur-face of bentonite. Similarly, Figure 6e indicates Ag particles deposition on P-25 TiO2 at x25000 magni-fication . However, SEM micrographs shown in Figure 6 (a, b, c, d, e) do not clearly display the par-ticle size of modified catalyst. For observing the size of fine particles of silver, TiO2 and bentonite the TEM analysis of the modified catalysts was performed.
3.3.2 TEM analysis
The catalysts morphology was analyzed using transmission electron microscope. The particle size of P-25 TiO2, P-25 TiO2/Bentonite, P-25 TiO2/Bentonite/Ag and P-25 TiO2/Ag catalysts were ana-lyzed by transmission electron microscope operated at 100 kV. Transmission electron microscopy (TEM) has the advantage of giving a real space image for the distribution of particles, their surface and shape. Samples were placed onto a carbon-coated copper grid having 400 holes. The sample
Copyright © 2009, BCREC, ISSN 1978-2993
Table 2. Decolorization and Mineralization effi-ciency of P-25 TiO2/Bentonite/Ag modified cata-lysts with different doses of silver salt
Catalysts Catalysts composi-tions, g
% Decol-orization efficiency (60min)
% Miner-alization efficiency
(9 hr) P-25
TiO2/Bentonite/Ag 0.5 g
3:3:0.5
98
68
P-25 TiO2/Bentonite/Ag 0.312 g
3:1:0.312
82
33
P-25 TiO2/Bentonite/Ag 0.624 g
3:1:0.624
88
13
P-25 TiO2/Bentonite/Ag 0.936 g
3:1:0.936
86
25
0 60 120 180 240 300 360 420 480 540 6000
10
20
30
40
50
60
70
80
90
100
% C
OD
Rem
oval
t,min
P-25 TiO2 P-25 TiO2/Bentonite P-25 TiO2/Ag 0.3120g P-25 TiO2/Bentonite 3g/Ag 0.5g
Figure 4. Percent COD Removal of OG with dif-ferent modified catalysts
0 60 120 180 240 300 360 420 480 540 6000
10
20
30
40
50
60
70
80
90
100
% C
OD
Rem
oval
t,min
P-25 TiO2/Bentonite 1g/Ag 0.3120g P-25 TiO2/Bentonite 1g/Ag 0.6240g P-25 TiO2/Bentonite 1g/Ag 0.9360g P-25 TiO2/Bentonite 3g/Ag 0.5g
Figure 5. Percent COD Removal of OG [Modified P-25 with Bentonite and different doses of Ag

was analyzed to see the particles that remained adhered to the grid. The TEM studies were per-formed using a Hitachi 7500 at SAIF, Panjab Uni-versity, Chandigarh. It was observed that the mean particle sizes were as P-25 TiO2 10 ± 2 nm [Figure 7a. at x300000], Bentonite 100 ± 2 nm [Figure 7b. at x120000], deposited Ag particle size
Bulletin of Chemical Reaction Engineering & Catalysis, 4(2), 2009, 48
1 to 2 nm at direct magnification [Figure 7d. at x500000]. These images clearly indicated that a modified silver doped titania based clay photocata-lyst of nano-size was obtained. Nano-sized particles are well known to exhibit different physical and chemical properties than bulk materials. When
Copyright © 2009, BCREC, ISSN 1978-2993
Figure 6. SEM analysis of (a) P-25 TiO2 (b) Bentonite (c) P-25 TiO2/Bentonite (d)P-25 TiO2/Bentonite/Ag (e) P-25 TiO2/Ag
(a) (b)
(c) (d)
(e)

nano-sized particles are used as catalyst, catalytic activity is expected to be enhanced due to the in-creased surface area. It was confirmed that silver is present in/on the bentonite and that the crystal structures of the bentonite and P-25 TiO2 were not changed by the silver doping.
3.3.3 XRD analysis The phase composition of photocatalyst was
studied using powder XRD technique. The patterns were recorded on an Philips PW-1710 X-ray diffrac-
Bulletin of Chemical Reaction Engineering & Catalysis, 4(2), 2009, 49
tometer using Cu-Kα (1.54060 Å) radiation at SAIF, Panjab University, Chandigarh. Diffraction patterns were taken over the 2θ range 20–100°. The crystallite size is determined from XRD pat-tern, using Sherrer formula t = (0.9λ/β cos θ), where t is in nm, λ the wavelength of X-ray in Å (1.54060 Å), β full width half maxima (FWHM) in radians and θ is the Bragg angle. Based on the full width half maxima of X-ray diffraction pattern, the mean crystallite size is estimated to be 10 ± 2 nm. The commercial catalyst (Degussa P-25 TiO2) used in the present study was pure anatase phase
Copyright © 2009, BCREC, ISSN 1978-2993
Figure 7. TEM analysis of (a) P-25 TiO2 (b) Bentonite (c) P-25 TiO2/Bentonite (d)P-25 TiO2/Bentonite/Ag
(a) (b)
(c) (d)

[Figure 8]. The results show that no phase change was observed and even the modified bentonite clay photocatalytic had TiO2 mainly in anatase form. The XRD spectrum of P-25 TiO2/Ag showed no sig-nificant differences from that of the P-25 TiO2, ex-cept the intensity of the basal plane peak are smaller than seen for the P-25 TiO2. Since the con-centration of silver in the P-25 TiO2/Ag sample is very low (0.3120 g) characteristic Ag peaks were not seen. This implies that the crystal structure of P-25 TiO2 was not changed by the silver ion.
The reflection at dA=0.3526 nm characteristic of anatase, was observed at 2θ=25.24°. According to JCPDS 21-1272, anatase presents the following diffraction pattern: a major intensity signal associ-ated with the reflection (110) located at2θ=25.28° (relative intensity 100%), as well as other impor-tant signals at 37.8° (20%), 48.05° (35%), 53.89° (20%), 55.06° (20%), and 62.69° (14%) were ob-served [7]. All these signals were present in our modified catalysts. Thus the XRD spectra con-firmed the crystalline nature of the titanium diox-ide and modified catalysts, with anatase being the main crystalline phase present.
3.3.4 FTIR analysis
FTIR is most useful for identifying chemicals that are either organic or inorganic. It can be util-ized to quantify some components of an unknown mixture. FTIR studies of modified catalysts were
Bulletin of Chemical Reaction Engineering & Catalysis, 4(2), 2009, 50
carried out in the 450–4000 cm−1 frequency range, in the transmission, mode using Perkin-Elmer-Spectrum RX-I (SAIF, Panjab University, Chandi-garh) [Figure 9].
Peaks of 3427.2 cm-1 3447.7 cm-1, 3407.2 cm-1, 3432.4 cm-1 and 3449.4 cm-1 wavenumbers are pre-sent in P-25 TiO2, betonite, P-25 TiO2/betonite, P-25 TiO2/betonite/Ag and P-25 TiO2/Ag catalysts respectively fall in the region 3550–3450 cm-1 and conform that the OH stretch functional group was present in the calatysts. If the peaks occur between 3670 and 3550 cm-1, the compound probably con-tains a non-hydrogen-bonded hydroxyl group. For wavenumbers 3400–3200 cm-1 and 3550–3450 cm-1
regions, the compound contains the normal ‘‘polymeric’’ OH stretch and dimeric OH stretch bend, often an alcohol or phenol with a sterically hindered OH group. This spectral feature is also exhibited by certain inorganics and minerals, and is indicative of a “free” OH group, either on the surface, or embedded within a crystal lattice, and free from interactions with other ions or groups [12]. 3621.3 cm-1 peak of bentonite in the 3670-3550 cm-1 range confirms this type of OH functional group.
Molecules containing NO2 groups, such as nitro compounds, nitrates, and nitramines, commonly exhibit asymmetric and symmetric stretching vi-brations of the NO2 group at 1660 to 1500 cm–1 re-gion. Peaks of 1635.7 cm–1, 1638.3 cm–1, 1631.2 cm–
1, 1630.5 cm–1 and 1625.8 cm–1 are present in P-25 TiO2, bentonite, P-25 TiO2/bentonite, P-25 TiO2/bentonite/Ag and P-25 TiO2/Ag modified catalysts found in the region of 1660 to 1500 cm–1, respec-tively, which conform the presence of NO2 group. Silicon-oxy absorptions occur within a crowded and highly overlapped region of the spectrum, mainly between 1350 and 950 cm-1 [12]. 1037.8 cm-1, 1045.4 cm-1 and 1035.5 cm-1 peaks are found in that region are present in bentonite, P-25 TiO2/bentonite and P-25 TiO2/bentonite/Ag catalyst com-bination. Peaks of C-H group 879.1 cm-1 and 524.7 cm-1 were present in bentonite. Corresponding to 790.4 cm-1 wavenumber ONO group was detected in bentonite. Frequencies and the functional groups present in the different modified catalysts are tabulated in Table 3.
Copyright © 2009, BCREC, ISSN 1978-2993
Figure 8. XRD analysis of (a) P-25 TiO2 (b) Ben-tonite (c) P-25 TiO2/Bentonite (d) P-25 TiO2/Bentonite/Ag (e) P-25 TiO2/Ag

Bulletin of Chemical Reaction Engineering & Catalysis, 4(2), 2009, 51
Copyright © 2009, BCREC, ISSN 1978-2993
Fig 9. FTIR analysis (a) P-25 TiO2 (b) Bentonite (c) P-25 TiO2/Bentonite (d) Bentonite/P-25 TiO2/Ag (e) P-25 TiO2/Ag
(a) (b)
(c) (d)
(e)

4. Conclusions
The decolorization efficiency was maximum with the P-25 TiO2/Ag combinations (i.e. 98%) un-der 60 min UV irradiation. Further 71% dye min-eralization in terms of COD removal was achieved with P-25 TiO2/Ag catalyst under 9 hr UV irradia-tions. However, with P-25 TiO2/Bentonite/Ag com-bination a moderate decolorization and mineraliza-tion efficiency was noticed and was 98% (60 min UV irradiation) and 68% (9 hr UV irradiation) re-spectively.
The SEM pictures show that bentonite consists of an aggregate of flat platelets and nano-sized par-ticles of silver and P-25 TiO2 is deposited on the surface of bentonote. It was observed by TEM analysis that the transition metal particles and nano-sized titania catalysts were supported on the
Bulletin of Chemical Reaction Engineering & Catalysis, 4(2), 2009, 52
surface of bentonite clay. Their mean particle size was 10 ± 2 nm P-25 TiO2, 100 ± 2 nm bentonite and deposited silver 1 to 2 nm. XRD studies support the above result and anatase phase was observed. It suggests that even after modifications there was no significant change in the P-25 TiO2 structure. From FTIR analysis different peaks were found indicating the presence of OH, Si-O-Si, CH and NO2 functional groups in modified photocatalysts r.
References [1] Lucas, Marco S.; Peres, Jose A. 2007. Degrada-
tion of Reactive Black 5 by Fenton/UV-C and ferrioxalate/H2O2/Solar light processes. Dyes and Pigments 74: 622-629.
[2] Menesi, Judit; Kekesi, Renata; Kor osi, Laszlo; Zollmer, Volker; Richardt, Andre; and Dekany, I. 2008. The Effect of TransitionMetal Doping on the Photooxidation Process of Titania-Clay Composites International Journal of Pho-toenergy. 1-9. doi:10.1155/2008/846304
[3] Pernyeszi, T.; Dekany, I. 2004. Photocatalytic degradation of hydrocarbons by bentonite and TiO2 in aqueous suspensions containing sur-factants. Colloids and Surfaces A: Physico-chem. Eng. Aspects 230: 191–199.
[4] Li, Jingyi; Chen, Chuncheng; Zhao, Jincai; Zhu, Huaiyong; Ding, Z. 2002 Photodegrada-tion of dye pollutants on TiO2 pillared ben-tonites under UV light irradiation. Science in China (Series B) 45(4): 445-448.
[5] Sun, Zhenshi; Chen, Yingxu; Ke, Qiang; Yang, Ye; Yuan, J. 2002. Photocatalytic degradation of cationic azo dye by TiO2/bentonite nanocom-posite. Journal of Photochemistry and Photo-biology A: Chemistry 149: 169–174.
[6] Ding, Z.; Zhu, H.Y.; Lu, G.Q.; and Greenfield, P.F. 1999. Photocatalytic Properties of Titania Pillared Clays by Different Drying Methods. Journal of Colloid and Interface Science 209: 193–199.
[7] Zhao, Difang; Zhou, Jie; Liu, N. 2007. Surface characteristics and photoactivity of silver-modified palygorskite clays coated with nanosized titanium dioxide particles. Materials Characterization 58: 249–255.
[8] Arabatzis, I. M.; Stergiopoulos, T.; Bernard, M.C.; Labou,D.; Neophytides, S.G.; Falaras, P. 2003. Silver-modified titanium dioxide thin films for efficient photodegradation of methyl orange. Applied Catalysis B: Environmental
Copyright © 2009, BCREC, ISSN 1978-2993
Table 3. Presences of various functional groups in modified catalysts using FTIR analysis
Catalysts Peaks found
(Wavenumber,cm-1)
Group(s) present
P-25 TiO2
3427.2 O-H
1635.7 Asymmetric and
symmetric stretch-ing vibrations of the
NO2 group
Bentonite
3621.3 O-H O-H 3447.7
1638.3 Asymmetric and
symmetric stretch-ing vibrations of the
NO2 group 1037.8 Si-O-Si 879.1 C-H 790.4 ONO bend 524.7 C-H 467.0 Not found
P-25 TiO2/Bentonite
3407.2 O-H
1631.2 Asymmetric and
symmetric stretch-ing vibrations of the
NO2 group 1045.4 Si-O-Si
P-25 TiO2/Bentonite/
Ag
3432.4 O-H
1630.5 Asymmetric and
symmetric stretch-ing vibrations of the
NO2 group 1035.5 Si-O-Si
P-25 TiO2/Ag
3449.4 O-H
1625.8 Asymmetric and
symmetric stretch-ing vibrations of the
NO2 group

42:187–201.
[9] APHA, AWWA, WEF, 1995. Standard meth-ods for the examination of water and waste-water, Greenberg.
[10] Divya, N.; Bansal, A.; Jana, A.K. 2009. Deg-radation of acidic Orange G dye using UV-H2O2 in batch photoreactor. International Journal of Biological and Chemical Science 3(1): 54-62.
Bulletin of Chemical Reaction Engineering & Catalysis, 4(2), 2009, 53
[11] Aleboyeh, A.; Olya, M. E.; Aleboyeh, H. 2008. Electrical energy determination for an azo dye decolorization and mineralization by UV/H2O2 advanced oxidation process. Journal of Chemical Engineering 137: 518–524.
[12] Coates, J. 2000. Interpretation of Infrared Spectra, A Practical Approach, Encyclopedia of Analytical Chemistry,Chichester
.
Copyright © 2009, BCREC, ISSN 1978-2993

Bulletin of Chemical Reaction Engineering & Catalysis, 4(2), 2009, 54
Copyright © 2009, BCREC, ISSN 1978-2993
This page intentionally left blank

1. Introduction Entrainment of gas from a gas-liquid surface is
known as surface aeration. Stirred reactors de-signed for this type of gas-liquid contact are called surface aerators. The main functions of surface aerators are to enhance the oxygen transfer rate, liquid phase mixing to ensure oxygen availability in all parts of the contactor, and suspension of mi-croorganisms [1-3]. Generally unbaffled tanks are employed for surface aerators, because unbaffled tanks give rise to higher fluid-particle mass trans-fer rates for a given power consumption [4], which is the paramount importance in designing aeration system. Baffled tanks are also giving rise to dead
Variability of Energy Dissipation and Shear Rate with Geometry in Unbaffled Surface Aerator
Bimlesh Kumar *
Civil Engineering, Indian Institute of Technology Guwahati, Guwahati 781039, India
* Author for Correspondence, E-mail: [email protected] Tel:+91-361-2582420
Bulletin of Chemical Reaction Engineering & Catalysis, 4(2), 2009, 55-60
Received: 17 October 2009; Revised: 12 December 2009; Accepted: 20 December 2009
Abstract
The dissipation rate of turbulent kinetic energy () and shear rate (γ) are the key process parameters for mixing in surface aerators. At constant dynamic variables (rotational speed), both and γ are greatly af-fected by the geometric parameters (impeller diameter, cross-sectional area of the tank, liquid height, rotor blade length and immersion height). By doing numerical computation by VISIMIX ®, present work ana-lyzes the effect of non-dimensional (which is non-dimensionalized through rotor diameter) geometric pa-rameters on e and g. With an increase in liquid height, there is an increase in the case of energy dissipation and shear rate values. In the case of tank area and blade length, it is vice versa. Energy dissipation and shear rate are not affected by the variation in immersion height of the impeller. © 2009 BCREC. All rights reserved. . Keywords: Energy dissipation; mixing; shear rate; surface aerator
zones, actually worsening the mixing performance of an aeration system [5]. It has been also recog-nized that the local value of the mass transfer rates would probably vary from one region to an-other in baffled tanks [6]. There are regions in the tanks where the surface renewal rate is high and the other parts where the liquid is relatively sta-tionary [6]. This non-uniformity of local value of mass transfer rates is the fundamental disadvan-tage of the use of baffled tank in mass transfer process.
In surface aerator, mechanical energy is trans-ferred from the impeller to the fluid causing fluid motion and then the energy dissipates in the fluid. The quantification of the dissipation rate of the
Copyright © 2009, BCREC, ISSN 1978-2993
Available online at BCREC Website: http://bcrec.undip.ac.id

turbulence kinetic energy (ε) is of paramount impor-tance for the optimization of fluid mixing processes in such vessels [7-10]. Shear rate of the flow in a mixing tank is also an important parameter con-trolling processes characteristics. High shear fields resulting from the fluid physical properties and the hydrodynamics may cause damage to fragile microorganisms and bio-films formation [11-12] or mechanical instability to immobilized biocatalysts [13-14]. However, a certain degree of shearing is required to attain sufficient heat and mass–transfer rates, and to achieve a homogene-ous distribution of transferred components into the bulk fluid. Process characteristics of surface aeration depend on the geometrical parameters. In fact, the geometry is so important that proc-esses can be considered "geometry specific". In the present work, it is aimed to find the effect of geo-metric parameter on these two important process variables (kinetic energy dissipation rate and shear rate). 2. Theory
Figure 1 shows the schematic drawing of a surface aeration tank used in the present study. The geometric variables include cross-sectional area A (m2) of the tank, depth H (m) of water in the tank, diameter D (m) of the rotor, length l (m) of the blades, distance h (m) between the top of the blades and the horizontal floor of the tank and the number of blades (n) as shown in Figure 1. Rushton type aerator with six flat blades has been used in the analysis. In the present study, the ratio of l/b has been maintained constant (=1.25). The geometric parameters have been non-dimensionalized by dividing through the rotor diameter (D). Cross-sectional area of tank used in the analysis is 1 m2. Energy dissipation rate (ε in W/kg) and shear rate (γ in 1/s) on different geometric parameters have been calculated by using visimix® software at different impeller rotational speed. 2.1. Dissipation Rate of Turbulent Kinetic Energy, ε
A characteristic feature of turbulent flow is the presence of a wide range of eddy sizes, rang-ing from the flow domain, i.e. integral scale ed-dies, to smaller sizes, i.e. Kolmogorov scale eddies [15].
The large eddies are unstable, interact with each other and with the boundaries of the flow and break down into multiple smaller eddies transferring their energy to them. First, this transfer is efficient and very little kinetic energy
is lost [15]. When the eddies become small enough, in the order of Kolmogorov scale in size, that the eddy motion is stable, viscosity takes over and the energy is damped out and converted into heat. This process is usually described as a turbulence cascade, where energy continually flows from larger to smaller eddy and at the smallest eddy scale, there is an ultimate sink of energy by viscous dissipation. This conversion of energy can be quantified using the kinetic turbu-lent energy dissipation rate ε. The direct meas-urement of ε is very difficult, since it needs to capture precisely the smallest turbulent structures [16]. There have been many attempts to model the rate of energy dissipation because of the difficulties involved in measuring and quantitatively deter-mining it directly. In the past, several methods were developed to estimate the dissipation rate of turbulent kinetic energy: • Kinetic energy balance term averaged over a
control volume [17-19] • Integration of dissipation spectrum [20-21] • Dimensional analysis [22]
In the present work, ε of surface aeration sys-
tems has been calculated by using commercial software Visimix®. The Visimix® program can be helpful in analyzing the mixing parameters in stirred tanks [10, 23-24]. The calculation proce-sure (which is kinetic energy balance term aver-aged over a control volume) are described as fol-lows:
The mean value of the kinetic energy of turbu-lence, E at the radius r is defined as:
(1) /2'v3 = E 2
Bulletin of Chemical Reaction Engineering & Catalysis, 4(2), 2009, 56
Copyright © 2009, BCREC, ISSN 1978-2993
Figure 1: Schematic diagram of a Surface Aeration Tank
d
H
DC Motor
Flange
h
b l
D
Shaft
Rotor blades
N

where is the mean square root velocity of turbulent pulsations corresponding to the largest local linear scale of turbulence. Steady-state transport of the turbulent component of kinetic energy can be described as:
(2)
where q is the circulation flow rate through the rotor (1/s), νe is the eddy viscosity and hj is the local linear scale of turbulence which is approxi-mately equal to 1.5b. The dissipation rate of en-ergy around the impeller at single speed is shown in the Figure 2.
As it can be seen from the Figure 2 that dissi-pation rate is very high in the impeller region. Kresta and Wood [25] investigated turbulence quantities in a stirred vessel with emphasis on energy dissipation. It is assumed that the bulk of the energy is contained in the largest eddies, the flow is at local equilibrium and the flux of energy towards smaller scales is constant. Zhou and Kresta [22] used a dimensional argument and found that most of the total energy is dissipated in the near vicinity of the impeller discharge.
Equation (2) is solved for = 0 at r = ∞.
The value of on the other boundary (r =d/2) is calculated using an estimated value of the maximum dissipation rate in the flow past the blades:
v'
022 =+⎥⎦
⎤⎢⎣
⎡⎟⎠⎞
⎜⎝⎛−⎟
⎠⎞
⎜⎝⎛ επνπ rhj
drdErhj
drd
drdEq e
v'
v'
(3) where vo is the axial velocity of the rotor (m/s). The dimensions of the em zone (length, height and width) are l, b and b/2, respectively. The mean value of dissipation is estimated as:
(4) The unit of turbulent dissipation rate, ε is W/
kg. Equation (4) is solved numerically to get the value of ε at different rotational speed.
2.2. Shear Rate
Shear rate is an important parameter in sur-face aerators, but it is not easy to be character-ized. Knowledge of the shear rate is essential for the design and operation of surface aerators. The specific energy dissipation rate in a stirred tank is well known to depend on the shear rate γ and the shear stress τ [5], as follows [26]:
(5) where P is the power input (watt), µ is dynamic viscosity of the fluid (NS/m2) and V is the volume of the fluid in the tank (m3). Equation (5) applies to laminar, turbulent and transitional flows. In laminar ranges, γ is linearly related to the rota-tional speed of the rotor (N) [27]. In turbulent flow, it is nonlinearly related to N [27]. One of the simpler ways to calculate shear rate is agitator tip speed over the distance between the tip and the vessel wall: γ = N D / (d – D) (6) where d is the tank diameter. Visimix® however, defines shear rate as the ratio of turbulent fluc-tuation velocity, v0, to the Kolmogorov turbulence scale, L0 as follows: γ = v0 / L0 (7)
L0 is called the Kolmogorov length and de-
pends primarily upon the power input per unit mass and the kinematic viscosity. Values of shear rate are calculated at different geometric parame-ters at different rotational speeds
( )[ ] lSinorNm /3v2 απε −=
rNbm πεε 6/=
VP
µγ 1
=
Bulletin of Chemical Reaction Engineering & Catalysis, 4(2), 2009, 57
Copyright © 2009, BCREC, ISSN 1978-2993
Figure 2: Energy dissipation rate around the impeller

3. Results and Discussion
Energy dissipation and shear rate are basi-cally correlated with the power consumption and rotational speed of the rotor, which is in turn re-lated with the oxygen transfer capacity of the sur-face aerator. Based on the analysis of Rao [28], it can be said that at constant rotational speed and for particular sized tank, ε and γ are affected by the geometric parameters such as H/D, h/D, l/D and A0.5/D. The purpose of the present work is to find the effect of geometric parameters on ε and γ.
3.1. Effect Due to Variation in H/D
As discussed earlier water depth has been non-dimensionalized by the rotor diameter, the value of H/D has been varied from 0.84 to 1.1 to ascertain the energy dissipating trend in the vi-cinity of the impeller. The results have been shown in the Figure 3. As shown in the Figure 3, both ε and γ show an increasing trend. It clearly indicates that the increase of rotational speed will increase the liquid pumping capacity of the impel-ler, thus the mixing quality will be improved and consequently energy dissipation and shear rate.
3.2. Effect Due to Variation in h/D
The effect due to variation in h/D, which signi-fies the impeller submergence, has found to be having no effect on the ε and γ as shown in the Figure 4. The reason for such behavior may be probably attributed to the fact that by definition of the surface aeration systems, impeller should be placed as near as water surface. Preserving the
definition of surface aerator, there is no signifi-cant variations in h/D. The given variations are not able to effect the energy dissipation and shear rate significantly.
3.3. Effect Due to Variation in l/D
The rotor blade is the most critical part of the surface aeration system since it determines the type of flow pattern, pumping and circulation flow rates. In the present case, l/D has been varied from 0.24 to 0.34. Results have been shown in the Figure 5.
It can be seen from the Figure 5 that an in-creases in blade width have been seen to result in corresponding decrease in ε and γ.
Bulletin of Chemical Reaction Engineering & Catalysis, 4(2), 2009, 58
Copyright © 2009, BCREC, ISSN 1978-2993
Figure 3: Effect on ε and γ due to variations in H/D
0.80 0.85 0.90 0.95 1.00 1.05 1.100.1
0.2
0.3
0.4
0.5
0.6
γ
N = 46.5 N = 70.6
H/D
ε
H/D0.80 0.85 0.90 0.95 1.00 1.05 1.10
300
400
500
600
700
800 N = 46.5 N = 70.6
0.6 0.7 0.8 0.9 1.0 1.10.4
0.6
0.8
1.0
γ
N = 57.3 N = 80.5
h/D
ε
h/D0.6 0.7 0.8 0.9 1.0 1.1
400
600
800
1000 N = 57.3 N = 80.5
Figure 4: Effect on ε and γ due to variations in h/D
Figure 5: Effect on ε and γ due to variations in
0.25 0.30 0.35
0.2
0.4
0.6
0.8
1.0
1.2
1.4
1.6
1.8
2.0 N = 55.7 N = 97
l/D
ε
l/D0.25 0.30 0.35
400
600
800
1000
1200
1400
1600
1800
γ
N = 55.7 N = 97

3.4. Effect Due to Variation in √A/D
Results due to variation in √A/D have been shown in the Figure 6. The trend shows a de-creasing with increasing √A/D . It can be due to that a lower value of √A/D intensifies the turbu-lence, which results in high energy dissipation and shear rate.
4. Conclusions
The knowledge of the variation of the rate of dissipation of the turbulence energy (ε) and shear rate (γ) with geometric parameters in surface aeration systems is of paramount importance for the de-sign and operation. Present work shows qualita-tively how the variations in geometric parameters affect the ε and γ. It is found that with an increase in H/D, ε and γ increases whereas it is vice versa in case of l/D and √A/D. It is also found that the variation in h/D do not affect the ε and γ. REFERENCES [1] Fair, G., Gayer, J., and Okum, D. 1971. Elements of
water supply and waste water disposal, John Wiley and Sons, New York.
[2] McWhirter, J., Chern, J., and Hutter, J. 1995. Oxy-gen Mass Transfer Fundamentals of Surface Aera-tors. Ind. Eng. Chem. Res. 34:2644-2654.
[3] Rao, A., and Kumar, B. 2008. Scaling-Up the Geo-metrically Similar Unbaffled Circular Tank Surface Aerator. Chemical Engineering and Technology 31: 287-293.
[4] Grisafi, F., Brucato, A., and Rizzuti, L. 1994, Solid
liquid mass transfer coefficients in mixing tanks: influence of side wall roughness. Instn Chem. Engn Symp. Ser. 136: 571-578.
[5] Nagata, S. 1975. Mixing Principles and applica-tions. John-Wiley & Sons.
[6] Johnson, A., and Huang, C. 1956. Mass transfer studies in an agitated vessel. AIChE J. 2: 412-419.
[7] Yianneskis, M., and Whitelaw, J. 1993. On the structure of the trailing vortices around Rushton turbine blades. Trans IChemE. 71: 543-550.
[8] Schaffer, M., Hofken, M., and Durst, F. 1997. De-tailed LDV Measurements for Visualization of the Flow Field Within a Stirred-Tank Reactor Equipped with a Rushton Turbine. Trans. Inst. Chem. Eng., 75: 729-736.
[9] Yianneskis, M., Popiolek, Z., and Whitelaw, J. 1987. An Experimental Study of the Steady and Unsteady Flow Characteristics of Stirred Reactors. J. Fluid Mech. 175: 537-555.
[10] Kumar, B., and Rao, A. 2009. Oxygen transfer and energy dissipation rate in surface aerator. Biore-source Technology 100: 2886-2888.
[11] Gjaltema, A., Tijhuis, L., van Loosdrecht, M., and Heijnen, J. 1995. Detachment of biomass from sus-pended non-growing spherical biofilms in airlift bioreactors. Biotech. Bioeng 46:258-269.
[12] Gjaltema, A., van der Marel, N., van Loosdrecht, M., and Heijnen, J. 1997. Adhesion and biofilm development on suspended carriers in airlift reac-tors: Hydrodynamic conditions versus surface cha-racteristics. Biotech. Bioeng. 55: 880-889.
[13] Leenen, E., Martins dos Santos, V., Grolle, K., Tramper, K.J., and Wijffels, R. 1996. Characteriza-tion and Selection Criteria of Support Materials for Cell Immobilization. Water Res 30: 2895-2996.
[14] Martins dos Santos, V., Leenen, E., Rippoll, M., van der Sluis, C., Vliet, T., Tramper, J., and R. Wijffels, R. 1997. Relevance of the Rheological Properties of Gel Beads for their Mechanical Stability in Bioreac-tors. Biotech. Bioeng, 56: 217-229.
[15] Pope, S.B. 2000, Turbulent Flows, Cambridge Uni-versity Press, Cambridge.
[16] Saarentine, P., and Piirto, M. 2000. Turbulent Ki-netic Energy Dissipation Rate from PIV Velocity Vectors Fields. Exp. Fluids 29: 300-307.
[17] Cutter, L. 1966. Flow and Turbulence in a Stirred Tank. AIChE J. 12: 35-44.
[18] Wu, H., and Patterson, G. 1989. Laser-Doppler Measurements of Turbulent Flow Parameters in a Stirred Mixer. Chem. Eng. Sci. 44:2207-2221
Bulletin of Chemical Reaction Engineering & Catalysis, 4(2), 2009, 59
Copyright © 2009, BCREC, ISSN 1978-2993
Figure 6: Effect on ε and γ due to variations in A0.5/D
1.61.82.02.22.42.62.83.03.23.43.63.8
0.2
0.4
0.6
0.8
1.0
γ
N = 50 N = 73.2
A0.5/D
ε
A0.5/D1.5 2.0 2.5 3.0 3.5
400
600
800
1000
N = 50 N = 73.2

Bulletin of Chemical Reaction Engineering & Catalysis, 4(2), 2009, 60
[19] Zhou, G., and Kresta, S. 1996a. Distribution of En-ergy Between Convective and Turbulent Flow for Three Frequently Used Impellers. Trans. Inst. Chem. Eng., 74: 379-389.
[20] Okamota, Y., Nishikawa, M., and Hashimoto, K. 1981. Energy Dissipation Rate Distribution in Mixing Vessels and Its Effects on Liquid- Liquid Dispersions and Solid-Liquid Mass Transfer. Int. Chem. Eng. 21: 88-94.
[21] Costes, J., and Couderc, J. 1988. Influence of the Size of the Units: I. Mean Flow and Turbulence. Chem. Eng. Sci., 43: 2751-2764.
[22] Zhou, G., and Kresta, S. 1996b. Impact of the Geome-try on the Maximum Turbulence Energy Dissipation Rate for Impellers. AIChE J. 42: 2476-2490.
[23] Liu, K., and Neeld, K. 1999, Topical Conference on Process Development from Research to Manufactur-ing: Industrial Mixing and Scale-up, AICHE Annual Meeting, Dallas, TX..
[24] Genck, W. 2003. Optimizing crystallizer scale up. Chem Eng Prog. 99: 36-44.
[25] Kresta, S., and Wood, P. 1993. The Flow Field Pro-duced by a 45ø Pitched Blade Turbine: Characteriza-tion of the Turbulence and Estimation of the Dissipa-tion Rate. Chem Eng Sci. 48: 1761-1774.
[26] Pe´rez, J., Porcel, E., Lo´pez, J., Sevilla, J., and Chisti, Y. 2006. Shear rate in stirred tank and bubble column bioreactors. Chem Eng J. 124: 1-5.
[27] Metzner, A., and Otto, R. 1957. Agitation of non-Newtonian fluids. AIChE J. 3, 3-10.
[28] Rao A. 1999. Prediction of reaeration rates in square, stirred tanks. Journal of Environ-mental Engineering 125: 215-233.
Copyright © 2009, BCREC, ISSN 1978-2993
1. Introduction A new mathematical model (Ibrehem and Al-
Salim, 2009) was derived to describe production processes by the most active input variables inside batch reactor as shown in Figure (1). The model was applied to a process of production of bio-diesel from vegetable oils. Production of bio diesel from
New Dynamic Analysis and System Identification of Biodiesel Production Process from Palm Oil
Ahmmed S. Ibrehem * and Hikmat S. Al-Salim
Chemical & Petroleum Engineering Department, University of Sedaya, Kuala
Lumpur,50603, Malaysia
* Corresponding Author. E-mail address: [email protected] (Ibrehem) Tel: +061-0149360913, Fax: +061-98-9985241
Bulletin of Chemical Reaction Engineering & Catalysis, 4(2), 2009, 61-68
Received: 12nd November 2009; Revised: 20th Decmber 2009; Accepted: 27th December 2009
Abstract
In this study we present advanced mathematical model was used to capture the batch reactor characteris-tics of reacting compounds new parameters and new a prerequisite average slope analysis (PASA) method for the system dynamic behaviour under different operational conditions is a prerequisite to the good selec-tion for these parameters. The model was applied to batch reactor for the production of bio-diesel from palm and kapok oils. Results of the model were compared with experimental data in terms of conversion of transesterification reaction for the production of bio-diesel under unsteady state. A good agreement was obtained between our model predictions and the experimental data. Both experimental and modeling re-sults showed that the conversion of triglycerides to methyl ester was affected by the process conditions and by using PASA that could be achieved by making some deterministic tests either in real data plant or in the physical model that properly and adequately fits the actual process. The input-output relationships are studied using the open-loop dynamic response of the process, which can be determined from the process model by stepping different inputs and recording output responses. Starting from steady state conditions, each input is perturbed with certain magnitude that is enough to show the effect on the system dynamics. The transesterficition process with temperature of about 70 oC, and methanol ratio to the triglyceride of about 5 times its stoichiometry and the NAOH catalyst of wt 0.4%, appear to be acceptable process condi-tions. PASA shows methanol ratio to the triglyceride has big effect on the system. PASA method can be ap-plied for different processes. © 2009 BCREC. All rights reserved. . Keywords: Mathematical model, System identification, Vegetable oil, Catalytic reactor, Dynamic study
vegetable oils received a lot of attention and may be one day will become one of the most important renewable energy sources for transport and house-hold uses (Dunn, 2008). Both Malaysia and Indone-sia have recently started developing bio-diesel de-rived from vegetable oils (Antaresti et.al., 2005) in large quantities using different sources for the oil
Copyright © 2009, BCREC, ISSN 1978-2993
Available online at BCREC Website: http://bcrec.undip.ac.id

(Franceschini and Macchietto, 2007). Production of bio diesel from vegetable oils received a lot of attention and may be one day will become one of the most important renewable energy sources for transport and household uses.
Both Malaysia and Indonesia have recently started developing bio-diesel derived from vegeta-ble oils (Antaresti et.al., 2005) in large quantities using different sources for the oil. What makes bio diesel important is attributed to its chemical and physical properties which closely resemble those of diesel fuel. This has been documented by many authors (Clark et al., 1984; Mittelbach and Tritthart, 1988; Pakpahan, 2001; Legowo, 2001). The bio-diesel cetane number, energy content, viscosity and phase changes are similar to those of petroleum based diesel fuel, but is essentially sulfur free. Bio-diesel offers enhanced safety char-acteristics when compared to diesel fuel. It has a higher flash point and does not produce explosive air/fuel vapors. Generally bio-diesel fuel less toxic than petroleum fuel due to the absence of aromat-ics hydrocarbons. Bio-diesel is made by trans-esterification of triglyceride found in natural oils with methanol in the presence of a catalyst. Transesterification of a vegetable oil was con-ducted as early as 1853 by scientists E. Duffy and J. Patrick, many years before the first diesel en-gine became functional. Rudolf Diesel's prime model, a single 10 ft (3 m) iron cylinder with a flywheel at its base, ran on its own power for the first time in Augsburg, Germany, on August 10, 1893.
In remembrance of this event, August 10 has been declared "International Biodiesel Day.The French Otto Company (at the request of the French government) demonstrated a Diesel en-gine running on peanut oil at the World Fair in Paris, France in 1900, where it received the Grand Prix (highest prize).
This engine stood as an example of Diesel's vision because it was powered by peanut oil a biofuel, though not biodiesel, since it was not transesterified. He believed that the utilization of biomass fuel was the real future of his engine. In a 1912 speech Diesel said, "the use of vegetable oils for engine fuels may seem insignificant today but such oils may become, in the course of time, as important as petroleum and the coal-tar prod-ucts of the present time."
During the 1920s, diesel engine manufactur-ers altered their engines to utilize the lower vis-cosity of petrodiesel (a fossil fuel), rather than vegetable oil (a biomass fuel). The petroleum in-dustries were able to make inroads in fuel mar-kets because their fuel was much cheaper to pro-
duce than the biomass alternatives. The result, for many years, was a near elimination of the biomass fuel production infrastructure. Only recently have environmental impact concerns and a decreasing price differential made biomass fuels such as bio-diesel a growing alternative.
Despite the widespread use of fossil petroleum-derived diesel fuels, interest in vegetable oils as fuels for internal combustion engines was reported in several countries during the 1920s and 1930s and later during World War II. Belgium, France, Italy, the United Kingdom, Portugal, Germany, Brazil, Argentina, Japan and China were reported to have tested and used vegetable oils as diesel fu-els during this time. Some operational problems were reported due to the high viscosity of vegetable oils compared to petroleum diesel fuel, which re-sults in poor atomization of the fuel in the fuel spray and often leads to deposits and coking of the injectors, combustion chamber and valves. At-tempts to overcome these problems included heat-ing of the vegetable oil, blending it with petroleum-derived diesel fuel or ethanol, pyrolysis and crack-ing of the oils.
On August 31, 1937, G. Chavanne of the Uni-versity of Brussels (Belgium) was granted a patent for a "Procedure for the transformation of vegeta-ble oils for their uses as fuels" (fr. "Procédé de Transformation d’Huiles Végétales en Vue de Leur Utilisation comme Carburants") Belgian Patent 422,877. This patent described the alcoholysis (often referred to as transesterification) of vegeta-ble oils using ethanol (and mentions methanol) in order to separate the fatty acids from the glycerol by replacing the glycerol with short linear alcohols. This appears to be the first account of the produc-tion of what is known as "biodiesel" today.
More recently, in 1977, Brazilian scientist Ex-pedito Parente invented and submitted for patent, the first industrial process for the production of biodiesel. This process is classified as biodiesel by international norms, conferring a "standardized identity and quality. No other proposed biofuel has been validated by the motor industry." Currently, Parente's company Tecbio is working with Boeing and NASA to certify bioquerosene (bio-kerosene), another product produced and patented by the Bra-zilian scientist.
Research into the use of transesterified sun-flower oil, and refining it to diesel fuel standards, was initiated in South Africa in 1979. By 1983, the process for producing fuel-quality, engine-tested biodiesel was completed and published internation-ally. An Austrian company, Gaskoks, obtained the technology from the South African Agricultural
Bulletin of Chemical Reaction Engineering & Catalysis, 4(2), 2009, 62
Copyright © 2009, BCREC, ISSN 1978-2993

Engineers; the company erected the first biodiesel pilot plant in November 1987, and the first indus-trial-scale plant in April 1989 (with a capacity of 30,000 tons of rapeseed per annum).
Throughout the 1990s, plants were opened in many European countries, including the Czech Re-public, Germany and Sweden. France launched local production of biodiesel fuel (referred to as diester) from rapeseed oil, which is mixed into regular diesel fuel at a level of 5%, and into the diesel fuel used by some captive fleets (e.g. public transportation) at a level of 30%. Renault, Peugeot and other manufacturers have certified truck en-gines for use with up to that level of partial bio-diesel; experiments with 50% biodiesel are under-way. During the same period, nations in other parts of the world also saw local production of bio-diesel starting up: by 1998, the Austrian Biofuels Institute had identified 21 countries with commer-cial biodiesel projects. 100% Biodiesel is now avail-able at many normal service stations across Europe.
In September 2005 Minnesota became the first U.S. state to mandate that all diesel fuel sold in the state contain part biodiesel, requiring a content of at least 2% biodiesel. In 2008, ASTM published new Biodiesel Blend Specifications Standards. In 2005, Franceschini and Macchietto derived model-based experiment design techniques for bio-diesel process based on experimental data only, while Dunn (2008) derived a mathematical model to cal-culate the temperature effects on the system. The two models did not include the effect of catalysts and concentration of reactants unlike our model which takes into it all variables such as tempera-ture, concentration of reactants, and catalyst. New mathematical model calculates the effects of con-centrations of triglycerides, methanol, catalyst weight percent and temperature of reaction on the percent of conversion.
Based on the Antaresti et.al. (2005) work ex-perimental basics of reactor design and the results of experiments on the various conditions. Design a complete mathematical model of the system by us-ing computer software such as MATLAB, the sys-tem is simulated and results compared to the ex-perimental results and give acceptable results be-tween new model predictions and the experimental data.
In this paper, we address the following ques-tion: what types of input signals are sufficient to completely identify the input/output behavior of a system? In other words, we look for classes x of in-puts with the property that, if a system is stimu-lated with the inputs from the set x and the corre-sponding time record of outputs is recorded, then,
on the basis of the collected information on inputs and outputs it is possible at least theoretically, with no regard to computational effort, and in the absence of noise to obtain a system output which is equivalent to y. By “equivalent” we mean that the estimated system will be completely indistinguish-able from the true system in its input/output be-havior.
2. Modified Mathematical Model
A mathematical model was applied to Antar-
esti. et.al experimental work which deals with the relationship between rate coefficient (k) of the re-action with weight percent of NaOH as a catalyst (cat). A numerical polynomial relationship depend-ing on experimental results was developed in our model by using version seven MATLAB software to give high accuracy (more than 99%) in calculating the rate coefficient (k) of the reaction which makes it suitable to use in calculating the rate of reaction (rA), mass balance (CA) and (CB) for the reactor, as well as energy balance (Treact) for reactor and the jacket (Tjacket) as shown in Figure (1). The estima-tion of the reactor model parameters are given in Table (1). The relationship between rate coeffi-cients of the reaction with weight percent of NaOH as a catalyst is given by:
Reactor mole balances for triglycerides (A) in vol-ume (v): Mole in – Mole out + Generation = Rate of accumu-lation of mass
Reactor mole balance for methanol (B) in volume (v): Mole in – Mole out + Generation = Rate of accumu-lation of mass
Bulletin of Chemical Reaction Engineering & Catalysis, 4(2), 2009, 63
Copyright © 2009, BCREC, ISSN 1978-2993
0065714.003952.0 011905.0101562.4 2316
++−×= −
catcatcatk (1)
dtdCvvr A
A =−− 00
BAA CkC
dtdC
−=(2)
dtdCvvr B
A =−−00
BAB CkC
dtdC
−= (3)
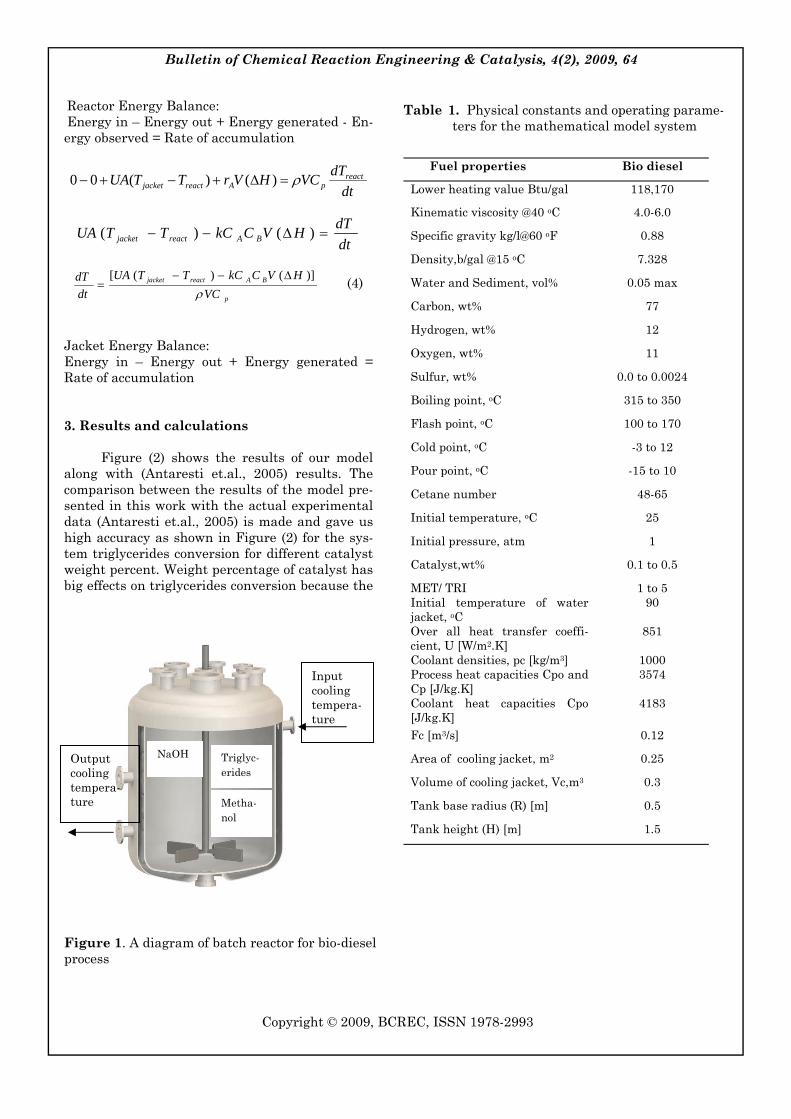
Reactor Energy Balance: Energy in – Energy out + Energy generated - En-ergy observed = Rate of accumulation
Jacket Energy Balance: Energy in – Energy out + Energy generated = Rate of accumulation
3. Results and calculations Figure (2) shows the results of our model
along with (Antaresti et.al., 2005) results. The comparison between the results of the model pre-sented in this work with the actual experimental data (Antaresti et.al., 2005) is made and gave us high accuracy as shown in Figure (2) for the sys-tem triglycerides conversion for different catalyst weight percent. Weight percentage of catalyst has big effects on triglycerides conversion because the
Bulletin of Chemical Reaction Engineering & Catalysis, 4(2), 2009, 64
Copyright © 2009, BCREC, ISSN 1978-2993
dtdTVCHVrTTUA react
pAreactjacket ρ=∆+−+− )()(00
dtdTHVCkCTTUA BAreactjacket =∆−− )()(
p
BAreactjacket
VCHVCkCTTUA
dtdT
ρ)]()([ ∆−−
= (4)
Table 1. Physical constants and operating parame-ters for the mathematical model system
Fuel properties Bio diesel
Lower heating value Btu/gal 118,170
Kinematic viscosity @40 oC 4.0-6.0
Specific gravity kg/l@60 oF 0.88
Density,b/gal @15 oC 7.328
Water and Sediment, vol% 0.05 max
Carbon, wt% 77
Hydrogen, wt% 12
Oxygen, wt% 11
Sulfur, wt% 0.0 to 0.0024
Boiling point, oC 315 to 350
Flash point, oC 100 to 170
Cold point, oC -3 to 12
Pour point, oC -15 to 10
Cetane number 48-65
Initial temperature, oC 25
Initial pressure, atm 1
Catalyst,wt% 0.1 to 0.5
MET/ TRI 1 to 5 Initial temperature of water jacket, oC
90
Over all heat transfer coeffi-cient, U [W/m2.K]
851
Coolant densities, pc [kg/m3] 1000 Process heat capacities Cpo and Cp [J/kg.K]
3574
Coolant heat capacities Cpo [J/kg.K]
4183
Fc [m3/s] 0.12
Area of cooling jacket, m2 0.25
Volume of cooling jacket, Vc,m3 0.3
Tank base radius (R) [m] 0.5
Tank height (H) [m] 1.5
Figure 1. A diagram of batch reactor for bio-diesel process
Triglyc-erides
Metha-nol
NaOH
Input cooling tempera-ture
Output cooling tempera-ture

weight percentage of catalyst effects on rate con-stant of reaction that leads to increase the conver-sion as shown in Figure (2) when the catalyst weight percentage increase from 0.1% to 0.2% the conversion increase more than 8%. So, if the weight of catalyst increases to 5% the conversion will increase more than 40% that give us a very good idea about the effects of weight of catalyst in the system. Meanwhile, Figure (3) shows the ef-fects different weight ratio of methanol (MET) to triglycerides (TRI) on triglycerides conversion that give us a very good idea about the accuracy of this model and big effects of increasing ratio of MET/TRI in the system. The conversion will be in-creased more than 45% if the ratio increases from 1 to 5 as shown in Figure (3). While Figures (4) and (5) show the effects different concentration step changes of TRI on the temperature of reaction with the time and different weight percent of catalyst step change on the concentration of TRI with the
time respectively. Once again there is a good agree-ment between the new model and the actual ex-perimental data.
4. Dynamic Analysis and Identification for
Mathematical Model System identification involves building a dy-
namical model from an input/output data and without use of any laws concerning the fundamen-tal nature and properties of the nonlinear system. The batch reactor process involves many variables, which contribute to its operation, and this makes it a Single-Input Single-Output (SISO) process. These variables are classified as follows:
Input or manipulated variables (MVs) are chosen from those variables that have direct effect on the process performance, and practically easy to actuate. In our case, these are: percent of NaOH as a catalyst (Qc) and ratio of MET/ TRI stoichiome-
Bulletin of Chemical Reaction Engineering & Catalysis, 4(2), 2009, 65
Copyright © 2009, BCREC, ISSN 1978-2993
0 10 20 30 40 50 600
10
20
30
40
50
60
70
80
Time,(min)
Trig
lyce
ride
conv
ersi
on %
Exp data for 0.1% catalystData predicted for 0.1% catalystExp data for 0.2% catalytstData predicted for 0.2% catalystExp data for 0.5% catalytstData predicted for 0.5% catalyst
Figure 2. Effect of time on the transesterification process of vegetable oil for different percentage of weight catal

try. The controlled variables (CVs) are selected from the process outlet streams that are usually of foremost importance such as the triglycerides conversion (TRI). A schematic diagram represent-ing the previously mentioned variables is shown in Figure (6). So, the identification steps can be defined for PASA as follows; 1. First step is to make actual calculations for the
system from nominal conditions xn,i to calcu-late yn,i.
2. Second step repeat step one with +33% per-turbed parameter input vector (1.33 × xn,i) to produce the + 33% perturbed output yi matrix.
3. Third subtract each element from matrix in first step from the corresponding element in matrix in second step and divided the differ-ence by yn,i. (yi- yn,i) / yn,i.
4. Fourth step similarly calculate the change in parameters (xi- xn,i) / xi.
5. Fifth step divided each element in third step by fourth step to produce the sensitivity matrix k. Depends completely on scale matrix without using any a proper factor.
6. Sixth step calculate k matrix for negative direc-tion which mean calculate k+33% and k-33% so as, we can check the effect of each parameters on output as seen in Table (2) .
Then find average slope to find average angle (θ) that is represented overall effect of each pa-rameters on the measured output ( θ1 represents the effects of MET/TRI and θ2 represents the ef-fects of catalyst on the system as shown in Figure (7).
From parameters average slope analysis we can see a preliminary partitioning of estimating into different groups depend on slope angle (θ) of kaverage and these groups can be specified as fol-lows;
Bulletin of Chemical Reaction Engineering & Catalysis, 4(2), 2009, 66
Copyright © 2009, BCREC, ISSN 1978-2993
0 10 20 30 40 50 600
10
20
30
40
50
60
70
80
90
Time,(min)
Trig
lyce
ride
conv
ersi
on %
Exp data for 1 ratio MET/TRIData predicted for 1 ratio MET/TRIExp data for 3 ratio MET/TRData predicted for 3 ratio MET/TRIExp data for 5 ratio MET/TRData predicted for 5 ratio MET/TRI
Figure 3. Effect of time on the transesterification process of vegetable oil for different ratio of MET/ TRI stoichiometry

Bulletin of Chemical Reaction Engineering & Catalysis, 4(2), 2009, 67
Copyright © 2009, BCREC, ISSN 1978-2993
0 10 20 30 40 50 60320
325
330
335
340
345
350
355
360
365
Time (min)
Tem
pera
ture
k
Figure 4. Effect of concentration step change of TRI on the temperature of reaction with the time (concentration of TRI=2kmol/m3 from time=0 min until 14min then concentration of TRI=0.5 kmol/m3 at time 14.5min).
0 10 20 30 40 50 600.75
0.8
0.85
0.9
0.95
1
Time (min)
Con
cent
ratio
n m
ol/m
3
Figure 5. Effect of weight percent of catalyst step change on the concentration of TRI with the time (weight percent of catalyst =0.5 from time=0 min until 15min then weight percent of catalyst =0.1 at time 14 min).
Figure 6. Representation of variables in bio diesel system as a MISO system
BATCH REACTOR
BIO DIESEL
MET/ TRI
Qc
TRI
Manipulated Variables Out put
Table 2. Calculate the percent difference for output profile
MET/ TRI
TRI differ-ence %
Kaverage Qc weight % TRI difference %
Kaverage
2 54 0.615 0.2 58 0.237 3 68 0.396 0.3 63 0.57
4 77 0.4 75
Average % 0.5055 0.4035
θ Average 26.81O 21.9O

• (θ) ≥ 20o: Large effects on the system. • 20o > (θ) > 15o: Middle effects on the system. • 15o ≥ (θ) ≥ 10o: Weak effects on the system. • 10o < (θ): Can not be established.
5. Conclusion New identification and analysis for new dy-
namic model for bio diesel was developed in this work and a new dynamic bio-diesel model was es-tablished in this work by using three differential equations mass balance equation for reactor sys-tem, heat balance equation for reactor system and heat balance for cooling jacket. New technique is used in this model to calculate rate constant by depending into account experiments results be-tween the catalyst weight percent and rate con-stant to produce third order polygon equation. This model takes into account the presence of catalyst weight percent, ratio of methanol to triglycerides, temperature of reaction, and temperature supply for reactor on conversion percent of triglycerides which depend on these parameters. The model pre-sented in this work was compared with experimen-tal data at unsteady state for conversion percent-age of triglycerides of the bio-diesel batch reactor process. From its observed accuracy, we can con-veniently use this model as a predictive tool to study the effects of operating, and kinetic parame-ters on the reactor performance. The results be-tween the new model and the experimental results gave a good indication about the behavior of the present model which is very close to experimental data.
This model takes into account the presence of particles participating in the reaction with TRI conversion which depend on the ratio MET/TRI and catalyst weight percentage. The comparison results between these two inputs gave good indica-tion about the behavior of the present model the
identification results gave good indication for ef-fects of the ratio MET/TRI and catalyst weight per-centage on the system. The ratio MET/TRI has more a great affects on the system compared to the catalyst weight percentage as see in Table (2) and Figure (7). This kind of identification and analysis method can be used to any system to identify which is the best input variables that effects on any system
REFERENCES
[1] Ahmmed S Ibrehem, and Hikmat S Al-Salim. Advanced Mathematical Model to Describe the Production of Bio-diesel Process, Bulletin of Chemical Reaction Engineeringt & Cataly-sis, Article Inpress, 2009
[2] Clark,S.,J.,Wagner, L., Schrock, M.D., and Pinnaar,P.G.1984.Methyl and ethyl esters as renewable fules for diesel engines. J. Amer. Oil Chem. Soc.,61,1632-1638.
[3] Legowo, E.2001,Experience in Palm Biodiesel uses for Transportation, Proceedings of the International Biodiesel Workshop, Medan, Indonesia.
[4] Mittelbach and Tritthart, P.1988.Diesel fuel derived from vegetable oils, III Emission test using methyl esters of used frying oils J. Amer. Oil Chem. Soc., 65, 1185-1187.
[5] Muniyappa, P.R.,Brammer, S.C., and Noureddini,H.1996.Improved conversion of plant oils and animal fats into biodiesel and co-product, Biodiesel Technology, 56,19-24.
[6] Pakpahan,A.2001. Palm Biodiesel: Its po-tency,technology,business prospect and envi-ronmental implication in Indonesian, Pro-ceeding of the International Biodiesel Wwork-shop, medan, Indonesia.
[7] Antaresti. et.al., 2005. The Biodiesel Produc-tion Process from Vegetable Oil, Dev. Chem. Eng. Mineral Process. 13(5/6), pp.687-692,2005.
[8] Dunn, R.O. 2008. Effect of temperature on oil stability index (OSI) of biodiesel. Energy and Fuels. 22:657-662.
[9] Gaia Franceschini and Sandro Macchietto, Validation of a Model for a Biodiesel Produc-tion Process through Model-Based Experi-ment Design for Parameter Precision, Com-puters and Chemical Engineering, 24, 1261-1267.
[10] SAE Technical Paper series no. 831356. SAE International Off Highway Meeting, Milwau-kee, Wisconsin, USA, 1983
Bulletin of Chemical Reaction Engineering & Catalysis, 4(2), 2009, 68
Copyright © 2009, BCREC, ISSN 1978-2993
θ 1=26.8o
θ 2=21.9o
θ =90o
Figure 7. Represents the slope average angle slope
1. PENDAHULUAN Penelitian sistem penyimpanan hidrogen
kenderaan fuel cell saat ini sangat intensif dilaku-kan. Dikenal ada tiga metode penyimpanan, yakni dalam bentuk gas, cair dan padat. Dua metode per-tama yaitu dalam bentuk gas (pada tekanan tinggi 700 bar) dan cair (suhu harus tetap stabil pada -
Pengaruh Lama Miling Terhadap Sifat Absorpsi Material Penyimpan Hidrogen MgH2 yang Dikatalisasi Dengan Fe
(The role of milling time on the absorption behaviour of MgH2 catalyzed by Fe)
Mustanir 1, and Zulkarnain Jalil 2 *
1 Jurusan Kimia, FMIPA, Universitas Syiah Kuala, Darussalam, Banda Aceh
2 KBM Material, Jurusan Fisika, FMIPA, Universitas Syiah Kuala, Darussalam, Banda aceh
* Corresponding Author. E-mail address: [email protected] (Z. Jalil)
Bulletin of Chemical Reaction Engineering & Catalysis, 4(2), 2009, 69-72
Received: 13 November 2009; Revised: 25 December 2009; Accepted: 31 December 2009
Abstract
Hidrida logam berbasis MgH2 dengan sisipan 1 wt% katalis Fe telah berhasil disintesis dengan teknik ball milling. Hasil proses miling selama 80 jam menunjukkan bahwa ukuran butir material telah membentuk struktur nanokristal. Hal ini ditunjukkan oleh profil difraksi sinar-X dimana terjadi pelebaran puncak-puncak difraksinya dengan meningkatnya waktu miling. Hasil uji absorpsi secara gravimetrik diketahui bahwa MgH2 berkatalis 1 wt% Fe mampu menyerap hydrogen sebesar 5,5 wt% dalam waktu ~20 menit pada temperatur 300 oC. Hasil ini sekaligus memperlihatkan bahwa sejumlah kecil katalis Fe bekerja se-cara baik dalam memperbaiki sifat absorpsi material penyimpan hydrogen berbasis Mg. © 2009 BCREC. All rights reserved (Metal hydrides are of great interest as hydrogen storage media especially for automotive application. Hy-drides of magnesium and magnesium alloys are particularly attractive as they combine potentially high hy-drogen storage capacities, 7.6 wt%. But, unfortunately, the sorption properties are poor. For example, con-ventional hydrogenation of magnesium requires prolonged treatment at temperatures of 300 oC and above. Here, we report the absorption properties of MgH2 catalyzed with a small amount of Fe element (1wt%) un-der argon atmosphere prepared by ball milling in 80 hours. As the results, it showed the influence of milling time on the absortion kinetics of material which could absorp hydrogen in amount 5.5 within 20 minutes at 300 oC. It is obvious that longer milling time and small amount of catalyst could improve the sorption prop-erties of Mg-based hydrides). © 2009 BCREC. All rights reserved. Keywords: Magnesium, ball milling, nanocrystalline, hydrogen absorption
253 0C) dari sisi keamanan belum memadai. Sistem penyimpan mutakhir yang saat ini
aktif diteliti adalah dengan menggunakan teknik penyimpan padat (solid hydrogen storage). Dalam sistem padat ini atom-atom H berada pada kisi-kisi material utamanya, dimana hidrogen "disisipkan" dalam material tertentu. Kini arah penelitian terfokus pada upaya untuk mendapat-
Copyright © 2009, BCREC, ISSN 1978-2993
Available online at BCREC Website: http://bcrec.undip.ac.id

kan material yang mampu menyimpan/menyerap hidrogen dalam jumlah besar, ringan dengan harga ekonomis.
Salah satu material tersebut adalah magne-sium (Mg) yang diyakini sebagai kandidat poten-sial untuk penyimpan hydrogen [1], karena memiliki kemampuan menyerap hidrogen dalam jumlah besar (7,6 wt%), sifatnya yang ringan dan tersedia di alam dalam jumlah besar. Namun Mg masih memiliki kelemahan, yaitu kinetika reak-sinya sangat lambat serta temperatur operasi yang sangat tinggi (300 oC).
Beberapa upaya telah dilakukan secara in-tensif untuk memperbaiki sifat-sifat Mg ini. Misal-nya proses membentuk material hingga berskala nanokristal dengan teknik milling [2,3], memben-tuk material komposit [4], demikian juga upaya menambahkan katalis tertentu, seperti logam dan oksida logam ke dalam MgH2 dalam skala nanok-ristal [5,6].
Dalam penelitian diobervasi pengaruh lama miling terhadap sifat serapan material penyimpan hidrogen MgH2 yang dikatalisasi dengan 1 wt% Fe dan dipreparasi melalui teknik mechanical alloy-ing
2. METODE Bahan-bahan yang disiapkan masing-masing
adalah MgH2 (produk Goldschmidt AG, Jerman kemurnian 95%+), dan unsur Fe (kemurnian 99%, produk Sigma Aldrich). Ukuran kedua material ini masih dalam skala mikrokristal. Setelah semua bahan disiapkan, lalu dilakukan proses reduksi butir dengan mesin ball mill (Retsch PM400). Adapun rasio bola dan material adalah 10:1 den-gan berat sampel 10 gram. Proses milling berlang-sung dalam suasana argon. Milling berlangsung selama 80 jam dengan kecepatan 400 rpm. Sejum-lah kecil sampel dipindahkan ke dalam wadah lain di setiap range waktu tertentu untuk dilakukan karakterisasi, masing-masing menyangkut kom-posisi fasa MgH2 dengan difraksi sinar-X, mor-fologi dengan SEM dan analisa serapan secara gra-vimetrik untuk mengetahui sifat absorpsi material MgH2-1 wt% Fe.
3. HASIL DAN PEMBAHASAN Gambar 1 menunjukkan evolusi dari pola-
pola difraksi sinar X (XRD) untuk material MgH2 -1 wt% Fe sebagai fungsi dari waktu milling dan intensitas. Pada saat campuran material tersebut masih berada pada tahap pre-milling terlihat jelas
bahwa ada dua fasa yang hadir yakni magnesium hidrida (MgH2) dan Fe pada kedudukan 2θ = 52.55o. Sedangkan MgH2 peak muncul pada 2θ = 32.75o, 42.05o, 61.66o, 68.24o, 77.73o, 81.85o, 83.23o, 90.93o, 101,39o.
Ketika milling berlangsung selama 2 jam, bentuk pola difraksi masih belum menunjukkan perubahan yang berarti. Disini dapat diketahui bahwa ukuran kristal masih mikrokristal. Situasi berbeda mulai ditunjukkan pada milling selam 10 jam, dimana puncak (peak) difraksi mulai melebar. Dapat disebut bahwa pada waktu milling 10 jam mulai terjadi reduksi ukuran butir.
Perbedaan yang signifikan terlihat pada waktu milling 20, 40 dan 60, pelebaran peak makin terlihat secara jelas. Begitupun, tidak ada perubahan posisi 2θ. dapat disimpulkan peak makin melebar seiring dengan meningkatkan waktu milling. Patut juga dicatat bahwa saat mill-ing berlangsung selam 20 jam, fasa metastabil g-MgH2 muncul pada kedudukan 2θ = 30.22o. Den-gan begitu ukuran kristal menuju ke arah nanok-ristal seiring dengan meningkatnya waktu milling. Dengan adanya reduksi ini akan terjadi peningka-tan permukaan material terhadap rasio volume butir. Dengan demikian hidrogen akan mudah ber-interaksi dan berabsorpsi di dalam material MgH2.
Hasil yang menarik tampak nyata setelah milling berlangsung selama 80 jam, dimana peak makin membesar/melebar secara ekstrem.Ini memberikan indikasi bahwa ukuran kristal sudah berada pada skala nanometer. Dengan kalkulasi Debye-Scherrer diketahui ukuran kristal berkisar 10 nanometer.
Bulletin of Chemical Reaction Engineering & Catalysis, 4(2), 2009, 70
Copyright © 2009, BCREC, ISSN 1978-2993
20 30 40 50 60 70 80 90
MgH2 MgH2 MgH2
MgH2
Inte
nsity
(a.
u.)
2 Theta
MgH2+ 1wt% Fe miling 80 jam
as received
2 jam
4 jam
10 jam
20 jam
40 jam
60 jam
80 jam
γ
γ
γ
γ
MgH2 MgH2
MgH2
MgH2
Fe
Gambar 1. Pola difraksi sinar-X MgH2-1 wt% Fe

Hasil observasi dengan mikroskop elektron (SEM) menunjukkan bahwa ukuran kristal terli-hat sangat halus. Gambar 2 memperlihatkan mor-fologi kristal setelah proses miling selama 80 jam.
Reduksi ukuran butir sangat berpengaruh pada material untuk hydrogen storage. Secara ringkas dapat dilihat pada kurva absorpsi (Gambar 3) berikut ini.
Pada penelitian ini diketahui bahwa dengan bertambahnya waktu miling maka terjadi pening-katan serapan hidrogen di dalam magnesium hidrida berkatalis besi 1 wt%. Pada gambar 2 di-tunjukkan hidrogen dapat diserap sebanyak 5,5 wt% dalam waktu 25 menit pada temperatur dan tekanan konstan (300 oC, 10 bar).
Suhu operasional ini masih sangat tinggi untuk aplikasi pada industri otomotif. Sebab itu perlu dilakukan upaya sistematis lanjutan guna menurunkan temperatur operasional material penyimpan hidrogen berbasis Mg. Begitupun, jelas terlihat bahwa kemampuan absorpsi MgH2 yang dikatalisasi dengan Fe mendekati nilai teoritis (7,6 wt%). Hanya saja kendala temperatur operasi yang tinggi (300 oC) masih belum dapat diperbaiki.
Hasil penelitian ini sekaligus juga memperli-hatkan bahwa teknik mechanical alloying meng-gunakan ball mill sangat atraktif dan menjanjikan dalam preparasi material berskala nanokristal [7]. Seperti disebut di atas, bila ukuran partikel makin kecil maka hidrogen yang diserap akan makin ban-yak. Sebab bila daerah permukaan material makin lebar akan memudahkan hidrogen berinteraksi dan berabsorpsi.
4. KESIMPULAN Preparasi dan karakterisasi struktural den-
gan sinar-X dari material berbasis magnesium, dalam hal ini MgH2 telah berhasil dilakukan den-gan menggunakan teknik preparasi menggunakan ball milling dalam suasana argon. Waktu milling yang berlangsung selama 80 jam, berhasil mere-duksi ukuran material hingga skala nanokristal. Penggunaan katalis Fe dalam jumlah kecil (1 wt%) melalui XRD terlihat juga muncul peak dari awal hingga akhir milling. Dapat dicatat bahwa fasa metastabil γ-MgH2 muncul pada milling 20 jam pada kisaran sudut difraksi 2θ = 30.22o. Semakin lama waktu milling, konsentrasi MgH2 dan Fe meningkat sehingga terlihat peak makin membe-sar. Ini merupakan indikasi terjadinya proses re-duksi butir menuju skala nanometer. Tidak ada perubahan dalam komposisi fasa. Sifat serapan melalui analisa gravimetrik.diketahui bahwa MgH2 — 1 wt% Fe mampu menyerap hydrogen se-besar 5,5 wt% dalam waktu 20 menit pada tem-peratur operasional 300 oC.
DAFTAR PUSTAKA
[1] Schlapbach and Zuettel, Hydrogen storage materials for mobile applications, Nature, Vol 414, 15 November 2001.
[2] G. Liang, Synthesis and hydrogen storage properties of Mg-based alloys, Journal of Al-loys and Compounds, 370, (2004), 123-128.
[3] F.C. Gennari, F.J. Castro, G. Urretavizcaya, Hydrogen desorption behavior from magne-sium hydrides synthesized by reactive me-
Bulletin of Chemical Reaction Engineering & Catalysis, 4(2), 2009, 71
Copyright © 2009, BCREC, ISSN 1978-2993
Gambar 2. Morfologi material dengan SEM
20 40 600
1
2
3
4
5
6
nc-MgH2, 80 jam miling nc-MgH2-1wt% Fe, 80 jam miling
Abso
rsi h
idro
gen(
wt%
)
Waktu(menit)
p g g j g
Gambar 3. Kurva sifat absorpsi MgH2-1wt% Fe pasca miling 80 jam

chanical alloying, Journal of Alloys and Com-pounds, 321, (2001), 46-53.
[4] T. Ichikawa, N. Hanada, S. Isobe, H. Leng, H. Fujii, Composite materials based on light ele-ments for hydrogen storage, Materials Trans-actions, 46, (2005), 1-14.
[5] W. Oelerich, T. Klassen, R. Bormann, Metal oxides as catalysts for improved hydrogen sorption in nanocrystalline Mg-based materi-als, Journal of Alloys and Compounds 315 (2001) 237-242.
[6] R.A. Varin, T. Czujko, E.B. Wasmund, Z.S. Wronski, Hydrogen desorption properties of MgH2 nanocomposites with nano-oxides and Inco micrometric- and nanometric-Ni, Jour-nal of Alloys and Compounds, 446-447, (2007), 63-66.
[7] Zaluska, A., Zaluski, L. & Stroem-Olsen, J. O. Structure, catalysis and atomic reactions on the nanoscale: a systematic approach to metal hydrides for hydrogen storage. Appl. Phys. A 72, 157 (2001).
Bulletin of Chemical Reaction Engineering & Catalysis, 4(2), 2009, 72
Copyright © 2009, BCREC, ISSN 1978-2993

Bulletin of Chemical Reaction Engineering & Catalysis, 4(2), 2009, 73-75

Bulletin of Chemical Reaction Engineering & Catalysis, 4(2), 2009, 74

Bulletin of Chemical Reaction Engineering & Catalysis, 4(2), 2009, 75
Bulletin of Chemical Reaction Engineering & Catalysis, 4(2), 2009, 76
The Authors submitting a manuscript do so on the understanding that if accepted for publication, copy-right of the article shall be assigned to Bulletin of Chemical Reaction Engineering Journal and Depart-ment of Chemical Engineering Diponegoro University as publisher of the journal.
Copyright encompasses exclusive rights to reproduce and deliver the article in all form and media, in-cluding reprints, photographs, microfilms and any other similar reproductions, as well as translations. The reproduction of any part of this journal, its storage in databases and its transmission by any form or media, such as electronic, electrostatic and mechanical copies, photocopies, recordings, magnetic media, etc. , will be allowed only with a written permission from Bulletin of Chemical Reaction Engineering Journal and Department of Chemical Engineering Diponegoro University.
Bulletin of Chemical Reaction Engineering Journal and Department of Chemical Engineering Dipone-goro University, the Editors and the Advisory International Editorial Board make every effort to ensure that no wrong or misleading data, opinions or statements be published in the journal. In any way, the contents of the articles and advertisements published in the Bulletin of Chemical Reaction Engineering and Catalysis (BCREC) are sole and exclusive responsibility of their respective authors and advertisers. Therefore, Bulletin of Chemical Reaction Engineering Journal and Department of Chemical Engineering Diponegoro University), the Editors and the Advisory International Editorial Board
The Copyright Transfer Form can be downloaded at BCREC website (http://bcrec.undip.ac.id/copyright-transfer-agreement )
The copyright form should be signed originally and send to the Editorial Office in the form of original mail, scanned document or fax to:
Dr. ISTADI Editorial Office of Bulletin of Chemical Reaction Engineering and Catalysis Department of Chemical Engineering, Diponegoro University Jl. Prof. Sudharto, Kampus UNDIP Tembalang, Semarang, Central Java, Indone-sia 50239 Telp.: +62-24-7460058, Fax.: +62-24-76480675 E-mail: [email protected]
COPYRIGHT TRANSFER AGREEMENT

Bulletin of Chemical Reaction Engineering & Catalysis, 4(2), 2009, 77

Bulletin of Chemical Reaction Engineering & Catalysis, 4(2), 2009, 78
This page intentionally left blank

Volume 4, Number 2, Year 2009, 31 December 2009
Bulletin of Chemical Reaction Engineering & Catalysis
SUBMISSION INFORMATION
All manuscripts can be submitted to the editorial office by e-mail to: [email protected]. The following materials should accompany manuscripts submitted to the editorial office: • signed copyright status form (a copy reproduced from the website), • a covering letter, outlines the basic findings of the paper and their significance. However, if for any reason authors are unable to use the above methods, they may also send the manuscripts by regular mail to the editorial office according to the following address:
Dr. ISTADI Editorial Office of Bulletin of Chemical Reaction Engineering and Catalysis Department of Chemical Engineering, Diponegoro University Jl. Prof. Sudharto, Kampus UNDIP Tembalang, Semarang, Central Java, Indonesia 50239 Telp.: +62-24-7460058, Fax.: +62-24-76480675
Four types of manuscripts are acceptable for publication: Research articles, Review articles, and Research Notes. Preparation of manuscripts Manuscript of research article or reviews should be prepared in ‘camera ready’ as above templates, according to the guidelines in the website: http://bcrec.undip.ac.id/author-guidelines Reviewing of manuscripts Every submitted paper is independently reviewed by at least two peers. Decision for publication, amendment, or rejection is based upon their reports. If two or more reviewers consider a manuscript unsuitable for publication in this Journal, a statement explaining the basis for the decision will be sent to the authors within three months of the submission date. Manuscripts rejected will not be returned to the authors. Revision of manuscripts Manuscripts sent back to the authors for revision should be returned to the editor without delay. The revised manuscripts can be sent to editorial office by e-mail ( [email protected] ). The revised manuscripts returned later than three months will be considered as new submissions.