Biomedicinska instrumentacija - FER
109
Biomedicinska instrumentacija Sveučilište u Zagrebu Fakultet elektrotehnike i računarstva 1 Electrocardiographs Blood pressure and other cardiovascular measurements and instrumentation prof. dr. sc. Ratko Magjarević
-
Upload
khangminh22 -
Category
Documents
-
view
3 -
download
0
Transcript of Biomedicinska instrumentacija - FER

Biomedicinska instrumentacija
Sveučilište u ZagrebuFakultet elektrotehnike i računarstva
11
Electrocardiographs
Blood pressure and other cardiovascular
measurements and instrumentation
prof. dr. sc. Ratko Magjarević

Outline
➢ Cardiovascular system
➢ Generation of ECG signal
➢ Blood pressure and measurement devices
➢ Blood flow and measurement devices

3
Cardiovascular system
➢ Pulmonary circulation: • right heart sends deoxygenated
blood to the lungs through pulmonary arteries
• oxygenated blood flows into the left heart through pulmonary veins
➢ Systemic circulation:• supplies organs with oxygenated
blood
• enables exchange of nutrients, dissolved gasses and waste products

4
= heart + blood vessels
➢ transportation system
➢ ensures transportation of nutrients, hormones, metabolic waste products, O2 and CO2
throughout the body to maintain cell-level metabolism
➢ synonym: circulatory system
Cardiovascular system

5
The Heart
➢ a hollow, muscular organ
➢ contracting rhythmically
➢ keeps up the circulation of the blood
➢ each day, the average heart beats 100.000 times
➢ 3.5 billion times in an average lifetime

6
Anatomy of the Heart
➢ four-chambermechanical pump
➢ upper chambers - left and right atria
➢ lower chambers - left and right ventricles
➢ septum (a wall of muscle) separates the left and the right heart

7
Cardiac Cycle
➢ Events during one heartbeat:• The cycle is initiated
by electrical activity
• Contraction of cardiac muscles generates changes in blood pressure and flow
• Opening and closing of cardiac valves generates cardiac sounds

8
Cardiac Cycle
➢ events during one heartbeat
➢ ventricles fill during diastole
➢ ventricles contract during systole
➢ heart rate or pulse –the rate at which the heart beats (75 bpm in adult, resting)

9

10
Cardiac Excitation
➢ sinoatrial node – primary pacemaker
➢ specialized muscle tissue, characteristics of both, muscle and nerves (contracts and generates impulses)
➢ self-excitable
➢ pulses spread at rate of approx. 1 m/s through atria to the atrioventricular node
11
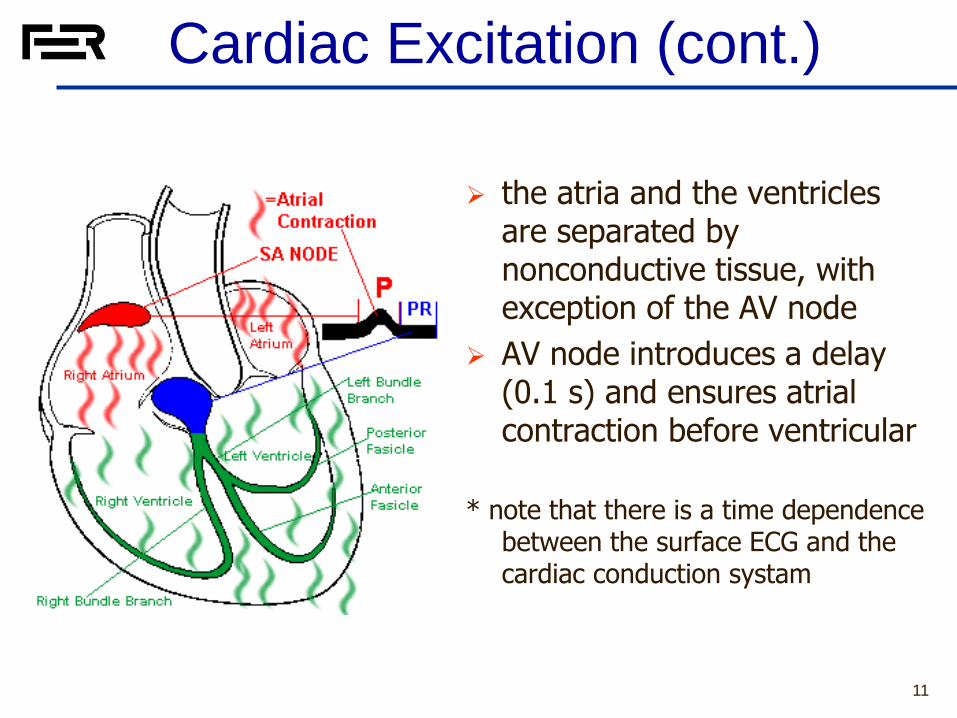
Cardiac Excitation (cont.)
➢ the atria and the ventricles are separated by nonconductive tissue, with exception of the AV node
➢ AV node introduces a delay (0.1 s) and ensures atrial contraction before ventricular
* note that there is a time dependence between the surface ECG and the cardiac conduction systam

12
Cardiac Excitation (cont.)
➢ After delay, the excitation signal is conducted through the bundle of His, down to the heart apex
➢ and then upwards, through the Purkinje fibers
➢ which leads to ventricular contraction
13
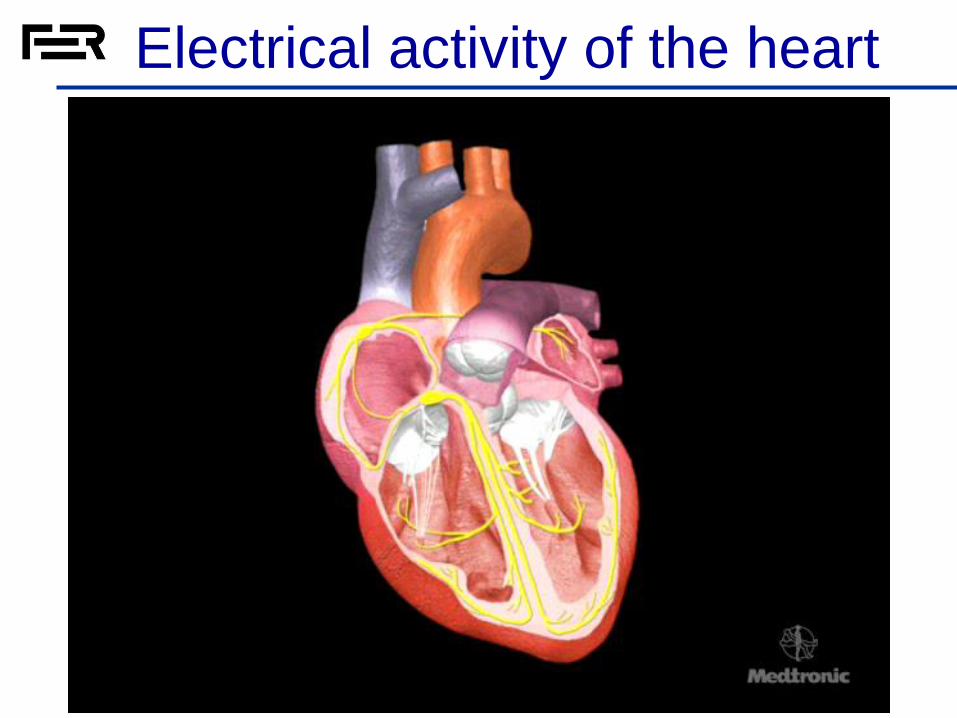
Electrical activity of the heart

14
Intracardiac ECG
➢ Different types of heart cells –different characteristics
➢ Action potentials of the different heart tissue are also different from action potentials of other excitable cells

15
Electrocardiogram (ECG)
➢ records the electrical activity of the heart, shows abnormal rhythms (arrhythmias or dysrhythmias), and detects heart muscle damage, heart rate, heart rate variability, analysis of the waveform morphology and other similar functions.
Surface ECG

16
ECG Characteristic Parts
P-wave - depolarisation of atria (0,05s - 0,1s)
PR interval – delay through the AV node
QRS complex – depolarisation of the ventricles ( <= 0,1s))
T-wave - repolarisation of the ventricles (approx. 0,3s)
PQ - interval (<0,2s)
QT - interval (depends on HR, at70 b/min from 0,32s to 0,39s)

17
ECG Characteristic Parts
Analysis software detects and reports on P, Q, R, S, and T wave onsets, amplitudes, and intervals in real-time, or post data recording
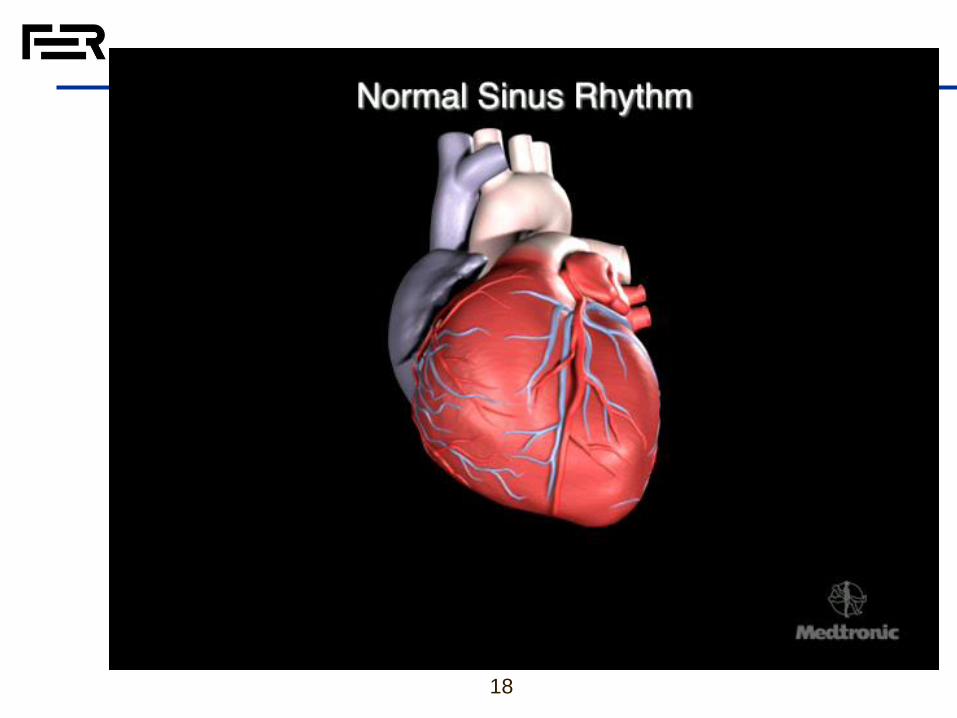
18

19
ECG Leads
• Standard leads –
recorded at the
body surface
• Heart – electrical
equivalent generator
represented as an
electrical dipole
• The dipole changes
its magnitude and
orientation

20
ECG Notation
➢ Standard notation in frontal plane:
➢ Leads I, II and III are forming the Eindhoven’s triangle
➢ Augmented leads: increase the magnitude of the signal 50%

21
Precordial leads
➢ Position of the precordial leads on the chest wall
➢ Different “view” on the heart activity

22
12 channel ECG record

Generation of ECG – I lead
➢ Vector representation of the biopotentials of the heart and the projection inot ECG leads
➢ See http://www.bem.fi/book/15/15.htmfor more details
23

Generation of ECG – I lead
24

Goldberg Augmented Leads
25
(A) The circuit of the Goldberger augmented leads.
(B) The location of the Goldberger augmented lead vectors in the image space.

26
Natural Heart Pacemakers
Sinoatrial node (SA node) - primary heart rate generator (pacemaker); frequency approx. 70/min in static - sino rhythm
Atrioventricular node (AV node) - secondary generator, frequency approx. 40 - 60/min - nodal rhythm
Ventricular conduction system - tertiary generator, frequency approx. 25 - 40/min, not effective enough

27
Normal Heart Rythm
➢ Normal heart rhythm is considered to be approx. 72 b/min in healthy adult persons. In newborn babies, the normal heart rate is 120-160 beats per minute.
Bradycardia is an
abnormally slow heart rate
(<60/min at rest)
Tachycardia is an abnormally fast heart rate (>100/min at rest).
28
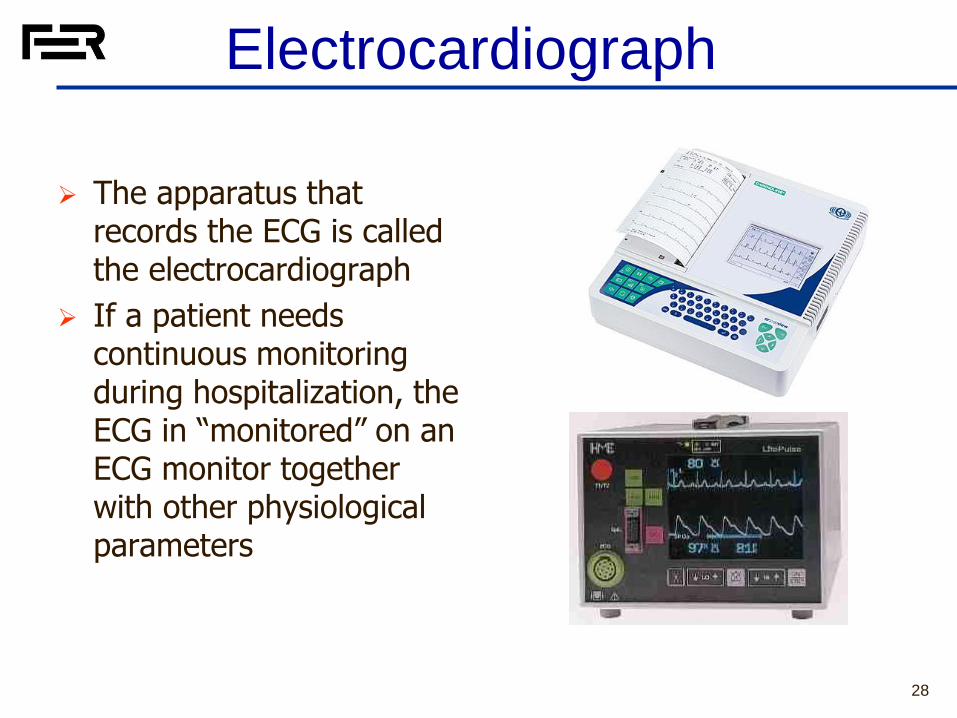
Electrocardiograph
➢ The apparatus that records the ECG is called the electrocardiograph
➢ If a patient needs continuous monitoring during hospitalization, the ECG in “monitored” on an ECG monitor together with other physiological parameters

29
Types of ECG records
There are 3 main types of ECG:
➢ a resting ECG – carried out while the patient is lying down in a comfortable position
➢ a stress or exercise ECG – carried out while thepatient is using an exercise bike or treadmill
➢ an ambulatory ECG (ECG holter) – the electrodes are connected to a small portable recorder worn at thepatient’s waist so the heart can be monitored at home for one or more days

30
ECG Amplifier➢ The most important part of any equipment
recording bioelectric potentials is the input amplifier
➢ Most important input characteristics:• Differential measurement (differential or instrumetation
amplifier)
• High gain (input signal 50uV to 1 mV)
• High common mode rejection ratio (CMRR)
• Frequency range typically from 0,05 Hz to >=100 Hz
• Very high input impedance
• Low noise
31
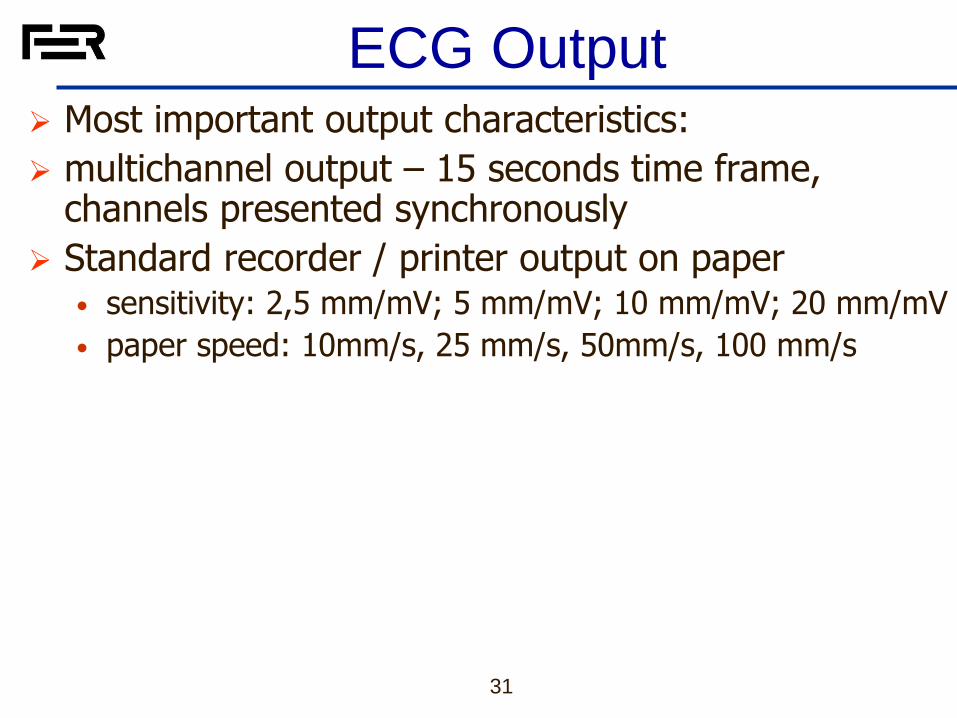
ECG Output➢ Most important output characteristics:
➢ multichannel output – 15 seconds time frame, channels presented synchronously
➢ Standard recorder / printer output on paper• sensitivity: 2,5 mm/mV; 5 mm/mV; 10 mm/mV; 20 mm/mV
• paper speed: 10mm/s, 25 mm/s, 50mm/s, 100 mm/s

32
ECG Data storage• different formats
• MIT BIH signal database (scientific)
• Interoperability issues

33
ECG Data storage• The DICOM standard is a set of rules that allows medical images to be
digitally exchanged, viewed and archived.
• Since the year 2000 the widely used DICOM standard has included rules for diagnostic ECG waveforms,
• Diagnostic 12 lead DICOM ECGs sent to DICOM network servers can be reviewed on DICOM workstations in conjunction with typical DICOM images like cardiovascular angiographic x-ray and cardiac US images.
➢ From: T. Hilbel et al. Innovation and advantage of the DICOM ECG standard for viewing, interchange and permanent archiving of the diagnostic electrocardiogram, Computers in Cardiology, 2007, DOI: 10.1109/CIC.2007.4745565

34
ECG Equipment classification
➢ ECG recorders
• classification to the number of channels
• 1 channel ECG
• 3 channel ECG
• 6 channel ECG
• 12 channel ECG
• > 12 channel ECG

35
ECG Block Diagram
Block diagram of a basic single channel ECGFrom: Sinha V. MOBILE-BASED TELE-ECG FOR RURAL HEALTH CARE,
2009

36
Mobile ECG Block Diagram
Block diagram of a handheld ECG unit.From: Sinha V. MOBILE-BASED TELE-ECG FOR RURAL HEALTH CARE,
2009

37
Mobile ECG Block Diagram
Flow diagram of the embedded software for tele-ECG and mobile application.
From: Sinha V. MOBILE-BASED TELE-ECG FOR RURAL HEALTH CARE, 2009
38
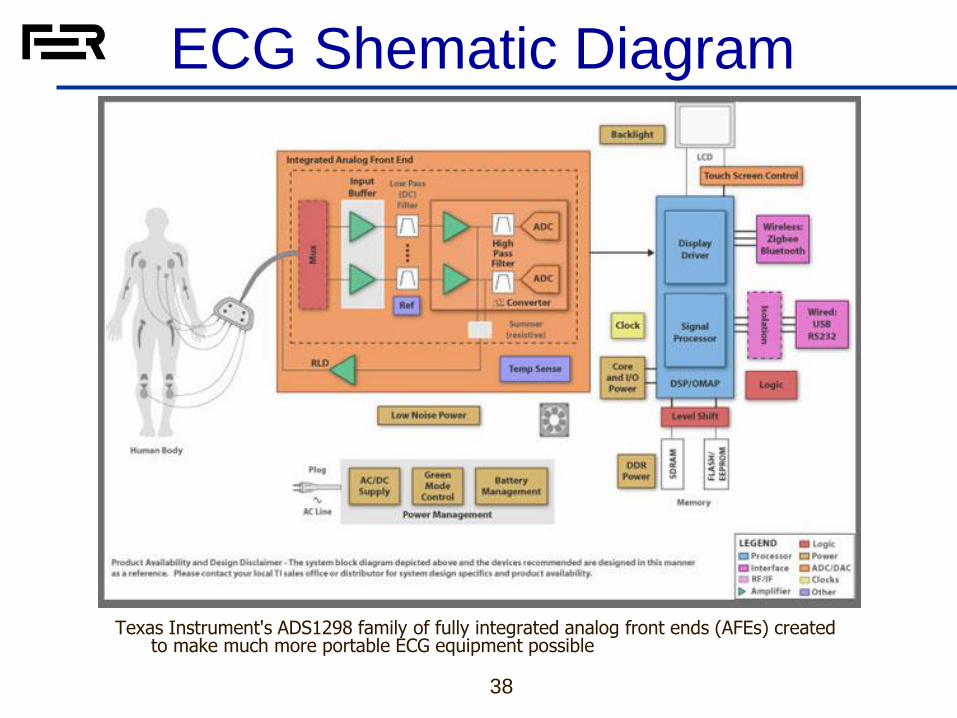
ECG Shematic Diagram
Texas Instrument's ADS1298 family of fully integrated analog front ends (AFEs) created to make much more portable ECG equipment possible

39
ECG Shematic Diagram

40
ECG ADS1298 Features
ANSI/AAMI EC11:1991/(R)2001, Diagnostic
Electrocardiographic Devices, 2ed, Establishes
minimum safety and performance requirements for
electrocardiographic (ECG) systems with direct writing
devices which are intended for use in the analysis of
rhythm and of detailed morphology of complex cardiac
complexes.
AAMI EC13 2nd Ed, 2007, Cardiac monitors, heart rate
meters, and alarms
IEC 60601 is a series of technical standards for the
safety and essential performance of medical electrical
equipment, published by the International
Electrotechnical Commission.
IEC 60601-2-27:2011
Medical electrical equipment - Part 2-27: Particular
requirements for the basic safety and essential
performance of electrocardiographic monitoring
equipment
IEC 60601-2-25:2011
Medical electrical equipment - Part 2-25: Particular
requirements for the basic safety and essential
performance of electrocardiographs

41
ECG processing - example
A system for heartbeat classification, which included three main
stages: preprocessing, feature extraction and classification.From: de Figueiredo Dalvi R et al. Heartbeat classification system based on neural
networks and dimensionality reduction, 2017, https://doi.org/10.1590/2446-4740.05815

ECG Shematic Diagram
A system for heartbeat classification, which included three main
stages: preprocessing, feature extraction and classification.From: de Figueiredo Dalvi R et al. Heartbeat classification system based on neural
networks and dimensionality reduction, 2017, https://doi.org/10.1590/2446-4740.05815

43
➢ An operational amplifier which derives common mode voltage, inverts it and returns to the patient through the right leg. The patient is not grounded.
ECG Amplifier with Right Leg Drive

44
Analysis of the ECG
➢ Analysis of the ECG waveform
➢ Extraction of various features of the waveform
• eg. heart rate
• time domain analysis - waveform
• frequency domain analysis – spectra
• statistical analysis – HR variability, ....

45
Diagnostic parameters

46
Cardiotachometers - heart rate meters
HR = heart rate
measurement of the number of heart beats in a minute
Definition:
HR = BeatsNumber / T
T = 1 minute

47
Cardiotachometers Two types:
➢ the beat−to−beat heart rate meter which computes the reciprocal of the time interval between two consecutive heart beats and updates the information with each heart beat.
➢ the averaging heart rate meter -calculates the average heart rate from a count of the number of beats over a period of time.
NR – number of detected R waves
TRR – RR interval
int
1
RRHR =
=
RN
RR
R
T
NHR
1
➢ Why do we measure heart rate in a period of time shorterthan 1 minute?

48
QRS detection
➢ Easiest way – thresholding (voltage comparator)
UK
False detections?
- artefacts
- interference
- pacemaker
- baseline wander
- high T wave......

49
QRS detector structure
• QRS detectors can be used:
• HR measurement and monitoring
• synchronization of the pacemakers

50
Pan-Tompkins QRS detector
( )( )
26
1 2
1 1 1
1
(1 )
( ) 2 ( 1) ( 2) ( ) 2 ( 6) ( 12)
zH z
z
y n y n y n x n x n x n
−
−
−=
−
= − − − + − − + −
( )16 17 32
1
2 2 1 1 1 1
1 32 32
32
32 ( ) ( 1) ( ) 32 ( 16) 32 ( 17) ( 32)
z z zH z
z
y n y n y n y n y n y n
− − −
−
− + − +=
−
= − − + − − − − −
( ) ( )( )
1 3 4
3 2 2 2 2
(1/8) 2 1 1 2
( ) 1/8 2 ( ) 1 ( 1) 1 ( 3) 2 ( 4)
H z z z z
y n y n y n y n y n
− − −= + − −
= + − − − − −
• LP, recursive (IIR)
• HP, recursive (IIR)
• derivation
• squaring
2
4 3( ) ( )y n y n=
4 4 4
1( ) ( 1) ( 2) ( )z n y n N y n N y n
N= − − + − − + +
• integration
• adaptive thresholds

Diagnostics and Therapy of
the Heart, 2011
51
Performance evaluation
➢ ANSI/AAMI EC57 standard
• sensitivitiy
• positive predictive value
• specificity
TPS
TP FN=
+TP
PPTP FP
=+
FPTN
TNSp
+=

52
Performance evaluation
➢ sensitivity and positive predictive value in online detectors reach 99.5% without greater processing load
• offline detectors use backward search and in general have better performance
• artefacts and pathological signals are still a problem and a challenge

53
Literature➢ John G. Webster: Medical Instrumentation, Chapter
4, The Origin of Biopotentials; Chapter 6, Biopotential Amplifiers
➢ B. U. Kohler, C. Henning, and R. Orglmeister, “The principles of software QRS detection,” IEEE Engineering in Medicine and Biology, vol. 21, pp. 42–57, 2002.
➢ A. Šantić, Biomedicinska elektronika, 2. poglavlje, Mjerenje bioelektričkih potencijala

Blood pressure
➢ Blood pressure is the lateral pressure on the blood vessel wall surface
➢ The difference in blood pressure (pressure gradient) between the aorta and veins is a result of heart beating, which is the main activator of blood in the cardiovascular system
➢ During heart muscle relaxation, pressure still exists in the veins as a result of vein blood charge and contraction of smooth muscle in the vessel wall.

Blood vessels pressure and flow
➢ The character of blood pressure and blood flow in arteries is pulsating
➢ The flow in veins and capillaries is mostly static,pressure is significantly lower than arteries, no pulse
From: Chambers, D., Huang, C., & Matthews, G. (2019). Cardiovascular Physiology. In Basic Physiology for
Anaesthetists (pp. 111-188). Cambridge: Cambridge University Press.

56
Computed pressure and flow waveforms in the aorta, the arm, and the brain. Results are shown as obtained using the simulation with element size Δz = 2.5 mm and time step Δt = 1 ms. The arrows indicate increase in distance from the aortic root.

Relations of significant physiological parameters
in different parts of the circulatory system
Mean arterial pressure, blood flow velocity, vesselcross-sectional area and theblood volume in the veinsof sistematic blood circulation AO - aorta, VA - great arteries, MA - small arteries, ART - arterioles, DROP - capillaries, VEN - venules, MV - small veins, VV - large veins, VK – vena cava

➢ Mean arterial blood pressure approximately corresponds to aorta medium pressure. In arterioles there is a signicifant pressure drop and pulse attenuation
➢ Blood flow velocity in any part of the circulatory system is inversely proportional to the cross-sectional area of all vessels in that segment
➢ Mean flow velocity in capillaries is approx. thousand times lower than in the aorta, because the total cross-sectional area of capillaries is approx. thousand times greater than the cross-sectional area of the aorta
➢ Since the flow velocity is not the same throughout the vessel cross section, mean velocity is considered
➢ Blood flow velocity gradually increases on the waytoward the right atrium.
➢ Venous system volume capacity is significantly larger (about 65% of the total volume of blood is in the veins)
Relations of significant physiological parameters
in different parts of the circulatory system

Cardiac cycle

Arterial blood pressure
➢ Typical pressures:• systolic (maximum)• diastolic (minimum)• mean arterial pressure psr
• pulse pressure
p [mmHg]
t [s]
Systolic pressure
Diastolic pressure
Medium arterial
pressure
t2 t1
0 10 20 30 40 50
90
60 70 80
100
120 110
130
0 1 2 3 4
Pulse pressure

Characteristic values of arterial pressure
➢ Pressure changes rhythmicaly between the maximum and minimum values depending on the heart action. The highest stage is the systolic ejection of blood from the heart (maximum or systolic pressure) and the lowest isdiastolic end (minimum or diastolic pressure).
➢ Mean arterial pressure is defined as mean waveformarterial pressure
➢ Mean arterial pressure is not equal to the arithmetic mean of systolic and diastolic pressure. It is slightly closer to diastolic values
➢ Pulse pressure is the difference between systolic and diastolic pressure

Blood pressure measuring units
➢ Blood pressure is measured in millimeters of mercury, mm Hg
➢ mmHg is not SI units, but is allowed for expressing blood pressure
➢ 1 kPa = 7.5 mmHg
➢ Units in the line are converted into units in a column by multiplying by a factor in the table. * at 0 °C, ** at 4 °C *** PSI - pounds per square inch.
kPa mmHg mbar cmH2O PSI
kPa 1,000 7,5006 10,000 10,1973 0,14504
mmHg * 0,13332 1,000 1,3332 1,3595 1,9377 10-2
mbar 0,100 0,75006 1,000 1,01973 0,01450
cmH2O ** 0,09806 0,7355 0,9806 1,000 1,4223 10-2
PSI *** 6,8948 51,715 68,948 68,948 1,000

Normal blood pressure
➢ Normal blood pressure is 120/80 mmHg
➢ Hypertension - Blood pressure high
➢ Hypotension - Blood pressure low
mm[Hg] Systolic
pressure
Diastolic
pressure
Normal < 140 < 90
Borderline hypertension 140 - 160 90 – 95
Hypertension
Isolated sistolic
hypertension
> 160
> 160
> 95
< 90

Blood pressure measurement
➢ Each vessel has its own blood pressure value
➢ Blood pressure depends on where it is measured
➢ Each heart beat results in different blood pressure
➢ Primarily to measure arterial pressure and its two values: systolic pressure and diastolic pressure

Blood pressure measurement➢ Invasive methods (direct)
• Retracting the catheter into a blood vessel• Intravascular or external pressure sensor (into the
vein)Advantages:• The most accurate method• Gives a total pressure waveformDisadvantages:• Invasiveness, the possibility of infection, the
possibility of embolism• Application in hospital conditions• External blood pressure sensor - it is necessary to
mind the resonant frequency

Blood pressure measurement
➢ Noninvasive (indirect) methods
• Pressure is measured indirectly, usually usingcufflinks
• Do not measure the pressure in the blood vessel
• Lower accuracy comparing to direct methods

Korotkov method
(also called Riva-Rocci auscultatory method)

Korotkov method
➢ Cuff wrapped around the upper arm➢ Put the stethoscope in the cubital fossa , distal to the cuff➢ Pump inflate the cuff above the expected systolic pressure➢ The pressure in the cuff overcomes the brachial artery
pressure ➢ Open the valve and empty the cuff 3-5 mmHg per beat➢ When the cuff pressure drops to a value of systolic blood
pressure, Korotkovljev noise (phase I) hearable in thestethoscope
➢ The pressure in the cuff at that point is the systolic pressure
➢ Further cuff discharge changes the intensity and character of the Korotkov noise
➢ When the noise is silenced and lost (Phase IV), the cuff pressure corresponds to diastolic pressure

Korotkov method➢ Korotkov noise is due to turbulence of blood flowing
through partly open artery➢ Accuracy comparison of auscultatory methods to
invasive methods:• Systolic pressure error : -2 mmHg• Diastolic pressure error : +4 to +10 mmHg
➢ Error due to hydrostatic pressure• None if the place of measurement is on the same level
as heart
➢ Accuracy can be affected by the width of cufflinks➢ Standard width of an average population is 12 cm➢ If upper arm has a large volume, the cuff must be
broader

Korotkov method
➢ Korotkov method can be automatized in terms of cuff inflation and drain, microphonerecording of Korotkov noise instead of a stethoscope, and automatic recognition of noise
➢ Disadvantage of such automated methods is in microphone recording of other ambient sounds which makes it difficult to identify the Korotkov noise

Oscillometric method
➢ Cuff pressure with superimposed Korotkoff sounds, which appear between systolic and diastolic pressures. Bottom: the oscillometric method detects when the amplified cuff pressure pulsations exceed about 30% of maximal pulsations.

Oscillometric method
➢ Oscillometric method is based on pressure fluctuations that occur due to arterial pulsation in the pressure cuff during inflation or discharge
➢ Cuff is inflated above the expectation values of systolic pressure and begins to discharge
➢ During the discharge waveform of pressure cuff is recorded➢ The pressure in the cuff has a caused slow drop-down discharge
component and a superimposed small component of the pressure oscillations in the cuff
➢ These oscillations exist above sistolic pressure and below diastolicpressure
➢ Oscillation amplitude changes, grows, reaches its maximum and then decreases
➢ Oscillations maximum correspondes to the moment when the pressure in the cuff is equal to mean arterial pressure
➢ Systolic and diastolic blood pressure are determined indirectly by oscillometric method, based on the mean arterial pressure andempirically determined ratios

Oscillometric method
➢ Systolic ratio:ksyst = Asyst / Amax (typ 0.5)
➢ Diastolic ratio:kdiast = Adiast / Amax (typ 0.4-0.7)
➢ Systolic pressure is measured as the mean pressure in the cuff, which is higher than the mean arterial pressure and hasamplitude fluctuations Asyst and maximum amplitude Amax ratio (systolic ratio) equal to a defined value ksyst.
➢ Diastolic pressure is defined as the mean pressure in the cuff,which is lower than the mean arterial pressure and has amplitude fluctuations Adiast and maximum amplitude Amaxratio (diastolic ratio) equal to a defined value kdiast
➢ Method error : 5-10 mmHg
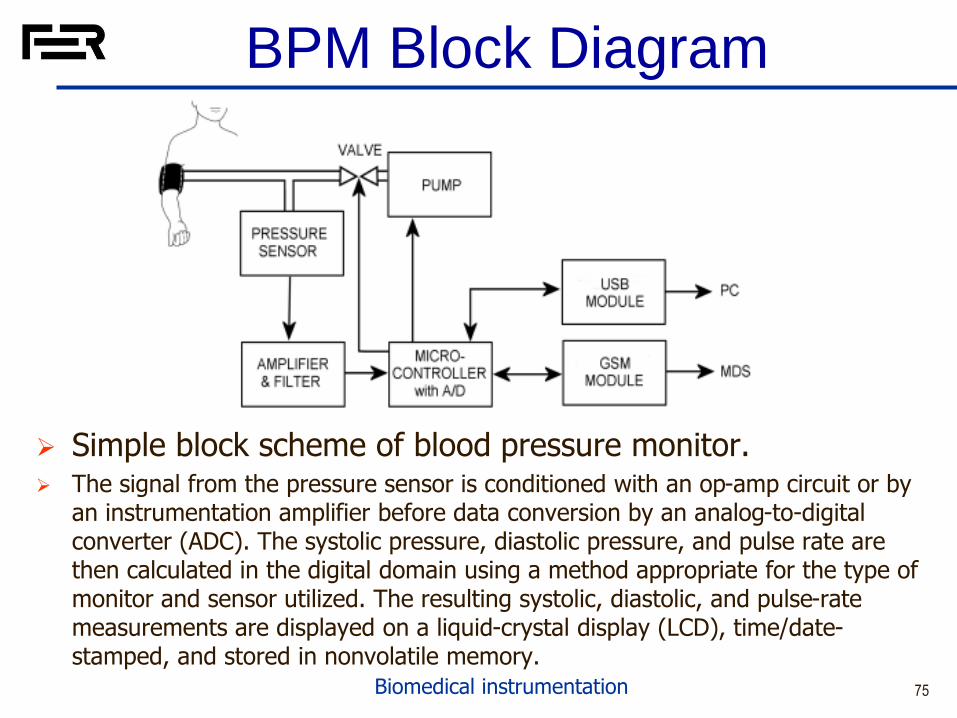
BPM Block Diagram
➢ Simple block scheme of blood pressure monitor.➢ The signal from the pressure sensor is conditioned with an op-amp circuit or by
an instrumentation amplifier before data conversion by an analog-to-digital converter (ADC). The systolic pressure, diastolic pressure, and pulse rate are then calculated in the digital domain using a method appropriate for the type of monitor and sensor utilized. The resulting systolic, diastolic, and pulse-rate measurements are displayed on a liquid-crystal display (LCD), time/date-stamped, and stored in nonvolatile memory.
75Biomedical instrumentation

BPM Block Diagram
76Biomedical instrumentation
Functional block diagram of a blood pressure monitor that includes
an advanced voice indicator.

BPM Block Diagram
77Biomedical instrumentation
The signal from the pressure sensor is conditioned with an op-amp circuit or
by an instrumentation amplifier before data conversion by an analog-to-
digital converter (ADC). The systolic pressure, diastolic pressure, and pulse
rate are then calculated in the digital domain using a method appropriate for
the type of monitor and sensor utilized. The resulting systolic, diastolic, and
pulse-rate measurements are displayed on a liquid-crystal display (LCD),
time/date-stamped, and stored in nonvolatile memory.

Pulse transit time monitoring
Pulse transit time (PTT) monitoring of blood pressure is ment for continous monitoring of blood pressure
78Biomedical instrumentation

Blood pressure monitor
79Biomedical instrumentation
Blood pressure monitor = Sphygmomanometer
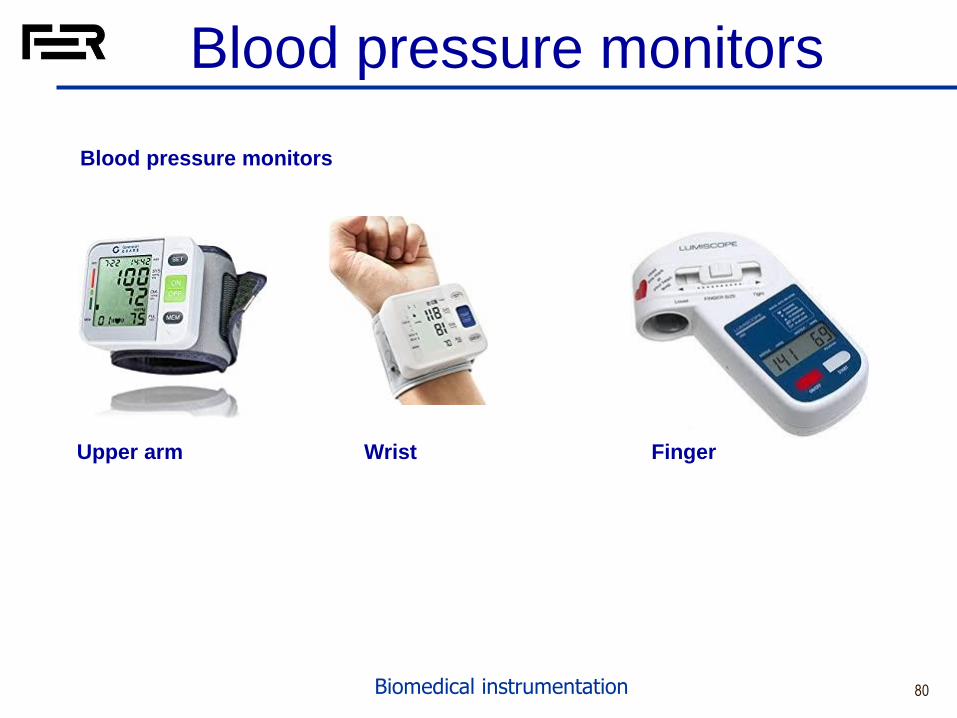
Blood pressure monitors
80Biomedical instrumentation
Blood pressure monitors
Upper arm Wrist Finger

Blood pressure monitor
➢ Oscillometric measurement, using an inflatable cuff within the watch band.
81Biomedical instrumentation
Blood pressure measurement up to 100 times, Activity measurement up to 7 days,
Sleep measurement up to 7 times, Event up to 100 items

82
Literature➢ John G. Webster: Medical Instrumentation, Chapter
7, Blood Pressure and Sound
➢ A. Šantić, “Biomedicinska elektronika”, poglavlje 7.1 “Mjerenje krvnog tlaka invazivnim metodama” i 7.2 “Neinvazivne metode mjerenja krvnog tlaka”

Blood flow - Hemodynamics
➢ Hemodynamics is the dynamics of blood flow in the cardiovascular system in the human body.
➢ The circulatory system is controlled by homeostatic mechanisms.
➢ The hemodynamic system continuously adjusts to conditions in the body and its environment.
➢ Blood is a non-Newtonian fluid.
➢ Blood vessels are not rigid tubes, so classic hydrodynamics and fluids mechanics based on the use of classical viscometers are not capable of explaining hemodynamics.

Blood flow
➢ Blood velocities in arteries are higher during systole than during diastole.
➢ The diameter of the blood vessel affects the speed of the flow of blood.
➢ Blood flow slows down as it moves from arteries to arterioles and subsequently to the capillaries because the cross-sectional area in the capillary beds is much larger than the arteries or any part of the circulatory system.

85
Cardiac Output
The amount of blood ejected from the ventricles during one beat is called stroke volume, (SV), and equals approx. 70 ml for each ventricle.
Total amount of blood ejected by heart in one minute is called cardiac output, CO and it is
i.e. approx. 5 l/min; where HR is the heart rate
The number of heart beats is mainly influenced by autonomous nerve system: the sympathetic system accelerates heart beating and parasympathetic system slows it down
CO [l/min] = SV [l/beat] x HR [beats/min]

Velocity profile in the blood system

Blood flow velocity profile
➢ v - mean velocity of blood.
➢ The blood flow velocity in the middle of the vessel is not equal with the periphery flow which has layered (laminar) velocity profile, described by parable

Blood Flow
Normal blood flow velocity in systolic phase is approx. 0,5 m/s – 1 m/s
in large vessel. In case of obstuctions, like plaque, the cross section of
large vessels becomes smaller and instead of laminar blood flow, the
flow becomes turbulent

Measurement methods
➢ Inductive measurement
• Measures instantaneous blood flow
• Invasive method
• Probe must be in direct contact with the blood vessel
➢ Ultrasound measurement
• Measures instanteous blood flow
• Noninvasive method
• Ultrasound can be beamed through the skin

Electromagnetic flowmeter
When blood flows in the vessel with velocity u, andpasses through magnetic field B, the induced emf e ismesaured at the electrodes shown. When an AC magneticfield is used, any flux lines cutting the shaded loop inducean undesired transformer voltage.
B – magnetic flux density, T
L – length between electrodes, m
u – instantaneous velocity of blood, m/s

Electromagnetic flowmeter waveforms
The transformer voltage is
90° out of phase with themagnet current. Otherwaveforms are shown solidfor forward flow anddashed for reverse flow.The gated signal from thegated-sine-wave flowmeterincludes less area than thein-phase signal from thequadrature-suppresionflowmeter.

Quadrature-suppression flowmeter
The quadrature-suppression flowmeter detects the
amplifier quadrature voltage. The quadrature generatorfeeds back a voltage to balance out the probe-genratedtransformer voltage.

Ultrasound blood flow measurement
Blood flow velocity measurement based on time transit difference
1
2
1 2 2 2 2
2
cos
cos
2 cos
cos
2cos
Dt
c v
Dt
c v
D vt t t
c v
D v
c
=+
=−
= − =
−
c – velocity of ultrasound spreading in the body, soft tissue; v - velocity of fluid flow (blood in the vein);
t1, t2, - time of ultrasound wave crossing path D from the transmitter to the receiver placed on the opposite side of the vessel;2R - diameter of the vessel;α – angle between ultrasound velocity vector and blood flow vector
c >> v D

For the calculation:
➢ Calculate t1, t2 and t for a vessel having the diameter 5 mm in case the ultrasound sensors are attached to the vessel under the angle of 60.
➢ Which ultrasound frequency you would recommend for the measurement for achieving measurement accuracy of 1%?
➢ c =1540m/s velocioty of ultrasound in soft tissues
➢ v = 2m/s velocity of the blood

Continuous flow velocity measurement
➢ Blood flow velocity measurement is based on the difference in transit time in continuous operation

➢ The measurement of time difference can be reduced to measuring phase difference
2
2
2
4 cos
4 cos
T
D v f
c
cv
D f
=
=
=
Continuous US flow measurement

Discussion
➢ What are the possible difficulties in measuring blood flow velocity in all these methods?

Doppler flow measurement
➢ Blood flow velocity measuring based on Doppler effect
'
2
0
1
1 cos
1 cos
pr
pr
f fv
c
vf f
c
=
+
= −

Device performance principle
➢ Device design for measuring blood flow based on Doppler effect
2 0
1 cos
1 cos
v
cf fv
c
−
=
+
( )
2 0
0
1 cos
1
1 cos
cos cos
f f f
v
cfv
c
cf
v
= −
−
= − +
= +

Block diagram – US Doppler flowmeter
f = 2 – 10 MHz0
c = 1500 - 1600 m/s (1540 m/s)f = 1,3 – 13 kHzd

Flow waveform
➢ Velocity change during heart contractions (cardiac cycle)

Doppler indices
➢ Some flow velocity measurementparameters
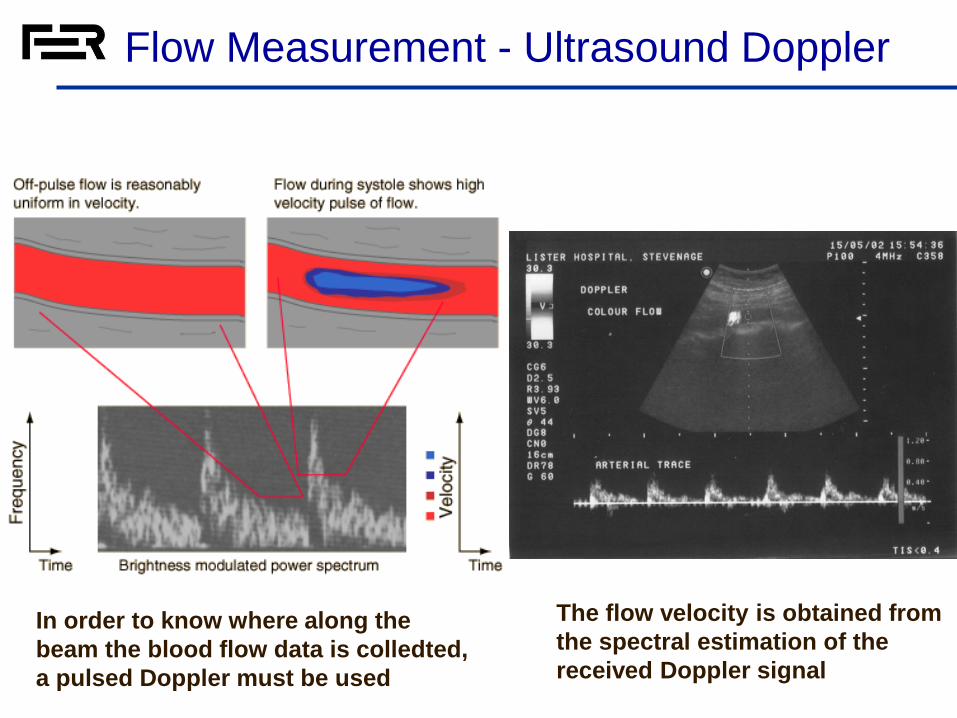
Flow Measurement - Ultrasound Doppler
The flow velocity is obtained from
the spectral estimation of the
received Doppler signal
In order to know where along the
beam the blood flow data is colledted,
a pulsed Doppler must be used

Velocity dependence on the angle of view
• Velocity dependence on the ultrasound probe angle comparing to trajectory velocity. (A) and (B) frequency difference signal is more pronounced if the ultrasound direction is a sharp angle to the blood movement direction. Angle between the ultrasound beam and trajectory flow rate is near 90°, so the signal (C) is small. (D) Blood flowing away from the source of ultrasound, so the signal is negative.


Flow measurement in the heart

Kidney perfusion

Literature
➢ John G. Webster: Medical Instrumentation, Chapter 8, Measurement of Flow and Volume of Blood
➢ Brown, BH., Smallwood, RH., et al., “Medical Physics and Biomedical Engineering, IoP Press, Bristol, 1999

➢ Thank you for your attention!
110Biomedical instrumentation