Formation of carbon nanotubes on iron/cobalt oxides supported on zeolite-Y: Effect of zeolite...
13
Formation of carbon nanotubes on iron/cobalt oxides supported on zeolite-Y: Effect of zeolite textural properties and particle morphology K.S. Triantafyllidis a, * , S.A. Karakoulia b , D. Gournis c , A. Delimitis b , L. Nalbandian b , E. Maccallini d,e , P. Rudolf d a Department of Chemistry, Aristotle University of Thessaloniki, GR-54124 Thessaloniki, Greece b Chemical Process Engineering Research Institute, CERTH, GR-57001 Thessaloniki, Greece c Department of Materials Science and Engineering, University of Ioannina, GR-45110 Ioannina, Greece d Zernike Institute for Advanced Materials, University of Groningen, Nijenborgh 4, NL-9747 AG Groningen, The Netherlands e Department of Physics, University of Calabria, via P. Bucci, I-87036 Arcavacata di Rende (Cs), Italy Received 31 May 2007; received in revised form 22 September 2007; accepted 9 October 2007 Available online 17 October 2007 Abstract The effect of the textural properties and morphology of zeolite Y, used as support of iron (Fe) or cobalt (Co) oxides, on the quantity and quality of the multi-wall carbon nanotubes (MWNTs) synthesized by catalytic chemical vapour deposition (CCVD) of acetylene was studied. The parent zeolite Y was modified by various dealumination procedures, namely hydrothermal treatment (steaming), treatment with ammonium hexafluorosilicate (AHFS) and combined steaming-AHFS. The ion-exchange and wet impregnation methods were used for supporting the metals on the zeolite Y samples, with the latter method providing the most effective catalysts for carbon nanotube (CNT) formation. Severe dealumination of zeolite-Y by steaming, which induced the formation of secondary meso/macropores and of relatively large particles/aggregates, resulted in significant decrease in the formation of CNTs compared to the catalysts based on the parent zeolite-Y. Post-treatment of the steamed samples with AHFS had no beneficial effect on the catalysts’ activity. Moderate dea- lumination of the parent zeolite Y by AHFS also inhibited the formation of CNTs, but to a lesser extent compared to the catalysts based on steamed zeolite Y. The TGA studies revealed the presence of carbon phases with different thermal stability in the zeolite–CNT com- posites, ranging from amorphous carbon to well-graphitized MWNTs. TEM images and micro-Raman spectra taken right after growth confirmed the formation of high quality MWNTs with a low degree of disorder irrespective of the catalysts used, the degree of dealu- mination of the zeolite Y and the textural and morphological characteristics of the zeolitic support. Ó 2007 Elsevier Inc. All rights reserved. Keywords: Carbon nanotubes; Fe/Co oxides; Zeolite Y; Dealumination; Secondary mesopores 1. Introduction The introduction of carbon nanotubes by Iijima [1] in 1991 gave a strong boost towards the systematic research and technological development of these important nano- structures, which had been observed by several researchers many years before Iijima’s report without getting the appropriate attention [2]. Carbon nanotubes (CNTs) are fullerene-related nanostructures which can be described as rolled-up sheets of graphite, with the carbon atoms arranged in a honeycomb-like hexagonal structure [3,4]. These hollow graphene cylinders can be open-ended or closed at either end with caps containing pentagonal rings, which are isostructural to a half fullerene molecule. Depending on the number of graphene sheets which consti- tute them, CNTs are classified either as single-wall or 1387-1811/$ - see front matter Ó 2007 Elsevier Inc. All rights reserved. doi:10.1016/j.micromeso.2007.10.007 * Corresponding author. Tel./fax: +30 2310 997730. E-mail address: [email protected] (K.S. Triantafyllidis). www.elsevier.com/locate/micromeso Available online at www.sciencedirect.com Microporous and Mesoporous Materials 110 (2008) 128–140
Transcript of Formation of carbon nanotubes on iron/cobalt oxides supported on zeolite-Y: Effect of zeolite...
Available online at www.sciencedirect.com
www.elsevier.com/locate/micromeso
Microporous and Mesoporous Materials 110 (2008) 128–140
Formation of carbon nanotubes on iron/cobalt oxides supportedon zeolite-Y: Effect of zeolite textural properties and
particle morphology
K.S. Triantafyllidis a,*, S.A. Karakoulia b, D. Gournis c, A. Delimitis b, L. Nalbandian b,E. Maccallini d,e, P. Rudolf d
a Department of Chemistry, Aristotle University of Thessaloniki, GR-54124 Thessaloniki, Greeceb Chemical Process Engineering Research Institute, CERTH, GR-57001 Thessaloniki, Greece
c Department of Materials Science and Engineering, University of Ioannina, GR-45110 Ioannina, Greeced Zernike Institute for Advanced Materials, University of Groningen, Nijenborgh 4, NL-9747 AG Groningen, The Netherlands
e Department of Physics, University of Calabria, via P. Bucci, I-87036 Arcavacata di Rende (Cs), Italy
Received 31 May 2007; received in revised form 22 September 2007; accepted 9 October 2007Available online 17 October 2007
Abstract
The effect of the textural properties and morphology of zeolite Y, used as support of iron (Fe) or cobalt (Co) oxides, on the quantityand quality of the multi-wall carbon nanotubes (MWNTs) synthesized by catalytic chemical vapour deposition (CCVD) of acetylene wasstudied. The parent zeolite Y was modified by various dealumination procedures, namely hydrothermal treatment (steaming), treatmentwith ammonium hexafluorosilicate (AHFS) and combined steaming-AHFS. The ion-exchange and wet impregnation methods were usedfor supporting the metals on the zeolite Y samples, with the latter method providing the most effective catalysts for carbon nanotube(CNT) formation. Severe dealumination of zeolite-Y by steaming, which induced the formation of secondary meso/macropores andof relatively large particles/aggregates, resulted in significant decrease in the formation of CNTs compared to the catalysts based onthe parent zeolite-Y. Post-treatment of the steamed samples with AHFS had no beneficial effect on the catalysts’ activity. Moderate dea-lumination of the parent zeolite Y by AHFS also inhibited the formation of CNTs, but to a lesser extent compared to the catalysts basedon steamed zeolite Y. The TGA studies revealed the presence of carbon phases with different thermal stability in the zeolite–CNT com-posites, ranging from amorphous carbon to well-graphitized MWNTs. TEM images and micro-Raman spectra taken right after growthconfirmed the formation of high quality MWNTs with a low degree of disorder irrespective of the catalysts used, the degree of dealu-mination of the zeolite Y and the textural and morphological characteristics of the zeolitic support.� 2007 Elsevier Inc. All rights reserved.
Keywords: Carbon nanotubes; Fe/Co oxides; Zeolite Y; Dealumination; Secondary mesopores
1. Introduction
The introduction of carbon nanotubes by Iijima [1] in1991 gave a strong boost towards the systematic researchand technological development of these important nano-structures, which had been observed by several researchers
1387-1811/$ - see front matter � 2007 Elsevier Inc. All rights reserved.
doi:10.1016/j.micromeso.2007.10.007
* Corresponding author. Tel./fax: +30 2310 997730.E-mail address: [email protected] (K.S. Triantafyllidis).
many years before Iijima’s report without getting theappropriate attention [2]. Carbon nanotubes (CNTs) arefullerene-related nanostructures which can be describedas rolled-up sheets of graphite, with the carbon atomsarranged in a honeycomb-like hexagonal structure [3,4].These hollow graphene cylinders can be open-ended orclosed at either end with caps containing pentagonal rings,which are isostructural to a half fullerene molecule.Depending on the number of graphene sheets which consti-tute them, CNTs are classified either as single-wall or
K.S. Triantafyllidis et al. / Microporous and Mesoporous Materials 110 (2008) 128–140 129
multi-wall. Multi-wall carbon nanotubes (MWNTs), whichare more easily formed, consist of concentric single-wallnanotubes (SWNTs) [5,6].
CNTs exhibit exceptional electrical and mechanicalproperties, which combined with their elongated shapeand nanoscale dimensions enable the design and develop-ment of novel nanodevices and nanocomposite materials[7–10]. The tensile strength of MWNTs has been measuredto be about 63 GPa [11], in comparison to high-carbonsteel which has a tensile strength of approximately1.2 GPa. CNTs are considered to be one of the stiffestmaterials, with an elastic modulus of the order of 1 TPa[10]. CNTs also excel for their high thermal conductivity(twice as high as diamond) and high electric current carry-ing capacity (1000 times higher than copper wires) [9]. Inaddition to these outstanding mechanical and electricalproperties, CNTs exhibit high thermal stability, survivingup to temperatures as high as 2800 �C under vacuum con-ditions [9]. Numerous potential applications of carbonnanotubes have been proposed and investigated, includingtheir use in polymer-reinforcement and ceramic compositematerials and as electron field emitters for electronicdevices, as well as for other purposes such as storage ofhydrogen or other gases and power production [6,9,12–15]. More recently, attention has also turned to the uniquebiomedical applications of functionalized CNTs [16,17].
For commercial applications the production of well-defined and organized arrays of carbon nanotubes, in suf-ficient quantities and at a low cost, is of high importance.Among the established growth techniques, arc-discharge[1,18] and laser ablation [19,20] have been very successfulin producing high quality material. Both methods sufferhowever from several drawbacks, such as the limitationin the volume of sample they can produce in relation tothe size of the carbon source (the anode in arc-dischargeand the target in laser ablation) and the high temperaturerequirement which results in prohibitive costs for scale-upmass production of carbon nanotubes. These limitationshave motivated the development of gas-phase techniques,such as catalytical chemical vapour deposition (CCVD),where nanotubes are formed by the decomposition of a car-bon-containing gas (methane, ethane, acetylene) over a cat-alyst containing nanoparticles of transition metal (Fe, Co,Ni) or of the related oxide, embedded in solid matrices orsupported on the surfaces of porous materials. Besidesthe possibility of mass production at a low cost, thismethod also has the advantage that diameter, length andmorphology of the nanotubes can be controlled by alteringthe size of the nanoparticles and the deposition conditions.The catalytic supports or matrices which have beenemployed comprise zeolites [21,22], mesoporous silica[23–25], silica [22,26], alumina [27–29], graphite [30] andclay minerals [31].
Amongst zeolitic supports, the zeolite type-Y (faujasite)has attracted most attention. It was shown [21,22,26] thatMWNTs with external diameters in the range of 20–30 nm can be formed in relatively large amounts (up to
50 wt.% carbon yield based on parent zeolitic catalystweight) by catalytic decomposition of acetylene on Feand Co oxides supported on zeolite Y. The total carbonformation activity of Fe/zeolite Y (including amorphouscarbon, carbon nanofibers and nanotubes) was found tobe higher than that of Co/zeolite Y; however, the quality(degree of graphitization) of the nanotubes produced onthe latter catalyst was markedly better. It is generallyaccepted that cobalt favours the formation of turbostraticnanotubes, while the use of other catalyst metals such asFe give a higher carbon deposit but tubes of lower quality.An appropriate combination of metals (such as Co–Fe orCo–V) can result in high yields of MWNTs with good qual-ity [32–34].
In all these studies it was suggested that the carbonnanotubes formed on the outer surface of the zeolitic par-ticles, since the formation of single-layer nanotubes thatcould penetrate the nano-pore openings of zeolite Y (whichhave a diameter of 7.4 A) was reported to be unfavourable[21]. It was moreover suggested that possible coke forma-tion during the initial steps of the acetylene conversionreaction resulted in blockage of the pores that hindered fur-ther transport of the reactants to the active metal sitesinside the zeolitic micropores [21].
The crystalline structure, morphology and microporos-ity of zeolite Y can be modified through post-synthesis dea-lumination procedures, such as, among others, steaming atelevated temperatures [35,36], treatment with SiCl4 vapourat moderate temperatures [36,37], and reaction with aque-ous solutions of ammonium hexafluorosilicate (AHFS)[36,38,39]. Controlled dealumination of the zeolite frame-work through parallel destruction and reconstruction stepscan lead to the formation of secondary pores in the rangeof mesopores (mean diameter 2–50 nm) as well as macrop-ores (mean diameter P 50 nm) [35,36,40]. In addition, lar-ger particles are formed due to aggregation of smallercrystallites during dealumination [36]. Such changes inthe textural properties and morphology of zeolite particlesare expected to have a significant effect on the formation ofcarbon nanotubes when the dealuminated zeolites are beingused as supports of the active transition metal oxides. Morespecifically, it may be expected that by increasing the meso/macropore volume of zeolitic catalysts a larger surfacewould be available for supporting catalytic nanoparticles,while at the same time avoiding the spacial restrictionsimposed by the subnanometer pores of the pristine zeolite.Contrary to this expectation, we have shown in a previouscommunication [41] that dealumination of the zeolite Ycatalytic support by hydrothermal treatment (steaming)or treatment with ammonium hexafluorosilicate (AHFS)before the deposition of Fe and Co oxide catalysts resultedin decreased production of carbon nanotubes.
In an effort to elucidate the origin of this unexpectedbehaviour, this work presents a detailed study of the effectof textural, morphological and porosity characteristicsof zeolite Y on carbon nanotube formation by supportedFe or Co oxide catalysts. Advanced characterization
130 K.S. Triantafyllidis et al. / Microporous and Mesoporous Materials 110 (2008) 128–140
techniques, such as transmission electron microscopy andX-ray photoelectron spectroscopy, have been applied inorder to further study previously prepared catalysts basedon steamed and AHFS-treated zeolite Y samples. In addi-tion, new catalytic samples have been prepared by usingzeolite Y that has been dealuminated by high-severityhydrothermal treatment and combined steaming-AHFSmethods in order to identify any systematic relationbetween gradual changes in texture/morphology of zeoliteY and carbon nanotube formation activity of zeolite Ybased catalytic materials.
2. Experimental
2.1. Preparation of the dealuminated zeolite Y samples
The parent zeolite used was a commercial NaY sample(Linde LZ-Y52, Si/Al = 2.5). The NaY sample was repeat-edly ion-exchanged with NHþ4 cations to produce theNH4Y sample (with Na < 1 wt.%). The NH4Y samplewas hydrothermally treated (steamed) initially at 700 �Cand 100% steam to produce an ultrastable Y zeolite (sam-ple USY) which was further steamed at 788 �C and 100%steam [sample USY(st)] in order to induce higher frame-work dealumination. The more severely steamed zeolite[sample USY(st)] was further treated with aqueous solutionof ammonium hexafluorosilicate (AHFS) in order toremove the extra-framework aluminium (EFAl) speciesthat were formed during the steaming process and blockthe entrance to the zeolitic pores (USY(st)–AHFS).Finally, the NH4Y sample was also dealuminated withAHFS without previous steaming (sample NH4Y–AHFS).Details on the dealumination procedures have been previ-ously reported [36,40].
2.2. Preparation of the Fe- and Co-supported catalysts
The Fe- or Co-modified zeolite Y samples were preparedby partial ion-exchange of sodium cations or by wetimpregnation procedures of the parent NaY and the dealu-minated samples. In the ion-exchange experiments, theNaY zeolite samples were treated with aqueous solutionsof Co- or Fe-acetate for 24 h, at pH between 3–3.5 forthe Fe-exchange and 5–6 for the Co-exchange; pH wasadjusted by the use of acetic acid solution (50% w/w).The samples were further filtered, washed thoroughly withdouble-distilled water and dried at ambient conditions. Theion-exchange of both metals was completely accomplishedas verified by the chemical analysis of the exchanged zeolitesamples and by the colourless clear filtrate solutionobtained after the ion-exchange. The iron and cobalt con-tent of the exchanged zeolite Y samples was approximately2.5 wt.%, which corresponds to �25% exchange of sodiumcations. The Fe- or Co-exchanged samples were designatedas FeNaY(ex) or CoNaY(ex), respectively.
In the wet impregnation experiments, the parent NaYand the dealuminated samples were added to an Fe-acetate
or Co-acetate solution, at pH 5 for Fe-acetate and pH 8 forCo-acetate (adjustment to pH 8 was done by dilute NH3
solution), and stirred at room temperature for 1 h. Themixtures were then transferred to a rotary evaporatorwhere they were further stirred at 70 �C for 1 h, followedby evaporation of the solvent at 80 �C under vacuum.The total metal content of the impregnated zeolite Y sam-ples was approximately 2.5 wt.% (2.5 wt.% Fe and 2.5 wt.%Co), similar to the exchanged samples. The Fe- or Co-impregnated samples were designated according to themetal and the zeolite sample (parent or dealuminated) thatwas used as support, i.e. FeNaY(imp) or FeUSY(imp). Allthe Fe- and Co-modified zeolite Y samples were calcined at450 �C for 4.5 h in air prior to the catalytic decompositionof acetylene.
2.3. Carbon nanotubes growth
The synthesis of carbon nanotubes was performed bycatalytic decomposition of acetylene on the calcined Fe-or Co-modified zeolite Y samples which was carried outin a fixed bed flow reactor at atmospheric pressure. Thereactor setup consists of a quartz boat containing the cat-alyst sample (approx. 100 mg) which is placed in a horizon-tal high-temperature tubular furnace. The catalyst wasgradually heated from room temperature to 700 �C in anargon flow (100 ml min�1) and kept at this temperaturefor about 15 min. A mixture of argon (100 ml min�1) andacetylene (10 ml min�1) was subsequently fed to the reactorfor 1 h, in order for the reaction to take place. These are themost common conditions (flow rates, reaction temperatureand time) that have been reported in the literature for car-bon nanotube production using acetylene as carbon source[21,30,32]. The furnace was then cooled to room tempera-ture under argon flow and the produced zeolite–CNT com-posite material was collected as a black powder from thequartz boat.
2.4. Characterization of the zeolite samples and thezeolite–CNT composites
Chemical analysis was performed by Inductive CoupledPlasma-Atomic Emission Spectroscopy (ICP-AES) using aPlasma 400 (Perkin Elmer) spectrometer, equipped withCetac6000AT+ ultrasonic nebulizer. Powder X-ray diffrac-tion (XRD) experiments were performed using a SiemensD-500 X-ray diffractometer with Cu Ka(40 kV, 40 mA,k = 1.5418 A) radiation and a secondary beam graphitemonochromator. The patterns were recorded in the 2-theta(2h) range from 5� to 85�, in steps of 0.04� and with acounting time of 2 s per step. The porosity characteristicsof the catalysts were determined by N2 adsorption–desorp-tion experiments performed at �196 �C in an AutomaticVolumetric Sorption Analyzer (Autosorb-1, Quanta-chrome). The multi point BET method was applied for spe-cific surface area estimation by using N2 adsorptionisotherm points of P/P0 < 0.1 in the BET equation (the
K.S. Triantafyllidis et al. / Microporous and Mesoporous Materials 110 (2008) 128–140 131
nitrogen cross-sectional area was taken as 0.162 nm2). Thetotal pore volume was determined at P/P0 = 0.99 and themicropore volume was deduced from t-plot analysis (deBoer method). The pore size (diameter) distribution curvesin the meso-/macropore range were determined from BJHanalysis of the desorption isotherm data.
Scanning electron microscopy-energy dispersive spec-troscopy (SEM-EDS) experiments were performed with aJEOL scanning microscope, JSM-6300. Thermogravimetricanalysis (TGA) was performed using a SDT 2960, TAInstrument. Samples of approximately 5 mg were heatedin air from 25 to 900 �C, at a rate of 10 �C/min. Transmis-sion Electron Microscopy (TEM) experiments were carriedout on a JEOL 2011 TEM with a LaB6 filament and anaccelerating voltage of 200 kV. Samples were prepared byevaporating drops of a zeolite–CNT – ethanol suspensionafter sonication onto a carbon-coated lacy film supportedon a 3 mm diameter, 300 mesh copper grid. X-ray photo-electron spectroscopy (XPS) measurements were per-formed using a SSX-100 (surface science instruments)photoelectron spectrometer with a monochromatic Al Ka
X-ray source (hm = 1486.6 eV). The base pressure in thespectrometer was 10�10 Torr and the energy resolutionwas set to 1.16 eV to minimise data acquisition time. Thephotoelectron take off angle was set at 37� and an electronflood gun was used to compensate for sample charging.Evaporated gold films on glass served as substrates. Thesamples were dispersed in distilled deionized water andafter stirring and sonication for 10 min, a small drop ofthe suspension was deposited onto the substrate and leftto dry in air. Spectral analysis included a background sub-traction (Shirley and Tougaard background), and peakseparation using Gaussian and asymmetrical functions, ina least squares curve-fitting program (WinSpec) developedat the LISE laboratory of the Facultes UniversitairesNotre-Dame de la Paix, Namur, Belgium. In particular,for the Fe 2p and Co 2p core levels, spectra analysisincluded a Tougaard background which takes into accountthe electron inelastic mean free path inside a solid [42]. Thecross section used for the inelastic scattering can beexpressed by the universal function K(E) = BE/(C + E2)2,with the values of parameters I and C as 2866 eV2 and
Table 1Structural and porosity characteristics of parent NaY and dealuminated zeoli
Samples Relative crystallinitya Dealumination degreeb Porosity
(%) (%) SSA (m2
NaY 100 – 908NH4Y 98 – 925USY 63 81 668USY(st) 53 85 565NH4Y–AHFS 74 54 684USY(st)–AHFS 49 95 443
a Values obtained from the comparison of the intensity of the (533) XRD peb Values obtained from the comparison of the number of framework alumin
parent zeolite Y; FAl atoms were determined from the unit cell size (XRD) ac From N2 adsorption–desorption experiments.
1643 eV2, respectively. The Fe- and Co-zeolite catalyticsamples were measured in four (4) different points of 600lm size. Raman spectra were recorded with a Micro-Raman system RM1000 RENISHAW using a laser excita-tion line at 532 nm (Nd–YAG) in the range of 100–3500 cm�1. A 0.5–1 mW was used with 1 lm focus spotin order to avoid photodecomposition of the samples.
3. Results and discussion
3.1. Physicochemical characteristics of zeolite Y matrices
and supported Fe and Co catalysts
The physicochemical characteristics of the parent andthe dealuminated zeolite Y samples and the supported Feor Co catalysts that were used for the synthesis of carbonnanotubes were investigated by means of XRD, N2 adsorp-tion–desorption, SEM, TEM and XPS measurements.
3.1.1. X-ray diffraction results
The XRD patterns of all dealuminated and metal-mod-ified samples (shown in ref. [41]) revealed a relatively highdegree of crystallinity of the zeolitic samples. The relativecrystallinity and the degree of dealumination of variouszeolite Y samples used as catalytic supports, comparedto the parent NaY or NH4Y zeolites, are reported inTable 1. It can be seen that steaming (sample USY)resulted in a more substantial removal of aluminumatoms from the zeolitic framework (�80% dealuminationdegree) compared to the treatment with AHFS (sampleNH4Y–AHFS) which induced only a �55% removal offramework aluminum (FAl) atoms. However, both meth-ods produced samples with relative crystallinity higherthan 60%. Further steaming of sample USY [sampleUSY(st)] under more severe conditions (at 788 �C) anda follow-up treatment with AHFS (sample USY(st)–AHFS) caused even higher removal of FAl, reaching adealumination degree of 95% with a relative crystallinityof �50%.
Modification of the parent NaY and dealuminated sam-ples by ion-exchange and wet-impregnation with iron orcobalt had almost no additional effect on their structural
te Y samples
characteristicsc
g�1) Micropore volume (cm3 g�1) Meso/macropore volume (cm3 g�1)
0.328 0.0670.336 0.0660.216 0.2660.187 0.2680.235 0.1450.139 0.200
ak of the dealuminated samples with that of the parent zeolite Y sample.um (FAl) atoms of the unit cell of dealuminated zeolites with that of the
nd the respective equation in Ref. [43].
132 K.S. Triantafyllidis et al. / Microporous and Mesoporous Materials 110 (2008) 128–140
properties, as revealed by XRD [41]. Further calcination ofthe metal-modified samples at 450 �C (for 4.5 h) in air toform the respective metal oxides and at 700 �C (for15 min) in Ar, to simulate the pre-treatment of catalystsbefore their use in carbon nanotube production, resultedin a lower relative crystallinity. This was more pronouncedin the case of the calcined/ion-exchanged catalysts basedon parent NaY zeolite (�30–50% decrease). The impreg-nated NaY and AHFS-treated samples were relatively lessaffected, while the impregnated steamed samples did notshow any significant changes in their relative crystallinitycompared to the initial steamed zeolite samples.
3.1.2. Nitrogen porosimetry
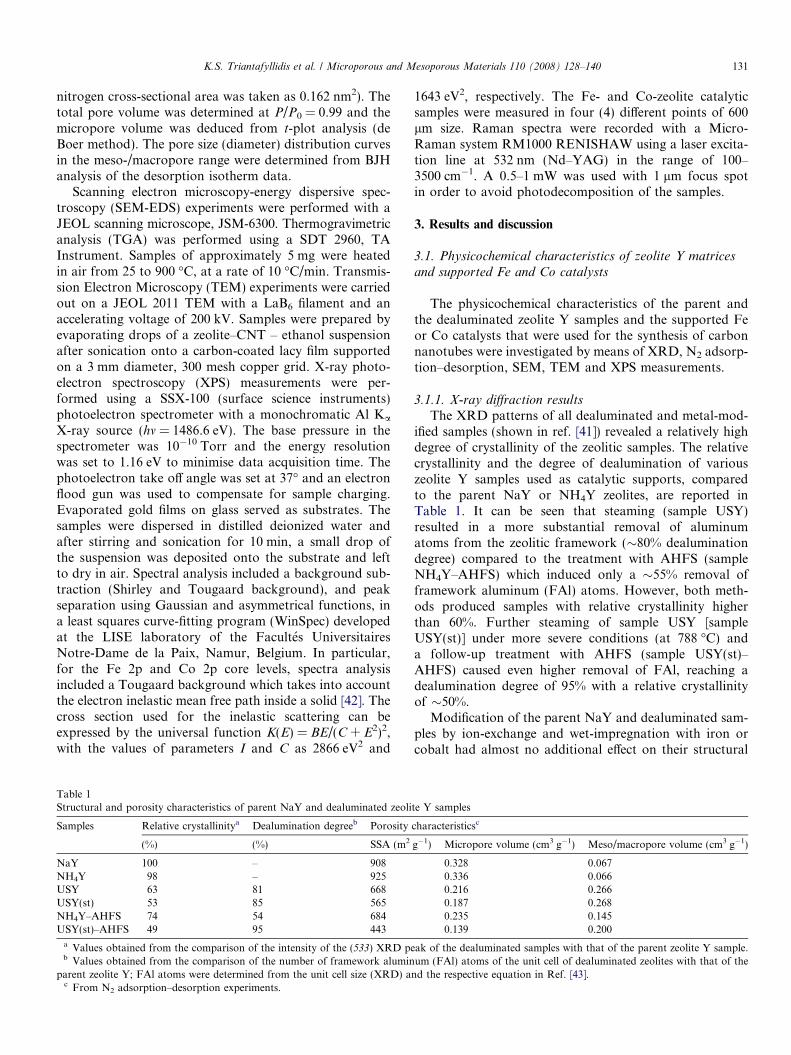
The nitrogen adsorption–desorption isotherms of theparent NaY and the dealuminated zeolite supports areshown in Fig. 1. The total specific surface area (SSA,obtained by the BET method) and the micropore andmeso/macropore volume data are given in Table 1. Theadsorption isotherm of the parent NaY zeolite is typicalfor microporous materials (type I in IUPAC classification)with no hysteresis loop formed during desorption. Theadsorption isotherm of the AHFS-treated sample displaysstill the characteristic features of microporous materials(sharp knee at P/P0 lower than 0.1 due to filling of microp-ores), but shows, in addition, a steep nitrogen uptakeincrease at P/P0 � 0.8–1.0 which is indicative of the
1 10 100
dV(l
ogd)
/cc
g-1
0.6
0.4
0.2
0.0
diameter/nm
4.6 nm
100
150
200
250
NaY
0.0 0.2 0.4 0.6 0.8 1.0 050
100
150
200
NH4Y-AHFS
N2 v
olum
e ad
sorb
ed (
cc g-1
/ ST
P)
P
Fig. 1. N2 adsorption–desorption isotherms of the parent NaY zeolite, the Asample (USY) and the severely steamed/AHFS-treated sample (USY(st)–AHFthe desorption data.
increase of the meso/macropore volume and of the corre-sponding surface area (including the external surface area)due to changes in the morphology of the zeolitic particles.The analogous adsorption isotherms for the steamed USYsample and the steamed/AHFS-treated sample (USY(st)–AHFS) are also shown in Fig. 1. With regard to desorptioncharacteristics, a bottle-neck type hysteresis loop isobserved for the AHFS-treated sample while a less-pro-nounced effect was observed for the steamed samples.The total surface area of the zeolite samples (Table 1)was observed to diminish with the decrease of relative crys-tallinity and the increase of framework dealumination, irre-spective of the dealumination method used. The totalsurface area of the parent zeolite (NaY and NH4Y sam-ples) was �900 m2/g and decreased to �450 m2/g for themost dealuminated USY(st)–AHFS sample. A similartrend was observed for the micropore volume (Table 1)and the micropore area which decreased from ca. 870 to350 m2/g with increasing dealumination. At the same time,the meso/macropore volume increased from ca. 0.065 to0.265 cm3/g (Table 1), and the corresponding surface area(including the external area) from ca. 50 to 110 m2/g. Bothparameters were higher in the steamed samples than in theAHFS-treated sample. From the pore size (diameter) distri-bution curves derived from desorption data (shown asinsets in Fig. 1), it can also be seen that new pores formedin the range of meso- and macropores. These secondary
1 10 100
15.6 nm
diameter/nm
0.3
0.2
0.1
dV(l
ogd)
/cc
g-13.6 nm
100
150
200
250
300
350
USY
.0 0.2 0.4 0.6 0.8 1.0/Po
50
100
150
200
250
USY(st)-AHFS
1 10 100
15.5 nm
dV(l
ogd)
/cc
g-1
diameter/nm
0.4
0.2
0.63.6 nm
HFS-dealuminated sample (NH4Y–AHFS), the steamed at 700 �C zeoliteS). The insets show the pore size distribution derived from BJH analysis of
K.S. Triantafyllidis et al. / Microporous and Mesoporous Materials 110 (2008) 128–140 133
meso/macropores resulted from the reorganization of thezeolitic framework during dealumination and also fromthe generation of larger aggregates from small primary zeo-litic particles capable of inducing textural porosity (inter-particle voids). Both these arguments are supported bythe SEM and TEM results shown below, and are consistentwith previous findings [36].
The total surface area of the calcined (at 450 �C and700 �C) catalytic samples was only slightly smaller thanthat of the initial zeolites. For example, the surface areaof the calcined Fe-exchanged and Fe-impregnated NaYsamples was �700 m2/g and �850 m2/g, respectively (com-pared to �900 m2/g of the parent NaY zeolite), while evensmaller changes were observed with the catalysts based ondealuminated zeolite Y samples.
3.1.3. Electron microscopy results
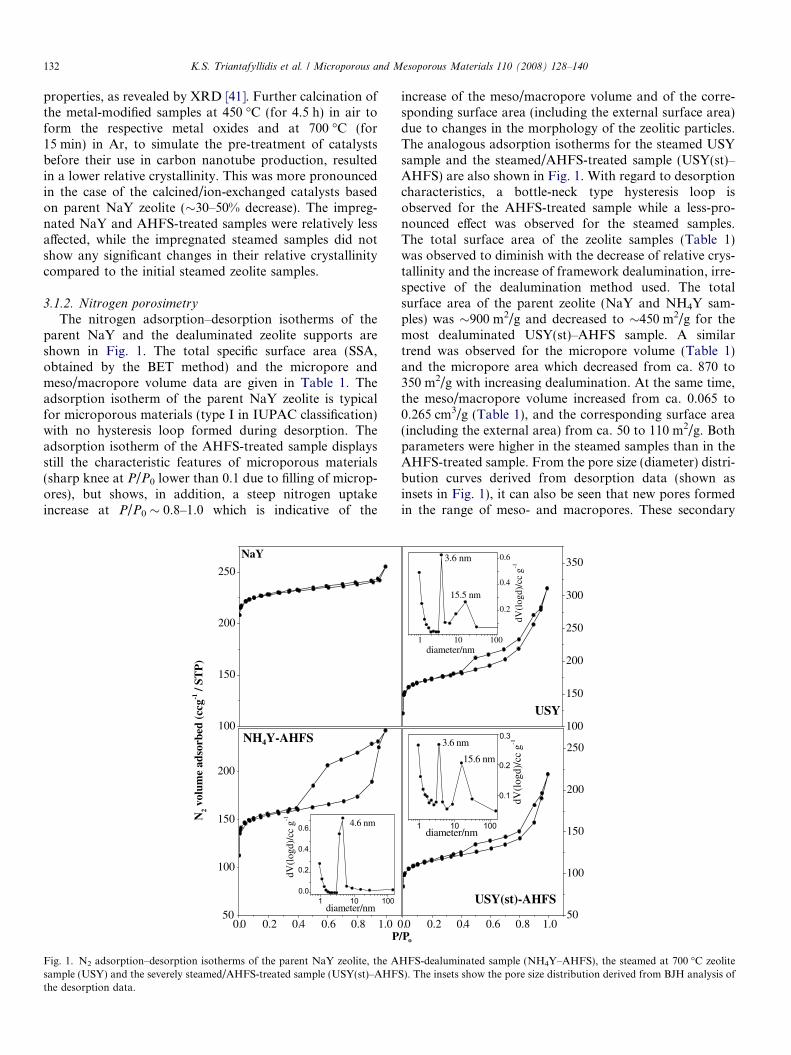
The crystal/particle morphology of the zeolite supportsand the respective Fe- or Co-catalysts was studied bySEM and TEM. In Fig. 2, we present the SEM images ofrepresentative calcined Fe-impregnated catalytic material,based on parent NaY zeolite, AHFS treated zeolite(NH4Y–AHFS), zeolite Y steamed at 700 �C (USY) andseverely steamed zeolite Y (USY(st)). The catalyst basedon parent zeolite NaY showed well formed particles/crys-tallites of cubic-like shape with sharp edges and flat sur-faces, with mean size of less than 2 lm. Similar particles/crystallites were observed for the rest of the catalytic mate-rials that were based on dealuminated zeolites; however, asit can be seen in the respective SEM images both the
Fig. 2. SEM images of calcined Fe-impregnated catalytic materials based on pAHFS(imp)], zeolite Y steamed at 700 �C [FeUSY(imp)] and severely steamed
steamed and the AHFS-treated samples comprised alsolarge aggregates of smaller particles with mean size of10–40 lm. Formation of these aggregates could happenthrough binding and consequent condensation of the sur-face hydroxyl groups (Si–OH) of neighbouring crystallites,which can be facilitated at the high temperatures of thehydrothermal treatment (steaming) or by the presence ofa chemical dealumination agent at relatively lower temper-atures (e.g. 80 �C in aqueous media), like AHFS which gen-erates a high number of hydroxyl nests when aluminumatoms are removed from the framework [36].
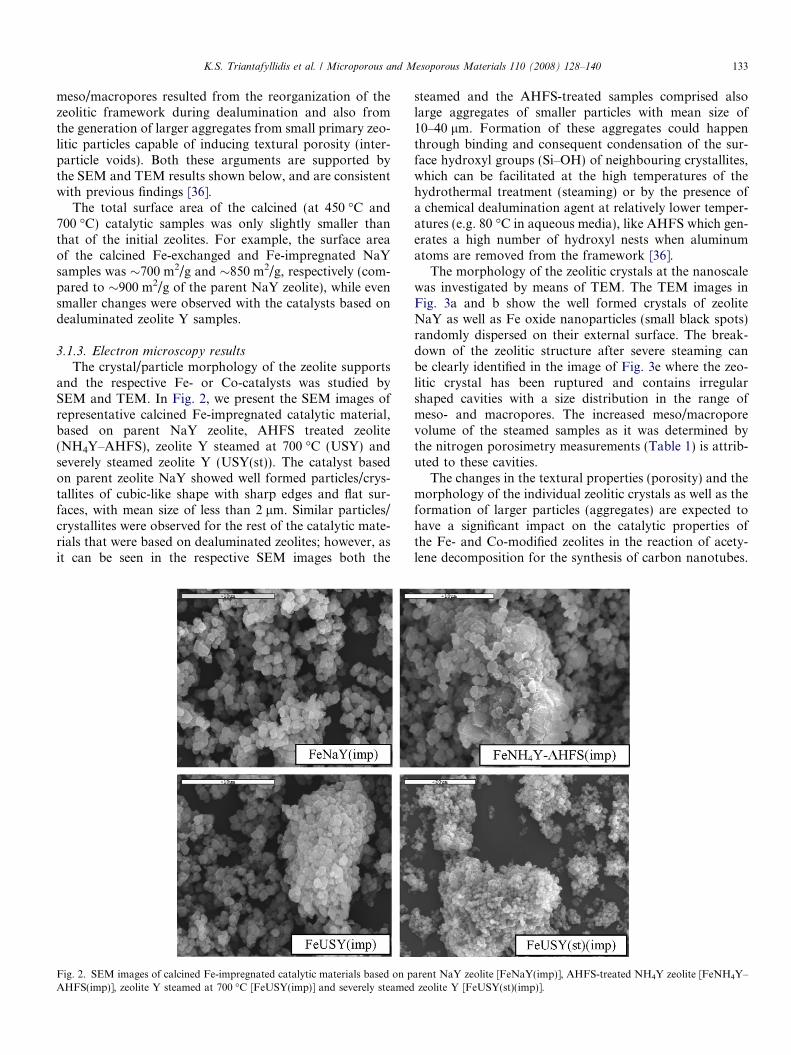
The morphology of the zeolitic crystals at the nanoscalewas investigated by means of TEM. The TEM images inFig. 3a and b show the well formed crystals of zeoliteNaY as well as Fe oxide nanoparticles (small black spots)randomly dispersed on their external surface. The break-down of the zeolitic structure after severe steaming canbe clearly identified in the image of Fig. 3e where the zeo-litic crystal has been ruptured and contains irregularshaped cavities with a size distribution in the range ofmeso- and macropores. The increased meso/macroporevolume of the steamed samples as it was determined bythe nitrogen porosimetry measurements (Table 1) is attrib-uted to these cavities.
The changes in the textural properties (porosity) and themorphology of the individual zeolitic crystals as well as theformation of larger particles (aggregates) are expected tohave a significant impact on the catalytic properties ofthe Fe- and Co-modified zeolites in the reaction of acety-lene decomposition for the synthesis of carbon nanotubes.
arent NaY zeolite [FeNaY(imp)], AHFS-treated NH4Y zeolite [FeNH4Y–zeolite Y [FeUSY(st)(imp)].
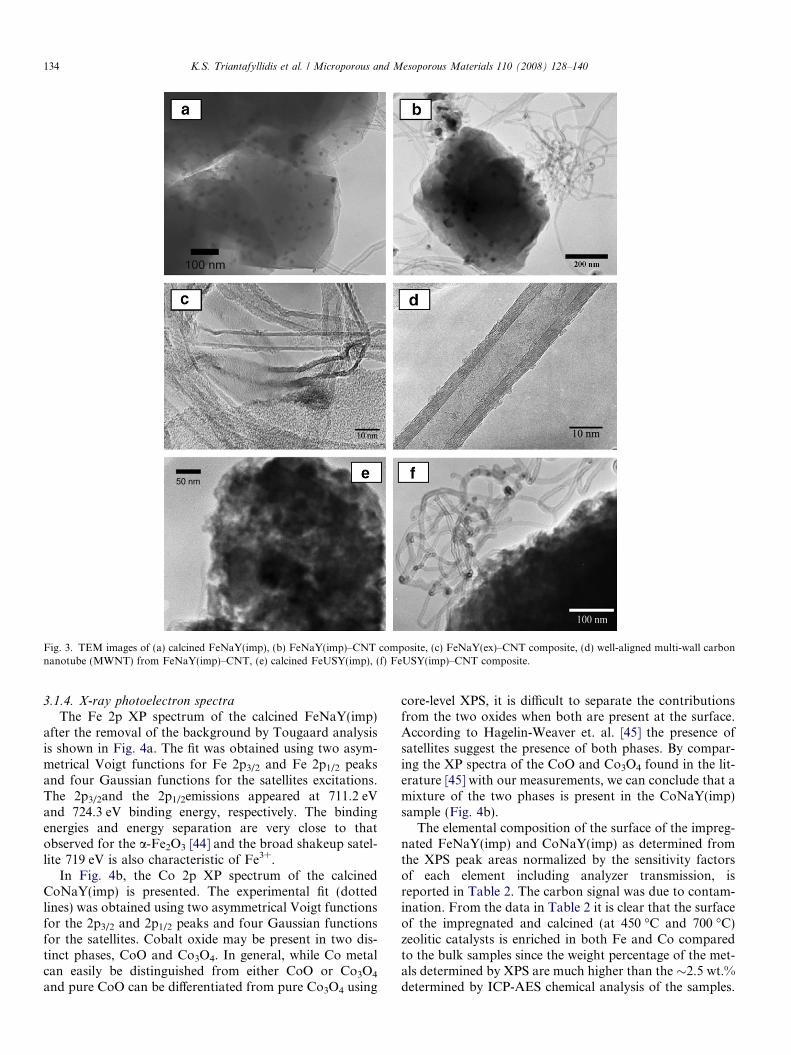
Fig. 3. TEM images of (a) calcined FeNaY(imp), (b) FeNaY(imp)–CNT composite, (c) FeNaY(ex)–CNT composite, (d) well-aligned multi-wall carbonnanotube (MWNT) from FeNaY(imp)–CNT, (e) calcined FeUSY(imp), (f) FeUSY(imp)–CNT composite.
134 K.S. Triantafyllidis et al. / Microporous and Mesoporous Materials 110 (2008) 128–140
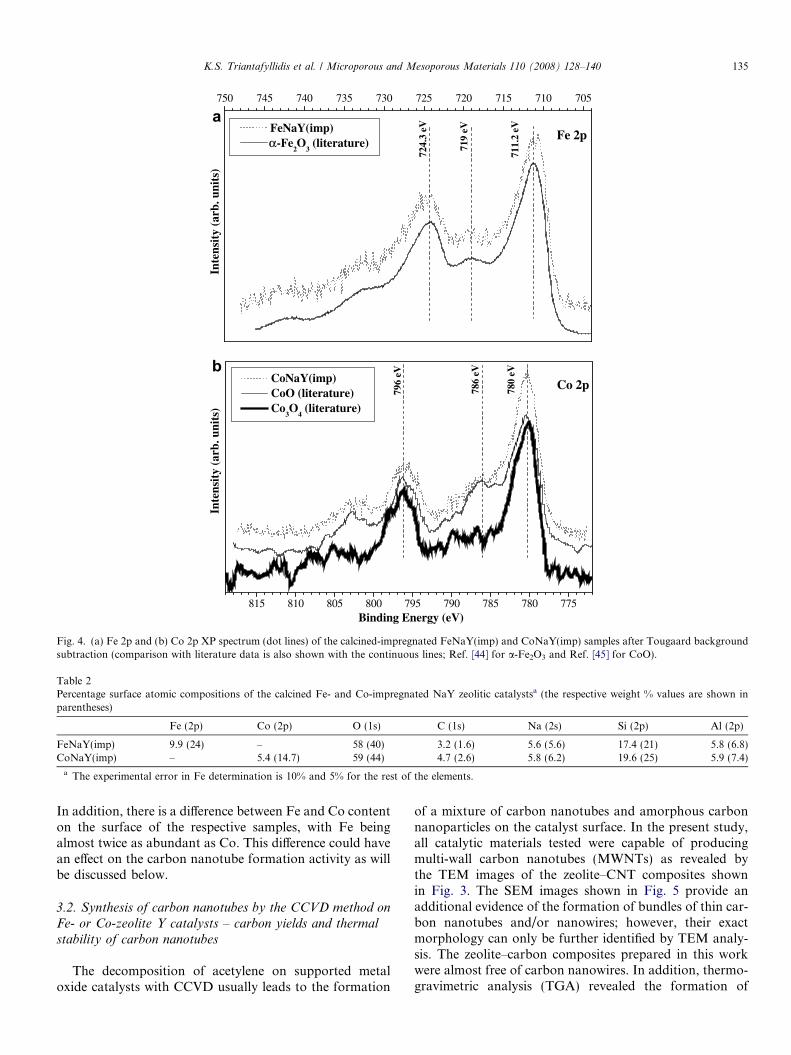
3.1.4. X-ray photoelectron spectraThe Fe 2p XP spectrum of the calcined FeNaY(imp)
after the removal of the background by Tougaard analysisis shown in Fig. 4a. The fit was obtained using two asym-metrical Voigt functions for Fe 2p3/2 and Fe 2p1/2 peaksand four Gaussian functions for the satellites excitations.The 2p3/2and the 2p1/2emissions appeared at 711.2 eVand 724.3 eV binding energy, respectively. The bindingenergies and energy separation are very close to thatobserved for the a-Fe2O3 [44] and the broad shakeup satel-lite 719 eV is also characteristic of Fe3+.
In Fig. 4b, the Co 2p XP spectrum of the calcinedCoNaY(imp) is presented. The experimental fit (dottedlines) was obtained using two asymmetrical Voigt functionsfor the 2p3/2 and 2p1/2 peaks and four Gaussian functionsfor the satellites. Cobalt oxide may be present in two dis-tinct phases, CoO and Co3O4. In general, while Co metalcan easily be distinguished from either CoO or Co3O4
and pure CoO can be differentiated from pure Co3O4 using
core-level XPS, it is difficult to separate the contributionsfrom the two oxides when both are present at the surface.According to Hagelin-Weaver et. al. [45] the presence ofsatellites suggest the presence of both phases. By compar-ing the XP spectra of the CoO and Co3O4 found in the lit-erature [45] with our measurements, we can conclude that amixture of the two phases is present in the CoNaY(imp)sample (Fig. 4b).
The elemental composition of the surface of the impreg-nated FeNaY(imp) and CoNaY(imp) as determined fromthe XPS peak areas normalized by the sensitivity factorsof each element including analyzer transmission, isreported in Table 2. The carbon signal was due to contam-ination. From the data in Table 2 it is clear that the surfaceof the impregnated and calcined (at 450 �C and 700 �C)zeolitic catalysts is enriched in both Fe and Co comparedto the bulk samples since the weight percentage of the met-als determined by XPS are much higher than the �2.5 wt.%determined by ICP-AES chemical analysis of the samples.
750 745 740 735 730 725 720 715 710 705
a
711.
2 eV
719
eV
724.
3 eV Fe 2pFeNaY(imp)
α-Fe2O
3 (literature)
Int
ensi
ty (
arb.
uni
ts)
815 810 805 800 795 790 785 780 775Binding Energy (eV)
b
780
eV
786
eV
796
eVCo 2pCoNaY(imp)
CoO (literature)Co
3O
4 (literature)
Int
ensi
ty (
arb.
uni
ts)
Fig. 4. (a) Fe 2p and (b) Co 2p XP spectrum (dot lines) of the calcined-impregnated FeNaY(imp) and CoNaY(imp) samples after Tougaard backgroundsubtraction (comparison with literature data is also shown with the continuous lines; Ref. [44] for a-Fe2O3 and Ref. [45] for CoO).
Table 2Percentage surface atomic compositions of the calcined Fe- and Co-impregnated NaY zeolitic catalystsa (the respective weight % values are shown inparentheses)
Fe (2p) Co (2p) O (1s) C (1s) Na (2s) Si (2p) Al (2p)
FeNaY(imp) 9.9 (24) – 58 (40) 3.2 (1.6) 5.6 (5.6) 17.4 (21) 5.8 (6.8)CoNaY(imp) – 5.4 (14.7) 59 (44) 4.7 (2.6) 5.8 (6.2) 19.6 (25) 5.9 (7.4)
a The experimental error in Fe determination is 10% and 5% for the rest of the elements.
K.S. Triantafyllidis et al. / Microporous and Mesoporous Materials 110 (2008) 128–140 135
In addition, there is a difference between Fe and Co contenton the surface of the respective samples, with Fe beingalmost twice as abundant as Co. This difference could havean effect on the carbon nanotube formation activity as willbe discussed below.
3.2. Synthesis of carbon nanotubes by the CCVD method on
Fe- or Co-zeolite Y catalysts – carbon yields and thermal
stability of carbon nanotubes
The decomposition of acetylene on supported metaloxide catalysts with CCVD usually leads to the formation
of a mixture of carbon nanotubes and amorphous carbonnanoparticles on the catalyst surface. In the present study,all catalytic materials tested were capable of producingmulti-wall carbon nanotubes (MWNTs) as revealed bythe TEM images of the zeolite–CNT composites shownin Fig. 3. The SEM images shown in Fig. 5 provide anadditional evidence of the formation of bundles of thin car-bon nanotubes and/or nanowires; however, their exactmorphology can only be further identified by TEM analy-sis. The zeolite–carbon composites prepared in this workwere almost free of carbon nanowires. In addition, thermo-gravimetric analysis (TGA) revealed the formation of
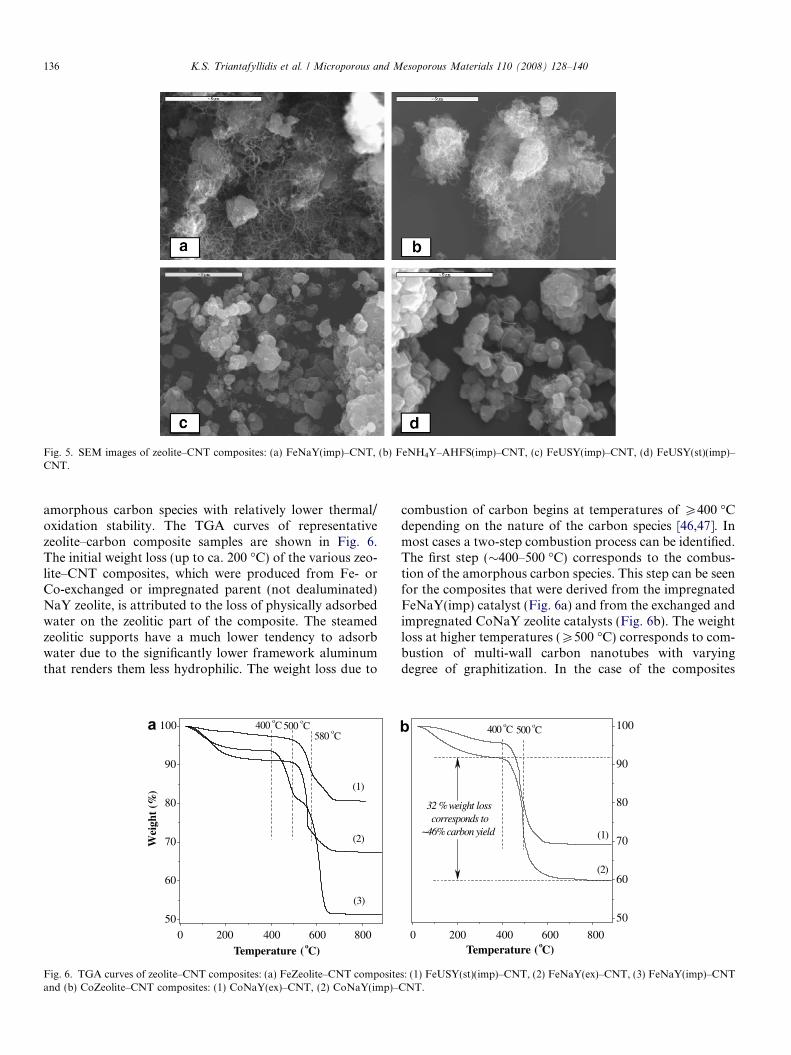
Fig. 5. SEM images of zeolite–CNT composites: (a) FeNaY(imp)–CNT, (b) FeNH4Y–AHFS(imp)–CNT, (c) FeUSY(imp)–CNT, (d) FeUSY(st)(imp)–CNT.
136 K.S. Triantafyllidis et al. / Microporous and Mesoporous Materials 110 (2008) 128–140
amorphous carbon species with relatively lower thermal/oxidation stability. The TGA curves of representativezeolite–carbon composite samples are shown in Fig. 6.The initial weight loss (up to ca. 200 �C) of the various zeo-lite–CNT composites, which were produced from Fe- orCo-exchanged or impregnated parent (not dealuminated)NaY zeolite, is attributed to the loss of physically adsorbedwater on the zeolitic part of the composite. The steamedzeolitic supports have a much lower tendency to adsorbwater due to the significantly lower framework aluminumthat renders them less hydrophilic. The weight loss due to
0 200 400 600 800
50
60
70
80
90
100 400 oC 500 oC580 oC
(3)
(2)
(1)
a
Wei
ght
(%)
Temperature (oC)
Fig. 6. TGA curves of zeolite–CNT composites: (a) FeZeolite–CNT compositeand (b) CoZeolite–CNT composites: (1) CoNaY(ex)–CNT, (2) CoNaY(imp)–
combustion of carbon begins at temperatures of P400 �Cdepending on the nature of the carbon species [46,47]. Inmost cases a two-step combustion process can be identified.The first step (�400–500 �C) corresponds to the combus-tion of the amorphous carbon species. This step can be seenfor the composites that were derived from the impregnatedFeNaY(imp) catalyst (Fig. 6a) and from the exchanged andimpregnated CoNaY zeolite catalysts (Fig. 6b). The weightloss at higher temperatures (P500 �C) corresponds to com-bustion of multi-wall carbon nanotubes with varyingdegree of graphitization. In the case of the composites
0 200 400 600 800
50
60
70
80
90
100500 oC400 oC
(2)
(1)
b
Temperature (oC)
32 % weight loss corresponds to
~46% carbon yield
s: (1) FeUSY(st)(imp)–CNT, (2) FeNaY(ex)–CNT, (3) FeNaY(imp)–CNTCNT.
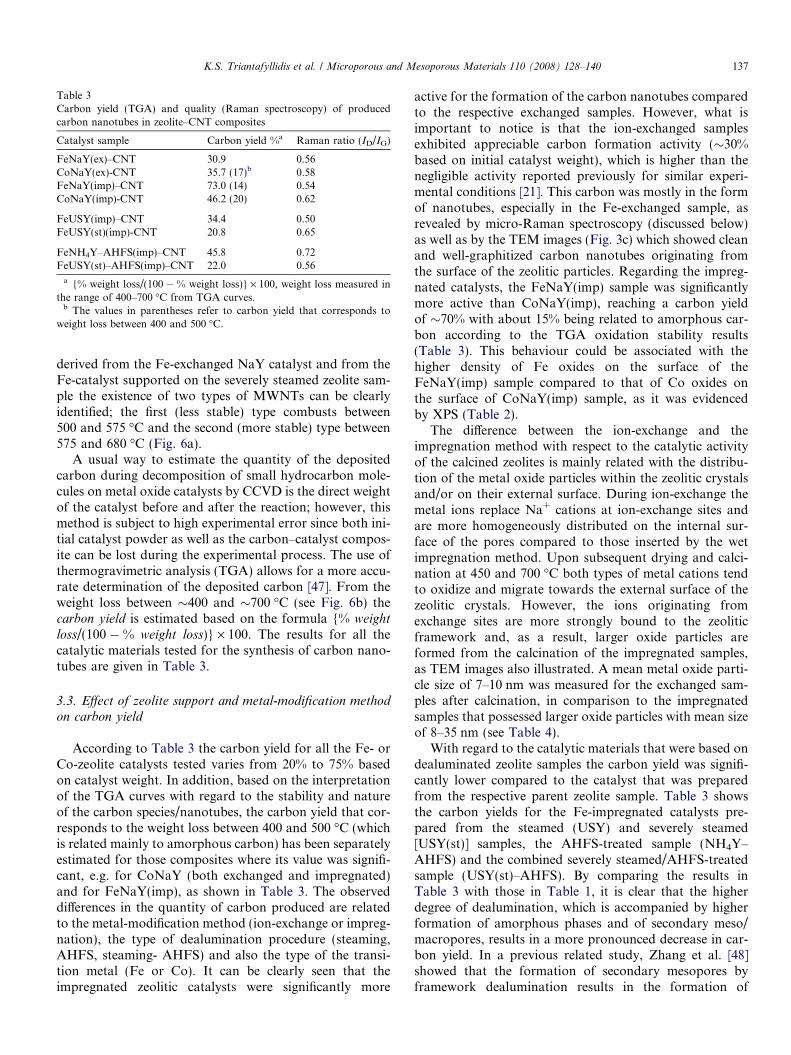
Table 3Carbon yield (TGA) and quality (Raman spectroscopy) of producedcarbon nanotubes in zeolite–CNT composites
Catalyst sample Carbon yield %a Raman ratio (ID/IG)
FeNaY(ex)–CNT 30.9 0.56CoNaY(ex)-CNT 35.7 (17)b 0.58FeNaY(imp)–CNT 73.0 (14) 0.54CoNaY(imp)-CNT 46.2 (20) 0.62
FeUSY(imp)–CNT 34.4 0.50FeUSY(st)(imp)-CNT 20.8 0.65
FeNH4Y–AHFS(imp)–CNT 45.8 0.72FeUSY(st)–AHFS(imp)–CNT 22.0 0.56
a {% weight loss/(100 � % weight loss)} · 100, weight loss measured inthe range of 400–700 �C from TGA curves.
b The values in parentheses refer to carbon yield that corresponds toweight loss between 400 and 500 �C.
K.S. Triantafyllidis et al. / Microporous and Mesoporous Materials 110 (2008) 128–140 137
derived from the Fe-exchanged NaY catalyst and from theFe-catalyst supported on the severely steamed zeolite sam-ple the existence of two types of MWNTs can be clearlyidentified; the first (less stable) type combusts between500 and 575 �C and the second (more stable) type between575 and 680 �C (Fig. 6a).
A usual way to estimate the quantity of the depositedcarbon during decomposition of small hydrocarbon mole-cules on metal oxide catalysts by CCVD is the direct weightof the catalyst before and after the reaction; however, thismethod is subject to high experimental error since both ini-tial catalyst powder as well as the carbon–catalyst compos-ite can be lost during the experimental process. The use ofthermogravimetric analysis (TGA) allows for a more accu-rate determination of the deposited carbon [47]. From theweight loss between �400 and �700 �C (see Fig. 6b) thecarbon yield is estimated based on the formula {% weight
loss/(100 � % weight loss)} · 100. The results for all thecatalytic materials tested for the synthesis of carbon nano-tubes are given in Table 3.
3.3. Effect of zeolite support and metal-modification methodon carbon yield
According to Table 3 the carbon yield for all the Fe- orCo-zeolite catalysts tested varies from 20% to 75% basedon catalyst weight. In addition, based on the interpretationof the TGA curves with regard to the stability and natureof the carbon species/nanotubes, the carbon yield that cor-responds to the weight loss between 400 and 500 �C (whichis related mainly to amorphous carbon) has been separatelyestimated for those composites where its value was signifi-cant, e.g. for CoNaY (both exchanged and impregnated)and for FeNaY(imp), as shown in Table 3. The observeddifferences in the quantity of carbon produced are relatedto the metal-modification method (ion-exchange or impreg-nation), the type of dealumination procedure (steaming,AHFS, steaming- AHFS) and also the type of the transi-tion metal (Fe or Co). It can be clearly seen that theimpregnated zeolitic catalysts were significantly more
active for the formation of the carbon nanotubes comparedto the respective exchanged samples. However, what isimportant to notice is that the ion-exchanged samplesexhibited appreciable carbon formation activity (�30%based on initial catalyst weight), which is higher than thenegligible activity reported previously for similar experi-mental conditions [21]. This carbon was mostly in the formof nanotubes, especially in the Fe-exchanged sample, asrevealed by micro-Raman spectroscopy (discussed below)as well as by the TEM images (Fig. 3c) which showed cleanand well-graphitized carbon nanotubes originating fromthe surface of the zeolitic particles. Regarding the impreg-nated catalysts, the FeNaY(imp) sample was significantlymore active than CoNaY(imp), reaching a carbon yieldof �70% with about 15% being related to amorphous car-bon according to the TGA oxidation stability results(Table 3). This behaviour could be associated with thehigher density of Fe oxides on the surface of theFeNaY(imp) sample compared to that of Co oxides onthe surface of CoNaY(imp) sample, as it was evidencedby XPS (Table 2).
The difference between the ion-exchange and theimpregnation method with respect to the catalytic activityof the calcined zeolites is mainly related with the distribu-tion of the metal oxide particles within the zeolitic crystalsand/or on their external surface. During ion-exchange themetal ions replace Na+ cations at ion-exchange sites andare more homogeneously distributed on the internal sur-face of the pores compared to those inserted by the wetimpregnation method. Upon subsequent drying and calci-nation at 450 and 700 �C both types of metal cations tendto oxidize and migrate towards the external surface of thezeolitic crystals. However, the ions originating fromexchange sites are more strongly bound to the zeoliticframework and, as a result, larger oxide particles areformed from the calcination of the impregnated samples,as TEM images also illustrated. A mean metal oxide parti-cle size of 7–10 nm was measured for the exchanged sam-ples after calcination, in comparison to the impregnatedsamples that possessed larger oxide particles with mean sizeof 8–35 nm (see Table 4).
With regard to the catalytic materials that were based ondealuminated zeolite samples the carbon yield was signifi-cantly lower compared to the catalyst that was preparedfrom the respective parent zeolite sample. Table 3 showsthe carbon yields for the Fe-impregnated catalysts pre-pared from the steamed (USY) and severely steamed[USY(st)] samples, the AHFS-treated sample (NH4Y–AHFS) and the combined severely steamed/AHFS-treatedsample (USY(st)–AHFS). By comparing the results inTable 3 with those in Table 1, it is clear that the higherdegree of dealumination, which is accompanied by higherformation of amorphous phases and of secondary meso/macropores, results in a more pronounced decrease in car-bon yield. In a previous related study, Zhang et al. [48]showed that the formation of secondary mesopores byframework dealumination results in the formation of
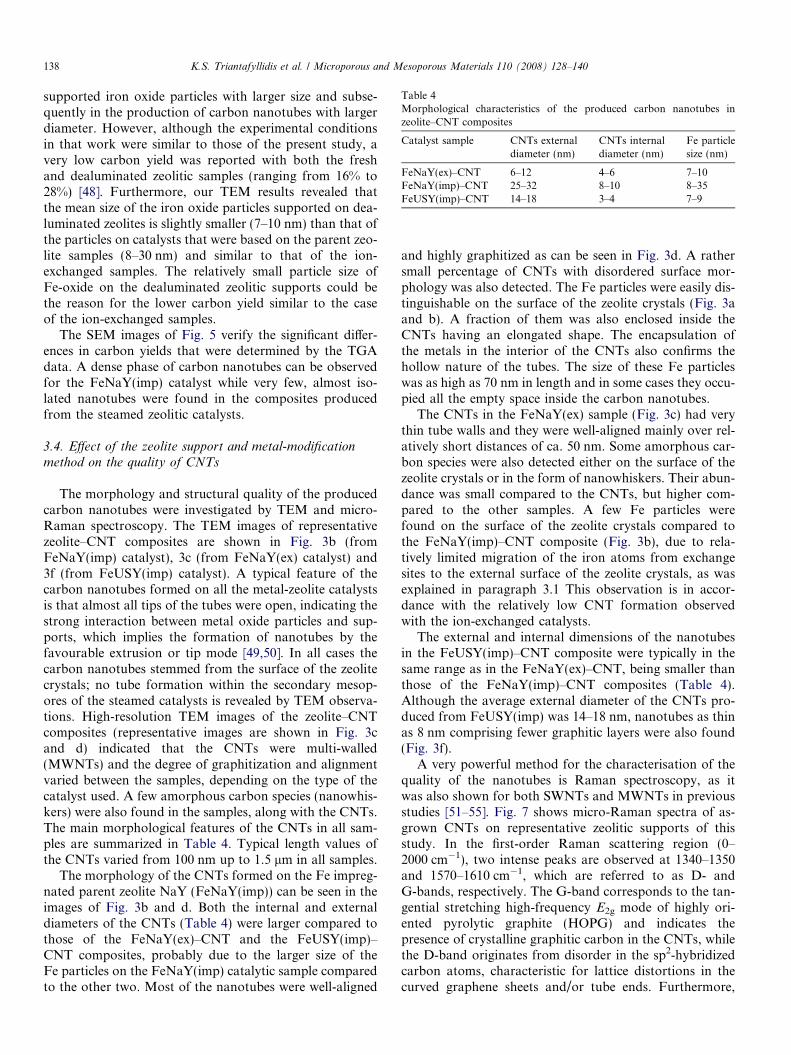
Table 4Morphological characteristics of the produced carbon nanotubes inzeolite–CNT composites
Catalyst sample CNTs externaldiameter (nm)
CNTs internaldiameter (nm)
Fe particlesize (nm)
FeNaY(ex)–CNT 6–12 4–6 7–10FeNaY(imp)–CNT 25–32 8–10 8–35FeUSY(imp)–CNT 14–18 3–4 7–9
138 K.S. Triantafyllidis et al. / Microporous and Mesoporous Materials 110 (2008) 128–140
supported iron oxide particles with larger size and subse-quently in the production of carbon nanotubes with largerdiameter. However, although the experimental conditionsin that work were similar to those of the present study, avery low carbon yield was reported with both the freshand dealuminated zeolitic samples (ranging from 16% to28%) [48]. Furthermore, our TEM results revealed thatthe mean size of the iron oxide particles supported on dea-luminated zeolites is slightly smaller (7–10 nm) than that ofthe particles on catalysts that were based on the parent zeo-lite samples (8–30 nm) and similar to that of the ion-exchanged samples. The relatively small particle size ofFe-oxide on the dealuminated zeolitic supports could bethe reason for the lower carbon yield similar to the caseof the ion-exchanged samples.
The SEM images of Fig. 5 verify the significant differ-ences in carbon yields that were determined by the TGAdata. A dense phase of carbon nanotubes can be observedfor the FeNaY(imp) catalyst while very few, almost iso-lated nanotubes were found in the composites producedfrom the steamed zeolitic catalysts.
3.4. Effect of the zeolite support and metal-modificationmethod on the quality of CNTs
The morphology and structural quality of the producedcarbon nanotubes were investigated by TEM and micro-Raman spectroscopy. The TEM images of representativezeolite–CNT composites are shown in Fig. 3b (fromFeNaY(imp) catalyst), 3c (from FeNaY(ex) catalyst) and3f (from FeUSY(imp) catalyst). A typical feature of thecarbon nanotubes formed on all the metal-zeolite catalystsis that almost all tips of the tubes were open, indicating thestrong interaction between metal oxide particles and sup-ports, which implies the formation of nanotubes by thefavourable extrusion or tip mode [49,50]. In all cases thecarbon nanotubes stemmed from the surface of the zeolitecrystals; no tube formation within the secondary mesop-ores of the steamed catalysts is revealed by TEM observa-tions. High-resolution TEM images of the zeolite–CNTcomposites (representative images are shown in Fig. 3cand d) indicated that the CNTs were multi-walled(MWNTs) and the degree of graphitization and alignmentvaried between the samples, depending on the type of thecatalyst used. A few amorphous carbon species (nanowhis-kers) were also found in the samples, along with the CNTs.The main morphological features of the CNTs in all sam-ples are summarized in Table 4. Typical length values ofthe CNTs varied from 100 nm up to 1.5 lm in all samples.
The morphology of the CNTs formed on the Fe impreg-nated parent zeolite NaY (FeNaY(imp)) can be seen in theimages of Fig. 3b and d. Both the internal and externaldiameters of the CNTs (Table 4) were larger compared tothose of the FeNaY(ex)–CNT and the FeUSY(imp)–CNT composites, probably due to the larger size of theFe particles on the FeNaY(imp) catalytic sample comparedto the other two. Most of the nanotubes were well-aligned
and highly graphitized as can be seen in Fig. 3d. A rathersmall percentage of CNTs with disordered surface mor-phology was also detected. The Fe particles were easily dis-tinguishable on the surface of the zeolite crystals (Fig. 3aand b). A fraction of them was also enclosed inside theCNTs having an elongated shape. The encapsulation ofthe metals in the interior of the CNTs also confirms thehollow nature of the tubes. The size of these Fe particleswas as high as 70 nm in length and in some cases they occu-pied all the empty space inside the carbon nanotubes.
The CNTs in the FeNaY(ex) sample (Fig. 3c) had verythin tube walls and they were well-aligned mainly over rel-atively short distances of ca. 50 nm. Some amorphous car-bon species were also detected either on the surface of thezeolite crystals or in the form of nanowhiskers. Their abun-dance was small compared to the CNTs, but higher com-pared to the other samples. A few Fe particles werefound on the surface of the zeolite crystals compared tothe FeNaY(imp)–CNT composite (Fig. 3b), due to rela-tively limited migration of the iron atoms from exchangesites to the external surface of the zeolite crystals, as wasexplained in paragraph 3.1 This observation is in accor-dance with the relatively low CNT formation observedwith the ion-exchanged catalysts.
The external and internal dimensions of the nanotubesin the FeUSY(imp)–CNT composite were typically in thesame range as in the FeNaY(ex)–CNT, being smaller thanthose of the FeNaY(imp)–CNT composites (Table 4).Although the average external diameter of the CNTs pro-duced from FeUSY(imp) was 14–18 nm, nanotubes as thinas 8 nm comprising fewer graphitic layers were also found(Fig. 3f).
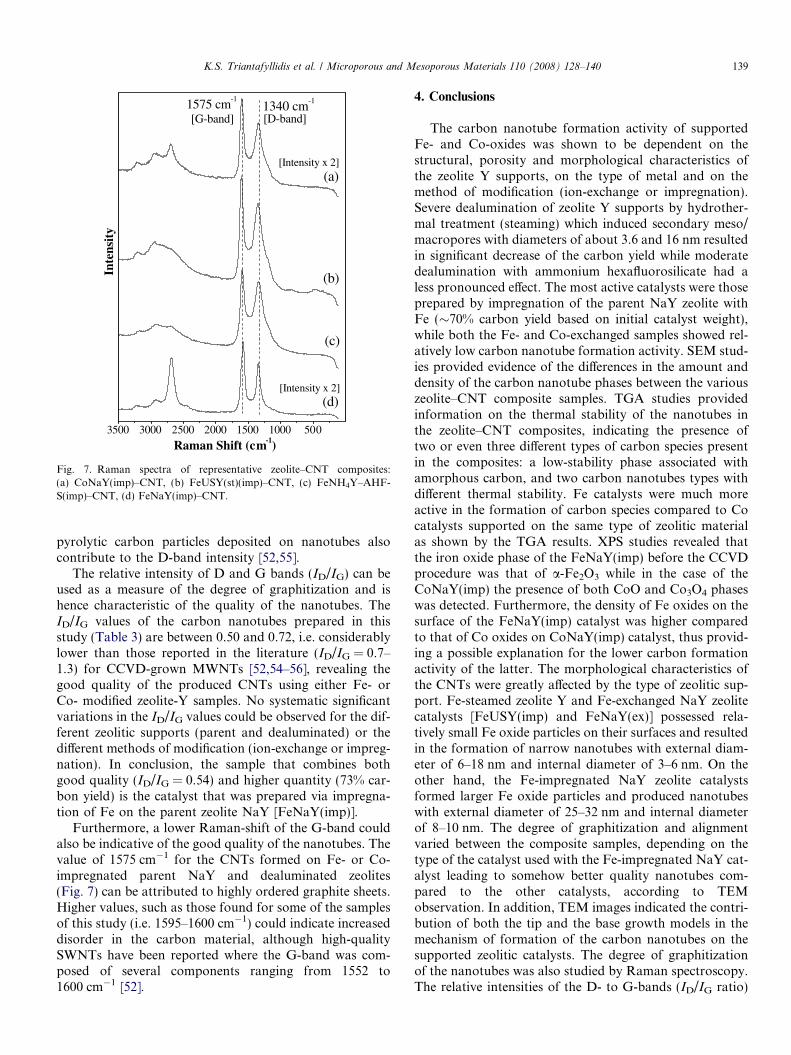
A very powerful method for the characterisation of thequality of the nanotubes is Raman spectroscopy, as itwas also shown for both SWNTs and MWNTs in previousstudies [51–55]. Fig. 7 shows micro-Raman spectra of as-grown CNTs on representative zeolitic supports of thisstudy. In the first-order Raman scattering region (0–2000 cm�1), two intense peaks are observed at 1340–1350and 1570–1610 cm�1, which are referred to as D- andG-bands, respectively. The G-band corresponds to the tan-gential stretching high-frequency E2g mode of highly ori-ented pyrolytic graphite (HOPG) and indicates thepresence of crystalline graphitic carbon in the CNTs, whilethe D-band originates from disorder in the sp2-hybridizedcarbon atoms, characteristic for lattice distortions in thecurved graphene sheets and/or tube ends. Furthermore,
3500 3000 2500 2000 1500 1000 500
1340 cm-1
[Intensity x 2]
(c)
(d)[Intensity x 2]
(b)
[D-band][G-band]1575 cm-1
(a)
Raman Shift (cm-1)
Inte
nsit
y
Fig. 7. Raman spectra of representative zeolite–CNT composites:(a) CoNaY(imp)–CNT, (b) FeUSY(st)(imp)–CNT, (c) FeNH4Y–AHF-S(imp)–CNT, (d) FeNaY(imp)–CNT.
K.S. Triantafyllidis et al. / Microporous and Mesoporous Materials 110 (2008) 128–140 139
pyrolytic carbon particles deposited on nanotubes alsocontribute to the D-band intensity [52,55].
The relative intensity of D and G bands (ID/IG) can beused as a measure of the degree of graphitization and ishence characteristic of the quality of the nanotubes. TheID/IG values of the carbon nanotubes prepared in thisstudy (Table 3) are between 0.50 and 0.72, i.e. considerablylower than those reported in the literature (ID/IG = 0.7–1.3) for CCVD-grown MWNTs [52,54–56], revealing thegood quality of the produced CNTs using either Fe- orCo- modified zeolite-Y samples. No systematic significantvariations in the ID/IG values could be observed for the dif-ferent zeolitic supports (parent and dealuminated) or thedifferent methods of modification (ion-exchange or impreg-nation). In conclusion, the sample that combines bothgood quality (ID/IG = 0.54) and higher quantity (73% car-bon yield) is the catalyst that was prepared via impregna-tion of Fe on the parent zeolite NaY [FeNaY(imp)].
Furthermore, a lower Raman-shift of the G-band couldalso be indicative of the good quality of the nanotubes. Thevalue of 1575 cm�1 for the CNTs formed on Fe- or Co-impregnated parent NaY and dealuminated zeolites(Fig. 7) can be attributed to highly ordered graphite sheets.Higher values, such as those found for some of the samplesof this study (i.e. 1595–1600 cm�1) could indicate increaseddisorder in the carbon material, although high-qualitySWNTs have been reported where the G-band was com-posed of several components ranging from 1552 to1600 cm�1 [52].
4. Conclusions
The carbon nanotube formation activity of supportedFe- and Co-oxides was shown to be dependent on thestructural, porosity and morphological characteristics ofthe zeolite Y supports, on the type of metal and on themethod of modification (ion-exchange or impregnation).Severe dealumination of zeolite Y supports by hydrother-mal treatment (steaming) which induced secondary meso/macropores with diameters of about 3.6 and 16 nm resultedin significant decrease of the carbon yield while moderatedealumination with ammonium hexafluorosilicate had aless pronounced effect. The most active catalysts were thoseprepared by impregnation of the parent NaY zeolite withFe (�70% carbon yield based on initial catalyst weight),while both the Fe- and Co-exchanged samples showed rel-atively low carbon nanotube formation activity. SEM stud-ies provided evidence of the differences in the amount anddensity of the carbon nanotube phases between the variouszeolite–CNT composite samples. TGA studies providedinformation on the thermal stability of the nanotubes inthe zeolite–CNT composites, indicating the presence oftwo or even three different types of carbon species presentin the composites: a low-stability phase associated withamorphous carbon, and two carbon nanotubes types withdifferent thermal stability. Fe catalysts were much moreactive in the formation of carbon species compared to Cocatalysts supported on the same type of zeolitic materialas shown by the TGA results. XPS studies revealed thatthe iron oxide phase of the FeNaY(imp) before the CCVDprocedure was that of a-Fe2O3 while in the case of theCoNaY(imp) the presence of both CoO and Co3O4 phaseswas detected. Furthermore, the density of Fe oxides on thesurface of the FeNaY(imp) catalyst was higher comparedto that of Co oxides on CoNaY(imp) catalyst, thus provid-ing a possible explanation for the lower carbon formationactivity of the latter. The morphological characteristics ofthe CNTs were greatly affected by the type of zeolitic sup-port. Fe-steamed zeolite Y and Fe-exchanged NaY zeolitecatalysts [FeUSY(imp) and FeNaY(ex)] possessed rela-tively small Fe oxide particles on their surfaces and resultedin the formation of narrow nanotubes with external diam-eter of 6–18 nm and internal diameter of 3–6 nm. On theother hand, the Fe-impregnated NaY zeolite catalystsformed larger Fe oxide particles and produced nanotubeswith external diameter of 25–32 nm and internal diameterof 8–10 nm. The degree of graphitization and alignmentvaried between the composite samples, depending on thetype of the catalyst used with the Fe-impregnated NaY cat-alyst leading to somehow better quality nanotubes com-pared to the other catalysts, according to TEMobservation. In addition, TEM images indicated the contri-bution of both the tip and the base growth models in themechanism of formation of the carbon nanotubes on thesupported zeolitic catalysts. The degree of graphitizationof the nanotubes was also studied by Raman spectroscopy.The relative intensities of the D- to G-bands (ID/IG ratio)

140 K.S. Triantafyllidis et al. / Microporous and Mesoporous Materials 110 (2008) 128–140
of the first-order Raman scattering region is a measure ofthe disorder in the graphite sheets, the lower being the ratiothe better the quality of the nanotubes. The values obtainedfrom the zeolite–CNT composites of this study wasbetween 0.50 and 0.72, these values being comparable orlower to those reported for other CVD-grown multi-wallcarbon nanotubes.
Acknowledgments
This work was supported in part by CPERI/CERTHand the Greek General Secretariat for Research and Tech-nology (GSRT), and by the Dutch Foundation for Funda-mental research on Matter (FOM) and the Breedtestrategieprogram of the University of Groningen. The authorswould also like to thank Roberto Macovez for criticalreading of the manuscript.
References
[1] S. Iijima, Nature 354 (1991) 56.[2] M. Monthioux, V.L. Kuznetsov, Carbon 44 (2006) 1621.[3] P.M. Ajayan, Chem. Rev. 99 (1999) 1787.[4] M.S. Dresselhaus, G. Dresselhaus, P. Avouris (Eds.), Carbon
Nanotubes: Synthesis, Structure, Properties and Applications, Topicsin Applied Physics, vol. 80, Springer Verlag, Berlin, 2001.
[5] D.S. Bethune, C.H. Kiang, M.S. Devries, G. Gorman, R. Savoy, J.Vazquez, R. Beyers, Nature 363 (1993) 605.
[6] S. Iijama, Nature 363 (1993) 603.[7] M. Paradise, T. Goswami, Mater. Des. 28 (2007) 1477.[8] P.R. Bandaru, J. Nanosci. Nanotechnol. 7 (2007) 1239.[9] P.G. Collins, P. Avouris, Scient. American 283 (2000) 62.
[10] E.T. Thostenson, Z. Ren, T.-W. Chou, Comput. Sci. Technol. 61(2001) 1899.
[11] M.-F. Yu, O. Lourie, M.J. Dyer, K. Moloni, T.F. Kelly, R.S. Ruoff,Science 287 (2000) 637.
[12] V. Popov, Mater. Sci. Eng. R 43 (2004) 61.[13] S. Fan, M.G. Franklin, T.W. Tombler, A.M. Cassel, H. Dai, Science
283 (1999) 512.[14] J.J. Zhao, Curr. Nanosci. 1 (2005) 169.[15] F.L. Darkrim, P. Malbrunot, G.P. Tartaglia, Int. J. Hydrogen Energy
27 (2002) 193.[16] L. Lacerda, A. Bianco, M. Prato, K. Kostarelos, Adv. Drug Delivery
Rev. 58 (2006) 1460.[17] W. Wei, A. Sethuraman, C. Jin, N.A. Monteiro-Riviere, R.J.
Narayan, J. Nanosci. Nanotechnol. 7 (2007) 1284.[18] C. Journet, W.K. Maser, P. Bernier, A. Loiseau, M.L. de la Chapelle,
S. Lefrant, P. Deniard, R. Lee, J.E. Fischer, Nature 388 (1997) 756.[19] A.G. Rinzler, J. Liu, H. Dai, P. Nikolaev, C.B. Huffman, F.J.
Rodriguez-Macias, P.J. Boul, A.H. Lu, D. Heymann, D.T. Colbert,R.S. Lee, J.E. Fischer, A.M. Rao, P.C. Eklund, R.E. Smalley, Appl.Phys. A 67 (1998) 29.
[20] Y. Zhang, S. Iijima, Appl. Phys. Lett. 75 (1999) 3087.[21] K. Hernadi, A. Fonseca, J.B. Nagy, D. Bernaerts, A. Fudala, A.A.
Lucas, Zeolites 17 (1996) 416.[22] A. Fonseca, K. Hernadi, J.B. Nagy, D. Bernaerts, A. Lucas, J.Mol.
Catal. A 107 (1996) 159.
[23] W.Z. Li, S.S. Xie, L.X. Qian, B.H. Chang, B.S. Zou, W.Y. Zhou,R.A. Zhao, G. Wang, Science 274 (1996) 1701.
[24] S. Lim, D. Ciuparu, C. Pak, F. Dobek, Y. Chen, D. Harding, L.Pfefferle, G. Haller, J. Phys. Chem. B 107 (2003) 11048.
[25] N. He, Y. Kuang, Q. Dai, Y. Miao, A. Zhang, X. Wang, K. Song, Z.Lu, C. Yuan, Mater. Sci. Eng. C8-9 (1999) 151.
[26] K. Hernadi, A. Fonseca, J.B. Nagy, D. Bernaerts, A.A. Lucas,Carbon 34 (1996) 1249.
[27] A.K.M.F. Kibria, Y.H. Mo, K.S. Nahm, Catal. Lett. 71 (2001) 229.[28] N.S. Kim, Y.T. Lee, J.H. Park, H. Ryu, H.J. Lee, S.Y. Choi, J.B.
Choo, J. Phys. Chem. B 106 (2002) 9286.[29] Z. Konya, I. Vesselenyi, K. Lazar, J. Kiss, I. Kiricsi, IEEE Trans.
Nanotechnol. 3 (2004) 73.[30] V. Ivanov, A. Fonseca, J.B. Nagy, A. Lucas, P. Lambin, D.
Bernaerts, X.B. Zhang, Carbon 33 (1995) 1727.[31] D. Gournis, M.A. Karakassides, T. Bakas, N. Boukos, D. Petridis,
Carbon 40 (2002) 2641.[32] K. Mukhopadhyay, A. Koshio, T. Sugai, N. Tanaka, H. Shinohara,
Z. Konya, J.B. Nagy, Chem. Phys. Lett. 303 (1999) 117.[33] I. Willems, Z. Konya, J.-F. Colomer, G. Van Tendeloo, N. Nagaraju,
A. Fonseca, J.B. Nagy, Chem. Phys. Lett. 317 (2000) 71.[34] S. Maruyama, R. Kojima, Y. Miyauchi, S. Chiashi, M. Kohno,
Chem. Phys. Lett. 360 (2002) 229.[35] S. Van Donk, A.H. Janssen, J.H. Bitter, K.P. de Jong, Catal. Rev. -
Sci. Eng. 45 (2003) 297.[36] C.S. Triantafillidis, A.G. Vlessidis, N.P. Evmiridis, Ind. Eng. Chem.
Res. 39 (2000) 307.[37] L. Kubelkova, V. Seidl, J. Novakova, S. Bednarova, P. Jiru, J. Chem.
Soc. Farad. Trans. 1 (80) (1984) 1367.[38] M. Neuber, V. Dondur, H.G. Karge, L. Pacheco, S. Ernst, J.
Weitkamp, Stud. Surf. Sci. Catal. 37 (1988) 461.[39] J.M. Cruz, A. Corma, V. Fornes, Appl. Catal. 50 (1989) 287.[40] C. Triantafillidis, A. Vlessidis, L. Nalbandian, N. Evmiridis, Micro-
por. Mesopor. Mater. 47 (2001) 369.[41] S. Karakoulia, L. Jankovic, K. Dimos, D. Gournis, K. Triantafyllidis,
Stud. Surf. Sci. Catal. 158 (2005) 391.[42] S. Tougaard, Solid State Commun. 61 (1987) 547.[43] L. Kubelkova, V. Seidl, G. Borbely, H.K. Beyer, J. Chem. Soc.
Faraday Trans. I 84 (1988) 1447.[44] P. Graat, M.A.J. Somers, Surf. Interface Anal. 26 (1998) 773.[45] H.A.E. Hagelin-Weaver, G.B. Hoflund, D.A. Minahan, G.N. Salaita,
Appl. Surf. Sci. 235 (2004) 420.[46] C.-M. Chen, M. Chen, F.-C. Leu, S.-Y. Hsu, S.-C. Wang, S.-C. Shi,
C.-F. Chen, Diamond Relat. Mater. 13 (2004) 1182.[47] Y. Li, X.B. Zhang, X.Y. Tao, J.M. Xu, W.Z. Huang, J.H. Luo, Z.Q.
Luo, T. Li, F. Liu, Y. Bao, H.J. Geise, Carbon 43 (2005) 295.[48] A. Zhang, C. Li, S. Bao, Q. Xu, Micropor. Mesopor. Mater. 29 (1999)
383.[49] R.T.K. Baker, Carbon 27 (1989) 315.[50] T.E. Muller, D.G. Reid, W.K. Hsu, J.P. Hare, H.W. Kroto, D.R.M.
Walton, Carbon 35 (1997) 951.[51] P.C. Eklund, J.M. Holden, R.A. Jishi, Carbon 33 (1995) 959.[52] M. Sveningsson, R.-E. Morjan, O.A. Nerushev, Y. Sato, J. Back-
strom, E.E.B. Campbell, F. Rohmund, Appl. Phys. A 73 (2001)409.
[53] M.S. Dresselhaus, P.C. Eklund, Adv. Phys. 49 (2000) 705.[54] W. Li, H. Zhang, C. Wang, Y. Zhang, L. Xu, K. Zhu, Appl. Phys.
Lett. 70 (1997) 2684.[55] K. Kwok, W.K.S. Chiu, Carbon 43 (2005) 437.[56] H. Cui, G. Eres, J.Y. Howe, A. Puretkzy, M. Varela, D.B. Geohegan,
D.H. Lowndes, Chem. Phys. Lett. 374 (2003) 222.