
Ga-promoted sulfated zirconia systems. II. Surface features and catalytic activity

This article was originally published in a journal published byElsevier, and the attached copy is provided by Elsevier for the
author’s benefit and for the benefit of the author’s institution, fornon-commercial research and educational use including without
limitation use in instruction at your institution, sending it to specificcolleagues that you know, and providing a copy to your institution’s
administrator.
All other uses, reproduction and distribution, including withoutlimitation commercial reprints, selling or licensing copies or access,
or posting on open internet sites, your personal or institution’swebsite or repository, are prohibited. For exceptions, permission
may be sought for such use through Elsevier’s permissions site at:
http://www.elsevier.com/locate/permissionusematerial

Autho
r's
pers
onal
co
py
Surface properties, textural features and catalytic performance for
NO + CO abatement of spinels MAl2O4 (M = Mg, Co and Zn)
developed by reverse and bicontinuous microemulsion method
A.E. Giannakas a,*, A.K. Ladavos b, G.S. Armatas a, P.J. Pomonis a
a Department of Chemistry, University of Ioannina, Ioannina 45110, Greeceb Department of Farm Organization and Management, University of Ioannina, Agrinio 30100, Greece
Received 4 September 2006; received in revised form 29 January 2007; accepted 6 February 2007
Available online 17 February 2007
Abstract
Three typical spinels of general formula MAl2O4 (M = Mg, Co and Zn) have been successfully prepared via a microemulsion method both in
the reverse and bicontinuous state. The final solids were characterized by X-ray diffraction followed by Rietveld analysis, N2 adsorption–
desorption porosimetry and SEM. Pore connectivity (c) was also calculated with Seaton’s method. The analysis of all these properties shown that
spinels prepared via reverse microemulsion route have better surface and textural properties than bicontinuous ones. The spinels were tested for
NO + CO reaction and reverse spinels shown better catalytic activity than bicontinuous ones while the full sequence of catalytic activity is:
ZnAl2O4-r > ZnAl2O4-b > MgAl2O4-r > MgAl2O4-b > CoAl2O4-r > CoAl2O4-b. The Rietveld analysis helped us to give an explanation about
the catalytic activity and shown that the configuration of inverse spinel phase is the critical factor for the catalytic behavior of final solids. The
reactants NO and CO react in a 2:1 ratio at low temperature but they convert in a 1:1 ratio at high temperatures. From the kinetic analysis the heats
of NO adsorption are estimated and are in full agreement with the results of catalytic activity.
# 2007 Elsevier B.V. All rights reserved.
Keywords: Microemulsion; Spinels; Catalysis; NO + CO
1. Introduction
Spinels are placed among the most widely used of all solid
precursors or catalyst supports and have a general formula of
AB2O4. In the unit cell there are 32 oxygen ions with 8 of the 64
tetrahedral and 16 of the 32 octahedral sites occupied. When the
A ions are all housed by the tetrahedral sites and all the B ions
are in the octahedral ones we talk about ‘‘normal spinels’’. The
spinels MAl2O4 (M = Mg, Fe, Co, Cu, Ni, Mn and Zn) have this
structure. But in certain other spinels, the eight tetrahedral
positions are occupied, not by the A ions, but by one-half of B
ions, the rest of which, together with the A ions, are arranged
randomly in the 16 octahedral positions. These ‘‘inverse
spinels’’ are therefore formulated as B(AB)O4. Many workers
have prepared spinels with the general formula of MAl2O4
(M = Mg, Co, Zn, Cu and Ni) in the last few years [1–7] and
they have given emphasis to preparing solids with high surface
area. Here are some of the most interesting reports about spinels
in the last few years. CoAl2O4 spinels have been prepared by
hydrolysis of mixed metal alkoxides [1] with specific surface
area Sp = 235 m2g�1 and by a low temperature combustion
method [2] with Sp = 77 m2g�1. Also MgAl2O4 aluminates
have been prepared from a colloidal solution using filter
expansion aerosol generator [3] and achieve surface area of
259 m2g�1. Nanocrystalline metal aluminates MAl2O4
(M = Mn, Cu and Zn) have been prepared using the combustion
method [5] with surface area varying from 40–180 m2g�1.
Finally a zinc aluminate with Sp = 350 m2g�1 and micro-
porosity with narrow pore size distribution prepared using a
hydrothermal treatment method [6] at low temperatures.
In order to achieve final solids with high surface area, which
is an interesting property from catalytic point of view,
microemulsion method has also been used [8–11]. The main
advantages of this method are the high surface area and the
small particle size of resulting materials in the range of 5–
10 nm. Additionally by using this method the same final solid
www.elsevier.com/locate/apsusc
Applied Surface Science 253 (2007) 6969–6979
* Corresponding author. Tel.: +32 6510 98361; fax: +32 6510 98795.
E-mail address: [email protected] (A.E. Giannakas).
0169-4332/$ – see front matter # 2007 Elsevier B.V. All rights reserved.
doi:10.1016/j.apsusc.2007.02.031
Autho
r's
pers
onal
co
py
can be prepared in two different microemulsion states, reverse
and bicontinuous, with different properties as previously
reported [10]. There are two different types of microemulsions:
the oil in water (o/w) where the aqueous phase includes oily
nanodroplets and the water in oil (w/o) where the oily phase
includes water nanodroplets. In w/o microemulsions when the
concentration of water is low, the system is called reverse
microemulsion. As the water concentration increases the
nanodroplets of microemulsion increase in size and eventually
form a cluster, which is considered infinite. Recently the
microemulsion method has been used for preparing materials
with interesting catalytic applications [12–18]. These studies
show the increased interest for microemulsion method in
catalysis field. One of the most usual reactions where solids as
perovskites, supported metals or spinels and d-oxides are used
is the reduction of NO where CO used as the reducing gas
because of the worldwide increasing interesting to control NO
and CO emissions especially from motor vehicles and because
NO and CO generally are believed to be the precursors of acid
rain and photochemical smog [19–21].
The present study reports the successful use of the
microemulsion method for preparing high surface area
aluminates MAl2O4 with varying A site cations (M = Mg, Co,
and Zn) at final calcination temperature of 800 8C. All spinels
have been prepared using the reverse and bicontinuous
microemulsion routes. The resulting spinels were characterized
by X-Ray diffraction followed by Rietveld analysis, N2
adsorption–desorption porosimetry and scanning electron
microscopy (SEM) while the connectivity (c) of the samples
was determined using Seaton’s equations. Catalytic activity tests
on the prepared materials for the NO + CO reaction were carried
out and studied in order to investigatewhich is the combination of
ions M–Al (M = Mg, Co, and Zn) with higher catalytic activity.
2. Experimental
2.1. Microemulsion used and preparation of samples
The microemulsion A (see Table 1) used for the preparation
of the solids was based on the CTAB/1-butanol/n-octane/
Al(NO3)3 + B(NO3)x system, where B = Mg, Co, Cu or Zn. In
this microemulsion A a second microemulsion B based on
CTAB/1-butanol/n-octane/NH3 was added under stirring at
room temperature. After several conductivity tests [10,18] we
reached the conclusion that the compositions of microemulsion
shown in Table 1 were worthwhile for the synthesis of the
corresponding spinels and their subsequent comparison. More
information about the conductivity experiments has been
reported in a previous work [10]. The selected compositions for
every solid are shown in Table 1 and also in Fig. 1 in the form of
triangular phase diagrams.
Precipitation took place by adding the microemulsion A to
B, where B contains NH3 in excess for the precipitation of the
corresponding hydroxides.
The prepared precursor phases were then filtered, dried at
room temperature, heated at 800 8C for 4 h under atmospheric
conditions, and ground in an agate motor in order to obtain the
final solids. The final calcination temperature (800 8C) was
selected after thermogravimetric experiments. Above this
temperature no mass loss was observed.
The samples obtained and characterized will be designated as
MAl2O4-r (M = Mg, Co, and Zn) meaning the samples prepared
by reverse microemulsion and MAl2O4-b (M = Mg, Co, and Zn)
meaning the samples prepared by bicontinuous microemulsion.
2.2. XRD analysis—Rietvield analysis
In order to check the development of the crystal phases,
XRD patterns of the prepared materials were obtained after
heating at 800 8C for 4 h. The equipment used was a Bruker
Advance D8 system employing Cu Ka radiation
(l = 1.5418 A). The samples were placed in quartz sample
holders and the step scans were taken over the range of 2u
angles from 108 to 808 in steps of 0.028 (2u). The XRD patterns
were assigned using the Joint Committee on Powder Diffraction
Standards (JCPDS) database and then were analyzed with
Rietvield refinement using an applicable computer program.
2.3. Surface area and porosity
The specific surface area Sp (m2g�1) was estimated by N2
adsorption–desorption porosimetry at 77 K via the BET method.
The instrument employed was a Fisons 1900 Sorptomatic
system. Prior to the measurement, the sample (�250 mg) was
degassed overnight at 200 8C under pressure P of 10�2 bar.
2.4. Pore connectivity of spinels ZnAl2O4
From the data of adsorption–desorption isotherms, the pore
connectivity c of spinels was estimated according to the
methodology proposed initially by Seaton [22–24] and applied
in various similar studies [25,26]. Briefly, the method of
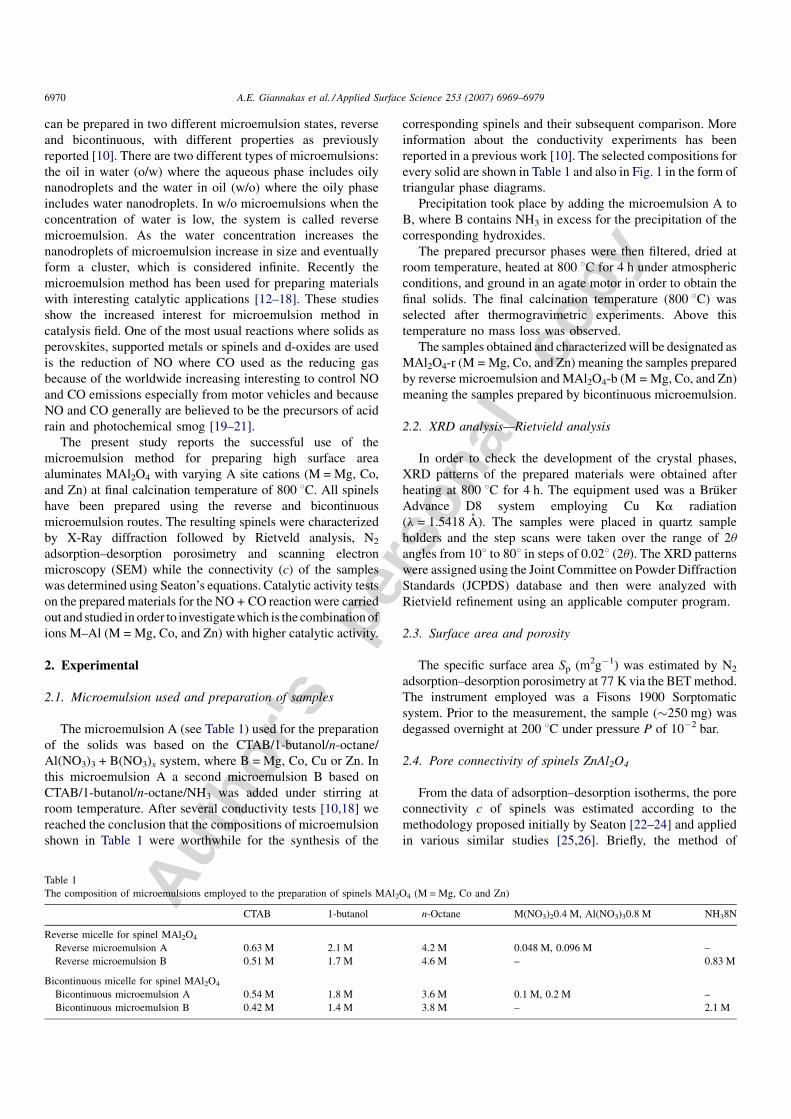
Table 1
The composition of microemulsions employed to the preparation of spinels MAl2O4 (M = Mg, Co and Zn)
CTAB 1-butanol n-Octane M(NO3)20.4 M, Al(NO3)30.8 M NH38N
Reverse micelle for spinel MAl2O4
Reverse microemulsion A 0.63 M 2.1 M 4.2 M 0.048 M, 0.096 M –
Reverse microemulsion B 0.51 M 1.7 M 4.6 M – 0.83 M
Bicontinuous micelle for spinel MAl2O4
Bicontinuous microemulsion A 0.54 M 1.8 M 3.6 M 0.1 M, 0.2 M –
Bicontinuous microemulsion B 0.42 M 1.4 M 3.8 M – 2.1 M
A.E. Giannakas et al. / Applied Surface Science 253 (2007) 6969–69796970

Autho
r's
pers
onal
co
pyestimating c is as follows [22–24]: The bond occupation
probability f was obtained as a function of percolation
probability F from the adsorption isotherms using the pore
size distribution obtained as follows:
f ¼R r¼1
r� nrdrR r¼10
nrdr(1)
f
F¼ V flat max � Vdes
V flat max � Vads
(2)
Where r is the pore radius, nr the corresponding psd using the
BJH method for cylindrical pores, Vflat max is the part of the
desorption curve before the start of desorption and Vdes, Vads are
the corresponding volumes in desorption and adsorption curves.
Then the c and L values are obtained by fitting the results for
f and F, obtained as described above, to the following
generalized scaling relation (Eq. (3)) proposed by Kirkpatrick
[25]:
Lb=vcF ¼ G
��c f � 3
2
�L1=v
�(3)
where c, connectivity; L, pore length and b, v,critical exponents
with values 0.41 and 0.88, respectively.
We must underline the fact that the estimation of
connectivity using the above procedure is possible only in
cases where there is some hysteresis in the N2 adsorption–
desorption data. The determined values of c and L have been
calculated using the experimental data of desorption isotherms
which corresponds to hysterisis branch. We also mention that
this methodology is based on the percolation theory and on
percolation effects which are related to connectivity of the pore
system and its relation to the adsorption–desorption hysteresis
loop. For a detailed description one may refer to the original
papers by Seaton and co-workers [22–24]. Typical fitting
results according to Eq. (3) are shown in Fig. 4 for the various
spinels.
2.5. SEM images
The obtained solids after calcination at 800 8C were
observed by scanning electron microscopy using a JEOL
JSM 5600 instrument.
Fig. 1. Phase diagrams for the systems n-octane—CTAB/1-butanol 1.5% w/w-Mg(NO3)2 0.4M + Al(NO3)3 0.8 M (upper left); n-octane—CTAB/1-butanol 1.5% w/
w-Co(NO3)2 0.4M + Al(NO3)3 0.8 M (upper right); n-octane—CTAB/1-butanol 1.5% w/w-Zn(NO3)2 0.4M + Al(NO3)3 0.8 M (down left); n-octane—CTAB/1-
butanol 1.5% w/w-NH3 8 N (down right). The points A1, A2 correspond to the chemical composition of microemulsion A employed (also in Table 1) for the synthesis
of the spinels MgAl2O4, CoAl2O4 and ZnAl2O4 using reverse and bicontinuous microemulsion correspondingly. The points A01, A02 corresponds to the chemical
composition of microemulsion B (NH3 8 N) employed for synthesis.
A.E. Giannakas et al. / Applied Surface Science 253 (2007) 6969–6979 6971
Autho
r's
pers
onal
co
py
2.6. Catalytic activity
The catalytic activity tests of the solids for the NO + CO
reaction were carried out in a bench scale tubular plug flow
reactor (PFR) under atmospheric pressure. A mixture of
reactants NO/CO/He = 2/2/96 at a total flow rate of
100 cm3 min�1 was passed through the catalyst bed containing
0.20 g of the catalyst. The system was heated externally via a
tubular furnace, regulated by a SUR BERLIN controller, within
�1 8C, via a thermocouple in contact with the catalyst bed.
Analyses of the reactants and products were carried out using a
Carlo Erba GC equipped with a TCD, with He as carrier gas and
connected to a PC for data acquisition. The carrier gas flow was
kept at 30 ml min�1. A 10-port valve controlled via the PC
enables sampling of 1 ml of reactants or products for analysis
using a two-column system, Porapac Q and Molecular Sieve
13X, similar to that described in [27]. The catalysts were tested
in the temperature region of 160–580 8C and from the data
obtained the degrees of conversion and reaction rates were
calculated.
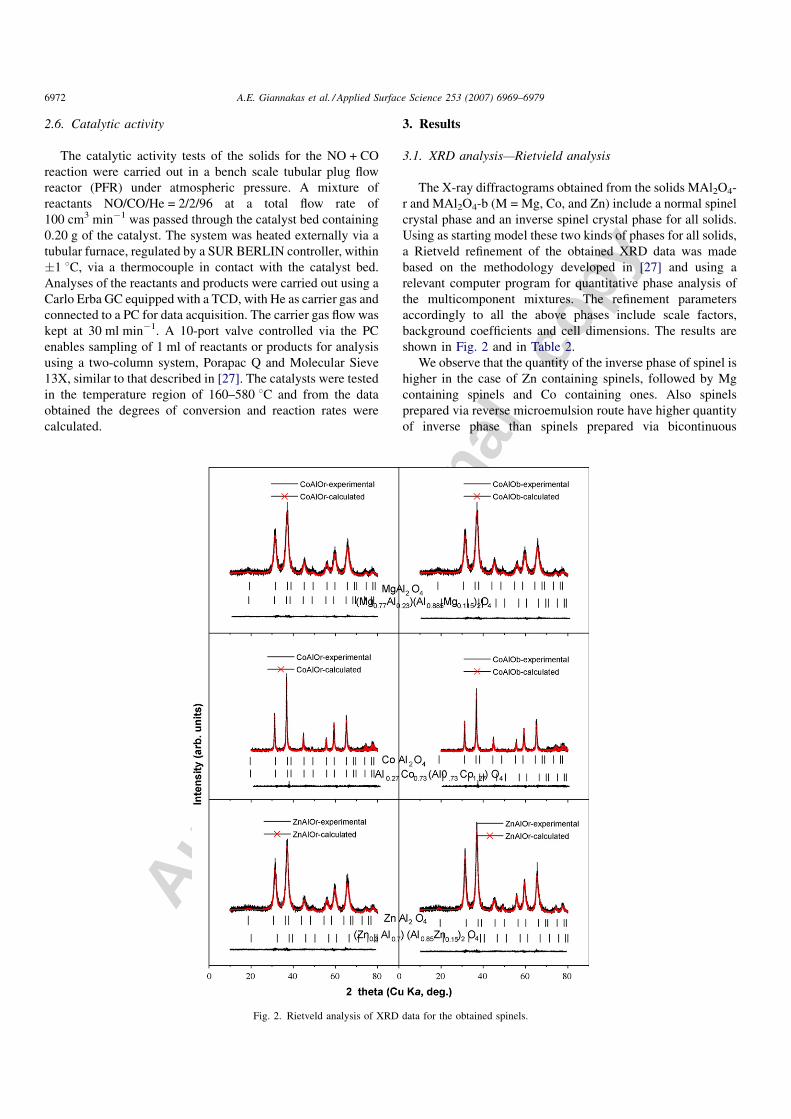
3. Results
3.1. XRD analysis—Rietvield analysis
The X-ray diffractograms obtained from the solids MAl2O4-
r and MAl2O4-b (M = Mg, Co, and Zn) include a normal spinel
crystal phase and an inverse spinel crystal phase for all solids.
Using as starting model these two kinds of phases for all solids,
a Rietveld refinement of the obtained XRD data was made
based on the methodology developed in [27] and using a
relevant computer program for quantitative phase analysis of
the multicomponent mixtures. The refinement parameters
accordingly to all the above phases include scale factors,
background coefficients and cell dimensions. The results are
shown in Fig. 2 and in Table 2.
We observe that the quantity of the inverse phase of spinel is
higher in the case of Zn containing spinels, followed by Mg
containing spinels and Co containing ones. Also spinels
prepared via reverse microemulsion route have higher quantity
of inverse phase than spinels prepared via bicontinuous
Fig. 2. Rietveld analysis of XRD data for the obtained spinels.
A.E. Giannakas et al. / Applied Surface Science 253 (2007) 6969–69796972

Autho
r's
pers
onal
co
py
microemulsion route. We can also see that for all materials the
cell parameters a, b, c (Table 2) are always lower than the
corresponding values of the phase in Data Bank.
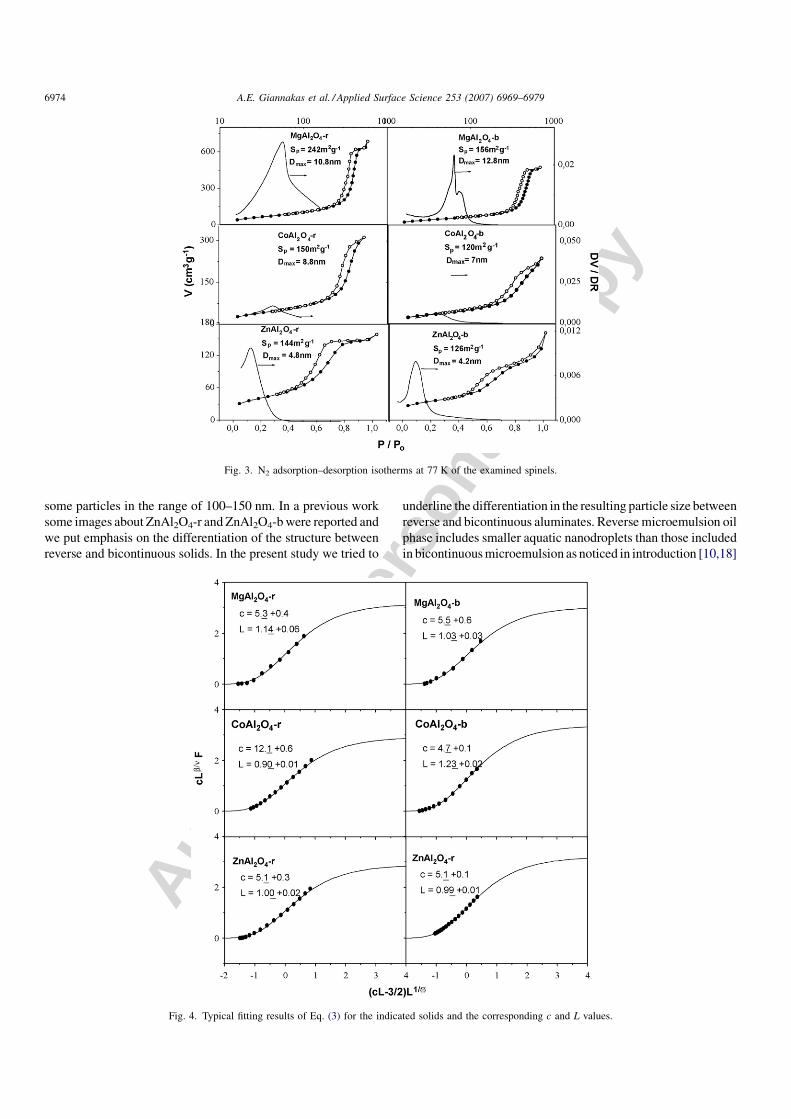
3.2. Surface and porosity
Taking into account the adsorption desorption isotherms,
shown in Fig. 3, and the calculated values of both the specific
surface area (Sp) and the pore diameter (Dmax), listed in Table 3, it
could be said that all prepared spinels are typical mesoporous
materials. The N2 adsorption– desorption isotherms (Fig. 3) show
the characteristic hysterisis loop of H1 type for mesoporous
materials. A first observation is that aluminates prepared via
microemulsion method have high specific surface area in the
range of 150–250 m2g�1. Same typical values of ssa for identical
spinels prepared via a sol–gel method have been previously
reported (Ref. [10]) and are shown in Table 3 for comparison. In
addition the values of ssa and Dmax from solids obtained by
reverse method are different than those of bicontinuous obtained
solids. We can see from Fig. 3 and Table 3 that all aluminates
which have been prepared via the reverse microemulsion route
have higher values of specific surface area than aluminates which
have been prepared via the bicontinuous microemulsion route. A
similar differentiation between reverse and bicontinuous solids is
observed for the values of pore diameter (Dmax).
3.3. Pore connectivity
Pore connectivity c values are around 5–6 for the most of the
resulting spinels (Table 3, Fig. 4) except for CoAl2O4-r where
the parameter c takes the value of 12.1. This means that each
irregular pore is connected to 5–6 different outlets on the
average. These values are average ones and it is understood that
there are pores with larger number of outlets while some others
posses less connections. Trying to compare the values of pore
connectivity c between examined reverse and bicontinuous
aluminates, it is observed that in the case of MgAl2O4 and
ZnAl2O4 spinels the values are quite similar while in the case of
CoAl2O4 spinels a big difference in the values of c is observed.
So CoAl2O4-r has c = 12.1 which is three times higher than
CoAl2O4-b with c = 4.7.
3.4. SEM images
In Fig. 5 some typical SEM images of the examined
aluminates are shown. In the left hand part of row images are
shown the ‘‘reverse spinels’’, while in the right hand the
‘‘bicontinuous’’ ones for comparison. From all images it is
concluded that microemulsion method leads to final solids with
small particle size. All examined spinels show particle size
smaller than 100 nm except for CoAl2O4 which shows size of
Table 2
Results of Rietveld refinement for all studied solids
Code of sample Observed phases (%) (%) a b c
MgAlOr Mg Al2 O4 Fd-3m 58.9 8.09745 8.09745 8.09745
(Mg0.77Al0..23)(Al0.885Mg0.115)2O4 Fd-3m 41.1 8.07272 8.07272 8.07272
MgAlOb Mg Al2 O4 Fd-3m 64.3 8.10791 8.10791 8.10791
(Mg0.77Al0..23)(Al0.885Mg0.115)2O4 Fd-3m 35.7 8.06741 8.06741 8.06741
CoAlOr Co Al2 O4 Fd-3m 68.9 8.09871 8.09871 8.09871
(Co0.94 Al0.06)(Co0.06 Al1.94)O4 Fd-3m 31.1 8.08188 8.08188 8.08188
CoAlOb CoAl2O4 Fd-3m 75.2 8.09463 8.09463 8.09463
(Co0.94 Al0.06)(Co0.06 Al1.94)O4 Fd-3m 24.8 8.07515 8.07515 8.07515
ZnAlOr ZnAl2O4 Fd-3m 18.7 8.07356 8.07356 8.07356
(Zn0.3 Al0.7)Al1.7O4 Fd-3m 81.3 8.01641 8.01641 8.01641
ZnAlOb Zn Al2 O4 Fd-3m 30.3 8.08854 8.08854 8.08854
(Zn0.3 Al0.7)Al1.7O4 Fd-3m 69.7 8.04425 8.04425 8.04425
Phases from Data Bank a b c
Mg Al2 O4 Fd-3m 8.131 8.131 8.131
(Mg0.77Al0.23)(Al0.885Mg0.115)2O4 Fd-3m 8.125 8.125 8.125
CoAl2O4 Fd-3m 8.107 8.107 8.107
(Co0.94 Al0.06)(Co0.06 Al1.94)O4 Fd-3m 8.105 8.105 8.105
ZnAl2O4 Fd-3m 8.086 8.086 8.086
(Zn0.3 Al0.7)Al1.7O4 Fd-3m 8.000 8.000 8.000
Table 3
Spinels studied and some of their surface properties in comparison with the surface properties values of same spinels prepared via sol–gel method
Material Sp (m2g�1) Sp (m2g�1) by sol–gel method Vp (cm3g�1) Dmax (nm) c L
MgAl2O4-r 242 139 1.10 10.8 5.3 1.14 � 0.06
MgAl2O4-b 156 0.70 12.8 5.5 1.03 � 0.03
CoAl2O4-r 150 65 0.49 8.8 12.1 0.90 � 0.01
CoAl2O4-b 120 0.32 7.0 4.7 1.23 � 0.02
ZnAl2O4-r 144 144 0.23 4.8 5.1 1.00 � 0.02
ZnAl2O4-b 126 0.20 4.2 5.1 0.99 � 0.01
A.E. Giannakas et al. / Applied Surface Science 253 (2007) 6969–6979 6973
Autho
r's
pers
onal
co
py
some particles in the range of 100–150 nm. In a previous work
some images about ZnAl2O4-r and ZnAl2O4-b were reported and
we put emphasis on the differentiation of the structure between
reverse and bicontinuous solids. In the present study we tried to
underline the differentiation in the resulting particle size between
reverse and bicontinuous aluminates. Reverse microemulsion oil
phase includes smaller aquatic nanodroplets than those included
in bicontinuous microemulsion as noticed in introduction [10,18]
Fig. 3. N2 adsorption–desorption isotherms at 77 K of the examined spinels.
Fig. 4. Typical fitting results of Eq. (3) for the indicated solids and the corresponding c and L values.
A.E. Giannakas et al. / Applied Surface Science 253 (2007) 6969–69796974

Autho
r's
pers
onal
co
py
and this differentiation is expected to characterize the particle
size of the examined solids. This differentiation is clearly
depicted in the case of CoAl2O4-r and CoAl2O4-b spinels while it
is less clear in the cases of the other couples of spinels.
3.5. Catalytic activity
In Fig. 6 the temperature profiles of the conversion of the
reactants NO and CO over the tested catalysts are shown.
The aluminates containing Mg, Co and Zn species showed
significant activity in the range of 350–600 8C. A comparative
graph T50%NO and T50%CO is shown in Fig. 7 for all studied
materials.
From Figs. 6 and 7 is observed that aluminates containing Zn
species have the bigger activity followed by the Mg containing
ones and Co containing ones. Also reverse spinels achieve a
little higher catalytic activity than bicontinuous ones in all
cases. These two catalytic results will be discussed next.
Fig. 8 shows the temperature profiles of the ratio of CO2
production to that of N-containing species, i.e. CO2/
(N2 + N2O).
The ratio CO2/(N2 + N2O) takes the value of about unity at
low temperatures and increases towards the value of two as the
reaction temperature increases. This behavior will be discussed
later.
Finally in Fig. 9 we have drawn Arrhenius-type plots of the
form ln RNO = f (1000/T) as well as ln RCO = f (1000/T) where
R is the observed integral rate of conversion in mmol g�1 s�1.
As derived from the Arrhenius plots, there are two straight line
parts one at low temperatures and another at high temperatures.
Fig. 5. SEM images for the obtained aluminates. In the left part of row are the reverse aluminates: (a) MgAl2O4-r, (c) CoAl2O4-r and (e) ZnAl2O4-r. In the right part of
row are the bicontinuous aluminates: (b) MgAl2O4-b, (d) CoAl2O4-b and (f) ZnAl2O4-b.
A.E. Giannakas et al. / Applied Surface Science 253 (2007) 6969–6979 6975

Autho
r's
pers
onal
co
py
The apparent activation energies Eapp (NO) and Eapp(CO) for low
and high temperatures can be estimated (see Table 4) from their
slopes.
4. Discussion
From all the above noticed information about crystal phases,
specific surface area (ssa), pore diameter (Dmax) and pore
connectivity (c) it is clear that spinels prepared by reverse
microemulsion technique are obviously different from spinels
prepared by bicontinuous microemulsion technique. Reverse
spinels shown better surface and textural properties than
bicontinuous ones. So MgAl2O4-r, CoAl2O4-r and ZnAl2O4-r
spinels have higher values of specific surface area than
MgAl2O4-b, CoAl2O4-b and ZnAl2O4-b correspondingly. Also
CoAl2O4-r has much higher value of pore connectivity c than
CoAl2O4-b (Table 2). In addition spinels prepared via reverse
microemulsion route have smaller particles size than bicontin-
uous ones as it is shown by SEM images. This differentiation in
conjunction with the better properties of reverse solids might be
the reason for the higher catalytic activity of them compared to
the bicontinuous solids. But this issue about the differentiation
in catalytic activity and textural properties of reverse and
bicontinuous solids was the main subject of previous reports
[10,18] and is not going to be discussed extensively here. This
differentiation caused by the different size of aquatic
nanodroplets included in reverse and bicontinuous microemul-
sion states, is depicted in final size and in the properties of
resulted solids [10,18].
So the main subject of this work will be the reasons—
properties which differentiate the catalytic activity of the tested
aluminates. Looking carefully into Figs. 6 and 7 we reach the
conclusion that the catalytic activity of the samples follows the
sequence ZnAl2O4-r> ZnAl2O4-b> MgAl2O4-r> MgAl2O4-
b> CoAl2O4-r> CoAl2O4-b. Taking into account all the
properties analyzed and discussed above we can observe that
the catalytic activity can be corelated with the presence of
inverse crystal phase of spinel in solids. In the inverse crystal
phase of spinels some of the A ions (AB2O4) take the place of B
ions in the spinel formula and as a result we have a final solid
which support the mechanism of the catalytic reaction. Looking
carefully in the results of refinement of spinels in Table 3 it is
observed that the sequence of the % percentage of inverse phase
is the same with the sequence of catalytic activity of the
samples: ZnAl2O4-r> ZnAl2O4-b> MgAl2O4-r> MgAl2O4-
b> CoAl2O4-r> CoAl2O4-b. In other words in the formation of
inverse spinel phase some of the B ions (AB2O4), which in
normal spinels phase are in octahedral positions with oxygen
atoms, changing their positions with some of the A ions, which
in normal spinels phase take the tetrahedral sites with oxygen
atoms. So it seems that the inverse spinel phase support better
the mechanism of catalytic reaction. This probably caused by
the changing in the interatomic range between A–O and B–O
bonds in the inverse spinel phase. These interatomic distances
between A, B and O ions may be important for the mechanism
of catalytic reaction according to Laberty study [28] who
proposes that the mechanism of catalytic reaction in such solids
takes place with the participation of the bulk oxygen. This result
is ascribed better in Fig. 10 where we have plotted the ratio of
normal to inverse spinel phase as a function of the temperature
Fig. 6. Temperature profiles of NO (XNO) and CO (XCO) conversion of the
examined catalysts.
Fig. 7. Comparative histograms of T50%NO and T50%CO for all examined
catalysts.
Table 4
Materials studied and the calculated values of Eapp NO and CO in low (LT) and high (HT) temperature region
Material Eapp (NO, LT) (kJ/mol) Eapp (CO, LT) (kJ/mol) Eapp (NO, HT) (kJ/mol) Eapp (CO, HT) (kJ/mol) Transition temperature (8C)
MgAl2O4-r 56.16 60.85 14.73 19.54 514
MgAl2O4-b 58.12 61.84 17.67 21.41 527
CoAl2O4-r 61.16 65.13 7.31 11.78 533
CoAl2O4-b 65.91 66.41 15.08 16.99 550
ZnAl2O4-r 47.64 50.79 10.76 13.02 460
ZnAl2O4-b 54.62 57.08 5.94 9.35 470
A.E. Giannakas et al. / Applied Surface Science 253 (2007) 6969–69796976

Autho
r's
pers
onal
co
pywhere the reduction of NO reaches the 50%. It is observed that
as the value of the ratio of normal spinel crystal phase to inverse
spinel crystal phase increases, the value where solids achieve
the temperature of 50% conversion of NO, decreases. So we
reach the conclusion that the % percentage of inverse phase of
spinel in final solid is the reason for the alternation of catalytic
activity in final solids.
Except from the reason which differentiates the catalytic
activity of tested solids it must be underlined the fact that solids
with the formula of spinel (MAl2O4, M = Co, Mg, Zn) do not
usually used as single catalysts. Usually such solids are used as
support catalysts in combination with d-oxides or metal
particles (Pt, Pd). So a remarkable result is that with
microemulsion method we achieve to prepare spinel solids
Fig. 8. Temperature profiles of the products ratio CO2/(N2 + N2O) (left hand axis) and the (%) yield of N2 (*) and N2O (~) (right hand axis) for the examined
catalysts.
Fig. 9. Arrhenius plots for the NO (*) and CO (*) conversion.
A.E. Giannakas et al. / Applied Surface Science 253 (2007) 6969–6979 6977

Autho
r's
pers
onal
co
py
which can be used as single catalyst due the inverse spinels
phases are formed with this method.
In accordance with previous works [29–33] the reaction
between NO and CO proceeds via two possible main routes:
2NO þ 2CO ! N2þ 2CO2 route1
where the ratio of the products CO2 and N2 is 2:1
2NO þ CO ! N2O þ CO2andN2O ! N2þ 1=2O2 route2
where the ratio of C-containing products (CO2) to that of N-
containing ones (N2 + N2O) equals unity.
Fig. 8 shows the temperature profiles of the ratio of CO2
production to that of N-containing species. It is observed that at
low reaction temperatures the ratio of CO2/(N2 + N2O) obtains
values of about unity and increases gradually towards the value
of two as the reaction temperature increases. So, it seems that
for all tested catalysts which contains Mg+2, Co+2 and Zn+2 as A
cation the examined reaction follows route 2 at low
temperatures up 200–350 8C. In the temperature range 400–
580 8C a gradual change of mechanism to route 1 occurs and
above 460–570 8C temperature range route 1 predominates for
tested solids.
In order to calculate the apparent activation energies for the
NO reduction and CO oxidation as well as to check the
transition point from one reaction route to the other, we have
plotted the relevant Arrhenius lines in the form: ln R = f (1000/
T). The plots have been drawn separately for the low (LT) and
high temperature (HT) regions. Between those two regions
there is a typical saddle point corresponding to the transition
region of the rate. The exact transition temperatures for every
solid were calculated and are listed in Table 4 for comparison. It
is observed that the value of transition temperature for every
spinel is in full agreement with catalytic results. So the lowest
value of transition temperature is for Zn species containing
spinels followed by Mg and finally Co. Above this transition
temperature the conversion of both NO and CO is always higher
than 70% because in this range the mechanism of reaction
follows route 2 were NO is fully reduced directly to N2 without
the intermediate step of reduction of NO to N2O
(N2O! N2 + 1/2O2). From the corresponding Arrhenius plots,
shown in Fig. 9, the apparent activation energies Eapp for NO
and CO conversions at low and high reaction temperatures were
calculated and are listed in Table 4.
From the results reported in Table 4 it can be seen that Eapp is
in every case higher in LT as compared to HT for both reactants
and Eapp for NO conversion is systematically lower compared
to that of CO. The Arrhenius plots provide more reliable values
of Eapp for NO and CO for the low temperature region and this is
where the Eapp values of both NO and CO (Table 4) for the
reverse spinels are lower than those of the bicontinuous ones.
This fact validating the results of the catalytic experiments
(Fig. 6) which were discussed above. Furthermore, as it is
shown in Table 4 the values of Eapp(NO), Eapp(CO) in high
temperature region are very low. This is mainly due to the
diffusion phenomena which appear in high temperature region
because of the fact that our aluminates are all porous materials.
For this reason these values are not used for comparison or other
calculations.
5. Conclusions
The microemulsion method has been applied successfully
for the preparation of high surface area spinels MgAl2O4,
CoAl2O4 and ZnAl2O4 both prepared in reverse and
bicontinuous microemulsion state. The solids after final
calcinations at 800 8C were characterized by X-Ray analysis
and Rietvield refinement, N2 adsorption–desorption porosim-
ety in 77K and calculation of the pore connectivity c was
calculated and SEM. The aluminates prepared via reverse
microemulsion method show different surface and textural
properties than aluminates prepared via bicontinuous route. All
final spinels were examined for their catalytic activity in the
reaction of reduction NO by CO. Catalysts prepared via reverse
route show a higher catalytic activity than bicontinuous ones
because of their better surface and textural properties. The
catalyst containing Zn species achieved the highest catalytic
activity followed by the Mg and Co containing species and this
behavior was in agreement with the increment of the %
percentage of inverse crystal phase of spinel. The decomposi-
tion of NO and CO is differentiated at the low and high
temperature regions exhibiting very low Eapp at high
temperatures a fact which was explained by diffusion
phenomena appearing in porous solids, but higher Eapp at
low temperatures. The Eapp for NO conversion is always lower
than Eapp for CO oxidation, a result which is compatible with
the hysteresis observed for the CO conversion as compared to
NO conversion. Finally the values of Eapp (NO, LT) and Eapp (CO,
LT) are in a full agreement with the catalytic behavior of the
tested spinels a fact which validates our catalytic results.
Acknowledgements
Part of this work was carried out with financial assistance
from a GROWTH project GSRT-CT-2000-00317 of the E.U.
Fig. 10. Schematic presentation of the ratio of normal to inverse spinel phase of
all studied solid as a function of T50%NO.
A.E. Giannakas et al. / Applied Surface Science 253 (2007) 6969–69796978

Autho
r's
pers
onal
co
py
The authors are grateful to the Ring of the Laboratory Units and
Centers of the University of Ioannina for the XRD mesur-
amentes, and SEM images.
References
[1] C.O. Arean, M.P. Mentruit, E.E. Platero, F.X. Xamera, J.B. Parra, Mater.
Lett. 39 (1999) 22.
[2] W. Li, J. Li, J. Guo, J. Eur. Ceram. Soc. 23 (2003) 2289.
[3] Y.C. Kang, J.S. Choi, S.B. Park, J. Eur. Ceram. Soc. 18 (1998) 641.
[4] J. Sehested, A. Carlsson, T.V.W. Jannssens, P.L. Hansen, A.L. Datye, J.
Catal. 197 (2001) 200.
[5] T. Mimani, J. Alloys Compd. 315 (2001) 123.
[6] M. Zawadski, J. Wrzyszcz, Mater. Res. Bull. 35 (2000) 109.
[7] V.N. Stathopoulos, P.J. Pomonis, Prog. Colloid. Polym. Sci. (2001) 2881.
[8] E.J. Choi, Y. Ahn, S. Kim, D.H. An, K.U. Kang, B.G. Lee, K.S. Back, H.N.
Oak, J. Magn. Magn. Mater. 262 (2003) 198.
[9] C.R. Vestae, Z.J. Zhang, J. Solid State Chem. 75 (2003) 59.
[10] (a) A.E. Giannakas, T.C. Vaimakis, A.K. Ladavos, P.N. Trikalitis, P.J.
Pomonis, J. Colloid Interface. Sci. 259 (2003) 244;
(b) V.N. Stathopoulos, P.J. Pomonis, Progress. in Colloid and Polymer
Science 118 (2001) 17.
[11] F. Meyer, A. Dierstein, C. Beck, W. Hartl, R. Hempelmann, S. Mathur, M.
Veith, Nanostruct. Mater. 12 (1999) 71.
[12] O.P. Yavad, A. Palmqvist, N. Cruise, K. Holmberg, Colloid Surf. A 00
(2003) 1.
[13] J. Schicks, D. Neumann, U. Specht, G. Veser, Catal. Today 81 (2003) 287.
[14] J. Rymes, G. Ehset, L. Hilaire, M. Boutonnet, K. Jiratova, Catal. Today 75
(2002) 297.
[15] H. Hayashi, L.Z. Chen, T. Tago, M. Kishida, K. Wakabayasshi, Appl.
Catal. A 231 (2002) 81.
[16] M. Ikeda, T. Tago, M. Kishida, K. Wakabayashi, Catal. Commun. 2 (2001)
39.
[17] M. Fernadez-Garsia, A. Martinez-Aria, A. Iglesias-Juez, A.B. Hungna,
J.A. Anderson, J.C. Conesa, J. Soria Appl. Catal. B 31 (2001) 39.
[18] A.E. Giannakas, A.K. Ladavos, P.J. Pomonis, Appl. Catal. B 49 (1) (2004)
147.
[19] D. Stoyanova, M. Christova, P. Dimitrova, J. Marinova, N. Kassabova, D.
Panayotov, Appl. Catal. B 17 (1998) 233.
[20] C. Drouet, D. Alphonse, A. Rouset, Appl. Catal. B 33 (2001) 35.
[21] P. Artizzu, E. Garbowski, M. Primet, Y. Brulke, J.S. Just, Catal. Today 47
(1999) 83.
[22] A.N. Seaton, Chem. Eng. Sci. 46 (1991) 1895.
[23] H. Liu, L. Zhang, A.N. Seaton, Chem. Eng. Sci. 47 (1992) 4393.
[24] H. Liu, L. Zhang, A.N. Seaton, J. Colloid Interface Sci. 156 (1993) 285.
[25] P.J. Pomonis, K. Kolonia, G.S. Armatas, Langmuir 17 (2001) 8397–8404.
[26] G.S. Armatas, K.M. Kolonia, P.J. Pomonis, Langmuir 18 (26) (2002)
10421.
[27] H.M. Rietveld, Acta Cryst. 22 (1967) 151.
[28] C. Laberty, C.M. Alvarez, C. Drouet, C. Mirodatos, J. Catal. 198 (2001)
226.
[29] A.A. Leontiou, A.K. Ladavos, P.J. Pomonis, Appl. Catal. A 241 (2003)
133.
[30] A.A. Leontiou, A.K. Ladavos, G.S. Armatas, P.N. Trikalitis, P.J. Pomonis,
Appl. Catal. A 263 (2) (2004) 227.
[31] A.K. Ladavos, P.J. Pomonis, Appl. Catal. A 165 (1997) 73.
[32] V.C. Belessi, P.N. Trikalitis, A.K. Ladavos, T.V. Bakas, P.J. Pomonis,
Appl. Catal. B 53a (1999) 177.
[33] V.C. Belessi, T.V. Bakas, C.N. Costas, A.M. Efstathiou, P.J. Pomonis,
Appl. Catal. B 13b (2000) 28.
A.E. Giannakas et al. / Applied Surface Science 253 (2007) 6969–6979 6979
Copyright © 2022 FDOKUMEN