
Company Detail Report - PONDY OXIDES & CHEMICALS LTD
12
Document code: FOTL_070220185_3 Copyright © 2016 Firstobject Technologies Ltd. All rights reserved PONDY OXIDES & CHEMICALS LTD Result Update (PARENT BASIS): Q3 FY18 CMP: 568.75 FEB 7 th , 2018 Overweight ISIN: INE063E01046 Index Details SYNOPSIS Pondy Oxides and Chemicals Limited is an India- based company, which is engaged in the business of lead metal and alloy. Revenue for Dec quarter of FY 2017-18 was Rs. 2380.71 mn as against Rs. 2383.41 mn in corresponding quarter of the previous year. During the quarter, EBIDTA of the company grew 11.47% at Rs. 160.51 mn from Rs. 144.00 mn in the corresponding quarter of the previous year. During Q3 FY18, net profit grew 15.29% to Rs. 80.41 mn from 69.75 mn in the corresponding quarter of previous year. During Q3 FY18, Profit before tax has increased to Rs. 123.03 mn from Rs. 108.40 mn in Q3 FY17. EPS of the company stood at Rs. 14.42 during the quarter, as against Rs. 12.51 per share over previous year period. In 9M FY2018, sales of the company grew 15.63% to Rs.6953.30 mn from Rs.6013.58 mn in 9M FY17. Nine months ended on 31 st Dec 2018, PAT of the company has increased to Rs.221.30 mn from Rs.164.38 mn in corresponding nine months of the previous year, up by 34.63% Net Sales and PAT of the company are expected to grow at a CAGR of 33% and 55% over 2016 to 2019E, respectively. Stock Data Sector Commodity Chemicals BSE Code 532626 Face Value 10.00 52wk. High / Low (Rs.) 779.00/298.00 Volume (2wk. Avg.) 15000 Market Cap (Rs. in mn.) 3171.35 Annual Estimated Results(A*: Actual / E*: Estimated) Years(Rs. In mn) FY17A FY18E FY19E Net Sales 8174.57 9676.83 11728.32 EBITDA 551.16 628.86 748.10 Net Profit 279.24 317.08 388.97 EPS 50.08 56.86 69.76 P/E 11.36 10.00 8.15 Shareholding Pattern (%) As on Dec 2017 As on Sep 2017 Promoter 46.21 51.01 Public 53.79 48.99 Others -- -- 1 Year Comparative Graph PONDY OXIDES & CHEMICALS LTD S&P BSE SENSEX PEER GROUPS CMP MARKET CAP EPS(TTM) P/E (X)(TTM) P/BV(X) DIVIDEND Company Name (Rs.) Rs. In mn. (Rs.) Ratio Ratio (%) Pondy Oxides & Chemicals Ltd. 568.75 3171.35 59.01 9.64 4.80 30.00 Gravita India Ltd 158.00 10855.30 6.67 23.69 7.01 30.00 Nile Ltd. 831.95 2497.40 100.83 8.25 2.54 30.00
-
Upload
khangminh22 -
Category
Documents
-
view
1 -
download
0
Transcript of Company Detail Report - PONDY OXIDES & CHEMICALS LTD
Document code: FOTL_070220185_3 Copyright © 2016 Firstobject Technologies Ltd. All rights reserved
PONDY OXIDES & CHEMICALS LTDResult Update (PARENT BASIS): Q3 FY18
CMP: 568.75 FEB 7th, 2018
Overweight ISIN:INE063E01046
Index DetailsSYNOPSIS
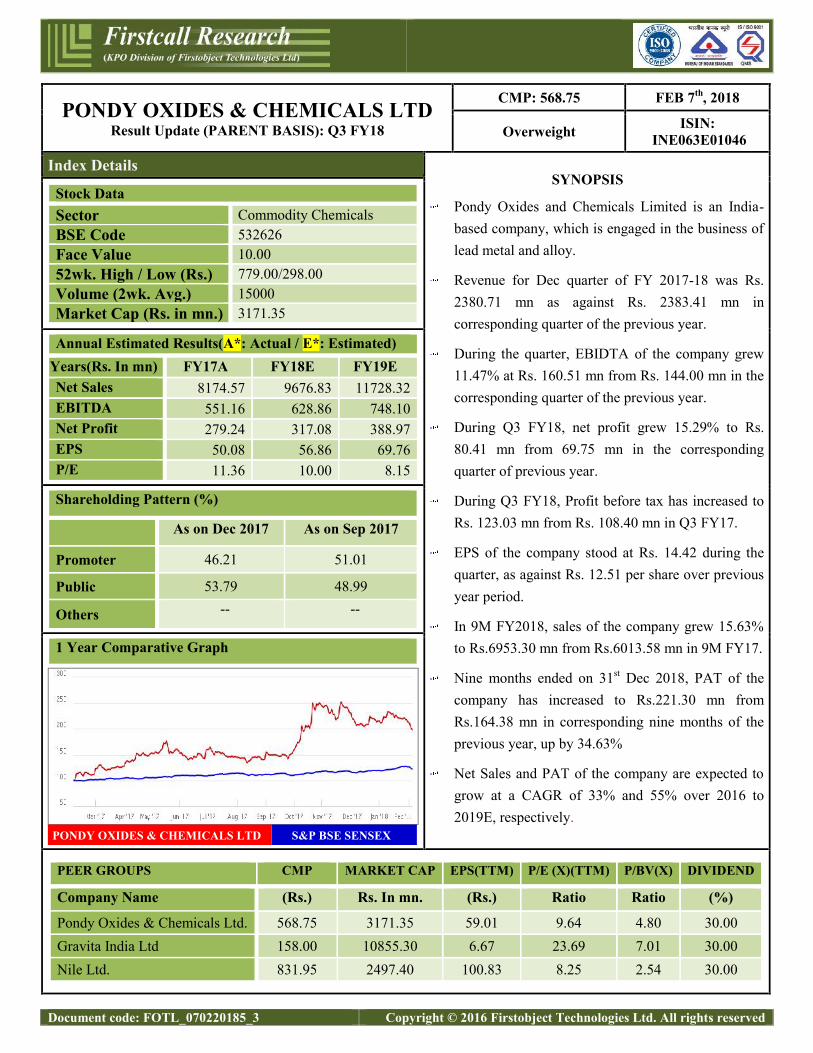
Pondy Oxides and Chemicals Limited is an India-based company, which is engaged in the business oflead metal and alloy.
Revenue for Dec quarter of FY 2017-18 was Rs.2380.71 mn as against Rs. 2383.41 mn incorresponding quarter of the previous year.
During the quarter, EBIDTA of the company grew11.47% at Rs. 160.51 mn from Rs. 144.00 mn in thecorresponding quarter of the previous year.
During Q3 FY18, net profit grew 15.29% to Rs.80.41 mn from 69.75 mn in the correspondingquarter of previous year.
During Q3 FY18, Profit before tax has increased toRs. 123.03 mn from Rs. 108.40 mn in Q3 FY17.
EPS of the company stood at Rs. 14.42 during thequarter, as against Rs. 12.51 per share over previousyear period.
In 9M FY2018, sales of the company grew 15.63%to Rs.6953.30 mn from Rs.6013.58 mn in 9M FY17.
Nine months ended on 31st Dec 2018, PAT of thecompany has increased to Rs.221.30 mn fromRs.164.38 mn in corresponding nine months of theprevious year, up by 34.63%
Net Sales and PAT of the company are expected togrow at a CAGR of 33% and 55% over 2016 to2019E, respectively.
Stock DataSector Commodity ChemicalsBSE Code 532626Face Value 10.0052wk. High / Low (Rs.) 779.00/298.00Volume (2wk. Avg.) 15000Market Cap (Rs. in mn.) 3171.35
Annual Estimated Results(A*: Actual / E*: Estimated)Years(Rs. In mn) FY17A FY18E FY19ENet Sales 8174.57 9676.83 11728.32EBITDA 551.16 628.86 748.10Net Profit 279.24 317.08 388.97EPS 50.08 56.86 69.76P/E 11.36 10.00 8.15
Shareholding Pattern (%)
As on Dec 2017 As on Sep 2017
Promoter 46.21 51.01
Public 53.79 48.99
Others -- --
1 Year Comparative Graph
PONDY OXIDES & CHEMICALS LTD S&P BSE SENSEX
PEER GROUPS CMP MARKET CAP EPS(TTM) P/E (X)(TTM) P/BV(X) DIVIDEND
Company Name (Rs.) Rs. In mn. (Rs.) Ratio Ratio (%)
Pondy Oxides & Chemicals Ltd. 568.75 3171.35 59.01 9.64 4.80 30.00Gravita India Ltd 158.00 10855.30 6.67 23.69 7.01 30.00Nile Ltd. 831.95 2497.40 100.83 8.25 2.54 30.00
Document code: FOTL_070220185_3 Copyright © 2016 Firstobject Technologies Ltd. All rights reserved
QUARTERLY HIGHLIGHTS (PARENT BASIS)
Results updates- Q3 FY18
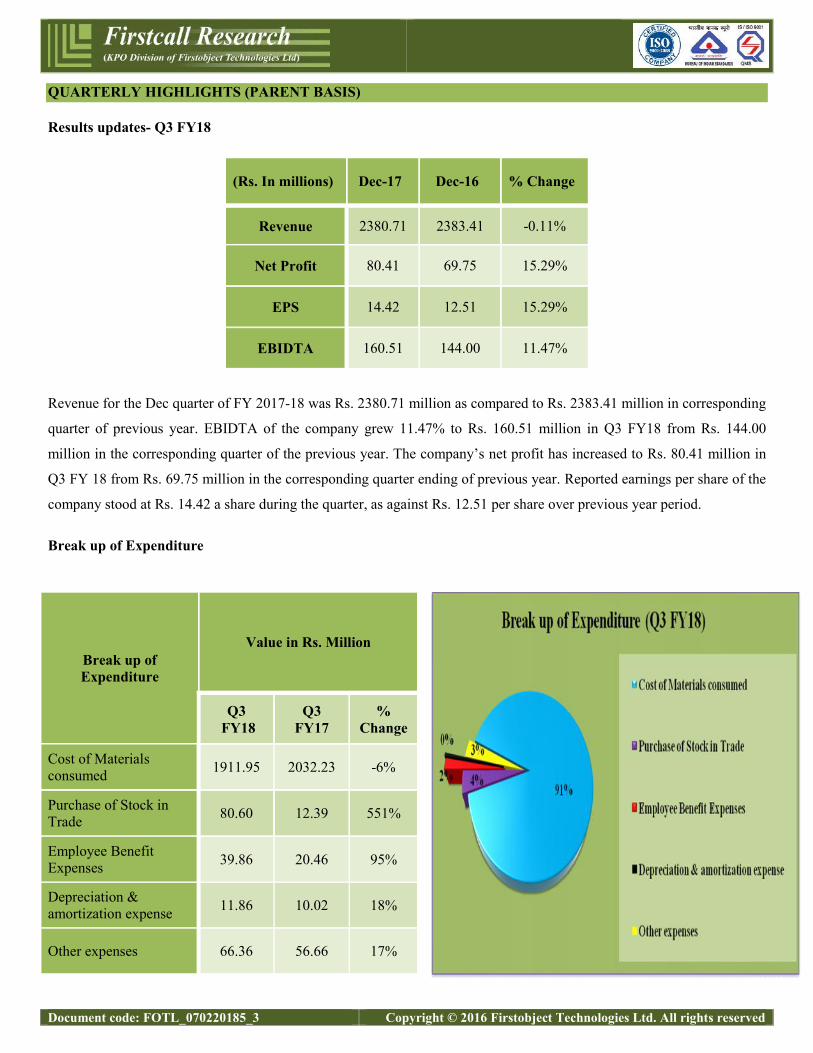
(Rs. In millions) Dec-17 Dec-16 % Change
Revenue 2380.71 2383.41 -0.11%
Net Profit 80.41 69.75 15.29%
EPS 14.42 12.51 15.29%
EBIDTA 160.51 144.00 11.47%
Revenue for the Dec quarter of FY 2017-18 was Rs. 2380.71 million as compared to Rs. 2383.41 million in corresponding
quarter of previous year. EBIDTA of the company grew 11.47% to Rs. 160.51 million in Q3 FY18 from Rs. 144.00
million in the corresponding quarter of the previous year. The company’s net profit has increased to Rs. 80.41 million in
Q3 FY 18 from Rs. 69.75 million in the corresponding quarter ending of previous year. Reported earnings per share of the
company stood at Rs. 14.42 a share during the quarter, as against Rs. 12.51 per share over previous year period.
Break up of Expenditure
Break up ofExpenditure
Value in Rs. Million
Q3FY18
Q3FY17
%Change
Cost of Materialsconsumed 1911.95 2032.23 -6%
Purchase of Stock inTrade 80.60 12.39 551%
Employee BenefitExpenses 39.86 20.46 95%
Depreciation &amortization expense 11.86 10.02 18%
Other expenses 66.36 56.66 17%

Document code: FOTL_070220185_3 Copyright © 2016 Firstobject Technologies Ltd. All rights reserved
COMPANY PROFILE
Pondy Oxides and Chemicals Limited is an India-based company, which is engaged in the business of lead metal and
alloy. The Company produces lead and lead alloys, and poly-vinyl chloride (PVC) additives that are supplied to various
customers, including battery manufacturers, chemical manufacturers and PVC extruded and molded products. Its divisions
include PVC stabilizer division and Smelter division. Its products include Lead; Lead Alloys, including Calcium Alloys
and Antimony Alloys; Master Alloys; Tin Alloys; Babbit Alloys, and PVC additives. It offers products under PVC
additives, including Di Basic Lead Phthalate and Tri Basic Lead Sulphate.
Document code: FOTL_070220185_3 Copyright © 2016 Firstobject Technologies Ltd. All rights reserved
FINANCIAL HIGHLIGHT (PARENT BASIS) (A*- Actual, E* -Estimations & Rs. In Millions)
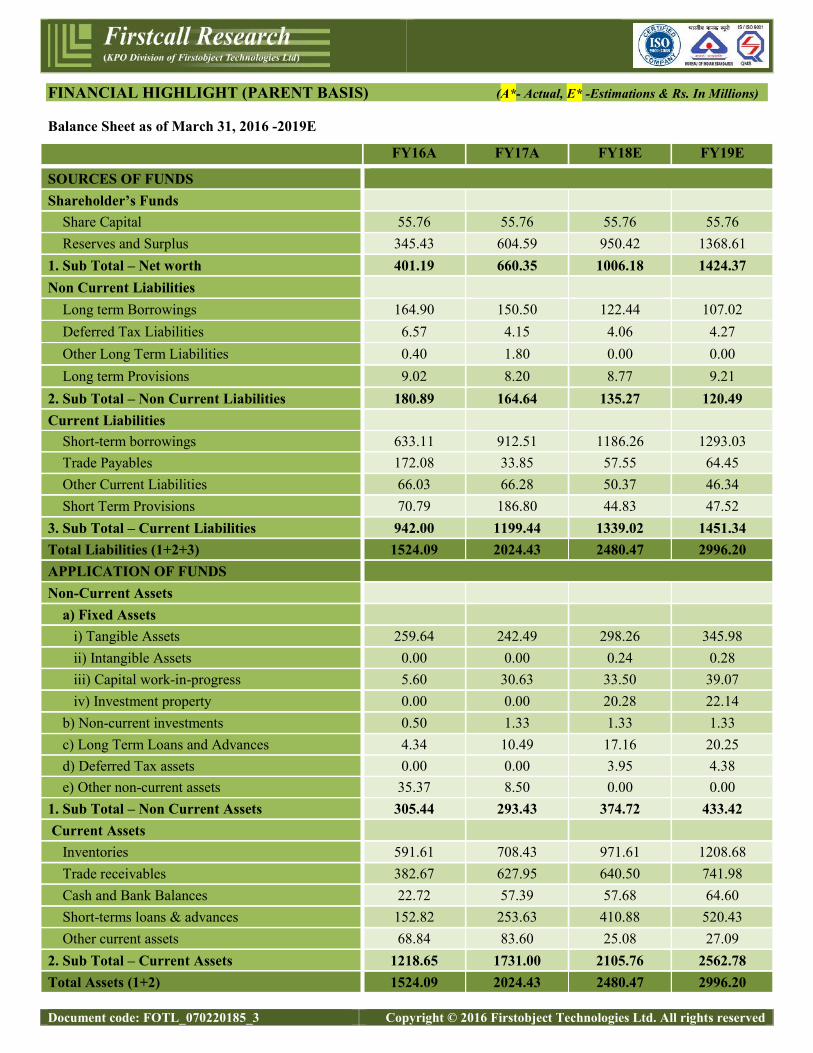
Balance Sheet as of March 31, 2016 -2019E
FY16A FY17A FY18E FY19E
SOURCES OF FUNDSShareholder’s Funds
Share Capital 55.76 55.76 55.76 55.76Reserves and Surplus 345.43 604.59 950.42 1368.61
1. Sub Total – Net worth 401.19 660.35 1006.18 1424.37Non Current Liabilities
Long term Borrowings 164.90 150.50 122.44 107.02Deferred Tax Liabilities 6.57 4.15 4.06 4.27Other Long Term Liabilities 0.40 1.80 0.00 0.00Long term Provisions 9.02 8.20 8.77 9.21
2. Sub Total – Non Current Liabilities 180.89 164.64 135.27 120.49Current Liabilities
Short-term borrowings 633.11 912.51 1186.26 1293.03Trade Payables 172.08 33.85 57.55 64.45Other Current Liabilities 66.03 66.28 50.37 46.34Short Term Provisions 70.79 186.80 44.83 47.52
3. Sub Total – Current Liabilities 942.00 1199.44 1339.02 1451.34Total Liabilities (1+2+3) 1524.09 2024.43 2480.47 2996.20APPLICATION OF FUNDSNon-Current Assets
a) Fixed Assetsi) Tangible Assets 259.64 242.49 298.26 345.98ii) Intangible Assets 0.00 0.00 0.24 0.28iii) Capital work-in-progress 5.60 30.63 33.50 39.07iv) Investment property 0.00 0.00 20.28 22.14
b) Non-current investments 0.50 1.33 1.33 1.33c) Long Term Loans and Advances 4.34 10.49 17.16 20.25d) Deferred Tax assets 0.00 0.00 3.95 4.38e) Other non-current assets 35.37 8.50 0.00 0.00
1. Sub Total – Non Current Assets 305.44 293.43 374.72 433.42Current Assets
Inventories 591.61 708.43 971.61 1208.68Trade receivables 382.67 627.95 640.50 741.98Cash and Bank Balances 22.72 57.39 57.68 64.60Short-terms loans & advances 152.82 253.63 410.88 520.43Other current assets 68.84 83.60 25.08 27.09
2. Sub Total – Current Assets 1218.65 1731.00 2105.76 2562.78Total Assets (1+2) 1524.09 2024.43 2480.47 2996.20
Document code: FOTL_070220185_3 Copyright © 2016 Firstobject Technologies Ltd. All rights reserved
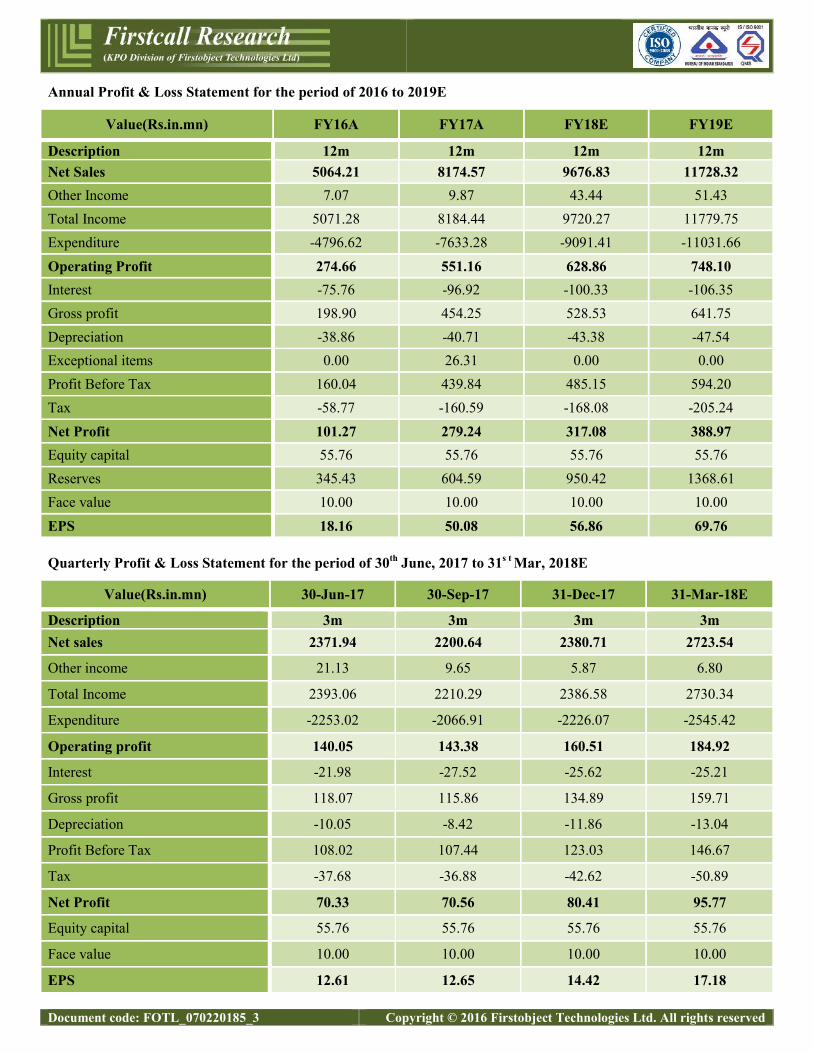
Annual Profit & Loss Statement for the period of 2016 to 2019E
Value(Rs.in.mn) FY16A FY17A FY18E FY19E
Description 12m 12m 12m 12mNet Sales 5064.21 8174.57 9676.83 11728.32Other Income 7.07 9.87 43.44 51.43Total Income 5071.28 8184.44 9720.27 11779.75Expenditure -4796.62 -7633.28 -9091.41 -11031.66Operating Profit 274.66 551.16 628.86 748.10Interest -75.76 -96.92 -100.33 -106.35Gross profit 198.90 454.25 528.53 641.75Depreciation -38.86 -40.71 -43.38 -47.54Exceptional items 0.00 26.31 0.00 0.00Profit Before Tax 160.04 439.84 485.15 594.20Tax -58.77 -160.59 -168.08 -205.24Net Profit 101.27 279.24 317.08 388.97Equity capital 55.76 55.76 55.76 55.76Reserves 345.43 604.59 950.42 1368.61Face value 10.00 10.00 10.00 10.00EPS 18.16 50.08 56.86 69.76
Quarterly Profit & Loss Statement for the period of 30th June, 2017 to 31s t Mar, 2018E
Value(Rs.in.mn) 30-Jun-17 30-Sep-17 31-Dec-17 31-Mar-18E
Description 3m 3m 3m 3mNet sales 2371.94 2200.64 2380.71 2723.54
Other income 21.13 9.65 5.87 6.80
Total Income 2393.06 2210.29 2386.58 2730.34
Expenditure -2253.02 -2066.91 -2226.07 -2545.42
Operating profit 140.05 143.38 160.51 184.92
Interest -21.98 -27.52 -25.62 -25.21
Gross profit 118.07 115.86 134.89 159.71
Depreciation -10.05 -8.42 -11.86 -13.04
Profit Before Tax 108.02 107.44 123.03 146.67
Tax -37.68 -36.88 -42.62 -50.89
Net Profit 70.33 70.56 80.41 95.77
Equity capital 55.76 55.76 55.76 55.76
Face value 10.00 10.00 10.00 10.00
EPS 12.61 12.65 14.42 17.18
Document code: FOTL_070220185_3 Copyright © 2016 Firstobject Technologies Ltd. All rights reserved
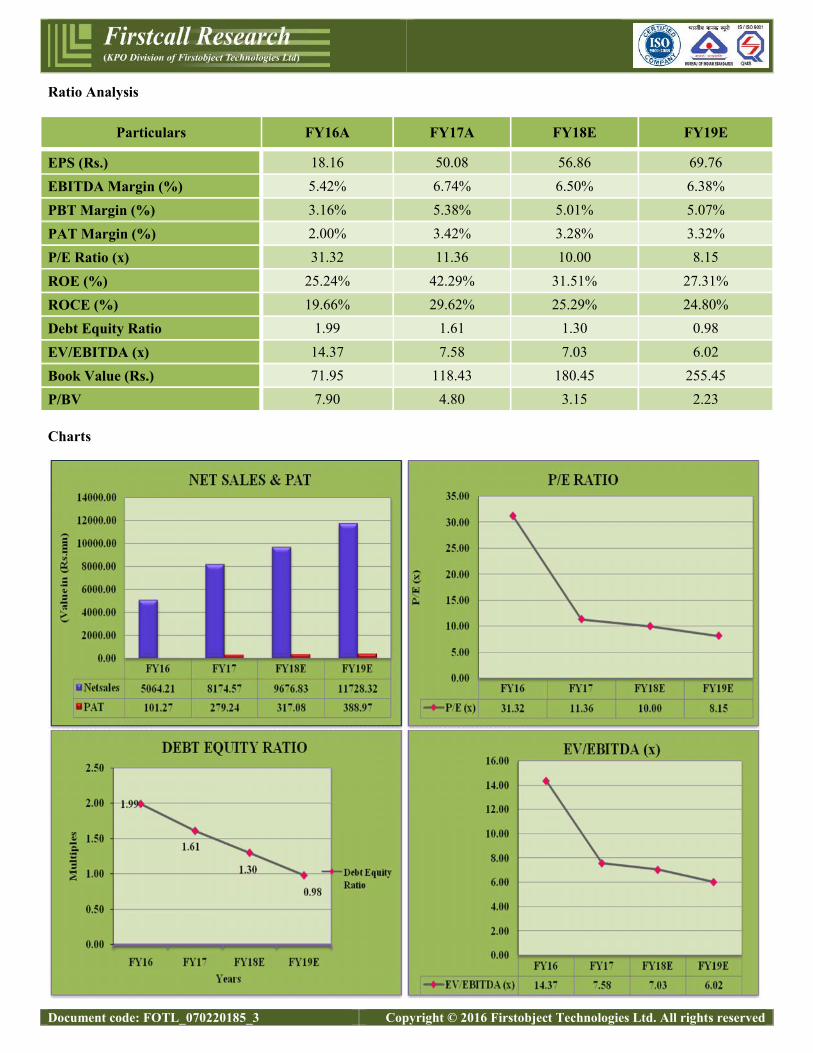
Ratio Analysis
Particulars FY16A FY17A FY18E FY19E
EPS (Rs.) 18.16 50.08 56.86 69.76EBITDA Margin (%) 5.42% 6.74% 6.50% 6.38%
PBT Margin (%) 3.16% 5.38% 5.01% 5.07%PAT Margin (%) 2.00% 3.42% 3.28% 3.32%P/E Ratio (x) 31.32 11.36 10.00 8.15
ROE (%) 25.24% 42.29% 31.51% 27.31%ROCE (%) 19.66% 29.62% 25.29% 24.80%Debt Equity Ratio 1.99 1.61 1.30 0.98
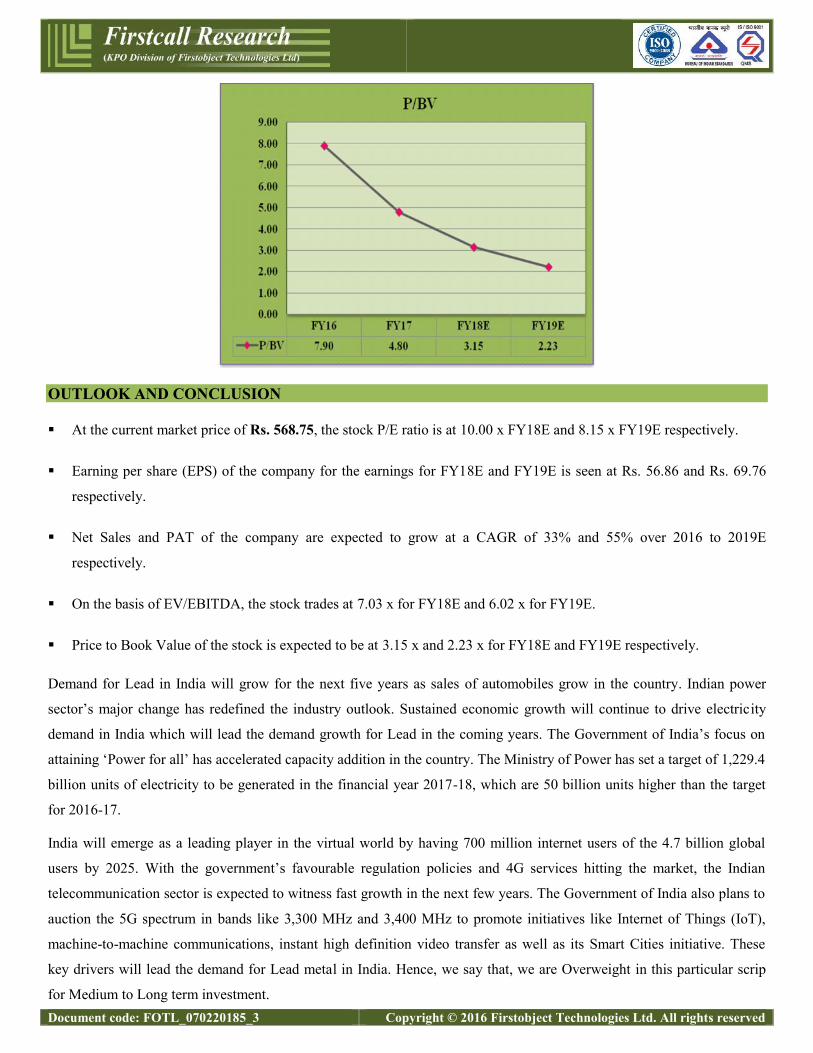
EV/EBITDA (x) 14.37 7.58 7.03 6.02Book Value (Rs.) 71.95 118.43 180.45 255.45P/BV 7.90 4.80 3.15 2.23
Charts
Document code: FOTL_070220185_3 Copyright © 2016 Firstobject Technologies Ltd. All rights reserved
OUTLOOK AND CONCLUSION
At the current market price of Rs. 568.75, the stock P/E ratio is at 10.00 x FY18E and 8.15 x FY19E respectively.
Earning per share (EPS) of the company for the earnings for FY18E and FY19E is seen at Rs. 56.86 and Rs. 69.76
respectively.
Net Sales and PAT of the company are expected to grow at a CAGR of 33% and 55% over 2016 to 2019E
respectively.
On the basis of EV/EBITDA, the stock trades at 7.03 x for FY18E and 6.02 x for FY19E.
Price to Book Value of the stock is expected to be at 3.15 x and 2.23 x for FY18E and FY19E respectively.
Demand for Lead in India will grow for the next five years as sales of automobiles grow in the country. Indian power
sector’s major change has redefined the industry outlook. Sustained economic growth will continue to drive electricity
demand in India which will lead the demand growth for Lead in the coming years. The Government of India’s focus on
attaining ‘Power for all’ has accelerated capacity addition in the country. The Ministry of Power has set a target of 1,229.4
billion units of electricity to be generated in the financial year 2017-18, which are 50 billion units higher than the target
for 2016-17.
India will emerge as a leading player in the virtual world by having 700 million internet users of the 4.7 billion global
users by 2025. With the government’s favourable regulation policies and 4G services hitting the market, the Indian
telecommunication sector is expected to witness fast growth in the next few years. The Government of India also plans to
auction the 5G spectrum in bands like 3,300 MHz and 3,400 MHz to promote initiatives like Internet of Things (IoT),
machine-to-machine communications, instant high definition video transfer as well as its Smart Cities initiative. These
key drivers will lead the demand for Lead metal in India. Hence, we say that, we are Overweight in this particular scrip
for Medium to Long term investment.
Document code: FOTL_070220185_3 Copyright © 2016 Firstobject Technologies Ltd. All rights reserved
INDUSTRY OVERVIEW
Global Lead Industry:
Lead price outlook in the year 2017-18 will be broadly determined by growth outlook for China and value of US Dollar.
Lead prices rallied to $1,895 in March, dropped back to $1,626 and then rallied back to $1,882, which is is around where
they are now consolidating. A push above the March high would look constructive – it would confirm a base is in place
and would open the way for prices to work higher. Given production cuts, mine closures and a generally robust auto
market, especially in China and Europe, as well as strong growth in the industrial battery market and relatively low stocks,
the fundamental outlook for lead looks sound.
Despite the slowdown in China’s economy, the country will remain the dominant refined Lead producer over the coming
years, and will account on average for 38.6% of global refined Lead production during 2016-2020.
China’s automobile’s team forecasts total vehicle production to grow 5.2% in 2017 and at an annual average of 5.7% to
2020, providing resilient support to Lead demand in the coming years.
Recovery in the global automotive sector will be a very gradual process. In terms of vehicle production, output in the US
will grow from 12.4mn units in 2016 to 13.2mn units by 2020.
Indian Lead Industry:
Lead demand in India will be strong for the next five years as sales of automobiles grow in the country as per BMI
Research report. Lead is a primary ingredient for automotive batteries.
A unit of rating agency Fitch, BMI forecasts the lead market will be minimally undersupplied this year on the back of
persistent supply cuts and growing demand from second-tier consumer countries, but the shortfall could quadruple to
70,000 tonnes in 2021. India seems to be potential Lead consuming country as we foresee 10-12% per annum growth in
Lead Acid Battery market between 2012 to 2020.The share of new emerging uses of batteries like Solar, E Bike, E Auto
will be substantial. By 2020 India should surpass Europe and will be the third largest consumer of Lead with expected
demand of over 2.2 million tones. Lead batteries industry in India is currently estimated at Rs. 40,000 Crores with 60%
automotive and 40% industrial. Over thousands of players continued recycling in India through recovery of lead from
telecom, uninterrupted power supply (UPS), invertors, renewable energy and other related industries.
Expected growth in the Indian automotive sector, to boost demand for refined Lead over the coming years. This is due to
auto batteries accounting for about 80.0% of total Lead demand. Expected demand growth to remain resilient due to
strong production, will continue to be a key driver behind Lead demand. Expansion of the product portfolio, in order to
include battery applications in solar, electric vehicle and defence will continue to provide resilient demand for Lead over
the coming years.
Industry facts of Lead Battery Recycling:
One billion vehicles worldwide rely on Lead-based batteries for power
Store renewable energy from wind turbines and solar panels
Document code: FOTL_070220185_3 Copyright © 2016 Firstobject Technologies Ltd. All rights reserved
Infinite number of times, the lead in Lead-based batteries can be recycled
Multiple applications of the Lead recycled from spent batteries. It can be used in new batteries, sporting goods,
radiation protection and more
Lead is unrivalled as a barrier to radiation in hospitals, dentistry and laboratories
37 million Lead-based start-stop batteries will be in micro hybrid cars by 2020.
25 billion kg CO2 equivalent saved by 2020 through vehicles with advanced Lead batteries.
90% of industrial batteries are Lead-based.
90% of household solar energy storage batteries are Lead based.
65% of forklift batteries use Lead-based batteries
100% of hybrid vehicles use Lead-based batteries.
10% fuel savings for start-stop vehicles using Lead batteries.
Document code: FOTL_070220185_3 Copyright © 2016 Firstobject Technologies Ltd. All rights reserved
Disclosure Section
The information and opinions in Firstcall Research was prepared by our analysts and it does not constitute an offer orsolicitation for the purchase or sale of any financial instrument including any companies scrips or this is not an officialconfirmation of any transaction. The information contained herein is from publicly available secondary sources and dataor other secondary sources believed to be reliable but we do not represent that it is accurate or complete and it should notbe relied on as such. Firstcall Research or any of its affiliates shall not be in any way responsible for any loss or damagethat may arise to any person from any inadvertent error in the information contained in this report. Firstcall Research and/or its affiliates and/or employees will not be liable for the recipients’ investment decision based on this document.
Analyst Certification
The following analysts hereby state that their views about the companies and sectors are on best effort basis to the best oftheir knowledge. Unless otherwise stated, the individuals listed on the cover page of this report are research analysts. Theanalyst qualifications, sectors covered and their exposure if any are tabulated hereunder:
Name of the Analyst Qualifications SectorsCovered
Exposure/Interest tocompany/sector UnderCoverage in the CurrentReport
Dr.C.V.S.L. Kameswari M.Sc, PGDCA,M.B.A,Ph.D (Finance)
Pharma &Diversified
No Interest/ Exposure
U. Janaki Rao M.B.A CapitalGoods
No Interest/ Exposure
B. Anil Kumar M.B.A Auto, IT &FMCG
No Interest/ Exposure
M. Vijay M.B.A Diversified No Interest/ ExposureV. Harini Priya M.B.A Diversified No Interest/ ExposureMD. Naveed M.B.A Diversified No Interest/ ExposureA. Bhikshapathi M.B.A Diversified No Interest/ Exposure
Important Disclosures on Subject Companies
In the next 3 months, neither Firstcall Research nor the Entity expects to receive or intends to seek compensation for anyservices from the company under the current analytical research coverage. Within the last 12 months, Firstcall Researchhas not received any compensation for its products and services from the company under the current coverage. Within thelast 12 months, Firstcall Research has not provided or is providing any services to, or has any client relationship with, thecompany under current research coverage.
Within the last 12 months, Firstcall Research has neither provided or is providing any services to and/or in the past has notentered into an agreement to provide services or does not have a client relationship with the company under the researchcoverage.
Certain disclosures listed above are also for compliance with applicable regulations in various jurisdictions. FirstcallResearch does not assign ratings of Buy, Hold or Sell to the stocks we cover. Overweight, Equal-weight, No-Weight andUnderweight are not the equivalent of buy, hold and sell. Investors should carefully read the definitions of all weightsused in Firstcall Research. In addition, since Firstcall Research contains more complete information concerning theanalyst's views, investors should carefully read Firstcall Research, in its entirety, and not infer the contents from theweightages assigned alone. In any case, weightages (or research) should not be used or relied upon as investment advice.
Document code: FOTL_070220185_3 Copyright © 2016 Firstobject Technologies Ltd. All rights reserved
An investor's decision to buy or sell should depend on individual circumstances (such as the investor's own discretion, hisability of understanding the dynamics, existing holdings) and other considerations.
Analyst Stock Weights
Overweight (O): The stock's total return is expected to exceed the average total return of the analyst's industry (orindustry team's) coverage universe, on a risk-adjusted basis, over the next 12-18 months.
Equal-weight (E): The stock's total return is expected to be in line with the average total return of the analyst's industry(or industry team's) coverage universe, on a risk-adjusted basis, over the next 12-18 months.
No-weight (NR): Currently the analyst does not have adequate conviction about the stock's total return relative to theaverage total return of the analyst's industry (or industry team's) coverage universe, on a risk-adjusted basis, over the next12-18 months.
Underweight (U): The stock's total return is expected to be below the average total return of the analyst's industry (orindustry team's) coverage universe, on a risk-adjusted basis, over the next 12-18 months.
Unless otherwise specified, the weights included in Firstcall Research does not indicate any price targets. The statisticalsummaries of Firstcall Research will only indicate the direction of the industry perception of the analyst and theinterpretations of analysts should be seen as statistical summaries of financial data of the companies with perceivedindustry direction in terms of weights.
Firstcall Research may not be distributed to the public media or quoted or used by the public media without the expresswritten consent of Firstcall Research. The reports of Firstcall Research are for Information purposes only and is not to beconstrued as a recommendation or a solicitation to trade in any securities/instruments. Firstcall Research is not abrokerage and does not execute transactions for clients in the securities/instruments.
Firstcall Research - Overall StatementS.No Particulars Remarks1 Comments on general trends in the securities market Full Compliance in Place2 Discussion is broad based and also broad based indices Full Compliance in Place3 Commentaries on economic, political or market conditions Full Compliance in Place4
Periodic reports or other communications not for public appearanceFull Compliance in Place
5 The reports are statistical summaries of financial data of the companies as and whereapplicable
Full Compliance in Place
6 Analysis relating to the sector concerned Full Compliance in Place7 No material is for public appearance Full Compliance in Place8 We are no intermediaries for anyone and neither our entity nor our analysts have any
interests in the reportsFull Compliance in Place
9 Our reports are password protected and contain all the required applicable disclosures Full Compliance in Place
10 Analysts as per the policy of the company are not entitled to take positions either fortrading or long term in the analytical view that they form as a part of their work
Full Compliance in Place
11 No conflict of interest and analysts are expected to maintain strict adherence to thecompany rules and regulations.
Full Compliance in Place
12As a matter of policy no analyst will be allowed to do personal trading or deal andeven if they do so they have to disclose the same to the company and take priorapproval of the company
Full Compliance in Place
Document code: FOTL_070220185_3 Copyright © 2016 Firstobject Technologies Ltd. All rights reserved
13Our entity or any analyst shall not provide any promise or assurance of any favorableoutcome based on their reports on industry, company or sector or group
Full Compliance in Place
14 Researchers maintain arms length/ Chinese wall distance from other employees of theentity
Full Compliance in Place
15No analyst will be allowed to cover or do any research where he has financial interest
Full Compliance in Place
16 Our entity does not do any reports upon receiving any compensation from anycompany
Full Compliance in Place
Firstcall Research Provides
Industry Research on all the Sectors and Equity Research on Major Companiesforming part of Listed and Unlisted Segments
For Further Details Contact:Mobile No: 09959010555
E-mail: [email protected]@firstcallresearch.comwww.firstcallresearch.com


![Ornament ist kein Detail [Ornament is no Detail] (2012)](https://static.fdokumen.com/doc/165x107/6345424d38eecfb33a067963/ornament-ist-kein-detail-ornament-is-no-detail-2012.jpg)


