Effect of Nd3+ substitution on structural, ferroelectric, magnetic ...
Upload
khangminh22Category
view
1download
0
HAL Id: tel-02015830https://tel.archives-ouvertes.fr/tel-02015830
Submitted on 12 Feb 2019
HAL is a multi-disciplinary open accessarchive for the deposit and dissemination of sci-entific research documents, whether they are pub-lished or not. The documents may come fromteaching and research institutions in France orabroad, or from public or private research centers.
L’archive ouverte pluridisciplinaire HAL, estdestinée au dépôt et à la diffusion de documentsscientifiques de niveau recherche, publiés ou non,émanant des établissements d’enseignement et derecherche français ou étrangers, des laboratoirespublics ou privés.
Photo-response of ferroelectric oxidesHalyna Volkova
To cite this version:Halyna Volkova. Photo-response of ferroelectric oxides. Other. Université Paris Saclay (COmUE),2018. English. �NNT : 2018SACLC094�. �tel-02015830�


Acknowledgements
I want to thank very much the members of the jury committee Doru Lu-pascu, Maël Guennou, Florence Porcher, et Nicolas Chauvin who agreed tocome to my defence and spent time reading and correcting this manuscript, aswell as for their inspiring questions which might help in the future developmentof this work.
I feel grateful to my thesis supervisors Brahim Dkhil and Ingrid Canero-Infante, who made me discover multiple topics and methods, and to move myscientific interests to the field of ferroelectrics, by helping me in discussionsand giving me the possibility to go to multiple conferences and workshops tomeet new people and learn new things. I am especially happy that I couldspend two short-time visits of other laboratories, in Lyon and Barcelona, forphotoluminescence and photovoltaic measurements, and I am happy that mywork seems to be the beginning of several collaborative projects.
I want to thank a lot to Nicolas Chauvin from INL, Lyon for all the helpwith equipment and fruitful discussions, and the team of ICMAB, Barcelona(Ignasi Fina and Florencio Sanchez for project supervision, and Mateusz Scigajfor showing me the experimental details). Also I am grateful for collaborationto Jerome Guillot, Damien Lenoble from Luxembourg and Gregory Genestefrom CEA, and to Carlos Frontera from ICMAB, Spain and Florence Porcherfrom LLB.
I thank very much to my official thesis supervisor, Pierre-Eymeric Janolin,for helping me in solving the administrative questions and except everythingfor his kind words which inspired me a lot in writing process.
Great thanks to all the members of SPMS laboratory, and especially to Pas-cale Gemeiner, Fabienne Karolak, Pavan Noukala, Christine Bogicevic, CharlesPaillard, Xavier Bril, and Nicolas Guiblin for introducing me to measurementsand performing a part of them. I am grateful to Christine Vinée-Jacquin, Pas-cale Salvini, and SPMS director Guilhem Dezanneau for nice advices, for theirkind attitude to me and for being always ready to help. Finally, I thank a lotto everybody from my home laboratory SPMS for help and for creating thenice atmosphere to be here during all the time of my thesis, and for the nicemoments I had in the laboratory, for instance learning plenty of new Frenchexpressions (I owe you actually starting actively speaking French!). Thanksfor nice time together to Charles, Arij, Vitoria, Chen Yi, Henri, Pavan, Leo,
1
2
Rossen, who were in SPMS at the same time as me. Also thanks to everybodyin ICMAB, Spain and INL Lyon, France for nice time I spent there.

Contents
Annex 1
Contents i
1 Introduction 11.1 Motivation: photovoltaics and ferroelectric perovskite oxides . . 11.2 Crystallographic studies of Ba(Sn,Ti)O3 phase diagram . . . . . 4
1.2.1 BaTiO3 . . . . . . . . . . . . . . . . . . . . . . . . . . . 41.2.2 BaSnO3 . . . . . . . . . . . . . . . . . . . . . . . . . . . 61.2.3 Ba(Sn,Ti)O3 . . . . . . . . . . . . . . . . . . . . . . . . 6
1.3 Visualizing chemical homogeneity on atomic level . . . . . . . . 81.4 Dipole ordering and dielectric spectroscopy . . . . . . . . . . . 91.5 Macroscopic polarization . . . . . . . . . . . . . . . . . . . . . . 13
2 New phase diagram (structure and dielectric/ferroelectricproperties) 152.1 Methods of characterization used in this chapter . . . . . . . . 15
2.1.1 Details of XRD measurement in this study . . . . . . . 162.1.2 Dielectric spectroscopy measurement . . . . . . . . . . . 17
2.2 Results . . . . . . . . . . . . . . . . . . . . . . . . . . . . . . . . 172.2.1 Microstructure from scanning electron microscopy . . . 172.2.2 Room temperature structure of compositional series . . 172.2.3 Dielectric spectroscopy . . . . . . . . . . . . . . . . . . . 202.2.4 Transmission electron microscopy . . . . . . . . . . . . . 272.2.5 Temperature dependent laboratory X-ray diffraction stud-
ies . . . . . . . . . . . . . . . . . . . . . . . . . . . . . . 29
3 Optical properties 373.1 Optical Properties: Introduction . . . . . . . . . . . . . . . . . 373.2 Band gap . . . . . . . . . . . . . . . . . . . . . . . . . . . . . . 38
3.2.1 Methodology: Diffuse reflectance theory, Kubelka Munkapproximation and Urbach tail . . . . . . . . . . . . . . 38
3.2.2 Results of UV-Visible-NIR spectroscopy . . . . . . . . . 393.3 Chemical disorder-driven absorption edge . . . . . . . . . . . . 42
i

ii CONTENTS
3.3.1 Types of disorder . . . . . . . . . . . . . . . . . . . . . . 423.3.2 Urbach tail width in Ba(Sn,Ti)O3 at 293 K . . . . . . . 46
3.4 Temperature evolution of band gap and disorder-related absorp-tion tail . . . . . . . . . . . . . . . . . . . . . . . . . . . . . . . 483.4.1 BaTiO3 . . . . . . . . . . . . . . . . . . . . . . . . . . . 48
3.4.1.1 Sample 1 . . . . . . . . . . . . . . . . . . . . . 493.4.1.2 Sample 2 . . . . . . . . . . . . . . . . . . . . . 51
3.4.2 BaSn0.1Ti0.9O3 . . . . . . . . . . . . . . . . . . . . . . . 513.4.3 BaSn0.2Ti0.8O3 . . . . . . . . . . . . . . . . . . . . . . . 533.4.4 BaSn0.5Ti0.5O3 . . . . . . . . . . . . . . . . . . . . . . . 543.4.5 BaSnO3 . . . . . . . . . . . . . . . . . . . . . . . . . . . 55
4 Chemical bonding at the atomic level 594.1 Methods and review . . . . . . . . . . . . . . . . . . . . . . . . 59
4.1.1 Raman spectroscopy . . . . . . . . . . . . . . . . . . . . 594.1.1.1 Introduction . . . . . . . . . . . . . . . . . . . 594.1.1.2 BaTiO3 . . . . . . . . . . . . . . . . . . . . . . 614.1.1.3 BaSnO3 . . . . . . . . . . . . . . . . . . . . . . 634.1.1.4 Solid solutions . . . . . . . . . . . . . . . . . . 644.1.1.5 Experimental details . . . . . . . . . . . . . . . 65
4.1.2 X-ray photoelectron spectroscopy . . . . . . . . . . . . . 664.1.2.1 Measurement details and framework of analysis 66
4.1.3 Connection between XPS, phonons, and the band gap . 684.2 Results . . . . . . . . . . . . . . . . . . . . . . . . . . . . . . . . 71
4.2.1 Raman spectroscopy . . . . . . . . . . . . . . . . . . . . 714.2.1.1 BaSnxTi1−xO3 at 293 K . . . . . . . . . . . . . 714.2.1.2 Connection between phonons and optical prop-
erties in BaTiO3 . . . . . . . . . . . . . . . . 744.2.1.3 Connection between phonons and optical prop-
erties in x(Sn)=0.2 . . . . . . . . . . . . . . . . 764.2.2 X-ray photoelectron spectroscopy . . . . . . . . . . . . . 79
5 Conclusions 89
Bibliography 93
Annex 105Annex A: UV-visible spectroscopy . . . . . . . . . . . . . . . . . . . 105Annex B: Raman spectra recorded in temperature . . . . . . . . . . 106Annex C: XPS full energy range spectra . . . . . . . . . . . . . . . . 107Annex D: Le Bail profile fit of XRD data . . . . . . . . . . . . . . . 107
Résumé complet de thèse 111


1.1. MOTIVATION: PHOTOVOLTAICS AND FERROELECTRICPEROVSKITE OXIDES 3
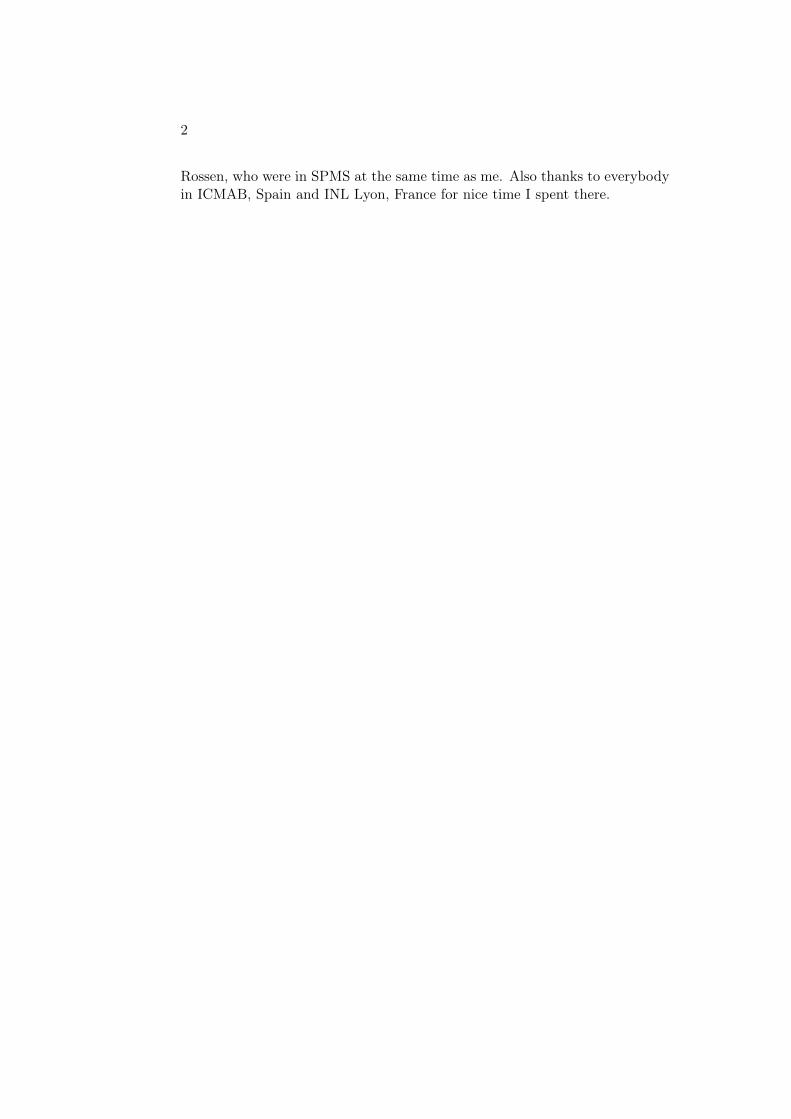
Figure 1.3: The efficiency chart of commercially patented solar cell tech-nologies. Credits to NREL (https://www.nrel.gov/pv/national-center-for-photovoltaics.html)
neglected. Thus, the band gap is mostly determined by the qualities of thebond B-O. Based on this, it is interesting to substitute the B-site cation.
Unlike some transparent oxide double compounds (HfO2 - ZrO2) [12],band gap value of perovskite solid solutions often evolves strongly non-linearly.There are multiple examples of such B-site substitution. First approach is tochoose the transition metal atom so that it’s electronic levels will be situatedinside the band gap of the parent compound. The examples are Sr(Cr,Ti)O3−δ
[13] where Cr−T i t2g orbitals are situated just above the valence band maxi-mum, or Ba(Pd,Ce,Ti)O3−δ, where the orbitals of Pd lie both above the VBMand below CBM which is formed by Ce [14, 15], or (K,Ba)(Ni,Nb)O3−δ, wherethe band gap was reduced from 4 eV to <1.5 eV. Calculations show that sig-nificant reduction in the band gap happens due to the formation of complexesfrom oxygen vacancy V ··
O and adjacent Ni′′′
Nb defects. Despite being efficient inband gap reduction, defects act as trapping and recombination centers for thephotoconduction electrons, and the final photovoltaic efficiency is low (around3%). In further works by Rappe, he calculated that charge redistributionin layered compounds with certain ordering of atoms, like Bi(Zn0.5Ti0.5)O3
[16, 17, 18] must lower the band gap without creating defects, but the syn-thesis of this material in pure shape is complicated, and the solid solution0.88 · BaTiO3 - 0.12 · Bi(Zn0.5Ti0.5)O3 does not show the band gap decreasefor some reason [19].
The layered compounds like thin film multilayers, or Aurivillius phase ma-terials, or Ruddlesden-Popper phases are actively studied [20, 18]. From all

4 CHAPTER 1. INTRODUCTION
the works with an accent on atomic ordering, the most successful was onBi2FeCrO6 thin films [21]. There are regions of ordered superstructure insidethe disordered matrix, former ones showing the decrease of band gap from 2.7eV to 1.5 eV (by 1.2 eV), and the latter one – only by 0.5 eV. Superstruc-ture leads to certain Jahn-Teller distortions, under which the valence of atomschanges from (Fe3+, Cr 3+) towards (Fe2+, Cr4+). Calculations explained thedrastic decrease of the band gap by effect of stress in thin films which causesthe reordering of orbital directions [22]. By making a trial multilayer solar cellfrom Bi2FeCrO6 layers with different properties of ordered regions, 8% effi-ciency is reached, which is the highest ever made with inorganic ferroelectricand is a very promising result.
In our work, we study pure perovskite compounds Ba2+Ti4+O2−3 ,
Ba2+Sn4+O2−3 and their solid solutions.
1.2 Crystallographic studies of Ba(Sn,Ti)O3 phasediagram
1.2.1 BaTiO3
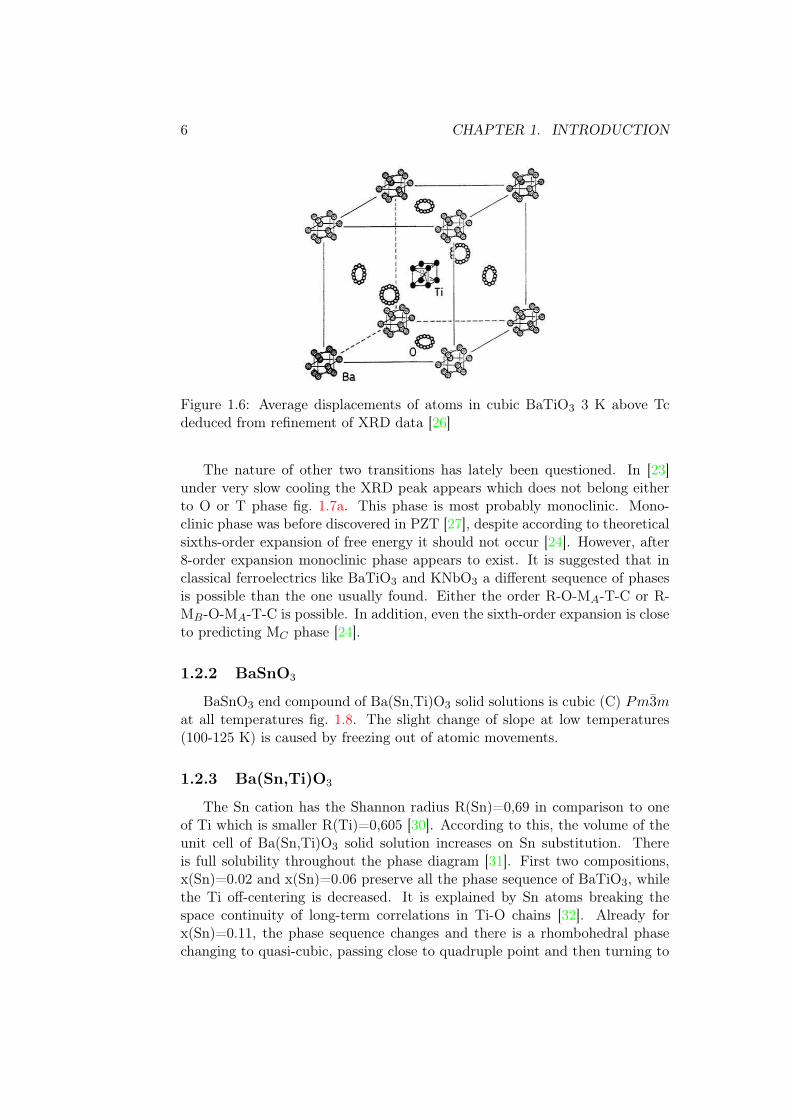
Barium titanate, BaTiO3, is a perovskite ferroelectric. Perovskites is theclass of chemical compounds which have the general formula ABO3 fig. 1.4.In the cubic unit cell the A-site atoms are located in the edges of a cube,the B atoms are in the center, and the O atoms are on the face centers andform the octahedron around the B-site atom. In BaTiO3 the cubic phase is inequilibrium at high temperatures (above the Curie temperature Tc). The fullphase sequence from high to low temperature is cubic (C) Pm3̄m, tetragonal(T) P4mm, orthorhombic (O) Amm2, rhombohedral (R) R3m as shown in thetop panel of fig. 1.5 [23]. In T, O and R phases the Ti atom is displaced fromthe center of unit cell towards the crystallographic directions <001>, <110>,and <111> [24]. On cooling, the unit cell parameters a and c decrease stepwiseduring phase transitions. There is a phase transition hysteresis at the differenttemperatures at each phase transition: during cooling the phase transitionstarts at lower temperatures in comparison to heating. This is characteristicto first order phase transitions, like those of BaTiO3. As the displacement ofcentral Ti ion changes, the polarization varies in the way shown in the secondpanel of fig. 1.5. Relative permittivity also peaks at phase transitions.
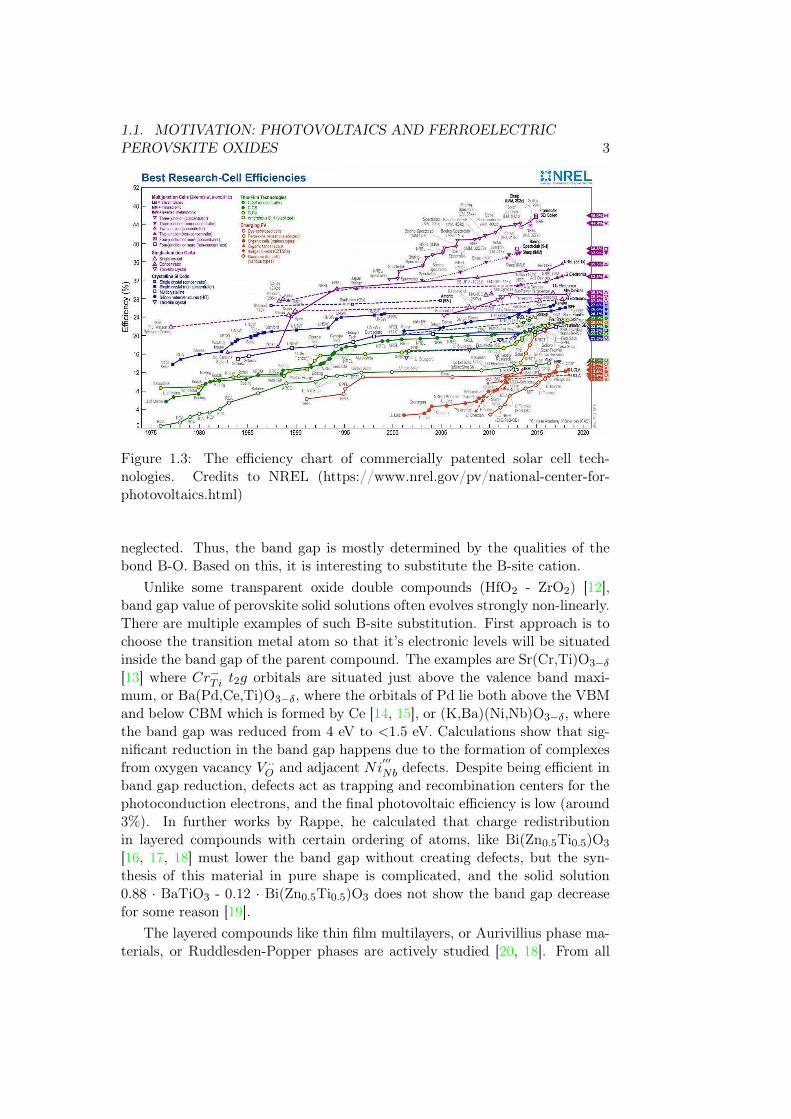
The nature of the T-C phase transition is a lot discussed in the literature.Originally, it is possible to picture it as a displacive phase transition controlledby certain phonon soft mode whose frequency tends to zero at the phase tran-sition (basically, phase transition happens in one step). However it was shownby Raman spectroscopy that the soft mode does not reach zero frequency. Itturns out that there is a significant order-disorder component (different unitcells are non-equivalent). It was shown by Itoh and coworkers [26] fig. 1.6, at

6 CHAPTER 1. INTRODUCTION
Figure 1.6: Average displacements of atoms in cubic BaTiO3 3 K above Tcdeduced from refinement of XRD data [26]
The nature of other two transitions has lately been questioned. In [23]under very slow cooling the XRD peak appears which does not belong eitherto O or T phase fig. 1.7a. This phase is most probably monoclinic. Mono-clinic phase was before discovered in PZT [27], despite according to theoreticalsixths-order expansion of free energy it should not occur [24]. However, after8-order expansion monoclinic phase appears to exist. It is suggested that inclassical ferroelectrics like BaTiO3 and KNbO3 a different sequence of phasesis possible than the one usually found. Either the order R-O-MA-T-C or R-MB-O-MA-T-C is possible. In addition, even the sixth-order expansion is closeto predicting MC phase [24].
1.2.2 BaSnO3
BaSnO3 end compound of Ba(Sn,Ti)O3 solid solutions is cubic (C) Pm3̄mat all temperatures fig. 1.8. The slight change of slope at low temperatures(100-125 K) is caused by freezing out of atomic movements.
1.2.3 Ba(Sn,Ti)O3
The Sn cation has the Shannon radius R(Sn)=0,69 in comparison to oneof Ti which is smaller R(Ti)=0,605 [30]. According to this, the volume of theunit cell of Ba(Sn,Ti)O3 solid solution increases on Sn substitution. Thereis full solubility throughout the phase diagram [31]. First two compositions,x(Sn)=0.02 and x(Sn)=0.06 preserve all the phase sequence of BaTiO3, whilethe Ti off-centering is decreased. It is explained by Sn atoms breaking thespace continuity of long-term correlations in Ti-O chains [32]. Already forx(Sn)=0.11, the phase sequence changes and there is a rhombohedral phasechanging to quasi-cubic, passing close to quadruple point and then turning to

1.2. CRYSTALLOGRAPHIC STUDIES OF BA(SN,TI)O3 PHASEDIAGRAM 7
(a) (b)
Figure 1.7: Possible intermediate monoclinic phase formation at O-T phasetransformation: (a) XRD diagram of BaTiO3 single crystal at cooling throughT-O phase transition (293-273 K, -0.05 K/min) [23] (b) possible directions ofpolarization inside the BaTiO3 unit cell [28]
Figure 1.8: Temperature dependence of the unit cell parameter of BaSnO3 [29]
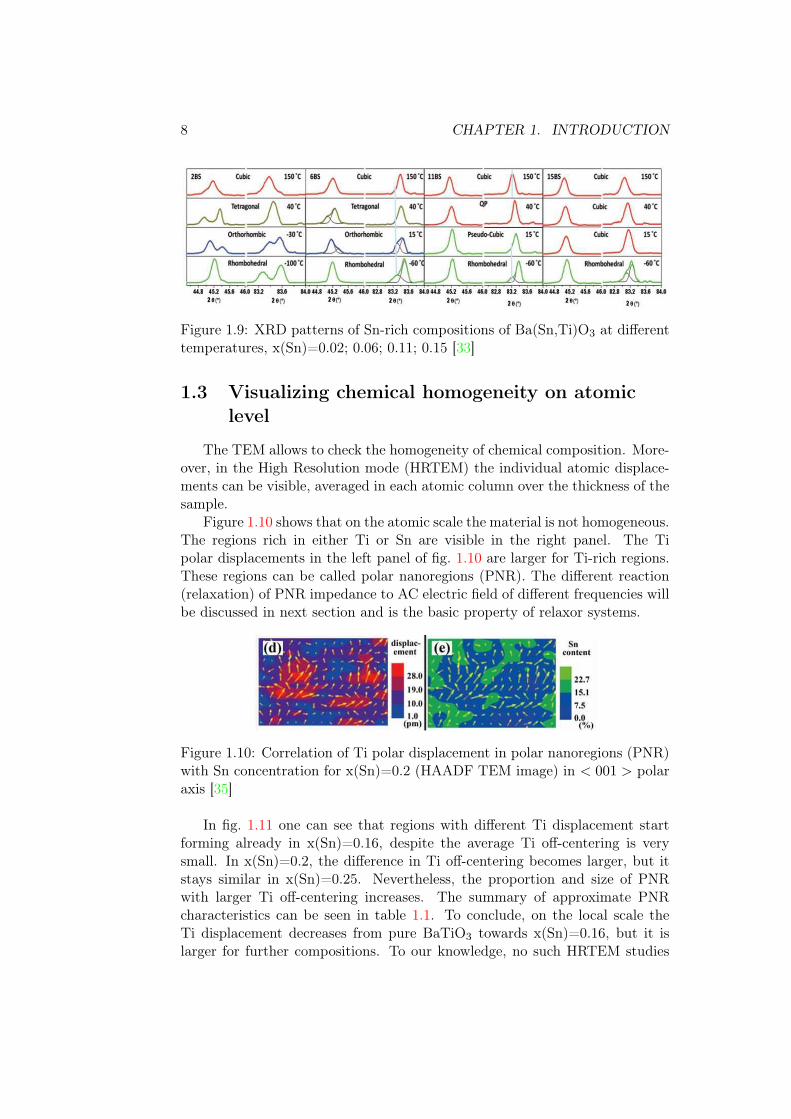
cubic at much lower temperatures in comparison to BaTiO3 [33]. The distor-tions in the quasi-cubic phase are very low and it is difficult to determine theirtrue nature as the XRD was performed on laboratory diffractometer wherethe resolution is not sufficient. Because of this, the refinements of laboratoryXRD data with tetragonal or cubic symmetry also give satisfactory agreementfactors [34]. As the Sn ratio increases further x(Sn)>0.11, the temperature oftransition between the rhombohedral phase and cubic one decreases fig. 1.9[33].
8 CHAPTER 1. INTRODUCTION
Figure 1.9: XRD patterns of Sn-rich compositions of Ba(Sn,Ti)O3 at differenttemperatures, x(Sn)=0.02; 0.06; 0.11; 0.15 [33]
1.3 Visualizing chemical homogeneity on atomiclevel
The TEM allows to check the homogeneity of chemical composition. More-over, in the High Resolution mode (HRTEM) the individual atomic displace-ments can be visible, averaged in each atomic column over the thickness of thesample.
Figure 1.10 shows that on the atomic scale the material is not homogeneous.The regions rich in either Ti or Sn are visible in the right panel. The Tipolar displacements in the left panel of fig. 1.10 are larger for Ti-rich regions.These regions can be called polar nanoregions (PNR). The different reaction(relaxation) of PNR impedance to AC electric field of different frequencies willbe discussed in next section and is the basic property of relaxor systems.
Figure 1.10: Correlation of Ti polar displacement in polar nanoregions (PNR)with Sn concentration for x(Sn)=0.2 (HAADF TEM image) in < 001 > polaraxis [35]
In fig. 1.11 one can see that regions with different Ti displacement startforming already in x(Sn)=0.16, despite the average Ti off-centering is verysmall. In x(Sn)=0.2, the difference in Ti off-centering becomes larger, but itstays similar in x(Sn)=0.25. Nevertheless, the proportion and size of PNRwith larger Ti off-centering increases. The summary of approximate PNRcharacteristics can be seen in table 1.1. To conclude, on the local scale theTi displacement decreases from pure BaTiO3 towards x(Sn)=0.16, but it islarger for further compositions. To our knowledge, no such HRTEM studies

1.4. DIPOLE ORDERING AND DIELECTRIC SPECTROSCOPY 9
have been performed for x(Sn) > 0.25, for Sn-rich compositions which showwell-marked relaxor behaviour.
Figure 1.11: Ti displacement in compositional serie x(Sn) = 0.16; 0.2; 0.25(HRTEM image) in <120> polar axis [36]
Table 1.1: Ti displacement in PNR and the average size of displaced regions
x(Sn) average Ti displacement, pm PNR average size, Å
0.16 [36] 0 - 5 40-600.2 [35] 10-28 160.2 [37] 8-22 16-240.2 [36] 10-20 20-300.25 [36] 10-20 30-40
The PNR size and shape can be analysed from the diffuse electron scat-tering around the diffraction points in TEM. The advantage of diffractionover imaging is that in the latter it is difficult to get the 3D information.The detailed analysis from [38] shows that the diffuse scattering in the seriesx(Sn)=0.10, 0.20, 0.225, 0.25, 0.30 and 0.50 comes from chains of polarizedunit cells in < 001 > direction, with the characteristic length of chains at least5 nm for all these compositions. With increase in Sn ratio the diffuse compo-nent becomes weaker, which is consistent with a decrease in the number of Tioff-centered atoms as well as reduction of dielectric constant.
Other work [37] suggests that the diffuse scattering is coming from verythin (< 1 nm) elliptic zones with long axis (∼ 2nm) parallel to the < 001 >direction.
1.4 Dipole ordering and dielectric spectroscopy
To study the transitions between different dipole orderings, dielectric spec-troscopy is used. The dielectric constant ε(ω) = ε′(ω) + iε”(ω) peaks at everyphase transition for a ferroelectric ( 1/ε tends to zero at the phase transition).In BaTiO3, the phase transitions are (at least partially) driven by a phonontransverse soft mode, and this causes the ε to peak:

10 CHAPTER 1. INTRODUCTION
Figure 1.12: Relative permittivity of BaSnxTi1−xO3 with x(Sn) = 0.02; 0.06;0.11; 0.15 [33]
ω2L
ω2T
=εstε∞
(1.1)
with ωL and ωT - longitudinal and transversal phonon mode frequency, εstand ε∞ - dielectric permittivity at electric field frequency f=0 and at opticalfrequencies.
To our knowledge, only the Ti corner of the phase diagram was studied indielectric spectroscopy. In fig. 1.12, one can see the ε shown for a composi-tional series BaSnxTi1−xO3. The plot for x(Sn)=0.02 has the peaks which areinherent to BaTiO3. On further increase of Sn ratio, the transition tempera-tures T1, T2 and T3 = Tm (temperature of peak maximum) get closer to eachother, so that for x(Sn) = 0.11 there is only one peak with the temperature ofmaximum Tm. For x(Sn) > 0.11 the Tm is decreasing. In this compositionalrange the dielectric permittivity value peaks for x(Sn)=0.11. As can be seenfrom fig. 1.13, this is the composition close to the so-called quadruple pointwhere four different kinds of unit cell distortion are allowed to coexist. The factthat Ti can be easily displaced to multiple directions also causes the anomalyof the piezo-electric [33, 28] and electrocaloric [39, 40, 40, 41] properties, andthe mechanical compliance to happen at this temperature. [42].
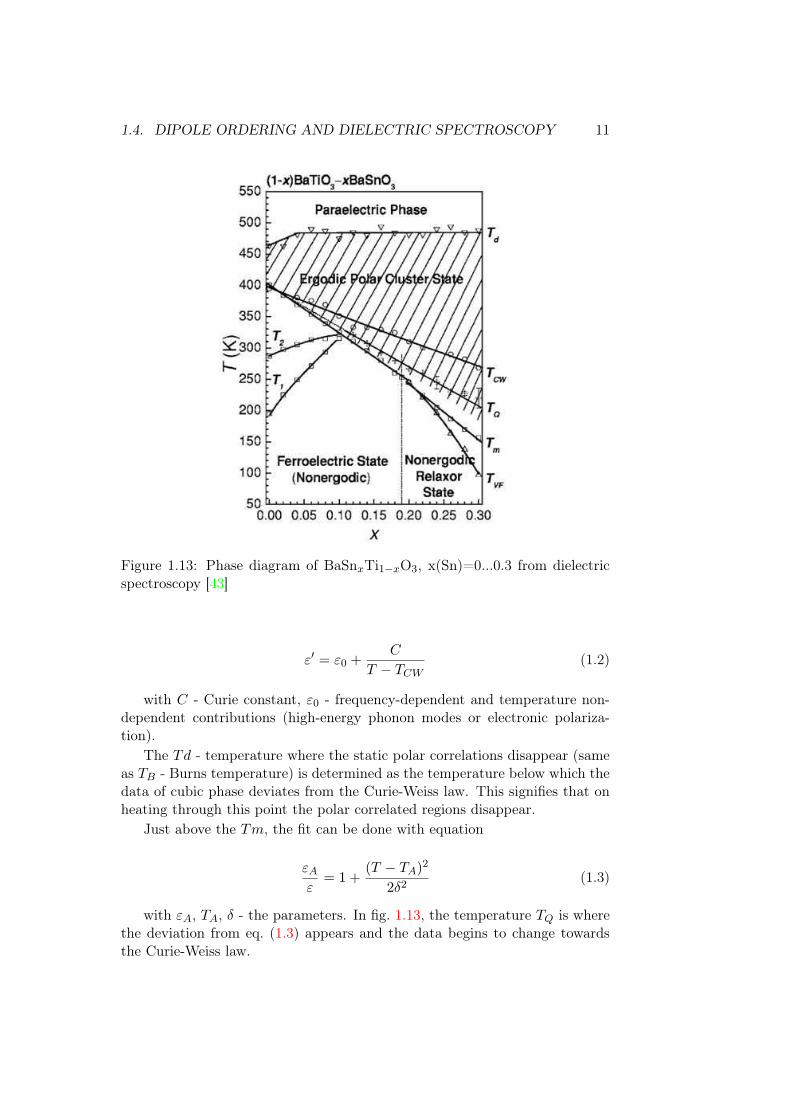
As shown in fig. 1.13, BaTiO3 the Tm equals the Curie temperature TCW ,but for compositions x(Sn)>0.1 dielectric permittivity peaks become wider ascharacteristic of diffuse phase transition. For diffuse phase transition 1/ε doesnot tend to zero, so more characteristic temperatures are needed to describethe phase transition. Those parameters are Tm - dielectric peak maximum,TCW - the Curie-Weiss temperature, and TQ. The TCW is determined from fitof data to equation
1.4. DIPOLE ORDERING AND DIELECTRIC SPECTROSCOPY 11
Figure 1.13: Phase diagram of BaSnxTi1−xO3, x(Sn)=0...0.3 from dielectricspectroscopy [43]
ε′ = ε0 +C
T − TCW(1.2)
with C - Curie constant, ε0 - frequency-dependent and temperature non-dependent contributions (high-energy phonon modes or electronic polariza-tion).
The Td - temperature where the static polar correlations disappear (sameas TB - Burns temperature) is determined as the temperature below which thedata of cubic phase deviates from the Curie-Weiss law. This signifies that onheating through this point the polar correlated regions disappear.
Just above the Tm, the fit can be done with equation
εAε
= 1 +(T − TA)
2
2δ2(1.3)
with εA, TA, δ - the parameters. In fig. 1.13, the temperature TQ is wherethe deviation from eq. (1.3) appears and the data begins to change towardsthe Curie-Weiss law.

12 CHAPTER 1. INTRODUCTION
The low-temperature phase is rhombohedral ferroelectric for low Sn ratio,and changes to polar glass frozen relaxor state for higher Sn ratio. The freezingtemperature TV F is determined from the fit by the Vogel-Fulcher law:
f = f0 · e
−Ea
k(Tm − TV F ) (1.4)
with f0 - the characteristic frequency of PNR dielectric relaxation, and Ea
- the activation energy.Whether the ferroelectric low-temperature phase changes to the relaxor
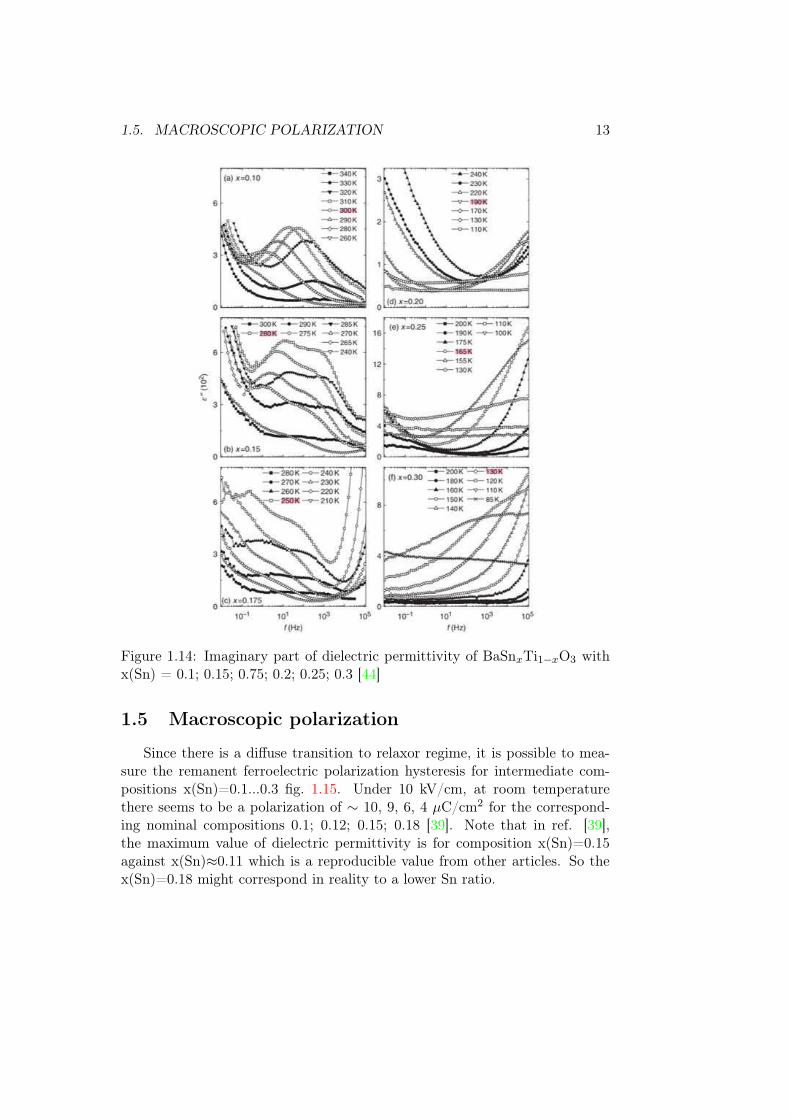
one abruptly in the compositional series was discussed in several references.Authors of ref. [43] found a sharp transition at x(Sn)=0.2 from the analysisof ε′ asymmetric peak widths. However, ref. [44] claims that the transitionis continuous. Figure 1.14 shows the dependence of an imaginary part ofdielectric permittivity ε” on frequency. It shows how the energy of appliedelectric field is absorbed by the sample (dielectric loss), and is used to analyseprocesses of dielectric relaxation. For compositions x(Sn)=0.15 and 0.175 thereare two relaxation processes, attributed to breathing modes of pinned domainwalls and PNRs. In the latter composition, there is at the same time the high-frequency relaxation (108-109), which is usually attributed to reorientation ofPNR [44]. This work claims that the gradual transition towards the classicalrelaxor regime occurs for x(Sn) = 0.175...0.25, since the dynamics freezing(disappearance of high-frequency peak) occurs much below the characteristictemperature of the diffuse phase transition determined from data fit [44]. Thefirst sample showing truly relaxor behaviour is x(Sn)=0.3.
1.5. MACROSCOPIC POLARIZATION 13
Figure 1.14: Imaginary part of dielectric permittivity of BaSnxTi1−xO3 withx(Sn) = 0.1; 0.15; 0.75; 0.2; 0.25; 0.3 [44]
1.5 Macroscopic polarization
Since there is a diffuse transition to relaxor regime, it is possible to mea-sure the remanent ferroelectric polarization hysteresis for intermediate com-positions x(Sn)=0.1...0.3 fig. 1.15. Under 10 kV/cm, at room temperaturethere seems to be a polarization of ∼ 10, 9, 6, 4 µC/cm2 for the correspond-ing nominal compositions 0.1; 0.12; 0.15; 0.18 [39]. Note that in ref. [39],the maximum value of dielectric permittivity is for composition x(Sn)=0.15against x(Sn)≈0.11 which is a reproducible value from other articles. So thex(Sn)=0.18 might correspond in reality to a lower Sn ratio.

14 CHAPTER 1. INTRODUCTION
Figure 1.15: Polarization dependence on temperature and (insets) P-E hys-teresis loops at different temperatures, x(Sn) = (a) 0.1 (b) 0.12 (c) 0.15 (d)0.18 [39]

Chapter 2
New phase diagram (structureand dielectric/ferroelectricproperties)
In this chapter we will describe the phase transitions of our samples de-pending on chemical composition and on temperature and compare the solidsolutions to the pure compounds BaTiO3 and BaSnO3. The following sec-tions will describe the fabrication of our samples and the study of average unitcell and ferroelectricity by X-ray diffraction, transmission electron microscopy,dielectric spectroscopy, and polarization measurement.
2.1 Methods of characterization used in thischapter
Solid state reaction synthesis implies mixing the initial chemical compo-nents in the shape of solid powders, and heating to high temperatures forchemical reaction to occur. In our case, to obtain BaSnxTi1−xO3 solid solu-tions, we prepared the mixture according to chemical reaction:
BaCO3 + (1− x)T iO2 + xSnO2 = BaSnxT i1−xO3 + CO2(gas) (2.1)
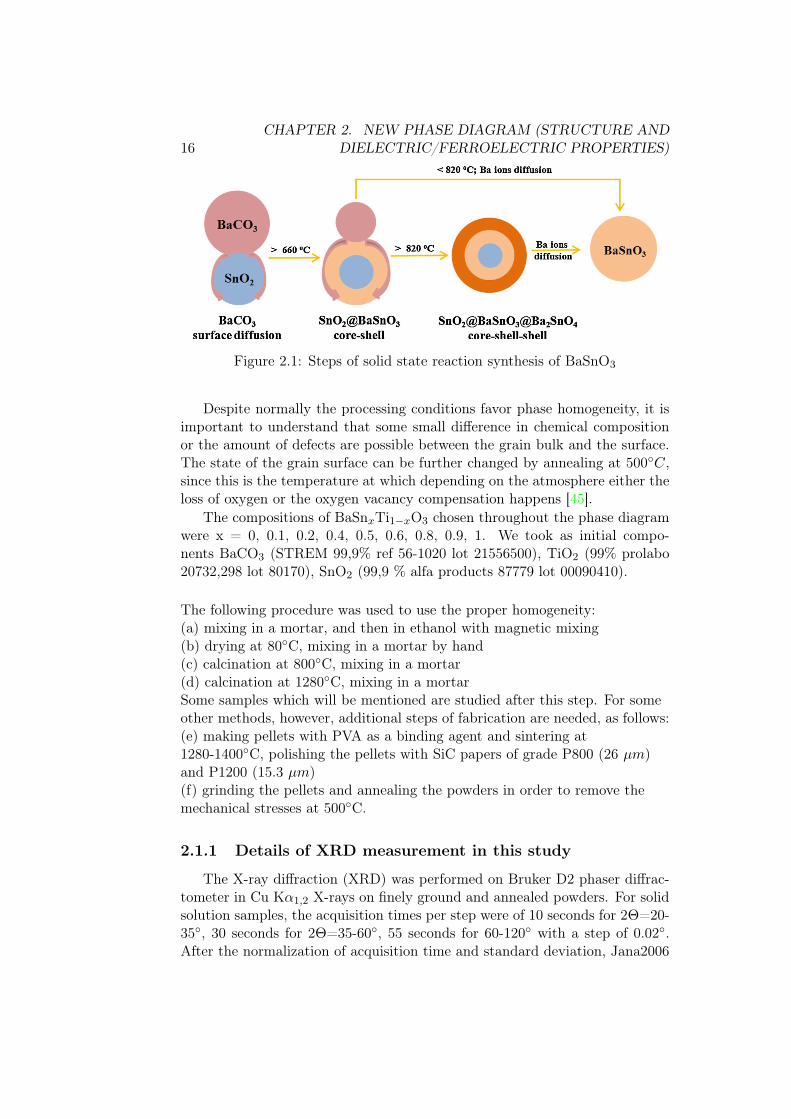
The speed of solid state reaction and the homogenisation of products dur-ing solid state reaction are limited by the size of the powder particles andtemperature. In fact, it was shown that there are several intermediate steps tothe process as shown in fig. 2.1 for pure BaSnO3. First, BaSnO3 crust formson SnO2. On second step, the process is diffusion-guided, since the Sn and Oatoms should be passing through the BaSnO3 layer which is formed already,and so the Sn deficient phase might be forming on top of the grain. Finally, af-ter sufficient homogenisation at high temperatures and during sufficient time,a BaSnO3 particle is formed.
15
16CHAPTER 2. NEW PHASE DIAGRAM (STRUCTURE AND
DIELECTRIC/FERROELECTRIC PROPERTIES)
Figure 2.1: Steps of solid state reaction synthesis of BaSnO3
Despite normally the processing conditions favor phase homogeneity, it isimportant to understand that some small difference in chemical compositionor the amount of defects are possible between the grain bulk and the surface.The state of the grain surface can be further changed by annealing at 500◦C,since this is the temperature at which depending on the atmosphere either theloss of oxygen or the oxygen vacancy compensation happens [45].
The compositions of BaSnxTi1−xO3 chosen throughout the phase diagramwere x = 0, 0.1, 0.2, 0.4, 0.5, 0.6, 0.8, 0.9, 1. We took as initial compo-nents BaCO3 (STREM 99,9% ref 56-1020 lot 21556500), TiO2 (99% prolabo20732,298 lot 80170), SnO2 (99,9 % alfa products 87779 lot 00090410).
The following procedure was used to use the proper homogeneity:(a) mixing in a mortar, and then in ethanol with magnetic mixing(b) drying at 80◦C, mixing in a mortar by hand(c) calcination at 800◦C, mixing in a mortar(d) calcination at 1280◦C, mixing in a mortarSome samples which will be mentioned are studied after this step. For someother methods, however, additional steps of fabrication are needed, as follows:(e) making pellets with PVA as a binding agent and sintering at1280-1400◦C, polishing the pellets with SiC papers of grade P800 (26 µm)and P1200 (15.3 µm)(f) grinding the pellets and annealing the powders in order to remove themechanical stresses at 500◦C.
2.1.1 Details of XRD measurement in this study
The X-ray diffraction (XRD) was performed on Bruker D2 phaser diffrac-tometer in Cu Kα1,2 X-rays on finely ground and annealed powders. For solidsolution samples, the acquisition times per step were of 10 seconds for 2Θ=20-35◦, 30 seconds for 2Θ=35-60◦, 55 seconds for 60-120◦ with a step of 0.02◦.After the normalization of acquisition time and standard deviation, Jana2006

2.2. RESULTS 17
software for Rietveld refinement was used to obtain the composition and latticeparameters.
2.1.2 Dielectric spectroscopy measurement
The measurement was made on two kinds of ceramic pellets, sintered with-out any binding agent and with PVA. The silver paste contacts were depositedon the former ones, and the Cr/Au sputtering was performed on the second se-ries. Note that for Sn-rich compositions around x(Sn)=0.8-1 the dark-coloredlayer of Cr-containing solid solution was formed at the contact interface withthe sample, which agrees with Cr solubility in the perovskite structure, includ-ing the Sn-containing ones [46]. Therefore, x(Sn)=0.8 with golden contacts wasnot measured. The measurement was performed in the cryofurnace in the tem-perature range 78-450 K, the temperature controlled with the help of PT100probe. The impedancemeter HP4294 was used.
2.2 Results
2.2.1 Microstructure from scanning electron microscopy
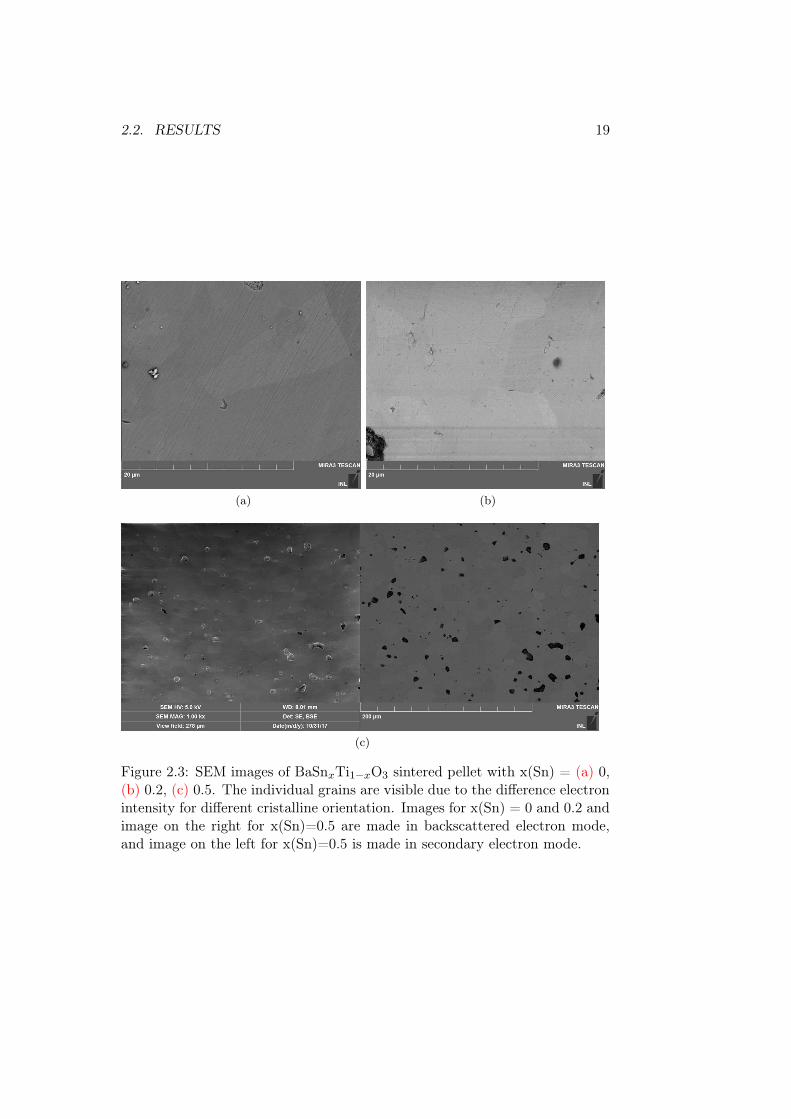
Scanning electron microscopy was performed on the powders after chemicalsynthesis fig. 2.2 and on the pellets sintered with PVA binding agent fig. 2.3using the microscope model Leo Gemini 1530 with field emission gun andin high resolution mode. The grains have faceted shape and even show thegrowth spirals fig. 2.2d, which in general shows that they are well crystalline.The grain size varies within one composition, but on average the value is1-2 µm throughout the compositional series. The larger grains occur rarelywith longer dimension reaching about 10 µm fig. 2.2c.
When sintered with PVA, high densities ρpellet are reached (92-95 %) asdetermined from weighting it in water and in air:
ρpellet =mairρwater
mair −mwater(2.2)
Correspondingly, during the sintering process the grain size increases to5-10 µm in x(Sn)=0 and 0.2, and to 20 µm for x(Sn)=0.5.
2.2.2 Room temperature structure of compositional series
The X-ray diffraction in fig. 2.4 shows characteristic patterns of pure per-ovskite compounds. No parasitic peaks are found with the laboratory source.The intensity of the peaks evolves gradually throughout all compositions. TheXRD peak at 45.5 ◦ (fig. 2.5a) consists of two components for BaTiO3 in P4mmspace group, (200) and (002). For x(Sn)=0.1, the two components merge intoone, but the shape of the peak is very wide hinting that the distortion is stillpresent. For the rest of the compositions, the peak is quasicubic. Spectra were

18CHAPTER 2. NEW PHASE DIAGRAM (STRUCTURE AND
DIELECTRIC/FERROELECTRIC PROPERTIES)
(a) (b)
(c) (d)
(e)
Figure 2.2: SEM (secondary electrons mode) images of BaSnxTi1−xO3 powdercoming from grinding the pellets of x(Sn) = (a) 0, (b) 0.2, (c) 0.5, (d) 0.8, (e)1
2.2. RESULTS 19
(a) (b)
(c)
Figure 2.3: SEM images of BaSnxTi1−xO3 sintered pellet with x(Sn) = (a) 0,(b) 0.2, (c) 0.5. The individual grains are visible due to the difference electronintensity for different cristalline orientation. Images for x(Sn) = 0 and 0.2 andimage on the right for x(Sn)=0.5 are made in backscattered electron mode,and image on the left for x(Sn)=0.5 is made in secondary electron mode.

20CHAPTER 2. NEW PHASE DIAGRAM (STRUCTURE AND
DIELECTRIC/FERROELECTRIC PROPERTIES)
analysed by LeBail fit to determine the unit cell volume (fig. 2.5b). The detailsof the fit can be found in Annex D in fig. D1 - fig. D2 and in table D1. Thevalue increases linearly as expected due to the larger size of the Sn ion.
40 60 80 100 120
XR
D i
nte
nsi
ty, a.
u.
2Θ,°
x(Sn) :
1
0.9
0.8
0.6
0.5
0.4
0.2
0.1
0
Figure 2.4: XRD patterns for different compositions of BaSnxTi1−xO3:x(Sn)=0...1 (bottom towards top)
2.2.3 Dielectric spectroscopy
For the analysis of the dielectric spectroscopy data, we have applied theprecedently described concepts of Vogel-Fulcher temperature TV F , maximumtemperature Tm, temperature of deviation from quadratic law TQ and shift toCurie-Weiss law, Curie-Weiss temperature TCW , and temperature of deviationfrom Curie-Weiss law which Td section 1.4.
Here, we analyse the dielectric properties of the relaxor compositions inthe BaSnxTi1−xO3 system for x(Sn)>0.3, as well as verify the properties ofx(Sn)<0.3 which have been studied before [43, 44].
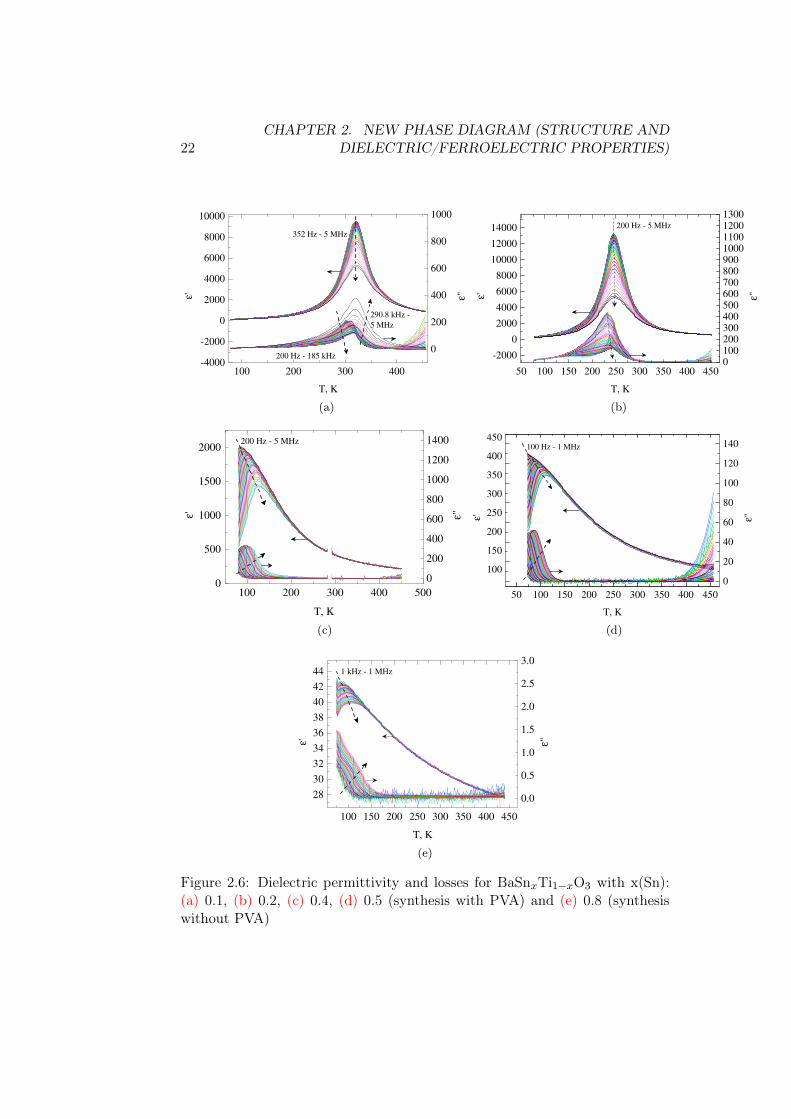
For all the compositions in fig. 2.6 we see the single dielectric permittivitypeak for single frequency. In x(Sn)=0.1 and 0.2 there in no frequency depen-dence of the peak, the compositions with higher Sn ratio and up to x(Sn)=0.8all show the relaxor peak shift. The corresponding Tm of dielectric permittiv-ity at 1 MHz is given in table 2.1 and later recalled in fig. 2.10.

2.2. RESULTS 21
43 44 45 46 47
x(Sn):
1
0.9
0.8
0.6
0.5
0.4
0.2
0.1
0
XR
D i
nte
nsi
ty
2Θ, °
(a)
0.0 0.2 0.4 0.6 0.8 1.064
65
66
67
68
69
70
Unit
cel
l volu
me,
A3
x(Sn)
(b)
Figure 2.5: Details of XRD data and results: (a) zoom at the region of (002)and (200) peaks, (b) the extracted unit cell volume (error bars of the Le Bailfit in green are smaller than the symbol size)
Table 2.1: Tm of dielectric permittivity at 1 MHz
x(Sn) Tm, K
0.1 3200.2 2450.4 1180.5 990.8 109
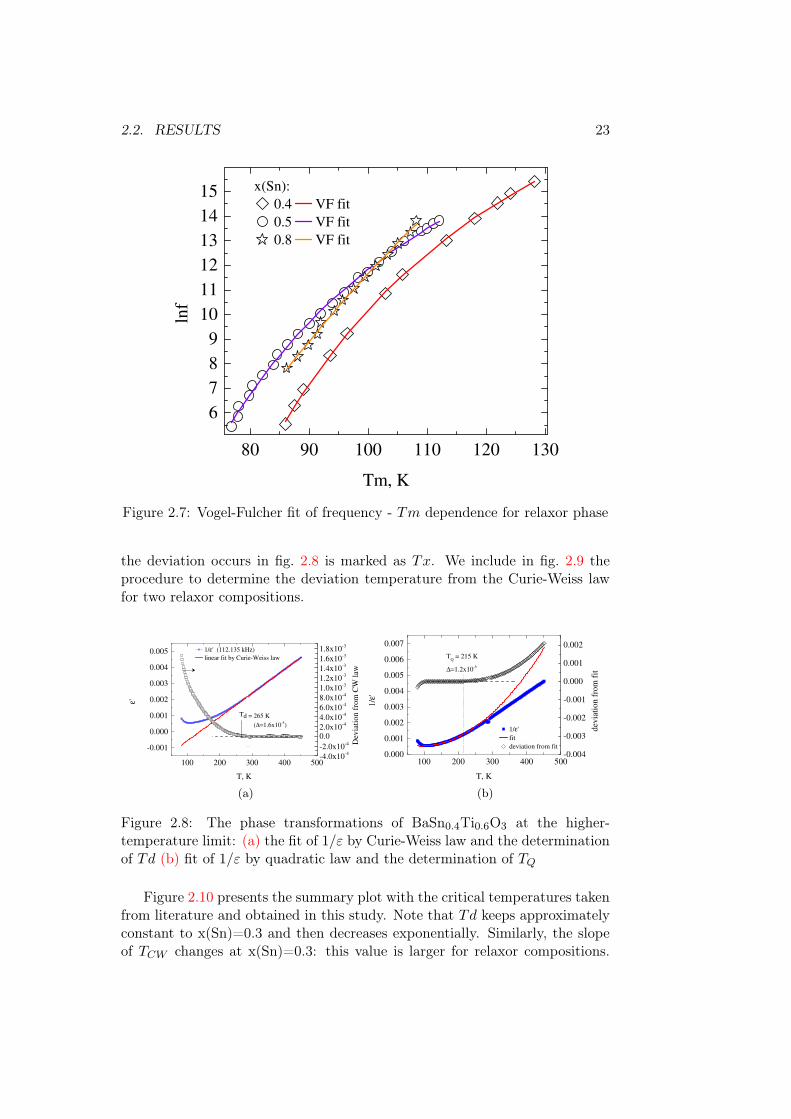
The Tm decreases first linearly for compositions until x(Sn)=0.4, and thenfor the remaining two compositions stays very close to 100 K. From fig. 2.7 itis visible that on frequency the Tm decreases with approximately similar ratefor x(Sn)=0.4 and 0.8 and faster for x(Sn)=0.5. The higher the Sn ratio, thestronger is the shift of the imaginary part ε” to lower temperatures from Tm.According to this, the TV F should be low. The results of fit by Vogel-Fucherlaw are shown in fig. 2.7, and TV F among other results of fitting can be foundin fig. 2.10.
Figure 2.8 illustrates the fit of 1/ε′ by Curie-Weiss and quadratic laws forx(Sn)=0.4 and the determination of Td and TQ correspondingly. Note thatfor x(Sn)=0.4 the Curie-Weiss law well fits the data to the highest measuredtemperatures, while for the further compositions x(Sn)=0.5 and 0.8 in fig. 2.8there is a deviation at high temperatures, which normally should not occurunless some dipoles of non-ferroelectric nature are present [47]. In Sn-richsamples those could be the charged defects. The temperature above which
22CHAPTER 2. NEW PHASE DIAGRAM (STRUCTURE AND
DIELECTRIC/FERROELECTRIC PROPERTIES)
100 200 300 400-4000
-2000
0
2000
4000
6000
8000
10000
ε'
T, K
0
200
400
600
800
1000
290.8 kHz -
5 MHz
ε"
352 Hz - 5 MHz
200 Hz - 185 kHz
(a)
50 100 150 200 250 300 350 400 450
-2000
0
2000
4000
6000
8000
10000
12000
14000
ε'
T, K
01002003004005006007008009001000110012001300
ε"
200 Hz - 5 MHz
(b)
100 200 300 400 5000
500
1000
1500
2000
ε'
T, K
200 Hz - 5 MHz
0
200
400
600
800
1000
1200
1400
ε"
(c)
50 100 150 200 250 300 350 400 450
100
150
200
250
300
350
400
450100 Hz - 1 MHz
ε'
T, K
0
20
40
60
80
100
120
140
ε"
(d)
100 150 200 250 300 350 400 450
28
30
32
34
36
38
40
42
44
ε'
T, K
1 kHz - 1 MHz
0.0
0.5
1.0
1.5
2.0
2.5
3.0
ε"
(e)
Figure 2.6: Dielectric permittivity and losses for BaSnxTi1−xO3 with x(Sn):(a) 0.1, (b) 0.2, (c) 0.4, (d) 0.5 (synthesis with PVA) and (e) 0.8 (synthesiswithout PVA)
2.2. RESULTS 23
80 90 100 110 120 130
6
7
8
9
10
11
12
13
14
15 x(Sn):
0.4 VF fit
0.5 VF fit
0.8 VF fit
lnf
Tm, K
Figure 2.7: Vogel-Fulcher fit of frequency - Tm dependence for relaxor phase
the deviation occurs in fig. 2.8 is marked as Tx. We include in fig. 2.9 theprocedure to determine the deviation temperature from the Curie-Weiss lawfor two relaxor compositions.
100 200 300 400 500
-0.001
0.000
0.001
0.002
0.003
0.004
0.005
ε'
T, K
1/ε' (112.135 kHz)
linear fit by Curie-Weiss law
-4.0x10⁻⁴
-2.0x10⁻⁴
0.02.0x10
-4
4.0x10⁻⁴
6.0x10⁻⁴
8.0x10⁻⁴
1.0x10⁻³
1.2x10⁻³
1.4x10⁻³
1.6x10⁻³
1.8x10⁻³
Td = 265 K
(∆=1.6x10⁻⁵)
Dev
iati
on
fro
m C
W l
aw
(a)
100 200 300 400 5000.000
0.001
0.002
0.003
0.004
0.005
0.006
0.007
1/ε
'
T, K
1/ε'
fit
deviation from fit
-0.004
-0.003
-0.002
-0.001
0.000
0.001
0.002
dev
iati
on
fro
m f
it
TQ = 215 K
∆=1.2x10⁻⁵
(b)
Figure 2.8: The phase transformations of BaSn0.4Ti0.6O3 at the higher-temperature limit: (a) the fit of 1/ε by Curie-Weiss law and the determinationof Td (b) fit of 1/ε by quadratic law and the determination of TQ
Figure 2.10 presents the summary plot with the critical temperatures takenfrom literature and obtained in this study. Note that Td keeps approximatelyconstant to x(Sn)=0.3 and then decreases exponentially. Similarly, the slopeof TCW changes at x(Sn)=0.3: this value is larger for relaxor compositions.

24CHAPTER 2. NEW PHASE DIAGRAM (STRUCTURE AND
DIELECTRIC/FERROELECTRIC PROPERTIES)
100 200 300 400 500
0.000
0.001
0.002
Tx = 366 K
( ∆ = 1.2x10⁻⁵
)
Dev
iati
on
fro
m C
uri
e-W
eiss
law
(∆
)
T, K
Td = 200 K
( ∆ = 1.2x10⁻⁵
)
(a)
100 150 200 250
0.000
0.001
0.002
Tx = 187 K
( ∆ = 1.2x10⁻⁵ )
Dev
iati
on
fro
m C
uri
e-W
eiss
law
(∆
)
T, K
Td = 134 K
( ∆ = 1.2x10⁻⁵ )
(b)
Figure 2.9: Deviation from Curie-Weiss law plotted for x(Sn) = (a) 0.5 (b) 0.8
0.0 0.2 0.4 0.6 0.8
-400
-200
0
200
400
600
Cri
tica
l te
mp
erat
ure
s, K
x(Sn)
Td
TCW
Tm (1 MHz)
TVF
Tx
?
Figure 2.10: The compositional evolution of TB, TCW , Tm, TV F (the data forx(Sn)<0.3 except the Tm is taken from ref. [43])
The Tm and TV F decrease non-linearly. It is as low as 30.8 K and 23.6 K forx(Sn)=0.4 and 0.5, and it shifts to negative values for x(Sn)=0.8. This meansthat there is no polar glass state for any temperature in that composition, thatthe low-temperature behaviour is dominated by quantum fluctuations and ischaracteristic for chemical compositions in BaTiO3-based relaxors above thepercolation point of Ti [47].
2.2. RESULTS 25
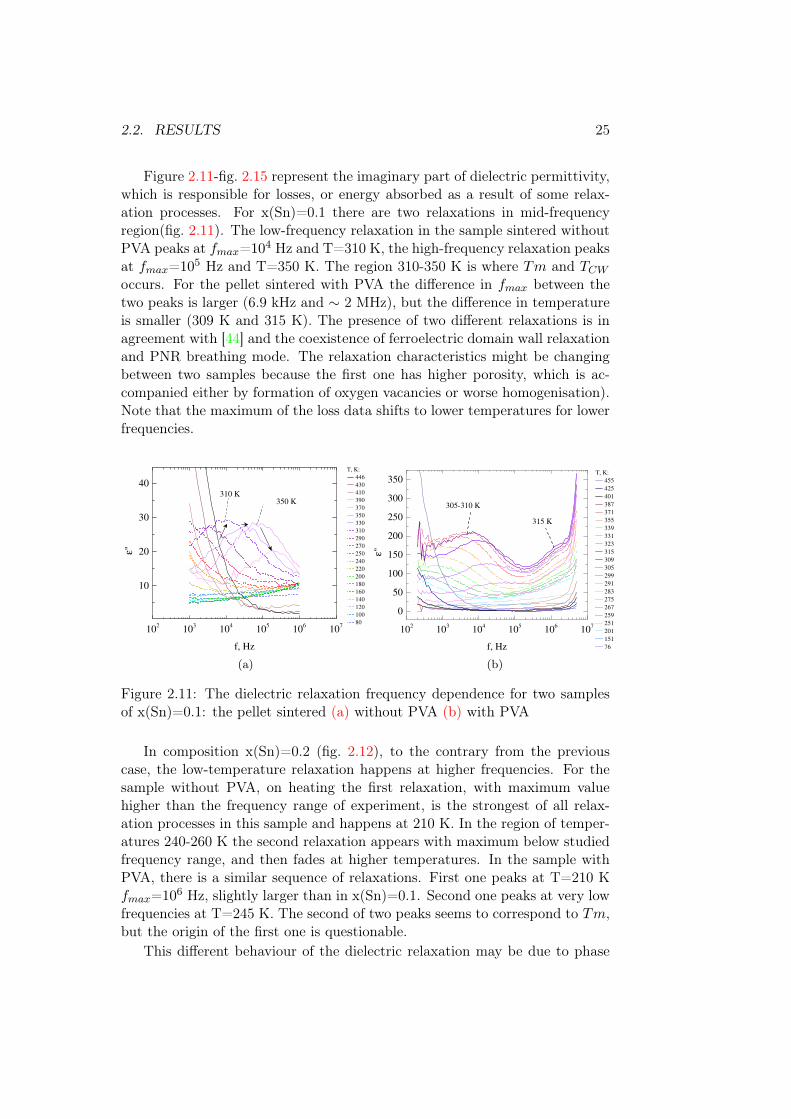
Figure 2.11-fig. 2.15 represent the imaginary part of dielectric permittivity,which is responsible for losses, or energy absorbed as a result of some relax-ation processes. For x(Sn)=0.1 there are two relaxations in mid-frequencyregion(fig. 2.11). The low-frequency relaxation in the sample sintered withoutPVA peaks at fmax=104 Hz and T=310 K, the high-frequency relaxation peaksat fmax=105 Hz and T=350 K. The region 310-350 K is where Tm and TCW
occurs. For the pellet sintered with PVA the difference in fmax between thetwo peaks is larger (6.9 kHz and ∼ 2 MHz), but the difference in temperatureis smaller (309 K and 315 K). The presence of two different relaxations is inagreement with [44] and the coexistence of ferroelectric domain wall relaxationand PNR breathing mode. The relaxation characteristics might be changingbetween two samples because the first one has higher porosity, which is ac-companied either by formation of oxygen vacancies or worse homogenisation).Note that the maximum of the loss data shifts to lower temperatures for lowerfrequencies.
102
103
104
105
106
107
10
20
30
40
350 K
T, K:
446
430
410
390
370
350
330
310
290
270
250
240
220
200
180
160
140
120
100
80
ε"
f, Hz
310 K
(a)
102
103
104
105
106
107
0
50
100
150
200
250
300
350
315 K
ε"
f, Hz
T, K:
455
425
401
387
371
355
339
331
323
315
309
305
299
291
283
275
267
259
251
201
151
76
305-310 K
(b)
Figure 2.11: The dielectric relaxation frequency dependence for two samplesof x(Sn)=0.1: the pellet sintered (a) without PVA (b) with PVA
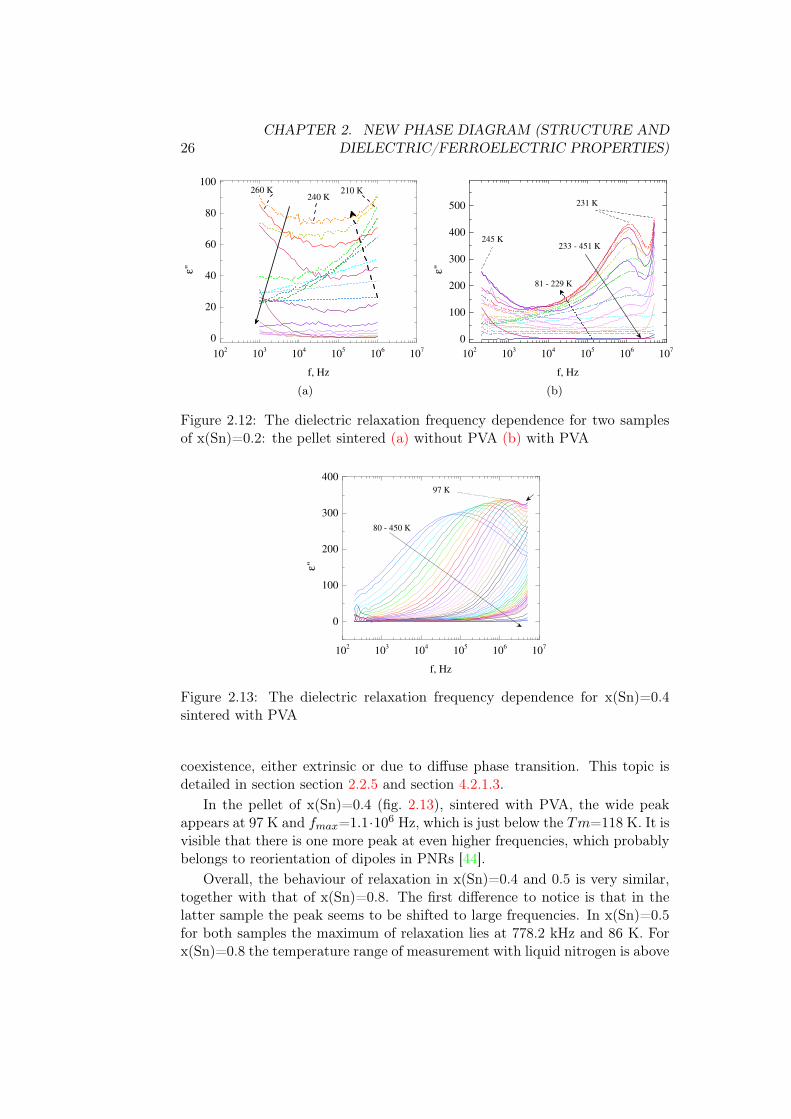
In composition x(Sn)=0.2 (fig. 2.12), to the contrary from the previouscase, the low-temperature relaxation happens at higher frequencies. For thesample without PVA, on heating the first relaxation, with maximum valuehigher than the frequency range of experiment, is the strongest of all relax-ation processes in this sample and happens at 210 K. In the region of temper-atures 240-260 K the second relaxation appears with maximum below studiedfrequency range, and then fades at higher temperatures. In the sample withPVA, there is a similar sequence of relaxations. First one peaks at T=210 Kfmax=106 Hz, slightly larger than in x(Sn)=0.1. Second one peaks at very lowfrequencies at T=245 K. The second of two peaks seems to correspond to Tm,but the origin of the first one is questionable.
This different behaviour of the dielectric relaxation may be due to phase
26CHAPTER 2. NEW PHASE DIAGRAM (STRUCTURE AND
DIELECTRIC/FERROELECTRIC PROPERTIES)
102
103
104
105
106
107
0
20
40
60
80
100ε"
f, Hz
210 K240 K
260 K
(a)
102
103
104
105
106
107
0
100
200
300
400
500
233 - 451 K
ε"
f, Hz
231 K
245 K
81 - 229 K
(b)
Figure 2.12: The dielectric relaxation frequency dependence for two samplesof x(Sn)=0.2: the pellet sintered (a) without PVA (b) with PVA
102
103
104
105
106
107
0
100
200
300
400
80 - 450 K
ε"
f, Hz
97 K
Figure 2.13: The dielectric relaxation frequency dependence for x(Sn)=0.4sintered with PVA
coexistence, either extrinsic or due to diffuse phase transition. This topic isdetailed in section section 2.2.5 and section 4.2.1.3.
In the pellet of x(Sn)=0.4 (fig. 2.13), sintered with PVA, the wide peakappears at 97 K and fmax=1.1·106 Hz, which is just below the Tm=118 K. It isvisible that there is one more peak at even higher frequencies, which probablybelongs to reorientation of dipoles in PNRs [44].
Overall, the behaviour of relaxation in x(Sn)=0.4 and 0.5 is very similar,together with that of x(Sn)=0.8. The first difference to notice is that in thelatter sample the peak seems to be shifted to large frequencies. In x(Sn)=0.5for both samples the maximum of relaxation lies at 778.2 kHz and 86 K. Forx(Sn)=0.8 the temperature range of measurement with liquid nitrogen is above

2.2. RESULTS 27
102
103
104
105
106
107
0
10
20
30
40
50
74-446 K
ε"
f, Hz
85-87 K
(a)
102
103
104
105
106
107
0
20
40
60
80
100
ε"
f, Hz
456 K
86 K
T: 73 - 456 K
(b)
Figure 2.14: The dielectric relaxation frequency dependence for two samplesof x(Sn)=0.5: the pellet sintered (a) without PVA (b) with PVA
102
103
104
105
106
107
0.0
0.5
1.0
1.5T, K:
73
80
90
100
110
120
130
140
150
160
170
180
190
200
210
220
230
237
ε"
f, Hz
Figure 2.15: The dielectric relaxation frequency dependence for x(Sn)=0.8sintered without PVA
the maximum of relaxation, so the decrease in intensity of the peak is seen.In pellets with x(Sn)=0.1, 0.5 with PVA, and 0.8 the large ε” at low tem-
peratures and low frequencies is probably related to conductivity contributionor contact polarization. Further experiments are needed to determine the re-laxation behaviour processes of these compositions.
2.2.4 Transmission electron microscopy
A Transmission Electron Microscope FEI Titan operated at 300 keV wasused. The sample was prepared by Focused Ion Beam.
All the previous HRTEM studies section 1.3 on BaSnxTi1−xO3 were per-formed on compositions from ferroelectric or diffuse phase transition regions.In fig. 2.16 we show our study on x(Sn)=0.4 which is a pure relaxor composi-
28CHAPTER 2. NEW PHASE DIAGRAM (STRUCTURE AND
DIELECTRIC/FERROELECTRIC PROPERTIES)
tion.
(a) (b)
1 2 3 4
4.5
4.0
3.5
3.0
2.5
2.0
1.5
1.0
0.5
y,
nm
x, nm
-0.04000
-0.03000
-0.02000
-0.01000
0.000
0.01000
0.02000
0.03000
0.04000
(c)
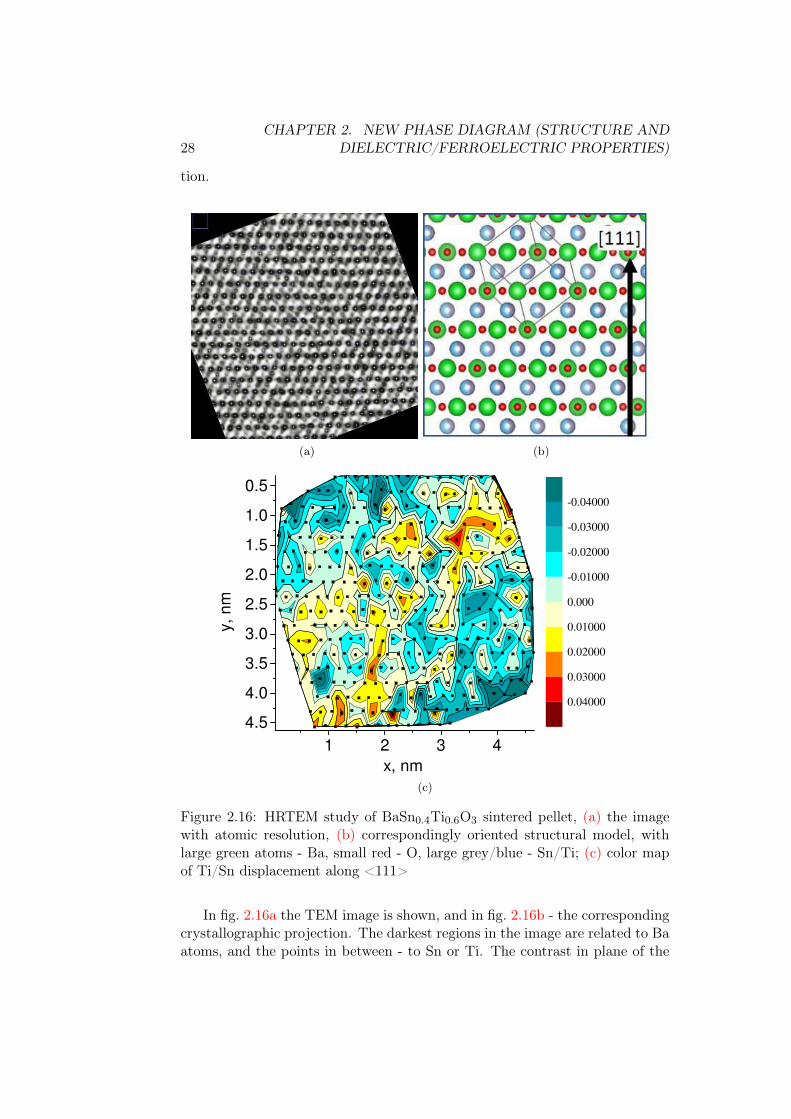
Figure 2.16: HRTEM study of BaSn0.4Ti0.6O3 sintered pellet, (a) the imagewith atomic resolution, (b) correspondingly oriented structural model, withlarge green atoms - Ba, small red - O, large grey/blue - Sn/Ti; (c) color mapof Ti/Sn displacement along <111>
In fig. 2.16a the TEM image is shown, and in fig. 2.16b - the correspondingcrystallographic projection. The darkest regions in the image are related to Baatoms, and the points in between - to Sn or Ti. The contrast in plane of the
2.2. RESULTS 29
figure comes from a sum of the atomic positions in atomic columns through thedepth of the sample (< 30 nm). The indexing by color depth was performedin ImageJ software, so that atomic positions, marked by bright data markers,are taken at the point with the highest probability to find an atom within eachcolumn.
According to model of fig. 2.16b, within the plane of the figure Ba atoms aresituated in horizontal lines, and Sn/Ti atoms are located in the middle betweenBa lines. The displacement of Sn/Ti atoms along <111> crystallographic axisis along the vertical of the figure.
In fig. 2.16a, the atoms of Ba are less displaced than Sn/Ti, so we assumeBa displacement as zero. Based on the model of fig. 2.16b, the displacement ofSn/Ti atoms along the <111> axis is calculated as difference between the po-sitions of corresponding Sn/Ti atom data markers in fig. 2.16a and 0.5dBa−Ba.
The B-site atomic positions are plotted in colormap of fig. 2.16c. The atomsare displaced from their standard positions by the groups of 4-5 unit cells withthe displacement stronger in the center. The PNRs seem to be of smallersize but with larger distortions. While in Ti-rich compositions of fig. 1.11the displacements were reaching maximum 20 pm, in this relaxor composi-tions the < 111 > displacements reach 30-40 pm and even more. According tothis, the trend of increasing displacements which was seen in x(Sn)=0.16...0.25(table 1.1) continues deeper into the phase diagram, and the presence of rhom-bohedral distortions is confirmed.
It is interesting to note that the distortions with the lifetime sufficientlyhigh to be detected in TEM exist in x(Sn)=0.4 above the Td (for which thedeviation from Curie-Weiss law was taken with large precision). We speculatethat there could be one more critical temperature T ∗ > Td corresponding tofull disappearance of any kind of static or dynamic polar correlations.
2.2.5 Temperature dependent laboratory X-ray diffractionstudies
We studied our samples in temperature by acquisition of three XRD peaks,corresponding to (200), (110), and (111) crystallographic planes. These threepeaks correspond to three directions of Ti atom off-centering in T, O, and Rphases. The quality of acquisition permits to estimate the phase symmetry andto find the temperatures of possible phase transitions, although the absorptionof Cu Kβ X-rays is high in BaSnxTi1−xO3, so that only the surface grains areanalysed (90% of intensity is lost at the depth of 6-7 grains).
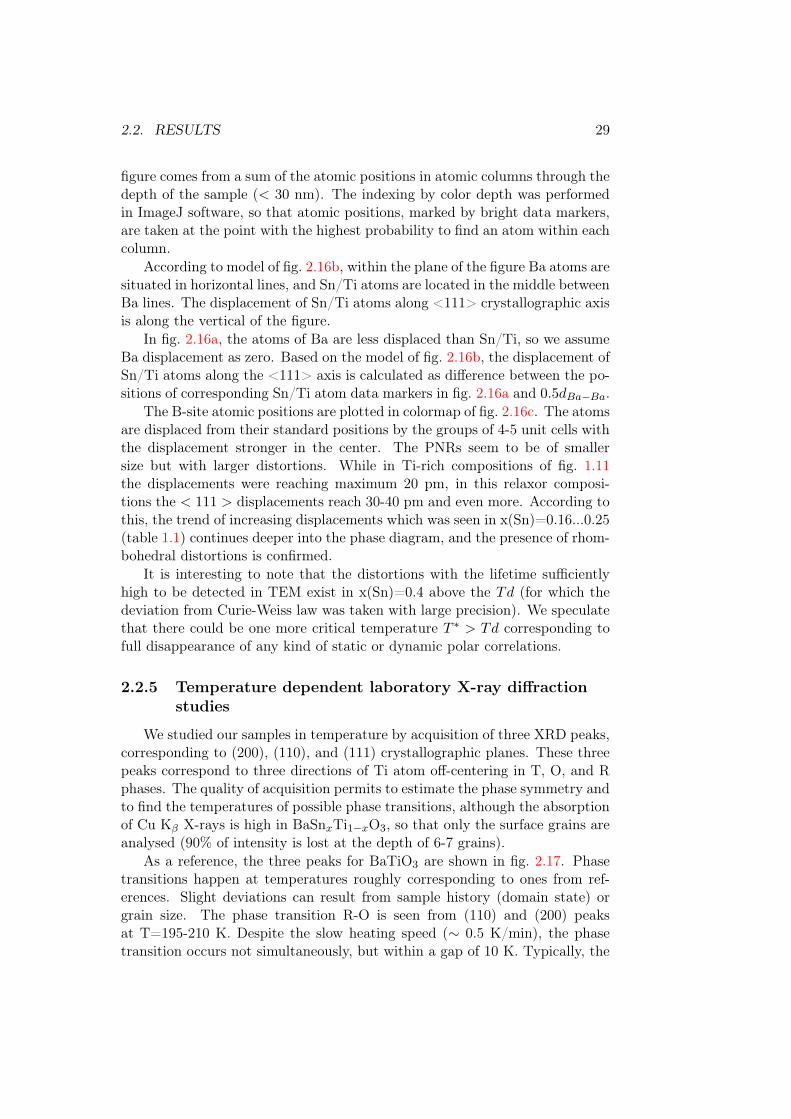
As a reference, the three peaks for BaTiO3 are shown in fig. 2.17. Phasetransitions happen at temperatures roughly corresponding to ones from ref-erences. Slight deviations can result from sample history (domain state) orgrain size. The phase transition R-O is seen from (110) and (200) peaksat T=195-210 K. Despite the slow heating speed (∼ 0.5 K/min), the phasetransition occurs not simultaneously, but within a gap of 10 K. Typically, the
30CHAPTER 2. NEW PHASE DIAGRAM (STRUCTURE AND
DIELECTRIC/FERROELECTRIC PROPERTIES)
28.2 28.5
T, K:
470
450
430
420
415
410
405
400
395
390
385
380
370
360
350
330
320
310
300
295
290
285
280
275
270
265
260
250
240
220
210
200
195
190
185
180
175
170
165
160
150
140
120
100
802Θ, °
195-
210 K
285-
290 K
400 K
380 K
(a)
28.2 28.5
T, K:
480
450
430
420
415
410
405
400
395
390
385
380
370
360
350
330
320
310
300
295
290
285
280
275
270
265
260
250
240
220
210
200
195
190
185
180
175
170
165
160
150
140
120
100
802Θ, °
195-
210 K
285-
290 K
400 K
380 K
(b)
40.5 41.0
405 K
2Θ, °
200-
210 K
285-
290 K
380 K
(c)
Figure 2.17: XRD peaks of BaTiO3 from crystallographic planes (a) (110), (b)(111), (c) (200)
upper temperature 210 K is higher than in single crystals, but is in agreementwith [48]. The next phase transition, O-T, is seen at expected temperature285-290 K for all peaks. Finally, the T-C phase transition lies in the widesttemperature interval of 370-405 K, where the 2Θ of peaks of (110) and espe-cially (200) varies according to different linear dependence than at tempera-tures below or above. There is also a shift of peak maximum to larger 2Θ values(smaller lattice parameters) at T=470 K, where the static Ti displacementsvanish [49], and which is close to depolarization temperature Td, determinedfrom dielectric spectroscopy (see section 1.2.1 and section 1.4).
For x(Sn)=0.2 (fig. 2.18), which corresponds to diffuse phase transitionwith coexistence of relaxor and ferroelectric phases, all the three crystallo-graphic phase transitions, remanent from from BaTiO3, disappear. However,on heating there is possibly a change of slope from increasing to nearly con-stant in d200 close to 200 K, which is close to TV F in fig. 1.13. Additionally,there is a shift to smaller value in d110 peak at the temperature which appearsto be the Td=440-460 K. It is possible to speculate that since the (110) peak ismost sensitive to Td, the major type of distortions in PNRs are orthorhombic.

2.2. RESULTS 31
28.2 28.4
T, K:
480
475
470
460
440
420
400
380
360
340
320
310
300
290
285
280
275
270
265
260
255
250
245
240
235
230
220
210
200
180
160
140
120
2Θ, °
440 K
(a)
34.5 35.0
2Θ, °(b)
40.2 40.5
2Θ, °
200 K
(c)
Figure 2.18: XRD peaks of BaSn0.2Ti0.8O3 from crystallographic planes (a)(110), (b) (111), (c) (200)
In x(Sn)=0.5 (fig. 2.19), which is a truly relaxor composition, more changesare visible at 180-200 K, 260-280 K, and 380-400 K. The first region corre-sponds to Td=200 K as determined from dielectric spectroscopy (fig. 2.9).The d111 starts increasing after passing through Td=200K. The further devia-tion present at 260-280 K, and at even higher temperatures the deviation fromCurie-Weiss law happens at 380-400 K. This means that more than one processis involved above Td=200 K. At 260-280 K the d110 and d200 start to increasesimilarly to d111 at Td=200 K. If several kinds of distortions (or phases) coex-ist, this temperature could correspond to disappearance of static distortions ofthe second type. Above T=380-400 K d110 and d111 start decreasing similarlyto BaTiO3, where there is also a sharp decrease in d110 and d111 at Td. Thedeviation reaches 1.2 · 10−5 at Tx =366 K, but appears well visible by eye at400 K (fig. 2.9a). Why the deviation happens at the temperature above thedisappearance of distortions of both types is not fully clear. However, we canconsider that this is related to appearance of some factor which is not relatedto ferroelectricity. This could be for instance the activation of defect sites,typically oxygen vacancies, coming from the BaSnO3 sublattice.

32CHAPTER 2. NEW PHASE DIAGRAM (STRUCTURE AND
DIELECTRIC/FERROELECTRIC PROPERTIES)
28.0 28.1
T, K:
480
460
440
420
400
380
360
340
320
300
280
260
240
220
200
180
160
140
120
100
85
2Θ, °
260 K
380 K
(a)
34.4 34.8
2Θ, °
200 K
380 K
(b)
40.0 40.2
2Θ, °
200 K
280 K
(c)
Figure 2.19: XRD peaks of BaSn0.5Ti0.5O3 from crystallographic planes (a)(110), (b) (111), (c) (200)
In x(Sn)=0.8 (fig. 2.20) the changes happening to d110 remind very muchones from x(Sn)=0.5, just the temperatures are different. The values of twohigh-temperature regions in this sample shift 40 K higher to give T1=300 Kand T2=420 K. These values do not anymore coincide with the Td or Tx whichare found at much lower temperatures. The coupling between crystallographicstructure and the polar order probably disappears because this composition isabove the percolation limit of Ti atoms, and dielectric properties (Ti sublat-tice) and defect properties (Sn sublattice) are not related.
The changes of unit cell volume which are not related to ferroelectricityare also visible in BaSnO3 (fig. 2.21) at 230-260 K for all the three systems ofcrystallographic plane (d200, d220, d111).

2.2. RESULTS 33
27.75 27.90
T, K:
480
460
440
420
400
380
360
340
320
300
280
260
240
220
200
180
160
140
120
115
110
105
100
95
90
85
2Θ, °
300 K
420 K
(a)
34 35
2Θ, °(b)
39.5 40.0
2Θ, °
340 K
(c)
Figure 2.20: XRD peaks of BaSn0.8Ti0.2O3 from crystallographic planes (a)(110), (b) (111), (c) (200)

34CHAPTER 2. NEW PHASE DIAGRAM (STRUCTURE AND
DIELECTRIC/FERROELECTRIC PROPERTIES)
57.0 57.5
T, K:
480
450
400
350
300
260
230
200
190
185
180
175
170
165
160
155
150
145
140
135
130
120
110
100
80
2Θ, °
230 K
260 K
(a)
34.0 34.2
2Θ, °(b)
39.5
2Θ, °
260 K
230 K
(c)
Figure 2.21: XRD peaks of BaSnO3 from crystallographic planes (a) (220);(b) (111); (c) (200)

2.2. RESULTS 35
Conclusions
The samples of BaSnxTi1−xO3 are synthesized. The laboratory X-ray diffraction does not show the presence of any impurities. At roomtemperature, the peak shape is quasicubic or cubic for all the compositionsexcept pure BaTiO3. With Sn ratio increase, the unit cell parameter varieslinearly.
According to our dielectric spectroscopy data combined with previousresearch, the phase diagram can be separated into 1) ferroelectric phase(below x(Sn)=∼0.13 %), diffuse phase transition with possible phase co-existence (x(Sn)=0.13-0.3), relaxor phase starting from x(Sn)=0.3 andfurther compositions until x(Sn)=0.8.
The properties vary non-linearly in relaxor compositions, includingthe Td, Tm, TV F decreasing exponentially on x(Sn). The compositionswith x(Sn)>0.5 never transform to a polar glass since TCW is negative.For Sn-rich compositions there is a high-temperature deviation from theCurie-Weiss law Tx, which we attribute to the activation of some non-ferroelectric mechanisms of interaction with the electric field, such as de-fect dipoles. The Tx was not discovered for other compositions becauseof an upper limitation of the measurement range, and whether it exists isan opened question for more experiments.
We evidence through HRTEM in x(Sn)=0.4 the PNRs with Ti dis-placements along the <111> crystallographic directions, despite this is atroom temperature T > Td. The full disappearance of polar correlationsprobably happens at higher temperatures.
The characteristic temperatures from laboratory X-ray diffraction arecompared with ones from dielectric spectroscopy in fig. 2.22. With oneexception for x(Sn)=0.5, the temperature values from XRD seem to cor-respond to the ones from dielectric spectroscopy below x(Sn)≈0.7. Abovethis composition, the temperatures do not coincide, as the ferroelectric(Ti) and defect (Sn) properties are probably not coupled, if this is abovethe possible percolation limit of Ti atom.

36CHAPTER 2. NEW PHASE DIAGRAM (STRUCTURE AND
DIELECTRIC/FERROELECTRIC PROPERTIES)
0.0 0.2 0.4 0.6 0.8 1.0-500
-400
-300
-200
-100
0
100
200
300
400
500
600
700
(all)
(110)
(110)(111 & 110)
(200 & 110)
(200 & 111)
(110)
Td
TCW
Tm (1 MHz)
TVF
Tx
Cri
tica
l te
mp
erat
ure
s, K
x(Sn)
?
T (XRD)
293 K
(200)
Figure 2.22: The characteristic temperatures united from dielectric spec-troscopy and laboratory X-ray diffraction
Chapter 3
Optical properties
3.1 Optical Properties: Introduction
In perovskite compounds Ba2+Ti4+O2−3 and Ba2+Sn4+O2−
3 the B-site atomshave the same valence. Due to this we don’t expect any significant contentsof compensating defects like VO, which can potentially cause the decrease ofefficiency in photovoltaic materials.
One of the parent compounds for this solid solution, Barium stannateBaSnO3 is known as a promising candidate to transparent conductive oxidesindustry, because the electronic structure of Sn atom assures the increasedmobility of electrons in the conduction band compared to BaTiO3. In detail,neutral B-site atoms in the two parent compounds of the solid solution arein configuration Ti 4s23d2 and Sn 5s25p24d10. After forming the chemicalbonding, the conduction band minimum is formed by Ti 3d0 and Sn 5s05p0,correspondingly. The s and p orbitals are known to be less localized in spacethan d-orbitals, providing wider conduction band with larger energy disper-sion. As a result, the electron effective mass is as low as m∗ ≈ 0.469m0 inBaSnO3 [50], compared to m∗ ≈ 2.8m0 in BaTiO3 [51].
The band gaps of the two compounds are very similar, 3.2 eV for BaSnO3
and 3.27 eV for BaTiO3. Whether the band gap of BaSnO3 is direct or indi-rect is under discussion. As for BaTiO3, both in tetragonal and cubic phasesindirect band gap R − Γ is very close in energy to the direct band gap Γ− Γso it is impossible to discriminate between the two by experimental techniques[52, 53, 54, 55, 51]. For BaSnO3 there is an agreement in theoretical works, aswell, that the indirect band gap has lower energy than the direct one [56, 50].Nevertheless, few existing experimental works do not reach the same conclu-sion, whether by UV-visible-NIR absorption spectroscopy or by Angular re-solved photoelectron emission spectroscopy (ARPES) [57]. Most probably, theambiguous results of ARPES are caused by the participation of defect levels inchemical binding [57]. Moreover, local structure imperfections or defects couldbe the reason why in Raman spectroscopy the modes of orthorhombic phase
37
38 CHAPTER 3. OPTICAL PROPERTIES
Pbnm (Pnma) [58, 59] are detected while no signal should exist for the cubicPm3̄m phase. It was shown that Pm3̄m has only slightly lower energy thanthe orthorhombic phase Pbnm (Pnma) [59].
3.2 Band gap
3.2.1 Methodology: Diffuse reflectance theory, KubelkaMunk approximation and Urbach tail
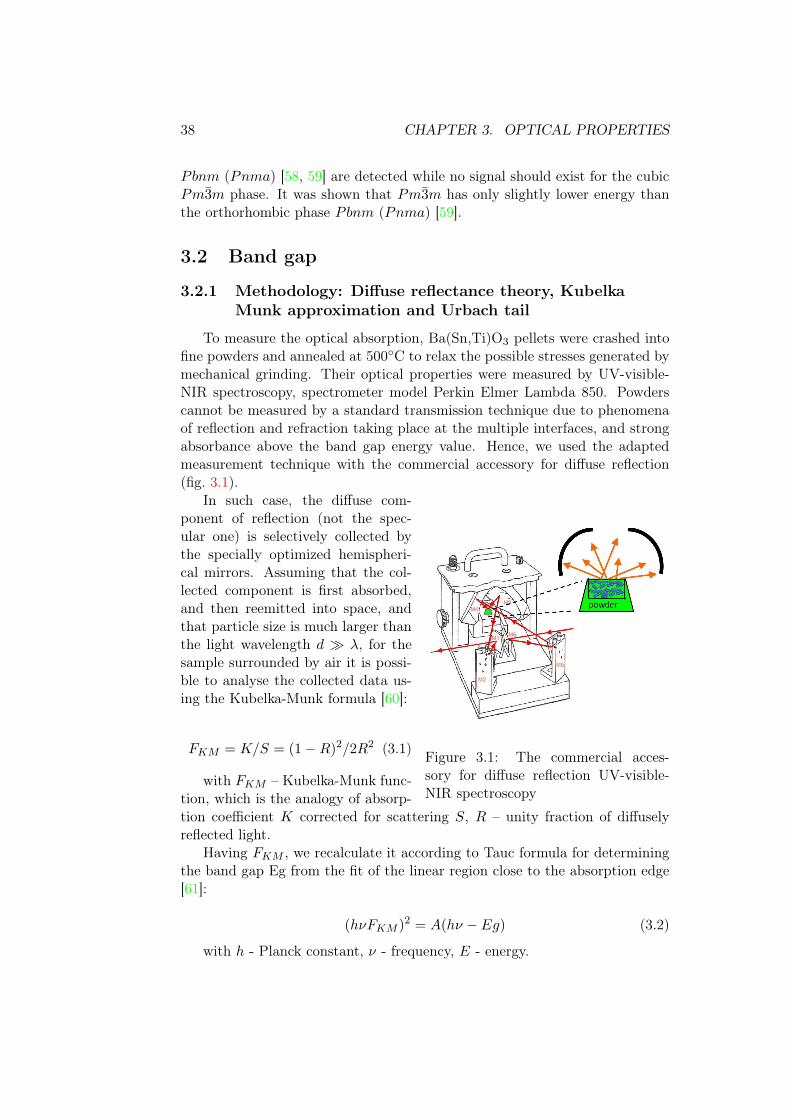
To measure the optical absorption, Ba(Sn,Ti)O3 pellets were crashed intofine powders and annealed at 500◦C to relax the possible stresses generated bymechanical grinding. Their optical properties were measured by UV-visible-NIR spectroscopy, spectrometer model Perkin Elmer Lambda 850. Powderscannot be measured by a standard transmission technique due to phenomenaof reflection and refraction taking place at the multiple interfaces, and strongabsorbance above the band gap energy value. Hence, we used the adaptedmeasurement technique with the commercial accessory for diffuse reflection(fig. 3.1).
Figure 3.1: The commercial acces-sory for diffuse reflection UV-visible-NIR spectroscopy
In such case, the diffuse com-ponent of reflection (not the spec-ular one) is selectively collected bythe specially optimized hemispheri-cal mirrors. Assuming that the col-lected component is first absorbed,and then reemitted into space, andthat particle size is much larger thanthe light wavelength d ≫ λ, for thesample surrounded by air it is possi-ble to analyse the collected data us-ing the Kubelka-Munk formula [60]:
FKM = K/S = (1−R)2/2R2 (3.1)
with FKM – Kubelka-Munk func-tion, which is the analogy of absorp-tion coefficient K corrected for scattering S, R – unity fraction of diffuselyreflected light.
Having FKM , we recalculate it according to Tauc formula for determiningthe band gap Eg from the fit of the linear region close to the absorption edge[61]:
(hνFKM )2 = A(hν − Eg) (3.2)
with h - Planck constant, ν - frequency, E - energy.

3.2. BAND GAP 39
It is possible to choose different assumption on the nature of the bandgap, including direct allowed (n=1/2), direct forbidden (n=3/2), indirect al-lowed(n=2), indirect forbidden (n=3) band gaps [61].
Since for solid solutions the nature of the absorption edge is not known,we checked all the four possible assumptions.
3.2.2 Results of UV-Visible-NIR spectroscopy
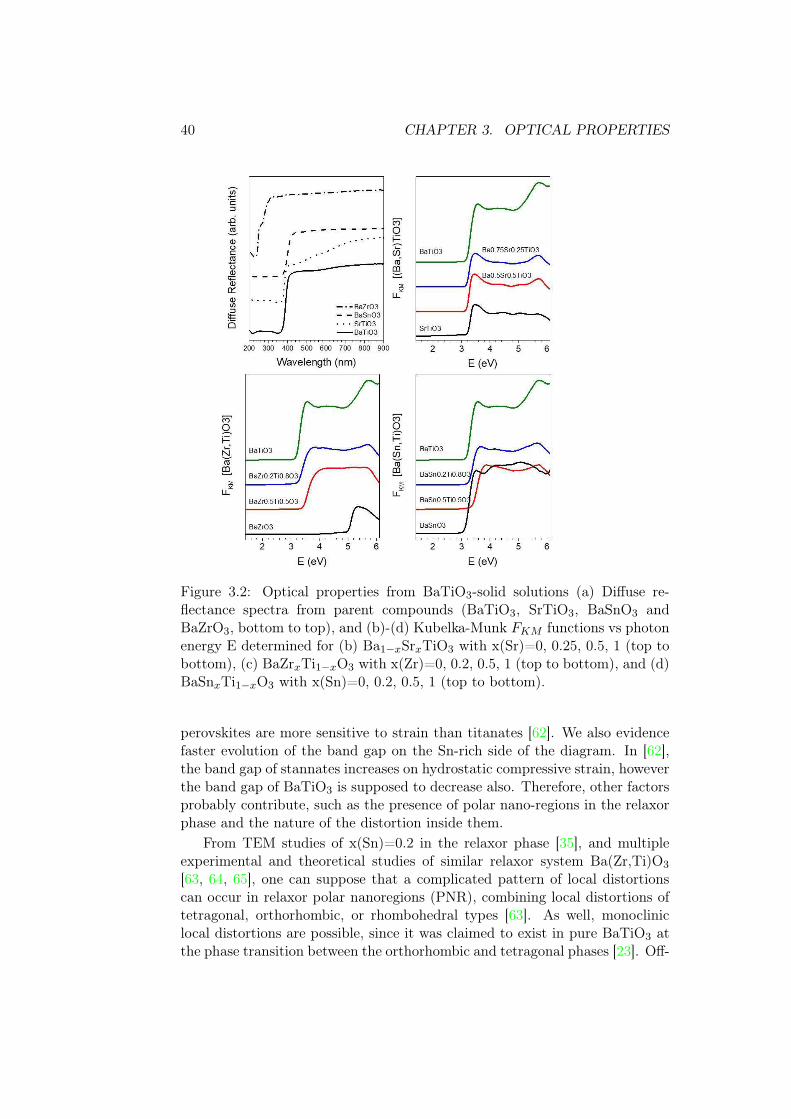
Diffuse reflectance raw data in fig. 3.2a point out the large absorptiondifferences of the parent compounds. Optical absorption features are seen inthe Kubelka-Munk functions FKM depending of the solid solution. A largeincrease of FKM is characteristic of the optical absorption edge at a givenphoton energy, being the Zr-compounds (fig. 3.2c) those presenting the largervariation of the photon energy onset. No remarkable onset change is seen forSr-compounds (fig. 3.2b), and weak and non-monotonic ones for Sn-compounds(fig. 3.2d).
The absorption coefficient of BaSnxTi1−xO3 at room temperature (FKM )is plotted in fig. 3.3 for a range of chemical compositions. No anomalies atthe absorption edge are visible. At the same time, the onset shifts to higherenergy for intermediate compositions. Overall, three peaks (possibly, groupsof peaks) are visible in the spectrum of BaTiO3 – at around 3.6 eV, 4.3 eV and5.7 eV.
In solid solutions, there is a second peak appearing at 5.25 eV, which isgrowing with increase in Sn content. In x(Sn) > 0.8 it dominates the spec-trum and is the only peak in the high-energy part of the spectrum in pureBaSnO3. Hence, it seems that energy levels, corresponding to high-energyabsorption, do not hybridize or mix in between them. To the contrary, thelower-energy levels cannot be separated into Ti- and Sn-related contributions,probably consisting of multiple widened components, and possibly with somehybridization happening in between them. This group of peaks evolves inthree steps, x(Sn) < 0.2, 0.2 6 x(Sn) 6 0.6, and x(Sn) > 0.8, corresponding toroom-temperature regions of ferroelectricity, relaxor behavior, and the regiondominated by BaSnO3 matrix as will be shown in Chapter 4.
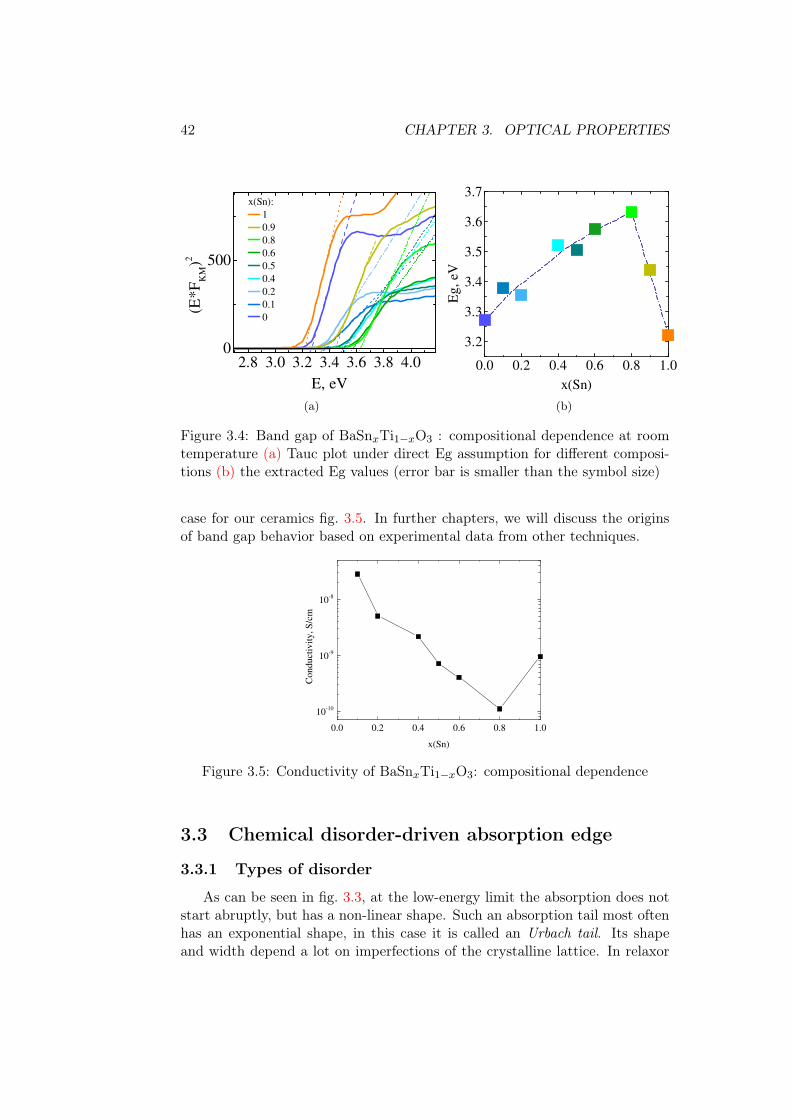
The Tauc plot was performed under different assumptions of the band gapnature to verify the presence of any additional absorption edges. There are noadditional absorption features appearing, thus we consider the band gap as adirect allowed one, fig. 3.4a. The rest three plots are available in fig. A1 of theAnnex. Band gap values in fig. 3.4 evolve non-linearly, increasing by around0.35 eV until x(Sn)=0.8, and then decreasing towards pure BaSnO3.
Existence of two distinct trends must be related to domination of Ti orSn levels, as seen in the high-energy region of the absorption coefficient. Onepossibility of why the band gap increases where Ti atoms dominate (accordingto the high-energy absorption region) is that the chemical stress is imposedby Sn atoms on Ti matrix. It was shown in calculations that Sn-containing
40 CHAPTER 3. OPTICAL PROPERTIES
Figure 3.2: Optical properties from BaTiO3-solid solutions (a) Diffuse re-flectance spectra from parent compounds (BaTiO3, SrTiO3, BaSnO3 andBaZrO3, bottom to top), and (b)-(d) Kubelka-Munk FKM functions vs photonenergy E determined for (b) Ba1−xSrxTiO3 with x(Sr)=0, 0.25, 0.5, 1 (top tobottom), (c) BaZrxTi1−xO3 with x(Zr)=0, 0.2, 0.5, 1 (top to bottom), and (d)BaSnxTi1−xO3 with x(Sn)=0, 0.2, 0.5, 1 (top to bottom).
perovskites are more sensitive to strain than titanates [62]. We also evidencefaster evolution of the band gap on the Sn-rich side of the diagram. In [62],the band gap of stannates increases on hydrostatic compressive strain, howeverthe band gap of BaTiO3 is supposed to decrease also. Therefore, other factorsprobably contribute, such as the presence of polar nano-regions in the relaxorphase and the nature of the distortion inside them.
From TEM studies of x(Sn)=0.2 in the relaxor phase [35], and multipleexperimental and theoretical studies of similar relaxor system Ba(Zr,Ti)O3
[63, 64, 65], one can suppose that a complicated pattern of local distortionscan occur in relaxor polar nanoregions (PNR), combining local distortions oftetragonal, orthorhombic, or rhombohedral types [63]. As well, monocliniclocal distortions are possible, since it was claimed to exist in pure BaTiO3 atthe phase transition between the orthorhombic and tetragonal phases [23]. Off-

3.2. BAND GAP 41
2 3 4 5 6
FK
M
E, eV
1
0.9
0.8
0.6
0.5
0.4
0.2
0.1
0
Figure 3.3: Absorption coefficient FKM of BaSnxTi1−xO3: compositional de-pendence
centering of the B-site cation of any kind leads to a deviation of the octahedralangle O-B-O from 180◦, which is known to decrease the overlap of the O 2pand B-site (Ti 3d or Sn 5s 5p) orbitals. This decreases the width of conductionband, mainly making its lower region more anti-bonding and less non-bonding,which results in an increase in the energy of the CBM and the band gap[66, 67]. Moreover, PNRs, at least in x(Sn)=0.2, correspond to Ti-rich regionsdistributed inside a Sn-rich matrix [35]. It can be thought as coherent particlesincorporated into a matrix with slightly larger lattice parameter, thus therewould be tensile stress applied on the PNRs. For rhombohedral distortions,tensile stress can add up to the effect of band gap increase [68]. Finally, itis under question if the nanoscopic size of PNR (6 2nm) can contribute witheffects of quantum confinement like it happens in nanoparticles of BaTiO3 orSrTiO3 powders [69, 70]. It is always possible to assume that the band gapcan increase due to so-called Burstein-Moss effect. Essentially, in this caseSn substitution for Ti would create the donor defects which would result infilling of the CB, so that the measured band gap would be Eg′ = Eg+Efilled.However, in this case the conductivity is supposed to increase, which is not the
42 CHAPTER 3. OPTICAL PROPERTIES
2.8 3.0 3.2 3.4 3.6 3.8 4.00
500
(E*
FK
M)2
E, eV
x(Sn):
1
0.9
0.8
0.6
0.5
0.4
0.2
0.1
0
(a)
0.0 0.2 0.4 0.6 0.8 1.0
3.2
3.3
3.4
3.5
3.6
3.7
Eg
, eV
x(Sn)
(b)
Figure 3.4: Band gap of BaSnxTi1−xO3 : compositional dependence at roomtemperature (a) Tauc plot under direct Eg assumption for different composi-tions (b) the extracted Eg values (error bar is smaller than the symbol size)
case for our ceramics fig. 3.5. In further chapters, we will discuss the originsof band gap behavior based on experimental data from other techniques.
0.0 0.2 0.4 0.6 0.8 1.0
10-10
10-9
10-8
Co
nd
uct
ivit
y, S
/cm
x(Sn)
Figure 3.5: Conductivity of BaSnxTi1−xO3: compositional dependence
3.3 Chemical disorder-driven absorption edge
3.3.1 Types of disorder
As can be seen in fig. 3.3, at the low-energy limit the absorption does notstart abruptly, but has a non-linear shape. Such an absorption tail most oftenhas an exponential shape, in this case it is called an Urbach tail. Its shapeand width depend a lot on imperfections of the crystalline lattice. In relaxor

3.3. CHEMICAL DISORDER-DRIVEN ABSORPTION EDGE 43
systems, this is a particularly important parameter to be analysed, since it isstraightly connected to physical properties.
Studies of absorption tail started as early as 1953, when F. Urbach studiedthe sensitivity of photographic emulsions of multiple semiconductors (includingthe wide-gap ones). He noticed that low-energy part could be described closelyby e1/kT [71]. Later studies, for instance on amorphous hydrogen-doped silicon[72] concluded that any kind of disorder contributes to widen, or blur, theallowed density of states ρ of the band gap edges according to the law lnρ = En,where n can be different depending on the kind of disorder.
In general, there can be structural static type of disorder EuS (due toimmobile defects), or the compositional disorder EuComp in solid solutionsdue to distribution of chemically substituted atoms, and temperature-relateddisorder EuT [73]:
Eu = EuT + EuS + EuComp (3.3)
The latter one EuT most often results from thermal lattice vibrations(phonons), but is also affected by disorder phase transformations characterizedby different dynamics of ions or defects:
EuT = Euph + Eudyn (3.4)
The thermal disorder is described by the formula
Euph = Eu0 + Eu11
e(ΘE/T ) − 1, (3.5)
with Eu0, Eu1, ΘE - constants. It is suggested that the thermal mechanismoccurs mainly due to valence band electron coupling to phonons [74]. Anotherapproach tells that the exciton at light absorption is momentarily trapped atthe vibrational levels created by phonons [73] (self-trapped ST exciton). Thispoint of view is supported by the fact that the Urbach tail also appears inphotoluminescence spectra which represent the recombination of ST exciton[75]. The phonons participating in the process are mainly those involving theelectric field change, the longitudinal optical LO branch, where the Ti-O bondvibrates parallel to the polarization direction, so that overlap of O 2p andTi 3d orbitals of π type is modulated [74]. Note, same effect of electric fieldmodulation can be caused by fast transverse acoustic phonons, which resultin a so-called piezoelectric absorption edge [76]. Moreover, if this effect ofchanging the polarization becomes static, for instance in the phase transitionfrom cubic (paraelectric) to tetragonal (ferroelectric) BaTiO3, then the bandgap itself is modified [74]. The fact that the band gap varies according tosimilar law as the Raman shift was pointed out by [77].
The second factor in temperature changes of Eu is the possibility of disor-der phase transformations. Those are characteristic to materials with high de-fect concentrations, so that there are unique favorable defect positions and/or
44 CHAPTER 3. OPTICAL PROPERTIES
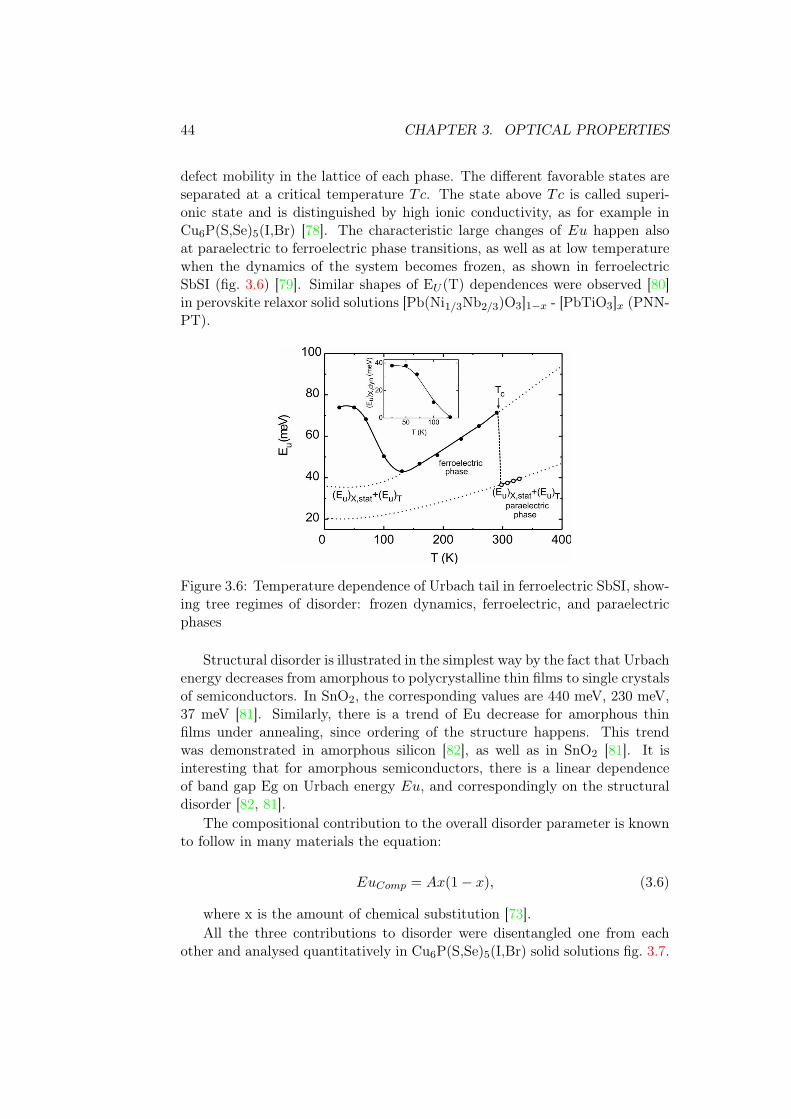
defect mobility in the lattice of each phase. The different favorable states areseparated at a critical temperature Tc. The state above Tc is called superi-onic state and is distinguished by high ionic conductivity, as for example inCu6P(S,Se)5(I,Br) [78]. The characteristic large changes of Eu happen alsoat paraelectric to ferroelectric phase transitions, as well as at low temperaturewhen the dynamics of the system becomes frozen, as shown in ferroelectricSbSI (fig. 3.6) [79]. Similar shapes of EU (T) dependences were observed [80]in perovskite relaxor solid solutions [Pb(Ni1/3Nb2/3)O3]1−x - [PbTiO3]x (PNN-PT).
Figure 3.6: Temperature dependence of Urbach tail in ferroelectric SbSI, show-ing tree regimes of disorder: frozen dynamics, ferroelectric, and paraelectricphases
Structural disorder is illustrated in the simplest way by the fact that Urbachenergy decreases from amorphous to polycrystalline thin films to single crystalsof semiconductors. In SnO2, the corresponding values are 440 meV, 230 meV,37 meV [81]. Similarly, there is a trend of Eu decrease for amorphous thinfilms under annealing, since ordering of the structure happens. This trendwas demonstrated in amorphous silicon [82], as well as in SnO2 [81]. It isinteresting that for amorphous semiconductors, there is a linear dependenceof band gap Eg on Urbach energy Eu, and correspondingly on the structuraldisorder [82, 81].
The compositional contribution to the overall disorder parameter is knownto follow in many materials the equation:
EuComp = Ax(1− x), (3.6)
where x is the amount of chemical substitution [73].All the three contributions to disorder were disentangled one from each
other and analysed quantitatively in Cu6P(S,Se)5(I,Br) solid solutions fig. 3.7.
3.3. CHEMICAL DISORDER-DRIVEN ABSORPTION EDGE 45
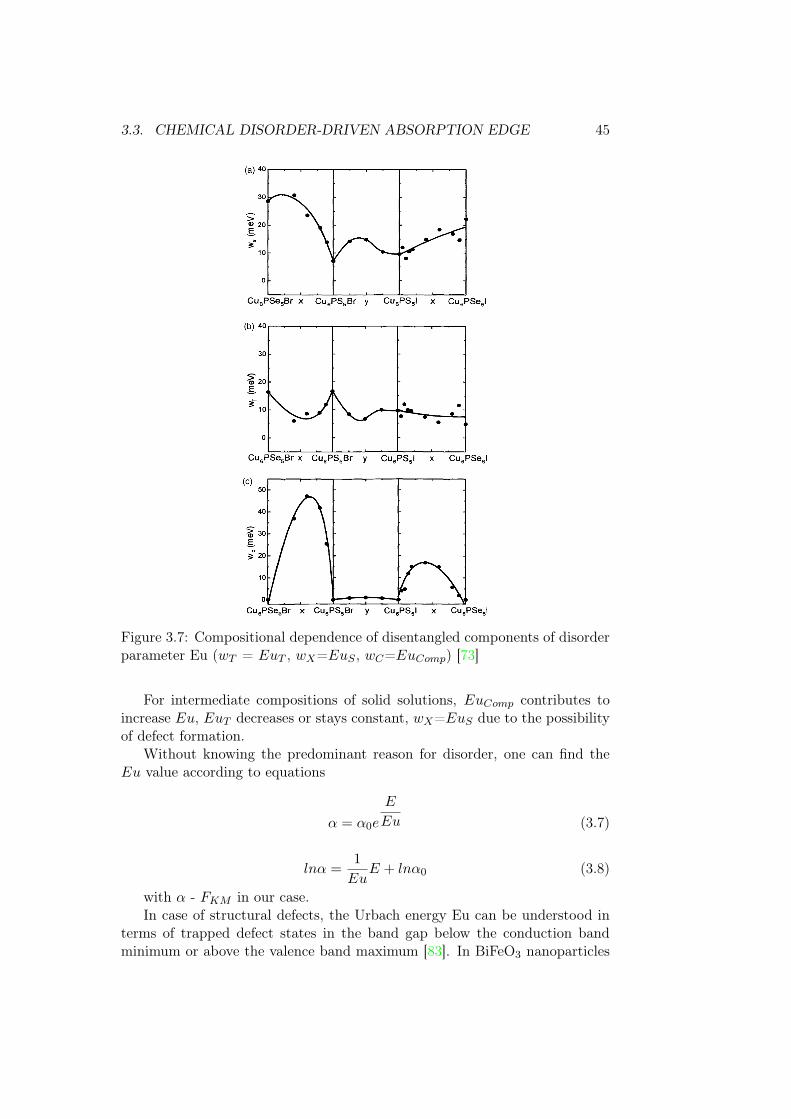
Figure 3.7: Compositional dependence of disentangled components of disorderparameter Eu (wT = EuT , wX=EuS , wC=EuComp) [73]
For intermediate compositions of solid solutions, EuComp contributes toincrease Eu, EuT decreases or stays constant, wX=EuS due to the possibilityof defect formation.
Without knowing the predominant reason for disorder, one can find theEu value according to equations
α = α0e
E
Eu (3.7)
lnα =1
EuE + lnα0 (3.8)
with α - FKM in our case.In case of structural defects, the Urbach energy Eu can be understood in
terms of trapped defect states in the band gap below the conduction bandminimum or above the valence band maximum [83]. In BiFeO3 nanoparticles

46 CHAPTER 3. OPTICAL PROPERTIES
[83] Eu describes the properties of the particle skin layer. As the size varies,the surface strain and the polarization state changes, the defect energy isshifted, so the Eu value is size-dependent. In addition, it should reflect thesample history, such as processing and annealing atmosphere which influencethe defect states.
3.3.2 Urbach tail width in Ba(Sn,Ti)O3 at 293 K
Figure 3.8 shows the Urbach plots. For both pure parent compounds, thereis a single linear region of the plot, with no absorption below. For intermediatecompositions, there is an additional shoulder at the lower-energy side. Thisshoulder is present for x(Sn)=0.1 to 0.6, and seems to disappear in x(Sn)>0.8.It is known that the presence of the second linear part of the Urbach plot canpoint at the coexistence of different phases or different types of disorder, atleast in BaTiO3 close to Tc [84]. However, here there is no clearly definedlinear region.
3 4
x(Sn):
0
0.1
0.2
0.4
0.5
0.6
0.8
0.9
1
ln(F
km
)
E, eV
x=0
x=1
Figure 3.8: Urbach-type plots for different Ba(Sn, Ti)O3 compositions
Whether this absorption comes from defect levels inside the band gap, orfrom coupling to more than one phonon due to multiple kinds of distortions

3.3. CHEMICAL DISORDER-DRIVEN ABSORPTION EDGE 47
in PNRs, needs more experimental proofs and discussion.
In fig. 3.9a the fitted Eu values definitely fall into two regimes of disorder.Inside both of them, the data can be fitted with eq. (3.6). The boundarycomposition between the two regimes, x(Sn)=0.8, is also separating the tworegimes for the band gap compositional dependence. Based on this,the bandgap evolution is definitely connected to different local environments of the B-site atoms. To stress this, we plot Eg against Eu in fig. 3.9b. As in casewith amorphous SnO2 and Si in the process of annealing, there is a linearcorrelation of the band gap to disorder within each of the two regimes separatedby x(Sn)=0.8.
-0.2 0.0 0.2 0.4 0.6 0.8 1.0 1.20.05
0.06
0.07
0.08
0.09
0.10
0.11
0.12
0.13
Eu,
eV
x(Sn)
b + ax+ ax2 (Ti percolation)
b + ax+ ax2 (Sn matrix)
(a)
0.05 0.06 0.07 0.08 0.09 0.10 0.11 0.123.1
3.2
3.3
3.4
3.5
3.6
3.7
BaSnO3
Eg
, eV
Eu, eV
BaTiO3
x(Sn)=0.8
(b)
Figure 3.9: Urbach tail width Eu in Ba(Sn,Ti)O3: (a) compositional depen-dence (b) coupling between disorder Eu and the bandgap Eg
Remarkably, the tangent is approximately the same for both regions (12.58and 13.37), and the Sn-rich region seems to be parallelly shifted towards thehigher disorder side. The reason is probably that the Sn matrix promotesthe formation of structures with a lot of defects, which is specific for BaSnO3
and which makes it a good protonic conductor at relatively low temperaturesT > 300 ◦ C [45, 85]. For both regions, the tangent is of opposite sign than inthe temperature-dependent plot on amorphous semiconductors. In that case,lower values of Eu correspond to higher annealing temperatures, less disorderand defects, so larger band gap. In our case, larger disorder Eu corresponds tolarger band gap Eg, demonstrating the clear connection between the two. Thereason is probably connected to the nature of the PNR and will be explainedlater on.

48 CHAPTER 3. OPTICAL PROPERTIES
3.4 Temperature evolution of band gap anddisorder-related absorption tail
3.4.1 BaTiO3
For BaTiO3, we are capable to deduce the non-linear temperature depen-dence the Tc for T-C phase transformation from Eg, and the correlation ofEu with the different structural transitions and dependence on powder samplepreparation.
The band gap of BaTiO3 (fig. 3.10a) has two linear regions, below 398 Kand above 550 K, which correspond to the pure tetragonal and cubic phases.In between, there is a non-linear region where the band gap decreases fast closeto Tc and slowly closer to 550 K.
200 300 400 500 600 700 800
3.0
3.1
3.2
3.3
3.4 1: powder
2: PVA-sintered
pellet + crashed
Eg,
eV
T, K
275 K
(a)
200 300 400 500 600 700 800
0.06
0.07
0.08
0.09
0.10
1: powder
2: PVA-sintered
pellet + crashed
Eu,
eV
T, K
(b)
Figure 3.10: Optical properties of BaTiO3 powders (straightly after solid statesynthesis and after sintering as a pellet with PVA and crashing: temperaturedependence of (a) band gap Eg (b) Urbach tail energy Eu (typical error barvalues are shown at lowest temperatures)
There is a difference between the curves for sample 1 and sample 2. Thelinear regions are more visible in sample 1, since sample 2 is obtained bycrashing the pellet and without the annealing to relax the possible mechanicalstrains. In sample 1, the change of Eg is ≈0.05 eV if taken in between thevalue at 300 K and the continuation of the linear fit of high-temperature data.
Because of different processing of sample 1 and 2, the curve for sample 2is not the same as the one for sample 1. Both Eg and the disorder Eu arehigher. Sample 2 was pressed into the pellet with the binding agent PVA andsintered at 1280◦C. As a result, the grain size could increase, the presence ofPVA could change the structure of the grain boundaries, the pressure couldintroduce the mechanical strain so that the domain structure and twin patternwould alternate. In addition, sample 2 was measured starting from lower
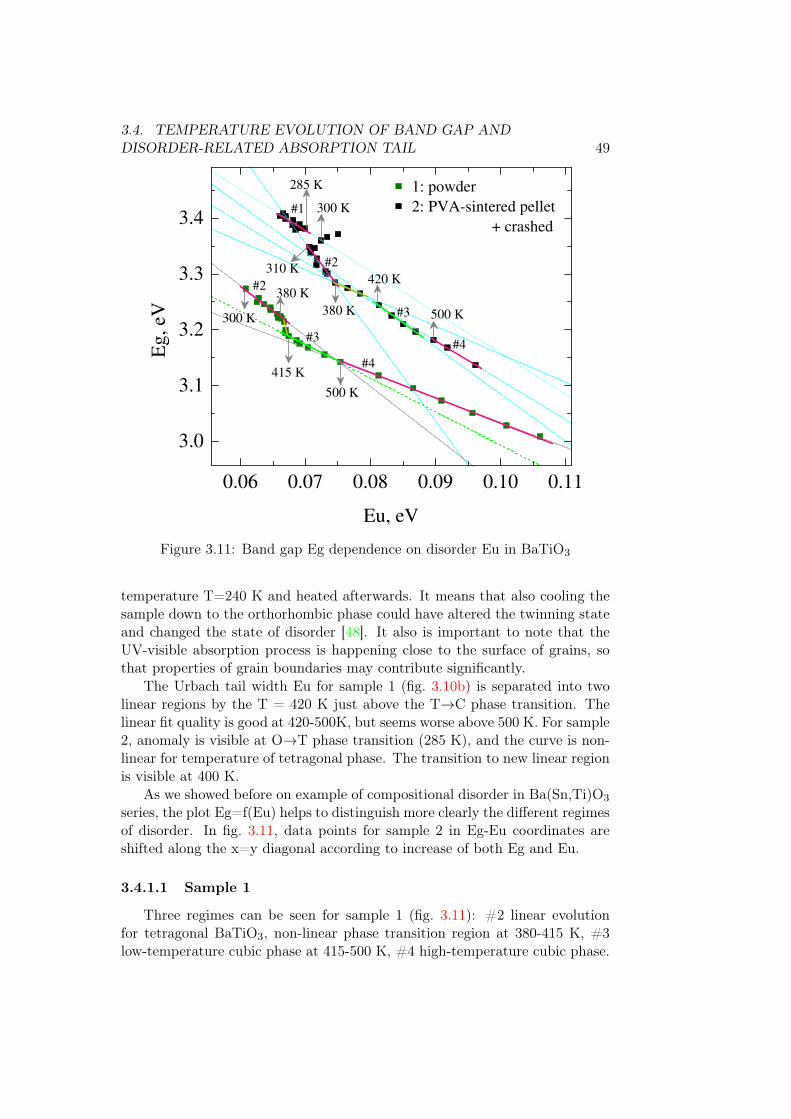
3.4. TEMPERATURE EVOLUTION OF BAND GAP ANDDISORDER-RELATED ABSORPTION TAIL 49
0.06 0.07 0.08 0.09 0.10 0.11
3.0
3.1
3.2
3.3
3.4
#2
#3
#4
380 K
380 K 500 K
#4
#3
#2
300 K
285 K
310 K
300 K
1: powder
2: PVA-sintered pellet
+ crashed
Eg
, eV
Eu, eV
415 K
500 K
420 K
#1
Figure 3.11: Band gap Eg dependence on disorder Eu in BaTiO3
temperature T=240 K and heated afterwards. It means that also cooling thesample down to the orthorhombic phase could have altered the twinning stateand changed the state of disorder [48]. It also is important to note that theUV-visible absorption process is happening close to the surface of grains, sothat properties of grain boundaries may contribute significantly.
The Urbach tail width Eu for sample 1 (fig. 3.10b) is separated into twolinear regions by the T = 420 K just above the T→C phase transition. Thelinear fit quality is good at 420-500K, but seems worse above 500 K. For sample2, anomaly is visible at O→T phase transition (285 K), and the curve is non-linear for temperature of tetragonal phase. The transition to new linear regionis visible at 400 K.
As we showed before on example of compositional disorder in Ba(Sn,Ti)O3
series, the plot Eg=f(Eu) helps to distinguish more clearly the different regimesof disorder. In fig. 3.11, data points for sample 2 in Eg-Eu coordinates areshifted along the x=y diagonal according to increase of both Eg and Eu.
3.4.1.1 Sample 1
Three regimes can be seen for sample 1 (fig. 3.11): #2 linear evolutionfor tetragonal BaTiO3, non-linear phase transition region at 380-415 K, #3low-temperature cubic phase at 415-500 K, #4 high-temperature cubic phase.
50 CHAPTER 3. OPTICAL PROPERTIES
Between regions #2 and #3, the band gap non-linear variation at thetetragonal to cubic phase transition was observed for BaTiO3 [86, 54, 74] andfor PbTiO3 [87]. The origin of non-linearity is not exhaustively explained.First possibility is that it is caused by the coexistence of multiple local ener-getically favorable states at the same energy, the proportion of one and anotherbeing time-dependent close to Tc [84]. A second possible reason is that theband gap change is related to a non-linear polarization change [87]. More indetail, there is a coupling between the polarization, phonon modes, and theband gap. Their relationship was studied in ref. [74], where the absorptionwas measured on single crystals under polarized light, with Eg‖ (band gapmeasured with light polarization parallel to the crystal polarization axis) be-ing higher than Eg⊥ (measured with light polarization perpendicular to thecrystal polarization axis). The separation between the two band gaps plottedagainst P 2 was shown not to disappear fully at the phase transition, but togradually linearly decrease above Tc [74]. It is proposed according to parallelstudy of Eu and Eg that both the valence band electrons and the conduc-tion band empty states can be possibly coupled both to crystal polarizationand polarization fluctuations in the cubic phase. Several works agree that thephonon participating in the process is most probably not the soft mode SlaterA1(TO1), but rather one of the LO phonons [74, 86], which have the wavevec-tors parallel to the polarization axis. Such phonons can change the chemicalbonding by modifying the dynamic hybridization between Ti and O orbitals[88].
The very important question is why we are able to detect two regimes(#3 and #4) by optical methods for a range of temperatures where there isa cubic phase. From studies by multiple methods it is well-known that evenabove Tc ≈400K in BaTiO3 there are some local polar correlations [89, 90].These correlations appear as chain-like tetragonal displacements in the columnof Ti-O-Ti [90]. The size of these correlation regions were determined bydifferent techniques as several unit cells (∼ 30 Å) [74]. Such regions shouldbe in principle similar by their dielectric response to relaxors. Despite thetemperature-dependent dielectric response of BaTiO3 showing no frequencydependence in Hz-MHz range, it was shown that a relaxation in THz range isfrequency-dependent [91, 92, 84]. The frequency values are close to the ones ofTi site hopping between eight rhombohedral directions, which is energeticallyfavorable for very short times in all BaTiO3 phases, including the cubic one[89].
Acoustic spectroscopy and resonant ultrasonic spectroscopy both showedthat in BaTiO3 there is a temperature above which the polar correlationsdisappear letting place to a purely cubic phase (T ∗ ≈550 K) [49, 48]. Moreover,in the range of temperatures between T ∗ and Tc one more critical temperatureT ′=500 K can be defined, which is limiting the dynamic polar correlations forT ′ < T < T ∗ and static polar chains for Tc < T < T ′. Most probably, T ′ canbe compared to Td from ref. [43].
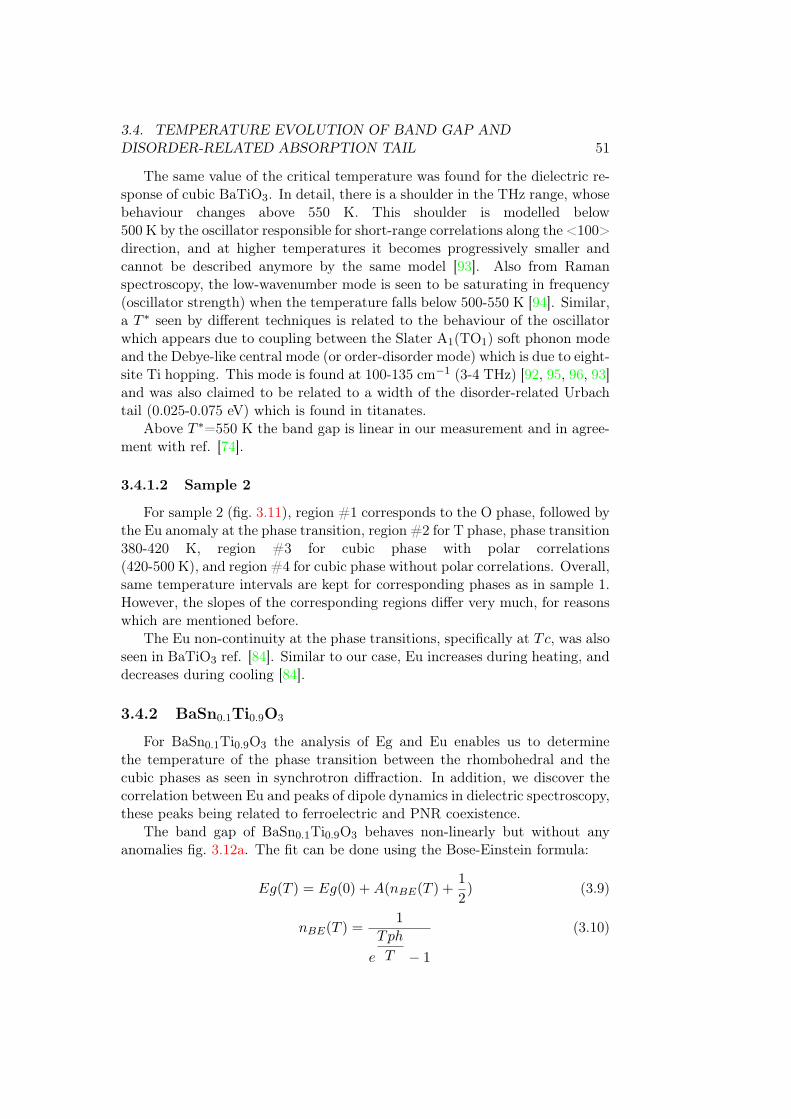
3.4. TEMPERATURE EVOLUTION OF BAND GAP ANDDISORDER-RELATED ABSORPTION TAIL 51
The same value of the critical temperature was found for the dielectric re-sponse of cubic BaTiO3. In detail, there is a shoulder in the THz range, whosebehaviour changes above 550 K. This shoulder is modelled below500 K by the oscillator responsible for short-range correlations along the <100>direction, and at higher temperatures it becomes progressively smaller andcannot be described anymore by the same model [93]. Also from Ramanspectroscopy, the low-wavenumber mode is seen to be saturating in frequency(oscillator strength) when the temperature falls below 500-550 K [94]. Similar,a T ∗ seen by different techniques is related to the behaviour of the oscillatorwhich appears due to coupling between the Slater A1(TO1) soft phonon modeand the Debye-like central mode (or order-disorder mode) which is due to eight-site Ti hopping. This mode is found at 100-135 cm−1 (3-4 THz) [92, 95, 96, 93]and was also claimed to be related to a width of the disorder-related Urbachtail (0.025-0.075 eV) which is found in titanates.
Above T ∗=550 K the band gap is linear in our measurement and in agree-ment with ref. [74].
3.4.1.2 Sample 2
For sample 2 (fig. 3.11), region #1 corresponds to the O phase, followed bythe Eu anomaly at the phase transition, region #2 for T phase, phase transition380-420 K, region #3 for cubic phase with polar correlations(420-500 K), and region #4 for cubic phase without polar correlations. Overall,same temperature intervals are kept for corresponding phases as in sample 1.However, the slopes of the corresponding regions differ very much, for reasonswhich are mentioned before.
The Eu non-continuity at the phase transitions, specifically at Tc, was alsoseen in BaTiO3 ref. [84]. Similar to our case, Eu increases during heating, anddecreases during cooling [84].
3.4.2 BaSn0.1Ti0.9O3
For BaSn0.1Ti0.9O3 the analysis of Eg and Eu enables us to determinethe temperature of the phase transition between the rhombohedral and thecubic phases as seen in synchrotron diffraction. In addition, we discover thecorrelation between Eu and peaks of dipole dynamics in dielectric spectroscopy,these peaks being related to ferroelectric and PNR coexistence.
The band gap of BaSn0.1Ti0.9O3 behaves non-linearly but without anyanomalies fig. 3.12a. The fit can be done using the Bose-Einstein formula:
Eg(T ) = Eg(0) +A(nBE(T ) +1
2) (3.9)
nBE(T ) =1
e
Tph
T − 1
(3.10)
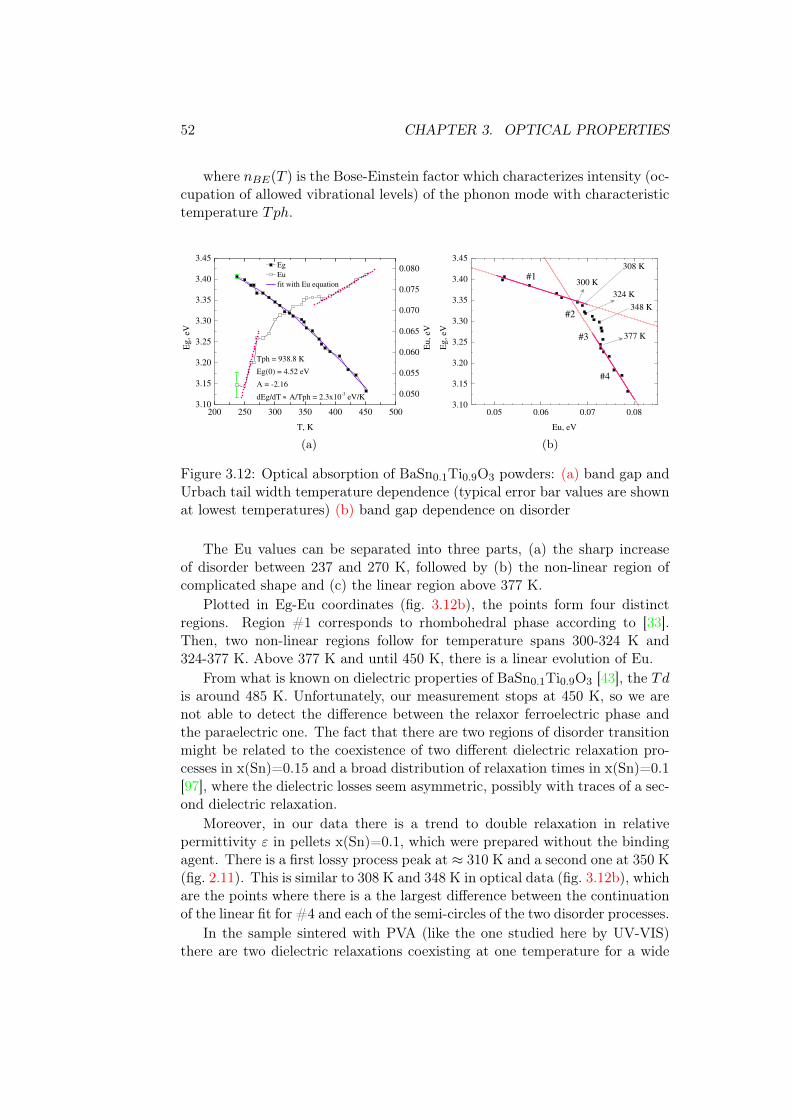
52 CHAPTER 3. OPTICAL PROPERTIES
where nBE(T ) is the Bose-Einstein factor which characterizes intensity (oc-cupation of allowed vibrational levels) of the phonon mode with characteristictemperature Tph.
200 250 300 350 400 450 5003.10
3.15
3.20
3.25
3.30
3.35
3.40
3.45 Eg
Eu
fit with Eu equation
Eg
, eV
T, K
Tph = 938.8 K
Eg(0) = 4.52 eV
A = -2.16
dEg/dT � A/Tph = 2.3x10⁻³
eV/K 0.050
0.055
0.060
0.065
0.070
0.075
0.080
Eu
, eV
(a)
0.05 0.06 0.07 0.083.10
3.15
3.20
3.25
3.30
3.35
3.40
3.45
348 K
308 K
377 K
#4
#3
#2
324 K
Eg
, eV
Eu, eV
300 K#1
(b)
Figure 3.12: Optical absorption of BaSn0.1Ti0.9O3 powders: (a) band gap andUrbach tail width temperature dependence (typical error bar values are shownat lowest temperatures) (b) band gap dependence on disorder
The Eu values can be separated into three parts, (a) the sharp increaseof disorder between 237 and 270 K, followed by (b) the non-linear region ofcomplicated shape and (c) the linear region above 377 K.
Plotted in Eg-Eu coordinates (fig. 3.12b), the points form four distinctregions. Region #1 corresponds to rhombohedral phase according to [33].Then, two non-linear regions follow for temperature spans 300-324 K and324-377 K. Above 377 K and until 450 K, there is a linear evolution of Eu.
From what is known on dielectric properties of BaSn0.1Ti0.9O3 [43], the Tdis around 485 K. Unfortunately, our measurement stops at 450 K, so we arenot able to detect the difference between the relaxor ferroelectric phase andthe paraelectric one. The fact that there are two regions of disorder transitionmight be related to the coexistence of two different dielectric relaxation pro-cesses in x(Sn)=0.15 and a broad distribution of relaxation times in x(Sn)=0.1[97], where the dielectric losses seem asymmetric, possibly with traces of a sec-ond dielectric relaxation.
Moreover, in our data there is a trend to double relaxation in relativepermittivity ε in pellets x(Sn)=0.1, which were prepared without the bindingagent. There is a first lossy process peak at ≈ 310 K and a second one at 350 K(fig. 2.11). This is similar to 308 K and 348 K in optical data (fig. 3.12b), whichare the points where there is a the largest difference between the continuationof the linear fit for #4 and each of the semi-circles of the two disorder processes.
In the sample sintered with PVA (like the one studied here by UV-VIS)there are two dielectric relaxations coexisting at one temperature for a wide

3.4. TEMPERATURE EVOLUTION OF BAND GAP ANDDISORDER-RELATED ABSORPTION TAIL 53
range of measurements, first peaking at 300 K and second at 315 K fig. 2.11.The optical measurement results have critical points closer to the sample
sintered without PVA, likely because the powder was previously annealed at500◦C. Thus, both the powder in optic measurements and the porous pelletin dielectric setup have the grain boundaries more exposed to the atmosphereunder heating, which could change the defect concentrations. The differencein temperature between the maxima of relaxation intensity is slightly larger inthese two samples, which means that the separation in temperature betweenthe two relaxations might depend on defect densities, for instance VO con-centration. Turning back to the dielectric spectroscopy results of Chapter 1,the two relaxations in 0.1<x(Sn)<0.175 represent [44] ferroelectric and PNRcontributions.
3.4.3 BaSn0.2Ti0.8O3
For this composition, we are able to detect multiple transition temper-atures, which correspond to critical temperatures of polar correlations fromdielectric spectroscopy [43].
For x(Sn)=0.2 both Eg and Eu have an anomaly close to 260-270 K fig. 3.13. The degree of disorder decreases, and starts to increase again further. Sametrend is visible for the band gap. Further, Eg decreases monotonously up tothe kink at 552-570 K. The Eu has additional change of slope at 324 K, and akink close to 493-500 K.
200 300 400 500 600
3.15
3.20
3.25
3.30
3.35
3.40
3.45
3.50 Eg
Eu
260 K
Eg
, eV
T, K
0.06
0.08
0.10
0.12
0.14
480 K
493 K
324 K
Eu
, eV
270 K
(a)
0.06 0.07 0.08 0.09 0.10 0.11 0.12 0.133.15
3.20
3.25
3.30
3.35
3.40
3.45
3.50
540 K
493 K
Eg
, eV
Eu, eV
510 K
0.06 0.07 0.08 0.093.42
3.43
3.44
3.45
3.46
3.47
3.48
3.49
260 K
275 K
(b)
Figure 3.13: Optical absorption of BaSn0.2Ti0.8O3: (b) temperature depen-dence of Eg and Eu (typical error bar is shown in green for lowest temperature)(b) dependence of Eg on Eu
In the inset of fig. 3.13, first the band gap decreases as disorder decreasesuntil 260 K, then the disorder continues to decrease but the band gap showsopposite trend, and finally, starting from 275 K, the band gap decreases as

54 CHAPTER 3. OPTICAL PROPERTIES
disorder increases, which is a standard behavior for semiconductors [81, 82].The high-temperature transition is illustrated better in fig. 3.13b, because therange of transition itself can be determined as 510-540 K.
To compare with dielectric spectroscopy data, in the porous pellet themaximum intensity of low-frequency relaxation is 260 K (and 210 K for thehigh-frequency one, which is out of range of optical measurement). If comparedto dielectric spectroscopy data from [43], 260 K is close to both Tm and TV F .
At 275 K there is TQ, where the1
εat T > Tm starts to deviate from a
quadratic dependence on temperature and the transition to Curie-Weiss lawbegins. The point 324 K is close to a characteristic temperature TCW (ideally,315 K) above which the Curie-Weiss law fits the data [43] fig. 3.13. The pointsof 293 K and the process 510-540 K might be related the disappearance ofstatic PNR (Td=485 K in [43]) and to the disappearance of dynamic polarcorrelations.
3.4.4 BaSn0.5Ti0.5O3
For this composition, the band gap appears to decrease linearly on tem-perature fig. 3.14a. The Urbach tail width increases with three linear regions:below 420 K, 420-520 K, 520-610 K, and above this temperature. Accordingto band gap linearity throughout the temperature span of measurement, nonew critical points appear in the plot of fig. 3.14b.
300 400 500 600 700 8003.20
3.25
3.30
3.35
3.40
3.45
3.50
3.55
T, K
Eg
, eV
0.07
0.08
0.09
0.10
0.11
0.12
0.13
Eu
, eV
(a)
0.08 0.09 0.10 0.11 0.12
3.3
3.4
3.5
Eg
, eV
Eu, eV
(b)
Figure 3.14: Optical absorption of BaSn0.5Ti0.5O3: (a) temperature depen-dence of Eg and Eu (typical error bar values are shown at lowest temperatures)(b) dependence of Eg on Eu

3.4. TEMPERATURE EVOLUTION OF BAND GAP ANDDISORDER-RELATED ABSORPTION TAIL 55
3.4.5 BaSnO3
The band gaps of both BaSnO3 samples shown in fig. 3.15a do not showany considerable non-linearities. Between the two samples, the rate of decreaseover the temperature is different. This difference is more pronounced than intwo samples of BaTiO3. Probably, in BaSnO3 the defect disorder plays amuch more important role for the properties than in BaTiO3, or the defectconcentrations are higher at the same conditions. Indeed, BaSnO3 tends to bea good ionic conductor due to high concentrations of defects [29]. It’s electronicconductivity is mainly controlled by defect-related mechanisms [98, 99].
300 400 500 600 700 800 900
2.8
2.9
3.0
3.1
3.2 sample 1: powder (first heating)
sample 1 (cooling)
sample 2: PVA-sintered pellet,
grind+anneal
Eg
, eV
T, K
(a)
200 300 400 500 600 700 800 900 10000.05
0.06
0.07
0.08
0.09
0.10
0.11
0.12 sample 1 (first heating)
sample 1 (cooling)
sample 2 (PVA)
360 K
480 K
580 K
Eu
, eV
T, K
820 K
(b)
Figure 3.15: Optical absorption of two BaSnO3 samples: (a) temperaturedependence of Eg and (b) of Eu (typical error bar values are shown at lowesttemperatures)
The Eu dependence on temperature is shown in fig. 3.15b. The plots donot coincide for the two samples. Nevertheless, despite the average slope ofevolution is similar starting from above 360 K. It is however evident that thedata cannot be fitted by a linear dependence, since there are some small non-linear variations superimposed. Moreover, there seem to be unexpected largenon-linearities at temperatures below 360 K for both samples, but neverthelessappearing different in the plot of fig. 3.15b.
To clarify this behavior, we plot the band gap dependence on disorder infig. 3.16. In the close-up on the right of fig. 3.16, it is visible that around300 K sample 1 does not behave in a similar way on heating and cooling,probably because it gets oxidized or reduced during heating, or there is arearrangement of defect structure. In fact, both cooling during the processingof the sample and heating during this measurement is done in air, but the lattertakes twice longer time and could act as annealing. The similarity betweenfirst heating for sample 1 and 2 is that both of them seem to change regimeat 295-300 K. In fact, in both dielectric measurements of [29] and [100] there

56 CHAPTER 3. OPTICAL PROPERTIES
seem to be some slight anomaly around 300 K and 324 K.
0.05 0.06 0.07 0.08 0.09 0.10 0.11
2.8
2.9
3.0
3.1
3.2
600 K
480 K
400-420 K
360 K
sample 1: heating
sample 1: cooling
sample 2 (PVA): heating
Eg
, eV
Eu, eV
580 K
820 K
360 K
295 K
480 K
700 K
295 K
0.06 0.07
3.15
3.20
3.25 300 K
300 K320 K
340 K
Figure 3.16: The Eg - Eu plot for the two BaSnO3 samples
Further, in our fig. 3.16 there seems to be an inflection point at 360 K.This is very close to 375 K, where the change of slope in dielectric data wasnoticed in [100]. At the same temperature, the mass loss was detected in [101]and was tentatively ascribed to evaporation of physisorbed water.
Next, in our data there is a change of slope at 480 K. This probably cor-responds to the end of the mentioned mass loss at 473 K in [101]. Moreover,in [100], at 460 K there is an end of linear region of dielectric spectrum withthe following strong non-linear increase of ε.
The following change of slope in our fig. 3.16 is at 580 K. In [45] the de-crease of n-type conductivity starts at this temperature, apparently caused bythe beginning of oxidation in their oxygen-deficient sample which was previ-ously quenched from 1773 K. To add to the mentioned reference, in [100] thedielectric constant decrease finishes, giving place to a horizontal plateau.
The change of slope of our plot at 700 K could correspond to the beginningof mass loss of multiple carbon species in ref. [101]. Otherwise, 650-670 K isthe temperature where the oxidation of oxygen-deficient BaSnO3 finishes, andthe conductivity starts to increase again [45]. It is a question whether theprocess of oxygenation at the surface compensates the dangling bonds whichare otherwise taken by carbon, and therefore the two processes are related.
There is a non-linear evolution of our plot until 820 K, and a new linear re-gion starts after that. Despite we have no suggestions for the possible reasons,this change is not unexpected, because the mass loss which starts at around670 K does not stop before 1173 K according to ref. [101]. In addition, as men-tioned, high temperature activates the process of oxygen loss which intensifieswith temperature increase [45].

3.4. TEMPERATURE EVOLUTION OF BAND GAP ANDDISORDER-RELATED ABSORPTION TAIL 57
As for sample 2, the critical points at 300 K, 360 K, 480 K, and the slightdeviation at 600 K coincide with those ones in sample 1. The further charac-teristic temperatures cannot be verified since 600 K is the upper limit of theexperimental temperature range.
Conclusions
The optical absorption was measured on BaSnxTi1−xO3 powders byUV-visible-NIR absorption spectroscopy.
According to the shape of the measured spectra, the Eg levels of Sn andTi exist separately, but the lower-energy levels cannot be distinguished,so probably they hybridize together. Despite the fact that the band gapsof BaTiO3 and BaSnO3 are very similar, the band gap increases untilx(Sn)=0.8 by more than 0.35 eV, and then decreases. Since the bandgap Eg plotted against Urbach energy Eu shows two separate regions aswell, we deduce that the disorder should be responsible for the band gapincrease. Moreover, there is a low-energy shoulder on the Urbach plot incompositions x(Sn)=0.1...0.6 which is probably due to some componentsof disorder.
We also studied the optical properties of some compositions in tem-perature. From complementary plots Eg=f(T) and Eg=f(Eu) the phasetransition temperatures can be extracted, as well as the changes of thedisorder state in a wider range around the phase transitions in ferroelec-tric and relaxor compositions (fig. 3.17). The T of phase transitions andthe Td agree well with XRD and TCW . For x(Sn)=0.1, there are two dis-order states existing in the region of diffuse phase transition, one relatedto process happening below Tm, and the second one - up to TCW . Forx(Sn)=0.2, two characteristic temperatures are also visible, and the Tdis confirmed. For BaSnO3, the temperature points in fig. 3.17 character-ize the changes of defect state. As for x(Sn)=0.5, unfortunately we arenot able to make any hypothesis because of the non-coinciding tempera-ture ranges of previous experiments. A deeper insight would need moreexperiments.
58 CHAPTER 3. OPTICAL PROPERTIES
0.0 0.2 0.4 0.6 0.8 1.00
100
200
300
400
500
600
700
800
T (XRD)
Td
TCW
Tm (1 MHz)
TVF
Tx
Cri
tica
l te
mp
erat
ure
s, K
x(Sn)
optic
Figure 3.17: The combined plot with characteristic temperatures from dielec-tric, XRD, and optical characterization
Chapter 4
Chemical bonding at the atomiclevel
4.1 Methods and review
4.1.1 Raman spectroscopy
4.1.1.1 Introduction
This chapter presents the results of two spectroscopic techniques, Ramanspectroscopy and X-ray photoelectron spectroscopy. These techniques allow toanalyse local properties of matter. Raman spectroscopy, applied to crystallinematerials, allows recording a phononic fingerprint of the material under study,which can lead to getting information of interatomic force constants, poten-tials, and local structure anisotropy. Only the phonon modes which cause thepolarization of electronic clouds are active in Raman, or in other words thosemodes which cause the dynamic contribution to atomic charges. We make thebridge to X-ray photoelectron spectroscopy, since this technique also permitsto qualitatively compare the atomic charges between different materials. Usingthese two techniques, we are interested to shine some light on the local chem-ical binding in BaSnxTi1−xO3 compounds in connection to the local (static ordynamic) unit cell distortions.
In Raman spectroscopy, the sample probe is the monochromatic light of alaser. The photons can be inelastically scattered with the creation or absorp-tion of a phonon vibration (Stokes process when the scattered photon has lessenergy than the incident, or Anti-Stokes processes when the scattered photonhas more energy than the incident one), the former ones being measured in thepresent experiments. The scattered phonon, whose energy (wavelength λs) isdifferent from the initial one (wavelength λi), has the Raman shift (wavenum-ber) of | 1/λi−1/λs |, which is used as abscissa in Raman spectroscopy spectrarepresentation.
For a phonon to be active in Raman, it should be characterized by a po-
59

60 CHAPTER 4. CHEMICAL BONDING AT THE ATOMIC LEVEL
Figure 4.1: Raman spectrum of BaTiO3 ceramics with different grain sizes, asindicated
larization of electronic clouds P as follows:
~P = α · ~E (4.1)
with α - tensor of electronic polarizability, and E - electromagnetic field.Only optical phonons are detected. They are separated into longitudinal (LO)or transverse (TO) modes. In LO phonons, the dipole moment is inducedparallel to the propagation direction of the mode, and in TO - perpendicularto it fig. 4.2. The interaction with the induced dipole moment causes thesplitting of TO and LO modes in energy.
Figure 4.2: Sketch of the difference between TO and LO phonons, the arrowsindicate the amplitude of vibration, horizontal lines indicate the propagationdirection (time axis)
In ABO3 perovskites, the modes can involve the vibration of different com-binations of atoms fig. 4.3. The type of mode determines the index n in themode name (LOn or TOn). The longitudinal Slater and Axe modes (LO1 and

4.1. METHODS AND REVIEW 61
LO3) are connected with the interaction of B-O and B-B pairs, and determinethe effective dynamic charges of these atoms. In this way these modes are con-nected to the short-range and long-range interactions and play an importantrole in ferroelectricity.
Figure 4.3: The classification of phonons in perovkites [95] depending on theinvolved atoms: (a) Slater n=1 (b) Last n=2 (c) Axe n=3 (d) O4 torsionalmode, n=4
4.1.1.2 BaTiO3
The TO1 mode, especially its component E(TO1) at low wavenumbers(10-50 cm−1) [102, 103], is very important to the phase transitions of BaTiO3.It is a so-called soft mode, whose frequency tends to zero at fully displacivephase transitions. To the contrary, in BaTiO3 this mode never comes to zero atany phase transition [94], because an order-disorder component is also involved[92]. The order-disorder contribution to the phase transition is observed fromdielectric experiments. Such mode arises from the hopping of Ti betweenthe eight ground sites where it lies along the <111> directions of the unit cell[89, 92]. This mode is also called a central mode [48]. As shown in fig. 4.4a, thetriple degenerate modes soften (decrease in frequency) at each phase transition,and then reappear between 200 and 300 cm−1.
It is claimed that at every phase transition on cooling certain degrees offreedom of Ti hopping are frozen, so the coupling between some components

62 CHAPTER 4. CHEMICAL BONDING AT THE ATOMIC LEVEL
(a)
100 150 200 250
C
wavenumber, cm-1
T
O
R
(b)
Figure 4.4: The soft mode in BaTiO3 (a) from neutron scattering [94], (b) inRaman spectroscopy (our data)
of soft mode and the central mode is broken. In the rhombohedral phaseof BaTiO3, the low-frequency Raman intensity coming from the soft modedisappears and shifts to the 200-300 cm−1 region (fig. 4.4).
The spectrum of BaTiO3 consists of three major groups of peaks (table 4.1)which lie below 450 cm−1, between 450 and 600 cm−1, and 700-800 cm−1 (seefig. 4.10).
The low-frequency region is dominated by wide and dampened soft andcentral modes. Another wide mode A1(TO1) strongly influences the shape ofthe spectra in the 270 cm−1 region.
In between those two wide modes, the spectrum is determined by the cou-pling of multiple modes which form the antiresonance (Breit-Wigner interfer-ence) in phases with unit cell distortions [107]. Ref. [108, 105, 109] claimsthere is a coupling of these modes with disorder, or with polaritons. In thelatter case, the coupling with polaritons is studied for modes propagating at
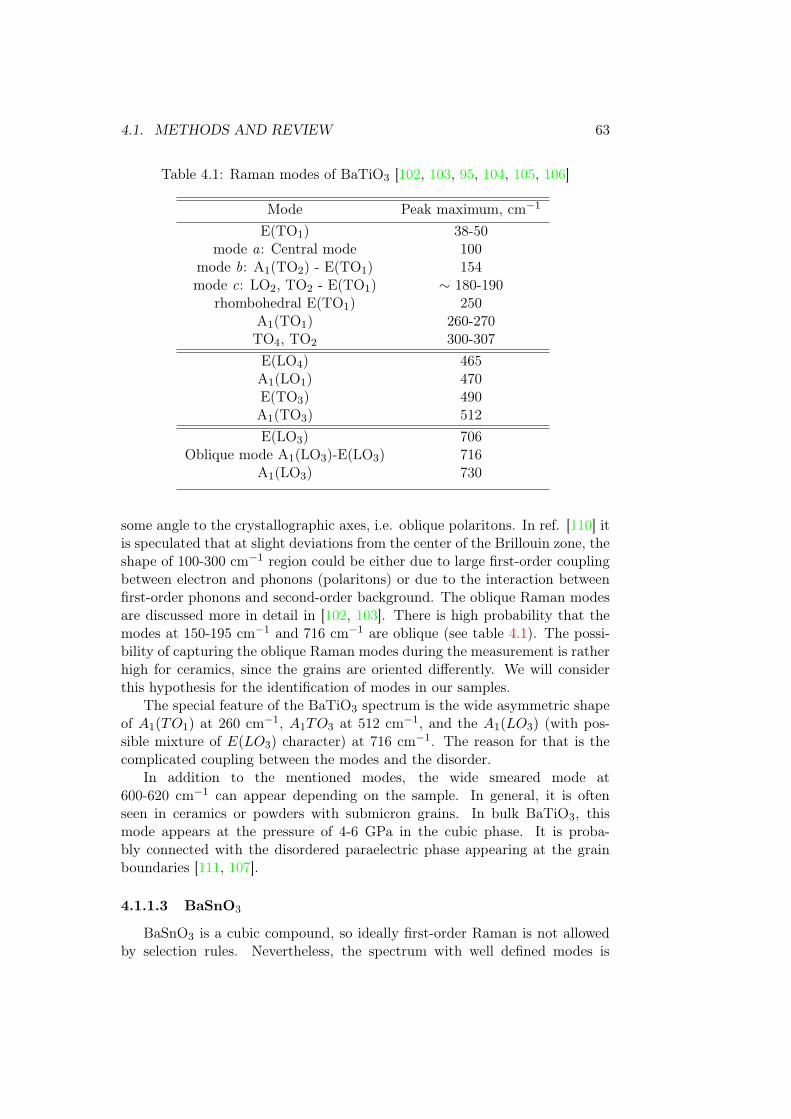
4.1. METHODS AND REVIEW 63
Table 4.1: Raman modes of BaTiO3 [102, 103, 95, 104, 105, 106]
Mode Peak maximum, cm−1
E(TO1) 38-50mode a: Central mode 100
mode b: A1(TO2) - E(TO1) 154mode c: LO2, TO2 - E(TO1) ∼ 180-190
rhombohedral E(TO1) 250A1(TO1) 260-270TO4, TO2 300-307
E(LO4) 465A1(LO1) 470E(TO3) 490A1(TO3) 512
E(LO3) 706Oblique mode A1(LO3)-E(LO3) 716
A1(LO3) 730
some angle to the crystallographic axes, i.e. oblique polaritons. In ref. [110] itis speculated that at slight deviations from the center of the Brillouin zone, theshape of 100-300 cm−1 region could be either due to large first-order couplingbetween electron and phonons (polaritons) or due to the interaction betweenfirst-order phonons and second-order background. The oblique Raman modesare discussed more in detail in [102, 103]. There is high probability that themodes at 150-195 cm−1 and 716 cm−1 are oblique (see table 4.1). The possi-bility of capturing the oblique Raman modes during the measurement is ratherhigh for ceramics, since the grains are oriented differently. We will considerthis hypothesis for the identification of modes in our samples.
The special feature of the BaTiO3 spectrum is the wide asymmetric shapeof A1(TO1) at 260 cm−1, A1TO3 at 512 cm−1, and the A1(LO3) (with pos-sible mixture of E(LO3) character) at 716 cm−1. The reason for that is thecomplicated coupling between the modes and the disorder.
In addition to the mentioned modes, the wide smeared mode at600-620 cm−1 can appear depending on the sample. In general, it is oftenseen in ceramics or powders with submicron grains. In bulk BaTiO3, thismode appears at the pressure of 4-6 GPa in the cubic phase. It is proba-bly connected with the disordered paraelectric phase appearing at the grainboundaries [111, 107].
4.1.1.3 BaSnO3
BaSnO3 is a cubic compound, so ideally first-order Raman is not allowedby selection rules. Nevertheless, the spectrum with well defined modes is
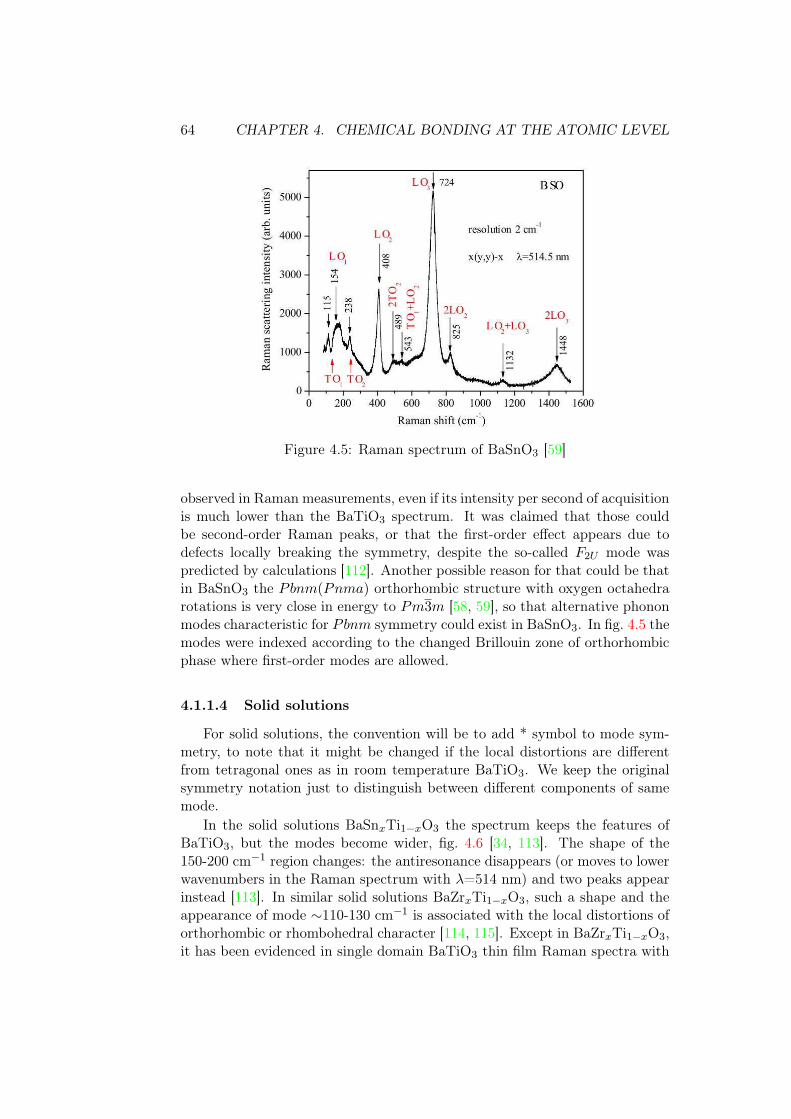
64 CHAPTER 4. CHEMICAL BONDING AT THE ATOMIC LEVEL
Figure 4.5: Raman spectrum of BaSnO3 [59]
observed in Raman measurements, even if its intensity per second of acquisitionis much lower than the BaTiO3 spectrum. It was claimed that those couldbe second-order Raman peaks, or that the first-order effect appears due todefects locally breaking the symmetry, despite the so-called F2U mode waspredicted by calculations [112]. Another possible reason for that could be thatin BaSnO3 the Pbnm(Pnma) orthorhombic structure with oxygen octahedrarotations is very close in energy to Pm3m [58, 59], so that alternative phononmodes characteristic for Pbnm symmetry could exist in BaSnO3. In fig. 4.5 themodes were indexed according to the changed Brillouin zone of orthorhombicphase where first-order modes are allowed.
4.1.1.4 Solid solutions
For solid solutions, the convention will be to add * symbol to mode sym-metry, to note that it might be changed if the local distortions are differentfrom tetragonal ones as in room temperature BaTiO3. We keep the originalsymmetry notation just to distinguish between different components of samemode.
In the solid solutions BaSnxTi1−xO3 the spectrum keeps the features ofBaTiO3, but the modes become wider, fig. 4.6 [34, 113]. The shape of the150-200 cm−1 region changes: the antiresonance disappears (or moves to lowerwavenumbers in the Raman spectrum with λ=514 nm) and two peaks appearinstead [113]. In similar solid solutions BaZrxTi1−xO3, such a shape and theappearance of mode ∼110-130 cm−1 is associated with the local distortions oforthorhombic or rhombohedral character [114, 115]. Except in BaZrxTi1−xO3,it has been evidenced in single domain BaTiO3 thin film Raman spectra with

4.1. METHODS AND REVIEW 65
rhombohedral nanoregions [116], disordered solid solutions (Ba,Sr)TiO3 [117],amorphous BaTiO3 [118], and is proved to be a component of A1(TO1) modecoupled with Debye mode (Ti hopping) [119, 92]. As well, this mode is sug-gested to be of Slater character according to the frequency and the mass ratioof Zr/Ti [114].
Figure 4.6: Raman spectra of BaSnxTi1−xO3 with x(Sn)=0.3 [113]
The temperature studies of the A∗1TO3 peak in x(Sn)=0.3 showed that from
Raman spectroscopy it is possible to find (from the presence of several linearregions in peak centers and the integrated intensity) the sequence of relaxorphases and the critical temperatures of phase transitions. The phase sequenceis slightly different from the one obtained by dielectric spectroscopy in [43]. It isproposed that the phases (in the order of temperature increase) are non-ergodicrelaxor, 100 K<T<200 K mature ergodic phase, 200 K<T<450 K ergodic polarcluster phase, T>450 K paraelectric phase fig. 4.7. In dielectric spectroscopy,no differentiation between mature ergodic phase and polar cluster phase wasmade.
In this chapter we are discussing the Raman data on other compositionsof BaSnxTi1−xO3 in the same frame, making references to other chapters.
4.1.1.5 Experimental details
The micro Raman spectra were acquired from ceramic pellets to reproduceXPS data using a Labram-Horiba spectrometer with He-Ne laser (632.8 nm)through an optical microscope and typically using 50X objective. Fityk soft-ware was used for fitting. For enhanced comparison of BaTiO3 features withour solid solutions, BaTiO3 sample was measured at temperatures 100-700 K

66 CHAPTER 4. CHEMICAL BONDING AT THE ATOMIC LEVEL
and fitted within the same procedure after correction for Bose-Einstein popu-lation factor. We used the mathematical correction by negative Gaussian peakfor the antiresonance in the 180 cm−1 region.
4.1.2 X-ray photoelectron spectroscopy
In laboratory based X-ray photoelectron spectroscopy, the monochroma-tized X-ray beam, generated with an X-ray source (typically aluminium), illu-minates and is absorbed by the material. The transition to the ground stateis accompanied by different desexcitation events, among others the generationof electrons (so called photoemitted electrons) fig. 4.8.
The hemispherical analyser with potential applied to it is used to separatethe photoelectrons by their kinetic energy K.E. The binding energy B.E. isthen recalculated as follows:
B.E. = hνXR −K.E.− φsp (4.2)
with hνXR - energy of X-ray, φsp - potential of spectrometer. Normally, thesample is electrically grounded, and the calibration is made with a standard, sothat the potential of the spectrometer does not contribute to the peak positionand the Fermi level is at the zero binding energy (see the red arrow in fig. 4.8b).By convention, the scale is normally inverted with "zero" on the right. If thevalue of the electronic level energy is small, the hνXR is enough to excite theelectron to the Fermi level or to the vacuum level energy. The deeper in energyis the core level, the less will be the kinetic energy of the electron, larger thanthe B.E..
The semiconductor valence band (VB) appears in the spectrum at someenergy below the Fermi level, and at some distance from the VB there are peakscorresponding to core levels or Auger processes which will not be discussedhere.
4.1.2.1 Measurement details and framework of analysis
Because the electrons are extracted from the sample, it needs to be notonly grounded but also well-conductive, otherwise it charges positively, and thepeak positions and shape change. If a sample with low conductivity has to bestudied, as it is the case in our work, it is possible to compensate the chargingby using an electron gun. The intensity of the electron flow is chosen to shiftthe peak of the surface carbon C 1s close to its usual position, nevertheless theabsolute values of the peak positions and the valence band maximum cannotbe trusted because C 1s binding energy can be influenced by different interfacecharge distribution phenomena and C is not part of the perovskite unit cell.
In our study, we want to make the comparative qualitative analysis of thepeaks. Since the absolute position is not available, we take the differencebetween the Ba 3d 5/2 and other levels, since Ba is present in all the samples

4.1. METHODS AND REVIEW 67
and is supposed to be least influenced by Ti substitution fig. 4.9. One of thereasons is that the Born charge of Ba in BaTiO3 and BaSnO3 was calculatedto be very close (+2.73 in and +2.74) [88, 120]. Note that we can distinguishcontributions to Ba 3d 5/2 peak from the bulk and surface carbonates.
It is clear that in a first approach in XPS the closest electronic levels tothe nucleus have larger value of binding energy. Outer orbitals have smallervalue of B.E., because the Coulomb interaction between them and the nu-cleus is screened by electrons from deeper levels. For the same bond betweenmetal atom and oxygen M-O, metal M electronic levels which are less oxi-dized/equivalently, more reduced are shifted to the smaller B.E. values. Inour case, cannot evaluate the absolute values of B.E. as there is no absoluteFermi edge allowing us to define the energy reference. On the other hand, weanalyse the B.E. difference between Ba 3d 5/2 (with its B.E. fixed accordingto calibration) and core levels of other atoms. Therefore the value of this dif-ference will account for different atomic and electronic factors, including theaverage charge of the metal ion M and the bond length itself. In this work inBa-perovskites, we consider the Ba 3d 5/2 B.E. level as constant. In additionto changes of valence state, the more intricate chemical shift could come fromthe property of the bond itself, such as the degree at which the electrons arelocalized at the atoms, or the covalency/ionicity of the bond:
∆B.E.(3d) = −∆ǫ−∆EXPSrelaxation(3d) (4.3)
with ǫ - the variation of Koopman’s energy (energy of monoelectronic or-bital), and ∆EXPS
relaxation(3d) - variation in the extra-atomic relaxation energycorresponding to a hole in the given shell [121]. Although this dependency isdeduced for monoelectronic orbitals, we can use it as a first approximation tobe applied to the different core levels under study in our compounds. There-fore the extra-atomic charge has an important effect on the B.E., this effectcan be imagined as outer charge screening of the core levels.
In the bond M-O the ∆B.E. is larger for a higher degree of ionicity (smallerMadelung potential) for the case of binary oxide Y2O3 [121]. However, in ourcase there are three pairs of such M-O bonds (Sn-O, Ti-O and Ba-O), so thecharge transfer from one bond to another is possible, and care should be takenabout the more complicated charge distribution.
The information on differences of the chemical bonding can be also ex-tracted from Auger lines. For instance, the difference between OKL23L23 andOKL1L23 is larger for the bond which is more covalent [121], because thedifferent orbitals of the same atom are influenced in a different way by thedistribution of electronic charge of the chemical bond.
In our experiment, we performed XPS on ceramic pellets, polished for easeof focusing. An axis Ultra DLD spectrometer with monochromatic Al KαX-ray source together with a charge compensation electron gun were used.

68 CHAPTER 4. CHEMICAL BONDING AT THE ATOMIC LEVEL
4.1.3 Connection between XPS, phonons, and the band gap
There is an important connection between the two techniques. we haveincluded in the results of this chapter, i.e. XPS and Raman spectroscopy.
In theoretical works, a lot of different definitions of effective charge exists toanswer the question of whether the charge of an atom is localized/delocalized,static or dynamic etc [120, 36]. Nevertheless, in general the more acceptedapproach is based on using a standard quantity called the Born charge. It isdefined as the change of polarization Pβ per unit cell along the β direction forthe displacement of the atom i in direction u.
Z∗i,αβ =
δPβ
δui, α(4.4)
with ui, α - the components of displacement.The polarization Pβ includes both the components of atomic rigid displace-
ment and the charge transfer in the electronic clouds. In a crystal, this dynamiccharge transfer contributes importantly to the properties of chemical bond andthus to the phonons that are related to the change in the polarizability.
The Born charge values for the different ions in BaTiO3 and BaSnO3 aregiven in table 4.2. It is remarkable that for BaTiO3 the values are very muchdifferent from the chemical valence values due to the dynamic hybridizationin Ti-O chains which are introduced by certain phonon modes [36, 120]. Notethat the O‖ Born charge is more different from the value of chemical valencethan the corresponding one from O⊥. In general, Z∗ strongly depends onthe electronic distribution leading to the creation of a dipole within the Ti-Obond, and thus of an atomic distortion in other words on the kind of unit celldistortion.
Table 4.2: Born charges of parent compounds of BaSnxTi1−xO3 [88]
Compound Z∗Ba Z∗
B Z∗O‖ Z∗
O⊥
BaTiO3 + 2.73 + 7.52 -5.88 -2.15BaSnO3 + 2.74 + 4.38 -3.35 -1.88
Most probable phonon modes to modify the effective charge distributionare probably Slater or Axe modes, since they involve movements of Ti againstO. Changing the Born or effective charges, the nature and energy position ofthe valence band maximum and the conduction band minimum can also bechanged. As a result, there might be a connection between the Raman modecharacteristics and the band gap in the different Born charges, as it will bementioned in the discussion of the results.
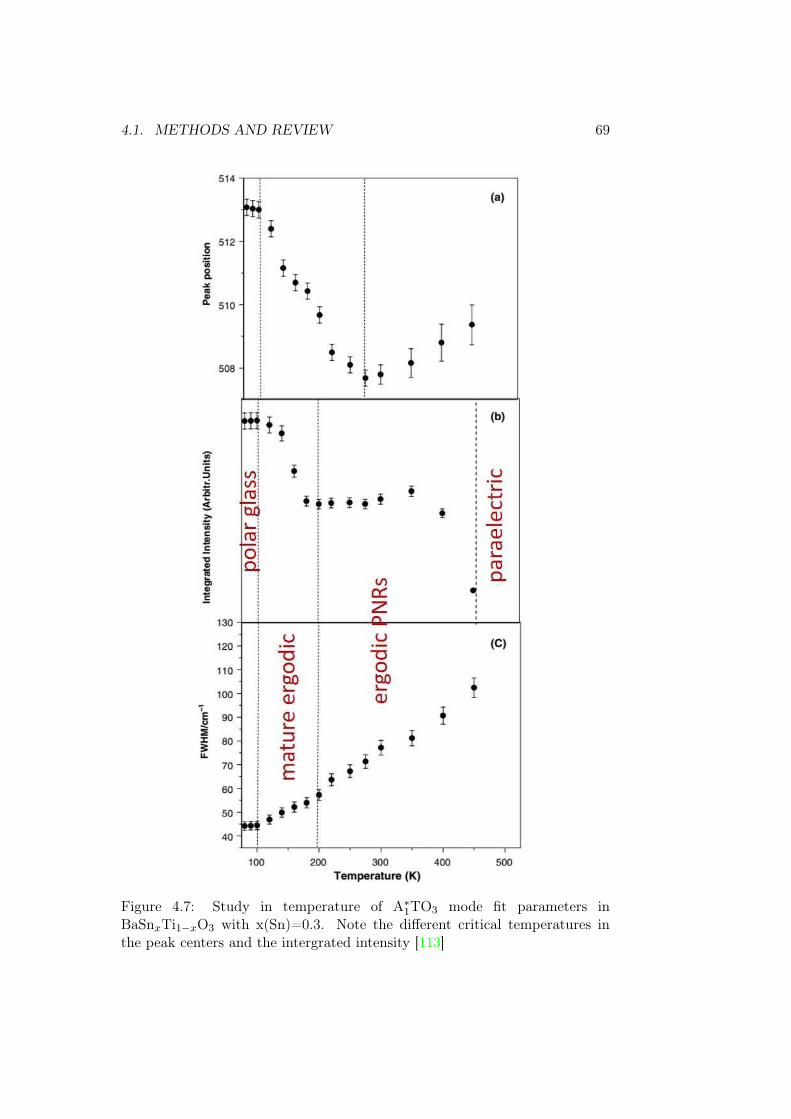
4.1. METHODS AND REVIEW 69
Figure 4.7: Study in temperature of A∗1TO3 mode fit parameters in
BaSnxTi1−xO3 with x(Sn)=0.3. Note the different critical temperatures inthe peak centers and the intergrated intensity [113]
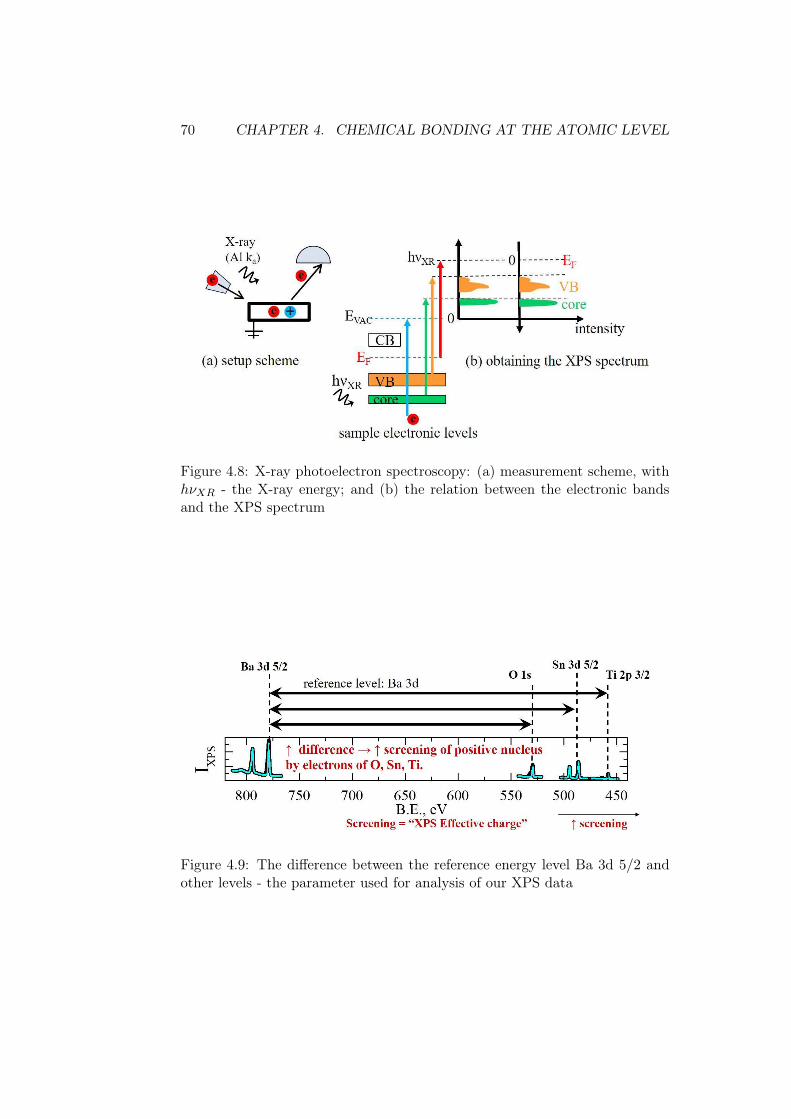
70 CHAPTER 4. CHEMICAL BONDING AT THE ATOMIC LEVEL
Figure 4.8: X-ray photoelectron spectroscopy: (a) measurement scheme, withhνXR - the X-ray energy; and (b) the relation between the electronic bandsand the XPS spectrum
Figure 4.9: The difference between the reference energy level Ba 3d 5/2 andother levels - the parameter used for analysis of our XPS data
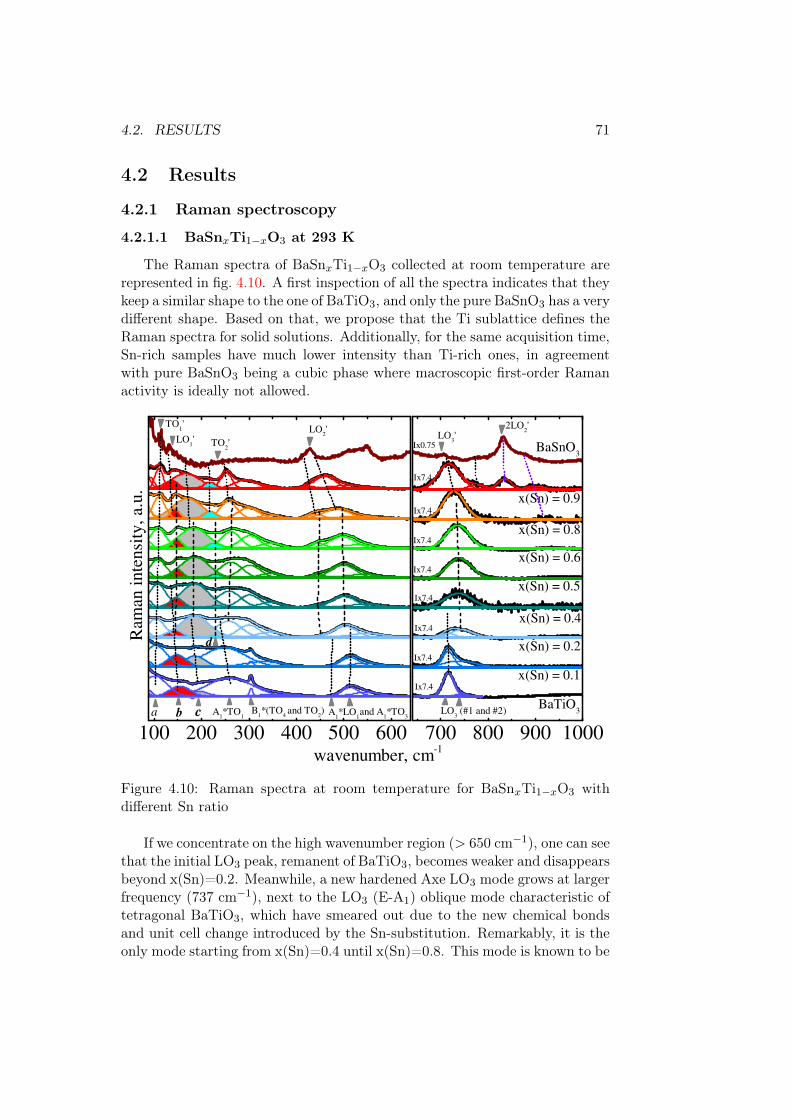
4.2. RESULTS 71
4.2 Results
4.2.1 Raman spectroscopy
4.2.1.1 BaSnxTi1−xO3 at 293 K
The Raman spectra of BaSnxTi1−xO3 collected at room temperature arerepresented in fig. 4.10. A first inspection of all the spectra indicates that theykeep a similar shape to the one of BaTiO3, and only the pure BaSnO3 has a verydifferent shape. Based on that, we propose that the Ti sublattice defines theRaman spectra for solid solutions. Additionally, for the same acquisition time,Sn-rich samples have much lower intensity than Ti-rich ones, in agreementwith pure BaSnO3 being a cubic phase where macroscopic first-order Ramanactivity is ideally not allowed.
100 200 300 400 500 600
2LO2'
B1*(TO
4 and TO
2)
LO1'
TO1'
a b A1*TO
1
Ram
an i
nte
nsi
ty,
a.u
.
wavenumber, cm-1
c
TO2'
LO2'
d
A1*LO
1and A
1*TO
3
700 800 900 1000
x(Sn) = 0.9
x(Sn) = 0.8
x(Sn) = 0.5
x(Sn) = 0.6
x(Sn) = 0.4
x(Sn) = 0.2
x(Sn) = 0.1
Ix7.4
Ix7.4
Ix7.4
Ix7.4
Ix7.4
Ix7.4
Ix7.4
BaTiO3
BaSnO3
LO3'
LO3 (#1 and #2)
Ix7.4
Ix0.75
Figure 4.10: Raman spectra at room temperature for BaSnxTi1−xO3 withdifferent Sn ratio
If we concentrate on the high wavenumber region (> 650 cm−1), one can seethat the initial LO3 peak, remanent of BaTiO3, becomes weaker and disappearsbeyond x(Sn)=0.2. Meanwhile, a new hardened Axe LO3 mode grows at largerfrequency (737 cm−1), next to the LO3 (E-A1) oblique mode characteristic oftetragonal BaTiO3, which have smeared out due to the new chemical bondsand unit cell change introduced by the Sn-substitution. Remarkably, it is theonly mode starting from x(Sn)=0.4 until x(Sn)=0.8. This mode is known to be

72 CHAPTER 4. CHEMICAL BONDING AT THE ATOMIC LEVEL
characteristic in relaxors, including the similar system Ba(Zr,Ti)O3 [114, 115].In x(Sn)=0.9, new peaks appear which are characteristic and common to someof the modes seen in pure BaSnO3.
The positions of LO3 mode(s) are plotted in fig. 4.11a. One can see thatfor the high-frequency mode there are two linear regions, which intercept atx(Sn)=0.75. In Ba(Zr,Ti)O3, this composition corresponds to percolation limitof Ti, so that further compositions represent the separate Ti-rich clusters whichare surrounded by paraelectric matrix [115]. This is in agreement with the newmodes characteristic of pure BaSnO3 appearing in x(Sn)=0.9, although otherpotential cause for this effect could be the existence of a phase separation.We cannot simply distinguish one from another from Raman spectroscopy andfurther experiments, including synchrotron radiation diffraction, are needed toanswer to this question.
0.0 0.2 0.4 0.6 0.8 1.0700
705
710
715
720
725
730
735
740
745
750
LO3
second LO3
wav
enu
mb
er, cm
-1
x(Sn)
(a)
292
296
300
304
0.0 0.2 0.4 0.6 0.8 1.0
0.0 0.2 0.4 0.6 0.8 1.00
17
34
51
Pea
k m
axim
um
, cm
-1
TO2-TO
4
FW
HM
, cm
-1
x(Sn)
(b)
Figure 4.11: Some of the fit parameters plotted against composition: (a) peakmaxima of LO3 modes in 700 cm−1 region; (b) the TO2-TO4 mode (remanentfrom B1 in BaTiO3). Error bars are shown in green.
In the part of the spectra at lower frequencies (< 650 cm−1) in fig. 4.10three compositional regions of the phase diagram are as well visible.
Below x=0.2, there is a significant softening of the Slater mode A∗1(TO1) at
260 cm−1 which occurs as for the soft mode of BaTiO3, i.e. due to the de-crease of the ferroelectric distortion and unit cell approaching quasicubic shapeat around 11 % [122, 123]. Besides, modes b and c, and LO3 are softened in-side the first compositional region because of their coupling to the soft mode.

4.2. RESULTS 73
Despite the fact that the antiresonance close to mode c disappears already inx(Sn)=0.1, similarly to cubic BaTiO3, the B∗
1(TO4-TO2) mode does not dis-appear fully but is widened, indicating probably the simultaneous presence ofdifferently distorted polar nanoregions in relaxors or a change in the unit cellthat could be compatible to a lower symmetry unit cell. Its center and FWHMare plotted in fig. 4.11b, and can be separated into three different composi-tional regions. The width of this mode stays approximately similar within therelaxor region, and further increases for x(Sn)=0.8 and 0.9, changing into awide feature fig. 4.10 which is not fitted in BaSnO3.
For relaxor compositions, there is as well a change in relative intensity ofmodes b and c. While in tetragonal BaTiO3 phase the mode b is more intensethan the mode c, it is to the contrary starting from x(Sn) = 0.2, resembling theorthorhombic phase of BaTiO3 (see fig. 4.4). The intensity ratio I(b)/I(c) isshown in fig. 4.12a, where we can clearly separate this I(b)/I(c) ratio into tworegions where this ratio behaves linearly on composition - ferroelectric onesagainst the rest of compositions. Based on this, we can make the hypothesisthat there could exist orthorhombic distortions in the Ti-rich clusters of com-positions x(Sn)> 0.2. Another important characteristic of relaxor phases is
0.0 0.2 0.4 0.6 0.8 1.0
0.2
0.4
0.6
0.8
1.0
1.2
1.4
1.6
1.8
2.0
2.2
rati
o I
(b)
/ I(
c)
x(Sn)
(a)
0.0 0.2 0.4 0.6 0.8 1.0
0.0
0.1
0.2
0.3
0.4
I(d
) /
I(A
1*
TO
1)
x(Sn)
(b)
Figure 4.12: (a) the intensity ratio I(b)/I(c), corresponding to different cou-pling of Last mode and soft mode; (b) the intensity ratio I(d)/I(A∗
1TO1)
the presence of mode d, appearing at 232 cm−1 in x(Sn) = 0.2 and becomingstronger for Sn-rich compositions. This mode appearing in BaTiO3 spectrumis the characteristic feature of rhombohedral phase (see fig. 4.4 and discussionof fig. 4.4a), evidences the de-coupling of all the components of Slater E∗TO1
from the eight-side hopping. The fact that the coupling disappears in ourspectra can be further proved by the drastic decrease of width of A∗
1TO1 modeat 260 cm−1 fig. 4.13a. Importantly, the widening of this mode in BaTiO3 isclaimed to happen due to bond and/or chemical coupling to disorder. Addi-
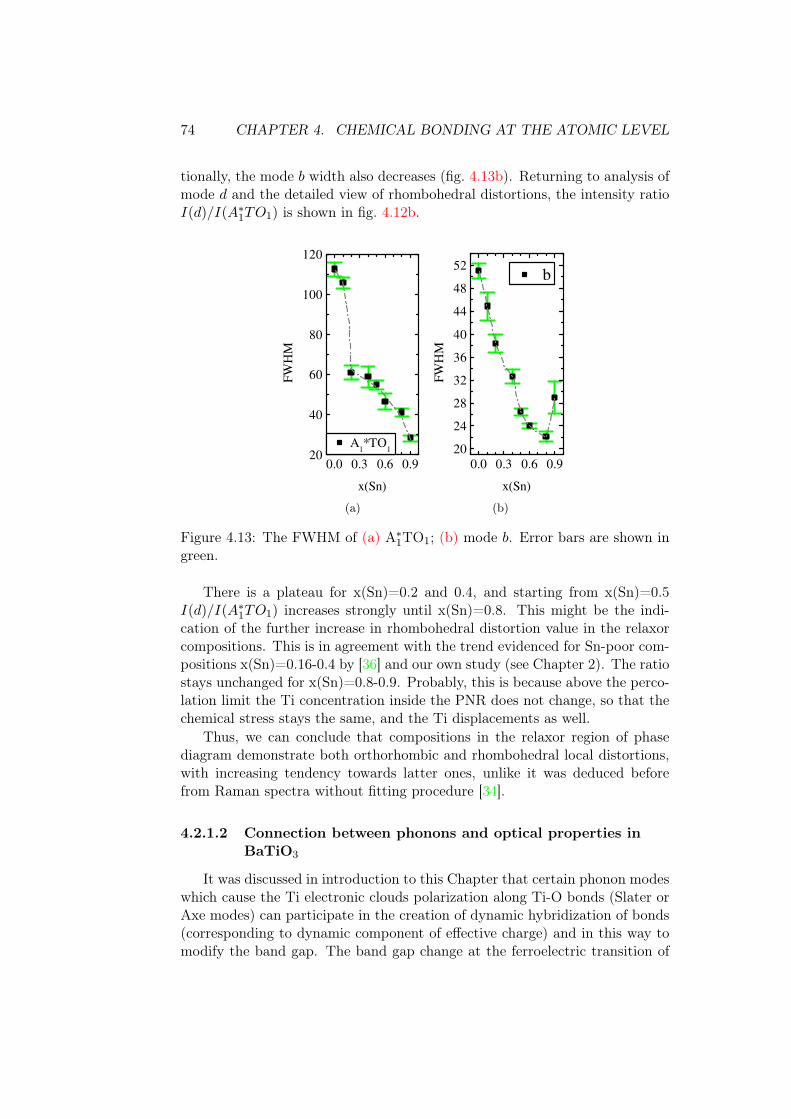
74 CHAPTER 4. CHEMICAL BONDING AT THE ATOMIC LEVEL
tionally, the mode b width also decreases (fig. 4.13b). Returning to analysis ofmode d and the detailed view of rhombohedral distortions, the intensity ratioI(d)/I(A∗
1TO1) is shown in fig. 4.12b.
0.0 0.3 0.6 0.920
40
60
80
100
120
FW
HM
x(Sn)
A1*TO
1
(a)
0.0 0.3 0.6 0.9
20
24
28
32
36
40
44
48
52
FW
HM
x(Sn)
b
(b)
Figure 4.13: The FWHM of (a) A∗1TO1; (b) mode b. Error bars are shown in
green.
There is a plateau for x(Sn)=0.2 and 0.4, and starting from x(Sn)=0.5I(d)/I(A∗
1TO1) increases strongly until x(Sn)=0.8. This might be the indi-cation of the further increase in rhombohedral distortion value in the relaxorcompositions. This is in agreement with the trend evidenced for Sn-poor com-positions x(Sn)=0.16-0.4 by [36] and our own study (see Chapter 2). The ratiostays unchanged for x(Sn)=0.8-0.9. Probably, this is because above the perco-lation limit the Ti concentration inside the PNR does not change, so that thechemical stress stays the same, and the Ti displacements as well.
Thus, we can conclude that compositions in the relaxor region of phasediagram demonstrate both orthorhombic and rhombohedral local distortions,with increasing tendency towards latter ones, unlike it was deduced beforefrom Raman spectra without fitting procedure [34].
4.2.1.2 Connection between phonons and optical properties inBaTiO3
It was discussed in introduction to this Chapter that certain phonon modeswhich cause the Ti electronic clouds polarization along Ti-O bonds (Slater orAxe modes) can participate in the creation of dynamic hybridization of bonds(corresponding to dynamic component of effective charge) and in this way tomodify the band gap. The band gap change at the ferroelectric transition of

4.2. RESULTS 75
BaTiO3 was measured in several references [74, 86, 84] fig. 4.14. It is specu-lated that phonon driving the optical response is probably not the soft modetransverse Slater phonon A1TO1. Here we present our Raman data acquiredin temperature to analyse the changes of the polar state and the possible con-nection to the band gap change we have determined.
Figure 4.14: The band gap of BaTiO3 at the T-C phase transition
The A1TO1 mode positions in temperature are plotted in fig. 4.15. Thecorresponding Raman spectra for BaTiO3 are presented for completitude inAnnex B, as well as for several other compositions. In agreement with [104],there are the discontinuities in peak centers at the phase transitions accordingto the mode softening close to the different phase transitions on heating, andthe new hardened mode appearing above the ferroelectric transition tempera-ture.
However, there are no discontinuities in the band gap of the BaTiO3 an-nealed powder in fig. 4.16.
In agreement with speculations in references, there seem to be no directconnection between A1TO1 mode positions and the band gap. On the otherhand, the A1TO3 mode seems to evolve in a way which is related to the bandgap. All the three phase transitions are accompanied by the correspondingsteps on both Raman and the band gap data. Therefore we conclude that inBaTiO3 it is the Axe mode which is indicative of the change in the orbitalsdetermining the band gap.
It is known that the static distortions cause the deviation of the Ti-O-Tibond from 180◦ and the change of orbital overlap (fig. 4.17) [66, 67]. Whetherthe B site atom orbital is Sn 5s or Ti 3d t2g (orbital forming the conductionband minimum in parent compounds of our solid solutions), the distortionpromotes the increase of antibonding character of the chemical bond. As aresult, the conduction band minimum shifts to higher values in energy, and
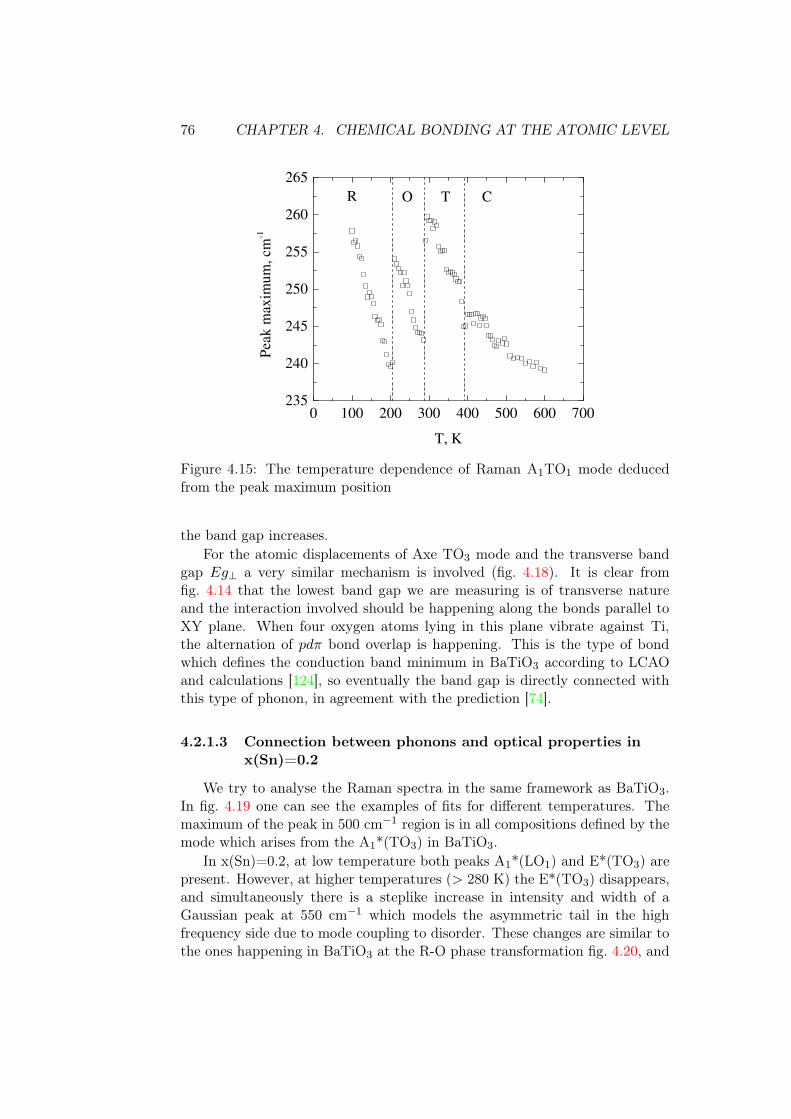
76 CHAPTER 4. CHEMICAL BONDING AT THE ATOMIC LEVEL
0 100 200 300 400 500 600 700235
240
245
250
255
260
265
CTO
Pea
k m
axim
um
, cm
-1
T, K
R
Figure 4.15: The temperature dependence of Raman A1TO1 mode deducedfrom the peak maximum position
the band gap increases.For the atomic displacements of Axe TO3 mode and the transverse band
gap Eg⊥ a very similar mechanism is involved (fig. 4.18). It is clear fromfig. 4.14 that the lowest band gap we are measuring is of transverse natureand the interaction involved should be happening along the bonds parallel toXY plane. When four oxygen atoms lying in this plane vibrate against Ti,the alternation of pdπ bond overlap is happening. This is the type of bondwhich defines the conduction band minimum in BaTiO3 according to LCAOand calculations [124], so eventually the band gap is directly connected withthis type of phonon, in agreement with the prediction [74].
4.2.1.3 Connection between phonons and optical properties inx(Sn)=0.2
We try to analyse the Raman spectra in the same framework as BaTiO3.In fig. 4.19 one can see the examples of fits for different temperatures. Themaximum of the peak in 500 cm−1 region is in all compositions defined by themode which arises from the A1*(TO3) in BaTiO3.
In x(Sn)=0.2, at low temperature both peaks A1*(LO1) and E*(TO3) arepresent. However, at higher temperatures (> 280 K) the E*(TO3) disappears,and simultaneously there is a steplike increase in intensity and width of aGaussian peak at 550 cm−1 which models the asymmetric tail in the highfrequency side due to mode coupling to disorder. These changes are similar tothe ones happening in BaTiO3 at the R-O phase transformation fig. 4.20, and

4.2. RESULTS 77
100 150 200 250 300 350 400 450
500
505
510
515
520
525
530
535 A
1(TO
3)
bandgap
wav
enu
mb
er, cm
-1
T, K
3.1
3.2
3.3
3.4
3.5
Eg
, eV
Figure 4.16: The connection between temperature dependences of A1TO3 Ra-man mode and band gap for different phases of BaTiO3 (error bar for the bandgap is smaller than the symbol size)
Figure 4.17: The changes of electronic structure (band gap increase) understatic distortions of BaTiO3 unit cell due to deviation of B-O-B bond from180◦ and the change of orbital overlap (illustrated for BaSnO3 on the right)[66, 67]
probably they mean that the E*(TO3) is the indicator of a symmetry changeat (R-C or R-O) transition.
In 700 cm−1 region of x(Sn)=0.2, the low-frequency component of LO3
decreases its intensity at 260-280 K, and the high-frequency component whichis characteristic of relaxor phase becomes more intense. These changes areillustrated in fig. 4.21 through the ratio of intensities of these two modes
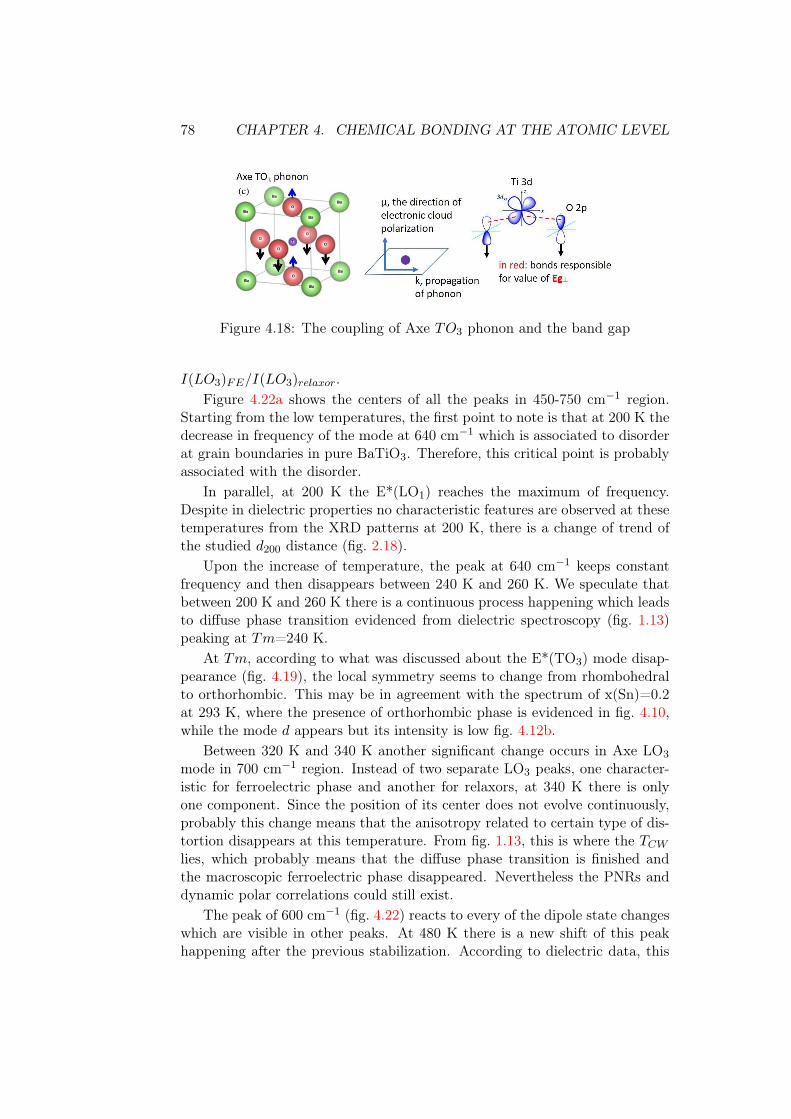
78 CHAPTER 4. CHEMICAL BONDING AT THE ATOMIC LEVEL
Figure 4.18: The coupling of Axe TO3 phonon and the band gap
I(LO3)FE/I(LO3)relaxor.Figure 4.22a shows the centers of all the peaks in 450-750 cm−1 region.
Starting from the low temperatures, the first point to note is that at 200 K thedecrease in frequency of the mode at 640 cm−1 which is associated to disorderat grain boundaries in pure BaTiO3. Therefore, this critical point is probablyassociated with the disorder.
In parallel, at 200 K the E*(LO1) reaches the maximum of frequency.Despite in dielectric properties no characteristic features are observed at thesetemperatures from the XRD patterns at 200 K, there is a change of trend ofthe studied d200 distance (fig. 2.18).
Upon the increase of temperature, the peak at 640 cm−1 keeps constantfrequency and then disappears between 240 K and 260 K. We speculate thatbetween 200 K and 260 K there is a continuous process happening which leadsto diffuse phase transition evidenced from dielectric spectroscopy (fig. 1.13)peaking at Tm=240 K.
At Tm, according to what was discussed about the E*(TO3) mode disap-pearance (fig. 4.19), the local symmetry seems to change from rhombohedralto orthorhombic. This may be in agreement with the spectrum of x(Sn)=0.2at 293 K, where the presence of orthorhombic phase is evidenced in fig. 4.10,while the mode d appears but its intensity is low fig. 4.12b.
Between 320 K and 340 K another significant change occurs in Axe LO3
mode in 700 cm−1 region. Instead of two separate LO3 peaks, one character-istic for ferroelectric phase and another for relaxors, at 340 K there is onlyone component. Since the position of its center does not evolve continuously,probably this change means that the anisotropy related to certain type of dis-tortion disappears at this temperature. From fig. 1.13, this is where the TCW
lies, which probably means that the diffuse phase transition is finished andthe macroscopic ferroelectric phase disappeared. Nevertheless the PNRs anddynamic polar correlations could still exist.
The peak of 600 cm−1 (fig. 4.22) reacts to every of the dipole state changeswhich are visible in other peaks. At 480 K there is a new shift of this peakhappening after the previous stabilization. According to dielectric data, this

4.2. RESULTS 79
must be the Td.Thus, summarizing phonons, XRD and dielectric results from our study
with local and macroscopic characterization tools, for the nominal composi-tion x(Sn)=0.2 there is a phase which is mostly (rhombohedral) ferroelectricbelow 200 K, the diffuse transition until Tm=260 K with the change of localdistortion to orthorhombic, the region of phase coexistence (relaxor and phasewith macroscopic polarization) until TCW=320-340 K, single relaxor phaseuntil Td=480 K, paraelectric above 480 K.
Turning to optical properties of x(Sn)=0.2 (fig. 4.22b), there is a criticalpoint for the band gap at 260 K. Despite the ranges of temperature in theexperiment does not permit the measurement of Eg below 235 K, it is visiblethat the critical point is preceded by a fast decrease of Eg, similarly to whathappens at phase transitions of BaTiO3. There seems to be a correlationbetween the decrease in Eg until 260 K, decrease of Eu until 270 K, and thechanges in Raman spectroscopy, such as the decrease in the frequency of theA1*(TO3) mode and the disappearance of E*(TO3) mode.
The Eg steplike decrease at 550 cm−1 could correspond to full disappear-ance of dynamic polar correlations similar to BaTiO3 [49].
The decrease of the Urbach tail characteristic energy, which is indicatingthe disorder of the transition (fig. 4.22) close to the Tm (fig. 2.6b) is probablyassociated with the disappearance of certain phonon modes which smear lessthe band gap edges. At T > Tm, the Urbach tail Eu is reactive to TCW=324 Kby change of slope, which is probably due to coupling with LO3 mode, or withthe 600 cm−1 mode, which by the way shows the change of slope for peakposition. The kink and the Eu slope alternation at Td=480 K seems as wellto be connected with the beginning of frequency decrease of disorder-relatedmode at 600 cm−1.
We summarize the temperature sequence of phases in x(Sn)=0.2 in fig. 4.23.Taking into account that the most significant changes of band gap oc-
curs when the local symmetry is changed (FE phase transitions or Tm inx(Sn)=0.2), we do not present here the data for other compositions. It isnevertheless a prospective for future works to study the connection betweenUrbach tail and the phonons in relaxor compositions.
4.2.2 X-ray photoelectron spectroscopy
Figure 4.24 shows the XPS peaks for each element. The intensity of Sn 3dpeak and Ti 2p is proportional to concentration, according to sensitivity fac-tors, and there are no unidentified shoulders or satellite peaks. It is noteworthythat the Ba 3d peaks contain a contribution from both Ba-TiO3 sublattice andsurface carbonate Ba-CO3, which we have identified and deconvoluted accord-ing to literature expected values for peak widths and relative energy positions.Similarly, the O 1s peak is formed by the contribution from the perovskitesublattice and from the surface organic bonds with H. The B site peaks are

80 CHAPTER 4. CHEMICAL BONDING AT THE ATOMIC LEVEL
well fitted by the single component, which confirms the correct valence stateand absence of significant amounts of defects at the surface.
Table 4.3: XPS quantification results of BaSnxTi1−xO3 ceramics
x(Sn) Sn/Ba Sn/Ba Sn/Ti Sn/Ti Ti/Ba Ti/Ba(theor) (theor) (theor)
0 0.94 10.1 0.17 0.1 0.17 0.11 0.99 0.90.2 0.28 0.2 0.39 0.25 0.7 0.80.4 0.58 0.4 1.05 0.67 0.55 0.60.5 0.65 0.5 1.39 1 0.47 0.50.6 0.79 0.6 2.29 1.5 0.35 0.40.8 1.07 0.8 5.93 4 0.18 0.20.9 1.25 0.9 14.96 9 0.08 0.11 1.44 1.00
The quantification results are shown in table 4.3. While the ratio of Ti/Baconcentrations is very close to the nominal one, there seems to be an excess ofSn, as deduced from the ratio Sn/Ba and Sn/Ti at the surface, more significantin Sn-rich samples.
We note that the effective screening on both Ti and Sn atoms increasesuntil x(Sn)=0.8, and then decreases after x(Sn)=0.8 (fig. 4.25). The trendand energy change are similar to those of the band gap fig. 3.4b. The for-mer probably suggests that both B-site atoms are influenced in the similarway by local environment. Whether the latter is connected with the valenceband maximum or conduction band minimum shifts, cannot unfortunately beverified with these experiments.
The difference ∆B.E.(Ba 3d - Ti 2p) and ∆B.E.(Ba 3d - Sn 2p) is largerin Sn-rich compositions, meaning that in those compositions there is moreelectron screening on B-site atoms. By extrapolation, the charge screening onTi in BaTiO3 is smaller than on Sn in BaSnO3, which means that Ti is moreoxidized than Sn (due to dynamic hybridizations induced by phonons and/orthe larger unit cell provided by the Sn-rich matrix).
The values of ∆B.E.(Ba 3d - O 1s) for pure end compounds do not followthe predicted Born charges (the Born charge of O in BaTiO3 is in absolutevalue larger than in BaSnO3). On one hand, this could be caused by the surfaceeffects due to organic bonds. Other possibility can be that the defects or localstructure are usually not taken into account in the calculation of electronicstructure of BaSnO3. The Born charge absolute value could be unprecisebecause the very same calculations predicted no allowed Raman modes inBaSnO3, while there are Raman active phonons that are visible and theirpositions seem to be in agreement with those caused by a local orthorhombicdistortion [59, 58]. The difference ∆B.E. (Ba 3d - O 1s) increases linearly

4.2. RESULTS 81
for all the compositions until x(Sn)=0.8. It stays approximately constant forx(Sn)>0.8.
The possible reason of why ∆B.E.(Ba 3d - O 1s) increases instead of de-crease predicted from calculations could be proposed through the shape ofthe valence band of different compositions in fig. 4.26. From calculations infig. 4.26b, hybridization with Ba contributes to the larger B.E. side of the com-plex valence band shape [53, 67]. In our measured VB of BaTiO3, the largerintensity lies as well at larger B.E. values. For x(Sn)=0.5, the maximum ofintensity shifts to higher B.E., and in BaSnO3 forms maximum on the low-B.E.side. This contribution is caused by hybridization with Ba levels [125]. Theshift of Ba-O hybridized level to higher energy can mean that it benefits ofhigher electronic charge. Probably, the increase of O atom screening relativeto Ba is happening for the same reason.
Special attention should be paid to the increase of electron screening forTi and Sn levels above values of pure BaSnO3 for x(Sn)=0.5-0.8. If the sim-ple charge transfer in Ti-O bond was happening, the increase of screeningfor Ti and Sn would probably correspond to opposite trend for O, which de-picted from our results. Within the unit cell with same characteristics, thesimultaneous increase in effective charge of A- and B-site atoms in perovskitesis unfavorable from the principle of Pauli repulsion between Ba-O and Ti-Ohybridized orbitals [126]. We speculate that two bonds could be involved,both Ti-O and Ba-O. The A-O bond tends to strengthen when the O-B-Ooctahedral angle deviates from 180◦ [67]. Therefore the XPS data are com-patible with our conclusions from the Raman spectroscopy that rhombohedraldistortions increase for compositions x(Sn)=0.5-0.8, and that the amount ofdistorted clusters decrease for x(Sn)=0.8-1. Everything goes in line with theband gap non-linear trend.
We also note that for Sn 4d core levels (fig. 4.25) two peaks can be observed,in contrast to the single peak measured for BaSnO3 compound. This result iscompatible with the existence of different bonding for Sn in this composition,which can be allowed in rhombohedral or orthorhombic distortions.
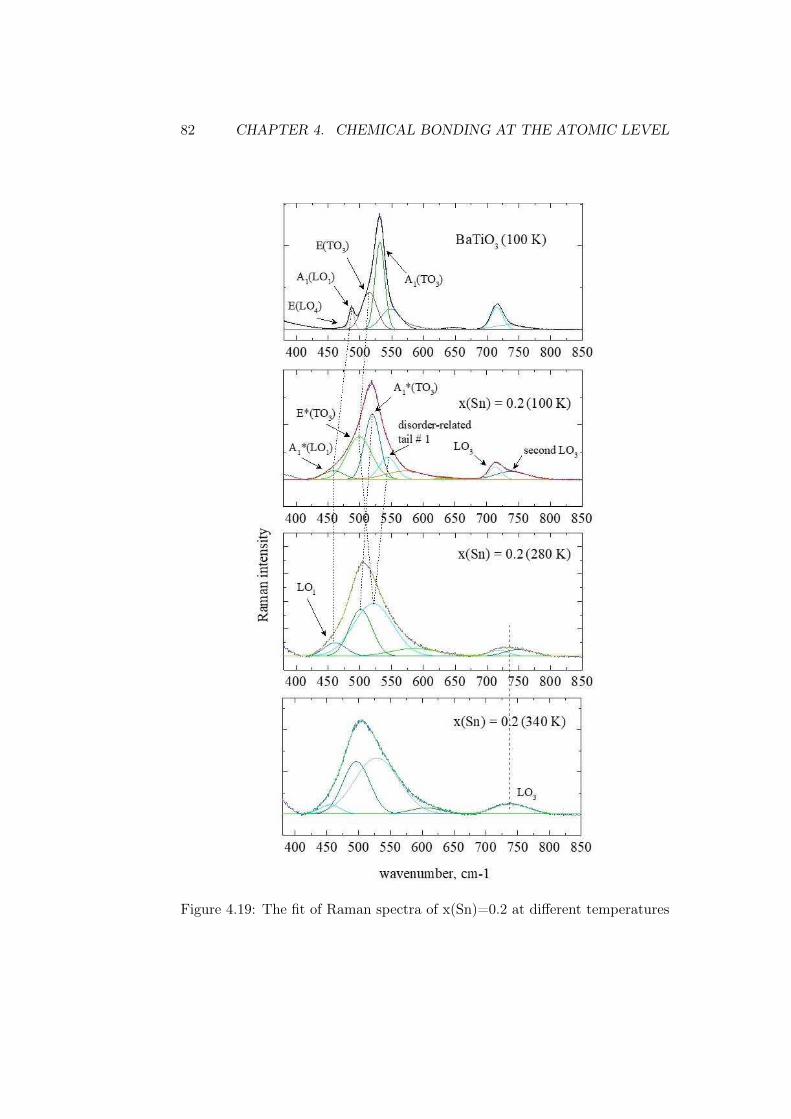
82 CHAPTER 4. CHEMICAL BONDING AT THE ATOMIC LEVEL
Figure 4.19: The fit of Raman spectra of x(Sn)=0.2 at different temperatures

4.2. RESULTS 83
500 550 600
240 K (O)
160 K (R)R
aman
in
ten
sity
wavenumber, cm-1
700 800
Figure 4.20: The appearance of fitted BaTiO3 spectrum in high-wavenumberregion in R and O phases
0 100 200 300 400 5001.8
1.6
1.4
1.2
1.0
0.8
0.6
0.4
0.2
0.0
+ g
row
ing
dis
ord
er
rela
xo
r
FE
(O)
+ r
elax
or
FE
(R)
I (L
O3
FE)
/ I
(LO
3re
lax
or)
Temperature, K
mai
nly
FE
(R)
= 5
fo
r B
aTiO
3
Figure 4.21: The intensity ratio I(LO3)FE/I(LO3)relaxor of two LO3 compo-nents in 700 cm−1 region of x(Sn)=0.2, low frequency one (LO3)FE , character-istic for ferroelectrics, and high frequency one (LO3)relaxor, which is disorder-coupled and characteristic to relaxors)

84 CHAPTER 4. CHEMICAL BONDING AT THE ATOMIC LEVEL
100 200 300 400 500
450
500
550
600
650
700
750 second LO
3
(characteristic of relaxors)
LO3
grain-boundary/
defects-related mode
assymetry due to
coupling to disorder-2
assymetry due to
coupling to disorder-1;
above 240K:
+ hardened mode
replacing E*(TO3)
A1*(TO
3)
E*(TO3)
A1*(LO
1)
Pea
k m
axim
um
, cm
-1
T, K
(a)
200 300 400 500 600
3.15
3.20
3.25
3.30
3.35
3.40
3.45
3.50 Eg
Eu
260 K
Eg
, eV
T, K
0.06
0.08
0.10
0.12
0.14
480 K
493 K
324 K
Eu
, eV
270 K
(b)
Figure 4.22: Connection between phonons and the optical absorption inx(Sn)=0.2: (a) the Raman peak maximum evolution; (b) Eg and Eu tem-perature dependence (reproduced from Chapter 2)

4.2. RESULTS 85
200
250
300
350
400
450
500
550
Eg minEu min
Eu slope
Eu slope
Eu start
Eu endnew state
TCW
Tm (1 MHz)
Td
TQ
T rel1 max
T rel2 max
wide disorder-related pr.
pure PE
dynamic P
correlations
(symmetry - ?)
PNRs (symmetry - ?)
FE (O) + relaxor
FE (R) + disorder
Optic
Raman
Die
XRD
Tem
per
atu
re,
K
FE (R)
wide disorder-related
process
Figure 4.23: The summary on phase and disorder transitions in x(Sn)=0.2,using the data from XRD and dielectric, UV-visible-NIR, and Raman spectro-scopies
800 790 780
2p 3/22p 1/23d 5/23d 3/23d 3/2 3d 5/2
O-H
O-MetalBa-TiO3
O 1s Ti 2pSn 3d
XP
S i
nte
nsi
ty,
a.u
.
Binding energy, eV
data
Fit for
x(Sn):
1
0.9
0.8
0.6
0.5
0.4
0.2
0.1
0
Ba 3d
Ba-CO3
495 490 485
465 460
535 530
Figure 4.24: XPS spectra at room temperature for BaSnxTi1−xO3 with differ-ent Sn ratio


4.2. RESULTS 87
Conclusions
Raman spectroscopy well describes the polar order and the kind ofdistortions. With the addition of the information from previous chap-ters, we can picture out the next section of the phase diagram at roomtemperature:
• FE-like with tetragonal distortion symmetry for 0<x(Sn)≤0.1
• x(Sn)=0.2 as the only representative of a sample with a diffuse phasetransition and the resulting phase coexistence at room temperature.Both FE and relaxor-like components are detected in Raman. Notethat according to dielectric measurements, at room temperature themajor phase is FE-like with very weak distortions (close to TCW
where the macroscopic static polarization disappears). The mixtureof relaxor-like phase is evidenced only by Raman.
The symmetry deduced from Raman spectra is mainly orthorhom-bic, with very weak mixture of rhombohedral distortions.
• x(Sn)=0.4 - the pure relaxor composition with mainly orthorhombicdistortions and a small mixture of rhombohedral ones
• 0.5<x(Sn)<0.75 relaxor compositions with both orthorhombic andgrowing rhombohedral distortions
• 0.75<x(Sn)≤0.9 clusters containing Ti within a purely paraelectricBaSnO3 matrix. The distortions preserve the same characteristics(O + R) as just below the percolation limit, probably because withinthe clusters the chemical stress stays similar.
In addition to giving a clear understanding of the polar state, Ra-man spectroscopy allows to qualitatively explain the band gap non-linearstep-like changes in temperature at the phase transitions with the massivechange of distortion kind (unit cell symmetry). We observe such changesboth in BaTiO3 (phonon mode of Axe character A1TO3) and x(Sn)=0.2(also Axe mode E∗TO3). The Axe mode is responsible for dynamic com-ponent of bond hybridization in pdπ (Ti-O) or psπ (Sn-O) chemical bond,which form the conduction band minimum.
The change of unit cell symmetry and kind of distortion changes boththe static and the dynamic components of the effective charge. The staticcomponent should be connected with macroscopic polarization P , howeverit was pointed out in [74] that the separation between transverse andlongitudinal Eg was not straightly proportional to P 2 as it is supposed to

88 CHAPTER 4. CHEMICAL BONDING AT THE ATOMIC LEVEL
be in the static model, but rather was connected with dynamic polarizationfluctuations. Similar quantitative analysis is out of the scope of this work,as it would probably require the Raman spectra to be recorded from singlecrystals, as well as the comparison to theoretical calculations.
We demonstrate on the example of x(Sn)=0.2 that there is a clearconnection between phonons and the temperature evolution of the Urbachtail Eu. The Eu decreases at 270 K, where the phonon mode causing theband gap non-linearity dies off. Additionally, Eu changes the slope attransitions which seem to involve only the change of polar order (TCW ,Td).
In agreement with the distortion-Eg connection deduced from Ramanspectroscopy, we also evidence the connection between the effective chargeof B-site atoms and Eg through X-ray photoelectron spectroscopy. Theelectron screening of core levels on Ti and Sn atoms is increasing (relativeto Ba) for compositions x(Sn)<0.8 and decreasing for 0.8<x(Sn)<1, theexcess of electron charge originating probably from the distortions of theunit cell and the octahedral angle O-B-O deviation from 180◦.

Chapter 5
Conclusions
The study of optical properties of perovskite solid solutions is of greatinterest in connection with their macroscopic structure and local polar or-der which can alternate the chemical bonding. The properties of ferroelectricsolid solutions, including photovoltaic, piezoelectric, dielectric, electrocaloricetc. often show non-linear behaviour and potentially allow to reach new func-tionalities in applied devices. In our work, we have concentrated on solidsolutions BaSnxTi1−xO3 with the end members BaTiO3 (ferroelectric) andBaSnO3 (paraelectric). The similar valence of Ti and Sn (+4) should preventlarge concentrations of defects, while Sn could potentially contribute to betterelectron mobility by its conduction band levels Sn 5s 5p.
In the first chapter, we have studied the compositional and temperaturedependence of the crystallographic structure by X-ray diffraction and polarorder by dielectric spectroscopy, and we had an insight into the atomic struc-ture and local atomic distortions of the relaxor phase by using transmissionelectron microscopy. Despite the linear compositional dependence of the unitcell volume at room temperature, a range of different phases is discovered.Adding more Ti atoms introduces chemical stress which causes the decrease offerroelectric distortion and increasing polar disorder. The sequence of phasesis:
• ferroelectric (x(Sn)=0...0.1)
• material in diffuse phase transition state where ferroelectric and relaxorphases coexist, with quasicubic unit cell (x(Sn)=0.1...0.3)
• relaxor phase with average quasicubic unit cell but presence of nanoclus-ters of distorted phase from x(Sn)=0.3 to 0.8 or higher Sn ratio
The dielectric properties of Ti-rich compositions seem to be defined bypolar order of ferroelectric origin, while the dipoles of non-ferroelectric (defect)origin play an important role for Sn-rich compositions.
89

90 CHAPTER 5. CONCLUSIONS
The local atomic structure shows that the PNRs in the relaxor phase inx(Sn) = 0.4 seem smaller in size, but the distortion of the B-site atoms increasesin comparison to compositions which are inside the diffuse phase transitionregion at room temperature. The distortion state is mixed, but a componentalong the <111> rhombohedral axis is present.
After characterization of the samples, in second chapter we tested the opti-cal absorption of solid solutions at room temperature for compositional series,and with varying the temperature for chosen compositions for deeper insightinto dependence of optical properties on the changing polar order.
In the compositional series, the band gap shows non-linear behaviour. Itincreases by ∼0.35 eV until x(Sn)=0.8 and decreases for Sn-rich compositions.From our data, the band gap seems to be defined by wide smeared featurewhere the Sn and Ti levels cannot be separated, we assume that the band gapis defined by mixed levels. We find a connection between the band gap andthe type of disorder in the compositional series. Based on this, we also studiedthe temperature dependence of the band gap in connection with changingdisorder regimes. In general, the band gap varies homogeneously within onephase, followed by a non-linear decrease on temperature increase around phasetransitions, and followed by another linear regime. For BaTiO3 above Tc, theslope of Eg variation differs for the phase with static polar correlations andthe phase where they are absent. For Ti-rich solid solutions, the Eg andEu react to changes of the polar state, while for BaSnO3 and probably Sn-rich compositions the disorder is determined by defects which are related tooxidation/reduction of the material.
Based on the importance of local disorder for optical properties, in thelast chapter of this manuscript we analysed the local structure and disorderin connection to chemical bonding. Concentrating on phase transitions, weuse Raman spectroscopy to distinguish the different types of local structuraldistortions and their magnitude, for compositional series and in temperature.This study combined with crystallographic, dielectric, and optical data, resultsin our redefinition of the sequence of phases at room temperature:
• FE-like for 0<x(Sn)≤0.1
• x(Sn)=0.2 as the only representative of the sample with diffuse phasetransition and the resulting phase coexistence at room temperature.Both FE and relaxor-like components are detected in Raman. Notethat according to dielectric measurements, at room temperature the ma-jor phase is FE-like with very weak distortions (close to TCW where themacroscopic static polarization disappears). The mixture of relaxor-likephase is evidenced only by Raman.
The symmetry deduced from Raman spectra is mainly orthorhombic,with very weak mixture of rhombohedral distortions.

91
• x(Sn)=0.4 - the pure relaxor composition with mainly orthorhombic dis-tortions and the small mixture of rhombohedral ones
• 0.5<x(Sn)<0.75 relaxor compositions with both orthorhombic and grow-ing rhombohedral distortions
• 0.75<x(Sn)≤0.9 clusters containing Ti within pure cubic BaSnO3 ma-trix. The distortions preserve same characteristics (O + R) as just belowthe percolation limit, probably because within the clusters the chemicalstress stays similar.
The band gap of a single composition decreases stepwise on increase of tem-perature if the change of the type of local symmetry occurs (e.g. rhombohedral-orthorhombic). According to our discussion, the band gap value is in significantdegree dependent on the different components of phonon A∗
1TO3 of Axe type,evidenced in Raman. The phonons of this type modify the overlap of orbitalsof O and B-site atoms in ABO3 which form the π bond that defines the energyof the conduction band minimum.
The degree of overlap of the atomic orbitals also modifies the distributionof the effective electronic charge of the atoms. This effective charge can bequalitatively analysed through X-ray photoelectron spectroscopy. Since thereare distortions of the unit cell, the octahedral angle O-B-O deviates from 180◦,simultaneously, an increase of the effective electronic charge on the B site andon O becomes possible, which is energetically unfavorable in a non-distortedunit cell. This trend appears in our XPS results between x(Sn)=0 and 0.8,with excess of effective charge decreasing for x(Sn)=0.8...1. This proves thatthe band gap increase in the compositional series is caused by the increasingrhombohedral distortions, and the following decrease of the bad gap agrees wellwith the gradual disappearance of distorted phase clusters in Sn-rich compo-sitions.
Outlook and perspectives
Since Sn should contribute to an increase of the electron mobility, it wouldbe of interest to perform the measurement to evaluate the changes in com-parison to BaTiO3. However, because of the microscopic size of grains, it canbe experimentally complicated. To the contrary, it is possible to estimate thephotovoltaic response from short-circuit current measured under laser illumi-nation. These measurements were performed at the Institut de Ciència deMaterials de Barcelona, but need additional processing before being shownto a thesis committee. The measurements were performed under lasers ofdifferent energies within the band gap of BaTiO3 on different compositions.The short circuit current response consists of several components, includingtransient behaviour which might depend on defect concentrations.

92 CHAPTER 5. CONCLUSIONS
The more profound analysis of this data can be performed if comparedto the analysis of photoluminescence experiments which were performed atthe Institut de Nanoscience de Lyon. In those experiments the electrons areexcited to the energy level in the conduction band, and then recombine withthe defect levels inside the band gap. The concentration of defects, includingthe distortion-related polarons, and the energies of levels can be analysed forbetter explanation of transient components as well as shift photocurrent valueswhich depend on defect trapping.
Bibliography
[1] William Shockley and Hans J Queisser. Detailed balance limit of effi-ciency of p-n junction solar cells. Journal of applied physics, 32(3):510–519, 1961.
[2] Eden Rephaeli and Shanhui Fan. Absorber and emitter for solar thermo-photovoltaic systems to achieve efficiency exceeding the Shockley-Queisser limit. Optics express, 17(17):15145–15159, 2009.
[3] Peter Krogstrup, Henrik Ingerslev Jørgensen, Martin Heiss, OlivierDemichel, Jeppe V Holm, Martin Aagesen, Jesper Nygard, andAnna Fontcuberta i Morral. Single-nanowire solar cells beyond theShockley-Queisser limit. Nature Photonics, 7(4):306–310, 2013.
[4] Robert T. Ross and Arthur J. Nozik. Efficiency of hot-carrier solar energyconverters. Journal of Applied Physics, 53(5):3813–3818, May 1982.
[5] R. D. Schaller and V. I. Klimov. High Efficiency Carrier Multiplication inPbSe Nanocrystals: Implications for Solar Energy Conversion. PhysicalReview Letters, 92(18), May 2004.
[6] A. J. Nozik, M. C. Beard, J. M. Luther, M. Law, R. J. Ellingson, andJ. C. Johnson. Semiconductor quantum dots and quantum dot arraysand applications of multiple exciton generation to third-generation pho-tovoltaic solar cells. Chemical Reviews, 110(11):6873–6890, November2010.
[7] O. E. Semonin, J. M. Luther, S. Choi, H.-Y. Chen, J. Gao, A. J. Nozik,and M. C. Beard. Peak External Photocurrent Quantum EfficiencyExceeding 100 % via MEG in a Quantum Dot Solar Cell. Science,334(6062):1530–1533, December 2011.
[8] Jonathan E. Spanier, Vladimir M. Fridkin, Andrew M. Rappe, An-drew R. Akbashev, Alessia Polemi, Yubo Qi, Zongquan Gu, Steve M.Young, Christopher J. Hawley, Dominic Imbrenda, Geoffrey Xiao, An-drew L. Bennett-Jackson, and Craig L. Johnson. Power conversion effi-ciency exceeding the Shockley–Queisser limit in a ferroelectric insulator.Nature Photonics, 10(9):611–616, August 2016.
93
94 BIBLIOGRAPHY
[9] Charles Paillard, Xiaofei Bai, Ingrid C Infante, Maël Guennou, GrégoryGeneste, Marin Alexe, Jens Kreisel, and Brahim Dkhil. Photovoltaicswith ferroelectrics: Current status and beyond. Advanced Materials,28(26):5153–5168, 2016.
[10] A. M. Glass, D. Von Der Linde, and T. J. Negran. High-voltage bulkphotovoltaic effect and the photorefractive process in LiNbO3. AppliedPhysics Letters, 25(4):233–235, 1974.
[11] W.T.H. Koch, R. Munser, W. Ruppel, and P. Würfel. Bulk photovoltaiceffect in BaTiO3. Solid State Communications, 17(7):847 – 850, 1975.
[12] J. G. Bendoraitis and R. E. Salomon. Optical energy gaps in the mon-oclinic oxides of hafnium and zirconium and their solid solutions. TheJournal of Physical Chemistry, 69(10):3666–3667, October 1965.
[13] Pakpoom Reunchan, Naoto Umezawa, Shuxin Ouyang, and JinhuaYe. Mechanism of photocatalytic activities in Cr-doped SrT iO3 un-der visible-light irradiation: an insight from hybrid density-functionalcalculations. Physical Chemistry Chemical Physics, 14(3):1876, 2012.
[14] Wenliang Zhou, Hongmei Deng, Tuo Zheng, Pingxiong Yang, and Jun-hao Chu. Pb-free semiconductor ferroelectrics: An experimental study ofBa(T i0.75Ce0.125Pd0.125)O3 thin films. Materials Letters, 177:1–4, Au-gust 2016.
[15] Joseph W. Bennett, Ilya Grinberg, Peter K. Davies, and Andrew M.Rappe. Pb-free semiconductor ferroelectrics: A theoretical study of Pd-substituted BaTiO3. Physical Review B, 82(18):184106, 2010.
[16] Tingting Qi, Ilya Grinberg, and Andrew M. Rappe. First-principles investigation of the highly tetragonal ferroelectric materialBi(Zn1/2T i1/2)O3 . Physical Review B - Condensed Matter and Ma-terials Physics, 79(9):1–5, 2009.
[17] Tingting Qi, Ilya Grinberg, and Andrew M. Rappe. Band-gap engi-neering via local environment in complex oxides. Physical Review B -Condensed Matter and Materials Physics, 83(22):1–6, 2011.
[18] Hungru Chen and Naoto Umezawa. Effect of cation arrangement on theelectronic structures of the perovskite solid solutions SrT iO3(1 − x) −LaCrO3(x) from first principles. Physical Review B, 90(4), July 2014.
[19] Lu Yu, Hongmei Deng, Wenliang Zhou, Pingxiong Yang, and Jun-hao Chu. Structural characteristics and optical properties of lead-free Bi(Zn1/2T i1/2)O3 − BaTiO3 ceramics. Ceramics International,43(8):6175–6179, June 2017.
BIBLIOGRAPHY 95
[20] Woo Seok Choi, Matthew F. Chisholm, David J. Singh, Taekjib Choi,Gerald E. Jellison, and Ho Nyung Lee. Wide bandgap tunability incomplex transition metal oxides by site-specific substitution. NatureCommunications, 3:689, 2012.
[21] R. Nechache, C. Harnagea, S. Li, L. Cardenas, W. Huang,J. Chakrabartty, and F. Rosei. Bandgap tuning of multiferroic oxidesolar cells. Nature Photonics, 9(1):61–67, 2014.
[22] Huafeng Dong, Zhigang Wu, Shanying Wang, Wenhui Duan, and JingboLi. Improving the optical absorption of BiFeO3 for photovoltaic ap-plications via uniaxial compression or biaxial tension. Applied PhysicsLetters, 102(7):072905, 2013.
[23] Ch. Eisenschmidt, H. T. Langhammer, R. Steinhausen, and G. Schmidt.Tetragonal-Orthorhombic Phase Transition in Barium Titanate via Mon-oclinic MC-Type Symmetry. Ferroelectrics, 432(1):103–116, January2012.
[24] David Vanderbilt and Morrel H. Cohen. Monoclinic and triclinic phasesin higher-order devonshire theory. Physical Review B, 63(9), January2001.
[25] Elena Aksel and Jacob L. Jones. Advances in lead-free piezoelectricmaterials for sensors and actuators. Sensors, 10(3):1935–1954, March2010.
[26] K. Itoh, L. Z. Zeng, E. Nakamura, and N. Mishima. Crystal structure ofBaTiO3 in the cubic phase. Ferroelectrics, 63(1):29–37, 1985-06.
[27] B. Noheda, D. E. Cox, G. Shirane, R. Guo, B. Jones, and L. E.Cross. Stability of the monoclinic phase in the ferroelectric perovskitePbZr1−xT ixO3. Physical Review B, 63(1), December 2000.
[28] Ajay Kumar Kalyani, Hari Krishnan, Arijit Sen, Anatoliy Senyshyn, andRajeev Ranjan. Polarization switching and high piezoelectric responsein Sn-modified BaTiO3. Physical Review B, 91(2), January 2015.
[29] Émile Bévillon, Anthony Chesnaud, Yanzhong Wang, Guilhem Dezan-neau, and Grégory Geneste. Theoretical and experimental study of thestructural, dynamical and dielectric properties of perovskite BaSnO3.Journal of Physics: Condensed Matter, 20(14):145217, 2008.
[30] R. D. Shannon. Revised effective ionic radii and systematic studies of in-teratomic distances in halides and chalcogenides. Acta CrystallographicaSection A, 32(5):751–767, sep 1976.

96 BIBLIOGRAPHY
[31] Xiaoyong Wei and Xi Yao. Preparation, structure and dielectric propertyof barium stannate titanate ceramics. Materials Science and Engineer-ing: B, 137(1-3):184–188, 2007.
[32] R. Von Der Mühll, A. Simon, C. Elissalde, and A. Villesuzanne. Dielec-tric investigation of a new TKWB lead free relaxor. Journal of Physicsand Chemistry of Solids, 65(6):1039–1043, 2004.
[33] Yonggang Yao, Chao Zhou, Duchao Lv, Dong Wang, Haijun Wu,Yaodong Yang, and Xiaobing Ren. Large piezoelectricity and dielectricpermittivity in BaTiO3 − xBaSnO3 system: The role of phase coexist-ing. EPL (Europhysics Letters), 98(2):27008, 2012.
[34] Ljiljana Veselinovic, Miodrag Mitric, Lidija Mancic, Marija Vuko-manovic, Branka Hadzic, Smilja Markovic, and Dragan Uskokovic. Theeffect of Sn for Ti substitution on the average and local crystal structureof BaTi1−xSnxO3 (x=0...0.20) . Journal of Applied Crystallography,47(3):999–1007, 2014.
[35] Tao Shi, Lin Xie, Lin Gu, and Jing Zhu. Why Sn doping significantly en-hances the dielectric properties of Ba(T i1−xSnx)O3. Scientific Reports,5:8606, 2015.
[36] L. Xie, Y. L. Li, R. Yu, Z. Y. Cheng, X. Y. Wei, X. Yao, C. L. Jia,K. Urban, A. A. Bokov, Z. G. Ye, and J. Zhu. Static and dynamicpolar nanoregions in relaxor ferroelectric Ba(T i1−xSnx)O3 system athigh temperature. Physical Review B - Condensed Matter and MaterialsPhysics, 85(1):1–5, 2012.
[37] Tao Shi, Lin Gu, and Jing Zhu. Explanation of diffuse scattering mech-anism based on the structure of polar nanoregions in BaTi1−xSnxO3.Journal of Applied Physics, 120(12):124103, 2016-09.
[38] Yun Liu, Ray L. Withers, Xiaoyong Wei, and John D. Fitz Gerald. Struc-tured diffuse scattering and polar nano-regions in the BaTi1−xSnxO3 re-laxor ferroelectric system. Journal of Solid State Chemistry, 180(3):858–865, 2007.
[39] X Zhang, L Wu, S Gao, JQ Liu, B Xu, YD Xia, J Yin, and ZG Liu.Large electrocaloric effect in Ba(T i1−xSnx)O3 ceramics over a broadtemperature region. AIP Advances, 5(4):047134, 2015.
[40] Zhengdong Luo, Dawei Zhang, Yang Liu, Di Zhou, Yonggang Yao,Chenqi Liu, Brahim Dkhil, Xiaobing Ren, and Xiaojie Lou. Enhancedelectrocaloric effect in lead-free BaTi1−xSnxO3 ceramics near room tem-perature. Applied Physics Letters, 105(10):102904, September 2014.
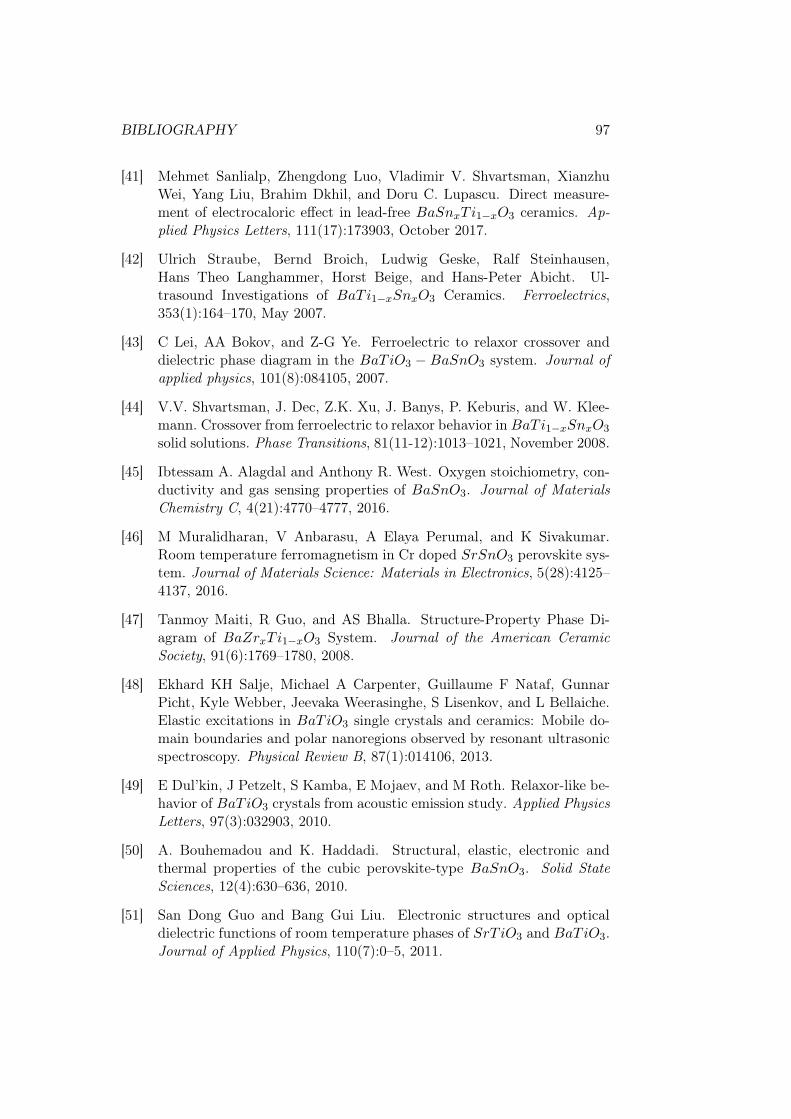
BIBLIOGRAPHY 97
[41] Mehmet Sanlialp, Zhengdong Luo, Vladimir V. Shvartsman, XianzhuWei, Yang Liu, Brahim Dkhil, and Doru C. Lupascu. Direct measure-ment of electrocaloric effect in lead-free BaSnxT i1−xO3 ceramics. Ap-plied Physics Letters, 111(17):173903, October 2017.
[42] Ulrich Straube, Bernd Broich, Ludwig Geske, Ralf Steinhausen,Hans Theo Langhammer, Horst Beige, and Hans-Peter Abicht. Ul-trasound Investigations of BaTi1−xSnxO3 Ceramics. Ferroelectrics,353(1):164–170, May 2007.
[43] C Lei, AA Bokov, and Z-G Ye. Ferroelectric to relaxor crossover anddielectric phase diagram in the BaTiO3 − BaSnO3 system. Journal ofapplied physics, 101(8):084105, 2007.
[44] V.V. Shvartsman, J. Dec, Z.K. Xu, J. Banys, P. Keburis, and W. Klee-mann. Crossover from ferroelectric to relaxor behavior in BaTi1−xSnxO3
solid solutions. Phase Transitions, 81(11-12):1013–1021, November 2008.
[45] Ibtessam A. Alagdal and Anthony R. West. Oxygen stoichiometry, con-ductivity and gas sensing properties of BaSnO3. Journal of MaterialsChemistry C, 4(21):4770–4777, 2016.
[46] M Muralidharan, V Anbarasu, A Elaya Perumal, and K Sivakumar.Room temperature ferromagnetism in Cr doped SrSnO3 perovskite sys-tem. Journal of Materials Science: Materials in Electronics, 5(28):4125–4137, 2016.
[47] Tanmoy Maiti, R Guo, and AS Bhalla. Structure-Property Phase Di-agram of BaZrxT i1−xO3 System. Journal of the American CeramicSociety, 91(6):1769–1780, 2008.
[48] Ekhard KH Salje, Michael A Carpenter, Guillaume F Nataf, GunnarPicht, Kyle Webber, Jeevaka Weerasinghe, S Lisenkov, and L Bellaiche.Elastic excitations in BaTiO3 single crystals and ceramics: Mobile do-main boundaries and polar nanoregions observed by resonant ultrasonicspectroscopy. Physical Review B, 87(1):014106, 2013.
[49] E Dul’kin, J Petzelt, S Kamba, E Mojaev, and M Roth. Relaxor-like be-havior of BaTiO3 crystals from acoustic emission study. Applied PhysicsLetters, 97(3):032903, 2010.
[50] A. Bouhemadou and K. Haddadi. Structural, elastic, electronic andthermal properties of the cubic perovskite-type BaSnO3. Solid StateSciences, 12(4):630–636, 2010.
[51] San Dong Guo and Bang Gui Liu. Electronic structures and opticaldielectric functions of room temperature phases of SrT iO3 and BaTiO3.Journal of Applied Physics, 110(7):0–5, 2011.
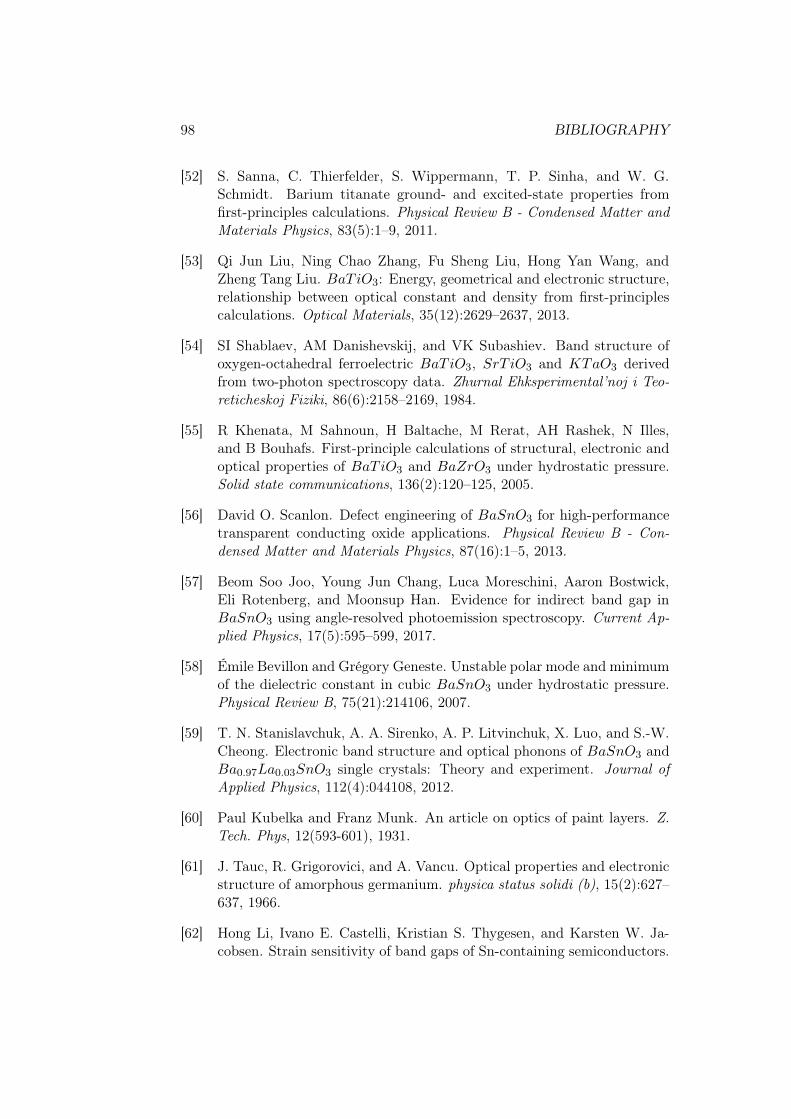
98 BIBLIOGRAPHY
[52] S. Sanna, C. Thierfelder, S. Wippermann, T. P. Sinha, and W. G.Schmidt. Barium titanate ground- and excited-state properties fromfirst-principles calculations. Physical Review B - Condensed Matter andMaterials Physics, 83(5):1–9, 2011.
[53] Qi Jun Liu, Ning Chao Zhang, Fu Sheng Liu, Hong Yan Wang, andZheng Tang Liu. BaTiO3: Energy, geometrical and electronic structure,relationship between optical constant and density from first-principlescalculations. Optical Materials, 35(12):2629–2637, 2013.
[54] SI Shablaev, AM Danishevskij, and VK Subashiev. Band structure ofoxygen-octahedral ferroelectric BaTiO3, SrT iO3 and KTaO3 derivedfrom two-photon spectroscopy data. Zhurnal Ehksperimental’noj i Teo-reticheskoj Fiziki, 86(6):2158–2169, 1984.
[55] R Khenata, M Sahnoun, H Baltache, M Rerat, AH Rashek, N Illes,and B Bouhafs. First-principle calculations of structural, electronic andoptical properties of BaTiO3 and BaZrO3 under hydrostatic pressure.Solid state communications, 136(2):120–125, 2005.
[56] David O. Scanlon. Defect engineering of BaSnO3 for high-performancetransparent conducting oxide applications. Physical Review B - Con-densed Matter and Materials Physics, 87(16):1–5, 2013.
[57] Beom Soo Joo, Young Jun Chang, Luca Moreschini, Aaron Bostwick,Eli Rotenberg, and Moonsup Han. Evidence for indirect band gap inBaSnO3 using angle-resolved photoemission spectroscopy. Current Ap-plied Physics, 17(5):595–599, 2017.
[58] Émile Bevillon and Grégory Geneste. Unstable polar mode and minimumof the dielectric constant in cubic BaSnO3 under hydrostatic pressure.Physical Review B, 75(21):214106, 2007.
[59] T. N. Stanislavchuk, A. A. Sirenko, A. P. Litvinchuk, X. Luo, and S.-W.Cheong. Electronic band structure and optical phonons of BaSnO3 andBa0.97La0.03SnO3 single crystals: Theory and experiment. Journal ofApplied Physics, 112(4):044108, 2012.
[60] Paul Kubelka and Franz Munk. An article on optics of paint layers. Z.Tech. Phys, 12(593-601), 1931.
[61] J. Tauc, R. Grigorovici, and A. Vancu. Optical properties and electronicstructure of amorphous germanium. physica status solidi (b), 15(2):627–637, 1966.
[62] Hong Li, Ivano E. Castelli, Kristian S. Thygesen, and Karsten W. Ja-cobsen. Strain sensitivity of band gaps of Sn-containing semiconductors.
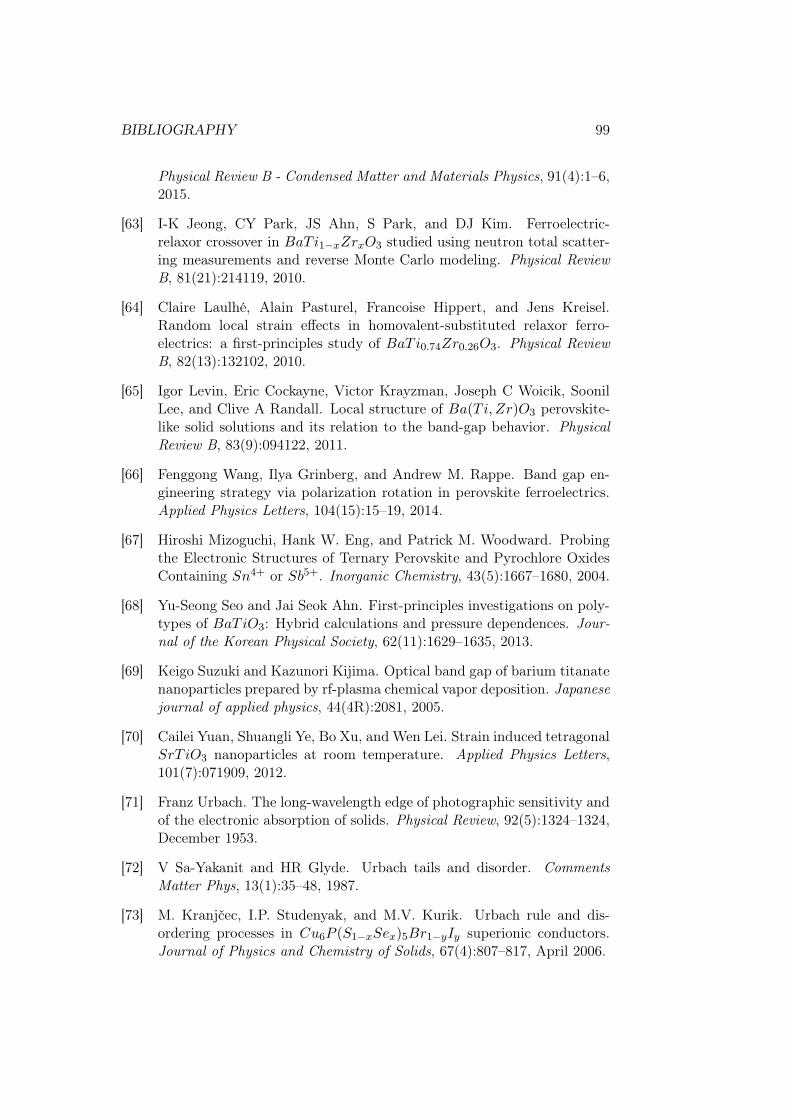
BIBLIOGRAPHY 99
Physical Review B - Condensed Matter and Materials Physics, 91(4):1–6,2015.
[63] I-K Jeong, CY Park, JS Ahn, S Park, and DJ Kim. Ferroelectric-relaxor crossover in BaTi1−xZrxO3 studied using neutron total scatter-ing measurements and reverse Monte Carlo modeling. Physical ReviewB, 81(21):214119, 2010.
[64] Claire Laulhé, Alain Pasturel, Francoise Hippert, and Jens Kreisel.Random local strain effects in homovalent-substituted relaxor ferro-electrics: a first-principles study of BaTi0.74Zr0.26O3. Physical ReviewB, 82(13):132102, 2010.
[65] Igor Levin, Eric Cockayne, Victor Krayzman, Joseph C Woicik, SoonilLee, and Clive A Randall. Local structure of Ba(T i, Zr)O3 perovskite-like solid solutions and its relation to the band-gap behavior. PhysicalReview B, 83(9):094122, 2011.
[66] Fenggong Wang, Ilya Grinberg, and Andrew M. Rappe. Band gap en-gineering strategy via polarization rotation in perovskite ferroelectrics.Applied Physics Letters, 104(15):15–19, 2014.
[67] Hiroshi Mizoguchi, Hank W. Eng, and Patrick M. Woodward. Probingthe Electronic Structures of Ternary Perovskite and Pyrochlore OxidesContaining Sn4+ or Sb5+. Inorganic Chemistry, 43(5):1667–1680, 2004.
[68] Yu-Seong Seo and Jai Seok Ahn. First-principles investigations on poly-types of BaTiO3: Hybrid calculations and pressure dependences. Jour-nal of the Korean Physical Society, 62(11):1629–1635, 2013.
[69] Keigo Suzuki and Kazunori Kijima. Optical band gap of barium titanatenanoparticles prepared by rf-plasma chemical vapor deposition. Japanesejournal of applied physics, 44(4R):2081, 2005.
[70] Cailei Yuan, Shuangli Ye, Bo Xu, and Wen Lei. Strain induced tetragonalSrT iO3 nanoparticles at room temperature. Applied Physics Letters,101(7):071909, 2012.
[71] Franz Urbach. The long-wavelength edge of photographic sensitivity andof the electronic absorption of solids. Physical Review, 92(5):1324–1324,December 1953.
[72] V Sa-Yakanit and HR Glyde. Urbach tails and disorder. CommentsMatter Phys, 13(1):35–48, 1987.
[73] M. Kranjčec, I.P. Studenyak, and M.V. Kurik. Urbach rule and dis-ordering processes in Cu6P (S1−xSex)5Br1−yIy superionic conductors.Journal of Physics and Chemistry of Solids, 67(4):807–817, April 2006.

100 BIBLIOGRAPHY
[74] S. H. Wemple. Polarization Fluctuations and the Optical-AbsorptionEdge in BaTiO3. Physical Review B, 2(7):2679–2689, October 1970.
[75] Thierry Pauporté and Daniel Lincot. Electrodeposition of semiconduc-tors for optoelectronic devices: results on zinc oxide. ElectrochimicaActa, 45(20):3345–3353, June 2000.
[76] John D. Dow. Urbach’s rule. Plenum Press, New York 1975, 1975.
[77] Yun Zhang, Yue Shen, Feng Gu, Mingming Wu, Yian Xie, and JianchengZhang. Influence of Fe ions in characteristics and optical propertiesof mesoporous titanium oxide thin films. Applied Surface Science,256(1):85–89, October 2009.
[78] A. V. Chadwick. High temperature transport in fluorites. RadiationEffects, 74(1-4):17–28, January 1983.
[79] I. P. Studenyak, M. Kranjcec, and B. M. Koperlyos. On the Urbachrule in SbSI ferroelectric crystal. Ukrainian Journal of Physical Optics,10(2):61–70, 2009.
[80] Charles Paillard. Photo-induced effects in multiferroics, 2016.
[81] Thierry Pauporté and Daniel Lincot. Electrodeposition of semiconduc-tors for optoelectronic devices: results on zinc oxide. ElectrochimicaActa, 45(20):3345–3353, June 2000.
[82] G. D. Cody, T. Tiedje, B. Abeles, B. Brooks, and Y. Goldstein. Disor-der and the optical-absorption edge of hydrogenated amorphous silicon.Physical Review Letters, 47(20):1480–1483, November 1981.
[83] Xiaofei Bai. Size and doping effect on the structure, transitions andoptical properties of multiferroic BiFeO3 particles for photocatalyticapplications, 2016.
[84] Vikash Mishra, Archna Sagdeo, Vipin Kumar, M. Kamal Warshi,Hari Mohan Rai, S. K. Saxena, Debesh R. Roy, Vinayak Mishra, RajeshKumar, and P. R. Sagdeo. Electronic and optical properties of BaTiO3
across tetragonal to cubic phase transition: An experimental and theo-retical investigation. Journal of Applied Physics, 122(6):065105, August2017.
[85] Yangzhong Wang. Synthesis and characterisation of acceptor-dopedBaSnO3 compounds as proton conductors, 2009.
[86] L Hafid, G. Godefroy, A. El Idrissi, and F.M. Michel-Calendini. Absorp-tion spectrum in the near U.V. and electronic structure of pure bariumtitanate. Solid State Communications, 66(8):841–845, 1988.

BIBLIOGRAPHY 101
[87] V Železný, D Chvostová, and D Šimek. The variation of PbT iO3 bandgapat ferroelectric phase transition. Journal of Physics: Condensed Matter,025501, 2015.
[88] L Xie and J Zhu. The Electronic Structures, Born Effective Charges,and Interatomic Force Constants in BaMO3 (M= Ti, Zr, Hf, Sn): AComparative First-Principles Study, journal = Journal of the AmericanCeramic Society. 95(11):3597–3604, 2012.
[89] David J Singh. Electric field gradients in BaTiO3 and KNbO3. Ferro-electrics, 153(1):183–187, 1994.
[90] Henry Krakauer, Rici Yu, Cheng-Zhang Wang, Karin M Rabe, andUmesh V Waghmare. Dynamic local distortions in KNbO3. Journalof Physics: Condensed Matter, 11(18):3779, 1999.
[91] D. Nuzhnyy, J. Petzelt, M. Savinov, T. Ostapchuk, V. Bovtun,M. Kempa, J. Hlinka, V. Buscaglia, M. T. Buscaglia, and P. Nanni.Broadband dielectric response of Ba(Zr, T i)O3 ceramics: From incipi-ent via relaxor and diffuse up to classical ferroelectric behavior. PhysicalReview B - Condensed Matter and Materials Physics, 86(1):1–9, 2012.
[92] J Hlinka, T Ostapchuk, D Nuzhnyy, J Petzelt, P Kuzel, Ch Kadlec,P Vanek, I Ponomareva, and L Bellaiche. Coexistence of the phonon andrelaxation soft modes in the terahertz dielectric response of tetragonalBaTiO3. Physical review letters, 101(16):167402, 2008.
[93] I. Ponomareva, L. Bellaiche, T. Ostapchuk, J. Hlinka, and J. Petzelt.Terahertz dielectric response of cubic BaTiO3. Physical Review B -Condensed Matter and Materials Physics, 77(1):1–4, 2008.
[94] Y. Luspin, J .L. Servoin, and F. Gervais. Soft mode spectroscopy inbarium titanate. Journal of Physics C: Solid State Physics, 13:3761–3773, 1980.
[95] Hoshina Takuya, Kanehara Kazuki, Takeda Hiroaki, and TsurumiTakaaki. Terahertz dielectric response of single-domain BaTiO3 mea-sured by far-infrared spectroscopic ellipsometry. Japanese Journal ofApplied Physics, 53(9S):09PD03, 2014.
[96] G Shirane, JD Axe, J Harada, and A Linz. Inelastic Neutron Scatteringfrom Single-Domain BaTiO3. Physical Review B, 2(9):3651, 1970.
[97] V. V. Shvartsman, W. Kleemann, J. Dec, Z. K. Xu, and S. G. Lu. Dif-fuse phase transition in BaTi1−xSnxO3 ceramics: An intermediate statebetween ferroelectric and relaxor behavior. Journal of Applied Physics,99(12):0–8, 2006.

102 BIBLIOGRAPHY
[98] Koustav Ganguly, Abhinav Prakash, Bharat Jalan, and C. Leighton.Mobility-electron density relation probed via controlled oxygen vacancydoping in epitaxial BaSnO3. APL Materials, 5(5):056102, May 2017.
[99] Shail Upadhyay, Ashok Kumar Sahu, Devendra Kumar, andOm Parkash. Probing electrical conduction behavior of BaSnO3. Jour-nal of Applied Physics, 84(2):828–832, July 1998.
[100] Ashok Kumar, BP Singh, RNP Choudhary, and Awalendra K Thakur.Ferroelectric phase transition in Te-modified BaSnO3. Materials Letters,59(14):1880–1888, 2005.
[101] S. Hodjati, C. Petit, V. Pitchon, and A. Kiennemann. Absorp-tion/desorption of NOx process on perovskites. Applied Catalysis B:Environmental, 27(2):117–126, July 2000.
[102] M D Fontana, K Laabidi, and B Jannot. Quasimodes and a central peakin BaTiO3. Journal of Physics: Condensed Matter, 6(42):8923–8930,oct 1994.
[103] J. D. Freire and R S Katiyar. Lattice dynamics of crystals with tetragonalBaTiO3 structure. Physical Review B, 37(4), 1988.
[104] C. CH Perry and DB Hall. Temperature Dependence of the RamanSpectrum of BaTiO3. Physical Review Letters, 15(17):700–702, 1965.
[105] J. L. Gervais, F. Servoin, A. M. Quittet, and Y. Luspin. Infrared andRaman responses in ferroelectric perovskite crystals: Apparent inconsis-tencies. Physical Review B, 21(5):2038–2041, 1980.
[106] K. Laabidi, M.D. Fontana, and B. Jannot. Underdamped soft phononin orthorhombic BaTiO3. Solid state communications, 76(6):765–768,1990.
[107] V. Buscaglia, M. T. Buscaglia, M. Viviani, L. Mitoseriu, P. Nanni,V. Trefiletti, P. Piaggio, I. Gregora, T. Ostapchuk, J. Pokorný, andJ. Petzelt. Grain size and grain boundary-related effects on the proper-ties of nanocrystalline barium titanate ceramics. Journal of the EuropeanCeramic Society, 26(14):2889–2898, 2006.
[108] Scalabrin A, Craves A S, Shima D S, and Porto S P S. TemperatureDependence of the A, and E Optical Phonons in BaTiO3. Physica StatusSolidi (b), 79:731–742, 1977.
[109] Lawrence H. Robins, Debra L. Kaiser, Lawrence D. Rotter, Peter K.Schenck, Gregory T. Stauf, and Daniel Rytz. Investigation of the struc-ture of barium titanate thin films by Raman spectroscopy. Journal ofApplied Physics, 76(11):7487–7498, 1994.

BIBLIOGRAPHY 103
[110] A Chaves, RS Katiyar, and SPS Porto. Coupled modes with A 1 sym-metry in tetragonal BaTiO3. Physical Review B, 10(8):3522, 1974.
[111] R Naik, JJ Nazarko, CS Flattery, UD Venkateswaran, VM Naik, MS Mo-hammed, GW Auner, JV Mantese, NW Schubring, AL Micheli, andAB Catalan. Temperature dependence of the Raman spectra of poly-crystalline Ba1−xSixT iO3. Physical Review B, 61(17):11367, 2000.
[112] Bog G. Kim, J.Y. Jo, and S.W. Cheong. Hybrid functional calculationof electronic and phonon structure of BaSnO3. Journal of Solid StateChemistry, 197:134–138, January 2013.
[113] Ashok Kumar, I. Rivera, and R. S. Katiyar. Investigation of local struc-ture of lead-free relaxor BaTi0.70Sn0.30O3 by Raman spectroscopy. Jour-nal of Raman Spectroscopy, 40(4):459–462, 2009.
[114] R Farhi, M El Marssi, A Simon, and J Ravez. A raman and dielec-tric study of ferroelectric ceramics. The European Physical Journal B-Condensed Matter and Complex Systems, 9(4):599–604, 1999.
[115] Tanmoy Maiti, R Guo, and AS Bhalla. Evaluation of experimental re-sume of BaZrxT i1−xO3 with perspective to ferroelectric relaxor family:An overview. Ferroelectrics, 425(1):4–26, 2011.
[116] Fernando Rubio-Marcos, Adolfo Del Campo, Pascal Marchet, and Jose FFernández. Ferroelectric domain wall motion induced by polarized light.Nature communications, 6, 2015.
[117] AG Razumnaya, Yu I Yuzyuk, IN Zakharchenko, Yu A Tikhonov, N Or-tega, A Kumar, RS Katiyar, M El Marssi, and IA Lukyanchuk. Phasetransition in ferroelectric BaTiO3/SrT iO3 superlattice: Raman spec-troscopy studies. Ferroelectrics, 501(1):61–69, 2016.
[118] Dmitry Nuzhnyy, Přemysl Vaněk, Jan Petzelt, Viktor Bovtun, Mar-tin Kempa, Ivan Gregora, Maxim Savinov, Radmila Krupková, Vá-clav Studnicka, Josef Bursík, Mihail Samoylovich, and Wilfried Schranz.Properties of BaTiO3 confined in nanoporous Vycor and artificial opalsilica. Processing and Application of Ceramics, 4(3):215–223, 2010.
[119] Shuangyi Liu, Limin Huang, Jackie Li, and Stephen Obrien. Intrinsicdielectric frequency dependent spectrum of a single domain tetragonalBaTiO3. Journal of Applied Physics, 112(1), 2012.
[120] Ph. Ghosez, J.-P. Michenaud, and X. Gonze. Dynamical atomic charges:The case of ABO3 compounds. Physical Review B, 58(10):6224–6240,September 1998.

104 BIBLIOGRAPHY
[121] Francois Jollet, Claudine Noguera, Martine Gautier, Nathalie Thromat,and Jean-Paul Duraud. Influence of oxygen vacancies on the electronicstructure of yttrium oxide. Journal of the American Ceramic Society,74(2):358–364, February 1991.
[122] Johannes Frantti, Y Fujioka, A Puretzky, Y Xie, Z-G Ye, and AM Glazer.A statistical model approximation for perovskite solid-solutions: A ra-man study of lead-zirconate-titanate single crystal. Journal of AppliedPhysics, 113(17):174104, 2013.
[123] Wen-Ku Chang, Shy-Feng Hsieh, Yuan-Haun Lee, Kuan-Neng Chen,Nan-Chung Wu, and A A Wang. X-ray diffraction studies of phase trans-formations between tetragonal and cubic phases in the BaSnxT i1−xO3
system. Journal of materials science, 33(7):1765–1768, 1998.
[124] Andrzej Koleżyński and Katarzyna Tkacz-Śmiech. From the molecularpicture to the band structure of cubic and tetragonal barium titanate.Ferroelectrics, 314(1):123–134, 2005.
[125] S. Sallis, D. O. Scanlon, S. C. Chae, N. F. Quackenbush, D. A. Fis-cher, J. C. Woicik, J. H. Guo, S. W. Cheong, and L. F J Piper. La-doped BaSnO3 - Degenerate perovskite transparent conducting oxide:Evidence from synchrotron x-ray spectroscopy. Applied Physics Letters,103(4):1–5, 2013.
[126] Joseph W Bennett, Ilya Grinberg, and Andrew M Rappe. Effect of sym-metry lowering on the dielectric response of BaZrO3. Physical ReviewB, 73(18):180102, 2006.

Annex
Annex A
UV-visible spectroscopy
1.5 2.0 2.5 3.0 3.5 4.0 4.5
0
1
2
3
4
5
6 x(Sn):
0
0.1
0.2
0.4
0.5
0.6
0.8
0.9
1
(E*F
KM
)1/2
E, eV
(a)
2.5 3.0 3.5 4.0 4.5
0
100
200
x(Sn):
0
0.1
0.2
0.4
0.5
0.6
0.8
0.9
1
(E*
FK
M)3
/2
E, eV
(b)
2.5 3.0 3.5 4.0 4.5
0.0
2.0x10⁴
4.0x10⁴
x(Sn):
0
0.1
0.2
0.4
0.5
0.6
0.8
0.9
1
(E*
FK
M)3
E, eV
(c)
Figure A1: The Tauc plot under different assumptions of its origin: (a) allowedindirect band gap; (b) forbidden direct band gap; (c) forbidden indirect bandgap
105

106 BIBLIOGRAPHY
Annex B
Raman spectra recorded in temperature for certain compo-sitions
(a)
200 400 600 800 1000
440 K
120 K
T, K:
500
480
460
440
420
400
380
360
340
320
300
280
260
240
220
200
180
160
140
120
100
80
Ram
an i
nte
nsi
ty
wavenumber, cm-1
240-280 K
(b)
200 400 600 800 1000
570
580
590
600
375
380
400
410
420
430
440
450
460
470
480
490
500
510
520
530
540
550
560
280
285
290
295
300
305
310
315
320
325
330
335
340
345
350
355
360
365
370
185
190
195
200
205
210
215
220
225
230
235
240
245
250
255
260
265
270
275
90
95
100
105
110
115
120
125
130
135
140
145
150
155
160
165
170
175
180
Ram
an i
nte
nsi
ty
wavenumber, cm-1
90 - 600 K
T, K:
(c)
200 400 600 800 1000
T, K:
570
540
510
480
450
420
390
360
330
300
290
260
230
200
150
90
Ram
an i
nte
nsi
ty
wavenumber, cm-1
(d)
Figure B1: Raman spectra recorder in temperature for compositions x(Sn):(a) 0; (b) 0.2, (c) 0.4, (d) 0.5

BIBLIOGRAPHY 107
Annex C
Full view of XPS spectra of different compositions
1200 1000 800 600 400 200 0
Ba
3p
3/2
x(Sn):
1
0.9
0.8
0.6
0.5
0.4
0.2
0.1
0
XP
S i
nte
nsi
ty
B.E.
Ba
3p
1/2
1065 1050
Figure C1: XPS survey spectra (inset: zoom of Ba 3p 3/2 peak)
Annex D
Le Bail profile fit of XRD data
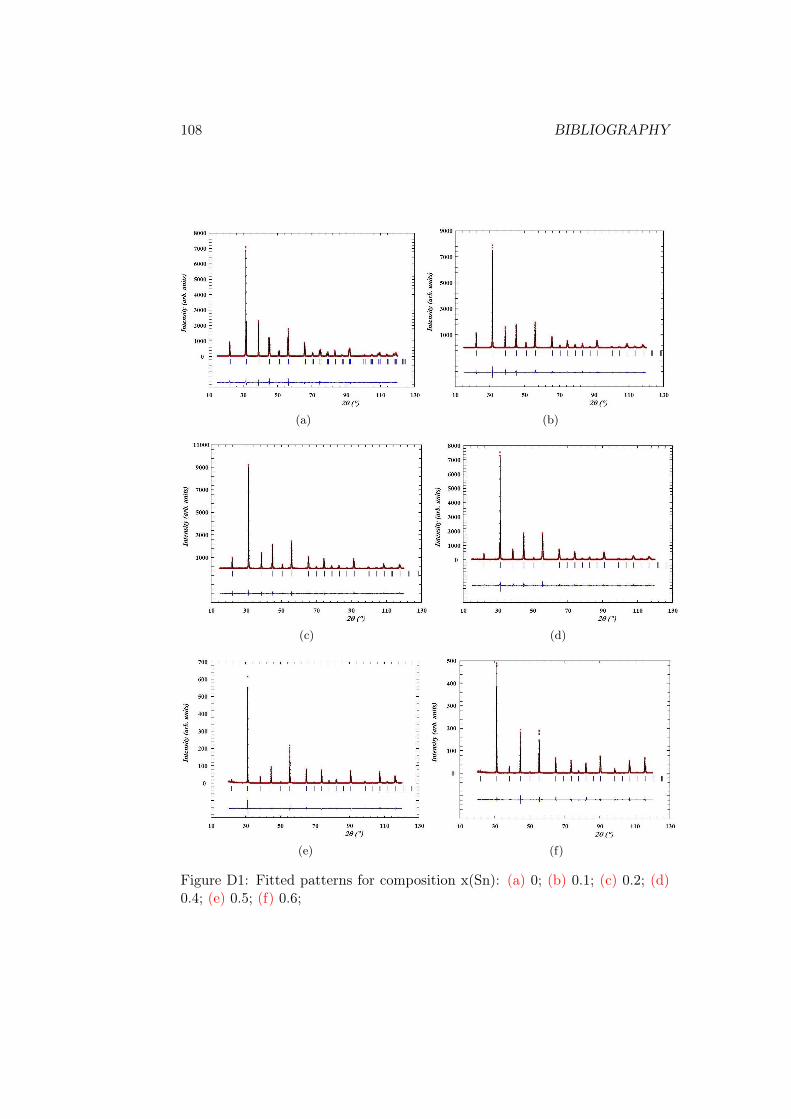
108 BIBLIOGRAPHY
(a) (b)
(c) (d)
(e) (f)
Figure D1: Fitted patterns for composition x(Sn): (a) 0; (b) 0.1; (c) 0.2; (d)0.4; (e) 0.5; (f) 0.6;

BIBLIOGRAPHY 109
(a) (b)
(c)
Figure D2: Fitted patterns for composition x(Sn): (a) 0.8; (b) 0.9; (c) 1
Table D1: Errors of the profile Le Bail fit for different compositions
x(Sn) Space group a, Å c, Å Rwp GOF
0 P4mm 3.9965 4.0325 15.99 1.40.1 Pm3̄m 4.0179 4.0179 17.56 1.50.2 Pm3̄m 4.0285 4.0285 16.84 1.470.4 Pm3̄m 4.0502 4.0502 16.06 1.370.5 Pm3̄m 4.0587 4.0587 12.38 1.50.6 Pm3̄m 4.0693 4.0693 14.62 1.880.8 Pm3̄m 4.0932 4.0932 13.61 1.220.9 Pm3̄m 4.1056 4.1056 11.54 1.541 Pm3̄m 4.1158 4.1158 16.72 1.38


Résumé complet de thèse
Les études des solutions solides de structure pérovskite permettent d’établirune connexion entre leur structure macroscopique et l’ordre polaire qui in-fluence les liaisons chimiques, et les propriétés optiques. Les propriétés (photo-voltaïques, piézoélectriques, diélectriques, électrocaloriques etc.) sont souventnon-linéaires et peuvent permettre de nouvelles fonctionnalités. Dans notretravail, nous nous sommes concentrés sur la solution solide BaSnxTi1−xO3
entre les composés chimiques purs BaTiO3 (ferroélectrique) et BaSnO3 (pa-raélectrique). Les valences similaires de Ti et de Sn (+4) doivent assurerl’absence de grandes concentrations de défauts. La présence de Sn peut contri-buer à la meilleure mobilité des charges par la présence des niveaux électro-niques Sn 5s 5p dans la bande de conduction.
Le diagramme de phases de BaSnxTi1−xO3 contient des compositions trèsdifférentes du point de vue de l’ordre polaire. En première approximation, àpartir des études détaillées pour 0<x(Sn)<0,3 il y a les ferroélectriques, oùles dipôles électriques sont ordonnés et les phases relaxeurs où il y rupture del’ordre polaire. Nous avons également étendu l’étude des propriétés au-delà dela composition x(Sn)=0,3.
Le premier chapitre décrit les études de la structure cristallographique pardiffraction des rayons X ainsi que de l’ordre polaire par spectroscopie diélec-trique. Puis, nous avons analysé une structure atomique (x=0,4) et les distor-sions locales de la phase relaxeur en utilisant la Microscopie Électronique enTransmission (MET). Bien que le volume de la maille unitaire évolue linéaire-ment avec la composition, nous avons pu préciser quelle était la séquence dephases :
• ferroélectrique (x(Sn)=0...0,1)
• les compositions présentant une transition diffuse où l’ordre ferrroélec-trique et desordre coexistent, avec une maille pseudo-cubique(x(Sn)=0,1...0,3)
• les relaxeurs avec une maille pseudo-cubique qui incluent des clustersnanoscopiques avec les distorsions polaires (x(Sn)>=0,3).
111
Les propriétés diélectriques des compositions riches en Ti viennent desdipôles d’origine ferroélectrique. Par contre, pour les compositions riches enSn, les dipôles de défauts peuvent jouer un rôle important.
La MET montre que les clusters polaires nanométriques des phases relaxeurx(Sn)=0,4 ont une taille plus petite que dans les compositions présentant unetransition diffuse, mais les valeurs des déplacements des Ti/Sn est plus grande.On observe des distorsions complexes avec une composante rhomboédriqueselon <111>.
Le deuxième chapitre présente les mesures d’absorption optique à tempéra-ture ambiante et en température, pour des compositions choisies, afin de relierles propriétés optiques à l’ordre polaire.
La bande interdite montre une variation non-linéaire en fonction de lacomposition. Elle croît d’une valeur ∼0.35 eV jusqu’à x(Sn)=0,8 et diminuepour les autres compositions. À partir de nos données, la bande interdite estdéfinie par les états élargis où les composantes individuelles Sn ou Ti ne sontpas séparables, nous amenant à supposer une hybridation.
On trouve la connexion entre la valeur de bande interdite et le type dedésordre sur x(Sn) pour les échantillons à température ambiante et en tem-pérature. La bande interdite change d’une façon continue dans les limitesd’une phase, puis elle diminue d’une façon non-linéaire avec l’augmentation detempérature près de la transition de phase, avant de reprendre une évolutionlinéaire. De plus, la pente de Eg(T ) change entre la phase avec les corréla-tions polaires statiques et la phase où elles sont absentes. La largeur de laqueue d’absorption exponentielles (dites queue d’Urbach) est couplée au typede désordre polaire mais, pour les compositions riches en Sn, le désordre estdéfini par l’activation des défauts.
En raison de l’importance du désordre local pour les propriétés optiques,dans le dernier chapitre de ce manuscrit la structure locale et le désordre sontanalysés en connexion avec la liaison chimique. Nous nous sommes concentréssur la transition de phase et la spectroscopie Raman a été employée pourdiscerner les types différents de distorsions et les caractériser qualitativement.Cette étude, couplée avec les résultats des méthodes utilisées dans les chapitresprécédents, nous a permis de redéfinir la séquence de phases à températureambiante :
• structures de type ferroélectrique 0<x(Sn)≤0,1
• x(Sn)=0,2 est la seule composition de notre étude présentant une tran-sition diffuse amenant à une coexistence de phase. Une composante fer-roélectrique est plus importante que la phase relaxeur selon les mesuresdiélectriques. La distorsion est très faible, comme x(Sn)=0.2 est justeau-dessous de TCW où la composante de polarisation macroscopique dis-paraît. La distorsion est orthorhombique avec une faible composanterhomboédrique.
112
• x(Sn)=0,4 – relaxeur avec des distorsions identique à x(Sn)=0,2
• 0,5<x(Sn)<0,75 relaxeur avec les distorsions orthorhombique et rhom-boédrique, la dernière augmentant avec la composition.
• 0,75<x(Sn)≤0,9 les clusters qui contiennent les atomes de Ti dans lamatrice BaSnO3 cubique. Les distorsions préservent les caractéristiquesidentiques à celle juste avant la limite de percolation d’atomes Ti(O + R), probablement parce que les contraintes chimiques dans lesclusters ne changent pas.
Dans les études en température Eg=f(T), la bande interdite réagit à toutchangement de phase où la symétrie est modifiée (e.g. rhomboédrique - or-thorhombique, comme pour x(Sn)=0.2 dans la zone de transition diffuse) etpas au désordre. Le mécanisme de la variation de la zone interdite est lecouplage avec les phonons de type Axe, qui sont détectés en Raman, qui mo-difient une degré de superposition des orbitales d’oxygène et des atomes Bde la structure-type ABO3. Ces orbitales forment la liaison chimique π, quidétermine l’énergie minimale de la bande de conduction. Le dégrée de super-position modifie aussi la distribution des charges électroniques effectives desatomes. On peut analyser ces charges qualitativement avec la Spectrométriede photo-électrons X. Dans une maille distordue, l’angle de la liaison chimiqueO-B-O n’est pas exactement 180◦ et il y a croissance simultanée des chargesélectroniques des atomes O et B, ce qui est interdit dans le cas cubique par-fait par le principe de Pauli. Cette tendance apparaît entre x(Sn)=0 et 0,8,puis le surplus de charge diminue pour x(Sn)=0,8...1. Ceci apporte la preuveque l’augmentation de la bande interdite est causée par l’augmentation de ladistorsion rhomboédrique, et la diminution qui suit est reliée à la disparitionprogressive des clusters polaires dans la matrice de BaSnO3.
113


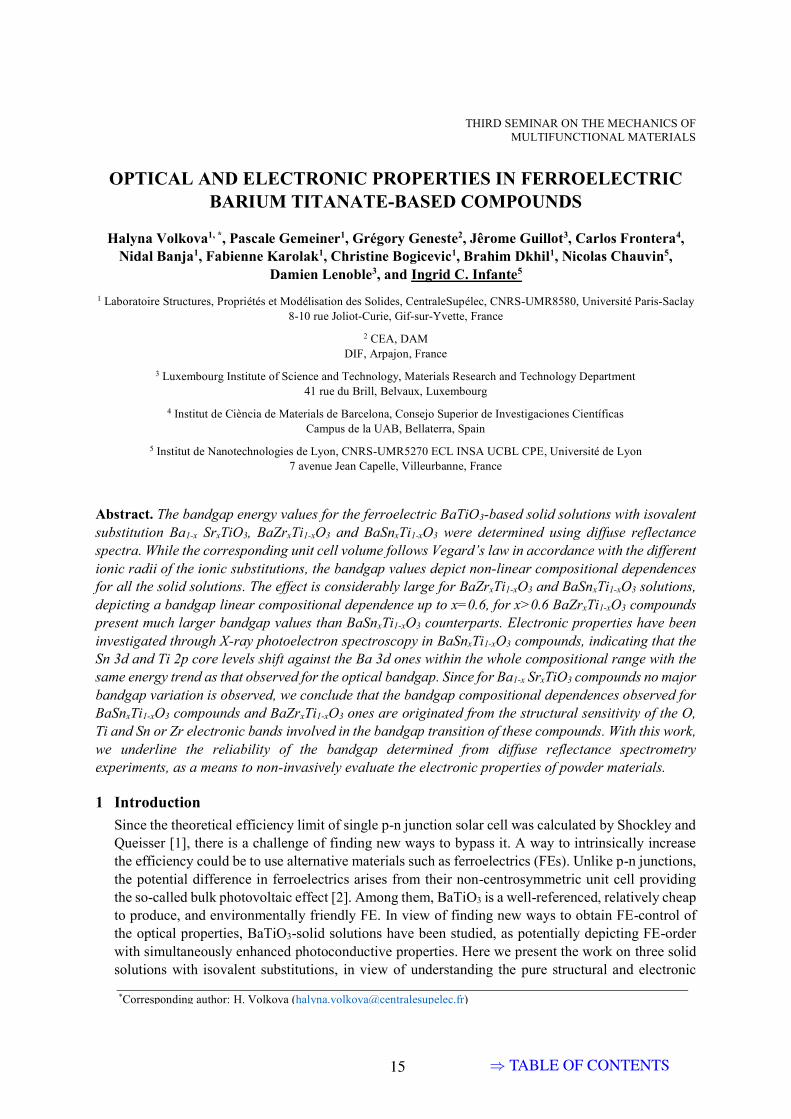
THIRD SEMINAR ON THE MECHANICS OF MULTIFUNCTIONAL MATERIALS
1
*Corresponding author: H. Volkova ([email protected])
OPTICAL AND ELECTRONIC PROPERTIES IN FERROELECTRIC BARIUM TITANATE-BASED COMPOUNDS
Halyna Volkova1, *, Pascale Gemeiner1, Grégory Geneste2, Jêrome Guillot3, Carlos Frontera4, Nidal Banja1, Fabienne Karolak1, Christine Bogicevic1, Brahim Dkhil1, Nicolas Chauvin5,
Damien Lenoble3, and Ingrid C. Infante5 1 Laboratoire Structures, Propriétés et Modélisation des Solides, CentraleSupélec, CNRS-UMR8580, Université Paris-Saclay
8-10 rue Joliot-Curie, Gif-sur-Yvette, France 2 CEA, DAM
DIF, Arpajon, France 3 Luxembourg Institute of Science and Technology, Materials Research and Technology Department
41 rue du Brill, Belvaux, Luxembourg 4 Institut de Ciència de Materials de Barcelona, Consejo Superior de Investigaciones Científicas
Campus de la UAB, Bellaterra, Spain 5 Institut de Nanotechnologies de Lyon, CNRS-UMR5270 ECL INSA UCBL CPE, Université de Lyon
7 avenue Jean Capelle, Villeurbanne, France
Abstract. The bandgap energy values for the ferroelectric BaTiO3-based solid solutions with isovalent substitution Ba1-x SrxTiO3, BaZrxTi1-xO3 and BaSnxTi1-xO3 were determined using diffuse reflectance spectra. While the corresponding unit cell volume follows Vegard’s law in accordance with the different ionic radii of the ionic substitutions, the bandgap values depict non-linear compositional dependences for all the solid solutions. The effect is considerably large for BaZrxTi1-xO3 and BaSnxTi1-xO3 solutions, depicting a bandgap linear compositional dependence up to x=0.6, for x>0.6 BaZrxTi1-xO3 compounds present much larger bandgap values than BaSnxTi1-xO3 counterparts. Electronic properties have been investigated through X-ray photoelectron spectroscopy in BaSnxTi1-xO3 compounds, indicating that the Sn 3d and Ti 2p core levels shift against the Ba 3d ones within the whole compositional range with the same energy trend as that observed for the optical bandgap. Since for Ba1-x SrxTiO3 compounds no major bandgap variation is observed, we conclude that the bandgap compositional dependences observed for BaSnxTi1-xO3 compounds and BaZrxTi1-xO3 ones are originated from the structural sensitivity of the O, Ti and Sn or Zr electronic bands involved in the bandgap transition of these compounds. With this work, we underline the reliability of the bandgap determined from diffuse reflectance spectrometry experiments, as a means to non-invasively evaluate the electronic properties of powder materials.
1 Introduction Since the theoretical efficiency limit of single p-n junction solar cell was calculated by Shockley and Queisser [1], there is a challenge of finding new ways to bypass it. A way to intrinsically increase the efficiency could be to use alternative materials such as ferroelectrics (FEs). Unlike p-n junctions, the potential difference in ferroelectrics arises from their non-centrosymmetric unit cell providing the so-called bulk photovoltaic effect [2]. Among them, BaTiO3 is a well-referenced, relatively cheap to produce, and environmentally friendly FE. In view of finding new ways to obtain FE-control of the optical properties, BaTiO3-solid solutions have been studied, as potentially depicting FE-order with simultaneously enhanced photoconductive properties. Here we present the work on three solid solutions with isovalent substitutions, in view of understanding the pure structural and electronic
H. Volkova, P. Gemeiner, G. Geneste, J. Guillot, C. Frontera, N. Banja, F. Karolak, C. Bogicevic, B. Dkhil, N. Chauvin, D. Lenoble, and I. C. Infante
2
effects and minimizing the point defect contributions. With Sr2+ substituting Ba2+, the Ba1-x SrxTiO3
is a family of solid solutions with ferroelectricity remaining at low temperature up to x_Sr~0.9 [3]. BaZrxTi1-xO3 and BaSnxTi1-xO3 are solid solutions with Ti4+ being substituted by Zr4+ and Sn4+, respectively, thus presenting conduction band where Zr 4d and Sn 5s 5p states will be added to Ti 3d ones, which in principle will depict much different effective mass and mobility, for the potential photoconduction properties that we are seeking. The phase diagrams of BaZrxTi1-xO3 [4] and BaSnxTi1-xO3 [5] display rich polar features, evolving at room temperature from a pure tetragonal FE in the Ti-rich region towards a paraelectric cubic structure in the Ti-poor region. In-between, the compositions are FE-relaxors characterized by polar disorder and average cubic structure.
2 Experimental procedures Ba1-xSrxTiO3 (x_Sr = 0, 0.25, 0.5, 1), BaZrxTi1-xO3 (x_Zr = 0, 0.1, 0.2, 0.3, 0.4, 0.5, 0.6, 0.7, 0.8, 0.9, 1) and BaSnxTi1-xO3 (x_Sn = 0, 0.1, 0.2, 0.4, 0.5, 0.6, 0.8, 0.9, 1) samples were synthesized by solid state reaction from starting materials, BaCO3 (99.9%), SrCO3 (99.9%), TiO2 (99%), ZrO2 (99.9%), and SnO2 (99.9%). After homogenization in a mortar, by ultrasonic bath and by magnetic mixing, the powders were calcined at temperatures between 800°C and 1200°C, and subsequently ground with polyvinyl alcohol and pressed into pellets. Two annealing steps at 600°C and 800°C insured the evaporation of binding agent. The sintering was held at temperatures of 1280-1450°C adjusting the dwell times, resulting in pellet density of ~92-95%. Structural evaluation by X-ray diffraction (XRD) was performed using a Bruker D2 Phaser diffractometer on finely ground and annealed powders, with 0.02º step and acquisition times adjusted for different angular ranges (10 sec/step for 2q=20-35°, 30 sec/step for 35-60°, 55 sec/step for 60-120°). Unit cell volume was determined using Le Bail analysis through devoted crystallographic software (Jana2006). The ultraviolet-visible-near-infrared spectrometry experiments were performed on a Perkin Elmer Lambda 850 spectrometer in diffuse reflectance geometry using a Harrick’s Praying MantisTM accessory, from finely grinded and annealed powders to minimize mechanical stresses. From the raw reflectance, R, the absorption coefficient k is determined according to Kubelka-Munk reemission function FKM transformation [6], within the assumption the scattering coefficient s is independent of the photon energy:
= = 1−2 . (1)
The optical bandgap is determined from a linear fit to the onset of the absorption edge obtained after converting the FKM following Tauc formalism, which for the present study we consider as direct bandgap. X-ray photoelectron spectroscopy (XPS) studies were carried out on powder and ceramic samples. Axis Ultra DLD spectrometer with Al Kα X-ray source operated at 50W was used, together with charge neutralizer. For the analysis of the XPS data (CasaXPS), we have used the internal reference of the Ba 3d7/2 core level energy, fixed at 778.5eV, as considered to be the ion with very limited changes in its electronic state due to chemical, electronic and structural effects.
3 Results and Discussion From the XRD collected (Figure 1a-c), we deduce the stabilization of a pure perovskite phase for each solid solution compound, with unit cell volume following Vegard’s law (Figure 1d). The larger compositional slope for Zr-compounds than for Sn-ones is in agreement with the expected effect induced by the difference in ionic radius of Zr4+ against Sn4+, depicting the Sr2+-compounds a volume reduction, as expected [8].
Optical properties of the different compositions are shown in Figure 2a-d. Diffuse reflectance raw data in Figure 2a point out the large absorption differences of parent compounds. Optical absorption features are seen in the Kubelka-Munk functions FKM depending of the solid solution. A large increase of FKM is characteristic of the optical absorption edge at a given photon energy, being the
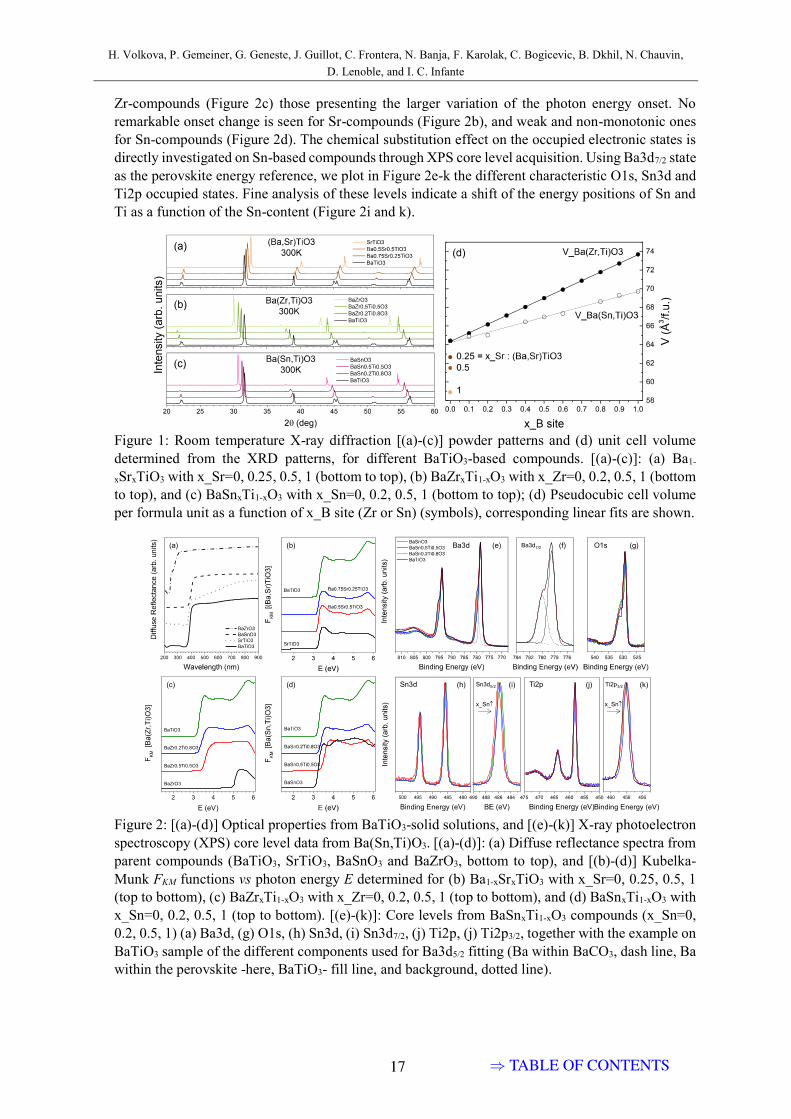
H. Volkova, P. Gemeiner, G. Geneste, J. Guillot, C. Frontera, N. Banja, F. Karolak, C. Bogicevic, B. Dkhil, N. Chauvin, D. Lenoble, and I. C. Infante
3
Zr-compounds (Figure 2c) those presenting the larger variation of the photon energy onset. No remarkable onset change is seen for Sr-compounds (Figure 2b), and weak and non-monotonic ones for Sn-compounds (Figure 2d). The chemical substitution effect on the occupied electronic states is directly investigated on Sn-based compounds through XPS core level acquisition. Using Ba3d7/2 state as the perovskite energy reference, we plot in Figure 2e-k the different characteristic O1s, Sn3d and Ti2p occupied states. Fine analysis of these levels indicate a shift of the energy positions of Sn and Ti as a function of the Sn-content (Figure 2i and k).
Figure 1: Room temperature X-ray diffraction [(a)-(c)] powder patterns and (d) unit cell volume determined from the XRD patterns, for different BaTiO3-based compounds. [(a)-(c)]: (a) Ba1-
xSrxTiO3 with x_Sr=0, 0.25, 0.5, 1 (bottom to top), (b) BaZrxTi1-xO3 with x_Zr=0, 0.2, 0.5, 1 (bottom to top), and (c) BaSnxTi1-xO3 with x_Sn=0, 0.2, 0.5, 1 (bottom to top); (d) Pseudocubic cell volume per formula unit as a function of x_B site (Zr or Sn) (symbols), corresponding linear fits are shown.
Figure 2: [(a)-(d)] Optical properties from BaTiO3-solid solutions, and [(e)-(k)] X-ray photoelectron spectroscopy (XPS) core level data from Ba(Sn,Ti)O3. [(a)-(d)]: (a) Diffuse reflectance spectra from parent compounds (BaTiO3, SrTiO3, BaSnO3 and BaZrO3, bottom to top), and [(b)-(d)] Kubelka-Munk FKM functions vs photon energy E determined for (b) Ba1-xSrxTiO3 with x_Sr=0, 0.25, 0.5, 1 (top to bottom), (c) BaZrxTi1-xO3 with x_Zr=0, 0.2, 0.5, 1 (top to bottom), and (d) BaSnxTi1-xO3 with x_Sn=0, 0.2, 0.5, 1 (top to bottom). [(e)-(k)]: Core levels from BaSnxTi1-xO3 compounds (x_Sn=0, 0.2, 0.5, 1) (a) Ba3d, (g) O1s, (h) Sn3d, (i) Sn3d7/2, (j) Ti2p, (j) Ti2p3/2, together with the example on BaTiO3 sample of the different components used for Ba3d5/2 fitting (Ba within BaCO3, dash line, Ba within the perovskite -here, BaTiO3- fill line, and background, dotted line).
500 495 490 485 480
Binding Energy (eV)
(e) (g)
(h) (i)
(f) O1s
Sn3d Ti2p
Ba3d(a) Ba3d7/2
460 458 456
Binding Energy (eV)
(j) (k)Ti2p3/2Sn3d5/2
x_Sn x_Sn
2 3 4 5 6
BaTiO3
BaZr0.2Ti0.8O3
BaZr0.5Ti0.5O3
BaZrO3
E (eV)
(b)
(c) (d)
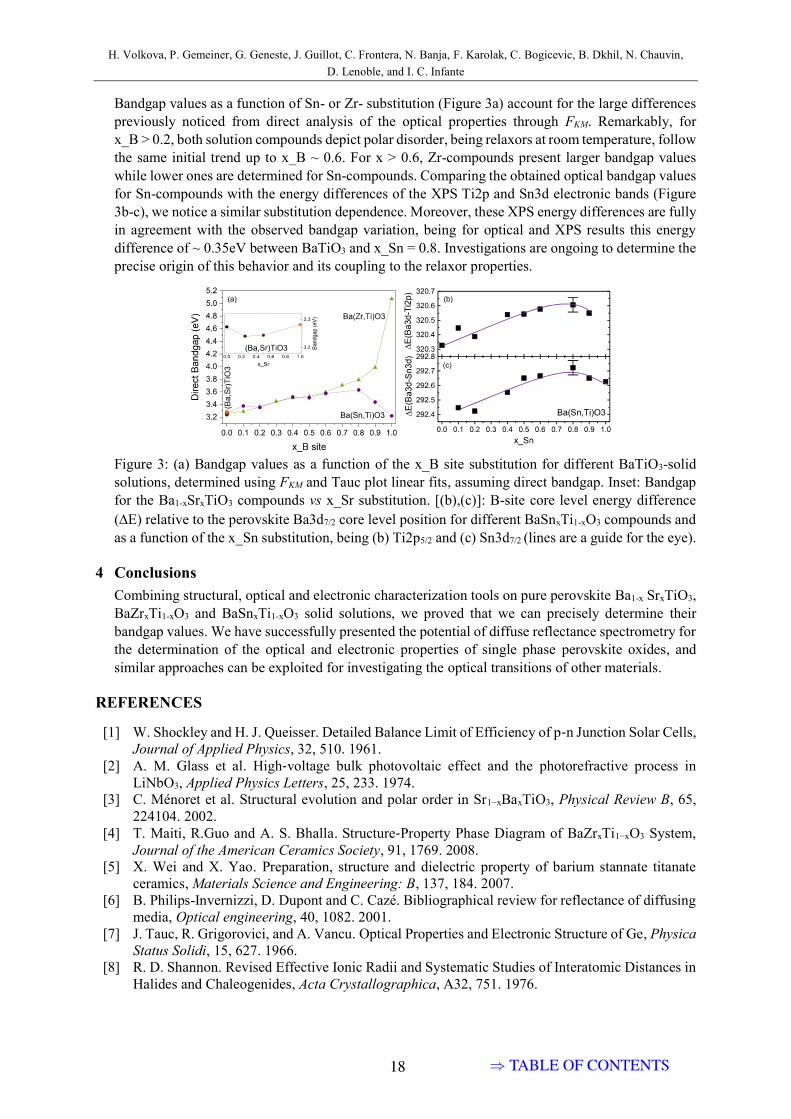
H. Volkova, P. Gemeiner, G. Geneste, J. Guillot, C. Frontera, N. Banja, F. Karolak, C. Bogicevic, B. Dkhil, N. Chauvin, D. Lenoble, and I. C. Infante
4
Bandgap values as a function of Sn- or Zr- substitution (Figure 3a) account for the large differences previously noticed from direct analysis of the optical properties through FKM. Remarkably, for x_B > 0.2, both solution compounds depict polar disorder, being relaxors at room temperature, follow the same initial trend up to x_B ~ 0.6. For x > 0.6, Zr-compounds present larger bandgap values while lower ones are determined for Sn-compounds. Comparing the obtained optical bandgap values for Sn-compounds with the energy differences of the XPS Ti2p and Sn3d electronic bands (Figure 3b-c), we notice a similar substitution dependence. Moreover, these XPS energy differences are fully in agreement with the observed bandgap variation, being for optical and XPS results this energy difference of ~ 0.35eV between BaTiO3 and x_Sn = 0.8. Investigations are ongoing to determine the precise origin of this behavior and its coupling to the relaxor properties.
Figure 3: (a) Bandgap values as a function of the x_B site substitution for different BaTiO3-solid solutions, determined using FKM and Tauc plot linear fits, assuming direct bandgap. Inset: Bandgap for the Ba1-xSrxTiO3 compounds vs x_Sr substitution. [(b),(c)]: B-site core level energy difference (DE) relative to the perovskite Ba3d7/2 core level position for different BaSnxTi1-xO3 compounds and as a function of the x_Sn substitution, being (b) Ti2p5/2 and (c) Sn3d7/2 (lines are a guide for the eye).
4 Conclusions Combining structural, optical and electronic characterization tools on pure perovskite Ba1-x SrxTiO3, BaZrxTi1-xO3 and BaSnxTi1-xO3 solid solutions, we proved that we can precisely determine their bandgap values. We have successfully presented the potential of diffuse reflectance spectrometry for the determination of the optical and electronic properties of single phase perovskite oxides, and similar approaches can be exploited for investigating the optical transitions of other materials.
REFERENCES
[1] W. Shockley and H. J. Queisser. Detailed Balance Limit of Efficiency of p‐n Junction Solar Cells, Journal of Applied Physics, 32, 510. 1961.
[2] A. M. Glass et al. High‐voltage bulk photovoltaic effect and the photorefractive process in LiNbO3, Applied Physics Letters, 25, 233. 1974.
[3] C. Ménoret et al. Structural evolution and polar order in Sr1−xBaxTiO3, Physical Review B, 65, 224104. 2002.
[4] T. Maiti, R.Guo and A. S. Bhalla. Structure‐Property Phase Diagram of BaZrxTi1−xO3 System, Journal of the American Ceramics Society, 91, 1769. 2008.
[5] X. Wei and X. Yao. Preparation, structure and dielectric property of barium stannate titanate ceramics, Materials Science and Engineering: B, 137, 184. 2007.
[6] B. Philips-Invernizzi, D. Dupont and C. Cazé. Bibliographical review for reflectance of diffusing media, Optical engineering, 40, 1082. 2001.
[7] J. Tauc, R. Grigorovici, and A. Vancu. Optical Properties and Electronic Structure of Ge, Physica Status Solidi, 15, 627. 1966.
[8] R. D. Shannon. Revised Effective Ionic Radii and Systematic Studies of Interatomic Distances in Halides and Chaleogenides, Acta Crystallographica, A32, 751. 1976.
Copyright © 2022 FDOKUMEN