these.pdf - Archives-Ouvertes.fr
293
HAL Id: tel-01940909 https://tel.archives-ouvertes.fr/tel-01940909 Submitted on 30 Nov 2018 HAL is a multi-disciplinary open access archive for the deposit and dissemination of sci- entific research documents, whether they are pub- lished or not. The documents may come from teaching and research institutions in France or abroad, or from public or private research centers. L’archive ouverte pluridisciplinaire HAL, est destinée au dépôt et à la diffusion de documents scientifiques de niveau recherche, publiés ou non, émanant des établissements d’enseignement et de recherche français ou étrangers, des laboratoires publics ou privés. Experimental study of the behavior of colonies of environmentally-assisted short cracks by digital image correlation, acoustic emission and electrochemical noise José Bolivar Vina To cite this version: José Bolivar Vina. Experimental study of the behavior of colonies of environmentally-assisted short cracks by digital image correlation, acoustic emission and electrochemical noise. Materials. Université de Lyon, 2017. English. NNT: 2017LYSEI059. tel-01940909
-
Upload
khangminh22 -
Category
Documents
-
view
2 -
download
0
Transcript of these.pdf - Archives-Ouvertes.fr

HAL Id: tel-01940909https://tel.archives-ouvertes.fr/tel-01940909
Submitted on 30 Nov 2018
HAL is a multi-disciplinary open accessarchive for the deposit and dissemination of sci-entific research documents, whether they are pub-lished or not. The documents may come fromteaching and research institutions in France orabroad, or from public or private research centers.
L’archive ouverte pluridisciplinaire HAL, estdestinée au dépôt et à la diffusion de documentsscientifiques de niveau recherche, publiés ou non,émanant des établissements d’enseignement et derecherche français ou étrangers, des laboratoirespublics ou privés.
Experimental study of the behavior of colonies ofenvironmentally-assisted short cracks by digital image
correlation, acoustic emission and electrochemical noiseJosé Bolivar Vina
To cite this version:José Bolivar Vina. Experimental study of the behavior of colonies of environmentally-assisted shortcracks by digital image correlation, acoustic emission and electrochemical noise. Materials. Universitéde Lyon, 2017. English. �NNT : 2017LYSEI059�. �tel-01940909�

N°d’ordre NNT :
2017LYSEI059
THESE de DOCTORAT DE L’UNIVERSITE DE LYON opérée au sein de
L'institut national des sciences appliquées de Lyon
Ecole Doctorale N° ED34
Ecole Doctorale matériaux de Lyon
Spécialité: Matériaux
Soutenue publiquement le 07/07/2017, par :
José Bolivar
Ingénieur en génie des matériaux
Experimental study of the behavior of colonies of environmentally-assisted
short cracks by Digital Image
Correlation, Acoustic Emission and
Electrochemical Noise
Devant le jury composé de :
M. NOGUEIRA Ricardo Professeur – The Petroleum Institute Rapporteur
M. DESQUINES Jean Docteur HDR – IRSN Rapporteur
M. WOLSKI Krzysztof Professeur – Ecoles des Mines St. Etienne Président
Mme. FREGONESE Marion Professeur – INSA de Lyon Directrice de thèse
M. RETHORE Julien Directeur de Recherches – EC Nantes Directeur de thèse
M. COMBRADE Pierre Docteur – ACXCOR Invité
Mme. DURET Claude Docteur – Institut de la Corrosion Invitée
Cette thèse est accessible à l'adresse : http://theses.insa-lyon.fr/publication/2017LYSEI059/these.pdf © [J. Bolivar], [2017], INSA Lyon, tous droits réservés

Abstract
José Bolivar
Thèse en Sciences des Matériaux / 2017
Institut national des sciences appliquées de Lyon
Résumé
Ce travail s'inscrit dans le contexte d'une meilleure prédiction de la durée de vie de structures
soumises au risque d'amorçage et de propagation de fissures multiples de corrosion sous
contrainte (CSC). Ainsi, en développant une méthodologie expérimentale originale basée sur
des mesures conjointes de corrélation d'images numériques (DIC), d'émission acoustique (EA)
et de bruit électrochimique (EN), et leur analyse, ce travail vise à contribuer à l'amélioration
de la compréhension des mécanismes impliqués dans le développement de colonies de fissures
courtes de CSC qui interagissent entre elles, et à la simulation du comportement de cette
colonie. Le choix de conditions optimales de traitement thermique d'un alliage base -Ni et de
pH d'une solution de polythionate, a permis la maitrise des paramètres géométriques et
morphologiques de colonies de fissures intergranulaires, qui ont été investiguées par DIC
grâce à l'optimisation d'une préparation de surface adaptée. Les différentes phases de
propagation d'une fissure unique et d'une colonie de fissures ont été identifiées, de même que
les mécanismes associés, par des expérimentations et analyses réalisées en 2D et en 3D. Cette
approche expérimentale innovante a permis de poser les bases d'une approche numérique puis
de la valider. Un focus particulier a été porté sur l'EN au travers d'une analyse critique des
perturbations engendrées par le bruit de l'instrumentation et par l'asymétrie du système
d'étude. Les limitations de la technique pour son application à l'étude quantitative de la
corrosion sous contrainte ont été évaluées sur la base des résultats de l'étude. Une transposition
de la démarche expérimentale à hautes pressions et températures est proposée comme
perspective à court terme de ce travail, qui permet également d'envisager la prise en compte
de différents modes de propagation des fissures en lien avec la microstructure du matériau
dans l'approche numérique.
Cette thèse est accessible à l'adresse : http://theses.insa-lyon.fr/publication/2017LYSEI059/these.pdf © [J. Bolivar], [2017], INSA Lyon, tous droits réservés

Abstract
José Bolivar
Thèse en Sciences des Matériaux / 2017
Institut national des sciences appliquées de Lyon
Abstract
This work concerns with the current needs of enhancing the tools used for predicting the
remnant lifetime of structures subjected to the risk of initiation and propagation of multiple
stress corrosion cracks (SCC). The approach consists in developing an original experimental
methodology based on joint measurements of digital image correlation (DIC), acoustic
emission (EA) and electrochemical noise (EN). The final objective is to contribute to both the
understanding of the mechanisms involved in the development of interacting short stress
corrosion cracks and to the modeling of the colony behavior. The choice of optimal conditions
for the heat treatment of a Nickel-base alloy and for the pH of a polythionate solution allowed
controlling the morphological parameters of intergranular cracks colonies, which were
investigated by DIC owning to an optimized suitable surface treatment. The different
propagation stages of a single crack and some colonies were identified, together with the
involved mechanisms, through experiments and analyses performed in 2D and 3D. This
innovative experimental approach allowed settling the basements of the numerical modeling
and validating it. A particular attention was focused on EN measurements through a critical
analysis of the perturbations generated by the instrumental noise and the asymmetry of the
studied system. The limitations of the technique for its application to the quantitative study
of SCC were evaluated on the basis of the present results. A transposal of the experimental
approach towards high temperature and pressure conditions of test was finally proposed as a
short-term prospect of this work, also allowing considering other modes of crack propagation
linked to the material microstructure in the numerical approach.
Cette thèse est accessible à l'adresse : http://theses.insa-lyon.fr/publication/2017LYSEI059/these.pdf © [J. Bolivar], [2017], INSA Lyon, tous droits réservés

Table of contents
José Bolivar I
Thèse en Sciences des Matériaux / 2017
Institut national des sciences appliquées de Lyon
Table of contents
GLOSSARY......................................................................................................... VI
Acronyms ................................................................................................................. VI
Notation for electrochemical variables ................................................................... VIII
Notation for mechanical variables .............................................................................. X
DEDICATION ..................................................................................................... XI
ACKNOWLEDGMENT .................................................................................... XII
I GENERAL INTRODUCTION ....................................................................... 1
I.1 Introduction ..................................................................................................... 2
I.1.1 Context of the study ....................................................................................... 2
I.1.2 Objectives of this work .................................................................................. 4
I.1.3 Overview of the manuscript ............................................................................ 6
II LITERATURE REVIEW ............................................................................... 7
II.1 Introduction ................................................................................................. 9
II.2 Stress Corrosion Cracking mechanisms and models ................................... 9
II.2.1 Crack initiation ......................................................................................... 10
II.2.2 Crack propagation .................................................................................... 11
II.2.3 Synopsis ................................................................................................... 16
II.3 Multiple cracking problem ......................................................................... 17
II.3.1 Crack interactions and crack colony behavior ............................................ 18
II.3.2 Multiple cracking and lifetime predictions ................................................ 22
II.3.3 Synopsis ................................................................................................... 23
II.4 Intergranular stress corrosion cracking of Austenitic Stainless Steels (ASS)
and Nickel base alloys in solutions containing polythionic acids .................... 24
II.4.1 Polythionic Acids ..................................................................................... 24
II.4.2 PTA-SCC mechanism in ASS and Nickel base alloys ................................ 25
II.4.3 Synopsis ................................................................................................... 28
II.5 Experimental approach for a quantitative in-situ evaluation of multiple stress
corrosion cracks propagation .......................................................................... 30
II.5.1 Digital Image correlation .......................................................................... 30
II.5.2 Acoustic Emission technique .................................................................... 34
II.5.3 Electrochemical Noise technique .............................................................. 37
Cette thèse est accessible à l'adresse : http://theses.insa-lyon.fr/publication/2017LYSEI059/these.pdf © [J. Bolivar], [2017], INSA Lyon, tous droits réservés

Table of contents
José Bolivar II
Thèse en Sciences des Matériaux / 2017
Institut national des sciences appliquées de Lyon
Chapter Summary .................................................................................................. 56
III. EXPERIMENTAL METHODOLOGY ..................................................... 59
III.1 Introduction ............................................................................................... 61
III.2 Material characterization and preparation ............................................... 61
III.2.1 Material ................................................................................................... 61
III.2.2 Sample geometry ...................................................................................... 62
III.2.3 Characterization of the material ................................................................ 64
III.2.4 Study of the surface treatment for Digital Image Correlation (2D)
measurements (surface patterning) ............................................................ 66
III.2.5 SCC Test solution ..................................................................................... 68
III.2.6 Preparation of the Long Tensile Samples (LTS) and the Counter-Electrodes
for the in-situ Stress Corrosion Cracking tests at room temperature ............ 68
III.2.7 Description of the Stress Corrosion Cracking tests on LTS samples ........... 69
III.2.8 Description of the Stress Corrosion Cracking tests under four-point
bending… ................................................................................................. 70
III.2.9 Preparation of the Small Tensile Specimens (STS) for the In-situ Stress
Corrosion Cracking tests by using X-ray synchrotron tomography ............. 71
III.2.10 Description of the in-situ Stress Corrosion Cracking tests with the STS
samples (X-ray tomography) ..................................................................... 72
III.3 In-situ monitoring techniques used during the Stress Corrosion Cracking
tests ............................................................................................................. 73
III.3.1 Digital Image Correlation measurements ................................................... 73
III.3.2 Electrochemical Noise measurements ........................................................ 75
III.3.3 Acoustic Emission measurements .............................................................. 76
III.3.4 Electrochemical Impedance Spectroscopy (EIS) measurements .................. 77
Chapter summary ................................................................................................... 77
IV CHOICE AND VALIDATION OF THE EXPERIMENTAL CONDITIONS
FOR THE SCC TESTS AT ROOM TEMPERATURE AND PRESSURE . 78
IV.1 Introduction ............................................................................................... 79
IV.2 Influence of the experimental conditions on the initiation and the
development of a crack colony ................................................................... 79
IV.2.1 Characterization of the degree of sensitization according to the different
applied Heat Treatments (HT) ................................................................... 79
IV.2.2 Effect of the loading mode on the crack colony morphology ...................... 84
IV.2.3 Suitability of SSRT and CL tests for AE, DIC, and EN measurements ....... 88
IV.2.4 Effect of the pH of the solution on the crack colony morphology ............... 89
IV.2.5 Synopsis ................................................................................................... 91
Cette thèse est accessible à l'adresse : http://theses.insa-lyon.fr/publication/2017LYSEI059/these.pdf © [J. Bolivar], [2017], INSA Lyon, tous droits réservés

Table of contents
José Bolivar III
Thèse en Sciences des Matériaux / 2017
Institut national des sciences appliquées de Lyon
IV.3 Choice and validation of the surface patterning compatible with DIC
measurements and SCC tests...................................................................... 92
IV.3.1 Evaluation of surface treatment on Squared Samples ................................. 93
IV.3.2 Electrochemical characterization of the surface treatment .......................... 99
IV.3.3 Validation of the surface patterning on the Long Tensile Samples (LTS) . 100
Chapter Summary ................................................................................................ 103
V STUDY OF CRACK PROPAGATION BY DIGITAL IMAGE
CORRELATION ANALYSIS ................................................................... 105
V.1 Introduction ................................................................................................. 107
V.2 Study of the propagation of a single stress corrosion crack ........................ 107
V.2.1 Presentation of the results ....................................................................... 108
V.2.2 Discussion .............................................................................................. 117
V.2.3 Synopsis ................................................................................................. 120
V.3 Description of the propagation behavior of a colony of stress corrosion cracks .
..................................................................................................................... 121
V.3.1 Presentation of the results ....................................................................... 121
V.3.2 Discussion .............................................................................................. 129
V.3.3 Synopsis ................................................................................................. 133
V.4 Validation by in-situ X-ray tomography and Digital Volume Correlation.. 133
V.4.1 Presentation of the results ....................................................................... 135
V.4.2 Discussion .............................................................................................. 149
V.4.3 Synopsis ................................................................................................. 152
Chapter Summary ................................................................................................ 154
VI ANALYSIS OF ELECTROCHEMICAL NOISE DURING STRESS
CORROSION CRACKING TESTS ........................................................ 156
VI.1 Introduction ............................................................................................. 157
VI.2 Theoretical background about the evaluation of the noise generated during
Electrochemical Noise Measurements (ENM) .......................................... 157
VI.2.1 Current partition according to Bertocci et al. model [172] ........................ 158
VI.2.2 Methodology for the evaluation of instrumental noise .............................. 161
VI.3 Evaluation of the instrumental noise generated by the REF600 Gamry
potentiostat ............................................................................................... 164
VI.3.1 Results and discussion ............................................................................ 164
VI.3.2 Synopsis ................................................................................................. 168
Cette thèse est accessible à l'adresse : http://theses.insa-lyon.fr/publication/2017LYSEI059/these.pdf © [J. Bolivar], [2017], INSA Lyon, tous droits réservés

Table of contents
José Bolivar IV
Thèse en Sciences des Matériaux / 2017
Institut national des sciences appliquées de Lyon
VI.4 Application of ENM in SCC studies: influence of current partition and
instrumental noise .................................................................................... 169
VI.4.1 Presentation of the results ....................................................................... 171
VI.4.2 Discussion .............................................................................................. 173
VI.4.3 Synopsis ................................................................................................. 178
VI.5 Critical analysis of the rise in the asymmetry between electrodes during
SCC process .............................................................................................. 179
VI.5.1 Results and discussions ........................................................................... 180
Chapter Summary ................................................................................................ 184
VII GENERAL SYNTHESIS, CONCLUSIONS AND FUTURE WORKS ... 186
VII.1 Introduction ............................................................................................. 187
VII.2 General Synthesis ..................................................................................... 187
VII.2.1 Influence of experimental parameters on the development of the crack
colony. ................................................................................................... 187
VII.2.2 Development of the in-situ experimental methodology for the study of SCC
crack colonies ......................................................................................... 189
VII.2.3 Crack detection and crack monitoring ..................................................... 190
VII.2.4 Evolution of intergranular stress corrosion cracks (Alloy 600 /
tetrathionate).. ........................................................................................ 191
VII.2.5 Mechanisms involved for crack propagation in sensitized Alloy 600 in a
solution containing tetrathionate ions ...................................................... 192
VII.2.6 Evaluation of Electrochemical Noise measurements in SCC experiments . 194
VII.3 Contribution of the experimental approach to modeling ......................... 196
VII.4 Transposition of the methodology towards intermediate temperature and
pressure environments ............................................................................. 200
A. APPENDIX A .......................................................................................... 203
Issues during EN signal acquisition ......................................................................... 203
B. APPENDIX B ............................................................................................. 206
Signal conditioning before data analysis/interpretation in EN measurements ............ 206
C. APPENDIX C .......................................................................................... 208
Report MISTRAS RF 2017.01: Analysis of Acoustic Emission data collected during
IG-SCC experiments ............................................................................................... 208
D. APPENDIX D .......................................................................................... 232
Cette thèse est accessible à l'adresse : http://theses.insa-lyon.fr/publication/2017LYSEI059/these.pdf © [J. Bolivar], [2017], INSA Lyon, tous droits réservés

Table of contents
José Bolivar V
Thèse en Sciences des Matériaux / 2017
Institut national des sciences appliquées de Lyon
Assessment of Stress Intensity Factors from DIC measurements .............................. 232
E. APPENDIX E ............................................................................................. 235
A phase field method for modelling stress corrosion crack propagation .................... 235
F. APPENDIX F .............................................................................................. 254
Description of the experimental apparatus for performing in-situ SCC experiments at
intermediate temperatures and pressures .................................................................. 254
G. APPENDIX G .......................................................................................... 258
Evaluation of the induced deformation by an out-of-plane movement: AF Micro 200
Lens ....................................................................................................................... 258
REFERENCES .................................................................................................. 262
Cette thèse est accessible à l'adresse : http://theses.insa-lyon.fr/publication/2017LYSEI059/these.pdf © [J. Bolivar], [2017], INSA Lyon, tous droits réservés

Glossary
José Bolivar VI
Thèse en Sciences des Matériaux / 2017
Institut national des sciences appliquées de Lyon
Glossary
Acronyms
ACF Auto-Correlation Function
AE Acoustic Emission
AIDE Adsorption Induced Dislocation Emission
ANR Agence National de la Recherche (in french)
AR As Received
ASS Austenitic Stainless Steel
BFM Body Force Method
BWR Boiling Water Reactor
CA Chemical Attack
CCD Charge-Coupled Device
CE Counter Electrode
CGR Crack Growth Rate
CL Constant Load test
CT Compact Tension sample
DIC Digital Image Correlation
DL-EPR Double-Loop Electrochemical Potentiokinetic Reactivation test
DVC Digital Volume Correlation
ECCOFIC Etude du Comportement de Colonies des Fissures Courtes de corrosion sous
contrainte (in french)
ECN Electrochemical Current Noise
EDM Electrical Discharge Machining
EDX Energy Dispersive X-ray spectroscopy
EE Electro-Etching
EN Electrochemical Noise
EPN Electrochemical Potential Noise
FC Fatigue Corrosion
Cette thèse est accessible à l'adresse : http://theses.insa-lyon.fr/publication/2017LYSEI059/these.pdf © [J. Bolivar], [2017], INSA Lyon, tous droits réservés

Glossary
José Bolivar VII
Thèse en Sciences des Matériaux / 2017
Institut national des sciences appliquées de Lyon
FEM Finite Element Modeling
FFT Fast Fourier Transform
FIB Focused-Ion Beam
FIC Film Induced Cleavage
FS Flexion Sample
HDT Hit Definition Time
HE Hydrogen Embrittlement
HEDE Hydrogen -Enhanced Decohesion
HELP Hydrogen -Enhanced Localized Plasticity
HLT Hit Lockout Time
IDG Initiation Dominant Growth
IGA Inter-Granular Attack
IGSCC Intergranular Stress Corrosion Cracking
LEFM Linear Elastic Fracture Mechanic
LME Liquid Metal Embrittlement
LTNS Long Tensile Notched Specimen
LTS Long Tensile Specimen
MAS Mill Annealed and Sensitized
MEM Maximum Entropy Method
MER Maximum Energy Release rate method
MSE Minimum Strain Energy density method
MTS Maximum Tangential Stress method
NF No Failure
OCP Open Circuit Potential
OM Optical Microscopy
PCC Primary Cooling Circuit
PDT Peak Definition Time
PLEDGE Plant Life Extension Diagnosis General Electric
PSD Power Spectral Density
Cette thèse est accessible à l'adresse : http://theses.insa-lyon.fr/publication/2017LYSEI059/these.pdf © [J. Bolivar], [2017], INSA Lyon, tous droits réservés

Glossary
José Bolivar VIII
Thèse en Sciences des Matériaux / 2017
Institut national des sciences appliquées de Lyon
PTA-SCC Polythionic Acid Stress Corrosion Cracking
PWR Primary Water Reactor
PWSCC Primary Water Stress Corrosion Cracking
RBM Rigid Body Movement
RE Reference Electrode
RMS Root Mean Square value
ROI Region of Interest
SAS Solution Annealed and Sensitized
SCC Stress Corrosion Cracking
SCE Saturated Calomel Electrode
SD, σ Standard deviation
SEM Scanning Electron Microscope
SIF Stress Intensity Factor
SRLT Slow Rate Load Test
SS Stainless Steel
SS Square Sample
SSRT Slow Strain Rate Test
STS Small Tensile Specimen
TGSCC Transgranular Stress Corrosion Cracking
WE Working Electrode
ZRA Zero-Resistance-Ammeter
Notation for electrochemical variables
ia Instantaneous dissolution current
M Molecular weight
λ Mean number of charge transferred by unit of time
∆I Current fluctuations
∆V Potential fluctuations
Cette thèse est accessible à l'adresse : http://theses.insa-lyon.fr/publication/2017LYSEI059/these.pdf © [J. Bolivar], [2017], INSA Lyon, tous droits réservés

Glossary
José Bolivar IX
Thèse en Sciences des Matériaux / 2017
Institut national des sciences appliquées de Lyon
𝜀��𝑡 Instantaneous strain rate at the crack tip
F Faraday constant
fc Cutoff frequency
fmax Maximal frequency for analysis according to the Nyquist-Shannon theorem
fmin Minimal frequency for analysis according to the Nyquist-Shannon theorem
fs Sampling frequency
I0 Value of mean current
I Current
Icorr Corrosion current
k Boltzmann's constant
M Number of analyzed blocks
N Length of the analyzed block
ρ Material density
ΨI(f) Power Spectral density of the current noise
ΨV(f) Power Spectral density of the potential noise
q Electric charge
R Resistance
Rn Noise Resistance
Rp Polarization resistance
σI, σECN Standard deviation of the current signal
σV, σEPN Standard deviation of the potential signal
t Time
T Absolute Temperature
V0 Value of mean potential
v Volume
V Potential
Vpp Voltage peak -to-peak
z Number of electrons involved in the reaction
Zn Noise Impedance
Cette thèse est accessible à l'adresse : http://theses.insa-lyon.fr/publication/2017LYSEI059/these.pdf © [J. Bolivar], [2017], INSA Lyon, tous droits réservés

Glossary
José Bolivar X
Thèse en Sciences des Matériaux / 2017
Institut national des sciences appliquées de Lyon
Notation for mechanical variables
��, da/dt, Crack growth rate
h Separation of the longitudinal axis of the cracks
ci Half-length of the "i" crack
E Young modulus
εyy Strain according to the y-axis
f(x) Gray levels of the reference image
g(x) Gray levels of the deformed image
KI Stress Intensity Factor in mode I
KII Stress Intensity Factor in mode II
u, U Displacement field
Ux Displacement according to x-axis
Uy Displacement according to y-axis
Uyimposed Imposed y-displacement
Uymax Maximum displacement according to the y-axis
ωi Degree of freedoms
�� Vector of coordinates
y y-axis
Ω Region of interest
Cette thèse est accessible à l'adresse : http://theses.insa-lyon.fr/publication/2017LYSEI059/these.pdf © [J. Bolivar], [2017], INSA Lyon, tous droits réservés

Dedication
José Bolivar XI
Thèse en Sciences des Matériaux / 2017
Institut national des sciences appliquées de Lyon
DEDICATION This is for all my family. This would not have been possible without your support and all the
good vibes that you gave me during all this time. I really thanks for always being there for
me.
This is also for my life partner, my love, Amelia Fernandez. Thank you for all your care, the
excellent moments shared and for all the love that we give to each other, each day.
Dedico esta obra a mi madre… Mujer increíble y que gracias a su tenacidad y a todo sus
sacrificios soy la persona que soy. ¡Mis logros son tan míos como tuyos y sé que los festejas
aún más que yo!
A mi padre que siempre me ha apoyado, formado e inculcado el valor del trabajo. ¡ Sé que esto
representa algo muy importante para ti y sé que estarás muy orgulloso! Siempre me has dado
lo mejor, de igual manera siempre he querido retribuirte dando siempre lo mejor de mí.
A mi abuela Ana y a mi abuelo Antonio. Por su amor y cariño incondicional.
Al resto de mi familia, en particular a mis abuelos (María, Miguelina, Ángel), a mis tíos
(Miguel, Nancy, Félix, Pedro, Maribel, Chepi, Evelyn, Kenya) y a todos mis primos y primas.
A mis amigos, que me ensenaron el valor de la amistad con todos esos momentos compartidos.
Y por último, pero no la menos importante, a mi compañera de vida…. A ti Amelia Fernández,
por tu increíble personalidad, por el gran amor y el invaluable apoyo que me has dado durante
todo este tiempo.
Con un inmenso cariño
José Francisco Bolivar Viña
Cette thèse est accessible à l'adresse : http://theses.insa-lyon.fr/publication/2017LYSEI059/these.pdf © [J. Bolivar], [2017], INSA Lyon, tous droits réservés

Acknowledgment
José Bolivar XII
Thèse en Sciences des Matériaux / 2017
Institut national des sciences appliquées de Lyon
ACKNOWLEDGMENT
No great achievement is carried out by itself, behind each achievement hides the support of a
family, a workgroup and special people who contributed in one way or another.
It is not easy to write acknowledgments in your third language, but I hope that my gratitude
will be clearly visible in the next lines.
I would like to thank my supervisor Marion Fregonese and my co-supervisor Julien Réthoré
for their guidance throughout the duration of my Ph.D. I sincerely thank them for giving me
their confidence to carry out my work, for encouraging my research and for allowing me to
grow as a research scientist. I will always remember a frame plenty of respect, confidence,
and motivation (a lot).
I would like to express my special appreciation and thanks to Pierre Combrade and Claude
Duret for their scientific advice, knowledge, many insightful discussions, and suggestions
made it during the numerous project meetings. Something that I will not forget, your humility.
I am very thankful to François Huet who helped me with the Electrochemical Noise technique.
He was always available for my questions and inquiries. His advice were priceless and very
important for the development of my Ph.D.
I would like to thanks, Jean-Yves Buffière and Jerome Adrien, for their great support during
the experiments carried out at SOLEIL synchrotron. Hard days but good moments.
I would also like to thank my committee members, Krzysztof Wolski, Ricardo Nogueira and
Jean Desquines for serving as my committee members. I also want to thank you for letting my
defense be an enjoyable moment, and for your brilliant comments and suggestions, thanks to
all you.
I wish to express my gratitude to "Agence National de la Recherche" for sponsoring this
project as well as to all the partners of the ECCOFIC project for their great collaboration.
I am very thankful the staff of the MATEIS lab (Jalila, Yasmina, and Antonia), and especially
the technicians (Robert, Ghani, Kader, Fred) in the workshop, were a great help and
contributed to the advancement of my Ph.D.
I give my best wishes to the staff in the Corrosion team for their advice and kindness. I can
cite Bernard Normand, Philippe Steyer, Benoit Ter-Orvanessian and Sabrina Marcelin. I also
thank my co-workers (Nicolas Vaché, Malo Carradot, Dwaipayan Mallick) in the lab for their
friendship and great moments.
Cette thèse est accessible à l'adresse : http://theses.insa-lyon.fr/publication/2017LYSEI059/these.pdf © [J. Bolivar], [2017], INSA Lyon, tous droits réservés

Acknowledgment
José Bolivar XIII
Thèse en Sciences des Matériaux / 2017
Institut national des sciences appliquées de Lyon
Special thanks to my family. Words cannot express how grateful I am to my mother and father,
to my grandparents, for all of the sacrifices that you’ve made on my behalf. I would also like
to thank all of my friends and Amelia's family who supported me in writing and incented me
to strive towards my goal.
At the end, I would like express appreciation to my life partner, my love, Amelia who always
behaved kindly and warm when I was stressed and a little unpleasant. She was always
supporting me in the moments when there was no one to answer my queries.
Many thanks to you all,
José
.
Cette thèse est accessible à l'adresse : http://theses.insa-lyon.fr/publication/2017LYSEI059/these.pdf © [J. Bolivar], [2017], INSA Lyon, tous droits réservés

Chapter I: General introduction
José Bolivar 1
Thèse en Sciences des Matériaux / 2017
Institut national des sciences appliquées de Lyon
Chapter I
I General introduction
I.1 Introduction ..................................................................................................... 2
I.1.1 Context of the study ....................................................................................... 2
I.1.2 Objectives of this work .................................................................................. 4
I.1.3 Overview of the manuscript ............................................................................ 6
Cette thèse est accessible à l'adresse : http://theses.insa-lyon.fr/publication/2017LYSEI059/these.pdf © [J. Bolivar], [2017], INSA Lyon, tous droits réservés

Chapter I: General introduction
José Bolivar 2
Thèse en Sciences des Matériaux / 2017
Institut national des sciences appliquées de Lyon
I.1 Introduction
I.1.1 Context of the study
Climate change and global warming are some of the greatest problems facing humanity in
this century. Our high energy dependency on fossil fuels is starting to show its
consequences, in particular, the deleterious effects of greenhouse-gas emissions (issued
from fossil fuels) both on climate and global society health. The gradual replacement of
fossil fuels by sustainable and renewable sources of energy is an unavoidable process . In
this context, emergents technologies based on wind-and-solar energies are in full
development with the aim of reducing green-house-gas emissions. However, such sources
are characterized by their natural intermittence which is non compatible with the
requirement of modern industrial society (highly energy consuming). For the moment and
despite all the controversies, nuclear power is one of the most promising sources able to
provide huge energy amounts in a safely, economically, reliably and sustainable way [1]–
[3].
France produces about 84 % of its electricity from the nuclear industry. In this manner, the
per-capita greenhouse gas emission in France is among the lowest of the industrial nations
worldwide. Nowadays, the French nuclear sector represents the third national industry,
assembling 19 nuclear power plants and 58 nuclear reactors [4]. Most of these reactors were
built with an initial design life of 40 years and are currently reaching the mean age of 30
years. In that context, an extension towards 60 or 80 years has been now envisaged. The
main reason for such extension lies in political and economic reasons [4]–[6]. Obviously,
this extension can only be possible if safe operating conditions are fully demonstrated by
utilities. This requires further research, notably, the development of prediction tools that
can assess the behavior face to the additional aging of such structures.
The list of the possible aging problems caused by the environmental degradation of
structural materials in a nuclear reactor can be quite long. The extreme conditions of
operation of the reactor (irradiation, high temperature and pressure) cause a very wide range
of degradations such as: irradiation-induced hardening and softening, thermal aging,
thermal fatigue and corrosion problems such as crevice corrosion, flow accelerated
corrosion, fatigue corrosion and Stress Corrosion Cracking (SCC). Under the frame of this
work, particular attention will be paid to the SCC phenomena.
Stress Corrosion Cracking (SCC) is a process of premature degradation of metals and alloys
generated by the synergistic effect of static mechanical loading and environmental factors
[7]. As such, SCC represents a commonly localized corrosion issue in the Primary Cooling
Circuit (PCC) of Pressurized Water Reactors (PWR, see Figure I-1). Basically, this is a
closed system full of water which carries the heat produced by the fission reaction in the
Cette thèse est accessible à l'adresse : http://theses.insa-lyon.fr/publication/2017LYSEI059/these.pdf © [J. Bolivar], [2017], INSA Lyon, tous droits réservés

Chapter I: General introduction
José Bolivar 3
Thèse en Sciences des Matériaux / 2017
Institut national des sciences appliquées de Lyon
core. The PCC works under extreme conditions because the water inside is at high
temperature and pressure (i.e. ~ 290-345°C and 155 bars). Three or four boilers (steam
generators) included in this system allows transferring the energy into steam in the
secondary circuit. Finally, the produced steam is used to drive a turbine which produces
electricity.
Figure I-1. Schematic representation of a Pressurized-Water Reactor (PWR)
The materials used in the PCC are Stainless Steels (SS) alloys such as austenitic stainless
steels (304L SS, 316 L SS), and Nickel based alloy such as the Alloy 600 and the Alloy
690. A large number of non-catastrophic cases of SCC in the PCC occurred in the past.
Most of them were reported for the Alloy 600 which presents high susceptibility to a type
of intergranular SCC usually called PWSCC (Primary Water Stress Corrosion Cracking) in
such environments (see Figure I.3). Some cases of transgranular SCC have also been
observed in occluded parts of the circuit in the presence of impurities (mainly chlorides and
sulfates).
In the case of PWSCC which usually occurs after very long incubation period, the main
problem relies on the evaluation of the remaining lifetime of components. The current
approach involves empirical model for crack initiation (see for example [8]) and crack
propagation. In this context, numerous mechanistic studies and experimental data has been
already obtained in order to describe the crack growth of one crack during in-service
conditions. Such studies take into account Linear Elastic Fracture Mechanic concepts for
the estimation of crack propagation rates of large cracks (see for example [9]).
Nevertheless, the issue becomes more complicated and less controlled when multiple cracks
initiate and propagate. The growth of cracks closely surrounded by other neighboring
defects is expected to be very different, compared to the growth kinetics obtained in
laboratory tests on notched specimens (single crack).
Much of the safety assessments concerning SCC risk have over-simplified some stages in
the aging process, such the periods of interactions between several short cracks (e.g.
Cette thèse est accessible à l'adresse : http://theses.insa-lyon.fr/publication/2017LYSEI059/these.pdf © [J. Bolivar], [2017], INSA Lyon, tous droits réservés

Chapter I: General introduction
José Bolivar 4
Thèse en Sciences des Matériaux / 2017
Institut national des sciences appliquées de Lyon
shielding effects, coalescence and irregular propagation). Therefore, the predicted lifetimes
are often over-conservative, as the initiation stages and the interaction periods can
constitute an important part of the cracking process. The "over-conservatism" of the
predictions presents several safety advantages; notwithstanding, it leads to under-estimated
lifetimes and therefore, to non-optimized both plant arrest planning and maintenance costs.
Under this framework, there is an actual need for improving the understanding of the growth
of multiple SCC cracks, particularly, for the enhancement of the actual predictive models,
in the context of reactors lifetime extension.
Figure I-2. Examples of some cases of Alloy 600 SCC in the Primary Cooling Circuit of a nuclear reactor [10].
Left) Leakage due to PWSCC on the Reactor Vessel (Ohi, Japan 2001). Top) Cracks on the Reactor Vessel
Head of Ohi unit 3 (Japan 2001). Right) PWSCC on Nozzle for CRDM of the Palisades nuclear reactor (The
USA, 2008)
I.1.2 Objectives of this work
In this context, the present work is part of an ANR1 project relative to the study of the
behavior of colonies of environmentally assisted short cracks, whose acronym due to its
French name is "ECCOFIC" (Etude du Comportement des COlonies des FIssures Courtes
de corrosion sous contrainte). The final objective of the project is to develop a more realistic
methodology for the lifetime evaluation of components sensitive to Stress Corrosion
Cracking in order to apply it for PWR life management. The aims of this project can be
summarized as:
1
MATETPRO ANR-12-RMNP-0020
Cette thèse est accessible à l'adresse : http://theses.insa-lyon.fr/publication/2017LYSEI059/these.pdf © [J. Bolivar], [2017], INSA Lyon, tous droits réservés

Chapter I: General introduction
José Bolivar 5
Thèse en Sciences des Matériaux / 2017
Institut national des sciences appliquées de Lyon
1. Enhance the understanding of the processes that are involved in the interactions
stages of the life of a multiple stress corrosion cracks colony.
2. Simulate the behavior of a colony of cracks induced by stress corrosion cracking.
Two approaches are developed in parallel within the ECCOFIC project: (i) an experimental
one consisting in the characterization of a crack colony behavior and data collection and
(ii) a numerical one for the development of a simulation methodology.
Within this framework, this PhD thesis is dedicated to develop the experimental part of
ECCOFIC project, in order to contribute to the accomplishment of the two objectives
described above. The objectives relative to this thesis can be listed as follows:
Choose one/or various experimental systems (material/environment) which cover a
broad range of mode and mechanisms of Stress Corrosion Cracking
(intergranular/transgranular SCC). The SCC systems should be able to give rise to
a colony of cracks with different morphologies (e.g. crack densities and modes of
propagation). The SCC process should be relatively easy to activate and compatible
with an in-situ experimental characterization.
Develop an innovative in-situ experimental set-up to collect experimental data. The
methodology should permit to obtain data in a fast an accurate way and to cover
both the mechanical and electrochemical steps involved in the crack colony growth.
The obtained data will be used for several purposes. Firstly, it will permit to characterize
the different steps, stages, and processes involved in the propagation of a colony of stress
corrosion cracks. The latter will allow identifying the parameters and tools that will be used
for the construction of an SCC model (numerical approach). On the other hand, the input
parameters intended to feed the model will be obtained from the collected data. Moreover,
the experimental observations and measurements, resulting from the methodology
developed here, will ensure the validation of the numerical approach.
It must be highlighted that due to the complexity of the subject and the numerous challenges
associated to real PCC conditions, the ECCOFIC project has adopted a progressive
approach. On this basis, all the methodology (experimental and numerical) will be first
developed at room temperature and will be successively transposed to more aggressive
conditions of temperature and pressure. In this context, this work mainly focused on an
experimental SCC system at room temperature and pressure. The latter consisted of an
Alloy 600, which is prone to suffer Intergranular Stress Corrosion Cracking at room
temperature in a solution of tetrathionates. Another system is also proposed for which the
methodology developed here is directly transposable.
Cette thèse est accessible à l'adresse : http://theses.insa-lyon.fr/publication/2017LYSEI059/these.pdf © [J. Bolivar], [2017], INSA Lyon, tous droits réservés

Chapter I: General introduction
José Bolivar 6
Thèse en Sciences des Matériaux / 2017
Institut national des sciences appliquées de Lyon
I.1.3 Overview of the manuscript
This manuscript will be organized into seven chapters (including this introduction). Chapter
II reviews the state-of-the-art related to stress corrosion cracking mechanisms and the
multiple cracking phenomena. Moreover, this chapter includes a literature review of the
SCC system studied during this work; this part permits to identify several parameters which
control the development of the cracks. In addition, Chapter II also includes an extensive
review of the experimental techniques used in this work, i.e. Digital Image Correlation
(DIC), Electrochemical Noise (EN) and Acoustic Emission (AE). The experimental details
and procedures are described in the third chapter.
Chapter IV presents the determination of the experimental conditions inducing the
emergence of a crack colony. Several experimental parameters are studied (e.g. heat-
treatments, sensitization, pH, mode of loading), and their influence on the morphology of
the cracks is analyzed. Moreover, this chapter also describes the surface conditioning of the
samples in order to allow DIC measurements. The results presented through this chapter
allowed determining experimental conditions which offered crack colonies with different
controlled features.
Chapter V describes the characterization of the growth of both a single stress corrosion
crack and a crack colony. The description of the behavior is based on DIC measurements
and correlation between AE and EN. The nature of the crack propagation mechanisms is
discussed, as well as the effects of the crack interactions on the individual growth of the
defects developing within the colony. A validation in 3D by microtomography is obtained.
Chapter VI is entirely devoted to the application of EN measurements for SCC studies.
Within this chapter, a special focus is made on the deleterious effects of both instrumental
noise and electrode asymmetry on the measurements.
Finally, Chapter VII presents a general synthesis of the results together with the conclusions
and the prospects of this work. A part of this chapter will be devoted to introduce the
numerical model developed in the frame of the ECCOFIC project and its validation by the
present works. Moreover, a second SCC system, as well as an experimental setup, are
proposed in order to transpose this research works to environmental conditions closer to the
final goal (high temperature and pressure).
Cette thèse est accessible à l'adresse : http://theses.insa-lyon.fr/publication/2017LYSEI059/these.pdf © [J. Bolivar], [2017], INSA Lyon, tous droits réservés

Chapter II: Literature review
José Bolivar 7
Thèse en Sciences des Matériaux / 2017
Institut national des sciences appliquées de Lyon
Chapter II
II Literature review II.1 Introduction ..................................................................................................... 9
II.2 Stress Corrosion Cracking mechanisms and models ....................................... 9
II.2.1 Crack initiation ......................................................................................... 10
II.2.2 Crack propagation .................................................................................... 11
II.2.2.1 Slip dissolution model (or slip oxidation or film rupture model) ............. 11
II.2.2.2 Film Induced Cleavage (FIC) model ...................................................... 13
II.2.2.3 Adsorption-based mechanisms ............................................................... 13
II.2.2.4 Models involving Hydrogen .................................................................. 15
II.2.3 Synopsis ................................................................................................... 16
II.3 Multiple cracking problem ............................................................................ 17
II.3.1 Crack interactions and crack colony behavior ............................................ 18
II.3.2 Multiple cracking and lifetime predictions ................................................ 22
II.3.3 Synopsis ................................................................................................... 23
II.4 Intergranular stress corrosion cracking of Austenitic Stainless Steels (ASS)
and Nickel base alloys in solutions containing polythionic acids .................... 24
II.4.1 Polythionic Acids ..................................................................................... 24
II.4.2 PTA-SCC mechanism in ASS and Nickel base alloys ................................ 25
II.4.3 Synopsis ................................................................................................... 28
II.5 Experimental approach for a quantitative in-situ evaluation of multiple stress
corrosion cracks propagation .......................................................................... 30
II.5.1 Digital Image correlation .......................................................................... 30
II.5.1.1 Description of the DIC principle ............................................................ 31
II.5.1.2 Problem to be solved ............................................................................. 32
II.5.1.3 Digital image correlation in SCC studies ............................................... 33
II.5.1.4 Synopsis ............................................................................................... 34
II.5.2 Acoustic Emission technique .................................................................... 34
II.5.2.1 Principles .............................................................................................. 34
II.5.2.2 Acoustic Emission in SCC studies ......................................................... 36
II.5.3 Electrochemical Noise technique .............................................................. 37
II.5.3.1 Sources of Electrochemical Noise.......................................................... 38
II.5.3.2 Different types of Electrochemical Noise experimental setups ................ 40
II.5.3.3 Electrochemical Noise data analysis ...................................................... 42
Cette thèse est accessible à l'adresse : http://theses.insa-lyon.fr/publication/2017LYSEI059/these.pdf © [J. Bolivar], [2017], INSA Lyon, tous droits réservés

Chapter II: Literature review
José Bolivar 8
Thèse en Sciences des Matériaux / 2017
Institut national des sciences appliquées de Lyon
II.5.3.4 Electrochemical Noise in Stress Corrosion Cracking studies .................. 48
II.5.3.4.1 Electrochemical Noise sources in Stress Corrosion Cracking ............. 48
II.5.3.4.2 Electrochemical Noise measurements during SCC tests ..................... 50
II.5.3.5 Synopsis ............................................................................................... 55
Chapter Summary .................................................................................................. 56
Cette thèse est accessible à l'adresse : http://theses.insa-lyon.fr/publication/2017LYSEI059/these.pdf © [J. Bolivar], [2017], INSA Lyon, tous droits réservés

Chapter II: Literature review
José Bolivar 9
Thèse en Sciences des Matériaux / 2017
Institut national des sciences appliquées de Lyon
II.1 Introduction
his chapter presents a state-of-the-art of Stress Corrosion Cracking
issues to which the present work is aimed at contributing. It will allow
orienting the experimental choices that will be done.
It is divided into four main parts. First, the different mechanisms possibly
involved in the initiation and propagation of single stress corrosion cracks
are presented (Section II.2). The most mature models proposed to describe
stress corrosion crack propagation are briefly discussed. A second section is
devoted to the multiple cracking issue (Section II.3). Within this section, the
literature works already done in this area, precisely those related to the
influence of cracks interactions on their propagation, are detailed.
Additionally, a third section (Section II.4) is devoted to the SCC system
chosen for this study (Alloy 600 / tetrathionate solution). In this section, the
mechanisms, as well as the various parameters affecting the crack
morphology and propagation, are described.
Finally, as the main objective of this work is to develop an experimental
methodology for the study of multiple cracks interactions in Stress Corrosion
Cracking, the last part (Section II.5) is devoted to present a literature review
of the most relevant experimental techniques. Within this section, their basis,
their advantages and their applications for SCC studies are detailed. A
conclusion allows defining the approach adopted for this work.
II.2 Stress Corrosion Cracking mechanisms
and models
Stress Corrosion Cracking (SCC) is the result of a synergic combination of mechanical,
physical, chemical and electrochemical factors that induce the initiation and the propagation
of brittle cracks. Depending on the alloy and the environment, cracks can propagate along
grain boundaries and produce a fracture surface quite smooth. In this case, the process is
called Intergranular Stress Corrosion Cracking (IG-SCC). Cracks can also progress
throughout the grains, exhibiting few anodic dissolution patterns (or features). This second
mode of propagation is called Transgranular Stress Corrosion Cracking (TG-SCC).
Sometimes, combined forms of IG-SCC and TG-SCC can be involved in the development
of a SCC defect.
The multidisciplinary characteristics and the complexity of the process are the main reasons
why there is no universal mechanism able to describe the development of SCC in all
materials and environments [11]. The SCC process is usually separated into two stages: (I)
T
Cette thèse est accessible à l'adresse : http://theses.insa-lyon.fr/publication/2017LYSEI059/these.pdf © [J. Bolivar], [2017], INSA Lyon, tous droits réservés

Chapter II: Literature review
José Bolivar 10
Thèse en Sciences des Matériaux / 2017
Institut national des sciences appliquées de Lyon
initiation and (II) propagation of cracks. This distinction is often made because the
conditions/mechanisms/controlling processes responsible for crack initiation are not
necessarily the same as those needed to sustain crack growth [12].
II.2.1 Crack initiation
SCC risk mainly concerns passive alloys. The stability of the surface film plays an
important role in the initiation and propagation of cracks [13]. The stability of this
protective layer is characterized by how resistant the film is and by its self -healing capacity
(rate of repair / repassivation). Such properties are determined by the composition of the
alloy (e.g. Cr and Mo content) and environment factors such as pH, temperature, potential,
ions concentration, strain, etc [14], [15]. The initiation of cracks is a complex process where
suitable electrochemical (e.g. pH, potential, repassivation rate), mechanical (e.g. strain) and
metallurgical conditions (e.g. composition, porosity, inclusions, etc.) need to be met for the
destabilization of the surface film. Several preferential sites for stress corrosion cracks
initiation have been already identified in the literature works [16]–[19]. Some of them can
be listed as follows:
At surface discontinuities: SCC frequently initiates on preexisting or corrosion-
induced surface defaults. These defaults may include grooves, laps, or burrs
resulting from fabrication processes. The local environment around such
discontinuities can favor the dissolution of metal and/or the formation of a weak
film. In addition, they can act as stress concentration agents which induce the
rupture of the protective layer.
By pitting: pits can form on inclusions that intersect the free surface or by a
breakdown in the protective film. Pits act as occluded cells where environmental
parameters such as pH and/or solution concentration (inside the cell) promote the
further development of the pit. The transition between pitting and cracking depends
on the same parameters that control SCC, i.e., the electrochemistry at the base of
the pit, pit geometry, chemistry of the material, and stress or strain rate at the base
of the pit.
Metallurgical defects: the alloy manufacturing process can promote the presence of
metallurgical defects such as grain boundaries, inclusions and voids. Such flaws can
have a different electrochemical behavior compared to their adjacent vicinity
(matrix), resulting in a galvanic coupling and a preferential dissolution in one of the
phases (matrix or flaw). In the case of sensitized stainless steels, the local grain
boundary chemistry differs from the bulk chemistry; the crack initiation is therefore
promoted at the grains boundaries where a weaker protective film is formed.
Cette thèse est accessible à l'adresse : http://theses.insa-lyon.fr/publication/2017LYSEI059/these.pdf © [J. Bolivar], [2017], INSA Lyon, tous droits réservés

Chapter II: Literature review
José Bolivar 11
Thèse en Sciences des Matériaux / 2017
Institut national des sciences appliquées de Lyon
II.2.2 Crack propagation
From an atomistic point of view, there exist essentially four fundamental processes that can
produce a crack advance event: (1) the removal of atoms at the crack tip, (2) either shear
movement of atoms at crack tips, emission of dislocations from crack tips or consumption
of dislocations at crack tips; (3) the tensile separation of atoms at crack tips (decohesion)
and (4) surface diffusion of atoms from crack tips [20]. Some of them can happen at the
same time and could explain why there do not exist a universal SCC mechanism able to
describe the crack growth process for all the material/environment systems.
Several mechanisms have been proposed to explain the crack propagation process, taking
into account directly or indirectly, some of the above mentioned atomic processes. A
common point between all of them is that all focus on the crack tip environment and on the
local properties of the interfacial alloy-environment film. Depending on the nature of the
model, they point out different controlling parameters of the crack tip environment such as
localized or selective anodic dissolution, adsorption of specific species, surface mobility of
atoms, rupture of the superficial film, vacancy injection in the base metal, local absorption
of hydrogen leading to hardening and embrittlement or to local softening of the plastic
zone, etc [18]. The next section presents only the most notorious and mature models
hitherto proposed.
II.2.2.1 Slip dissolution model (or slip oxidation or film rupture model)
The basis of the current model was born in 1952 [21] and underwent several improvements
and modifications, notably by Staehle, Parkins and Ford, until arriving to what it is today
[22], [23]. This model [24] assumes that a slow but continuous plastic strain located at the
crack tip periodically breaks the passive film, revealing a bare metal surface (see Figure
II-1). Subsequently, the exposed fresh surface dissolves (atoms removing) until a new
protective layer is formed [25].
In this model, the crack growth rate (ȧ, da/dt) is assumed to be described by the Faraday
law and the density of the instantaneous dissolution current ia (Equation II-1).
�� =𝑑𝑎
𝑑𝑡=
𝑀
𝑧 ∙ 𝐹 ∙ 𝜌∙ 𝑖𝑎(𝑡, 𝜀��𝑡 , … ) Equation II-1
where M is the molecular weight of the dissolving species, z is the number of electrons
involved in the reaction of dissolution, F is the Faraday constant, t is time, εct is the
instantaneous strain rate the crack tip and ρ is the density of the metal being considered.
The propagation of the crack depends on the extent of the metal dissolution involved in the
film rupture event and in the kinetics of film repair. In order to keep the crack geometry,
only the current originated at the crack tip is assumed to participate to the crack growth.
The latter implies limited or no dissolution of the crack flanks.
Cette thèse est accessible à l'adresse : http://theses.insa-lyon.fr/publication/2017LYSEI059/these.pdf © [J. Bolivar], [2017], INSA Lyon, tous droits réservés

Chapter II: Literature review
José Bolivar 12
Thèse en Sciences des Matériaux / 2017
Institut national des sciences appliquées de Lyon
In this way, the crack growth takes into account the dissolution process, the film repair
stage and the influence of the local strain rate at the crack tip (mechanical influence). The
deterministic approach of the model is based on the knowledge of both the local chemistry
at the crack tip and the crack tip strain rate. Both parameters can be really difficult to obtain
properly by experimental approaches and are the main cause of the development of different
versions of this model. The main difference between the several modificat ions lies in the
dependence of the current density according to the local electrochemical environment inside
the crack. The other discrepancy concerns the influence of the crack tip strain rate. Several
equations have been already proposed to describe the current density taking into account
different mechanical approaches [26]–[31]. Nevertheless, no consensus exists between the
different analytic equations and their validity is still in discussion, mainly because they
assume that crack tip strain is « homogeneous » while in fact it occurs along slip planes and
it is fundamentally localized [22], [23], [32].
Figure II-1. Schematic representation of the crack advance process due to successive film breakdown/film
repair transients, according to the slip-dissolution model: (Left) sequence of transients from Staehle and
(Right) resulting crack advance, from Ford.
Two modes of cracking can be described by this model: continuous cracking when the crack
tip remains bare thanks to a faster kinetics of film rupture compared to the rate of re -
passivation, and discontinuous cracking, when the crack tip has enough time to re-passivate
completely and is frequently broken by the emergence of slip steps. Moreover, the model
has been proposed to describe IG-SCC as well as TG-SCC. Nevertheless, using this model
to describe TG-SCC seems very delicate since in this mode of cracking the fractured
surfaces matches very well, indicating that very little dissolution is involved. Consequently,
this model has been more accepted for explaining intergranular SCC, specifically for
materials exhibiting a pre-existing active path (e.g. sensitized stainless steels and some
Cette thèse est accessible à l'adresse : http://theses.insa-lyon.fr/publication/2017LYSEI059/these.pdf © [J. Bolivar], [2017], INSA Lyon, tous droits réservés

Chapter II: Literature review
José Bolivar 13
Thèse en Sciences des Matériaux / 2017
Institut national des sciences appliquées de Lyon
aluminum alloys), and is generally not accepted as a mechanism of transgranular SCC [11].
It is in particular believed to be responsible for the IG-SCC of sensitized stainless steels
and Ni-base alloys in aerated high temperature water, i.e. in BWR plants using the so-called
“Normal Water Chemistry” and successfully modelled by the P lant Life Extension
Diagnosis General Electric (PLEDGE) model developed by Ford and Andresen.
II.2.2.2 Film Induced Cleavage (FIC) model
The actual authors of this model are Sieradzki and Newman. The high growth rates (≈10-7
m/s) and the apparent arrest marks on transgranular fracture surfaces are not consistent with
the slip dissolution model [33]. Those facts have encouraged some workers to argue that
TG-SCC can be explained by an environmental phenomenon causing micro-cleavage [34].
This model assumes that an environmentally induced brittle film forms at the crack tip that
fractures very fast in a brittle manner. The strain caused to base metal is too fast to be
accommodated by the emission of dislocations and cracking continues to propagate across
the ductile matrix for distance greater (10 – 10000 times) than the film thickness. The crack
finally stops, suffers blunting and the film grows back to the conditions for cleavage (see
Figure II-2). This model is able to explain the existence of crack arrest marking on the
fracture surface, the cleavage like facets and discontinuous crack propagation. Therefore,
the model seems to be more adapted for TG-SCC than for IG-SCC.
The brittle surface films responsible for this form of SCC are generally nano-porous layers
due to selective dissolution of an alloying element. This is believed to occur on copper
alloys in ammonia, nitrite or chloride containing environments [35]. Film induced cleavage
is also probably responsible for SCC of stainless steels in caustic environments where
chromium can be selectively dissolved.
Figure II-2. Schematic representation of the crack advance process according to by the Film-Induced Cleavage
model [36]
II.2.2.3 Adsorption-based mechanisms
Adsorbed foreign atoms at the surface of a material can lead to interactions with the
crystalline lattice and decrease the bonding forces between the surface atoms [37]. In the
late 1950s, Uhlig proposed that the chemisorption of specific ions can weaken the
Cette thèse est accessible à l'adresse : http://theses.insa-lyon.fr/publication/2017LYSEI059/these.pdf © [J. Bolivar], [2017], INSA Lyon, tous droits réservés

Chapter II: Literature review
José Bolivar 14
Thèse en Sciences des Matériaux / 2017
Institut national des sciences appliquées de Lyon
interatomic bonds at the crack tips, hence promoting crack growth by decohesion along a
cleavage plane or a grain boundary (see Figure II-3).
Figure II-3. Schematic representation of the adsorption-induced decohesion [36]
Another model based on adsorption of species was later proposed by Lynch; it was named
Adsorption-Induced Dislocation Emission (AIDE). This model assumes that the adsorption
of specific ions at the crack tip can affect the atomic neighborhood close to the surface
within a crack (see Figure II-4). The adsorption of species reduces the force of the
interatomic bond, hence, it also reduces the critical shear stress for dislocation mobility
(rather than decohesion). Dislocations are easier to move locally and facilitate the formation
of nano-voids in the plastic zone ahead of cracks, which can coalesce and produce a
cleavage-like fractured surface. This model is in some way similar to the Hydrogen
Embrittlement model (e.g. HELP see below) and can also explain many similarities between
SCC and Liquid Metal Embrittlement (LME), where analogous fractured surfaces have been
observed. In fact, several authors suggest that the rapid crack growth rates observed in such
processes can only be explained by adsorption mechanisms because there is not enough
time for the diffusion of species into the substrate or for other kinds of reaction than
adsorption.
Figure II-4. Schematic diagram representing the Adsorption-Induced Dislocation Emission mechanisms [22]
Cette thèse est accessible à l'adresse : http://theses.insa-lyon.fr/publication/2017LYSEI059/these.pdf © [J. Bolivar], [2017], INSA Lyon, tous droits réservés

Chapter II: Literature review
José Bolivar 15
Thèse en Sciences des Matériaux / 2017
Institut national des sciences appliquées de Lyon
II.2.2.4 Models involving Hydrogen
Hydrogen-based models can be adopted to describe cracking in some SCC systems for
several reasons [20]:
Hydrogen can be produced at the crack tip by electrochemical reactions and by
chemical dissociation of water.
Some materials (High-strength steels, Ni-alloys, Ti-alloys, Al-alloys, and Mg-
alloys), present degradation of the mechanical properties when tested under an
hydrogen atmosphere (non-aqueous media). Moreover, these materials can suffer
SCC in moist air, where dissolution reactions and other embrittlement phenomena
can be neglected.
Besides, the similar characteristics of the fracture surfaces produced by SCC and HE in the
materials mentioned above motivate the idea that the SCC mechanism could be the same as
those proposed for HE. Hydrogen can be adsorbed at the surface of the material and due to
its small size and its electronic configuration [38], the hydrogen atom can interact with the
lattice of the material in several manners and promote cleavage, intergranular cracking
and/or a highly localized plastic fracture. As noted, it can reduce the mechanical properties
of the alloy and cause catastrophic cracking [39]. Yet this kind of environmental assisted
cracking process cannot be explained by a single mechanism. Three main cases are usually
encountered:
Hydride-induced embrittlement: this mechanism requires the possible and s table
formation of metal hydrides within the material (as second phases). The materials
that form hydrides are primarily the group V metals including Nb, V and Ta and
also Zr, Ti, Mg and Pd and their alloys [40], [41]. The formation of these brittle
phases is enhanced by the presence of hydrogen and the existence of a stress field
at the crack tip. Hydrides form therefore at the crack tip, and due to their fragile
nature, they fail by cleavage. The process is continuously repeated until final failure
(see Figure II-5). This mechanism is supported by microscopic observations.
Figure II-5. Schematic representation of a crack growth process by hydride-induced embrittlement [42]
Hydrogen-Enhanced Decohesion (HEDE): in this mechanism, it is considered that
hydrogen influences both the rupture of atomic bonds at the crack tip and the
Cette thèse est accessible à l'adresse : http://theses.insa-lyon.fr/publication/2017LYSEI059/these.pdf © [J. Bolivar], [2017], INSA Lyon, tous droits réservés

Chapter II: Literature review
José Bolivar 16
Thèse en Sciences des Matériaux / 2017
Institut national des sciences appliquées de Lyon
interatomic cohesion forces. This model proposes that hydrogen can accumulate
around regions with strong triaxiality as it is the case at the crack tip, decreasing
the energy of bonding and facilitating crack propagation. This mechanism is
debatable since no direct evidence demonstrated that dissolved hydrogen in metals
decreases the interatomic forces. This model is applicable to non-hydride forming
systems [43].
Hydrogen-enhanced localized plasticity (HELP): this model can be applied to
systems where hydrides cannot be formed. This model establishes that the presence
of hydrogen in solid solution decreases the barriers to dislocation motion, hence,
increasing the amount of deformation but in a very local manner. In that case,
hydrogen enhances plasticity, unlike the other models for which final failure is
brittle [44].
II.2.3 Synopsis
This section gave a general idea about the different mechanisms proposed to account of the
different stages of the SCC process: (I) crack initiation and (II) crack propagation. In the
crack initiation stage, it has been noticed that the stability of the passive film (or surface
layer) generally plays a major role. This stability is controlled in part by environment
factors such as pH, electrochemical potential, local stress, strain, temperature, ions
concentration and some other factors such as surface flaws and local Cr-depletion.
On the other hand, it was observed that the crack growth process could be reduced to three
different kinds of interactions (happening the crack tip): (i) dissolution, (ii) adsorption of
species and voids coalescence and (iii) hydrogen generation, diffusion, and segregation.
The systems displaying IG-SCC seems to be more associated to a process involving
dissolution. On the contrary, the systems presenting TG-SCC would be rather linked to a
process of embrittlement promoted by the adsorption of species.
Generally, the mechanisms and models summarized in this section, describe the growth of
a single SCC defect. However, in the case of engineering materials (e.g. structural alloys),
the propagation process might involve the combination of several mechanisms and the
presence of several cracks close to each other whose interaction may modify crack growth
kinetics and lead to crack coalescence processes. The latter are believed to modify the crack
growth which will differ from those described by the deterministic models here detailed.
The next section is devoted to introduce the multiple cracking phenomenon and its
consequences on crack growth.
Cette thèse est accessible à l'adresse : http://theses.insa-lyon.fr/publication/2017LYSEI059/these.pdf © [J. Bolivar], [2017], INSA Lyon, tous droits réservés

Chapter II: Literature review
José Bolivar 17
Thèse en Sciences des Matériaux / 2017
Institut national des sciences appliquées de Lyon
II.3 Multiple cracking problem
In some components, a single dominant crack may develop and lead to rupture.
Nevertheless, there exist some situations where the final failure of a structural component
is preceded by the initiation, propagation, and coalescence of multiple cracks [45]. Some
examples of this kind of failure have already been reported in aging aircraft [46], pressure
vessels (of nuclear reactors) [47], [48], and piping components (in high-pressure gas
transmission) [49]–[51]. The domains where this process has occurred seem to be quite
diverse. In fact, all the cases mentioned above share a common characteristic: the
degradation process was associated to the nucleation of multiple surface cracks. Such
feature are observed in fatigue [52], thermal fatigue [53], corrosion fatigue [54] and stress
corrosion cracking [55].
The first most important contributions to the understanding of the multiple cracking
processes were developed in the gas industry field [50], [55], [56]. As mentioned above,
the initiation and propagation of multiple stress corrosion cracks caused the failure of
several high-pressure gas transmission pipelines, specifically in Canada (see Figure II-6).
Parkings and Wang can be considered as some of the pioneers in this subject. Their works
were based on the study of the influence of interactions on the growth of SCC [55], [57],
[58]. Their experimental observations conducted them to state that the periods of initiation
and development of several cracks (propagation and interactions) can represent a large part
of the lifetime of a structural component (see Figure II-7, stages 1 to 3). They also observed
that both the initiation and propagation stages were very stochastic processes. They argued
that the individual Crack Growth Rates (CGR) displayed periods of activity and dormancy
which appear to be very random [58]. Those statements were very important and changed
the point of view of classical failure analysis and lifetime prediction assessments. The
implementation of crack velocities obtained from notched specimens (single crack) and the
simplification of the periods of initiation and interaction between cracks were signaled to
be at the origin of possible exaggerated conservatism in component lifetime predictions .
The same conclusions can be directly transposed to the nuclear industry. In this field, the
emergence of multiple cracks on components of the primary cooling circuit of several
Japanese nuclear reactors stimulates the intensification of the research in this domain [48].
The next section is aimed at summarizing the main results concerning the effects of crack
interactions on the crack growth. Another subsequent section is devoted to the works that
have been done in the numerical field (modeling).
Cette thèse est accessible à l'adresse : http://theses.insa-lyon.fr/publication/2017LYSEI059/these.pdf © [J. Bolivar], [2017], INSA Lyon, tous droits réservés

Chapter II: Literature review
José Bolivar 18
Thèse en Sciences des Matériaux / 2017
Institut national des sciences appliquées de Lyon
Figure II-6. Example of multiple cracking problems in high-pressure gas transmission pipelines: (a) Failure in
a buried gas transmission pipeline by IG-SCC [50] (b) Representation of the stress state of a pipeline and (c)
circumferential SCC crack colony in a pipeline [59]
Figure II-7. Schematic representation of the lifetime of a component subjected to multiple Stress Corrosion
Crack initiation, coalescence, and growth [56]
II.3.1 Crack interactions and crack colony behavior
A crack colony is defined as a set of cracks sharing a well-confined surface (see Figure
II-6.c). Individual cracks in the colony exhibit an irregular growth which is expected to be
controlled by the interactions between the cracks [58], [60]. Such mechanical interactions
Cette thèse est accessible à l'adresse : http://theses.insa-lyon.fr/publication/2017LYSEI059/these.pdf © [J. Bolivar], [2017], INSA Lyon, tous droits réservés

Chapter II: Literature review
José Bolivar 19
Thèse en Sciences des Matériaux / 2017
Institut national des sciences appliquées de Lyon
result from the reorganization of the stress field (see Figure II-8) ahead of the different
cracks tips (stress concentration) and crack flanks (stress relaxation/shielding) [61]. Those
complex interactions conduce to an irregular intermittent growth, periods of dormancy (or
permanent arrest) and crack coalescences. Consequently, the effects of the interactions have
direct implications on both the growth behavior of cracks and the remaining lifetime of the
component.
Figure II-8. Schematic representation of the re-organization of the stress field around a surface crack
Failure analysis involving multiple parallel cracks requires delimitating cracks that
propagate as isolated ones from those that interact. Forsyth [62] was the first one to suggest
that there exist an offset distance limit allowing to make such a distinction. He suggested
that the limit must be proportional to the plastic zone size of the approaching crack tips and
that the point of maximum interaction coincides with the overlapping of both plastic zones
(see Figure II-9). Moreover, Wang et al. proposed a very simple rule for coalescence
obtained from numerous experimental observations [58]. The coalescence criteria state that
the separation of the parallel cracks (h) should be less than a fraction of the mean length of
both cracks to coalesce (see Equation II-2).
ℎ < 0.14 × (2𝑐1+2𝑐2
2) Equation II-2
where c1 and c2 are the half-length of the approaching cracks.
In addition, they observed that the conditions for coalescence were independent of either
the material, stressing condition or the environment. Similar criteria were also obtained for
fatigue crack growth by Ochi et al. [52] for different materials (304 SS, S15C, and Cu).
Such observations suggest that crack coalescence in SCC is a purely mechanical process.
Cette thèse est accessible à l'adresse : http://theses.insa-lyon.fr/publication/2017LYSEI059/these.pdf © [J. Bolivar], [2017], INSA Lyon, tous droits réservés

Chapter II: Literature review
José Bolivar 20
Thèse en Sciences des Matériaux / 2017
Institut national des sciences appliquées de Lyon
Figure II-9. Changes of the crack tip plastic-zone size for approaching and passing offset cracks. The numbers
denote simultaneous crack tip position [62]
Crack coalescence is characterized by a particular deviation of the approaching crack tips
as depicted in Figure II-10 [63]. It has been theoretically demonstrated that such a deviation
is produced by the emergence of mixed loading conditions at the crack tips (modes I and
II). Several proposed theories describe the curve trajectory of the crack tips; among them,
it can be cited the Maximum Energy Release Rate (MER), Maximum Tangential Stress
(MTS) or the Minimum Strain Energy density (MSE). Wang et al. state that the introduction
of a mode II stress have important consequences in a system where plasticity controls the
crack growth [63]. In fact, the size of the plastic zone in mode II is larger than in mode I
for comparable stress intensity factors (see Figure II-11). This can accelerate crack growth
but can also involves plasticity-induced crack closure, thereby, reduce the crack
propagation rate. Other authors [64], [65] argued that the enhanced plasticity can also
induce the initiation of cracks at the crack tip and cause an apparent acceleration of the
crack growth by the coalescence of these cracks.
Figure II-10. Typical example of the change in direction of the closest tips of two cracks to achieve
coalescence [66]
Cette thèse est accessible à l'adresse : http://theses.insa-lyon.fr/publication/2017LYSEI059/these.pdf © [J. Bolivar], [2017], INSA Lyon, tous droits réservés

Chapter II: Literature review
José Bolivar 21
Thèse en Sciences des Matériaux / 2017
Institut national des sciences appliquées de Lyon
Figure II-11. Crack tip plastic zone shapes estimated from elastic solutions and the von Mises yield criterion:
(a) Mode I and (b) Mode II [67]
Figure II-12. Intensification of the SIF values of the approaching crack tips of two semi -elliptical cracks
(subjected to a tensile stress): (Left) geometry of the interacting cracks and (Right) Normalized SIFs along the
crack front of the inner crack tip of the of the crack “1” (a 1/c1=0,8) [61]
As can be observed, the crack coalescence is a very well established process with solid
theoretical basis. Nevertheless, interactions exist well before coalescence takes place (or
even if there is not) [68]. Kamaya et al. study through several analytical works the effect of
interactions on crack growth [69]–[71]. Their approach was based on the Linear Elastic
Fracture Mechanic (LEFM), precisely on the assessments of the Stress Intensity Factors
(SIF) of a couple of approaching cracks. The SIF values describe the local stress conditions
near the crack tips. Therefore, the interaction effects are studied by calculating the evolution
of the SIF of the approaching cracks. The analytical assessment of the SIF-values is often
performed by using the Body Force Method (BFM) or Finite Element Modelling (FEM).
A consensus in the results shows that the SIFs values in the vicinity of the approaching
crack tips are perturbed during the advancing process (see Figure II-12) [68]. The
perturbation can cause an acceleration, a retardation or crack arrest. Kamaya et al. [61]
showed that the interaction level depends on the relative position of cracks, the relative
length, and the relative shape of the cracks. They also demonstrated that in the case of two
approaching identical cracks (same length), the SIF value is magnified and causes an
Cette thèse est accessible à l'adresse : http://theses.insa-lyon.fr/publication/2017LYSEI059/these.pdf © [J. Bolivar], [2017], INSA Lyon, tous droits réservés

Chapter II: Literature review
José Bolivar 22
Thèse en Sciences des Matériaux / 2017
Institut national des sciences appliquées de Lyon
acceleration of the crack growth in the most part of the geometrical configurations [63].
Despite this, in the case of overlapping crack tips, the interaction level decreases due to the
shielding effect1 [61]. Furthermore, Kamaya et al. proved that the intensity of the
interactions varies across the position in the crack front of a 3D semi-elliptical crack [68].
The SIF values are therefore higher at the surface approaching crack tips than in the middle
point of each crack in the depth direction [68]. At this point, it can be stated that the
interactions between cracks are a complex process, and that the intensity of the interactions
depends largely on the stage of growth. It means that it is constantly changing and needs to
be evaluated permanently as the cracks approach to each other.
II.3.2 Multiple cracking and lifetime predictions
The first part of this literature review has described the different processes contributing to
the growth of a stress corrosion crack. The slip dissolution model represents one of the most
reliable deterministic mechanisms able to describe the crack advance under operating
conditions (in Boiling Water Reactors) [72]. The model takes into account the contribution
of electrochemistry and mechanical factors in order to estimate the crack growth rate. The
slip dissolution model has shown good performances in predictive estimations [72].
Nevertheless, there is still missing a deterministic model able to take into account the
nucleation and propagation of multiple cracks. Moreover, the Crack Growth Rates (CGRs)
issued from the slip dissolution model can be highly impacted by the possible interactions
that could exist between neighboring cracks. Therefore, using the estimated CGRs (from
the slip dissolution model) in situations where multiple cracks are nucleated can lead to
misleading conclusions. Even more if the period of initiation is neglected.
Realistic lifetime predictions of high-pressure pipelines have been already performed in the
past [57]. Such structures are strongly susceptible to slightly alkaline multiple IG-SCC or
near neutral multiple TG-SCC. The model used for such predictions was based on a Monte-
Carlo approach [57], [66]. Such decision obeys to the stochastic nature of most of all the
parameters necessary for modeling (initiation, CGRs, electrochemistry, crack morphology).
The input values were obtained through numerous statistical characterizations of the
distributions (Weibull distributions) of the initiation of cracks, cracks lengths, and CGRs.
In this model, crack initiation is controlled by a power law (determined experimentally) and
by a Weibull distribution of random crack sizes. The Weibull distributions are determined
empirically for the particular material, environment and stress conditions. On the other
hand, the crack velocities are derived from Weibull distributions which are a function of
the crack length, the stress, and the environment. For each selected time period, the
coordinates of each randomly located crack are determined, then a test is conducted to
calculate the probability of dormancy and subsequently the appropriate value of crack
1
The shielding effect represents the diminution in the CGR once the crack tip enter s to the stress
relaxation zone of a neighbor crack. The diminution in the CGR is caused by a reduction of the SIF
value.
Cette thèse est accessible à l'adresse : http://theses.insa-lyon.fr/publication/2017LYSEI059/these.pdf © [J. Bolivar], [2017], INSA Lyon, tous droits réservés

Chapter II: Literature review
José Bolivar 23
Thèse en Sciences des Matériaux / 2017
Institut national des sciences appliquées de Lyon
velocity is applied to the selected growing cracks. After that, the cracks are tested for the
coalescence criterion (Equation II-2). The program continues to integrate multiple initiation
and growth until a crack reaches a pre-set critical size criterion. The process is then repeated
many times to determine the distribution of failure times.
Yet, the model presents several drawbacks that can impact the confidence limits of the
results. Firstly, the model does not take into account the effect of local stress in the
nucleation rate of cracks. Secondly, the model does not take into account the possible
change of cracks growing towards the depth-direction. Additionally, the interactions are
strongly simplified: they are basically neglected until the coalescence criterion is reached.
Moreover, the dormancy of cracks is entirely established by statistical parameters, without
taking into account local stresses (stress shielding). Some of these points have already been
taken into account by Kamaya et al. and included in a simulation procedure, particularly,
the effect of local stresses on the initiation kinetics [65]. Nevertheless, a coupling with a
deterministic approach able to describe the evolution of a crack colony by the synergic
effect of the electrochemistry and mechanical factors is still missing.
II.3.3 Synopsis
This section introduced the influence of the interactions between several cracks on their
individual behavior. The latter has been demonstrated by both experimental observation
and analytical approaches. The experimental observations dealt principally with the study
of crack interactions as a function of crack parameters such as length, offset distance, crack
growth rate and coalescence events. On the other hand, the study of crack interactions has
also been performed numerically by the evaluation of the SIF values. Such evaluation has
only been performed in the cases of coplanar and parallel cracks (2D or 3D). To summarize,
it was observed that the interactions modify the CGRs of the interacting crack tips and tha t
the intensity of the interaction is a function of the relative position of cracks, relative length,
and relative shapes (crack front shape and dimensions). In other words, the interaction level
changes as the cracks develop. This implies that the interactions between the cracks have
to be permanently evaluated.
Although a lot of progress have been made in the mechanistic SCC studies devoted to the
propagation of a single crack, very few works have taken into account the effects of the
interactions between several cracks for a predictive analysis. A deterministic/empiric model
able to describe the initiation of multiple cracks and their propagation that takes into
account the specificities of the crack growth processes involved in SCC, i.e., the synergy
between the electrochemistry and the mechanical factors is still missing.
As already mentioned before, the final aim of this project consists in the development of a
model able to take into account the points mentioned above. For this, it is essential to
develop an experimental methodology that allows obtaining all the input parameters
necessary for the construction of the model and for its validation. The SCC system should
Cette thèse est accessible à l'adresse : http://theses.insa-lyon.fr/publication/2017LYSEI059/these.pdf © [J. Bolivar], [2017], INSA Lyon, tous droits réservés

Chapter II: Literature review
José Bolivar 24
Thèse en Sciences des Matériaux / 2017
Institut national des sciences appliquées de Lyon
permit the possibility to modify the crack colony morphology (e.g. cracks density) in order
to obtain a varied input data able to describe different situations. As detailed in Section II.2,
the modification of electrochemical (e.g. pH, potential), environmental (severity,
temperature, pressure) and mechanical factors (e.g. stress, strain rate) can have
consequences: (i) on the initiation kinetics of cracks (i.e. crack density) and (ii) on the
contribution of electrochemical and mechanical processes implied in crack growth. A
system which meets the conditions mentioned above is the alloy 600 in polythionate
solutions. In fact, this alloy can be sensitized at different degrees; additionally, the severity
of the corrosive media can also be easily modified. The above allows initiating multiple
cracks in the form of colonies which is the object of this work. The next section is therefore
devoted to describe the SCC of the alloy 600 in polythionate solutions; the section includes
also sensitized austenitic stainless steels because, in polythionic solutions, both materials
behave in very similar way and their SCC mechanism is considered to be the same.
II.4 Intergranular stress corrosion cracking of
Austenitic Stainless Steels (ASS) and
Nickel base alloys in solutions containing
polythionic acids
II.4.1 Polythionic Acids
Polythionic acids have the general formula of H2SxO6 with x being 3, 4 or 5 for the most
usual. Both of the protons have very strong acidic properties so that in aqueous solution
they exist under the form of oxy-sulfur anions (e.g. SxO62-). Moreover, polythionates are
metastable anions and their chemistry is very particular and complex. They can be oxidized,
reduced and can disproportionate or decompose under varying electrochemical and/or
chemical conditions. Figure II-13 depicts a simplified potential-pH diagram for the S-H2O
system. In this diagram, only a group of the possible reactions were considered for practical
reasons. It can be observed that the regions of stability of the thiosulfate and tetrathionate
(S2O32-, S4O6
2-) are very narrow. In fact, it is very likely that such metastable species coexist
with other sulfur compounds such as S, H2S, HS-, and HSO3 - in aqueous solutions [73].
Besides, it can be noticed that thiosulfate is more stable at neutral-basic pH while
tetrathionate is more stable at acidic pH values.
Polythionates are present in many industrial sectors such as chemical, pharmaceutical, pulp
and paper, petrochemical, nuclear and recently in hydrometallurgy (gold leaching) [73].
Corrosion problems involving polythionates have been reported mainly in the oil and
nuclear industries. In oil refineries, an iron sulfide scale can be produced in the
hydrocracking process of sour crude oil. The iron scale subsequently reacts with water and
Cette thèse est accessible à l'adresse : http://theses.insa-lyon.fr/publication/2017LYSEI059/these.pdf © [J. Bolivar], [2017], INSA Lyon, tous droits réservés

Chapter II: Literature review
José Bolivar 25
Thèse en Sciences des Matériaux / 2017
Institut national des sciences appliquées de Lyon
oxygen during shutdowns to form polythionic acids (see Equation II-3) and other
oxyanions, such as thiosulfate (S2O32−) [74].
8FeS + 11O2 +2H2O 4Fe2O3 + 2H2S4O6 Equation II-3
On the other hand, the thiosulfate ion can also be accidentally found in the main cooling
system of nuclear power plants, where solutions of borate with thiosulfates are stored to be
used as sprays in containment building following a serious nuclear accident (thiosulfate
anions are used to react with the iodine fission products) [75], [76]. Many cases of localized
corrosion such as pitting, crevice and stress corrosion cracking have already been registered
in such environments. Therefore, Polythionic Acid Stress Corrosion Cracking (PTA-SCC)
has been intensively studied in the last 30 years. Nevertheless, the SCC mechanisms remain
in discussion [73], [77].
Figure II-13. Simplified potential-pH diagram for the system S-H2O. The total concentration of sulphur in
water is 0.204 grams S per kg H2O [78]
II.4.2 PTA-SCC mechanism in ASS and Nickel base alloys
It has been reported that the polythionate solutions can cause stress corrosion cracking of
structural materials such as austenitic stainless steels and nickel base alloys [79], [80]. It is
highlighted that in such systems, a sensitized microstructure is essential to promote
intergranular cracking [81].
Sensitization is a deleterious phenomenon that takes place in austenitic steels and other
nickel-base alloys [82]–[84]. It consists in the formation of Cr-depleted zones in the vicinity
of the grains boundaries (see Figure II-14), due to the intergranular precipitation of
chromium carbides when the material is heated to unappropriated temperatures (400-800
°C) for a certain period of time. Intergranular Cr-depletion impairs the formation of passive
Cette thèse est accessible à l'adresse : http://theses.insa-lyon.fr/publication/2017LYSEI059/these.pdf © [J. Bolivar], [2017], INSA Lyon, tous droits réservés

Chapter II: Literature review
José Bolivar 26
Thèse en Sciences des Matériaux / 2017
Institut national des sciences appliquées de Lyon
films and facilitates the initiation of cracks [85]. The Cr-depleted zones become more
anodic than both the grains and the chromium carbides, hence, intergranular corrosion
and/or intergranular stress corrosion cracking are promoted.
Figure II-14. Schematic representation of the intergranular stress corrosion cracking of austenitic stainless
steels alloys in polythionic acids [86]
In this system, the crack initiation kinetics is strongly dependent on both the sensitizing
degree and the associated grain boundary chromium depletion. Figure II-15 shows that IG-
SCC occurs when grain boundary Cr concentration is lower than a critical value and
becomes more severe as grain boundary Cr concentration decreases [79], [80]. Crack
initiation takes place by film rupture over the Cr-depleted zones produced by the
sensitization treatment [87]. The film rupture occurs due to Inter-Granular Attack (IGA)
and/or due to the emergence of slip steps on the surface, over the Cr-depleted region. Crack
initiation kinetics has been reported to increase with decreasing the pH [88]. In stainless
steel alloys the stability of the passive film is given by the potential and pH domains at
which the material is exposed [15], [89], [90]. Acidic media weaken the passive film and
compromise the conditions of re-passivation. Therefore, not only the crack density (crack
initiation kinetic) can be controlled by changing the pH, but the contribution of mechanical
and electrochemical factors on the crack propagation can also be managed. Moreover, it has
been reported that this system exhibits short incubation time for crack initiation at acidic
pHs [91].
Figure II-15. Percentage of IG fracture versus grain boundary chromium concentration for Ni–16Cr–9Fe
stressed in 0.017 M Na2S4O6 at 25 °C [79]
Cette thèse est accessible à l'adresse : http://theses.insa-lyon.fr/publication/2017LYSEI059/these.pdf © [J. Bolivar], [2017], INSA Lyon, tous droits réservés

Chapter II: Literature review
José Bolivar 27
Thèse en Sciences des Matériaux / 2017
Institut national des sciences appliquées de Lyon
The crack propagation process in this system is not very clear and remains in discussion
[73]. Nevertheless, a general consensus exists concerning some points. It is generally
accepted that the crack propagation is improved by an important anodic dissolution of the
active-path, which is formed between the Cr-depleted zones and the matrix. Stress has a
purely mechanical effect, increasing crack opening, enhancing the transport of species and
increasing anodic dissolution [92]. This dissolution seems to be enhanced by the deposition
of elemental sulfur at the crack tip which prevents repassivation and increases anodic
dissolution [93]. The elemental sulfur is produced by the reduction of the metastable anions
(tetrathionate, thiosulfate) according to Equation II-4 and Equation II-5.
S4O62- + 12H+ + 10e 4S + 6H2O Equation II-4
S2O32- + 6H+ + 4e 2S + 3H2O Equation II-5
Several works have demonstrated that the chemisorption of sulfur significantly enhances
the dissolution rate of iron and nickel [93], [94]. Nevertheless, it remains difficult to
explain the high CGRs registered during cracking only by anodic dissolution. In that
context, some authors argued that a mechanical step must also be involved (cleavage) while
some others state that hydrogen-embrittlement mechanisms must be implicated [77], [80].
Newman et al. studied the SCC process of a sensitized 304 Stainless Steel (SS) in thiosulfate
solutions at relatively high pH [80]. They stated that the highest current density obtained
from scratching test can only produce Crack Growth Rates (CGRs) 50 to 100 times smaller
than those experienced during the SCC tests. Based on thermodynamic arguments, they
disregarded the hydrogen embrittlement mechanism for this system. They explained the
results on the basis of intermittent brittle fracture of the grains boundaries, assisted by local
formation of strain generated martensite and sharpening effect of anodic dissolution.
Concerning alloy 600, where the martensite does not form, Newman et al. suggested that
the process must involve localized fracture of the grain boundaries.
Moreover, contrary results were reported by Gomez-Duran, et al. for 304 SS in thiosulfate
solutions [80]. The authors measured the coupling current between the crack tip and the
external surfaces of the specimen. The crack seemed to grow via a series of microfracture
events that induced a periodic noise in the coupling current. The dimension of the
microfracture events was estimated to be the supra-grain size of the material (3 times the
average grain size) [95]. The authors state that such dimension is too large to be produced
by the brittle fracture of strain-induced martensite on the grain boundaries. Gomez-Duran
et al. argued that the only viable explanation is the contribution of an hydrogen-induced
cracking into the crack growth process, the hydrogen being promoted by the high acidity of
the crack tip media but also by the catalysis of hydrogen formation by the adsorbed sulfur.
It has been postulated that atomic sulfur inhibits the recombination of hydrogen atoms,
thereby promoting the entry of hydrogen into the material.
Cette thèse est accessible à l'adresse : http://theses.insa-lyon.fr/publication/2017LYSEI059/these.pdf © [J. Bolivar], [2017], INSA Lyon, tous droits réservés

Chapter II: Literature review
José Bolivar 28
Thèse en Sciences des Matériaux / 2017
Institut national des sciences appliquées de Lyon
Finally, it would be interesting to note that depending on pH, sensitized SS can suffer either
significant generalized intergranular corrosion or IG-SCC. The above could correspond to
change in the mechanisms according to the solution pH. On the left of the Figure II-16,
cracking could be due to a simple opening of IG penetration. On the right, cracking could
be more related to film rupture. Similar observations can be done on the effect of potential
(see Figure II-17).
Figure II-16. Cross-sectional micrographs of sensitized 304 SS U-bended specimens tested in a solution of 1
wt. % K2S4O6 at different pH values (adjusted by H2SO4 addition) [96]
Figure II-17. Stress corrosion cracking test performed in a sensitized 304 SS at various potential in a
polythionic acid solution. Figures indicate potential and time to failure. NF stands for no failure. 10 X, 100 X
[97]
II.4.3 Synopsis
Through this section, it is stated that sensitized austenitic stainless steels and nickel based
alloys are susceptible to suffer intergranular stress corrosion cracking in polythionate
solutions. Moreover, several factors which are expected to influence the intergranular
Cette thèse est accessible à l'adresse : http://theses.insa-lyon.fr/publication/2017LYSEI059/these.pdf © [J. Bolivar], [2017], INSA Lyon, tous droits réservés

Chapter II: Literature review
José Bolivar 29
Thèse en Sciences des Matériaux / 2017
Institut national des sciences appliquées de Lyon
process were listed. Firstly, it was noted that the material susceptibility is highly related to
the sensitization degree. The incubation time was observed to diminish when increasing the
sensitization state. Secondly, it was also noticed that the properties of the passive film
control both initiation and propagation of cracks. It was mentioned that such properties a re
controlled by the pH of the solution and the corrosion potential. Considering all above, it
can be argued that the morphology of the cracks can be controlled by the pH, the potential
and the degree of sensitization.
Moreover, it was noticed that the processes involved in the crack propagation advance are
not yet well-understood. Clearly, the mechanism must imply an important anodic
dissolution of the active-path. Nonetheless, the measurements of the current involved
during the cracking step are not able to explain the rapid crack growth rate experienced.
This fact suggests that other processes (cleavage, HE) also support the cracking
mechanisms. A mechanistic study is not the aim of this work. Nevertheless, the
experimental methodology developed through this work can potentially elucidate some of
the missing parts.
In that context, it can be stated that the polythionate solutions and the alloy 600 are good
candidates for the experimental part of this investigation. The main reasons are that this
system quickly produces IG-SCC, enabling the feasibility of monitoring techniques and
producing the initiation of multiple cracks on smooth specimens. It is expected that by
modifying experimental parameters such as pH and the degree of sensitization of the
material, different crack colony morphologies will be obtained.
Finally, the next section will be devoted to describe the experimental techniques that can
be looked for the experimental approach here developed. The chosen techniques must allow
obtaining: (i) statistical data on the colony and also (ii) local measurements useful to
characterize the interactions between the cracks, in order to finally implement and validate
modeling of multiple SCC propagation.
Cette thèse est accessible à l'adresse : http://theses.insa-lyon.fr/publication/2017LYSEI059/these.pdf © [J. Bolivar], [2017], INSA Lyon, tous droits réservés

Chapter II: Literature review
José Bolivar 30
Thèse en Sciences des Matériaux / 2017
Institut national des sciences appliquées de Lyon
II.5 Experimental approach for a quantitative
in-situ evaluation of multiple stress
corrosion cracks propagation
A key point in the study of multiple cracks growth is the development of a methodology for
quantifying the rate of damage and the different phases involved in the evolution of the
crack colony. Experimental approaches for studying single long environmental assisted
cracks are well established. In this case, standards are available for evaluating crack growth
rates under Linear Elastic Fracture Mechanics (LEFM) on notched Compact-Tension (CT)
specimens (e.g. ASTM E 1681-03 [98]). However, as far as small numerous cracks are
concerned, there are no standards that guide the measurement process, neither in the case
of a single defect nor for multiple growing cracks.
In this context, the next section aims at introducing some experimental techniques able to
provide statistical data and local measurements concerning the development of a crack
colony. The information obtained through the implementation of the techniques here
described should allow characterizing the crack colony behavior and the interactions
between the cracks. Among the most relevant techniques, Digital Image Correlation (DIC)
seems to be quite promising in SCC studies. This technique gives access to local
measurements of deformation and to the early detection of growing defects on the surface.
However, the technique provides only surface mechanical information about the process
(2D); its extension to 3D is possible but need tomographic imaging techniques (e.g. high -
resolution X-ray tomography). In order to cover both the mechanical and the
electrochemical steps involved in the crack colony growth (in a three-dimensional manner),
complementary techniques such as Acoustic Emission (AE) and Electrochemical Noise
(EN) can be coupled to DIC. The latter should provide a broad range of mechanistic
information (mechanical and electrochemical) in three dimensions.
DIC, EN and AE techniques are therefore presented in this section. Their basis, their
advantages and their applications for SCC studies are detailed
II.5.1 Digital Image correlation
Digital image Correlation (DIC) is an optical method designed to measure full displacement
fields and/or full deformation fields in solids [99]. The basis of the technique consists in
capturing successive images of the surface: one before deformation (reference image) and
the others corresponding to the deformed states. The principle of the technique consists in
estimating the displacement field that allows reproducing the deformed images from the
reference image [100]. Roughly speaking, a numerical treatment (described later) will
compare both images for determining the associated displacement field. In order to
facilitate the comparison, the surface of the object must display a random pattern (non -
Cette thèse est accessible à l'adresse : http://theses.insa-lyon.fr/publication/2017LYSEI059/these.pdf © [J. Bolivar], [2017], INSA Lyon, tous droits réservés

Chapter II: Literature review
José Bolivar 31
Thèse en Sciences des Matériaux / 2017
Institut national des sciences appliquées de Lyon
repetitive, isotropic and with high contrast) [101]. This random pattern is generally made
by spraying black and white paints [99]. The paint layer must remain sufficiently thin so
that the displacement field corresponds to that of the surface of the sample. Sometimes, the
application of a paint is not possible (e.g. corrosive media, high temperatures) [102]. In that
case, the surface preparation can be performed by abrasion or metallographic attacks [103].
DIC technique presents several advantages that have encouraged its democratization in
materials science:
First, the experimental set-up to perform DIC measurements is much simpler than
those used in equivalent full-field measuring techniques (holographic
interferometry and speckle interferometry) [104]–[107]. Such techniques based on
interferometry are accurate but need very complex setups (black-rooms, lasers,
mirrors and specific material roughness) limiting their range of use [99]. On the
other hand, DIC requires basically a CCD camera, a lighting dispositive and an
adapted optical lens.
Secondly, DIC is a contactless technique. This provides useful solutions to
experiments performed in aggressive, hot, corrosive environments [108], [109].
Moreover, DIC is also very interesting when testing soft materials for which gauges
are not adapted (e.g. polymers, wood, paper) [110], [111].
The access to kinematic measurements (displacement/deformation field) is very important
in fracture mechanics [112], [113]. This capacity enables the implementation of DIC
measurements for the study of the mechanical behavior of homogeneous and heterogeneous
materials, notably, for the identification of material properties and material behaviors. The
technique facilitates the detection of the initiation and propagation of cracks. In fact, the
initiation of a crack leads to the apparition of a discontinuity (step jump) in the displacement
field. Due to the subpixel resolution of the technique, DIC allows detecting and
characterizing optically invisible cracks [114]. Moreover, some works have employed DIC
for the study of crack propagation (notched specimens). For instance, the technique allows
obtaining SIF values, crack opening angles and crack tip opening displacement with very
good accuracy [115]–[117].
II.5.1.1 Description of the DIC principle
DIC can be performed by two main different approaches. They are respectively named local
and global (see Figure II-18) [118]. Both methods achieve the same result but can diverge
in the accuracy level. The local approach consists in splitting the reference image into
several subsets of pixels. The displacement vector is therefore estimated for each subset,
and the full displacement field is obtained by interpolating all the obtained solutions
between all the subsets [99]. Appeared later, the global method uses the entire image to
determine the displacement field. The method is based on a mesh and the shape functions
Cette thèse est accessible à l'adresse : http://theses.insa-lyon.fr/publication/2017LYSEI059/these.pdf © [J. Bolivar], [2017], INSA Lyon, tous droits réservés

Chapter II: Literature review
José Bolivar 32
Thèse en Sciences des Matériaux / 2017
Institut national des sciences appliquées de Lyon
are directly issued from the finite element method[119]. Hence, all the elements are related
to each others, and the final solution is more accurate. During this work, the algorithm used
for the correlation was based on a global approach (finite element based) [120], [121].
Figure II-18. A schematic presentation of the two classical Digital Image Correlation methods: the local
method (subset division) and the global method (finite element meshing) [122]
II.5.1.2 Problem to be solved
The functions representing the respective gray levels of the reference image 𝑓(𝑥) and the
deformed image 𝑔(𝑥) have to be considered. The vector 𝑥 denotes the coordinates in the
plane of the surface (x and y) of the specimen on which the method is applied. The aim of
the DIC method is to identify the displacement field 𝑢 which allows passing from the image
𝑓(𝑥) to the image 𝑔(𝑥) with the Equation II-6. This relation expresses the equation of the
optical flow 3 [123].
𝑓(𝑥) = 𝑔(𝑥 + 𝑢) Equation II-6
The problem is ill-posed because the solution consists in a vector 𝑢 of dimension two that
have to be determined from a scalar equation (see Equation II-6). Consequently, the method
used to resolve such a problem consists in determining the closest solution that minimizes
the residue of the optical flow equation by the least square method. This is equal to
minimize the quantity 𝐼 (𝑢𝑎) defined by the Equation II-7.
3
The optical flow describes the variations of the gray levels due to the movement of an object between
two successive images of the same scene. To calculate it, it is assumed that a material point retains its
luminous intensity during its displacement
Cette thèse est accessible à l'adresse : http://theses.insa-lyon.fr/publication/2017LYSEI059/these.pdf © [J. Bolivar], [2017], INSA Lyon, tous droits réservés

Chapter II: Literature review
José Bolivar 33
Thèse en Sciences des Matériaux / 2017
Institut national des sciences appliquées de Lyon
𝐼 (𝑢𝑎) = ∫ [𝑓(𝑥) − 𝑔 (𝑥 + 𝑢𝑎)]2
𝛺
𝑑𝛺 Equation II-7
Where Ω represents the Region Of Interest (ROI) on which the functions 𝑓(𝑥) and 𝑔(𝑥)
are defined. In the frame of the global approach, the method is based on a Finite Element
(FE) mesh and the solution 𝑢𝑎 is decomposed into a base of functions 𝜙𝑖(𝑥, 𝑦) of dimensions
Nf (see Equation II-8).
𝑢𝑎 = ∑ 𝜙𝑖𝑁𝑓𝑖=1 (𝑥, 𝑦)𝜔𝑖
Equation II-8
The term 𝜔𝑖 represents the degree of freedom of the problem and the final equation to be
solved is described by the Equation II-9. The solution is achieved by an iterative method
until the minimum of the function is obtained.
min |𝜔𝑖{∫ [𝑓(𝑥) − 𝑔 (𝑥 + 𝑢𝑎)]
2
𝛺𝑑𝛺} Equation II-9
Note that despite that the method here detailed is based on a 2D approach, its extension to
3D is possible and underlies in the same principle. In this case, the technique usually adopts
the name of Digital Volume Correlation (DVC) which is a synonym of 3D-DIC. The only
difference is the additional dimension of the vector 𝑥 (x, y, z).
Nevertheless, in a 3D context, the technique requires both three-dimensional images of the
object and the presence of a three-dimensional pattern. The latter can be obtained through
high-resolution X-ray tomography on materials displaying a natural pattern compatible with
DVC measurements. The presence of second phases (e.g. intermetallics, precipitates) with
a good phase contrast has already been used for DVC analysis [122], [124].
II.5.1.3 Digital image correlation in SCC studies
In this context, some studies have already used DIC in SCC experiments [125]–[127]. Cook
et al. were the first to implement DIC to SCC studies [127]. They detected and quantified
the growth of a few cracks at room temperature, in a 304 L stainless steel with a detection
resolution of 250 µm in length and an opening of 5µm. Moreover, Duff and Marrow [128]
observed the propagation of short cracks in aerated water at high temperature and pressure
(250 °C and 50 bars). They followed the initiation of intergranular cracks by length and
opening measurements. The same authors also observed the propagation of multiple
cracking in a 304 SS in a solution of tetrathionate [114]. They highlighted the high
sensitivity of the technique to detect small crack opening displacement and lengths. In a
like manner, Kovac and coworkers [129] coupled DIC with complementary techniques such
as Acoustic Emission (AE) and Electrochemical Noise (EN) in order to increase the
monitoring capabilities of the SCC process. By using this configuration, the authors
detected the initiation of a short crack (notched sample) before its macroscopic apparition.
Cette thèse est accessible à l'adresse : http://theses.insa-lyon.fr/publication/2017LYSEI059/these.pdf © [J. Bolivar], [2017], INSA Lyon, tous droits réservés

Chapter II: Literature review
José Bolivar 34
Thèse en Sciences des Matériaux / 2017
Institut national des sciences appliquées de Lyon
II.5.1.4 Synopsis
Digital Image Correlation is an optical method with a wide success in the Fracture
Mechanics field. Its full-field measuring characteristics and its relatively simple set -up to
perform the measurements, are two of the main reasons of its fast spreading out to materials
science. As noted, DIC seems to be very promising in SCC studies. The technique has
displayed exceptional performances in detecting narrow cracks, and identifying the
characteristics of an SCC process, providing crack location and dimensions. Moreover, DIC
can provide local measurements of the kinematic that can be useful to study cracks
interactions. Notwithstanding, DIC gives only access to mechanical information of the
cracking process. Both the electrochemistry and the crack propagation mechanisms are not
accessible from the DIC data. Moreover, DIC deals with only surface information, unless
the conditions are met to extend the technique to three dimensions. Consequently , it appears
interesting to couple DIC with complementary techniques such as AE and EN in order to
obtain 3D information about the cracking mechanisms and parameters.
II.5.2 Acoustic Emission technique
II.5.2.1 Principles
Acoustic emission (AE) is defined as the group of processes in which transient elastic waves
are generated by the energy dissipations of localized sources (within a material). These
elastic waves propagate over a wide range of frequencies, ranging from audible to the MHz
range [130]. In AE, the originated waves are generally detected by the use of a piezoelectric
sensor (resonant or broadband) which makes it possible to transform the elastic wave into
an electrical signal. The detected signal is very often of low amplitude and requires
amplification (by using pre-amplifiers). After this stage, the signal can be filtered by the
use of high-pass and low-pass filters. The filtering steps eliminate the background noise as
well as the parasite signals. Finally, the signal is recorded in a computer for feature
extractions and processing (see Figure II-19).
AE is qualified as a dynamic, global and fast technique, which means that the detection of
the signal is performed at the same time when the localized phenomenon becomes active.
In addition, AE allows locating the source if multiple sensors are employed (by
triangulation). On the other hand, the main disadvantages of AE are its high sensitivity to
capture interference and its incapacity to determine defects size or shape. In order to obtain
quantitative results about size and depth, other complementary nondestructive testing
methods (often ultrasonic testing) are necessary.
The acoustic emission is often discontinuous, discrete and is closely associated with the
physical mechanisms that accompany its release. This means that if a particular process is
able to provide an important AE activity, the corresponding originated AE waves can be
Cette thèse est accessible à l'adresse : http://theses.insa-lyon.fr/publication/2017LYSEI059/these.pdf © [J. Bolivar], [2017], INSA Lyon, tous droits réservés

Chapter II: Literature review
José Bolivar 35
Thèse en Sciences des Matériaux / 2017
Institut national des sciences appliquées de Lyon
seen as the fingerprint of the AE source. Each AE wave can be characterized by different
parameters, whether in the temporal domain or in the frequency domain (see Figure II-20).
Some of the most basic wave parameters are detailed hereunder.
Amplitude: it is the greatest measured voltage in a waveform and is expressed in
decibels (dB). This is an important parameter in acoustic emission inspection
because it determines the detectability of the signal. Signals with amplitudes below
the operator-defined threshold (minimum threshold) will not be recorded.
Rise time: it is the time interval between the first threshold crossing and the signal
peak. This parameter is related to the propagation of the wave between the source
of the acoustic emission event and the sensor. Therefore, rise time is used for
qualification of signals and as a standard for noise filter.
Duration: it is the time difference between the first and last threshold crossings.
Duration can be used to identify different types of sources and to filter out noise.
Like counts, this parameter relies upon the magnitude of the signal and the
absorbing properties of the material.
Figure II-19. Basis of the Acoustic Emission technique
Figure II-20. Principal features of an AE burst signal
Cette thèse est accessible à l'adresse : http://theses.insa-lyon.fr/publication/2017LYSEI059/these.pdf © [J. Bolivar], [2017], INSA Lyon, tous droits réservés

Chapter II: Literature review
José Bolivar 36
Thèse en Sciences des Matériaux / 2017
Institut national des sciences appliquées de Lyon
II.5.2.2 Acoustic Emission in SCC studies
Yuyama [131] reported that several processes could provide the release of acoustic
emissions during SCC. These include metal dissolution, hydrogen gas evolution, the
breakdown of thick oxide films, fracture or decohesion of precipitate and inclusions, plastic
deformation by slip or twin, martensitic transformation, and micro/macro-cracking (see
Figure II-21). Nevertheless, Yuyama argued that the most part of the sources associated to
the corrosion process (metal dissolution, film formation) are not energetic enough to be
detected by the piezoelectric sensors. In contrast, he argued that the rupture of thick film,
gas releasing, plastic deformation and the propagation of cracks are very energetic
processes, and can therefore be easily detected.
Figure II-21. Sources of acoustic emission in SCC [131]
In that context, several works have reported the origin of the recorded AE activity during
SCC experiments. It was stated that most of the AE events registered during SCC are
originated by the propagation of cracks and by the increasing plastic deformation produced
at the crack tips. In a like manner, several authors have recorded AE during SCC tests,
under Slow Strain Rate Tests (SSRT). Most of the AE activity was highly concentrated just
above the yield point and before the final fracture [132]. The AE activity around the yield
point was related to cooperative dislocations movements. In contrast, the high activity near
the final fracture was due to the propagation of macro-cracks. In some other studies [129],
[133]–[135], it was indicated that individual AE activity could be related to crack initiation,
crack propagation and final failure. Indeed, the acoustic emission activity increases as
cracks initiate and propagate.
Moreover, other works have successfully detected TG-SCC and IG-SCC in various metals
(α-brass, ASS and Ag-Au alloys) [136]–[138]. It is generally accepted that TG-SCC can be
successfully detected by AE, in contrast, the detection of IG-SCC is less reliable and more
difficult [137]–[140]. Alvarez et al. [138] reported that the AE activity recorded during the
propagation of TG-SCC was generally of one order of magnitude higher than the AE
Cette thèse est accessible à l'adresse : http://theses.insa-lyon.fr/publication/2017LYSEI059/these.pdf © [J. Bolivar], [2017], INSA Lyon, tous droits réservés

Chapter II: Literature review
José Bolivar 37
Thèse en Sciences des Matériaux / 2017
Institut national des sciences appliquées de Lyon
activity recorded during IG-SCC propagation. They attributed this result to the fracture of
ligaments behind the advancing of the crack in TG-SCC. On the other hand, the mean values
of the amplitude and rise time of the AE signals registered during both processes (IG-SCC
and TG-SCC) were found to be similar and only varied slightly between different
environments tested [137], [138]. These results suggest that the AE recorded during the
IG-SCC experiments are not characteristic of a dissolution process, in contrast, they seem
to be more related to a mechanical source (deformation at the crack tips).
In order to obtain additional information about the relationship between SCC and AE,
numerous authors have coupled other complementary methods (in addition to AE),
including electrochemical noise (EN), tensile force and elongation measurements, and
digital image correlation [129], [133], [141]–[144]. By implementing simultaneous EN and
AE measurements, Yonezu et al. [141] studied the mechanisms of IG-SCC of a sensitized
304 SS tested in a tetrathionate solution. In this work, some activity was registered all alon g
the SCC test. The authors proposed that AE bursts recorded during the IG-SCC were related
to the detachment of surface grains. Moreover, Leban and co-workers [133], [145]
monitored the progress of IG-SCC on a sensitized type 304 SS exposed to aqueous sodium
thiosulfate and sodium thiocyanate solutions. According to the authors, the detection of
simultaneous transients in the electrochemical current noise and acoustic emission bursts
indicated the discontinuous nature of the monitored IG-SCC processes.
To conclude, Acoustic Emission have been widely used in SCC studies due to its
performances for monitoring crack initiation and growth. In addition, it was observed that
the implementation of AE coupled to others complementary techniques (such as EN), allows
obtaining a wider range of information about the cracking process, covering the
electrochemical and mechanical elementary mechanisms involved in the propagation of
cracks.
II.5.3 Electrochemical Noise technique
The emergence of Electrochemical Noise in SCC studies has been seen by some
corrosionists as quite promising. In fact, this technique has been used increasingly from the
90's due to its non-intrusive characteristics and its performances on (i) detection of crack
initiation, (ii) monitoring of SCC progress and (iii) quantification of dissolved amount of
metal along cracking steps.
In the case of stochastic corrosion processes (pitting corrosion, crevice, Stress Corrosion
Cracking, fatigue corrosion, etc. [146], [147]) the use of traditional electrochemical
techniques (polarization curves, potentiostatic polarization or impedance measurements)
sometimes become unappropriated and ineffective. Indeed, those deterministic techniques
involve measurements based on controlling the potential or the current of the whole
electrochemical system, hence, changing the natural evolution of the system and sometimes
Cette thèse est accessible à l'adresse : http://theses.insa-lyon.fr/publication/2017LYSEI059/these.pdf © [J. Bolivar], [2017], INSA Lyon, tous droits réservés

Chapter II: Literature review
José Bolivar 38
Thèse en Sciences des Matériaux / 2017
Institut national des sciences appliquées de Lyon
modifying the process. In order to overcome that barrier, researchers started to develop a
technique allowing the obtaining of information coming from random mechanisms without
applying an external perturbation. It was in the 70’s when Iverson introduces
Electrochemical Noise in the field of corrosion [148]. The idea of studiying the spontaneous
fluctuations on the electrical quantities, potential and current, established the basis of
Electrochemical Noise. It represents the spontaneous variations in the current
(Electrochemical Current Noise, ECN) and potential (Electrochemical Potential Noise,
EPN) which occur during an electrochemical process [147], [149], [150]. In such way, EN
technique allows registering those low-level fluctuations which can be seen as the
fingerprint of a particular electrochemical process [151], [152].
II.5.3.1 Sources of Electrochemical Noise
Noise has usually been related to spurious, unwanted disturbances that interfere and
pollutes a recorded signal [153]. In the signal processing field, the term has sometimes been
also used to describe signals that are random (stochastic signals) which means that the
amplitude and phase values cannot be predicted in a deterministic way [153]. There exist
several fundamental noise sources such as:
Thermal noise: the origins of thermal noise arise from thermal vibrations of
electrons and charge carriers in a conductive medium (solid, electrolytic, etc.)
encountered at the thermodynamic equilibrium [154]. In the case of resistors, the
thermal-induced motion of electrons generates a stochastic separation of charges
across the resistance and thereby generates a voltage and current noise given by
Equation II-10 and Equation II-11, respectively [155].
𝜓𝑉(𝑓) = 4𝑘𝑇𝑅 Equation II-10
𝜓𝐼(𝑓) = 4𝑘𝑇1
𝑅 Equation II-11
Where k is the Boltzmann’s constant, T is the absolute temperature, and R is the
resistance (real part of the impedance). It can be noticed that the noise is totally
white, which means that the PSD is frequency-independent. In the case of an
electrochemical process, the thermal noise is generated by the impedance of the
interface metal-solution. In systems involving passive metals or coating, which are
known to possess high-impedances, thermal noise could be more significant.
Finally, thermal noise determines the absolute minimum noise that can be expected
to exist in a system, meaning that its amplitude is quite low compared to noise
generated by electrochemical systems [156].
Shot noise: it results from the sudden transfer of a quantity of charge. It was first
observed in vacuum tubes, where each electron transporting a charge q (in a very
short time) caused a current spike [157]. In that case, supposing that all the charge
Cette thèse est accessible à l'adresse : http://theses.insa-lyon.fr/publication/2017LYSEI059/these.pdf © [J. Bolivar], [2017], INSA Lyon, tous droits réservés

Chapter II: Literature review
José Bolivar 39
Thèse en Sciences des Matériaux / 2017
Institut national des sciences appliquées de Lyon
carriers move independently, and therefore follow a Poison process (random), the
average current can be expressed by [146]:
< 𝐼 >= 𝜆𝑞 Equation II-12
Where λ and q represent respectively the mean number of charge transfered by unit
of time and the electric charge. The PSD of the current fluctuations (𝜓𝐼(𝑓)) is given
by
𝜓𝐼(𝑓) = 2𝑞 < 𝐼 >= 2𝜆𝑞2 Equation II-13
It can be noticed that in conventional electric shot noise the PSD is also frequency-
independent (white noise), considering the short duration of the events. Besides, the
amplitude is very low as the charge is related to that one of an electron. However,
numerous electrochemical processes can give place to a large liberation of charge
in the form of transients and produce shot noise [158]. For example, in metastable
pitting, a huge quantity of charge is involved. However, the charge transfer is not
instantaneous. Thus, the PSD is frequency dependent.
Flicker noise (or 1/f noise): the origin is not completely understood, but it is widely
observed in a big range of systems. Flicker noise is related to noise whose amplitude
decreases while increasing frequency [159]. This kind of noise is present in some
EN instrumentation and might limit the sensibility of the instrument in the low-
frequency region.
In addition to fundamental noise sources, there exist additional noise-generation processes
in corrosion which have larger amplitudes than those mentioned above [160]. Among the
main origins we can cite:
Charge flow in diffusion and electrochemical reactions: they are related to the
fluctuations of reactants in an activation-controlled reaction and/or in a mass-
transport limited reaction. The intensity of noise will depend on the kinetics of the
release of electron packets once an anodic event is happening. This liberation will
lead to shot noise, which is very often of low amplitude. In the case of anodic
dissolution of metal, the intensity of noise is expected to be quite important because
an important amount of charge is involved [160].
Film deterioration, destruction, and recovery at metal-dissolution interface: they are
related to fluctuations in the electrode activity. In the case of localized corrosion,
the breakdown and repair of a passive film are widely known processes for
generating transient of quite important amplitudes [161], [162]. A discontinuous
process such as metastable pitting is known to produce very well established
transients [146]. Their shape consists in a sudden increase in current (see Figure
Cette thèse est accessible à l'adresse : http://theses.insa-lyon.fr/publication/2017LYSEI059/these.pdf © [J. Bolivar], [2017], INSA Lyon, tous droits réservés

Chapter II: Literature review
José Bolivar 40
Thèse en Sciences des Matériaux / 2017
Institut national des sciences appliquées de Lyon
II-22) coming from the rupture of the passive film and the dissolution of bare metal,
followed by a sharp drop which is related to the re-passivation process [163]. On
the other hand, the shape of the potential recorded transient might changes. The
recovery of the potential drop is influenced by the charging kinetics of the double-
layer capacitance by the cathodic reactions. Moreover, other discontinuous
processes are also expected to produce important noise; they range from stress
corrosion cracking, fatigue corrosion, crevice corrosion and erosion-corrosion.
Figure II-22. Schematic shape of a current and potential fluctuation associated with metastable pitting [15]
Gas evolution during corrosion reactions: they are originated by the variations in
the active electrode area [164]. The formation of hydrogen gas bubbles (generated
by cathodic reactions) will mask a small portion of the active surface. This kind of
screening becomes more important as the bubble grows. Once the bubble breaks
away, there will be a fluctuation on the active surface of the electrode which gives
place to spiky transients (see Figure II-23). A more detailed description of sources
of EN produced by bubble evolutions has been detailed in [165].
Figure II-23. Schematic shape of fluctuations associated with bubble gas detachment [165]
II.5.3.2 Different types of Electrochemical Noise experimental setups
Due to the low level amplitudes of the EN signals, a special care needs to be taken when
choosing the configuration of the electrochemical cell (number of electrodes, spacing,
Cette thèse est accessible à l'adresse : http://theses.insa-lyon.fr/publication/2017LYSEI059/these.pdf © [J. Bolivar], [2017], INSA Lyon, tous droits réservés

Chapter II: Literature review
José Bolivar 41
Thèse en Sciences des Matériaux / 2017
Institut national des sciences appliquées de Lyon
exposed area, etc.) and the measuring equipment (instrumental noise level, anti -aliasing-
filters, quality of amplifiers, etc.) in order to diminish the spurious noise and interferences
[166]. There exist two main approaches for measuring EN. The oldest and simple method
consists in measuring only the Electrochemical Potential Noise (EPN) or the
Electrochemical Current Noise (ECN) by using only one Working Electrode (WE). They
are respectively achieved by performing a galvanostatic control (see Figure II-24.a) or a
potentiostatic control (see Figure II-24.b), measuring the output (potential or current) [167].
Potentiostatic control: here, a constant potential is imposed between the WE and the
Reference Electrode (RE) by using a classical Counter-Electrode (CE). The
resulting current (I0 + ∆I) is therefore measured through the resistor R next to the
CE (Figure 3.1). An advantage of this method is the capacity to diminish the
incubation period, especially, in cases where the initiation period is time consuming
(e.g., pitting). It is also interesting in cases where the current noise is too low to be
detected; in this case, by polarizing the sample onto more aggressive condition, the
amplitude of current noise is expected to increase. Some other applications of this
method can be found in studies related to passivity. By controlling the potential,
information about the kinetics involved in the mechanism of breakdown and repair
of the passive film could be obtained. Nevertheless, the polarization might modify
the process and the mechanisms of interest. In addition, special care needs to be
taken in the resolution capabilities of the potentiostat used for the regulation of
potential. If poor resolution instrument is used, the measurements of ECN will be
degraded by the instrumental noise.
Galvanostatic control: in this case, a constant current is input to the system through
a galvanostat (see Figure II-24.b) and using a classical CE. The resulting potential
(V0 + ∆V) is then measured between the RE and the WE. In the case of measurements
performed at the corrosion potential, the galvanostat is not needed.
Figure II-24. Electrical scheme and an equivalent circuit of the measurement methods of EN. a) Potentiostatic
method and b) Galvanostatic method [167]
Cette thèse est accessible à l'adresse : http://theses.insa-lyon.fr/publication/2017LYSEI059/these.pdf © [J. Bolivar], [2017], INSA Lyon, tous droits réservés

Chapter II: Literature review
José Bolivar 42
Thèse en Sciences des Matériaux / 2017
Institut national des sciences appliquées de Lyon
In 1986, Eden et al. proposed an innovative method allowing the simultaneous measurement
of the EPN and the ECN at open circuit potential [168]. This approach involves two
identical freely corroding working electrodes which are connected through a Zero-
Resistance-Ammeter (ZRA). The ZRA ensures that both WE’s are at the same potential
allowing to measure the fluctuations of the coupling current passing across the two WE’s
(see Figure II-25). The EPN is then measured between both Working Electrodes and the
RE (or a third WE). In order to diminish the coupling current (I0) and increase the resolution
capabilities when measuring the current fluctuations (∆I), the symmetry of the system has
to be of first order. It means that the WE’s used in the measurements of current fluctuations
(WE1 and WE2) have to be as close as possible: same material, same size, same surface
preparation and same experimental conditions.
Figure II-25. Experimental setup for EN measurements at Open Circuit Potential conditions [167]
Sometimes the symmetry condition is not possible to be accomplished. This is the case of
studies involving Localized Corrosion phenomena (pitting, crevice, etc.) where one of the
electrodes can become suddenly more active than the other one and the condition of equality
is no longer reached [169]. It is also the case in Stress Corrosion cracking (SCC) or Fatigue
Corrosion (FC) studies where only one WE is stressed.
II.5.3.3 Electrochemical Noise data analysis
EN data analysis can be done in several ways, each one offering different advantages. They
can be mainly divided into visual examination of the time records, statistical analysis, and
processing in the frequency domain. The type of analysis will depend on the objectives of
the study: detection of corrosion, monitoring of corrosion, quantification of damage and/or
mechanisms studies.
Visual examination of the time records: it is the most intuitive way to make a first
approach for the analysis of data, and it must always be the first to be employed. It
is particularly useful when isolate transients are present in the time record and can
be easily identified (e.g. pitting). The observation of the signals allows a qualitative
examination of transients, hence, the identification of the type of corrosion (see
Figure II-26) and/or the stage of the corrosion process (monitoring purposes).
Among the parameters that can be analyzed, the form, size, and frequency of
Cette thèse est accessible à l'adresse : http://theses.insa-lyon.fr/publication/2017LYSEI059/these.pdf © [J. Bolivar], [2017], INSA Lyon, tous droits réservés

Chapter II: Literature review
José Bolivar 43
Thèse en Sciences des Matériaux / 2017
Institut national des sciences appliquées de Lyon
apparition of the transients can be cited. In addition, this method allows confirming
the correlation between the EPN and ECN records. Usually, the corrosion events
give place to current transients (release of e-) which generate potential fluctuations.
Consequently, a visual correlation must exist in the time-series between the EPN
and the ECN. Finally, this method can be used in order to detect the initiation of a
corrosion event (see Figure II-26) and also to monitor the evolution of corrosion
process. Of course, the main disadvantage of this method concerns data dealing with
a long time which can result in very time-consuming acquisition.
Figure II-26. Electrochemical Noise measured during different stages of corrosion in diluted aqueous solution
of Na(OH) and NaCl: (I) Passivity, (II) Metastable pitting, (III) Stable pitting on WE, (IV) General corrosio n
and (V) Pitting on CE [170]
Statistical analysis: it consists in the study of a population of points (potential or
current values) by describing the distribution of such values. Between the statistical
parameters, the most used that can be cited are the standard deviation, the skewness
and the kurtosis. The main advantages of this method is that it allows studying
lengthy data in a simple way without being as time-consuming as the visual
examination. As mentioned before, the calculation of any statistical parameters
requires the condition of stationarity to be confirmed (see Appendix B). Here below,
an indication of the physical meaning of some statistical parameters is discussed.
o Standard Deviation (SD,σ), variance, Root Mean Square (RMS) value: they
represent the most used statistical parameters in EN data analysis. They are
associated with the mean amplitude of fluctuations on the time record
analyzed. Figure II-27 shows the relation between the standard deviation
and the shapes of the signal. As they are related to each other, the assessment
of only one of them will give the same information.
Cette thèse est accessible à l'adresse : http://theses.insa-lyon.fr/publication/2017LYSEI059/these.pdf © [J. Bolivar], [2017], INSA Lyon, tous droits réservés

Chapter II: Literature review
José Bolivar 44
Thèse en Sciences des Matériaux / 2017
Institut national des sciences appliquées de Lyon
Figure II-27. Graphical example showing the relationship between the standard deviation of a signal (σ) and
their amplitudes. Note that Vpp means Voltage peak to peak [171]
o Skewness: it provides an indication of the symmetry of the distribution (see
Equation II-14). A value of zero implies that the distribution is symmetrical
whereas a positive skewness implies that there is a tail in the positive direction
and a negative skewness indicates a tail in the negative direction (see Figure
II-28). In the case of localized corrosion, where unidirectional transient are
expected to be recorded, the time record will be heavily skewed.
𝑆𝑘𝑒𝑤 = ∑ (𝑥[𝑘]−��)3𝑁
𝑘=1
𝑁−1(𝑥[𝑘]2 )32
Equation II-14
Figure II-28. Graphical representation of Skew of distribution [151]
o Noise Resistance (Rn): this parametter is derived from the calculation of the
standard deviation in potential and current (see Equation II-15).
𝑅𝑛 =𝜎𝑣
𝜎𝐼 Equation II-15
Where σv and σI are respectively the standard deviation of the potential and
current noise.
Cette thèse est accessible à l'adresse : http://theses.insa-lyon.fr/publication/2017LYSEI059/these.pdf © [J. Bolivar], [2017], INSA Lyon, tous droits réservés

Chapter II: Literature review
José Bolivar 45
Thèse en Sciences des Matériaux / 2017
Institut national des sciences appliquées de Lyon
Some studies [172]–[176] have related this parameter to the polarization
resistance Rp which describes the corrosion rate in the cases of general
corrosion (Stern-Geary equation, 𝑅𝑝 ∝ 1/Icorr). Nevertheless, its interpretation
in SCC studies is hazardous as the statement mentioned above is only valid in
some circumstances, notably when dealing with symmetric electrodes [169].
In addition, the measurements of the ECN are more prone to spurious
contamination by the instrumental noise, therefore, the meaning of Rn could
be in some cases misleading.
Processing in the frequency domain: any signal can be transformed from the
temporal domain to the frequency domain in order to analyze its frequency
composition (spectra, frequency spectrum). For example, by using the Fourier series
a signal can be separated into a sum of sines and cosines of different amplitudes,
frequencies, and phases (see Figure II-29), hence, obtaining an overview about its
composition. The latter introduces the “spectral estimation” definition which is the
process of estimating the power present at the various frequency of a signal. The
results of a power estimation are called “Power Spectral Density” with units of
V2/Hz or A2/Hz for potential PSD and current PSD respectively. For their
estimation, the most commonly used methods in corrosion are the Fast Fourier
Transform (FFT) and the Maximum Entropy Method (MEM) (described below).
Figure II-29. Relation between the temporal domain and the frequency domain. (a) Frequency decomposition
of a signal and (b) frequency content from PSD
o Fast Fourier Transform (FFT) based method: this method is one of the most
widely used for spectral estimation. It is based on the calculation of the FFT of
the time-series and the subsequent calculation of the modulus squared of the
FFT already calculated (see Figure II-30). The main advantage of this method
is that it needs few independent inputs to be defined by the user.
Notwithstanding, the resolution of the PSD is related to the minimum frequency
analyzed (fmin =1/N*fs), with N being the length of the analyzed block (power of
2) and fs the sampling frequency. The PSD obtained with this method looks very
noisy and is very often smoothed after calculation (see Figure II-31). The
manner most used consist in averaging several PSD. In fact, the standard
Cette thèse est accessible à l'adresse : http://theses.insa-lyon.fr/publication/2017LYSEI059/these.pdf © [J. Bolivar], [2017], INSA Lyon, tous droits réservés

Chapter II: Literature review
José Bolivar 46
Thèse en Sciences des Matériaux / 2017
Institut national des sciences appliquées de Lyon
deviation of the results owes to 1/√𝑀, M being the number of blocks used for
the average [177].
o Maximum Entropy Method (MEM): the difference of this method with the FFT-
based one is that it uses the calculation of the Fourier Transform of the
Autocorrelation Function (ACF) for the spectrum estimation. If the ACF is used as
obtained (raw), the method is called the periodogram method. Nevertheless, the
estimation involving the MEM method fits the ACF, resulting indirectly in a
smoothed spectra. This is a clear advantage compared to the PSD obtained by the
FFT where the noisy spectrum needs to be averaged. Conversely, the main
disadvantage is that the function which fits the ACF implies the computation of a
number of coefficients. The number of coefficients represent the order of the MEM
and is user-defined. Its choices will have consequences on the shape of the spectrum
(resolution/noise) and will add an additional uncertainty (see Figure II-31).
Figure II-30; Summary of the different methods for the calculation of power spectra [151]
Cette thèse est accessible à l'adresse : http://theses.insa-lyon.fr/publication/2017LYSEI059/these.pdf © [J. Bolivar], [2017], INSA Lyon, tous droits réservés

Chapter II: Literature review
José Bolivar 47
Thèse en Sciences des Matériaux / 2017
Institut national des sciences appliquées de Lyon
Figure II-31. Comparison between PSD estimation of white noise from FFT method and MEM. (a) FFT (1), (b)
FFT (20), (c) MEM (10), (d)MEM (30) and (e) MEM (300). For clearer reading the curves a,b,c,d and e were
multiplied by 10,102,103 and 104 respectively. FFT (k) “k” is the number of time records used for average.
MEM (k) “k” is the order for MEM calculation [177]
Analyzing in the frequency domain carries out unavoidably an increase in difficulty
on the interpretation stage, particularly when no transients are visible on the time
records and when the instrument noise can be the main source. Besides, when
transients are present some care need still to be taken on the interpretation as
different transient shapes could give the same PSD. Similarly, the PSD of an
individual fluctuation is the same of that one obtained from a time series involving
several transients but with much less power. The shape of the PSD depends
therefore on the shape of transients, on its statistical distribution, and on the
distribution of their characteristic parameters (lifetime, decay constant, amplitude,
etc.) [178]. An example of a typical PSD obtained in corrosion studies can be seen
in Figure II-32: the curve displays a 1/𝑓𝑛 shape having a low-frequency plateau, an
inflection point (knee frequency) and then a decreasing behavior (higher
frequencies) which slope is the n-exponent under a log-log scale.
In a like manner, the PSD can be characterized by the roll -off slope (n exponent)
and the low-frequency value (related to a low-frequency plateau). Several
researchers [174], [175], [179], [180] have related those parameters to the type of
corrosion. Nevertheless, the obtained results exhibit very scarce data and any
consensus have been reported on the results [181]. Another parameter similar to Rn
but calculated in the frequency domain is the Noise Impedance (Zn). Zn is calculated
following the Equation II-16 and has also resistance's units.
Cette thèse est accessible à l'adresse : http://theses.insa-lyon.fr/publication/2017LYSEI059/these.pdf © [J. Bolivar], [2017], INSA Lyon, tous droits réservés

Chapter II: Literature review
José Bolivar 48
Thèse en Sciences des Matériaux / 2017
Institut national des sciences appliquées de Lyon
𝑍𝑛 = √𝛹𝐸(𝑓)
𝛹𝐼 (𝑓) Equation II-16
According to Bertocci et al. Zn can be analogous to the impedance modulus in some
circumstances, especially, when the electrodes are symmetric [172]. In this case,
the authors claim that Zn is equal to the impedance modulus of the working
electrodes. In contrast, this statement is no longer true if the system becomes
asymmetric. In this case, its interpretation is not straightforward and needs special
care because the noise impedance will be comprised between the impedance
modulus of the two working electrodes.
Figure II-32; Schematic diagram showing typical potential noise from an electrode undergoing pitting
corrosion [182]
Finally, an important relation exists between the standard deviation of a signal and its PSD.
Such relation is given by Equation II-17 which shows that the standard deviation (for a
determined bandwidth) could be obtained from the square root of the area of the PSD.
𝜎𝑥 = √∫ 𝛹𝑥(𝑓)𝑑𝑓𝑓𝑚𝑎𝑥
𝑓𝑚𝑖𝑛 Equation II-17
II.5.3.4 Electrochemical Noise in Stress Corrosion Cracking studies
II.5.3.4.1 Electrochemical Noise sources in Stress Corrosion Cracking
It is important to have an idea of the noise sources involved in the SCC mechanisms before
analyzing the different EN parameters (SD, skew, PSD, Rn, DC drift evolution, etc.). The
first part of this chapter was devoted to the description of the main models proposed to
describe SCC (Section II.2). It was noted that the propagation of stress corrosion cracks can
be explained by different models of different nature. By either an anodic mechanism as slip
dissolution (also called film-rupture model), by a cathodic mechanism as hydrogen
embrittlement or by corrosion induced embrittlement (for a system that does not imply
hydrogen). Even if the nature of each of the models mentioned before varies, there exist
some common points between all of them which are susceptible to produce important EN
activity. Ricker established three common points as follows [43]:
Cette thèse est accessible à l'adresse : http://theses.insa-lyon.fr/publication/2017LYSEI059/these.pdf © [J. Bolivar], [2017], INSA Lyon, tous droits réservés
Chapter II: Literature review
José Bolivar 49
Thèse en Sciences des Matériaux / 2017
Institut national des sciences appliquées de Lyon
Rupture of the passive film in the crack advancing step: As mentioned in Section
II.5.3.1 the rupture of the passive film is known to produce important EN (see Figure
II-33). If this event takes place under alternated conditions there exists high
probabilities to record large noise amplitudes coming from the crack advance steps.
In multiple cracking, the propagation of different cracks is expected to increase the
level of the PSD. The latter is explained by the fact that the various advancing step
are uncorrelated and are expected to cover all the frequency range. On the other
hand, if the meantime between crack advances is within the frequency bandwidths
of the measurements, therefore, it is possible to detect it in the spectra.
The reaction of the newly exposed bare metal zone at the crack tip with the solution:
SCC can develop under discontinuous or continuous mechanisms. The SCC that
propagates in a continuous manner is related to the lack of a re-passivation stage of
the crack tip front. In this case, the extended exposure of the bare metal to the
solution (either under anodic or cathodic mechanism), will generate a “constant”
relatively low-level amplitude noise in either the current or the potential
fluctuations [160]. The amplitude of this continuous noise will, of course, depend
on the extension of the reactions. If the reactions involve more and more surface, a
slight increase in the SD of the signal is expected to be recorded. On the other hand,
if the phenomenon implies the sudden formation of active zones in the crack front
with an exponential recovery (re-passivation), the noise amplitude is expected to be
larger and also dependent on the extension of the damage, hence, influencing the
SD [183] (see Figure II-33). The form, the characteristic time (λ), the recovery time
of the fluctuations are also expected to influence the characteristics of the PSD
[178].
Hydrolysis of metal ions produced at the crack tip: The environment inside the crack
differs a lot when compared to the solution. It is widely accepted that there exists
some hydrolysis of metal ions liberated from reactions at the crack tip. The
hydrolysis of the metal ions carries out the precipitation of oxides and hydroxides
and lowers the pH. In some cases, the growing of such hydroxides tends to block
the crack path, therefore, reduces the conductivity inside the crack. All above can
result in a lost in noise signal due to the ohmic drop as crack grows towards the
bulk direction. In addition, hydrogen evolution can also happen inside the crack.
The formation, growth, and liberation of such bubbles inside the crack are also
expected to send out some noise (fluctuation of the conductivity).
Cette thèse est accessible à l'adresse : http://theses.insa-lyon.fr/publication/2017LYSEI059/these.pdf © [J. Bolivar], [2017], INSA Lyon, tous droits réservés

Chapter II: Literature review
José Bolivar 50
Thèse en Sciences des Matériaux / 2017
Institut national des sciences appliquées de Lyon
Figure II-33. Schematic diagram for a crack advance process in SCC and its relations with EN parameters
II.5.3.4.2 Electrochemical Noise measurements during SCC tests
It was in 1986 when Cottis and Loto [183] reported for the first time the application of EN
in SCC studies under freely corroding conditions. The EN acquisition system that they used
was very simple and only allowed registering Electrochemical Potential Noise. In this
manner, they applied EN measurements on three different systems for which the SCC
mechanisms were reasonably well understood, hence, expecting to determine the different
characteristic of noise according to the source. The systems (environment/alloy) of interest
were alpha-brass in a Cu-NH3 solution (IG-SCC) [184], AA 7075 in NaCl (IG-SCC) [185]
and a High-Strength carbon steel in a solution of NaCl polluted with Na2S (Hydrogen
Embrittlement) [186]. Among the most important conclusions of those works, they found
that the growth of stress corrosion cracks gives rise to an increase of the electrochemical
potential noise (see Figure II-34) [183, p. 1]. The parameter used to quantify the increase
in the level of EPN was the standard deviation, calculated from the PSD of the potential
noise (see Equation II-17). On the other hand, there was little consistent evidence of a
change in the shape of the PSD resulting from the evolution of SCC.
Cette thèse est accessible à l'adresse : http://theses.insa-lyon.fr/publication/2017LYSEI059/these.pdf © [J. Bolivar], [2017], INSA Lyon, tous droits réservés

Chapter II: Literature review
José Bolivar 51
Thèse en Sciences des Matériaux / 2017
Institut national des sciences appliquées de Lyon
Figure II-34. Evolution of the standard deviation of Electrochemical Potential of a SCC test of AA 7075 in 3.5
% NaCl [185]
The set-up developed by Eden (ZRA mode) [168], allowing registering EPN and ECN at
freely corroding conditions started to be intensively used in the 90's. Several researchers
reported the relation between crack initiation and EN measurements in different systems
[88], [143], [187]–[190]. Wells and coworkers [88] employed EN for monitoring of SCC
304 SS in dilute thiosulphate solutions at room temperature. On the other hand, Stewart et
al. [190] implemented EN on the same alloy in high-purity oxygenated water at 288 °C.
Both studies concerned IG-SCC, and both highlighted the capacity and the high sensitivity
of the technique to detect crack initiation. Wells et al. particularly stated that the technique
was better than AC potential drop for the detection of cracks smaller than 20 µm. The crack
detection was stated by visual observation of potential and current transients which were
related to the initiation, temporary growth, and arrest of short IG-SCC micro cracks. Their
results were discussed on the base of the slip dissolution model and the film-rupture model.
The dissolution of the bare metal, generated during the initiation process or the propagation
of the crack tip generates positive current transients and negative potential fluctuations.
Moreover, the reliability of EN for crack detection have been proved by simultaneous use
of complementary techniques such as AE, DIC, elongation measurements and load drops
[129], [133], [143]. Leban and coworkers [187] became interested in the fluctuations
produced during SSC of AISI 304 SS in a NaSCN solution. They performed the experiments
under Slow Rate Load Test (SRLT) and followed load and elongation measurements. In
this way, they correlated the apparition of potential and current fluctuations to load drops
and jumps on the elongation measurements (see Figure II-35). The correlations were
associated with the initiation and temporary propagation of cracks. Besides, they also
calculated the roll-off slope of the PSD in order to distinguish the active period and the
non-active period, but the results did not allow to make a clear delimitation.
Cette thèse est accessible à l'adresse : http://theses.insa-lyon.fr/publication/2017LYSEI059/these.pdf © [J. Bolivar], [2017], INSA Lyon, tous droits réservés

Chapter II: Literature review
José Bolivar 52
Thèse en Sciences des Matériaux / 2017
Institut national des sciences appliquées de Lyon
Figure II-35. Time series corresponding to the EN during a SSC test of an AISI 304 Stainless Steel (SS) i n a
NaSCN solution (a) voltage noise, (b) current noise and (d) elongation measurements during the SRLT test.
Only the last 2 hours before failure are shown [187]
EN has also been employed to monitor the progress of IG-cracking on smooth specimens
or in notched samples [129], [188]. Studies concerning ASS in polythionate solutions have
evidenced that the noise generation was highly related to the sensitization degree of the
tested samples [88], [188]. In the cases of highly sensitized specimens, the noise generated
during the IG-SCC presented scarce transients of very low amplitude. However, during the
cracking period, the DC level of the current shown a steady increase while the potential
noise level decreased. Kovac et al.[129], [133] related this increase of the DC level of the
current with the intensification of the dissolution process at the crack tip which was thought
to be continuous. On the other hand, some studies have paid attention to the shape of the
transients when cracking seems to be discontinuous. The shape of these current fluctuations
was of particular interest during the propagation of one or multiple cracks [145], [191],
[192]. Leban and coworkers [145] registered two types of transients during SCC under
SRLT: Type I – rapid sharp transients and Type II – smooth fluctuations (see Figure II-36).
Transients of Type I displayed high current amplitudes, short duration, and bigger
displacement. They were related to the crack advance by the overloading of the remnant
ligament at the crack tip (more related to mechanical failure). Type II transients displayed
high current amplitudes, long duration, and lower displacements. They were associated to
the anodic dissolution along the grain boundaries. Breimesser et al. [191] also studied the
shape of fluctuations during an SCC test on a notched sample. They registered three
different transients with some similarities to those evidenced by Leban et al. [145] (see
Figure II-37). The different transients were attributed to metastable pitting, propagation of
single cracks and macrocrack propagation or coalescence events.
Cette thèse est accessible à l'adresse : http://theses.insa-lyon.fr/publication/2017LYSEI059/these.pdf © [J. Bolivar], [2017], INSA Lyon, tous droits réservés

Chapter II: Literature review
José Bolivar 53
Thèse en Sciences des Matériaux / 2017
Institut national des sciences appliquées de Lyon
Figure II-36. Characteristic current transient types encountered during EN measurements of IG-SCC on
sensitized samples. a)Type I: Crack advance by mechanical overloading of crack ligament, b) Type II: Crack
advance by dissolution along the grain boundaries and c) Mixed Type I and II: Crack advance by anodic
dissolution and mechanical overloading of remnant ligament [145]
Figure II-37. Characteristic current transient types encountered during EN measurements of IG -SCC on
sensitized samples. I) Metastable pitting or micro-crack growth steps, II) Propagation of a single micro crack
and III) Macroscopic crack growth and or coalescence event [191]
Besides the shape of the transients, the charge associated with the current fluctuations
has also been studied [88], [190], [191], [193], [194]. The obtained values have been
implemented in the Faraday relation (Equation II-18) in order to quantify the volume of
dissolved metal involved in each crack propagation step. Most of these studies do not justify
the validity of the current measurements and the influence of the asymmetry of the system
in the current repartition. Therefore, the calculation could give sometimes misleading
results [195].
𝑉 =𝑀𝑚𝑒𝑡𝑎𝑙×𝐼×𝑡
𝜌×𝑧×𝐹 Equation II-18
(V: Volume; M: molar mass; I: current; t: time; ρ: density, z: charge number; F: Faraday
constant)
Others studies have explored the analysis of the statistic parameters and the frequency
domain in order to monitor the progress of SCC [181], [193]. Anita and coworkers studied
the noise generate by the SCC of a 316 SS in an acidic chloride solution. The assessment
Cette thèse est accessible à l'adresse : http://theses.insa-lyon.fr/publication/2017LYSEI059/these.pdf © [J. Bolivar], [2017], INSA Lyon, tous droits réservés

Chapter II: Literature review
José Bolivar 54
Thèse en Sciences des Matériaux / 2017
Institut national des sciences appliquées de Lyon
of the standard deviation of current and potential noise (σV and σI) and the Noise Resistance
(Rn), allowed differentiating the initiation period of SCC and the stage of propagation (see
Figure II-38). Moreover, the standard deviation displayed high values at the beginning
associated to the reconditioning of the passive film. Then, the standard deviation decreased
as the reconditioning was accomplished and the crack initiated. The increase of σI at about
22 h was related to the crack propagation stage.
Figure II-38. EN derived parameters during SCC of type 316 SS in boiling acidic chloride solution. (a) σ V and
σI and (b) Evolution of the Noise Resistance (Rn) and the 𝑅𝑆𝑁0
[181]
Some others studies have employed Shot Noise analysis of EN data obtained from SCC
[193]. Shot Noise theory assumes that the signals are associated to the releasing of
numerous packets of charges, which induces the apparition of current transients [196].
Under several assumptions (see [158] for more details) the Shot Noise analysis allows
obtaining the frequency appearance of the anodic events (fn) and the charge (q) involved in
each one. Calabrese and coworkers [193] studied by Acoustic Emission (AE) and
Electrochemical Noise, the progress of SCC in a 17-4 PH Stainless Steel, immersed a
solution of MgCl2 at 100 °C. The combined correlation between the AE and the Shot Noise
analysis allowed the identification of four damage stages. The discriminant parameters used
for such identification were the cumulative energy of the AE hits and the cumulative charge
obtained by Shot Noise analysis (see Figure II-39).
To conclude, it has been noticed the high capacity of the EN technique to detect and follow
the progress of SCC in a wide range of systems, going from room temperature to more
aggressive conditions (high temperature and pressure). It has also been noticed how EN in
Cette thèse est accessible à l'adresse : http://theses.insa-lyon.fr/publication/2017LYSEI059/these.pdf © [J. Bolivar], [2017], INSA Lyon, tous droits réservés

Chapter II: Literature review
José Bolivar 55
Thèse en Sciences des Matériaux / 2017
Institut national des sciences appliquées de Lyon
complement with other techniques allows increasing the understanding of the sequence of
electrochemical and mechanical events involved in the IG-SCC mechanism. Nevertheless,
the use of EN data (issued from SCC test) for the assessment of quantitative values ( e.g.,.
dissolved metal during the crack advance step) remains very delicate. As mentioned, the
methods employed in such calculations lack of justification.
Figure II-39. Identification of different damages stages during a SCC test at constant load of a 17-4 PH SS in a
solution of MgCl2 at 100 °C. Evolution of cumulative AE hit energy and cumulative shot noise electrochemical
charge (q) [145]
II.5.3.5 Synopsis
The literature review presented above shown that the EN technique displays interesting
advantages for SCC studies. Firstly, the non-intrusiveness of the technique and the
possibility of working under freely corroding conditions is worth of interest for SCC
studies. The latter allows studying the SCC system under almost natural evolution
conditions. Besides, it was noticed how performing EN is for the detection of crack
initiation. It has also been noted how EN, coupled with other complementary techniques,
can enhance the qualitative understanding of the SCC mechanisms, particularly, concerning
the sequence between the mechanical and electrochemical factors involved in crack
propagation stages. Finally, it has been seen that to carry out EN measurements is not so
easy. It requires the knowledge of concepts that are far from pure corrosion domain,
especially those related to the signal processing field: signal acquisition, signal
conditioning, and signal analysis.
Cette thèse est accessible à l'adresse : http://theses.insa-lyon.fr/publication/2017LYSEI059/these.pdf © [J. Bolivar], [2017], INSA Lyon, tous droits réservés

Chapter II: Literature review
José Bolivar 56
Thèse en Sciences des Matériaux / 2017
Institut national des sciences appliquées de Lyon
Chapter Summary
The state-of-the-art relative to Stress Corrosion Cracking presented in this chapter showed
the complexity of the problem. After having pointed out that SCC initiation and propagation
results from a synergic combination of mechanical, physical, chemical and electrochemical
factors that are characteristic of each SCC system, the most mature models proposed to
describe the main SCC modes were first exposed. So far, it was noted that a universal
mechanism able to account for all the SCC systems (materials/environments) does not exist.
Each SCC system needs to be analyzed in detail individually in order to identify the
parameters which govern the apparition and the progress of cracks.
A subsequent section highlighted the multiple cracking problem, and its consequences on
the crack growth behavior. Even if some geometrical interaction criteria were proposed, it
was noted that cracks in a colony display an irregular behavior once they start to
interact/approach with/to each other, which makes their experimental study delicate.
Moreover, deterministic/empirical models able to take into account the different stages
involved in the development of a crack colony, particularly the periods of initiation and
irregular propagation of cracks due to the interactions, are still missing.
On the other hand, alloy 600 (Ni-based alloy) is known to be susceptible to IG-SCC in
polythionic acid solutions. The process is also called Polythionic Acid Stress Corrosion
Cracking (PTA-SCC) and is common to sensitized austenitic stainless steels and nickel base
alloys. The third part of this chapter was devoted to describe the PTA-SCC mechanism. It
was evidenced that this system promotes multiple IG-SCC at room temperature, with very
short incubation periods, which makes it interesting for a feasibility and validation study.
Moreover, this system offers the capacity to control the severity of the degradation (crack
density and morphology) by controlling environmental (pH, potential) and material
parameters (sensitization). Clearly, the IG-SCC mechanism is not the same as the one
encountered in real conditions in the case of nuclear issues (primary cooling circuit),
nevertheless, the mode of cracking and the main characteristics of the obtained c rack
colonies remain equivalent. In addition, the experimental conditions for which this system
suffers IG-SCC are reasonably accessible in laboratory, hence enabling the implementation
of the experimental methodology developed within this work. This methodology is expected
to be transposed to more realistic conditions of temperature and pressure in future works
(see Section VII).
The main objective of this work is to develop an in-situ experimental approach allowing to
obtain quantitative experimental data in a fast and accurate way and to cover both the
mechanical and electrochemical steps involved in the crack colony growth. The obtained
data are expected to be eventually used for the development and the validation of a new
Cette thèse est accessible à l'adresse : http://theses.insa-lyon.fr/publication/2017LYSEI059/these.pdf © [J. Bolivar], [2017], INSA Lyon, tous droits réservés

Chapter II: Literature review
José Bolivar 57
Thèse en Sciences des Matériaux / 2017
Institut national des sciences appliquées de Lyon
numerical model that would take into account the effects of crack interaction on the crack
growth together with the relative electrochemical and mechanical contributions.
The literature review allowed identifying the most relevant experimental techniques that
can be used to reach these goals (DIC, AE, and EN) and whose simultaneous use can provide
reliable experimental data. Digital Image Correlation is a contactless technique with a high
capacity to both detect and follow crack propagation. This technique estimates the
displacement field of the sample surface, which allows calculating Stress Intensity Factors.
In addition, the technique can act as a “bridge” between experiments and simulation, as it
can provide the boundary limit conditions for modeling purposes. Nevertheless, classical
DIC gives only access to surface data. In order to monitor what is happening into the bulk,
DIC can be coupled to AE measurements. AE can provide an idea about the dynamics of
cracking into the bulk and also provide complementary information about the SCC
mechanism. Finally, as SCC also results from electrochemical processes, the
Electrochemical Noise technique, coupled to DIC and AE measurements, appears to be a
complementary relevant technique, which can improve the qualitative understanding of the
involved SCC mechanisms, particularly concerning the relative contribution of the
mechanical and electrochemical factors to the crack propagation stages.
From these conclusions, it is therefore possible to define the SCC system for studying and
the chosen experimental techniques, which are presented in details in Chapter III.
As the implementation of the experimental approach requires the validation of the material
preparation and its solicitation, Chapter IV is dedicated to the presentation of first
experimental results concerning: (i) the influence of experimental parameters (thermal
treatment, mechanical loading) on the initiation and development of a crack colony, and (ii)
the definition of a surface treatment compatible with DIC measurements and SCC
development. The performed results and analysis permit to validate the experimental
conditions adopted for all the following tests.
By its part, Chapter V presents the characterization of the growth of both a single IG-SCC
crack and a crack colony. The analysis here detailed is mainly based on DIC measurements
and their correlation with complementary data obtained by EN and AE. Besides, a
validation of the 2D quantitative characterization of the different steps of the crack colony
growth is obtained by complementary high resolution X-ray tomography and DVC
measurements.
As the literature survey pointed out the limitations of EN measurements for quantitative
evaluation of SCC rate, Chapter VI is devoted to evaluate the adverse effects of instrumental
noise and electrode asymmetry and gives a critical analysis of EN data recorded during
SCC processes.
Cette thèse est accessible à l'adresse : http://theses.insa-lyon.fr/publication/2017LYSEI059/these.pdf © [J. Bolivar], [2017], INSA Lyon, tous droits réservés

Chapter II: Literature review
José Bolivar 58
Thèse en Sciences des Matériaux / 2017
Institut national des sciences appliquées de Lyon
Finally, Chapter VII gives a general synthesis of the obtained experimental results and
proposes a global description of the life of a crack colony, considering the possible
mechanisms involved. A brief section is devoted to the discussion of the contribution of the
experimental works here performed within the global framework of the ANR ECCOFIC
project and direct prospects are presented in terms of (i) extension to o ther modes of SCC
(TG) in more representative experimental conditions (high temperature and pressure) and
(ii) innovative modeling.
Cette thèse est accessible à l'adresse : http://theses.insa-lyon.fr/publication/2017LYSEI059/these.pdf © [J. Bolivar], [2017], INSA Lyon, tous droits réservés

Chapter III: Experimental methodology
José Bolivar 59
Thèse en Sciences des Matériaux / 2017
Institut national des sciences appliquées de Lyon
Chapter III
III. Experimental methodology III.1 Introduction ................................................................................................... 61
III.2 Material characterization and preparation ................................................... 61
III.2.1 Material ................................................................................................... 61
III.2.2 Sample geometry ...................................................................................... 62
III.2.3 Characterization of the material ................................................................ 64
III.2.3.1 Mechanical properties ........................................................................ 64
III.2.3.2 Characterization of the sensitization level .......................................... 64
III.2.3.3 Characterization of the material microstructure .................................. 65
III.2.4 Study of the surface treatment for Digital Image Correlation (2D)
measurements (surface patterning) ............................................................ 66
III.2.4.1 Obtaining the surface pattern ............................................................. 66
III.2.4.2 Characterization of the surface patterning for Digital Image Correlation
(2D) measurements ............................................................................ 67
III.2.5 SCC Test solution ..................................................................................... 68
III.2.6 Preparation of the Long Tensile Samples (LTS) and the Counter-Electrodes
for the in-situ Stress Corrosion Cracking tests at room temperature ............ 68
III.2.7 Description of the Stress Corrosion Cracking tests on LTS samples ........... 69
III.2.7.1 Slow Strain Rate Tests (SSRT) .......................................................... 69
III.2.7.2 Constant Load tests (CL) ................................................................... 69
III.2.8 Description of the Stress Corrosion Cracking tests under four-point
bending… ................................................................................................. 70
III.2.9 Preparation of the Small Tensile Specimens (STS) for the In-situ Stress
Corrosion Cracking tests by using X-ray synchrotron tomography ............. 71
III.2.10 Description of the in-situ Stress Corrosion Cracking tests with the STS
samples (X-ray tomography) ..................................................................... 72
III.3 In-situ monitoring techniques used during the Stress Corrosion Cracking
tests ................................................................................................................ 73
III.3.1 Digital Image Correlation measurements ................................................... 73
III.3.1.1 DIC acquisition ................................................................................. 73
III.3.1.2 DIC data analysis .............................................................................. 74
III.3.2 Electrochemical Noise measurements ........................................................ 75
III.3.2.1 Description of the experimental setup ................................................ 75
Cette thèse est accessible à l'adresse : http://theses.insa-lyon.fr/publication/2017LYSEI059/these.pdf © [J. Bolivar], [2017], INSA Lyon, tous droits réservés

Chapter III: Experimental methodology
José Bolivar 60
Thèse en Sciences des Matériaux / 2017
Institut national des sciences appliquées de Lyon
III.3.2.2 Electrochemical Noise acquisition ..................................................... 75
III.3.2.3 Electrochemical Noise data analysis ................................................... 75
III.3.3 Acoustic Emission measurements .............................................................. 76
III.3.4 Electrochemical Impedance Spectroscopy (EIS) measurements .................. 77
Chapter summary ................................................................................................... 77
Cette thèse est accessible à l'adresse : http://theses.insa-lyon.fr/publication/2017LYSEI059/these.pdf © [J. Bolivar], [2017], INSA Lyon, tous droits réservés

Chapter III: Experimental methodology
José Bolivar 61
Thèse en Sciences des Matériaux / 2017
Institut national des sciences appliquées de Lyon
III.1 Introduction
he main objective of this study is to contribute to the development of a
new SCC model describing the interactions between several cracks and
their propagation. For this purpose, this work proposes an innovative
experimental methodology which aims at providing experimental data useful
for the construction and the validation of this new model, considering both
mechanical and electrochemical information allowing to resolve the synergic
characteristic of the problem. The experimental methodology here presented
is based on the coupling of several in-situ measurements by Digital Image
Correlation (2D and/or 3D), Electrochemical Noise technique and Acoustic
Emission.
As justified before, the studied system consists in an Alloy 600 in a
tetrathionate solution at room temperature and pressure, which is known to
suffer intergranular cracking. This chapter aims at describing all the
experimental procedures and techniques that are involved in the development
of this study. It is divided into two sections. The first section (III.2) describes
the development of the experiments (IG-SCC system), whereas the second
section (III.3) presents the in-situ monitoring technique procedures (AE,
DIC, EN and Electrochemical Impedance Spectroscopy).
III.2 Material characterization and preparation
III.2.1 Material
The tested material consisted of a 2 mm thick plate of Alloy 600. This alloy is composed
of mainly Nickel, Chromium and Iron (Ni-15Cr-9Fe). The chemical composition of the
alloy is detailed in Table III-1.
Table III-1. Composition of the tested Alloy 600
Element Ni Fe Cr Mn Cu Co Ti + Al C S
Wt. % bal. 9.25 15.52 0.12 0.1 0.1 0.25 0.03 0.,002
The increase in the susceptibility to intergranular corrosion or intergranular stress corrosion
cracking is closely related to the content of intergranular chromium carbides [79]. The
presence of Cr-carbides increases the initiation of cracks and the crack growth rate [87],
[197]. The precipitation of such carbides takes place in a well-defined range of temperatures
[198]. Therefore, the content of intergranular chromium carbides can be managed by
applying specific heat treatments.
T
Cette thèse est accessible à l'adresse : http://theses.insa-lyon.fr/publication/2017LYSEI059/these.pdf © [J. Bolivar], [2017], INSA Lyon, tous droits réservés

Chapter III: Experimental methodology
José Bolivar 62
Thèse en Sciences des Matériaux / 2017
Institut national des sciences appliquées de Lyon
Three different material preparation conditions were explored in this study. The objective
was to investigate the capacity of the alloy to suffer more or less IG-SCC according to the
different conditions. Table III-2 gathers the description of each material preparation
condition and the heat treatment applied to each one. All the heat treatments were applied
in a Nabertherm furnace in an air atmosphere.
Table III-2. Different heat treatments and material preparation conditions for the tested Alloy 600
Material preparation condition
Description of the sensitization heat treatment
As Received (AR) The material does not suffer any heat treatment. The
material is tested as received.
Mill Annealed and Sensitized
(MAS)
The material is heated at 600 °C (in air) for 30 h,
then the material is air-cooled until room
temperature.
Solution Annealed and Sensitized
(SAS)*
The material suffers a previous annealing at 1050
°C (in air) for 1 h, which is immediately followed
by a water-quenching stage. A subsequent heat
treatment is performed at 600 °C (in air) for 30 h.
Finally, the sample is air-cooled until room
temperature.
* The solution annealing treatment (used in SAS samples) dissolves all the existing chromium carbides [199];
consequently, it allows controlling the initial content of carbides before the sensitization treatment.
III.2.2 Sample geometry
All the samples were machined out by Electrical Discharge Machining (EDM). They were
obtained from a 2 mm thick plate of Alloy 600. The samples geometry varied according to
the type of experiment:
Square Samples (SS): 10 mm each side and 2 mm thick. They were used for tests
dedicated to the material characterization such as: metallography (sensitization
treatment and microstructure study), study of the surface treatment (for DIC) and
electrochemical characterization (polarization curves).
Long Tensile Specimens (LTS): These samples were used for the characterization of
the mechanical properties of the material (e.g. tensile tests) and for the Stress
Corrosion Cracking tests. The geometry of these samples is represented in Figure
III-1. In some cases a notch was machined (by EDM) on the middle section of the gage
length. This type of sample is further cited as Long Tensile Notched Specimens
(LTNS). The geometry of the notch is showed in Figure III-2.
Cette thèse est accessible à l'adresse : http://theses.insa-lyon.fr/publication/2017LYSEI059/these.pdf © [J. Bolivar], [2017], INSA Lyon, tous droits réservés

Chapter III: Experimental methodology
José Bolivar 63
Thèse en Sciences des Matériaux / 2017
Institut national des sciences appliquées de Lyon
Figure III-1. Geometry of the Long Tensile Specimens (LTS)
Figure III-2. Geometry of the Long Tensile Notched Specimens (LTNS)
Small Tensile Specimens (STS): this type of sample was dedicated to the in-situ SCC
tests performed by using X-ray synchrotron tomography. The reason of their small
size was due to the limitations of the experimental device. The geometry of these
samples is represented in Figure III-3.
Figure III-3. Geometry of the Small Tensile Specimens (STS)
Flexion Samples (FS): this type of sample was dedicated to the bending SCC tests.
The geometry of these samples is represented in Figure III-4.
Figure III-4. Geometry of the Flexion Samples (FS)
Cette thèse est accessible à l'adresse : http://theses.insa-lyon.fr/publication/2017LYSEI059/these.pdf © [J. Bolivar], [2017], INSA Lyon, tous droits réservés

Chapter III: Experimental methodology
José Bolivar 64
Thèse en Sciences des Matériaux / 2017
Institut national des sciences appliquées de Lyon
III.2.3 Characterization of the material
III.2.3.1 Mechanical properties
The tensile properties of this alloy were obtained for each material preparation condition
(AR, MAS and SAS). The tensile tests were performed on LTS samples by using an
electromechanical tensile machine LLOYD LR30K Plus. The samples were pre -loaded at
200 N and stressed (in tension) at a constant strain rate of 5 × 10⁻⁷𝑠−1. The mechanical
properties are gathered in Table III-3.
Table III-3. Mechanical properties of the Alloy 600 according to the different material preparation conditions
Material preparation
condition
As Received Mill Annealed and
Sensitized
Solution Annealed
and Sensitized
(AR) (MAS) (SAS)
Yield stress (MPa) 236 263 144
Young Modulus (GPa) 210 210 N/D
III.2.3.2 Characterization of the sensitization level
The characterization of the heat treatments induced sensitization was performed on the
Square Samples (SS). The technique used for this purpose was the Double Loop
Electrochemical Potentiokinetic Reactivation tests (DL-EPR, according to [200]).
Prior to each test, the samples were embedded in a Bakelite-type mounting resin (200 °C /
4 bar/ 10 min). A hole was drilled on the opposite surface of the mounted sample, this
allowed to insert a rigid copper wire for the electrical contact to the samples (see the image
on the left hand side of Figure III-5). A silicon rubber (CAF 4®) was deposed on the edges
of the hole to insure the electrical insulation. The mounted samples were grounded with
emery paper until 1200 grit, degreased in acetone, rinsed and dried.
The DL-EPR tests were conducted in a conventional three-electrode cell (see Figure III-5),
using Pt as auxiliary electrode and a saturated calomel as the reference electrode (SCE).
The composition of the solution for the DL-EPR tests was 0.5 M H2SO4 + 0.01 M KSCN.
The localized attack of the grain boundaries is caused by the adsorption of the thiocyanate
ion (SCN-) [81], [201]. The attack will predominantly take place in the weak regions,
precisely around the chromium carbides. The differences in the intensity of the
intergranular attack can, consequently, be correlated to different content of intergranular
chromium carbides. For each test, approximately 300 mL of the test solution was added to
the cell test. The free corrosion potential was first measured by a time period of 4 minutes.
The initial potential of the DL-EPR was set to the Open Circuit Potential (OCP) of the
samples. The OCP was usually stable and ranged from -400 to -450 mV/SCE. Subsequently,
the samples were submitted to a potentiodynamic sweep towards the anodic direction until
Cette thèse est accessible à l'adresse : http://theses.insa-lyon.fr/publication/2017LYSEI059/these.pdf © [J. Bolivar], [2017], INSA Lyon, tous droits réservés

Chapter III: Experimental methodology
José Bolivar 65
Thèse en Sciences des Matériaux / 2017
Institut national des sciences appliquées de Lyon
reaching the passivity region (300 mV/SCE), then the scan was instantly reversed towards
the cathodic direction until reaching the OCP. The sweeping rate was 1.67 mV/s. After each
test, the attacked surfaces of the samples were examined under an optical microscope.
Figure III-5. Experimental montage for DL-EPR test. (Left) Sample for DL-EPR test and (Right) cell test.
III.2.3.3 Characterization of the material microstructure
The analysis of the microstructure was performed on Squared Samples. The samples were
polished until 1 µm grade following the different steps mentioned on Table III-4. The final
surface was then examined in a Scanning Electron Microscope (SEM) Zeiss Supra 55VP
Field and Energy Dispersive X-ray spectroscopy (EDX) was performed.
Table III-4. Sample preparation procedure for the microstructure analysis
Process Step Abrasive compound
Grinding
1 180 Grit SIC paper
2 400 Grit SIC paper
3 600 Grit SIC paper
4 1200 Grit SIC paper
Polishing
5 6 µm diamond paste
6 3 µm diamond paste
7 1 µm diamond paste
Cette thèse est accessible à l'adresse : http://theses.insa-lyon.fr/publication/2017LYSEI059/these.pdf © [J. Bolivar], [2017], INSA Lyon, tous droits réservés

Chapter III: Experimental methodology
José Bolivar 66
Thèse en Sciences des Matériaux / 2017
Institut national des sciences appliquées de Lyon
III.2.4 Study of the surface treatment for Digital Image Correlation (2D)
measurements (surface patterning)
The application of the DIC measurements is based on the existence of a random surface
pattern. The quality of this surface pattern influences the accuracy of the DIC to resolve
pixel and sub-pixel displacements. Random black and white patterns with paint spray are
usually applied for DIC studies. This solution is not compatible with SCC studies because
the spray paint acts as a physical barrier against corrosion (corrosion protection). In that
context, several solutions for obtaining a correct surface pattern were studied in this work.
They were based on chemical attacks and electro-etching techniques.
III.2.4.1 Obtaining the surface pattern
The study of the surface treatment for DIC measurements was performed on the Square
Samples, which were embedded in a Bakelite-type mounting resin. The procedure was the
same than the one implemented for the samples used for DL-EPR tests (including the
electrical contact). The mounted samples were grounded with emery paper until 1200 grit,
degreased in acetone, rinsed and dried.
Table III-5 gathers the four surface treatment procedures explored, and the different stages
involved in each one. The activation of the surface was performed by immersing the sample
in an aqueous solution of 50 % vol. HCl. The Chemical Attack (CA) was performed by
immersing the sample in a solution containing 50 mL of 50 vol. % HCl and the addition of
2 mL H2O2 (30 vol. %). This solution is usually used for Nickel-based alloys to reveal the
grains boundaries [202]. Then the following electroetching-stages were performed in a
solution of 8 % vol. perchloric acid and 92 % vol. glacial acetic acid.
Figure III-6 presents the experimental setup used for the electro-etching. The working
electrode was connected to the positive terminal of the DC power supply (model TTi
CPX400D). The whole system was continually stirred and was tempered with water at room
temperature. The anode was placed at around 10 mm from the cathode.
Table III-5. Description of the different surface treatment procedures tested
Time (s)
Surface
treatment
procedure
Activation Chemical
attack (CA)
Electro-Etching I
(EE1)
Electro-Etching II
(EE2)
(50 vol. %
HCl)
(50 mL of 50
% vol. HCl +
2 mL H2O2)
(92 vol. % glacial acetic acid,
8 vol. % perchloric acid, 5 V)
(92 vol. % glacial
acetic acid, 8 vol. %
perchloric acid, 10 V)
ST-I 30 5 - 120 - -
ST-II 30 5 - 120 - 10
ST-III - - - 10
ST-IV - - 10 10
Cette thèse est accessible à l'adresse : http://theses.insa-lyon.fr/publication/2017LYSEI059/these.pdf © [J. Bolivar], [2017], INSA Lyon, tous droits réservés

Chapter III: Experimental methodology
José Bolivar 67
Thèse en Sciences des Matériaux / 2017
Institut national des sciences appliquées de Lyon
Figure III-6. Scheme of the experimental set-up for electro-etching stage on Square Samples
III.2.4.2 Characterization of the surface patterning for Digital Image Correlation
(2D) measurements
The quality of the different surface treatments was evaluated by numerical tests. For this
purpose, each sample surface was photographed and numerically manipulated by applying
digital displacements. Each image was shifted in the y direction (∆y) of 100, 10, 1, 0.5, 0.1
and 0.05 pixels (see Figure III-7 for details). Altogether, 7 images were obtained for each
surface patterning (one reference image plus six displaced images). A DIC analysis was
carried out for each subset of pictures. The DIC correlation was performed using an in -
house developed software based on finite elements (Ufreckles®). Square elements with a
size of 45 pixels (155 µm) were used for the assessments of displacement vector (Uy and
Ux). The quality of each surface patterning was evaluated by the form of the histogram of
the images and by the accuracy of the results. Finally, the accuracy of the DIC results was
evaluated according to: the standard deviation of the displacement field, the mean error of
the displacements (real displacement vs. calculated) and the obtained mean strain.
Cette thèse est accessible à l'adresse : http://theses.insa-lyon.fr/publication/2017LYSEI059/these.pdf © [J. Bolivar], [2017], INSA Lyon, tous droits réservés

Chapter III: Experimental methodology
José Bolivar 68
Thèse en Sciences des Matériaux / 2017
Institut national des sciences appliquées de Lyon
Figure III-7. Schematic representation of the evaluation routine implemented for the surface patterning study
III.2.5 SCC Test solution
The test solution was prepared by using distillated water and chemical grade reagents. It
consisted of 0.01 M potassium tetrathionate (K2S4O6). In some cases the test solution was
acidified to the pH of interest by H2SO4 addition.
III.2.6 Preparation of the Long Tensile Samples (LTS) and the Counter-
Electrodes for the in-situ Stress Corrosion Cracking tests at room
temperature
After heat treatments, the surfaces of the samples were grounded with an emery paper until
1200 grit, degreased in acetone, rinsed and dried. An electroetching stage was performed
to make the surface suitable for DIC measurements. Only a section of 30 mm (on both
sides) of the gauge length was exposed to the electro-etching solution. The delimitation of
the excluded zone was made with a red varnish. This delimitation allowed a more
homogeneous attack and improved the results. Figure III-8 presents the experimental setup
used for the electro-etching. The working electrode was connected to the positive terminal
of the DC power supply (model TTi CPX400D). The cathode was made of a 304 SS sheet
and was connected to the negative terminal. The shape of the cathode was cylindrical in
order to improve the homogeneity of the attack. After the electroetching (see Table III-5),
the samples were immersed in acetone and placed into an ultrasonic bath. This stage
eliminated the red varnish and cleaned the surface. The last stage consisted in reducing
again the exposed surface for SCC testing. For this, the specimens were partially covered
with silicone rubber. Both sides of the middle section of the samples were exposed to the
electrolyte, each with an exposed area of 120 mm2 (15 X 8 mm).
Cette thèse est accessible à l'adresse : http://theses.insa-lyon.fr/publication/2017LYSEI059/these.pdf © [J. Bolivar], [2017], INSA Lyon, tous droits réservés

Chapter III: Experimental methodology
José Bolivar 69
Thèse en Sciences des Matériaux / 2017
Institut national des sciences appliquées de Lyon
Figure III-8. Experimental setup for the electro-etching of the LTS samples
III.2.7 Description of the Stress Corrosion Cracking tests on LTS samples
The electrodes (Working Electrode4, Counter-Electrode and Reference Electrode) allowing
Electrochemical Noise measurements (see Section II.4.3) were disposed in a corrosion cell
containing the test solution (see Figure III-9). The test cell was made of PVC and had a
transparent window which allowed the visual contact to the tensile sample. The samples
were generally immersed in the test solution for different durations before loading. In
general, the acquisition of AE, EN and DIC started with the loading. It must be highlighted
that in some tests (Chapter VI), the acquisition of EN started from the instant when the
sample was immersed into the solution. Two modes of loading were used: Slow Strain Rate
Tests (SSRT) and Constant Load (CL) tests.
III.2.7.1 Slow Strain Rate Tests (SSRT)
These tests were performed on an electromechanical tensile machine LLOYD LR30K Plus.
A pre-load of 200 N at 21 mm/s was applied to the sample. Then the loading was performed
at constant displacement of 5 × 10⁻⁷𝑠−1 until rupture.
III.2.7.2 Constant Load tests (CL)
The CL tests were performed on the same electromechanical tensile machine LLOYD
LR30K Plus. The loading was carried out under a constant displacement of 5 × 10⁻⁵𝑠−1
until achieving 80 % of the yield stress of the material. The tests which were not executed
4
The WE was the LTS
Cette thèse est accessible à l'adresse : http://theses.insa-lyon.fr/publication/2017LYSEI059/these.pdf © [J. Bolivar], [2017], INSA Lyon, tous droits réservés

Chapter III: Experimental methodology
José Bolivar 70
Thèse en Sciences des Matériaux / 2017
Institut national des sciences appliquées de Lyon
until rupture were interrupted when a representative colony of cracks was detected by visual
observation and when the Open Circuit Potential (OCP) of the specimen was stabilized at
around -200 mV/SCE. At the end of the tests, the samples were examined in order to
validate the identification of cracks. The observations were done either by Optical
Microscopy (OM) or Scanning Electron Microscopy (SEM, Zeiss Supra 55VP Field).
Figure III-9. Experimental setup for the Stress Corrosion Cracking tests at room temperature
III.2.8 Description of the Stress Corrosion Cracking tests under four-point
bending
Four-point bending tests were performed on FS samples (see Section III.2.2). The sample
surfaces were polished until grit 1200 with emery paper, then degreased and rinsed. The FS
samples were positioned in a special bending device (see Figure III-10) made of Hastelloy
C276. The sample was positioned between alumina rods which insulate the sample from the
body of the bending device. The sample was loaded until 420 MPa before the immersion in
the solution according to Figure III-10. The loading was performed by screwing the bolt
which deflected the sample in the y-direction. The stress was calculated thanks to the
deflection y, measured by a dial gauge (see Figure III-10) and the Equation III-1 (from
ASTM G39 [203]).
𝜎 =12𝐸𝑡𝑦
3𝐻2 − 4𝐴2 Equation III-1
Where y is the displacement, E is the young modulus, t is the thickness of the sample, H is
the distance between the external alumina rods and A is the distance between the internal
and the external alumina rods (see Figure III-10).
Once the stress applied, the device was immersed in a PVC corrosion cell which contains
the test solution. The tests were stopped once several cracks were visually detected or after
192 h of test.
Cette thèse est accessible à l'adresse : http://theses.insa-lyon.fr/publication/2017LYSEI059/these.pdf © [J. Bolivar], [2017], INSA Lyon, tous droits réservés

Chapter III: Experimental methodology
José Bolivar 71
Thèse en Sciences des Matériaux / 2017
Institut national des sciences appliquées de Lyon
Figure III-10. Experimental device for the 4-point bending tests
III.2.9 Preparation of the Small Tensile Specimens (STS) for the In-situ
Stress Corrosion Cracking tests by using X-ray synchrotron
tomography
After heat treatments, the surfaces of the samples were grounded with an emery paper until
1200 grit, degreased in acetone, rinsed and dried. Some specimens were previously pre -
notched by Focused Ion Beam (FIB, FIB Dual Beam NVision40 Carl Zeiss Microscopy).
The notches were machined by using a voltage of 30 kV, an ionic current of 27 nA and a
dwell time of 26 µs [204]. The notch geometry was 200 x 10 x 50 µm and was located in
the middle section of the gauge length (see Figure III-11). Prior to testing, a tiny hole was
drilled in the corner of the sample. This hole allowed inserting a rigid copper wire for the
electrical contact to the sample. A red varnish was deposed on the edges of the hole in order
to insure the insulation and to avoid any galvanic coupling between the wire and the sample
(see Figure III-12.b).
Figure III-11. FIB notch geometry in a STS sample
Cette thèse est accessible à l'adresse : http://theses.insa-lyon.fr/publication/2017LYSEI059/these.pdf © [J. Bolivar], [2017], INSA Lyon, tous droits réservés

Chapter III: Experimental methodology
José Bolivar 72
Thèse en Sciences des Matériaux / 2017
Institut national des sciences appliquées de Lyon
III.2.10 Description of the in-situ Stress Corrosion Cracking tests with the
STS samples (X-ray tomography)
The in situ Stress Corrosion Cracking experiments were performed on the Psiche beamline
at Synchrotron SOLEIL5. The experimental device consisted in a miniaturized tensile
machine with a maximal capacity of 2 kN (see Figure III-12.a). One of the structural part
of the device consisted in a transparent Perspex cylinder. This cylinder supported the
reaction force of the motor when the sample is being loaded. The X-rays cross the Perspex
cylinder without being absorbed which allows increasing the quality of the images. In
addition, the cylinder allows containing the test solution (see Figure III-12.b).
Figure III-12. Experimental device for the in-situ SCC tests in Synchrotron SOLEIL. a) General view of the
tensile machine, b) disposition of the electrodes and c) Spatial reference system for tomography analysis
For performing X-ray scans, a polarization procedure was necessary (see Chapter V,
Section V.4). In this procedure, the tensile specimen was used as the Working Electrode
(WE), a saturated calomel electrode (SCE) was used as a reference and a Pt wire as the
Counter Electrode (CE). Reference and counter electrodes were placed in the upper part of
the cell so that they do not interact with the X-ray beam (see Figure III-12). Metallic parts
(grips…) of the cell were protected by a varnish in order to avoid any galvanic coupling
(Figure III-12).
The tests were performed at constant load. The loading was carried out under a constant
displacement of 1.25 × 10⁻⁴𝑠−1 until achieving 110 % of the yield stress of the material.
The final stress was much higher than for the tests with the LTS samples in order to reduce
the time of the tests. The tests were performed under free corroding conditions. The scans
were regularly performed during the test. During each scan, the displacement was stopped
5
Beam time awarded by synchrotron SOLEIL on the Psiche beamline (20140951 and 20150856
accepted proposals)
Cette thèse est accessible à l'adresse : http://theses.insa-lyon.fr/publication/2017LYSEI059/these.pdf © [J. Bolivar], [2017], INSA Lyon, tous droits réservés

Chapter III: Experimental methodology
José Bolivar 73
Thèse en Sciences des Matériaux / 2017
Institut national des sciences appliquées de Lyon
and the potential was decreased towards the cathodic domain where no dissolution can
occur (-300 mV/SCE). The images were obtained in a pink beam mode (E=80 keV) on a
Hamamatsu Detector (2048 x 2048 pixels). The scan duration was about 5 minutes (1020
images, average of 10 radiographs for each, exposure time of 25 ms) with a 2.34 μm voxel
size.
III.3 In-situ monitoring techniques used
during the Stress Corrosion Cracking tests
III.3.1 Digital Image Correlation measurements
III.3.1.1 DIC acquisition
The experimental setup for the acquisition of images is given in Figure III-9 . The optic
consists of a telecentric 1X lens (Myutron LSTL 10H-F) with a working distance of 113
mm. The sample surface was observed through a 2/3” CCD Stingray 5 Mpx camera with a
pixel size of 3.45 µm. In addition, the surface was lit with a led coaxial lamp in order to
eliminate the light variation in the surface (see Figure III-13). The whole system was
mounted in a clamping device with 5 degrees of freedom. It was composed of a plate able
to translate in z, y, and x with a minimal resolution of 10 µm (micrometric screws) and two
plates able to rotate in the x-z and z-y planes. Besides, linear polarizing filters were also
used in order to limit light reflection. The images were recorded generally every 60 seconds.
Figure III-13. Acquisition device for DIC measurements
Cette thèse est accessible à l'adresse : http://theses.insa-lyon.fr/publication/2017LYSEI059/these.pdf © [J. Bolivar], [2017], INSA Lyon, tous droits réservés

Chapter III: Experimental methodology
José Bolivar 74
Thèse en Sciences des Matériaux / 2017
Institut national des sciences appliquées de Lyon
III.3.1.2 DIC data analysis
DIC analysis was carried out using an in-house developed software based on finite elements
(Ufreckles). Square elements with a size of 16 pixels (55 µm) were used for the assessments
of displacement vector. The crack identification was achieved by detecting the displacement
jumps originated by the initiation and/or opening of cracks (Figure III-14). Note that in the
experiments with 2D-DIC, the y-axis represents the direction of the loading. The amplitude
of the discontinuity caused by the crack detection represents the opening value of the crack
(Uy(i) = yi - y0). In order to clarify the discontinuities, Rigid Body Movement (RBM) and
the homogenous mean strain were extracted from the displacement fields. Additionally, the
resulting field was differentiated in the y-axis and subsequently multiplied by the element
size. Thereby a displacement jump field could be obtained (Figure III-15.b). Then, cracks
were identified by filtering the field with a threshold (Figure III-15.c), which corresponds
to the uncertainty of measurements (0.45 µm). The segments of elements with a
displacement jump higher than the threshold, and obeying a connectivity of 8 (considering
that an element can have contact with one of its 8 neighbors) leads to crack detection.
Finally, the cracks were labeled and their parameters (length, opening, Crack Growth Rate
(CGR) and dynamic state, etc.) were extracted by image treatment.
Figure III-14. Schematic representation of the apparition of a discontinuity on the displacement field due to
crack initiation and opening (at ti)
Figure III-15. Procedure for the identification of a crack by DIC analysis: a) displacement field; b) filtered
displacement field and c) binary field
Cette thèse est accessible à l'adresse : http://theses.insa-lyon.fr/publication/2017LYSEI059/these.pdf © [J. Bolivar], [2017], INSA Lyon, tous droits réservés

Chapter III: Experimental methodology
José Bolivar 75
Thèse en Sciences des Matériaux / 2017
Institut national des sciences appliquées de Lyon
III.3.2 Electrochemical Noise measurements
III.3.2.1 Description of the experimental setup
Electrochemical Noise (EN) measurements were performed in a three electrode cell
configuration under freely corroding conditions (see Figure III-9). The reference electrode
was a Saturated Calomel Electrode (SCE). The Working Electrode (WE) and the Counter -
Electrode (CE) were made from the same material and suffered the same surface treatment.
The CE for EN measurements was located 5 mm behind the WE; this configuration allows
the observation of the sample surface by DIC. The tensile sample was electrical ly insulated
from the tensile machine by inserting SiC paper between the sample and the grips. The
insulation was omitted in the tests involving Acoustic Emission measurements. In fact, the
SiC paper slided slightly during the loading and caused spurious acoustic activity.
Moreover, a Faraday Cage was disposed around the corrosion cell in order to limit
electromagnetic interferences (see Appendix A). The floating ground of the potentiostat
was connected to the Faraday cage.
III.3.2.2 Electrochemical Noise acquisition
The Electrochemical Potential Noise (EPN) and Current Noise (ECN) were acquired and
recorded by a REF600 GAMRY potentiostat which has inherent antialiasing filters (See
Appendix A and Section VI.3). The signals were acquired at 10 Hz by using the ESA410
acquisition software (version 7.0.4). The optimum I/E range was evaluated before starting
the acquisition. Short acquisitions of about 80 seconds at 100 Hz were performed for several
I/E ranges. The PSD in current obtained for each I/E range was compared between all the
acquisitions. The optimum I/E range was stated as the range for which any overload
occurred and for which the PSD in current was superimposed to another one of a more
sensitive IE range (see Section VI.2 in Chapter VI).
III.3.2.3 Electrochemical Noise data analysis
A MatLab script was developed for the analysis of the EN data. The routine comprised
signal conditioning (See Appendix B) and signal treatment. The method was based on a
sliding window which divides the lengthy data into blocks (see Figure III-16). The window
slides with a span of ¾ the block length. The length of each block is a power of 2 (e.g. 212
= 4096 points) and limits the bandwidth of the analysis to fmin – fmax (see Nyquist-Shannon
theorem in Appendix A). Depending on the records, the length of the sliding window was
comprised between 2048 and 16384 points.
In some case a digital filter (low-pass or high-pass) was applied over all the signal (Matlab
function) before the construction of the sliding blocks. Moreover, each block suffered a de-
trending stage before the assessment of statistics and frequency analysis. The de -trending
was performed by using either a polynomial method either order 1 or 5. The choice depends
Cette thèse est accessible à l'adresse : http://theses.insa-lyon.fr/publication/2017LYSEI059/these.pdf © [J. Bolivar], [2017], INSA Lyon, tous droits réservés

Chapter III: Experimental methodology
José Bolivar 76
Thèse en Sciences des Matériaux / 2017
Institut national des sciences appliquées de Lyon
on the type of SCC experiment and is detailed for each case. The statistics parameters
(standard deviation σ, noise resistance Rn) were extracted for each block. In this way the
evolution of such parameters was obtained in the time domain. Subsequently, a Hann
window is applied to each block before the estimation of the Power Spectral Density (PSD).
The MatLab routine allows choosing between using a FFT-based method (periodogram,
MatLab function) or a MEM method (based on the Yule-Walker method, MatLab function)
for the PSD estimation. If the periodogram method is selected, a subsequent smoothing
phase is applied before displaying the final PSD. The smoothing is performed by averaging
a series of 10 successive PSDs. On the other hand, the PSD obtained from MEM
calculations were smooth enough after calculation, therefore, any additional smoothing
phase was not required. The MEM order used for such estimations was 100. Finally, the
standard deviation for each block was also calculated from the PSD measurements by
following the Equation III-2 (already displayed in Section II.5.3.3).
𝜎𝑥 = √∫ 𝛹𝑥(𝑓)𝑑𝑓𝑓𝑚𝑎𝑥
𝑓𝑚𝑖𝑛 Equation III-2
Figure III-16. Schematic representation of the sliding-window-based method for EN data analysis
III.3.3 Acoustic Emission measurements
The acquisition system was a Physical Acoustic Corporation PCI 2. The acquisition
software was AEWIN for PCI2 version 1.7. The acoustic emission (AE) was acquired by
using two piezoelectric AE sensors R15D type: one was fixed to the top of the working
electrode (see Figure III-9), the second one was fixed to the bottom of it. The operating
frequencies of the sensors were between 20-1000 kHz with a resonance frequency centered
on 150 kHz. The sensor output was amplified by a gain of 60 dB. The sampling frequency
was 2 MHz. Furthermore, two frequency filters were used (Physical Acoustic Corporation
model 1220 A): a high-pass filter with a cutoff frequency of 100 kHz and a low-pass filter
with a cutoff frequency of 400 kHz. The threshold was 23 dB, which was slightly above the
background noise. The pre-trigger was of 50 µs. The Peak Definition Time (PDT), Hit
Definition Time (HDT) and Hit Lockout Time (HLT) were of 300, 600 and 1000 µs
respectively. The acquired Acoustic Emission data were filtered in order to delete the noise
(post-acquisition). The noise was defined as all the AE bursts characterized by both an
amplitude smaller than 27 dB, absolute energy lower than to 0.1 aJ and counts number lower
to 2.
Cette thèse est accessible à l'adresse : http://theses.insa-lyon.fr/publication/2017LYSEI059/these.pdf © [J. Bolivar], [2017], INSA Lyon, tous droits réservés

Chapter III: Experimental methodology
José Bolivar 77
Thèse en Sciences des Matériaux / 2017
Institut national des sciences appliquées de Lyon
The optimization of the setup and the analysis of AE data were performed by MISTRAS
Group SAS which is one of the partners of the ECCOFIC project. A description of the setup
as well as the methodology implemented for the treatment of the collected AE data is
detailed in Appendix C, including the process of data filtering and noise suppression.
III.3.4 Electrochemical Impedance Spectroscopy (EIS) measurements
In some cases, EIS measurements were performed during the SCC tests. They were
performed at the Open Circuit Potential in the three electrode cell configuration. A REF600
Gamry was used for this purpose. The working electrode was either the stressed sample or
the counter-electrode used for the EN measurements. The reference electrode was the
Saturated Calomel Electrode used for EN measurements. The auxiliary electrode was a
commercial Pt electrode. Moreover, the acquisitions were done with an amplitude of 15
mV/OCP taking 8 points by decade. The bandwidth of the measurements ranged from 10
mHz to 100 kHz.
Chapter summary
This chapter was dedicated to the description of all the experimental techniques and
procedures applied in this work. Several thermal treatments will be applied to the studied
Alloy 600 in order to control the initiation of multiple SCC and the morphological
characteristics of the cracks colony. Different specimen geometries will allow performing
SCC tests in various configurations, including different modes of mechanical loading and 3D
in-situ characterization by X-ray microtomography. Based on the literature survey and in
order to reach the objectives of this work, three main monitoring techniques will be used:
Digital Image Correlation (in 2D and 3D), Acoustic Emission and Electrochemical Noise,
which requires specific surface preparation.
These different procedures (thermal treatment, mechanical loading, surface patterning) need
to be optimized; this is the objective of next chapter.
Cette thèse est accessible à l'adresse : http://theses.insa-lyon.fr/publication/2017LYSEI059/these.pdf © [J. Bolivar], [2017], INSA Lyon, tous droits réservés

Chapter IV: Choice and validation of the experimental conditions for the SCC tests at room temperature and pressure
José Bolivar 78
Thèse en Sciences des Matériaux / 2017
Institut national des sciences appliquées de Lyon
Chapter IV
IV Choice and validation of the
experimental conditions for the
SCC tests at room temperature
and pressure
IV.1 Introduction ................................................................................................... 79
IV.2 Influence of the experimental conditions on the initiation and the
development of a crack colony ....................................................................... 79
IV.2.1 Characterization of the degree of sensitization according to the different
applied Heat Treatments (HT) ................................................................... 79
IV.2.1.1 Microstructure analysis ...................................................................... 80
IV.2.1.2 Evaluation of the Susceptibility to Stress Corrosion Cracking according
to the different sensitization state ....................................................... 83
IV.2.2 Effect of the loading mode on the crack colony morphology ...................... 84
IV.2.2.1 Time to rupture ................................................................................. 85
IV.2.2.2 Crack colony morphology .................................................................. 86
IV.2.3 Suitability of SSRT and CL tests for AE, DIC, and EN measurements ....... 88
IV.2.4 Effect of the pH of the solution on the crack colony morphology ............... 89
IV.2.5 Synopsis ................................................................................................... 91
IV.3 Choice and validation of the surface patterning compatible with DIC
measurements and SCC tests ........................................................................... 92
IV.3.1 Evaluation of surface treatment on Squared Samples ................................. 93
IV.3.1.1 Visual observations ........................................................................... 93
IV.3.1.2 Numerical evaluation ......................................................................... 97
IV.3.1.3 Synopsis ............................................................................................ 99
IV.3.2 Electrochemical characterization of the surface treatment .......................... 99
IV.3.3 Validation of the surface patterning on the Long Tensile Samples (LTS) . 100
Chapter Summary ................................................................................................ 103
Cette thèse est accessible à l'adresse : http://theses.insa-lyon.fr/publication/2017LYSEI059/these.pdf © [J. Bolivar], [2017], INSA Lyon, tous droits réservés
Chapter IV: Choice and validation of the experimental conditions for the SCC tests at room temperature and pressure
José Bolivar 79
Thèse en Sciences des Matériaux / 2017
Institut national des sciences appliquées de Lyon
IV.1 Introduction
he SCC system selected for the experiments at room temperature
consists in an Alloy 600 tested in a solution of potassium tetrathionate.
This system is commonly used in IG-SCC studies because of its low
incubation time for cracking which allows the feasibility study of monitoring
techniques and the study of the propagation of intergranular multiple cracks.
In this context, this chapter focuses on the determination of the experimental
conditions that induce the initiation and the development of a crack colony,
with various geometrical parameters. Moreover, the mode of loading for the
SCC tests will be also chosen as well as the surface treatment compatible
with DIC measurements.
For this purpose, this chapter will be divided into two parts. The first section
will be dedicated to the study of some parameters which influence the
evolution and the morphology of the crack colony, notably the influence of
the heat treatment applied to the material, the mode of loading and the pH of
the solution. Finally, the second part will present the investigation of a
surface treatment compatible with DIC measurements and the SCC tests.
IV.2 Influence of the experimental conditions
on the initiation and the development of a
crack colony
As described in the literature survey (Section II.4), the SCC susceptibility of the system
Alloy 600/tetrathionate is particularly dependent on both the degree of sensitization and the
pH of the solution. Both parameters act over the stability of the passive film, hence, on the
initiation and propagation of cracks. The crack colony density and the crack morphology
are expected to vary according to those parameters. On the other hand, mechanical factors
such as the mode of loading are also expected to play a major role in the crack c olony
morphology. The following section is devoted to the characterization of the effects of each
factor mentioned above, in order to determine the experimental conditions that will be used
in the following chapters.
IV.2.1 Characterization of the degree of sensitization according to the
different applied Heat Treatments (HT)
As described before, three different thermal conditions were studied (see Table III.2): As
Received (AR), Mill Annealed and Sensitized (MAS) and Solution Annealed and Sensitized
(SAS). It is expected that the different materials (AR, MAS, and SAS) will be sensitized at
different levels, hence, will present different amounts of intergranular chromium carbides
T
Cette thèse est accessible à l'adresse : http://theses.insa-lyon.fr/publication/2017LYSEI059/these.pdf © [J. Bolivar], [2017], INSA Lyon, tous droits réservés

Chapter IV: Choice and validation of the experimental conditions for the SCC tests at room temperature and pressure
José Bolivar 80
Thèse en Sciences des Matériaux / 2017
Institut national des sciences appliquées de Lyon
and a different susceptibility towards SCC. The extent of the sensitization was evaluated
by microstructure analysis and electrochemical tests.
IV.2.1.1 Microstructure analysis
The presence of chromium carbides was evaluated by optical microscopy. The examination
of the surface was performed after DL-EPR tests (only one cycle, see Section III.2.3.2 for
details). Figure IV-1 gathers the different revealed microstructures for each material
preparation condition. These optical examinations allowed obtaining the material grain size
and a qualitative evaluation of the sensitization degree for each material preparation
condition. The results from this evaluation are resumed in Table IV-1.
Figure IV-1. Optical microphotography of the microstructure of the different material conditions AR, MAS and
SAS. The microstructure was revealed after a DL-EPR test (only one cycle).
Table IV-1. Grain size and intergranular attack after DL-EPR test for each material condition
Material condition Grain size
(µm) Intergranular attack
AR 70-100 Discontinuous
MAS 70-100 Continuous and severe
SAS 150-300 Continuous and severe
As can be noted, the samples presented intergranular attack at different levels. The MAS
and SAS materials revealed a continuous attack while the AR material presented a scarce
discontinuous attack. The continuous attack on the MAS and SAS samples confirmed the
increase of the content of intergranular chromium carbides by the sensitization treatment.
Furthermore, the scarce attack on the AR samples implies that the AR material is as well
sensitized, but in a lower degree.
Cette thèse est accessible à l'adresse : http://theses.insa-lyon.fr/publication/2017LYSEI059/these.pdf © [J. Bolivar], [2017], INSA Lyon, tous droits réservés

Chapter IV: Choice and validation of the experimental conditions for the SCC tests at room temperature and pressure
José Bolivar 81
Thèse en Sciences des Matériaux / 2017
Institut national des sciences appliquées de Lyon
Figure IV-2. SEM images (InLens) and EDX analysis of the sample MAS Alloy 600. (a) SEM image showing
some chromium carbides along the grain boundaries and some TiN particles. (b) Enlarged zone displaying a
TiN particle. (c) EDX spectra 1of image b and (d) EDX spectra 2 of image b.
The presence of chromium carbides was verified on the sensitized samples (MAS) through
SEM observations and EDX measurements. Figure IV-2 shows a couple of SEM images
and two EDX composition analysis of the sample surface. As can be observed, the
microstructure is mainly composed by an austenitic matrix (in light grey, spectra 2) and
two precipitation phases: large black precipitates and a finer intergranular network of dark
grey precipitates. The spectra 1 in the Figure IV-2.c shows that the large black precipitates
are mainly composed of Titanium and Nitrogen. It is thought that those precipitates are
Titanium Nitrides (TiN). In fact, TiN precipitates have already been reported in Alloy 600
as a non-intentionally precipitate phase. They are produced during the vacuum-melting
process of the alloy [205].
Besides, Figure IV-3 shows a SEM image and an EDX map of the intergranular dark grey
precipitates. The EDX map notices that they are composed by Cr and C, suggesting that
this dark grey precipitates are chromium carbides formed during the sensitization heat
treatment. The presence of this kind of precipitates is desired, since they are expected to
promote Intergranular Corrosion and Intergranular Stress Corrosion Cracking.
Cette thèse est accessible à l'adresse : http://theses.insa-lyon.fr/publication/2017LYSEI059/these.pdf © [J. Bolivar], [2017], INSA Lyon, tous droits réservés

Chapter IV: Choice and validation of the experimental conditions for the SCC tests at room temperature and pressure
José Bolivar 82
Thèse en Sciences des Matériaux / 2017
Institut national des sciences appliquées de Lyon
Figure IV-3. SEM image and EDX map of the vicinity of a grain boundary containing chromium carbides
precipitates (MAS Alloy 600)
Another important observation is that SAS material presents a different microstructure
compared to the AR and MAS samples. The optical micrographs taken after the DL-EPR
tests (see Figure IV-1) show the grain size of all the materials. Both the AR and the MAS
conditions induce equiaxed grains with a size comprised approximately between 70 and 100
µm. In contrast, the SAS microstructure is recrystallized with a grain size comprised
between 150 and 300 µm. It can be noted that the form of the grains is less equiaxed than
in the AR and MAS materials. The origin of the increase of the grain size is due to the
preliminary solution annealing treatment at 1100 °C during 1 h plus water-quenching. For
those conditions, the chromium carbides dissolve, but the material recrystallizes. Such
coarse grains are undesirable in the present study. It is actually believed that the propagation
of short cracks will be deeply affected if the material is composed of only few grain across
the sample thickness. Consequently, a heat treatment that dissolves the chromium carbides
but without leading to a recrystallization of the microstructure was also investigated. It is
known carbides are dissolves above 1040 °C and that the grain growth is thermally activated
above 980 °C [206]. The Alloy 600 supplier suggests that brief exposures to 1040 °C could
dissolve some of the carbides without producing a coarse grain structure . In that context,
some tests were performed at 1040°C for 15 and 30 minutes and at 1100 °C for 15 minutes.
Figure IV-4 shows that at 1040°C for both time periods (15 and 30 min), the material
recrystallizes partially. In contrast, when the heat treatment is performed at 1100°C for 15
minutes, the recrystallization is complete. As a result, no solution could be provided to the
recrystallization problem. The SAS samples were therefore still prepared as before (e.g.
1100 °C / 1 h / water-quenching).
Cette thèse est accessible à l'adresse : http://theses.insa-lyon.fr/publication/2017LYSEI059/these.pdf © [J. Bolivar], [2017], INSA Lyon, tous droits réservés

Chapter IV: Choice and validation of the experimental conditions for the SCC tests at room temperature and pressure
José Bolivar 83
Thèse en Sciences des Matériaux / 2017
Institut national des sciences appliquées de Lyon
Figure IV-4. Optical micrographs of the microstructure of the Alloy 600 after the application of different
solution heat treatments. The microstructure was revealed by the application of 5 consecutive cycles DL-EPR
tests.
IV.2.1.2 Evaluation of the Susceptibility to Stress Corrosion Cracking according to
the different sensitization state
The susceptibility to IG-SCC will vary according to the degree of sensitization of the tested
material [207]. A lower susceptibility means that the incubation period of the SCC
phenomenon could be very long [87]. As already mentioned, the tests performed during this
work are expected to exhibit short incubation periods, thus, allowing the experimental data
to be obtained in a relatively fast manner. The material susceptibility was evaluated through
four-point bending SCC tests (see Section III.2.8). The test solution consisted in 0.01 M of
potassium tetrathionate acidified at pH 3. The samples were deflected until achieving 420
MPa, and the tests were stopped either once several cracks were visually detected or after
192 h of running.
Table IV-2 summarizes the three SCC tests that were performed. It can be noticed that the
AR sample did not suffer SCC: the sample surface was observed by optical microscopy,
and no crack was detected. The cause of this behavior was attributed to the low degree of
Cette thèse est accessible à l'adresse : http://theses.insa-lyon.fr/publication/2017LYSEI059/these.pdf © [J. Bolivar], [2017], INSA Lyon, tous droits réservés

Chapter IV: Choice and validation of the experimental conditions for the SCC tests at room temperature and pressure
José Bolivar 84
Thèse en Sciences des Matériaux / 2017
Institut national des sciences appliquées de Lyon
sensitization of this material (see Section IV.2.1). In contrast, the MAS and the SAS
samples experienced some SCC. The MAS specimen displayed several surface cracks after
72 h of test (see Figure IV-5). On the other hand, the SAS sample did not show any
propagated crack; only some crack initiations could be observed after 168 h of test (see
Figure IV-5). Their length was only a portion the grain size of the SAS material.
Table IV-2. Four-point bending SCC test performed: evaluation of the material susceptibility towards SCC.
Sample ID Material
condition Solution pH Stress
(MPa) SCC
observed Test duration
(h)
F 02-14 AR 0,01 M
K2S4O6 3.0
420 no 168
F 05-14 MAS 420 yes 72
F 03-14 SAS 420 yes 168
Figure IV-5. Optical micrographs of the sample surface after the SCC test. Left) MAS sample F 05-14 and
Right) SAS sample F 03-14
The above presented results show that the application of a sensitization heat treatment
promotes an increase in the susceptibility to suffer IG-SCC. Nevertheless, the SAS samples
did not display intensive SCC. These results suggest that the application of a sensitization
heat treatment is essential to promote IG-SCC in this system.
IV.2.2 Effect of the loading mode on the crack colony morphology
As mentioned in the literature survey, the crack initiation kinetics is closely correlated with
the stability of the passive film (see Section II.2.1). This stability can be perturbed by
mechanical factors such as stress concentration in grinding grooves, strain and sliding of
slip-planes [13]. Such factors can cause its rupture and the initiation of SCC cracks. Those
effects can be intensified when the sample is loaded under dynamic conditions (e.g. SSRT).
Cette thèse est accessible à l'adresse : http://theses.insa-lyon.fr/publication/2017LYSEI059/these.pdf © [J. Bolivar], [2017], INSA Lyon, tous droits réservés

Chapter IV: Choice and validation of the experimental conditions for the SCC tests at room temperature and pressure
José Bolivar 85
Thèse en Sciences des Matériaux / 2017
Institut national des sciences appliquées de Lyon
In this case, cracks initiation can be quite perturbed, as well as the crack colony morphology
and the interactions between cracks.
For this reason, the influence of the loading mode on the obtained crack colony
(morphology, crack density) was evaluated in this section. Each material (LTS samples)
was tested either at Constant Load (CL) or under Slow Strain Rate Test (SSRT). The CL
tests were performed at 80 % of the yield stress (σy). On the other hand, the SSRT were
carried out under a constant strain rate of 5 × 10⁻⁷𝑠−1 (see Section III.2.7 for more details).
All the tests were performed until rupture or until 21 days in the case of the CL tests. After
rupture, each sample surface was inspected by Optical Microscopy (OM) or Scanning
Electron Microscopy (SEM).
IV.2.2.1 Time to rupture
Table IV-3 summarizes the time to rupture for each test according to the mode of loading
and the sample preparation condition. It can be seen that the AR samples did not fail by
SCC neither after the CL tests nor the SSRT tests. On the other hand, the sensitized samples
(MAS and SAS) failed after both kinds of tests (CL and SSRT). Additionally, the SAS
samples achieved rupture faster than the MAS samples. Finally, it can be noted that the
samples loaded by SSRT reached the final rupture faster that the static tests (CL).
Table IV-3. Time to rupture for SCC tests according to the mode of loading and the material preparation
conditions
Sample Time to rupture (h)
SSRT ( 5x10⁻⁷ s-1) CL (80 % σy)
AR Ductile failure No SCC failure after 21 days
MAS 17.9 20.2
SAS 8.0 12.6
According to the results presented in Table IV-3, it can be stated that within the period of
time studied, the AR samples do not suffer IG-SCC neither under dynamic loading nor static
loading. As already discussed in the last section, the AR samples are not susceptible to
suffer IG-SCC because of their low content of chromium carbides. On the other hand, it
was noted that the sensitized samples achieved the final failure for different times. In fact,
the SAS specimens failed faster than the MAS samples. The shorter time to rupture of the
SAS material may be due to a higher sensitization degree, the big coarse microstructure or
both (see Figure IV-7). It is very well established that intergranular cracks propagate faster
in microstructures having large grains [208], simply because fewer grain boundaries have
to be followed by the crack front. Finally, it was observed that tests performed under
dynamic loading (SSRT) achieved rupture faster than the tests at Constant Load. This
behavior is classically attributed to the influence of the increasing crack driving force
Cette thèse est accessible à l'adresse : http://theses.insa-lyon.fr/publication/2017LYSEI059/these.pdf © [J. Bolivar], [2017], INSA Lyon, tous droits réservés

Chapter IV: Choice and validation of the experimental conditions for the SCC tests at room temperature and pressure
José Bolivar 86
Thèse en Sciences des Matériaux / 2017
Institut national des sciences appliquées de Lyon
provided by the constant straining rate. It is expected that the constant rate increases the
dissolution at the crack tip by the continuous rupture of the passive film.
IV.2.2.2 Crack colony morphology
At the end of each test presented in Table IV-3, the surface of the samples was examined
by optical microscopy. Figure IV-6 gathers the images. It can be observed that both
sensitized materials (MAS and SAS) exhibited the nucleation and the propagation of
multiple cracks regardless the loading conditions. It can also be observed that the specimens
tested by SSRT displayed a slightly higher crack density, because the constant deformation
of the surface causes a continuous rupture of the passive film, increasing the initiation
kinetics.
Figure IV-6. Optical images of the surfaces of the samples after SCC tests in a solution of 0.01 M of K2S4O6
acidified at pH 3. a) MAS sample tested by SSRT, b) MAS sample tested at CL, c) SAS sample tested by SSRT
and d) SAS sample tested at CL.
Nevertheless, the aspect of the cracks seems to be equivalent in all cases. The only
noticeable difference was the presence of some localized strain at the crack tips of the
Cette thèse est accessible à l'adresse : http://theses.insa-lyon.fr/publication/2017LYSEI059/these.pdf © [J. Bolivar], [2017], INSA Lyon, tous droits réservés

Chapter IV: Choice and validation of the experimental conditions for the SCC tests at room temperature and pressure
José Bolivar 87
Thèse en Sciences des Matériaux / 2017
Institut national des sciences appliquées de Lyon
samples loaded by SSRT. Such difference is because all the SSRT tests reached the plastic
domain at the end of the test. In contrast, the CL tests were performed in the elastic domain.
The local stresses in that case induce much less plastic deformation localized at the crack
tips.
Moreover, it was also noticed that the SAS samples showed lower crack densities than the
MAS material, regardless the mode of loading. This result can be attributed to the difference
in the grain size of each material. The material having larger grains (SAS) provides fewer
grain boundaries over the surface for crack nucleation. Thus, it is expected that the crack
density will be smaller in that case.
Figure IV-7. Fracture surfaces observed by SEM after SCC tests in a 0.01 M K2S4O6 solution acidified at pH 3.
(a) MAS sample tested by SSRT, (b) MAS sample tested at CL, (c) SAS sample tested by SSRT and (d) SAS
sample tested at CL.
The fracture surfaces of the samples were also examined by SEM (see Figure IV-7). These
images allow appreciating the strong intergranular features of the cracking process. Only a
very small portion of the surface failed in ductile mode, even on the samples loaded by
SSRT. The different testing condition lead to rather consistent results . Hence, it can be
Cette thèse est accessible à l'adresse : http://theses.insa-lyon.fr/publication/2017LYSEI059/these.pdf © [J. Bolivar], [2017], INSA Lyon, tous droits réservés

Chapter IV: Choice and validation of the experimental conditions for the SCC tests at room temperature and pressure
José Bolivar 88
Thèse en Sciences des Matériaux / 2017
Institut national des sciences appliquées de Lyon
established that the mechanism of crack propagation was the same in both cases and was
not modified by the loading conditions.
IV.2.3 Suitability of SSRT and CL tests for AE, DIC, and EN measurements
The in-situ experimental methodology developed in this work is based on the simultaneous
application of Digital Image Correlation, Acoustic Emission, and Electrochemical Noise
measurements. This kind of measurements can be slightly perturbed by the loading mode
employed (SSRT or CL). As mentioned in the last section, the SCC tests with the MAS
specimens can last approximately 20 h. If the SSRT tests are performed at the straining rate
of 5 × 10⁻⁷𝑠−1, is means that the sample extends 4.21 mm in 20 h. Such extension
represents around 60 % of the height of the CCD images (8 X 7 mm). Therefore, the cracks
can move out the Region Of Interest (ROI) as depicted in Figure IV-8, which will result in
a loss of data.
Figure IV-8. Schematic representation of the exit of a crack from the CCD sensor during an SSRT test for
t1<t2<t3
The Acoustic Emission measurements can also be quite perturbed by the constant straining
of the samples. Figure IV-9 presents two SCC tests performed on MAS specimens and
monitored by AE. One of the tests was performed under SSRT while the second one was
carried out under CL. The stress curve and the AE cumulative hits curve for each test are
depicted in the same figure. It can be noticed that there are three well-demarcated regions,
each one displaying different AE activities. The regions I and III are very similar for the
SSRT and the CL tests. Those regions correspond respectively to the elastic loading (I) and
the cracking stage (III). Nevertheless, it can be observed that there exists a big difference
in the region II between the SSRT and the CL tests. The AE activity continuously increases
for the sample tested by SSRT, while it remains almost constant for the CL test.
Cette thèse est accessible à l'adresse : http://theses.insa-lyon.fr/publication/2017LYSEI059/these.pdf © [J. Bolivar], [2017], INSA Lyon, tous droits réservés

Chapter IV: Choice and validation of the experimental conditions for the SCC tests at room temperature and pressure
José Bolivar 89
Thèse en Sciences des Matériaux / 2017
Institut national des sciences appliquées de Lyon
Figure IV-9. Comparison between the AE activity produced during SCC tests performed under SSRT or CL
(MAS material in a 0.01 M tetrathionate solution at pH 3). The x-axis represents the normalized time (against
the final time, tf)
As noted, under SSRTs in IG-SCC testing conditions the plastic domain of the material is
reached (see region II in Figure IV-9). Within this domain, a lot of AE is produced by
plastic processes which release much more energy than IGSCC crack propagation. The
latter explains the difference observed in the region II between the SSRT and the CL tests.
The analysis of AE is not always straightforward, even more when the AE events comes
from different mechanisms (plasticity and SCC propagation). Consequently, all the results
presented until here allows establishing that the more suitable loading mode for our study
is the Constant Load mode. This mode of loading offers more suitable conditions for DIC
and AE measurements than SSRT. Therefore, the Constant Load will be chosen for
performing all the tests presented in the next sections.
IV.2.4 Effect of the pH of the solution on the crack colony morphology
The stability of the passive film plays a major role in the initiation and propagation of stress
corrosion cracks. The stability of this protective layer is characterized by how resistant the
film is and by its self-healing capacity [89], [163], [209]. Such properties are determined
by the composition of the alloy (e.g. Cr and Mo content) and environmental factors such as
pH, temperature, potential and ions concentration. In this section, the pH of the solution
was varied in order to modify the stability of the passive film and therefore, the initiation
and propagation of cracks. For this, three SCC tests were performed under CL in a solution
of 0.01 M of K2S4O6 at pH 3.0, 4.0 and 5.3. A CCD camera was used to take pictures once
the cracks were well developed.
Cette thèse est accessible à l'adresse : http://theses.insa-lyon.fr/publication/2017LYSEI059/these.pdf © [J. Bolivar], [2017], INSA Lyon, tous droits réservés

Chapter IV: Choice and validation of the experimental conditions for the SCC tests at room temperature and pressure
José Bolivar 90
Thèse en Sciences des Matériaux / 2017
Institut national des sciences appliquées de Lyon
Figure IV-10 gathers the CCD pictures of the surface of the samples tested at different pH.
It can be observed that the more acidic the solution, the higher the crack density. Moreover,
Figure IV-11 shows two SEM images of the cracks developed at pH 3.0 and pH 5.3. It can
be observed that the crack developed at pH 5.3 presents more localized plasticity at the
crack tips, while the cracks that propagated at pH 3.0 displayed a more brittle aspect.
According to these observations, it can be argued that acidic media weaken the passive film
and ease initiation of cracks. Film-repair properties are also compromised in those
conditions. Therefore, not only the crack density can be controlled by changing the pH, but
the contributions of mechanical and electrochemical factors to crack propagation can also
be managed. The latter was evidenced by the difference of local plasticity at the cracks tips
at the different pH. The aggressiveness of the ion (tetrathionate) may also be influenced
by the pH, hence, playing a major role in the propagation process. However, no conclusion
can be drawn on this point from only optical microscopy observations.
Figure IV-10. CCD pictures of sample surface after SCC tests under Constant Load (0.8 σy) of a MAS Alloy 600
sample (LTS) in a 0.01 M tetrathionate solution at different pH.
Figure IV-11. SEM images of cracks obtained after SCC tests at Constant Load (80 % σy) of a MAS Alloy 600
samples (LTS) in a solution of 0.01 M of tetrathionate at different pH. (Left) at pH 3.0 and (Right) at pH 5.3
Cette thèse est accessible à l'adresse : http://theses.insa-lyon.fr/publication/2017LYSEI059/these.pdf © [J. Bolivar], [2017], INSA Lyon, tous droits réservés

Chapter IV: Choice and validation of the experimental conditions for the SCC tests at room temperature and pressure
José Bolivar 91
Thèse en Sciences des Matériaux / 2017
Institut national des sciences appliquées de Lyon
IV.2.5 Synopsis
In this section, the experimental conditions essential to nucleate multiple IG-SCC cracks
were investigated. The influence of several experimental parameters (e.g. heat treatment,
mode of loading and pH) on the morphology of the crack colonies were also analyzed.
According to the results, a sensitized microstructure was essential to suffer IG-SCC. Two
sensitized materials were therefore investigated: MAS and SAS. The only difference was
the application of a solution annealing treatment, before the sensitization stage in the SAS
material preparation. However, the solution annealing treatment was observed to cause a
very large heterogeneous microstructure. Consequently, the SAS material preparation
condition was discarded for further researches and the following part of the work focused
on the MAS material condition.
Two loading modes for the SCC experiments (SSRT and CL) were compared with a
particular attention to their effects on the crack colony morphology and their suitability for
DIC and AE measurements. It was observed that the cracks colonies obtained with both
modes of loading displayed similar characteristics (fracture surface, density, mode of
propagation). However, the CL tests were chosen for the rest of this study because their
static nature is more compatible with DIC and AE measurements: fixed relative ROI for
DIC measurements and less disturbance of AE data by plastic deformation.
The effects of the pH of the solution in the obtained cracks morphology and distribution
were investigated. Crack initiation was observed to be particularly susceptible to pH
variations. Decreasing the pH produced high-density crack colonies. In this manner,
different colonies of cracks, with different characteristics (density, frequency of crack
interactions) can be obtained by simple variation of the solution pH.
The last point that needs to be clarified to definitely settle the experimental procedure
concerns the development of a surface conditioning procedure in order to adapt DIC
measurement to in-situ SCC testing. It is detailed in next section.
Cette thèse est accessible à l'adresse : http://theses.insa-lyon.fr/publication/2017LYSEI059/these.pdf © [J. Bolivar], [2017], INSA Lyon, tous droits réservés

Chapter IV: Choice and validation of the experimental conditions for the SCC tests at room temperature and pressure
José Bolivar 92
Thèse en Sciences des Matériaux / 2017
Institut national des sciences appliquées de Lyon
IV.3 Choice and validation of the surface
patterning compatible with DIC
measurements and SCC tests
This work is based on the application of DIC measurements for the study of the interactions
between multiple stress corrosion cracks. As already described in the literature survey, this
technique allows the measurements of full/local strain fields by comparing an image
corresponding to a deformed state, to another one corresponding to a reference state.
Broadly speaking, the correlation is performed by tracking surface features included in a
group of pixels, named elements, in each of the images. This allows the assessment of the
displacement vector for each element, hence, the estimation of the displacement field. The
accuracy and the precision of the solution depend in large part on both the size of the
element and on the existence of a surface pattern [101]. In fact, the uniqueness of each
surface feature is only guaranteed if the surface exhibits a non-repetitive, isotropic and high
contrast pattern. Some materials are naturally textured, and the images are contrasted
enough so that the correlation is possible. The samples used for SCC tests do not present
such characteristics because SCC tests require polished surfaces for reproducibility reasons.
Consequently, the surfaces of the samples need to be adapted for DIC measurements.
In the case of non-textured materials, a random surface texture is usually generated by
spraying a speckle pattern with black and white paint. Nevertheless, this solution is
unsuitable for SCC testing because covering the sample surface with a paint can
modify/inhibit the SCC phenomenon. In that context, this section will be devoted to the
determination of a surface patterning compatible with DIC measurements and Stress
Corrosion Cracking tests.
Several methods were explored in this work; they were based on sandblasting, chemical
attacks and electro-etchings. Figure IV-12 shows a typical example of the surface pattern
generated by sandblasting. It can be noticed that the sandblasting induces the apparition of
facets on the surface which reflect the light (saturated pixels). This phenomenon is
deleterious for the performance of the algorithm. Besides, the sandblasting induces high
residual compression stress on the surface which can modify both the initiation kinetics and
the propagation rate of cracks. Thereupon, this method was quickly discarded, and the study
was only focused on chemical attacks and electro-etching.
Cette thèse est accessible à l'adresse : http://theses.insa-lyon.fr/publication/2017LYSEI059/these.pdf © [J. Bolivar], [2017], INSA Lyon, tous droits réservés

Chapter IV: Choice and validation of the experimental conditions for the SCC tests at room temperature and pressure
José Bolivar 93
Thèse en Sciences des Matériaux / 2017
Institut national des sciences appliquées de Lyon
Figure IV-12. CCD picture of the surface of an LTS sample after a surface preparation by sandblasting.
IV.3.1 Evaluation of surface treatment on Squared Samples
The study of the surface patterning was performed on squared samples made of MAS Alloy
600. The surface treatments were produced according to the different methods previously
described (chemical attack, electro-etching or both), then, the surface of the samples was
observed by optical microscopy. Additionally, CCD pictures of the surface of the samples
were also obtained. They were used to evaluate numerically the quality of the patterns. The
experimental procedure and the description of all the solutions implemented for surface
patterning evaluation were detailed in Section III.2.4.
IV.3.1.1 Visual observations
Table IV-4 (already displayed in Section III.2.4.1) summarizes the four types of random
patterns explored in this work. The ST-I only involves a chemical attack (by immersion) in
a solution of 50 vol. % HCl and containing H2O2 (here named CA). The other methods (ST-
II, ST-III, and ST-IV) involved either the same Chemical Attack (CA), an electro-etching
or both. The solution used for the Electro-Etching was composed 92 vol. % Glacial acetic
acid and 8 vol. % of perchloric acid. The surface patterning method ST-II consisted in an
CA followed by one electro-etching stage at 10 V (here named EE2). Subsequently, the ST-
III consisted in a single electro-etching at 10 V (EE2). Finally, the ST-IV consisted in two
electro-etching stages. The first one at 5 V for 10 s (named EE1) and the last one at 10 V
during 10 s (EE2).
Cette thèse est accessible à l'adresse : http://theses.insa-lyon.fr/publication/2017LYSEI059/these.pdf © [J. Bolivar], [2017], INSA Lyon, tous droits réservés

Chapter IV: Choice and validation of the experimental conditions for the SCC tests at room temperature and pressure
José Bolivar 94
Thèse en Sciences des Matériaux / 2017
Institut national des sciences appliquées de Lyon
Table IV-4. Description of the different surface treatment procedures tested (already displayed in Section
II.2.4.1)
Time (s)
Surface
treatment
procedure
Activation
(Act.)
Chemical
attack (CA)
Electro-Etching I
(EE1)
Electro-Etching II
(EE2)
(50 vol. %
HCl)
(50 mL of 50
% vol. HCl +
2 mL H2O2)
(92 vol. % glacial acetic acid,
8 vol. % perchloric acid, 5 V)
(92 vol. % glacial
acetic acid, 8 vol. %
perchloric acid, 10 V)
ST-I 30 5 - 120 - -
ST-II 30 5 - 120 - 10
ST-III - - - 10
ST-IV - - 10 10
Figure IV-13 presents two optical micrographs of the surface of two samples being
subjected to the surface treatment ST-I; the only difference between the two images was
the time of immersion for each of the samples (40 and 120 s). It can be observed that this
kind of surface treatment reveals the material microstructure (grain boundaries).
Additionally, the dissolution of the surface is a function of the crystallographic orientation
of the grains; therefore, different grains give different contrast. However, it was noted that
some of the grains keep a mirror aspect and reflect the light. This behavior penalizes the
possibility of this method to be used as a surface patterning technique, and this option was
consequently discarded.
Moreover, Figure IV-14 depicts the CCD pictures and the optical micrographs of the
surfaces of the samples subjected to the surface treatments ST-II, ST-III and ST-IV. As can
be seen on the optical micrographs, the three surface treatments produce different patterns.
Both the ST-II and ST-IV result in a mix of a macro-pattern immersed in a micrometric
pattern with a noisy aspect. In contrast, the ST-III is entirely composed of a micro noisy
texture. It can also be observed from the CCD pictures, that all the surfaces were matte
(non-light reflective), which is essential for the image acquisition process.
The matte aspect of all the surfaces described above (ST-II, ST-III and ST-IV) is thought
to be produced by the final electro-etching stage at 10 V (EE2). Figure IV-15 represents the
optical micrograph for the ST-III treatment, which consists only in an electro-etching at 10
V (EE2). It can be noted that this potential induces a slightly micro-heterogeneous attack
on the surface of the sample, which is thought to cause a diffuse reflection of the light and
the final matte aspect (see Figure IV-14). Moreover, it is also responsible of the micro
patterns mentioned above with noisy features.
Cette thèse est accessible à l'adresse : http://theses.insa-lyon.fr/publication/2017LYSEI059/these.pdf © [J. Bolivar], [2017], INSA Lyon, tous droits réservés

Chapter IV: Choice and validation of the experimental conditions for the SCC tests at room temperature and pressure
José Bolivar 95
Thèse en Sciences des Matériaux / 2017
Institut national des sciences appliquées de Lyon
Figure IV-13. Optical micrographs of sample surface after the Chemical Attack ST-I: a) immersion of 40 s and
b) immersion of 120 s
Figure IV-14. Compilation of CCD pictures and optical micrographs of the surface of the samples subjected to
the surface treatment ST-II (left), ST-III (center) and ST-IV (right)
Figure IV-16 depicts the surface of the sample, after the different stages involved in the
ST-II surface treatment. It can be noted that the final aspect results in scarce isolated bright
regions surrounded by a micro attack with a noisy aspect. The bright zones formerly
originated from the first stage (chemical attack, CA), then they are partially covered by the
Cette thèse est accessible à l'adresse : http://theses.insa-lyon.fr/publication/2017LYSEI059/these.pdf © [J. Bolivar], [2017], INSA Lyon, tous droits réservés

Chapter IV: Choice and validation of the experimental conditions for the SCC tests at room temperature and pressure
José Bolivar 96
Thèse en Sciences des Matériaux / 2017
Institut national des sciences appliquées de Lyon
EE2 treatment (see Figure IV-16). Similarly, in the ST-IV treatment (see Figure IV-17), the
first electroetching stage (EE1, 5V) produces a macro heterogeneous attack on the surface,
then the second electro-etching (EE2, 10 V) induces a general micro-attack that results in a
matte surface. It is important to mention that the EE2 treatment involves a shallow surface
dissolution, which is thought to decrease the surface residual stresses of the material and
increase the repeatability of the crack initiation kinetics.
Figure IV-15. Optical micrographs of the micro-heterogeneous attack produced by the surface treatment ST-III
(EE2, Electro-Etching at 10 V for 10 s)
Figure IV-16. Optical micrographs of the surface of a sample subjected to the surface patterning ST-II: a)
Stage I, Chemical Attack (CA) and b) Stage II, Electro-Etching (EE2)
Cette thèse est accessible à l'adresse : http://theses.insa-lyon.fr/publication/2017LYSEI059/these.pdf © [J. Bolivar], [2017], INSA Lyon, tous droits réservés
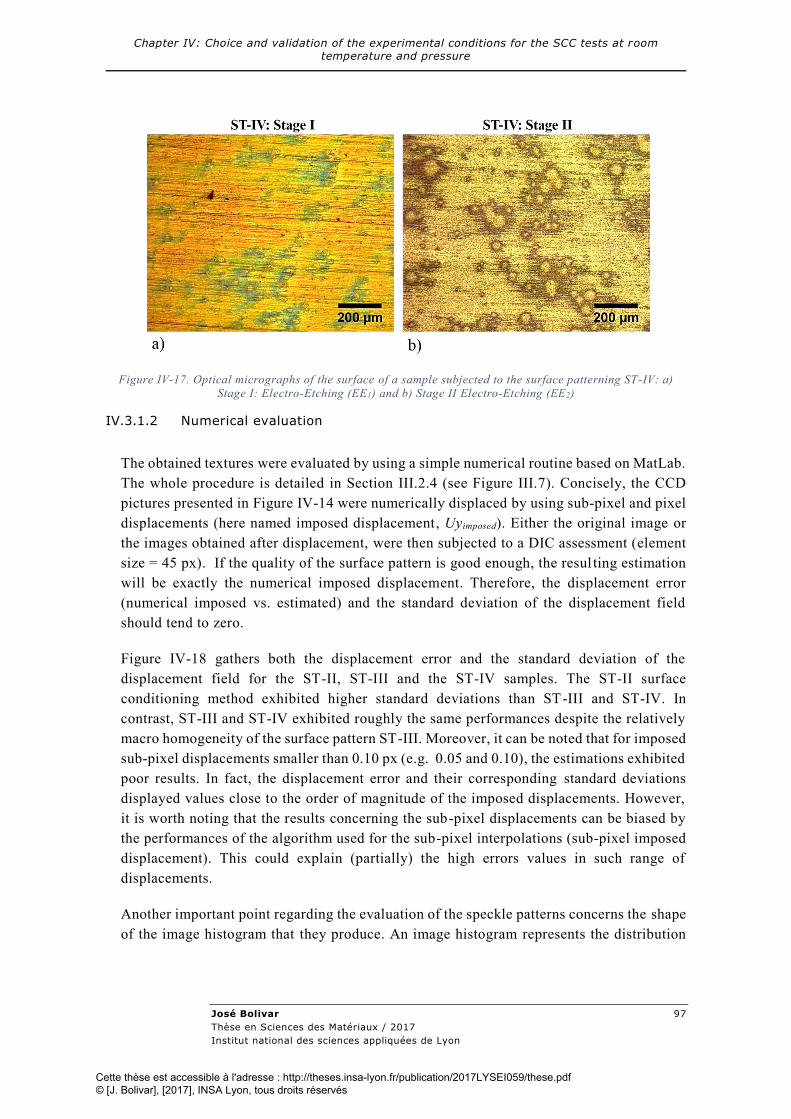
Chapter IV: Choice and validation of the experimental conditions for the SCC tests at room temperature and pressure
José Bolivar 97
Thèse en Sciences des Matériaux / 2017
Institut national des sciences appliquées de Lyon
Figure IV-17. Optical micrographs of the surface of a sample subjected to the surface patterning ST-IV: a)
Stage I: Electro-Etching (EE1) and b) Stage II Electro-Etching (EE2)
IV.3.1.2 Numerical evaluation
The obtained textures were evaluated by using a simple numerical routine based on MatLab.
The whole procedure is detailed in Section III.2.4 (see Figure III.7). Concisely, the CCD
pictures presented in Figure IV-14 were numerically displaced by using sub-pixel and pixel
displacements (here named imposed displacement, Uyimposed). Either the original image or
the images obtained after displacement, were then subjected to a DIC assessment (element
size = 45 px). If the quality of the surface pattern is good enough, the resul ting estimation
will be exactly the numerical imposed displacement. Therefore, the displacement error
(numerical imposed vs. estimated) and the standard deviation of the displacement field
should tend to zero.
Figure IV-18 gathers both the displacement error and the standard deviation of the
displacement field for the ST-II, ST-III and the ST-IV samples. The ST-II surface
conditioning method exhibited higher standard deviations than ST-III and ST-IV. In
contrast, ST-III and ST-IV exhibited roughly the same performances despite the relatively
macro homogeneity of the surface pattern ST-III. Moreover, it can be noted that for imposed
sub-pixel displacements smaller than 0.10 px (e.g. 0.05 and 0.10), the estimations exhibited
poor results. In fact, the displacement error and their corresponding standard deviations
displayed values close to the order of magnitude of the imposed displacements. However,
it is worth noting that the results concerning the sub-pixel displacements can be biased by
the performances of the algorithm used for the sub-pixel interpolations (sub-pixel imposed
displacement). This could explain (partially) the high errors values in such range of
displacements.
Another important point regarding the evaluation of the speckle patterns concerns the shape
of the image histogram that they produce. An image histogram represents the distribution
Cette thèse est accessible à l'adresse : http://theses.insa-lyon.fr/publication/2017LYSEI059/these.pdf © [J. Bolivar], [2017], INSA Lyon, tous droits réservés

Chapter IV: Choice and validation of the experimental conditions for the SCC tests at room temperature and pressure
José Bolivar 98
Thèse en Sciences des Matériaux / 2017
Institut national des sciences appliquées de Lyon
of the intensity values of the pixels of a digital image: the wider its shape, the more
dispersed the pixel values in the image. Therefore, the uniqueness of the location of a
determined feature can be enhanced. In this context, Figure IV-19 depicts the histogram of
pixels for the surface treatments ST-II, ST-III and ST-IV. It can be observed that both the
ST-II and the ST-III treatments show relatively narrow histograms, displaced towards the
dark intensities. In contrast, the histogram of the surface prepared according to the surface
treatment ST-IV exhibits a wider distribution.
Figure IV-18. Results of the numerical evaluation of the surface treatments ST-II, ST-III, and ST-IV. (Left)
Displacement error of the estimated displacement field (|Uyestimated - Uyimposed|). (Right) Standard deviation of
the estimated displacement field
Figure IV-19. Histogram of the CCD pictures corresponding to the surface of the sample subjected to surface
treatments ST-II, ST-III and ST-IV.
Cette thèse est accessible à l'adresse : http://theses.insa-lyon.fr/publication/2017LYSEI059/these.pdf © [J. Bolivar], [2017], INSA Lyon, tous droits réservés

Chapter IV: Choice and validation of the experimental conditions for the SCC tests at room temperature and pressure
José Bolivar 99
Thèse en Sciences des Matériaux / 2017
Institut national des sciences appliquées de Lyon
IV.3.1.3 Synopsis
In summary, it was observed that the application of a surface treatment based on a single
chemical attack (ST-I) produced bright surfaces. This kind of surface patterning was
immediately discarded because they produced partial saturated CCD images, useless for
DIC assessments. In contrast, the surface patterning procedures ST-II, ST-III and ST-IV
generated a matte finishing. Such a matte finishing was provided by the electro-etching EE2
which was applied at the last stage. Furthermore, the numerical evaluation (displacement
error, standard deviation) showed that the surface treatments ST-III, and ST-IV had roughly
similar performances which were better than those observed for the ST-II sample.
Moreover, the DIC assessments were less accurate and precise in the range of the sub-pixel
displacements (< 0.5 px), but they exhibited good performances to resolve displacements
larger than 0.5 px. Finally, the histogram of the CCD pictures of each of the surface pattern
revealed that the ST-IV presented a wide histogram, while the two others (ST-II and ST-
III) showed narrow distributions displaced towards the dark intensities.
It is important to highlight that the numerical method implemented for the evaluation of the
surface patterning performances might not be the most adequate, notably because the
imposed Rigid Body Mouvements (RBM) are homogeneous and did not consider any
deformation. Nevertheless, it is believed that the results from these tests are correct to
validate the application of a surface treatment for DIC measurements for our finalities.
Given this points, it is established that the surface patterning procedure the most adapted
for assessments is the surface treatment ST-IV. This surface treatment is easy to be
transposed to LTS samples as the procedure involves only one solution (92 vol. % Glacial
acetic acid + 8 vol. % perchloric acid) and involves a relatively easy set-up. Moreover, the
final texture achieved with this procedure induces the generation of two patterns at different
scales (macro and micro noisy patterns), so that, in theory, this should increase the
performances of the patterns in the estimation of strains involving sub-pixels and pixels
displacements.
IV.3.2 Electrochemical characterization of the surface treatment
The retained surface patterning method (ST-IV) involves two electro-etching stages in an
acidic solution. The final finishing induces several surface modifications that could modify
the original electrochemical behavior of the material, notably the stability of the passive
film and the mechanisms of crack initiation. For this reason, it is important to evaluate the
influence of the surface treatment ST-IV, on the electrochemical behavior of the material.
The latter was performed through polarization curves.
Figure IV-20 depicts the polarization curves for the AR and MAS conditions. Each
preparation condition was tested with and without the surface patterning (ST-IV). The test
solution consisted in 0.01 M of K2S4O6 at pH 3.0. It can be appreciated that the application
Cette thèse est accessible à l'adresse : http://theses.insa-lyon.fr/publication/2017LYSEI059/these.pdf © [J. Bolivar], [2017], INSA Lyon, tous droits réservés

Chapter IV: Choice and validation of the experimental conditions for the SCC tests at room temperature and pressure
José Bolivar 100
Thèse en Sciences des Matériaux / 2017
Institut national des sciences appliquées de Lyon
of the surface treatment displaces the corrosion potential towards more active values. This
effect can not be perceived for the AR condition but is clearer on the sensitized samples
(MAS). Moreover, the application of the surface treatment on the MAS material increased
the measured current density. It seems that a weaker passive film forms after the application
of the surface treatment. The latter is expected to modify in some degree the initiation
kinetics of cracks when compared to a sample that has not suffered a surface treatment.
Figure IV-20. Polarization curves obtained at 10 mV/min in a 0.01 M K2S4O6 solution at pH 3.0.
IV.3.3 Validation of the surface patterning on the Long Tensile Samples
(LTS)
The surface treatment ST-IV was transposed to the LTS samples. Both the reproducibility
and the performances of the patterning were evaluated. Three LTS samples were subjected
to the surface treatment ST-IV. Figure IV-21 presents the CCD pictures of the obtained
surface patterns. It can be noted that the obtained surfaces are similar to those obtained for
the small specimens (see Figure IV-14). The surfaces were matte, and comprised a macro
pattern and a noisy micropattern. However, it can be observed that the shape of the macro
pattern was not reproduced in the same manner on the three LTS samples. The reason may
be due to the fact that the surface treatments were not all produced the same day. The
temperature of the bath could have changed by some degrees (e.g. 1 or 2°C) between each
experiment, hence, modifying the final aspect. This result is important because the SCC
samples will be prepared different days. Consequently, the obtained patterns are expected
to vary in the same manner.
Cette thèse est accessible à l'adresse : http://theses.insa-lyon.fr/publication/2017LYSEI059/these.pdf © [J. Bolivar], [2017], INSA Lyon, tous droits réservés

Chapter IV: Choice and validation of the experimental conditions for the SCC tests at room temperature and pressure
José Bolivar 101
Thèse en Sciences des Matériaux / 2017
Institut national des sciences appliquées de Lyon
Figure IV-21. CCD pictures of the surface patterns obtained after the surface treatment ST-IV on LTS samples
(Alloy 600 MAS)
The quality of the obtained patterns was evaluated by following the same procedure as that
one used for small specimens (see Section III.2.4 for details). As previously detailed, the
CCD picture of each sample surface (see Figure IV-21) was numerically displaced by using
sub-pixel and pixel steps. Both the original image and the displaced images were then
subjected to a DIC assessment (element size = 45 px). The quality of the patterns was
evaluated by calculating the displacement error (numerical imposed vs. estimated) and the
standard deviation of the displacement field. Both results are presented in Figure IV-22. It
can be noted that despite the difference between the three patterns, all of them exhibited
roughly the same behavior. The obtained patterns displayed poor precision for movements
comprised between 0.05 and 0.1 px. However, from an imposed displacement larger than
0.1 px, the performance of all the patterns is quite satisfactory.
Figure IV-22. Results of the numerical evaluation of the surface treatment ST-IV on LTS samples. (Left)
Displacement error of the estimated displacement field (|Uy estimated - Uyimposed|). (Right) Standard deviation of
the estimated displacement field
It is known that the DIC assessment is also influenced by the element size used in the
calculations. In order to estimate the quality of the results versus the element size, the
Cette thèse est accessible à l'adresse : http://theses.insa-lyon.fr/publication/2017LYSEI059/these.pdf © [J. Bolivar], [2017], INSA Lyon, tous droits réservés

Chapter IV: Choice and validation of the experimental conditions for the SCC tests at room temperature and pressure
José Bolivar 102
Thèse en Sciences des Matériaux / 2017
Institut national des sciences appliquées de Lyon
patterns were evaluated by using square elements of 8, 16, 32 and 45 pixels. Figure IV-23
depicts the displacement error and the standard deviation of the estimated fields, in function
of the element size used for the DIC assessments. As observed before, the DIC assessment
shows poor performances when estimating very small displacements (≤ 0.1 px). In that case,
both displacement errors and standard deviations display the same order of magnitude (or
larger) than the imposed displacement. Moreover, using an element size equal to 16 px
allows achieving levels of accuracy close to those that could be obtained by using larger
elements. However, the estimations become slightly more accurate as the element size
increases, which can be observed on the graph giving the standard deviation.
Given these points, it can be stated that the patterns can easily resolve displacement values
larger than 0.5 px with a maximal error of 10−4 px (0.02 %). The results become more
accurate as the magnitude of the displacement to be resolved increases. Working with an
element size comprised between 16 and 32 px is recommended, which should allow working
with enough precision and a good spatial resolution.
Figure IV-23. Results of the numerical evaluation of the pattern LT-ST-03 in function of different element sizes.
(Left) Displacement error of the estimated displacement field (|Uy estimated - Uyimposed|). (Right) Standard
deviation of the estimated displacement field
Cette thèse est accessible à l'adresse : http://theses.insa-lyon.fr/publication/2017LYSEI059/these.pdf © [J. Bolivar], [2017], INSA Lyon, tous droits réservés

Chapter IV: Choice and validation of the experimental conditions for the SCC tests at room temperature and pressure
José Bolivar 103
Thèse en Sciences des Matériaux / 2017
Institut national des sciences appliquées de Lyon
Chapter Summary
In this work, the system chosen for the room temperature SCC tests consists in the Alloy
600 tested in a 10 mM tetrathionate solution. The cracking features of this system are
reported to be dependent on the sensitization state of the material, the pH of the solution
and the mode of loading. In this chapter, the influence of these parameters on the obtained
crack colony morphology was evaluated. Moreover, a surface patterning method compatible
with DIC measurements was designed and validated.
The susceptibility towards IG-SCC of the different states of the material (AR, MAS, and
SAS) was evaluated through four-point bending tests, SSRT, and Constant Load tests. The
AR samples did not show any sign of IG-SCC in any of the performed tests. It was
established that a heavy sensitized state is essential for the material to suffer IG-SCC in a
solution of potassium tetrathionate.
Multiple crack initiation and propagation occurred on both sensitized samples (MAS and
SAS). The initiated cracks presented very brittle aspect in both materials, they propagated
following an intergranular path and exhibited signs of interactions (shielding,
coalescences). The MAS material presented high susceptibility to IG-SCC associated to a
finer microstructure (compared to the SAS one). In fact, the SAS material is composed of
large grains which can influence the propagation mechanisms of cracks at the mesoscale.
For this reasons, the MAS samples were selected to continue the study.
The influence of the pH of the solution was also evaluated. Three SCC tests were performed
under constant load at pH 3.0, 4.0 and 5.3. It was noticed that acidic pH induces an increase
in the initiation kinetics of cracks, therefore, having a direct influence on the final crack
density. Such property was used in the subsequent part of this work in order to analyze
crack colonies with different features (e.g. density, frequency of crack interactions).
Two modes of loading were compared, through Slow Strain Rate Tensile Tests (SSRT) and
Constant Load tests (CL). No substantial differences were observed on the obtained crack
colony morphology according to the different loading techniques.
The suitability of each of the charging methods (SSRT, CL) for AE and DIC measurements
was also evaluated. In the SSRT tests, the risk that the Region Of Interest goes out of the
frame of the camera exists, hence resulting in a loss of information. Moreover, the SSRT
achieves the plastic domain of the material. In this domain, a lot of or AE sources are
activated by the plasticity related mechanisms, resulting in an intensive AE activity that
"pollutes" the recording. For these reasons, the CL tests appear to be more adapted to this
work.
Cette thèse est accessible à l'adresse : http://theses.insa-lyon.fr/publication/2017LYSEI059/these.pdf © [J. Bolivar], [2017], INSA Lyon, tous droits réservés

Chapter IV: Choice and validation of the experimental conditions for the SCC tests at room temperature and pressure
José Bolivar 104
Thèse en Sciences des Matériaux / 2017
Institut national des sciences appliquées de Lyon
On the other hand, several surface patterning methods were characterized and studied on
Small Squared samples. They consisted of sandblasting, chemical attack and electro-
etchings. The surface patterns produced by only one stage of either sandblasting or chemical
attack were quickly discarded. Both methods produced reflecting features that saturated the
CCD images. On the other hand, the methods based on a mix between a chemical attack
and electro-etchings (ST-II, ST-III and ST-IV) produced textured matte surfaces. The
quality of all the surface treatments was numerically evaluated. The surface pattern ST-II
displayed poorer performances than the ST-III and ST-IV ones. ST-III and ST-IV were
observed to display roughly the same performances on the numerical test. However, the
surface patterning ST-IV was finally chosen for its easier application on LTS. The final
selection was based on the aspect of the final surface and the corresponding histograms.
Actually, the surface conditioning ST-III produced a relatively macro homogeneous surface
with a narrow histogram. Such an aspect is believed to be deleterious for the resolution of
large deformations in SCC tests.
The surface treatment ST-IV was transposed to the LTS samples. The quality of the
obtained patterns was also numerically evaluated. The results showed that the pattern
exhibited good performances to resolve displacements larger than 0.5 px. In that case, the
maximal displacement error was estimated to be 10−4 px. Additionally, the influence of the
element size on the DIC measurements was also evaluated. It was noted that working with
a subset size comprised between 16 and 32 px provides good results with an acceptable
resolution.
To conclude, the results obtained during this part of the work allowed defining both the set
of experimental conditions (material preparation conditions and pH) and the experimental
methodology (mode of loading and surface conditioning) that will be implemented for the
rest of the study. Intergranular crack propagation in a MAS Alloy 600 under constant load,
with variable pH conditions is studied that way in the next section.
Cette thèse est accessible à l'adresse : http://theses.insa-lyon.fr/publication/2017LYSEI059/these.pdf © [J. Bolivar], [2017], INSA Lyon, tous droits réservés

Chapter V: Study of crack propagation by Digital Image Correlation analysis
José Bolivar 105
Thèse en Sciences des Matériaux / 2017
Institut national des sciences appliquées de Lyon
Chapter V
V Study of crack propagation by
Digital Image Correlation
analysis V.1 Introduction ................................................................................................. 107
V.2 Study of the propagation of a single stress corrosion crack ........................ 107
V.2.1 Presentation of the results ....................................................................... 108
V.2.1.1 Crack detection by DIC ................................................................... 108
V.2.1.2 Description of Crack Growth ........................................................... 110
V.2.1.3 Extraction of cracks parameters ....................................................... 111
V.2.1.4 Acoustic Emission and Electrochemical Noise measurements during the
SCC test .......................................................................................... 114
V.2.2 Discussion .............................................................................................. 117
V.2.3 Synopsis ................................................................................................. 120
V.3 Description of the propagation behavior of a colony of stress corrosion
cracks…. ........................................................................................................ 121
V.3.1 Presentation of the results ....................................................................... 121
V.3.1.1 General behavior of the crack colony ............................................... 121
V.3.1.2 Crack colony morphology ................................................................ 122
V.3.1.3 Crack detection ............................................................................... 123
V.3.1.4 DIC results: evolution of the crack colony........................................ 124
V.3.1.5 Complementary AE and EN results .................................................. 128
V.3.2 Discussion .............................................................................................. 129
V.3.3 Synopsis ................................................................................................. 133
V.4 Validation by in-situ X-ray tomography and Digital Volume Correlation.. 133
V.4.1 Presentation of the results ....................................................................... 135
V.4.1.1 Description of the in-situ experiments performed on the Psiche beamline
(synchrotron SOLEIL) ..................................................................... 135
V.4.1.1.1 Experiment S_I_600_01 ............................................................... 136
V.4.1.1.2 Experiment S_I_600_02 ............................................................... 138
V.4.1.2 Shape of the intergranular stress corrosion cracks............................. 141
Cette thèse est accessible à l'adresse : http://theses.insa-lyon.fr/publication/2017LYSEI059/these.pdf © [J. Bolivar], [2017], INSA Lyon, tous droits réservés

Chapter V: Study of crack propagation by Digital Image Correlation analysis
José Bolivar 106
Thèse en Sciences des Matériaux / 2017
Institut national des sciences appliquées de Lyon
V.4.1.3 Feasibility of Digital Volume Correlation measurements from in-situ
microtomography SCC experiments ................................................. 143
V.4.1.4 Crack morphology extraction from the estimated error fields ............ 147
V.4.2 Discussion .............................................................................................. 149
V.4.3 Synopsis ................................................................................................. 152
Chapter Summary ................................................................................................ 154
Cette thèse est accessible à l'adresse : http://theses.insa-lyon.fr/publication/2017LYSEI059/these.pdf © [J. Bolivar], [2017], INSA Lyon, tous droits réservés

Chapter V: Study of crack propagation by Digital Image Correlation analysis
José Bolivar 107
Thèse en Sciences des Matériaux / 2017
Institut national des sciences appliquées de Lyon
V.1 Introduction
he experimental conditions suitable to induce the initiation and the
propagation of intergranular stress corrosion cracks for Alloy 600 immersed
in a 0.01 M potassium tetrathionate solution of were previously determined.
The present chapter is devoted to the study of the propagation of intergranular
stress corrosion cracks by Digital Image Correlation technique and by
complementary Acoustic Emission and Electrochemical Noise measurements.
The analysis that will result from this approach will contribute to the
characterization of the IG-SCC process, and will help to the development of a
numerical model devoted to simulate the propagation of multiple stress corrosion
cracks.
The present chapter is divided into three parts. The first section presents the
study of the propagation of a single intergranular crack. Here, several
correlations between the different experimental techniques will be done in order
to characterize and understand the propagation mechanism. The second section
is devoted to the study of the propagation of a crack colony. Herein, the different
stages involved in the development of the colony are discussed. Besides,
qualitative evaluation of the effect of crack interactions on the growth of the
colony is detailed.
Finally, the last section presents the validation of the 2D approach by in-situ
micro-tomography observations. Within this section, the different stages
involved in the propagation of the defects and their 3D shape will be discussed
and validated.
V.2 Study of the propagation of a single stress
corrosion crack
A MAS LTS specimen (CC 04-15) was tested in a solution of 0.01 M of potassium tetrathionate
at pH 5.3. Figure V-1 depicts the propagation of the single defect that initiated and propagated.
In this experiment, the sample underwent a pre-immersion period of 3 h, which corresponds to
the time that sample lasted immersed in the solution (in the absence of stress) before the
application of the constant load (at 0.8 σy). This experiment lasted 100 h (97 h under applied
load) and was interrupted before the final failure. The overview of this section is as follows. A
first subsection will be devoted to describe the obtained results. It comprises (i) the detection
of crack initiation, (ii) the extraction of the crack parameters, (iii) the description o f the crack
growth and (iv) the compilation of the AE, EN and DIC results. Subsequently, a whole
subsection will be devoted to a general discussion with respect to the previously detailed
results. Finally, this section ends with a synopsis containing the main conclusions.
T
Cette thèse est accessible à l'adresse : http://theses.insa-lyon.fr/publication/2017LYSEI059/these.pdf © [J. Bolivar], [2017], INSA Lyon, tous droits réservés

Chapter V: Study of crack propagation by Digital Image Correlation analysis
José Bolivar 108
Thèse en Sciences des Matériaux / 2017
Institut national des sciences appliquées de Lyon
Figure V-1. Evolution of the single stress corrosion crack initiated on sample CC 04 -15: CCD pictures of the
sample surface for different times
V.2.1 Presentation of the results
V.2.1.1 Crack detection by DIC
A DIC assessment was performed in order to detect the initiation and the propagation of the
crack. The calculation was performed with squared elements of 16 pixels (55 µm) over images
acquired every 10 minutes. The sample was loaded under mode I according to the y-axis,
consequently all the analysis focused on the displacement according to the y-axis (Uy).
Actually, when a defect initiates on the surface, it induces a y-displacement jump because of
the opening of the crack. The obtained displacement fields were treated post-acquisition. The
treatment consisted in filtering the displacements induced by an homogeneous deformation of
the surface, which allowed to better identifying the displacement exclusively due to the
apparition of a discontinuity (e.g. crack opening). In general terms, that was achieved by
subtracting the displacements of the edges of the Region Of Interest (ROI) according to the y-
axis (see Figure V-2). In this context, if no crack initiates, the filtered field is expected to
remain constant (Uy ≈ constant). Otherwise, the maximum value of Uy will increase according
to the amplitude of the displacement jump (crack opening). The estimation of the crack
initiation time was performed by evaluating the evolution of the maximum values of Uy (Uymax).
Figure V-3 depicts both the evolution of Uymax together with the strain measurements (εyy). As
can be observed, there exists a domain where Uymax is relatively constant (from 0 to 950 min),
suggesting that no crack (larger than 55 µm) has initiated. On the other hand, Uymax shows a
continuous increase from 950 min which could be related to either the initiation and/or the
propagation of a defect.
Cette thèse est accessible à l'adresse : http://theses.insa-lyon.fr/publication/2017LYSEI059/these.pdf © [J. Bolivar], [2017], INSA Lyon, tous droits réservés

Chapter V: Study of crack propagation by Digital Image Correlation analysis
José Bolivar 109
Thèse en Sciences des Matériaux / 2017
Institut national des sciences appliquées de Lyon
Figure V-2. Schematic representation of the filtering stage before the treatment of the displacement fields. The
displacements induced by an homogeneous deformation (according to the y-axis) were determined from the
displacements of the edges of the ROI (in green) then, they were subtracted from the displacement field.
Figure V-3. Longitudinal strain measurement (εyy) and maximum values of Uy for the test CC 04-15.
Figure V-4 gathers the displacement field (Uy) for different times together with crack opening
measurements (see section V.2.1.3 for details). At 973 minutes, it can be observed that the
crack is already present on the corresponding displacement field. Nevertheless, its Crack
Opening Displacement (COD) is very small and is close to the noise level (≈ 0.25 px). In fact,
it can be noted that some other locations display the same levels of displacements. Moreover,
it can be seen that for the considered period (from 973 to 1673 min), the COD ranges from 1.5
to 3 µm (0.15 to 0.87 px, respectively) while the length of the cracks seems to evolve from 500
µm until 1500 µm (approximately), suggesting that within this lapse of time the crack mostly
propagates in the surface rather than inside the material.
Cette thèse est accessible à l'adresse : http://theses.insa-lyon.fr/publication/2017LYSEI059/these.pdf © [J. Bolivar], [2017], INSA Lyon, tous droits réservés

Chapter V: Study of crack propagation by Digital Image Correlation analysis
José Bolivar 110
Thèse en Sciences des Matériaux / 2017
Institut national des sciences appliquées de Lyon
Figure V-4.Evolution of the single stress corrosion crack initiated on sample CC 04-15. (Left) Opening
measurements at the center of the crack. (Right) Displacement field Uy for different times . Both the grid
surrounding each picture as well as the scale bar are in pixels
V.2.1.2 Description of Crack Growth
Figure V-1 depicts some CCD pictures of the sample surface for different times. It can be
observed that despite the crack was detected by DIC at 950 min, it starts to be optically visible
from 2170 min. In order to better appreciate the crack evolution, Figure V-5 displays a zoomed
region for the lapse of time comprised between 2323 and 4323 minutes. It can be noted that
some cracks initiate near the main crack and then coalesce with it during the propagation
process. Moreover, it can be observed that from 3500 min the recently initiated defects appear
to follow an inclined plane. It can also be seen that there exists a period during which the newly
initiated defects are unconnected to the main body, suggesting that the crack tip do not deflect
by itself and that the process is not a pure branching mechanism. Actually, it is more likely that
the cracks initiate at the crack tips and then propagate following an inclined path. The inclined
aspect of such defects suggests the existence of a mixed loading condition (mode I and II) in
the crack tips neighborhood.
These observations are very important because they allowed identifying a particular
propagation mechanism. The defect becomes larger by adjacent cracks coalescence rather than
by direct growth of the primary crack. This behavior differs from a pure "mechanical"
propagation where the process is described only by the local stress around the crack front
(LEFM conditions). Kamaya et al. have already reported this kind of behavior in the case of
304 SS in high-temperature water [64]. The authors named the process "Initiation Dominant
Growth (IDG)" and highlighted the significance that have local stresses on the initiation
kinetics of cracks and hence, on the growth of IDG defects [64], [210]. In this case the cracks
initiated near the crack tips of the main crack because of the significant stress/strain
concentration that exists in that zone (see Figure II.8 in Section II.3.1).
Cette thèse est accessible à l'adresse : http://theses.insa-lyon.fr/publication/2017LYSEI059/these.pdf © [J. Bolivar], [2017], INSA Lyon, tous droits réservés

Chapter V: Study of crack propagation by Digital Image Correlation analysis
José Bolivar 111
Thèse en Sciences des Matériaux / 2017
Institut national des sciences appliquées de Lyon
Figure V-5. Zoomed region around the stress corrosion crack. Identification of nucleated cracks in the vicinity of
the crack tips of the main defect.
V.2.1.3 Extraction of cracks parameters
In this experiment, several methods were explored for the extraction of the crack size, because
the very small COD at the beginning of the test and the important emergence of plasticity
(confined at crack tips) during the last stages complicate the application of a single approach.
Figure V-6 depicts four methods that were considered to estimate crack length. They comprise
(i) image thresholding, (ii) analysis of Uy, (iii) thresholding of the correlation error and (iv)
thresholding of the strain field (or 1st derivative of Uy).
Figure V-6. Methods for the estimation of crack dimensions. (a) Segmentation from grayscale images. (b) From the
displacement field. (c) From the correlation error field and (d) From the strain field (1st derivative of Uy)
The first method consists of segmenting the gray-scale images directly from a determined gray
value, allowing the segmentation of the defect (see Figure V-7). The disadvantage of this
method is that it can only be employed once the defect has reached an opening that is wide
enough. Nevertheless, this method is almost unaffected by plasticity effects that are produced
on the stress concentration zone of the crack. Hence, this approach was only employed from at
Cette thèse est accessible à l'adresse : http://theses.insa-lyon.fr/publication/2017LYSEI059/these.pdf © [J. Bolivar], [2017], INSA Lyon, tous droits réservés

Chapter V: Study of crack propagation by Digital Image Correlation analysis
José Bolivar 112
Thèse en Sciences des Matériaux / 2017
Institut national des sciences appliquées de Lyon
time exceeding 2600 minutes, corresponding to sufficient crack opening to be easily
segmented.
Figure V-7. Extraction of crack dimensions by the method (i): segmentation of the gray scales images. "a"
represents the crack opening, defined at the middle of the crack and "2c" represents the crack length.
Figure V-8. Extraction of crack dimensions by the method (ii): scanning of the displacement field. (a) Uy, (b)
obtained crack opening profile and (c) scanning process for determining crack opening
The second approach consisted in obtaining the size of the defect (length and opening) directly
from the displacement field; the basis of this method is depicted on Figure V-8. As already
mentioned, the initiation of a crack induces a discontinuity on Uy (see Line # 1 in Figure V-8).
The amplitude of the discontinuity represents directly the local COD. The regions without
cracks will not present any discontinuity; only the displacements induced by the deformation
will be present (see Line # 2 in Figure V-8). In this manner, the Uy field is scanned according
to the y-axis in order to determine the regions where a discontinuity exists. Consequently, the
amplitudes of the displacement jumps are extracted, and a crack opening profile is
reconstructed (see Figure V-8.c). The length of the crack is taken as the extension of the
opening profile. Moreover, the crack opening is chosen as twice the maximum value of the
obtained profile. As an advantage, this approach allows detecting size of defects with very
small COD. Nevertheless, when the plasticity effects are too important at the crack tips, the
detection of the displacement jumps is very troublesome at the limits. Therefore, this method
is more adapted for the first part of the test rather than for the last stage.
Finally, the methods (iii) and (iv) were not further used because they are affected by several
drawbacks. With respect to the correlation error (iii), the obtained fields resulted in noisy
images having a detrimental effect on crack characteristic measurements . Figure V-7.c
Cette thèse est accessible à l'adresse : http://theses.insa-lyon.fr/publication/2017LYSEI059/these.pdf © [J. Bolivar], [2017], INSA Lyon, tous droits réservés

Chapter V: Study of crack propagation by Digital Image Correlation analysis
José Bolivar 113
Thèse en Sciences des Matériaux / 2017
Institut national des sciences appliquées de Lyon
evidence the important noise level in the error field. The noise is believed to be produced by
some convection of the solution and by the relatively low quality of the surface pattern. On the
other hand, the use of the strain field (iv) also displayed some obstacles. Due to the increasing
size of the plastic zones at the crack tips during sample deformation (Figure V-7.d), the
segmentation process of the object requires a modified threshold for each step. That stage was
judged delicate, and hence this method was disregarded.
Figure V-9 compiles the results obtained for the estimation of both the crack length and
opening, from methods (i) and (ii). Despite the crack was detected by DIC from 950 min (see
Section V.2.1.1), the evaluation of the dimension of the defect was only possible from 1470
min. As already mentioned, before 1470 min the measurement of COD of the defect is affected
by the noise level, making very difficult the detection of the displacement jumps. Moreover,
this figure allows perceiving that the crack seems to display two different behaviors during its
propagation. The transition between those two behaviors seems to be around 2500 minutes.
Before 2500 min, the measurements confirm that the crack grows mostly on the surface rather
than inside the material. After 2500 min, both opening and length measurements constantly
evolve, suggesting that the crack grows towards both directions (2500 – 5000 min).
Figure V-9. Compilation of the crack length measurements (sample CC 04-15) from methods: (i) segmentation of
gray scale images and (ii) analysis of Uy.
A refined analysis of the displacement fields permits to estimate the Stress Intensity Factors at
both crack tips (left and right). The reader can refer to Appendix D where the procedure
followed for the SIF-determination is described in detail. As a summary, the experimental
displacement fields were compared by a least-squares method to an analytical solution
describing kinematic near the crack tip neighborhood. The analytical solution consists of
William's series, which were developed to describe the behavior near the tip of a semi -infinite
straight crack in a linear elastic isotropic infinite body. Under the conditions mentioned just
before, this approach allows determining both the position of the crack tips and their
corresponding SIF values precisely. In this manner, Figure V-10 compiles the SIF values
(modes I and II) for the period comprised between 1400 and 4000 min. The K I-curve displays
a similar evolution on both crack tips, consisting in a continuous increase. Moreover, despite
the sample is loaded in mode I, the tips of the cracks also experience some mode II. The mode
II is induced by the geometrical disposition of the crack (which is inclined) with respect to the
loading direction. The KII-values at the left tip are almost twice the value of the one at the right
Cette thèse est accessible à l'adresse : http://theses.insa-lyon.fr/publication/2017LYSEI059/these.pdf © [J. Bolivar], [2017], INSA Lyon, tous droits réservés

Chapter V: Study of crack propagation by Digital Image Correlation analysis
José Bolivar 114
Thèse en Sciences des Matériaux / 2017
Institut national des sciences appliquées de Lyon
tip. This could explain the significant deviation of the crack tip on the left side of the defect
(see Figure V-5). Moreover, the graph at the right on Figure V-10 represents the CGR of both
tips in function of the KI value. Despite increasing values of the crack driving force, the CGR
remains relatively constant.
Figure V-10. Results of the estimation of the Stress Intensity Factors at the surface crack tips. (Left) representation
of the evolution of the SIFs for mode I (KI) and II (KII). (Right) Crack Growth Rate in function of the K-values for
both crack tips.
V.2.1.4 Acoustic Emission and Electrochemical Noise measurements during the SCC test
Acoustic Emission data treatment was mainly performed by MISTRAS Group SAS, which was
one of the industrial partner of the ECCOFIC project. For that reason, details about both the
characterization of the background noise and about the nature of the sources of the registered
AE events are gathered in Appendix C.
For the present section, only the AE registered 2 hours after loading was considered (from 300
min). Actually, during loading a lot of AE activity is generated due to local plasticity
phenomena (such as dislocations movements). These plasticity processes were observed to have
progressively decreasing intensity after the loading time, due to strain/stress reorganization
within the material.
Figure V-11 gathers AE and EN measurements, together with the results derived from DIC
analysis. With respect to the upper graph, the AE activity is represented by the cumulative
energy of the acoustic hits and the cumulative evolution of the acoustic emission events (hits).
It can be observed that there exists an important low energy AE activity between 300 and 2500
minutes, characterized by a significant increase in both the cumulative hits and the cumulative
absolute energy. Subsequently, the cumulated energy seems to evolve in a constant manner
until around 4000 min, when the AE activity starts to be very intensive and energetic.
Furthermore, Figure V-11 also includes both the Electrochemical Potential Noise (EPN) and
Electrochemical Current Noise (ECN) coming from EN measurements. It can be appreciated
that the EPN increases from the pre-immersion period until around 500 min of the test. At that
time, the EPN shows an inflection point and starts to drop progressively until around 4000 min.
The inflection point could be related to the initiation of some intergranular attack, which
Cette thèse est accessible à l'adresse : http://theses.insa-lyon.fr/publication/2017LYSEI059/these.pdf © [J. Bolivar], [2017], INSA Lyon, tous droits réservés

Chapter V: Study of crack propagation by Digital Image Correlation analysis
José Bolivar 115
Thèse en Sciences des Matériaux / 2017
Institut national des sciences appliquées de Lyon
becomes intensive and produces the progressive drops. Once at 4000 minutes, the potential
stabilizes a short period of time before increase slightly until the end of the test .
Regarding the Electrochemical Current Noise, it can be observed that the signal remains
relatively constant with a low DC level from the beginning of the test until 800 min. At that
time, the ECN increases sharply. A part of this current can be attributed the occurrence of
anodic processes at the WE. Then, the ECN remains nearly constant until 4000 min of the test.
At that time, the ECN starts to decrease and the cumulative energy (AE) starts to increase
considerably.
The second graph on Figure V-11 compiles both the crack length and opening obtained in
Section V.2.1. Such measurements were derived and divided by the lapse of time between each
point (10 min) in order to calculate the CGR. The upper graph and the lower graph are plotting
the same duration to facilitate the analysis of the crack propagation process.
Finally, Figure V-12 represents the evolution of the standard deviation of both the EPN (σEPN)
and the ECN (σECN). The description of the method implemented for the treatment of the EN
record is detailed in Section III.3.2.3. The raw EPN and ECN signals were digitally high-pass
filtered (fc6 = 0.05 Hz). The values of the standard deviations were calculated from the PSD of
the signals (4096 points / block), by using Equation II-17. It has to be mentioned that this test
was performed without a Faraday cage. Moreover, it is expected that some important
asymmetry develops between the WE and the CE during the experiment. Hence, the confidence
in the ECN measurements remains questionable at this stage of the study, but will be clarified
later (see Chapter VI). Furthermore, is it know that the potential measurements are less affected
by those factors and can be therefore more reliable (see Chapter VI). The evolution of the σEPN
exhibits a peak at around 460 min which corresponds to the first drop in the potential signal.
Subsequently the σEPN decreases until achieving a minimum at around 800 minutes. From this
moment, the σEPN remained relatively constant until 2500 min. Then, its evolution becomes
more and more significant until the end of the experiment.
6
fc, cutoff frequency of the digital filter
Cette thèse est accessible à l'adresse : http://theses.insa-lyon.fr/publication/2017LYSEI059/these.pdf © [J. Bolivar], [2017], INSA Lyon, tous droits réservés

Chapter V: Study of crack propagation by Digital Image Correlation analysis
José Bolivar 116
Thèse en Sciences des Matériaux / 2017
Institut national des sciences appliquées de Lyon
Figure V-11. Compilation of AE, EN and DIC data for the CC 04-15 test and representation of the different stages
involved in the propagation of the crack.
Cette thèse est accessible à l'adresse : http://theses.insa-lyon.fr/publication/2017LYSEI059/these.pdf © [J. Bolivar], [2017], INSA Lyon, tous droits réservés

Chapter V: Study of crack propagation by Digital Image Correlation analysis
José Bolivar 117
Thèse en Sciences des Matériaux / 2017
Institut national des sciences appliquées de Lyon
Figure V-12. Standard deviations of the EPN and ECN during the SCC test (CC 04-15), calculated from the PSDs
by using Equation II-17 (4096 points/block). The signal was high-pass filtered before the assessment (fc = 0.05 Hz)
V.2.2 Discussion
This section is devoted to the analysis of the results for the test CC 04-15 which exhibited the
propagation of a single intergranular stress corrosion crack. Table V.1 summarizes the main
results obtained from AE, EN and DIC measurements. It appears that the development of the
crack can be separated into four stages.
The first stage (I) was identified between sample loading (175 min) until 800 min (t1). This
stage corresponds to the incubation and the initiation of the stress corrosion process. The EPN
signal displayed an increasing trend during this period until around 460 min. The increasing
tendency of EPN and the relative constant values of the ECN can be related to the establishment
of a passive state. At 460 min, it seems that something perturbed the passive state, inducing a
drop in the EPN. Yet, the ECN remained constant with a low DC level. This drop could be
related to the rupture of the passive film and to the start of a very shallow Intergranular Attack
(IGA) which does not produce an increase in the DC level of the current record. Later, at 800
minutes (t1), a change in the evolution of the EPN and ECN can be noticed. Henceforth, the
ECN starts to increase sharply, indicating that a significant anodic event is happening. Despite
the detection of a corrosion process at 460 min, the process is very local and cannot be directly
associated to the development of the crack. In contrast, the sharp increase of the ECN at 800
min is followed by a significant decrease of the potential, hence, is very likely to be caused by
the initiation of the crack. Moreover, the defect was localized and detected only 2h later by
DIC measurements.
Cette thèse est accessible à l'adresse : http://theses.insa-lyon.fr/publication/2017LYSEI059/these.pdf © [J. Bolivar], [2017], INSA Lyon, tous droits réservés

Chapter V: Study of crack propagation by Digital Image Correlation analysis
José Bolivar 118
Thèse en Sciences des Matériaux / 2017
Institut national des sciences appliquées de Lyon
Table V.1. Trends of the main parameters associated to the crack evolution in the CC 04-15 test
Stage I II III IV
from t0 until t1
(175 - 800 min)
from t1 until t2
(800 - 2510 min)
from t2 until t3
(2510 - 4050
min)
from t3 until the
end (4050 - 5970
min)
EPN level Present an
inflection point Decreases
Decreases
slightly Increases
ECN level Low and
constant Increases sharply
Relatively
constant Decreases
AE,
Cumulative
Hits
Increases
sharply Increases Increases slightly Increases
AE,
Cumulative
Energy
Increases
sharply Increases Increases slightly Increases sharply
CGR in length N/A Decreases
sharply
Relatively
constant
Relatively
constant
Opening rate N/A Increases
slightly
Significant
increase at the
beginning, then
increases
constantly.
Relatively
constant
KI N/A Increases
slightly Increases N/A
The second stage (II) was defined between 800 and 2510 min (t2) and was attributed to a first
phase in the growth of the crack. At this stage, the initiated defect was observed to propagate
mostly in the surface rather than in depth toward the bulk. The propagation stage was
characterized by an initially high and decreasing CGR (in length) and very small COD whose
values evolved in a constant manner (see Figure V-11). In this phase, the EPN exhibited a
continuous decrease while the ECN increased sharply until achieving a relatively high DC
level. Such trends are characteristic of an anodic process which is becoming more and more
intensive [129], [143], [145], [211]. The intensification could be related to the increase of the
dissolution of metal as the crack grows. Therefore, it can be argued that during this phase, the
propagation process was mostly governed by anodic dissolution. The dissolution processes are
more favored at the sample surface rather that at the maximum penetration of the crack front,
as the small COD might limit the mass transport between the solution and the bottom of the
crack. Then, as the crack length increases, the COD also increases by mechanical effects,
progressively enhancing the exchanges between the bottom of the crack and the solution. Yet,
the crack continues to propagate mostly in surface but with a decreasing CGR as the
propagation inside the material becomes more and more favored.
Furthermore, it was observed the AE record displayed a significant low energy activity for the
period comprised between 460 min and 2510 min (end of stage II). As mentioned above, the
Cette thèse est accessible à l'adresse : http://theses.insa-lyon.fr/publication/2017LYSEI059/these.pdf © [J. Bolivar], [2017], INSA Lyon, tous droits réservés

Chapter V: Study of crack propagation by Digital Image Correlation analysis
José Bolivar 119
Thèse en Sciences des Matériaux / 2017
Institut national des sciences appliquées de Lyon
predominant process involved within this period is anodic dissolution. The latter agrees very
well with the low energy of the AE bursts registered during this phase. A more detailed study
about the characteristic of the AE sources registered during the SCC tests performed during
this work is described in Appendix C. The results of such analysis reveal that the features of
the AE bursts registered during the periods mainly governed by anodic dissolution, do not
present significant differences compared to the AE hits acquired during the loading stage,
which are more related to plasticity processes. The latter suggests that the metal dissolution
does not produce significant AE by itself, but might induce some stress/strain reorganization,
resulting in a very local plastic process which produces some AE. Moreover, it is known that
the advance of the intergranular front sometimes produces the failure of remaining ductile
bridges which are also able to produce AE [129], [138].
The third stage (III) was defined from 2510 min (t2) until 4050 min (t3). During this phase, it
was noted that the crack changed its growth behavior. Despite the sharp increase in the K I
values within this phase, the CGR of the crack tips (in the surface) remains relatively constant
(see Figure V-10 and Figure V-11). Knowing that the sample is subjected to constant load, the
important increase noticed in the K I values should have also induced a considerable increase
of the crack length; yet, the CGR was observed to remain relatively constant. In contrast, the
opening rate displayed a slight acceleration around 2500 min, then, it keeps an increasing
tendency. Such a behavior suggests that the crack continues to propagate similarly along the
entire crack front. It is possible that the elongated defect starts to adopt a shape more favorable
to in-depth propagation from a mechanical point of view such as a semi-circular or a semi-
elliptical. This could explain the remarkable increase of the SIFs and the relative constant CGR
in length. Concerning the propagation mechanism, it can be argued that the crack continues to
propagate under the same mechanism observed during the stage II (anodic dissolution).
Actually, it was noted that the AE cumulative hits curve increases slightly with an equivalent
activity as those registered during the phase II (low energy AE hits). Moreover, the EPN
decreases slightly while the ECN evolves in a relatively constant manner with high anodic
values. Besides, the standard deviation of EPN showed an increasing tendency (see Figure
V-12). This behavior confirms that the defect is active and is becoming larger [181], [183],
[187]
Finally, stage IV was defined from 4050 min (t3) until the end of the test (t4, 5970 min). During
this phase, the AE records displayed a sharply increase in both the cumulative hits and the
cumulative absolute energy. Moreover, the EPN exhibited an increasing trend while t he DC
level of the ECN decreased. Such trends suggest that at 4050 min, the crack front achieves (or
was very close to) the rear surface of the sample. This situation generates a diminution of the
active surface of the crack front as it becomes completely straight. Figure V-13 presents two
pictures belonging to the surface of the sample (front and rear) after the test. It can be observed
that the crack propagated across the plate width of the sample and that the final crack front is
relatively straight. The progressive formation of this shape induced an overloading of the
remaining ligaments, hence, their plastic deformation. Figure V-1 depicts the increase of such
plastic deformation at the crack tips between 4300 and 5970 min. Such phenomena could be
the origin of the very energetic AE bursts registered within this phase. The characteristic s of
the AE hits detected during this period were analyzed in detail in Appendix C. The results of
the analysis established that the AE hits acquired during this stage are strongly related to a
Cette thèse est accessible à l'adresse : http://theses.insa-lyon.fr/publication/2017LYSEI059/these.pdf © [J. Bolivar], [2017], INSA Lyon, tous droits réservés

Chapter V: Study of crack propagation by Digital Image Correlation analysis
José Bolivar 120
Thèse en Sciences des Matériaux / 2017
Institut national des sciences appliquées de Lyon
deformation mechanism characteristic of the propagation of a macro crack. Finally, despite that
the crack front completely crossed the width of the sample and that significant plastic
deformation occurred on the crack tips, it can be argued the crack continue to propagate. This
is confirmed by the relatively constant CGR in surface and by the high levels of the standard
deviation of the EPN (see Figure V-12).
Figure V-13. Pictures of the sample surfaces after the test. The crack crosses the whole width of the specimen
V.2.3 Synopsis
This section described the propagation steps of a single intergranular stress corrosion crack.
The development of the IG-SCC process was monitored by simultaneous AE, EN and DIC
measurements. The correlations between the different measurement techniques allowed
monitoring the initiation and the propagation of the defect. Crack initiation was detected
through a decrease of the EPN and a remarkable increase of the DC level of the ECN. The
initiation of the crack was confirmed shortly later by DIC measurements. The propagation of
the crack caused both a gradual decrease of the measured potential and a raise of the standard
deviation of the EPN signal.
Moreover, the correlation between several parameters permits the description of the
propagation of the crack according to several stages. After crack initiation (stage I), DIC
measurements showed that the stress corrosion crack propagates mostly in surface rather than
inside the material (stage II). The crack aspect consisted in a very long defect with a small
COD. The surface propagation is believed to be promoted by the small COD which might
complicate the access of the solution to the bottom of the defect and limit in-depth dissolution.
During the second phase of propagation (stage III), it was observed that the crack propagates
in both direction. It is believed that during this stage the crack starts to adopt a more stable
shape. Hence, the crack starts to grow presumably with a preference towards the depth. Finally,
during the last stage the defect becomes deep enough so that it achieves the rear side of the
sample. The latter confirmed the in-depth propagation presumed during stage III.
Finally, correlation between EN and AE measurements suggest that the governing crack
advance mechanism is anodic dissolution.
Cette thèse est accessible à l'adresse : http://theses.insa-lyon.fr/publication/2017LYSEI059/these.pdf © [J. Bolivar], [2017], INSA Lyon, tous droits réservés

Chapter V: Study of crack propagation by Digital Image Correlation analysis
José Bolivar 121
Thèse en Sciences des Matériaux / 2017
Institut national des sciences appliquées de Lyon
V.3 Description of the propagation behavior of
a colony of stress corrosion cracks
The present section is devoted to the study of the growth of a dense cracks colony. Several
SCC tests were performed on MAS Alloy 600 LTS samples in an acidic solution of 0.01 M
potassium tetrathionate at pH 3.0. All the experiments were conducted under constant load
at 80 % of the yield stress. As mentioned in Chapter IV, these experimental conditions
promote the initiation and propagation of numerous intergranular cracks as a colony.
The experiments were monitored by DIC, AE and EN measurements. The tests were
prepared as described in Sections III.2.6 and III.2.7.2. The prepared samples were immersed
in the test solution before being loaded. This period is defined as the "pre -immersion time"
and was comprised between 1 and 24 hours. After accomplishing this stage, the samples
were loaded until achieving the targeted stress. Subsequently, the experiments were
conducted until rupture or until the crack colony was significantly developed. The following
section will firstly detail the results of these tests and then a general discussion will be
presented.
V.3.1 Presentation of the results
V.3.1.1 General behavior of the crack colony
Table V.2 gathers the main results of all the tests performed under the experimental
conditions mentioned above. This table indicates the period of pre-immersion, the time for
crack initiation (ta), the maximal crack density and the time to achieve it ( tb). For all the
tests, the zero time was defined as the moment when the samples were loaded. As it can be
noticed, the pre-immersion time was not constant and varied for each test. The time of crack
initiation (ta) seems to be influenced by the duration of this previous immersion stage. After
4 hours of pre-immersion, the crack initiation time decreases as the pre-immersion time
increases. Yet, the evolution of the crack colony remains equivalent for all the tests. It is
characterized by the development of multiple cracks by IG-SCC with short incubation
periods and high crack densities. For the presentation of further analysis, only the CC 03 -
15 experiment is detailed next. It exhibits features representative of the four tests.
Figure V-14 depicts the evolution of the crack density for the CC 03-15 test together with
the stress and strain measurements. It can be observed that once the stress of interest is
reached (210 MPa), the mean strain (obtained by DIC) remains very low (0.1 %). Soon
after, a sudden increase appears at 378 min (ta) which coincides with the time when the first
surface crack is detected; hence, this time is considered as the moment when first cracks
initiate. Subsequently, crack density increases and a multiple cracking regime is
established. On the other hand, the crack density evolution shows an increase with a slope
Cette thèse est accessible à l'adresse : http://theses.insa-lyon.fr/publication/2017LYSEI059/these.pdf © [J. Bolivar], [2017], INSA Lyon, tous droits réservés

Chapter V: Study of crack propagation by Digital Image Correlation analysis
José Bolivar 122
Thèse en Sciences des Matériaux / 2017
Institut national des sciences appliquées de Lyon
m (see Table V.2) until a maximum at time tb is reached. Then, the behavior changes and
crack density decreases by crack coalescences.
Table V.2. Crack density values and characteristic times for constant load tests conducted in a 0.01M
potassium tetrathionate solution at pH 3.0 with different pre-immersion times
ID test
Immersion
time before
loading (h)
Crack
initiation
(ta, min)
Maximal
crack density
(𝐜𝐫𝐚𝐜𝐤𝐬
𝐜𝐦𝟐 )
tb
(min) m (
𝒄𝒓𝒂𝒄𝒌𝒔
𝒎𝒊𝒏∗𝒄𝒎𝟐)
CC 02-15 4 493 232 763 1.36
CC 03-15 1 378 240 830 1.37
CC 01-15 5 187 307 712 1.43
CC 05-15 24 71 169 391 1.45
Figure V-14. Crack density and strain evolution during the SCC test CC 03-15
V.3.1.2 Crack colony morphology
Figure V-15 presents selected images captured either by the digital imaging system or by
post-mortem SEM analysis. The micrographs illustrate the characteristics of the obtained
crack colonies. Figure V-15.a was obtained at the final stage of the test and shows the
morphology of the crack colony. It can be observed that several cracks exhibit highly brittle
characteristics associated with an intergranular path. The fractography presented in Figure
V-15.b confirms the intergranular nature of the fracture (see Figure V-15.c). Moreover, the
high density of the cracks and the reduced spacing favored crack tip singularity interactions
during their growth. An example can be seen in Figure V-15.c, where some cracks coalesce
Cette thèse est accessible à l'adresse : http://theses.insa-lyon.fr/publication/2017LYSEI059/these.pdf © [J. Bolivar], [2017], INSA Lyon, tous droits réservés

Chapter V: Study of crack propagation by Digital Image Correlation analysis
José Bolivar 123
Thèse en Sciences des Matériaux / 2017
Institut national des sciences appliquées de Lyon
while others reveal crack tip kinking. As noticed, the visual aspect of the obtained cracks
remains consistent with the previous experiments discussed in Chapter IV (Section IV.2.2).
Figure V-15. Typical morphology of the crack colonies obtained. a) CCD image of the sample surface at the
end of an interrupted test at 1130 min. b) SEM fractography and c) SEM image of the sample surface
V.3.1.3 Crack detection
The procedure used for the detection of the cracks is described in Section III.3.1.2. The
identification of the cracks was achieved by detecting the displacement jumps originated
by the initiation and opening of cracks. This methodology allowed detect ing defects that
propagated along a very narrow path with an opening displacement that remains in the order
of a hundred of nanometers. The detection limits for the crack identification were 55 µm in
length and 0.45 µm in opening. The former limitation is due to the size of the elements used
for DIC assessment (16 px × 16 px) and the latter is associated to the accuracy of the
measurements, mainly related to noise (e.g liquid convection, speckle pattern quality, etc.).
Figure V-16 shows some optical images obtained during the SCC test with their respective
post-DIC assessments. At 630 min (see Figure V-16.a), the DIC analysis reveals the
presence of few cracks at an initiating stage while it remains almost impossible to detect
them by more classical optical methods. This difficulty is also encountered when the crack
colony reaches the maximal crack density (at tb see Figure V-16.b). Figure V-16.c
represents a CCD picture taken at 1130 min where a few cracks start to present a
predominant macro individual behavior, able to conduct to the fast rupture of the sample.
This is related to the final phase of the crack colony growth and is not within the framework
of this study.
Cette thèse est accessible à l'adresse : http://theses.insa-lyon.fr/publication/2017LYSEI059/these.pdf © [J. Bolivar], [2017], INSA Lyon, tous droits réservés

Chapter V: Study of crack propagation by Digital Image Correlation analysis
José Bolivar 124
Thèse en Sciences des Matériaux / 2017
Institut national des sciences appliquées de Lyon
Figure V-16. DIC analysis after a SCC test conducted at constant load (CC 03-15): CCD images and filtered
displacement field including crack labelling. a) at 630 min; b) at 830 min (time t b) and c) at 1130 min.
V.3.1.4 DIC results: evolution of the crack colony
Each crack detected at time ti was labelled. Labels were gradually incremented when new
cracks were detected (Figure V-17). When two cracks coalesce the resulting crack keeps
the lowest label value (i.e. the one of the first detected crack). In this manner, this
methodology allows following the development of each crack (extraction of crack
parameters) and classifying the crack populations.
The crack populations were classified according to the different dynamic states which were
defined as active, dormant and initiating cracks. A crack is called active at a time ti when
its length and/or its opening has increased between times ti-1 and ti (ti – ti-1 corresponds to
the interval of time between 2 successive images (i-1) and (i) analyzed by DIC). A crack is
called dormant at a time ti when its length and its opening have not increased between times
ti-1 and ti. Indeed, LEFM indicates that if no variation in both the opening or in the length
is observed, the crack depth remains also constant. If a new crack initiates between ti-1 and
ti, it is counted as a new initiation event at ti, but it is not yet considered as active. If its
length and/or its opening vary between t i and ti+1, it will be considered as active at ti+1. One
example is schematized in Figure V-17. In this example cracks 1 and 2 coalesce and give
crack 1 at time ti; crack 1 is then classified as active at time ti. Crack 3 exhibits the same
length and opening as at time ti-1, therefore it is considered as a dormant crack. Finally,
crack 4 is detected at time ti and is associated to an initiation.
Cette thèse est accessible à l'adresse : http://theses.insa-lyon.fr/publication/2017LYSEI059/these.pdf © [J. Bolivar], [2017], INSA Lyon, tous droits réservés

Chapter V: Study of crack propagation by Digital Image Correlation analysis
José Bolivar 125
Thèse en Sciences des Matériaux / 2017
Institut national des sciences appliquées de Lyon
Figure V-17. Diagram showing the classification of the dynamic states of cracks at a time t i
For the considered test (CC 03-15), a total of 307 cracks were labelled all along the test
(see Table V.3). At the end of the test 65 cracks were still present, which means that 242
coalescences occurred. At time tb (see Figure V-16.b), the number of cracks was maximum
and equal to 103.
Table V.3. Number of cracks at the maximum of crack density (tb) and at the end of the test
At time tb (830 min) At the end of the test
(1130 min)
# Total
number of
cracks in
ROI
Cracks
(#)
Density of cracks
(#/cm2)
Cracks
(#)
Density of
cracks (#/cm2)
Total number of
coalescences
307 103 240 65 140 242
For each step of image treatment, the mean crack length, mean crack opening and
coalescence events were obtained. The evolution of these parameters is presented in Figure
V-18. Both mean crack length and mean crack opening exhibit a continuous increase from
time ta all along the test, with an acceleration at about 700 min. On the other hand, the
number of coalescence events starts to increase at 658 min (tc), then remains globally
constant after time tb corresponding to the maximum crack density detection (see Table
V.3). The graph also includes the mean Crack Grow Rate (CGR) of the active cracks without
taking into account cracks participating in coalescence events. The mean CGR shows a
minor increase from ta until tc, then, it remains almost constant between tc and tb. Finally,
it displays a slight decrease from tb until the end of the test.
Cette thèse est accessible à l'adresse : http://theses.insa-lyon.fr/publication/2017LYSEI059/these.pdf © [J. Bolivar], [2017], INSA Lyon, tous droits réservés

Chapter V: Study of crack propagation by Digital Image Correlation analysis
José Bolivar 126
Thèse en Sciences des Matériaux / 2017
Institut national des sciences appliquées de Lyon
Figure V-18. Evolution of the coalescence events, the mean length, the mean opening and the mean crack
growth rate (without taking into account coalescence of cracks) for CC 03 -15 SCC test
Figure V-20 plots the distribution of each kind of crack (active, dormant and initiation)
during the whole SCC test. It can be noted that the active cracks are majority throughout
the test, followed by the dormant cracks and the number of cracks that initiate at eac h step.
The total number of cracks at time ti is the sum of the active, dormant and newly initiated
crack numbers; the active crack number includes the coalescence events.
From these observations, it can be assessed that between times ta and tc the global number
of cracks increases due to the increase of newly initiated cracks and the absence of
coalescence events (see Figure V-18). In this first part of colony life, both active and
dormant cracks follow the same increasing evolution. From time tc, the population of active
cracks becomes predominant, whereas dormant and newly initiated cracks continue to
increase. At the same time, the number of coalescence events sharply increases ( see Figure
V-18). At time near to tb, the coalescence kinetic slows down together with the number of
initiation events. However, as the number of coalescence events remains higher than the
number of initiation events, the global crack density decreases.
In order to help interpretation, an aspect ratio η was calculated. It consists of the ratio of
the depth d to the half-length 𝑐 of each crack (see Equation V-1 and Figure V-19). The η
factor aims to describe the evolution in time of the crack shape and also the impact of the
intensification of interactions on crack propagation. The η factor was obtained for each
crack by resolving Equation V-3, which derives from Equation V-2. The terms σ, υ and E
represent the loading stress, Poisson’s ratio and the Young’s modulus of the material
respectively. Equation V-2 was proposed by Hack [212] and estimates the opening a of a
Cette thèse est accessible à l'adresse : http://theses.insa-lyon.fr/publication/2017LYSEI059/these.pdf © [J. Bolivar], [2017], INSA Lyon, tous droits réservés

Chapter V: Study of crack propagation by Digital Image Correlation analysis
José Bolivar 127
Thèse en Sciences des Matériaux / 2017
Institut national des sciences appliquées de Lyon
crack by using a closed linear elastic crack-tip solution for a semi-elliptical crack in a finite
plate under tension. As such, a decreasing η is an indication of surface propagation, while
an increasing η is the indication of a crack propagating mostly in depth.
Figure V-19. Description of crack parameters
𝜂 =𝑑
𝑐 Equation V-1
𝑎 = 4√2(1 − 𝜐2)(𝜎𝑑
𝐸)(1 + 0.12 (1 −
𝑑
𝑐) (√1 − 0.619
𝑑
𝑐) Equation V-2
𝑎
𝑐− (
𝑑
𝑐) [4√2(1 − 𝜐2)(
𝜎
𝐸)(1 + 0.12 (1 −
𝑑
𝑐) (√1 − 0.619
𝑑
𝑐)] = 0 Equation V-3
Figure V-20. Distribution of crack populations during the SCC test
Cette thèse est accessible à l'adresse : http://theses.insa-lyon.fr/publication/2017LYSEI059/these.pdf © [J. Bolivar], [2017], INSA Lyon, tous droits réservés

Chapter V: Study of crack propagation by Digital Image Correlation analysis
José Bolivar 128
Thèse en Sciences des Matériaux / 2017
Institut national des sciences appliquées de Lyon
Figure V-21 presents the evolution of the mean aspect ratio η, the crack density and a
growing indicator called Global Crack Colony Growth Rate (GCCGR). The GCCGR is
defined as the variation of the cumulate crack lengths in the colony for a step over the time
(ti – ti-1). It may be noted that η exhibits 2 stages, suggesting two different regimes of
propagation. One from ta to tb where cracks tend to propagate more on the surface than in
depth. Then, around tb, there is an inflection point in both curves (η and GCCGR). The
decrease in the GCCGR and the increase in η suggest that cracks tend to grow more in depth
than on the surface.
Figure V-21. Evolution of the aspect ratio η, crack density and global crack growth through the SCC test.
V.3.1.5 Complementary AE and EN results
Figure V-22 gathers AE, DIC and EN results. The active cracks population obtained by DIC
is included in the graph. The acoustic emission activity is represented by signal amplitude,
each point corresponding to a registered acoustic event. It can be seen that the majority of
acoustic activity is detected during the very first part of the test corresponding to the
dynamic loading of the specimen, and increase again after 900 min of test. The reader can
refer to Appendix C where the characterization of the AE sources associated to the
propagation of the colony is detailed.
Moreover, the mean Electrochemical Potential Noise (EPN) and mean Electrochemical
Current Noise (ECN) coming from EN measurements are also plotted. They were calculated
using blocks of 512 points. The mean EPN displays a continuous drop accompanied by high
levels in the DC part of the mean ECN which indicates that anodic reactions are occurring
at the Working Electrode (WE). Then stagnation of the EPN is observed at a time when the
number of active cracks begins to decrease.
Cette thèse est accessible à l'adresse : http://theses.insa-lyon.fr/publication/2017LYSEI059/these.pdf © [J. Bolivar], [2017], INSA Lyon, tous droits réservés

Chapter V: Study of crack propagation by Digital Image Correlation analysis
José Bolivar 129
Thèse en Sciences des Matériaux / 2017
Institut national des sciences appliquées de Lyon
Figure V-22. Compilation of AE, EN and DIC data for the CC 03-15 test.
V.3.2 Discussion
The experimental methodology implemented in this study enabled to initiate and develop a
crack colony exhibiting different features of interactions such as coalescence, dormancy
and shielding. Several tests were performed under identical experimental conditions but
with different immersion times before loading. For periods longer than 4 hours of pre-
immersion, a decrease in the crack initiation time was noted when the duration of pre -
immersion time was increased (see Table V.2). Indeed, the Alloy 600 is known to suffer an
Intergranular Attack (IGA) in polythionate acidic solutions for concentrations up to 0.01 M
[75]. Thereby, it can be assumed that for pre-immersion time longer than 4 hours, the IGA
is deep enough to initiate stress corrosion cracks once a stress is applied. Initiation time is
therefore reduced when the pre-immersion time is longer.
For all the tests undertaken, the crack density exhibits a maximum (see Table V.2 and
Figure V-14). The existence of this maximum (at time tb) indicates that the competition
between initiations contributing to the increase in crack density, and coalescences
contributing to its decrease, is dominated by coalescences. In the case of the 24 h pre-
immersed sample, the maximal crack density value is the smallest. This result is in
agreement with the fact that a longer pre-immersion time induces a more extensive IGA
[79]. When the load is applied, more numerous and longer cracks quickly initiate compared
to an experiment where initiated cracks are smaller and fewer due to a weaker extension of
IGA. Yet, the relaxation zone generated by the emergence of a crack lead to a shielding
effect and crack initiation is inhibited inside this zone (see Figure V-23), whose extent is
Cette thèse est accessible à l'adresse : http://theses.insa-lyon.fr/publication/2017LYSEI059/these.pdf © [J. Bolivar], [2017], INSA Lyon, tous droits réservés

Chapter V: Study of crack propagation by Digital Image Correlation analysis
José Bolivar 130
Thèse en Sciences des Matériaux / 2017
Institut national des sciences appliquées de Lyon
proportional to the initiated crack length [64]. Consequently, when the pre-immersion time
increases, there are more cracks in the very first stages, and, as they are also longer due to
the extent of IGA, further initiations are inhibited and coalescences are promoted.
Maximum crack density is therefore lowered at the end. Despite these differences, the
overall behavior of the crack colony remains the same regardless of the duration of pre -
immersion before loading. The latter is confirmed by the global evolution in crack density
with similar values of the slope m (see Table V.3) representing the global kinetic evolution
of the crack colony.
Figure V-23. Diagram of the stress relaxation zone produced by the apparition o f a crack in the first stages
according to different durations of pre-immersion
Table V.4 summarizes the principal crack colony parameters obtained for the CC 03-15
test, presented in Section V.3.1. According to the results, the development of the crack
colony can be separated into three stages.
In the first stage (I) of the test (period ranged between ta and tc) it is observed that the
majority of cracks are active (see Figure V-20 and Table V.4). Moreover, the mean CGR
(see Figure V-18 and Table V.4) also exhibits an increasing trend which proves that the
propagating cracks are not influenced by their environment. In addition, EN measurements
confirm the high activity of the surface with a continuous decrease in EPN values while the
ECN DC-level remains high (see Figure V-22). Furthermore, AE measurements display a
low acoustic emission activity (see Figure V-22). The low AE level suggests once again the
occurrence of a significant dissolution process localized at grain boundaries . Indeed, it is
known that such electrochemical processes hardly release enough energy to be detected
[137], [213]. Regarding the evolution of the aspect ratio η (see Figure V-21), a decrease is
observed in this first stage of the test (between ta and tc) showing that cracks tend to
propagate on the surface rather than into the bulk. Such behavior is different from crack
propagation under mechanical load only. In the latter case, cracks with a smaller aspect
Cette thèse est accessible à l'adresse : http://theses.insa-lyon.fr/publication/2017LYSEI059/these.pdf © [J. Bolivar], [2017], INSA Lyon, tous droits réservés

Chapter V: Study of crack propagation by Digital Image Correlation analysis
José Bolivar 131
Thèse en Sciences des Matériaux / 2017
Institut national des sciences appliquées de Lyon
ratio propagate in depth rather than on the surface from their first steps of development
[64]. All of the above suggests that cracks initiate by IGA and start to grow as isolated
cracks. Corrosion seems to play quite a large role in the propagation process, as was noted
by the EN signals and by the low acoustic emission activity.
Table V.4. Trend of the main parameters for crack colony evolution in the CC 03-15 test
Stage
I II III
from ta until tc
(378 - 658 min)
from tc until tb
(658 - 830 min)
from tb until the
end
(830 - 1130 min)
Crack density Increases Increases
sharply Decreases
Initiation
kinetic
Low and
constant Increases Low and constant
Active crack
population + +++ ++
Mean CGR* Slight increase Constant Slight decrease
Coalescence
kinetic No coalescence
Increases
sharply Constant
EPN level Decreases Decreases
sharply Constant
ECN level High with a
slight diminution
High with a
slight diminution Decreases
AE activity Weak Weak Strong
η Decreases Decreases Increases
GCCGR Increases Increases
sharply Constant
*mean CGR does not take into account merging cracks
During the second stage (II) of the crack colony propagation (between times tc and tb),
active cracks are dominant, compared to dormant and initiation populations (see Figure
V-20). The mean EPN displays a strong decrease while the mean ECN and AE activity
evolve as in the first stage (see Table V.4). In addition, Figure V-18 shows that several
coalescence events start to occur while the mean CGR, which excludes the effects of
coalescences, remains constant. Such evolution reveal that the majority of cracks in the
colony are no more propagating as isolated ones. On the contrary, interactions start to
Cette thèse est accessible à l'adresse : http://theses.insa-lyon.fr/publication/2017LYSEI059/these.pdf © [J. Bolivar], [2017], INSA Lyon, tous droits réservés

Chapter V: Study of crack propagation by Digital Image Correlation analysis
José Bolivar 132
Thèse en Sciences des Matériaux / 2017
Institut national des sciences appliquées de Lyon
influence the global behavior of the colony. Such interactions include coalescences but also
shielding effects. The decrease in the initiation kinetic close to time tb (see Figure V-20) is
a consequence of the shielding effect between cracks. As mentioned before, such a shielding
effect is due to the emergence of the relaxation zone around the crack flanks. The
superposition of the different relaxation zones, coming from the propagation of multiple
cracks, induces a general de-stressing of the surface which also decreases the crack driving
force (see Figure V-23). The probability for a new crack to be initiated in such systems is
highly dependent on the local stress which plays an important part in the rupture of the
passive film. Stress relaxation decreases the probability of cracks initiating, hence the start
of coalescences being more regular than initiations and the crack density finally decreases
(see Figure V-20) as already demonstrated by Kamaya et al. [64]. The shape factor η
continues to decrease, showing that cracks are still propagating more on the surface rather
than in depth (see Figure V-21). As in stage I, corrosion is highly implicated in the
propagation mechanism. Yet, even if some cracks start to feel the consequences of
interactions, such interactions barely influence the development of the colony.
In the last stage (III), defined from tb until the end of the test, active cracks continue to
dominate the population but have now a tendency to decrease (crack density also decreases).
This decreasing trend is also encountered in the ECN signal and can be related to the
propagation of active cracks. At this stage, there are fewer propagating active cracks.
Therefore, the variations in the crack front of active cracks become less intensive and the
amount of metal dissolution also decreases, which may induce a decrease in the DC level
of current. On the other hand, EPN shows also a drop in the first part and then stabilizes at
around -195 mV/SCE (see Figure V-22). Stabilization could be attributed to the propagation
of few dominant cracks where a continuous bare metal surface at the crack tip is being
generated. Regarding AE activity, acoustic bursts start to be detected in quantity some
minutes after time tb. Such activity seems to be related to the intensification of interactions
which is expected to produce more confined plastic deformation on the approaching crack
tips. The effects of shielding on the surface are confirmed by the decrease in the average
CGR from tb (see Figure V-18). Coalescences also become less intensive, but are still
effective. In addition, the aspect ratio η displays a change in its evolution around tb,
implying that cracks start to grow more in volume than in surface. Such behavior can
explain why the coalescence rate slows down too; it is thought that at around tb, the
shielding effect between cracks is enough to prevent crack propagation at the surface, and
therefore enhances crack propagation in the depth direction.
Taking into consideration all of the above, both AE and EN measurements suggest a
propagation mechanism of cracks by the continuous anodic dissolution of the crack front.
This dissolution process greatly decreases the fracture toughness of the material and
promotes continuous crack propagation. The crack front tip becomes weak enough to be
fractured by stress without any important plastic deformation. Therefore, no significant AE
activity is detected and cracks grow in surface with shallow features. The influence of
Cette thèse est accessible à l'adresse : http://theses.insa-lyon.fr/publication/2017LYSEI059/these.pdf © [J. Bolivar], [2017], INSA Lyon, tous droits réservés

Chapter V: Study of crack propagation by Digital Image Correlation analysis
José Bolivar 133
Thèse en Sciences des Matériaux / 2017
Institut national des sciences appliquées de Lyon
interactions starts to have effects on the global behavior of the colony at around 800
minutes. At this time, cracks start to display a tendency to grow in depth; interactions take
control of colony growth and the shielding effect between cracks starts to produce plastic
deformation at the crack tip. The increases in local deformation and the coalescence events,
both contributing to crack growth, is thought to explain the increase in AE activity.
V.3.3 Synopsis
The development of a dense crack colony was studied by complementary DIC, EN and AE
measurement. The colony was composed by several intergranular cracks having a brittle
aspect.
An in-house data treatment routine was specially developed for the identification,
classification and monitoring of cracks. Cracks exceeding 55 µm and opened more than
0.45 µm could be detected. In addition, the crack population was classified into initiating,
active and dormant cracks. The evolution, with time, of each population was obtained.
Crack interactions such as coalescence and shielding were also registered.
Correlations between DIC, EN and AE results enabled to sort crack colony propagation into
3 stages. The lack of acoustic emission accompanied by high levels of current (DC part) in
the first part of the test, suggest that active dissolution and lack of re -passivation are
responsible for crack advance, which remains at the surface and involves very few
interactions. In the second stage, interactions between cracks (coalescence + shielding)
begin to occur but do not modify the general behavior of the colony, whose growth remains
mainly governed by active anodic dissolution. Finally, the intensification of interactions
leads to a decrease in the number of active cracks and the crack growth rate. The defects
shields to each other, which favor the propagation of the cracks within the bulk; where the
shielding effect is less effective and where probably the stress intensity factors are higher.
V.4 Validation by in-situ X-ray tomography
and Digital Volume Correlation
The crack propagation is a three-dimensional process, whose rates that can vary along the
crack front. Depending on the circumstances, the cracks can either propagate preferentially
in the surface, primarily in-depth or at the same rate in both directions. The variations in
the propagation rate relative to the direction can be related to mechanical (residual stresses,
local stress and deformations) [45], [214], microstructural (precipitates, second phases,
grain size, crystallography) [215] and electrochemical (ohmic drop, mass transport,
conductivity) [216], [18], [25] factors. Characterizing the propagation of a crack into all
the directions is therefore of prime importance in a context of lifetime predictions.
Until now, the characterization of the multiple crack propagation in surface was performed
by direct 2D measurements (2D-DIC), allowing the identification of the periods of activity
Cette thèse est accessible à l'adresse : http://theses.insa-lyon.fr/publication/2017LYSEI059/these.pdf © [J. Bolivar], [2017], INSA Lyon, tous droits réservés

Chapter V: Study of crack propagation by Digital Image Correlation analysis
José Bolivar 134
Thèse en Sciences des Matériaux / 2017
Institut national des sciences appliquées de Lyon
and dormancy of cracks, as well as assessing crack growth rates. In contrast, the
characterization of the propagation of cracks inside the material was only evaluated by
indirect measurements such as crack opening, acoustic emission activity, and
electrochemical noise records. This methodology has allowed identifying several steps in
the crack growth for both of a single crack and a colony of cracks. The results suggest that
the cracks grow predominantly on the surface rather than in-depth in a first stage, with a
significant contribution of dissolution processes in the propagation mechanism.
Subsequently, a second stage involves a crack growth preferentially oriented towards the
bulk of the material. This behavior was observed for both single cracks and actives cracks
in a colony. In both cases, the causes were attributed to local mechanical effects (stre ss
concentration and crack shielding).
However, the shape under which the cracks propagate remains so far unknown. Accessing
to this information should allow (i) validating the results obtained from bi-dimensional data
(2D-DIC), (ii) estimating 3D SIF-values from 2D measurements7 (2D-DIC) and (iii)
validating the numerical results of a future numerical model (with 3D experimental data).
An innovative experimental technique enabling the measurement of 3D geometry of cracks
consists in X-ray computed tomography [218]. This technique provides directly and in a
non-destructive way three-dimensional (3D) images of the interior of optically opaque
materials. Performing tomography scans under synchrotron radiation moreover allows
obtaining very high-quality images with short acquisition times [219], because synchrotron
source provides X-ray beams with higher flux and coherence than laboratory tomographs.
Besides, synchrotron tomography enables to work with phase contrast (electron density
related). The presence of phase contrast enhances the quality of the images of heterogeneous
materials, showing phases with very similar attenuation coefficients (absorption contrast)
[220]. In addition, it also improves the imaging of cracks with a sub-voxel opening [221],
[222]. Finally, if a material presents a microstructure providing a phase contrast that can be
used as natural markers, the obtained images can be used for Digital volume Correlation
(3D-DIC) analysis [223].
In this context, two in-situ SCC experiments were performed under X-ray high-resolution
tomography (synchrotron radiation). The experiments were performed on Psiche beamline
at synchrotron SOLEIL8. The main objective of such experiments was to obtain 3D
information of the cracking process, e.g. the shape and the dimensions of cracks. The
overview of this section is as follows. A first subsection will be devoted to the description
of the performed experiments as well as the obtained results. After this, a whole subsection
7
If the crack shape is known, 3D SIF-values can be obtained from 2D measurements using analytical
formulas (e.g. Raju and Newman relations [217])
8 Beam time awarded by synchrotron SOLEIL on the Psiche beamline (20140951 and 20150856
accepted proposals)
Cette thèse est accessible à l'adresse : http://theses.insa-lyon.fr/publication/2017LYSEI059/these.pdf © [J. Bolivar], [2017], INSA Lyon, tous droits réservés

Chapter V: Study of crack propagation by Digital Image Correlation analysis
José Bolivar 135
Thèse en Sciences des Matériaux / 2017
Institut national des sciences appliquées de Lyon
will be devoted to a general discussion considering the previously detailed results. Finally,
this section will close with a synopsis containing the main conclusions.
V.4.1 Presentation of the results
V.4.1.1 Description of the in-situ experiments performed on the Psiche beamline
(synchrotron SOLEIL)
The samples used for the in-situ experiments consisted in Small Tensile Samples (STS)
made of Alloy 600 in a MAS condition. The composition of the test solution remained
unchanged (0.01 M of potassium tetrathionate). The description of the sample preparation
and the experimental procedure is detailed in Section III.2.9. The samples were immersed
in the solution one hour before the loading started. SCC was obtained under free corroding
conditions. It was necessary to stop the crack growth during the scans, so a cathodic
potential was periodically applied to the tensile specimens ( -0.30 V/SCE). Once the
scanning period finished, the sample was returned to Open Circuit Potential (OCP) for 30
minutes, then a new scan was performed and so on.
Table V.5 summarizes the experimental conditions adopted for each test. It can be noted
that the test S_I_600_01 was performed at pH 3.0 while the tests S_I_600_02 was carried
out at pH 4.0. It is important to highlight that the experimental conditions for these
experiments were slightly different from those of the tests performed on large samples
(LTS). For the present tests, the samples were subjected to pseudo-constant load at higher
stresses than those used in the traditional experiments (LTS specimens). The macroscopic
plastic domain was reached, with loads greater than 1.2 times the yield stress. Due to the
limited access to synchrotron facilities, it was expected that higher load decreases the time
for the development of the cracking process and the duration of the tests.
Table V.5. Experimental conditions for in-situ SCC tests performed at synchrotron SOLEIL: MAS Alloy 600
tested in a 0.01 M potassium tetrathionate solution at different pH
Test ID pH
Polarization
potential for the
active stage
(mV/SCE)
Polarization
potential during
the scan (mV/SCE)
Test
duration
(h)
Stress (MPa) Scans
(#)
S_I_600_01 3.0
OCP
-300 6.3
1,10 σy (initial)
9 for 30 min
and increased
until 1,40 σy
S_I_600_02 4.0
OCP
-300 14.2
1,20 σy (initial)
16 for 30 min
and increased
until 1,40 σy
Cette thèse est accessible à l'adresse : http://theses.insa-lyon.fr/publication/2017LYSEI059/these.pdf © [J. Bolivar], [2017], INSA Lyon, tous droits réservés

Chapter V: Study of crack propagation by Digital Image Correlation analysis
José Bolivar 136
Thèse en Sciences des Matériaux / 2017
Institut national des sciences appliquées de Lyon
V.4.1.1.1 Experiment S_I_600_01
This experiment lasted 6.3 hours, during which 9 scans were performed. Figure V-24
depicts the evolution of the stress and the potential during the test. It can be appreciated
that the potential displays a continuous drop during the pre-immersion stage. At the moment
of loading, the potential falls drastically; then it continues to decrease as the test goes on.
The initial stress was set at 1.10 σy. However, the in-situ tensile machine is not able to keep
constant load and the force relaxed. Hence, the load had to be activated and deactivated
manually in order to keep a constant stress level.
Figure V-25 gathers the reconstructed tomography slices corresponding to the surface of
the sample. It can be appreciated that immediately after loading (at 7 min of test), the
surface of the sample exhibits the presence of crack initiations. It can be deduced that the
corrosion process was already activated during the pre-immersion of the specimen, which
could explain why the potential was decreasing from the beginning of the test. Moreover,
it can be observed that during the period comprised between 7 min and 160 min , the cracks
display a remarkable variation in length (on the sample surface). This observation is clearer
within the period comprised between 7 and 115 min of test; within this range, the stress
remains unchanged, allowing to disregard the effect of an increasing load. For the rest of
the test (between 270 min and 360 min of test), negligible crack growth is observed over
the sample surface, regardless the increase of the stress. Only a overall increase in the crack
openings is noticed.
Moreover, Figure V-26 gathers the projection of all X-Y slices according to the Z-
direction9. In this kind of representation, all the slices belonging to the volume are projected
into the plane of interest (here X-Y). This mode of representation allows observing the
extension of the crack propagation inside the material. It can be noticed that during the first
period (7 – 115 min), the defects remain very shallow. Then, increasing the load from 1.10
σy to 1.20 σy, induces a significant variation in the depth of the cracks followed by crack
arrest afterwards (160 – 215 min). This is the reason why the load was stepwise increased,
in order to promote crack propagation and limit the test duration.
9
Note that for the experiments performed under X-ray tomography, the Z-axis corresponds to the
loading direction
Cette thèse est accessible à l'adresse : http://theses.insa-lyon.fr/publication/2017LYSEI059/these.pdf © [J. Bolivar], [2017], INSA Lyon, tous droits réservés

Chapter V: Study of crack propagation by Digital Image Correlation analysis
José Bolivar 137
Thèse en Sciences des Matériaux / 2017
Institut national des sciences appliquées de Lyon
Figure V-24. Description of the S_I_600_01 test (MAS Alloy 600 immersed in a 0.01 M K2S4O6 solution at pH
3.0)
Figure V-25. Reconstructed X-ray tomography slices for the test S_I_600_01: plane Z-X
Cette thèse est accessible à l'adresse : http://theses.insa-lyon.fr/publication/2017LYSEI059/these.pdf © [J. Bolivar], [2017], INSA Lyon, tous droits réservés

Chapter V: Study of crack propagation by Digital Image Correlation analysis
José Bolivar 138
Thèse en Sciences des Matériaux / 2017
Institut national des sciences appliquées de Lyon
Figure V-26. Projection of all X-Y slices according to the Z-direction for different times (test S_I_600_01)
V.4.1.1.2 Experiment S_I_600_02
This experiment was aimed at studying the propagation of a single crack. For this, a
prismatic notch was machined out by Focused Ion Beam milling in the center the gauge
length. The notch had a prismatic shape with dimensions of 200 µm in length (X-axis), 50
µm of depth (Y-axis) and 10 µm in width (see Figure III-11 in Chapter III). The test was
performed at pH 4.0. These conditions were expected to favor the propagation of a single
crack at the notch root and limit the initiation of cracks on the sample surface.
The evolution of both the stress and the potential is depicted in Figure V-27. This
experiment lasted 14 hours, during which 15 scans were performed. It can be noticed that
the potential increased during the pre-immersion period, unlike the previous test, where the
potential decreased progressively. At the beginning of the loading period, the potential
dropped drastically and remained almost constant (at around -0.200 V/SCE) until 200 min
of test (scan 04). Later, from 250 min of test (scan 05) the potential displayed a continuous
decrease with test duration.
Figure V-28 presents the reconstructed tomography slices corresponding to the surface of
the sample. It can be observed that in spite of the presence of the notch, several cracks
initiated over the sample surface. The first cracks were detected after 270 min of test. This
time matches with the start of the continuous decrease of the potential.
Figure V-29 gathers the projection of all X-Y slices according to the Z-direction. The
initiation of a crack at the notch root can be observed. This defect presents a different
growth behavior compared to the others. It actually grows faster than the others because the
Cette thèse est accessible à l'adresse : http://theses.insa-lyon.fr/publication/2017LYSEI059/these.pdf © [J. Bolivar], [2017], INSA Lyon, tous droits réservés

Chapter V: Study of crack propagation by Digital Image Correlation analysis
José Bolivar 139
Thèse en Sciences des Matériaux / 2017
Institut national des sciences appliquées de Lyon
local stresses around the notch should be more important than in the rest of the sample
(stress concentration).
Figure V-27. Description of the S_I_600_02 test (MAS Alloy 600 immersed in a 0.01 M K2S4O6 solution at pH
4.0)
Cette thèse est accessible à l'adresse : http://theses.insa-lyon.fr/publication/2017LYSEI059/these.pdf © [J. Bolivar], [2017], INSA Lyon, tous droits réservés

Chapter V: Study of crack propagation by Digital Image Correlation analysis
José Bolivar 140
Thèse en Sciences des Matériaux / 2017
Institut national des sciences appliquées de Lyon
Figure V-28. Reconstructed X-ray tomography slices for the test S_I_600_02: plane Z-X
Figure V-29. Projection of all X-Y slices according to the Z-direction for different times (test S_I_600_02)
Cette thèse est accessible à l'adresse : http://theses.insa-lyon.fr/publication/2017LYSEI059/these.pdf © [J. Bolivar], [2017], INSA Lyon, tous droits réservés

Chapter V: Study of crack propagation by Digital Image Correlation analysis
José Bolivar 141
Thèse en Sciences des Matériaux / 2017
Institut national des sciences appliquées de Lyon
V.4.1.2 Shape of the intergranular stress corrosion cracks
The morphology of the cracks was evaluated in a qualitative manner directly from the
reconstructed tomography images. The shape of the cracks was very close in both tests.
Therefore, only some examples taken from the test S_I_600_02 are here detailed. These
examples are representative of the general morphology of the cracks observed in both
experiments.
Figure V-30 depicts the aspect of a representative crack (here named "I" , see Figure V-28)
observed through three successive scans, starting from 620 min until 840 min of test. The
first row of images represents the reconstructed tomography slices belonging to the sample
surface. The second row displays the projections of the slices of the plane parallel to the
surface of the sample, with respect to the Y-axis. Finally, the third row represents the
projection of the slices perpendicular to the crack plane (with respect to the Z-axis). The
reader can refer to the schematic design on Figure V-28 for visualizing both the spatial
reference system and the specific localization of the crack.
Figure V-30. Morphology of the crack "I" labelled in Figure V-28 (test S_I_600_02)
According to Figure V-30, this crack exhibits poor surface propagation during the period
displayed (620 – 840 min). In contrast, both the opening and the depth dimensions of the
crack increased during the considered period. Observing the images of the second row (Y-
projection of the plane Z-X), it can be seen that the crack path is very tortuous; the crack
exhibits some deviations from the mode I propagation plane, which are believed to be
caused by grain boundaries. Moreover, the projection of X-Y slices (last row in Figure
V-30) allows observing the "fingerprints" left by the crack during its propagation. Such
marks are produced by the changes of directions once the crack front crosses the different
grains. Furthermore, it was also observed that the cracks tend to propagate under a shape
Cette thèse est accessible à l'adresse : http://theses.insa-lyon.fr/publication/2017LYSEI059/these.pdf © [J. Bolivar], [2017], INSA Lyon, tous droits réservés

Chapter V: Study of crack propagation by Digital Image Correlation analysis
José Bolivar 142
Thèse en Sciences des Matériaux / 2017
Institut national des sciences appliquées de Lyon
close to a semi-elliptical, as can be observed in the pictures of the last row of Figure V-30.
However, some microstructural factors can disturb the mean shape of the crack: an example
is labelled in Figure V-30 by red arrows, where it can be seen that the crack front grew
preferentially over a large grain boundary plane with no microstructural obstacle.
Additionally, coalescence events can also modify the shape of the cracks. Figure V-31
shows the evolution of the morphology of the crack initiated at the FIB-notch (see Figure
V-28 to localize the defect). This crack results from the coalescence between three cracks
(see Figure V-28 at 510 min): one initiated at the left of the notch, the crack initiated at the
bottom of the notch and another initiated at its right. According to Figure V-31, the resulting
crack front after the coalescence is not semi-elliptical anymore (at 620 min). Nevertheless,
the pictures suggest that there is a tendency to follow a semi-elliptical shape (with small
microstructural perturbations) when the cracks propagate. The reentrant portion of the crack
front (see red arrows in Figure V-31) between the deepest point and the crack tip at the
surface seems actually to grow faster than the extremities (tips). If this behavior goes on, it
is believed that the cracks will re-adopt a shape close to a semi-ellipse.
Figure V-31. Morphology of the crack initiated at the FIB notch of the test S_I_600_02 (see Figure V-28)
Moreover, it was noticed that most of the cracks that appeared to be discontinuous at the
surface, actually interact and coalesce within the material. This kind of interactions can be
appreciated in Figure V-32: at 730 min it can be noticed that the two cracks on the right of
the notch are not connected at the surface of the sample; nevertheless, when looking to the
images corresponding to the Y-projection, a dark zone across the remaining ligament
between the two cracks can be observed, meaning that in fact, the cracks do not merge at
the surface, but they did inside the material. Recent studies have already reported this kind
of feature for both transgranular and intergranular SCC, in single or polycrystalline
materials [224]–[226]. This process is most probably a characteristic of SCC phenomena.
It is believed to be caused either by "crack branching" or by the crack tip deviation during
the coalescence event [227]. Both processes are known to produce remaining ligaments
Cette thèse est accessible à l'adresse : http://theses.insa-lyon.fr/publication/2017LYSEI059/these.pdf © [J. Bolivar], [2017], INSA Lyon, tous droits réservés

Chapter V: Study of crack propagation by Digital Image Correlation analysis
José Bolivar 143
Thèse en Sciences des Matériaux / 2017
Institut national des sciences appliquées de Lyon
between both interacting cracks and is very often called "crack bridging" [228]. Regarding
the internal coalescence, the author believes that once the bridge forms, both interacting
cracks propagate inside the material (Figure 7, 620 min). The merging of the inner crack
tips is restricted because of the shielding effects between both cracks. Nevertheless, it can
also be limited by microstructural factors (e.g. resistant grains). If the interacting cracks are
located in a dense crack colony (as it is the case here), the existence of multiple cracks
would generate a significant relaxation of the stress on the surface, hence, increase the
driving force on the deepest crack tips, and promote the internal coalescence. Moreover,
crack bridging can have a major consequence on crack growth: in fact, the existence of a
remaining ligament inside a crack reduces the effective crack driving force, hence, affect s
the propagation of the crack [227], [228].
Figure V-32. Morphology of crack "II" labelled in Figure V-28 (test S_I_600_02)
V.4.1.3 Feasibility of Digital Volume Correlation measurements from in-situ
microtomography SCC experiments
Digital Volume Correlation is the given name to three-dimensional DIC. It consists in
extending the same basis of 2D-DIC to 3D. In that context, implementing DVC requires 3D
images exhibiting a random pattern, usually composed of natural markers (precipitates,
second phases) [229], [230]. The Alloy 600 is known to be a relatively homogeneous
material, consisting of an austenitic matrix and small precipitates (carbides, nitrides, γ')
[205]. Figure V-33 shows an example of the reconstructed tomography images for Alloy
600. As mentioned before, the tomographies were reconstructed with the algorithm that
takes into account phase contrast. The picture on the left represents the Z-projection of X-
Y plane; this image evidences the presence of several black points in the bulk of the
material. On the other hand, the picture on the right represents a single slice of the cross -
section of the sample. According to this picture, it can be seen that the material also presents
some heterogeneities on the distribution of the grays levels (like stains). These features can
be better observed on the red enlarged area.
Cette thèse est accessible à l'adresse : http://theses.insa-lyon.fr/publication/2017LYSEI059/these.pdf © [J. Bolivar], [2017], INSA Lyon, tous droits réservés

Chapter V: Study of crack propagation by Digital Image Correlation analysis
José Bolivar 144
Thèse en Sciences des Matériaux / 2017
Institut national des sciences appliquées de Lyon
The black dots correspond to titanium nitrides. These nitrides were already identified during
the characterization of the material microstructure in Section IV.2.1.1; their size is around
5-10 µm which correspond to 8-27 voxels (2.34 µm/pixel). However, the origin of the stain-
like features of the material remains so far unsolved. It is believed that the pattern is
produced by chemical heterogeneities formed by the precipitation of chromium carbides in
the grain boundaries vicinity. The width of this zone was determined by EDX analysis and
was around 0.4 µm, which is tiny compared to the voxel size of 2.34 µm. Nevertheless, it
is known that the phase contrast enhances the imaging of features having sub-pixels
dimensions [221], [222]
Figure V-33. Pseudo-pattern obtained for the MAS Alloy 600 after the implementation of phase contrast
In this context, the presence of this pseudo-pattern motivated to study the feasibility of
DVC measurements. A DVC analysis was therefore performed for the test S_I_600_02. The
correlation was carried out taking into account the whole cross-section of the sample (2950
x 1100 µm) and 950 µm of the gauge length. The size of the elements was of 16 pixels
(37.44 µm/element).
The results of the correlation displayed poor results with some unexpected tendencies. In
fact, the DVC estimated that the deformation along the Z axis (axis of loading) diminishes
as the test goes on. This is not consistent with the fact that the initiation and the continued
opening of the cracks should produce an increasing axial deformation. The poor
performances of the results were attributed to both the presence of artifacts (mainly rings)
and the insufficient quality of the pattern which was relatively homogeneous (tiny highly
scattered markers). Actually, when the analyzed images are poorly constrasted, the
resolution of the optical flow equation by the least minimum squares do not converge to a
Cette thèse est accessible à l'adresse : http://theses.insa-lyon.fr/publication/2017LYSEI059/these.pdf © [J. Bolivar], [2017], INSA Lyon, tous droits réservés

Chapter V: Study of crack propagation by Digital Image Correlation analysis
José Bolivar 145
Thèse en Sciences des Matériaux / 2017
Institut national des sciences appliquées de Lyon
global minimum, because multiple solutions exist for each element but no accurate solution
for the entire mesh (see Figure V-34).
Nevertheless, the accuracy was sufficient enough for the convergence of the analysis. It has
to be highlighted that DVC was mainly used to calculate the correlation error field from
which the crack morphology can be easily extracted. In fact, the segmentation process (of
cracks) from the error field is much easier than doing it directly from the tomography
images, especially, when there is poor contrast between the cracks and the bulk of the
sample. Figure V-35 shows the comparison between the images obtained through
absorption contrast (standard reconstruction) and those obtained with phase contrast. The
cracks presented in Figure V-35 correspond to cracks I and III of the test S_I_600_02 at
390 min (see Figure V-28 to localize the cracks). It can be observed that in both cases,
performing the segmentation process for isolating the cracks is very challenging. On the
images obtained by absorption contrast, the cracks are very tight; their opening ranges from
a pixel fraction to some pixels. On the other hand, it can be appreciated that the phase
contrast allows capturing the morphology of tight cracks; yet, due to the like-stain pattern,
isolating the defects from the material remains equally difficult.
Figure V-34. Schematic example of all the possible solutions for the displacement of an element in a relative
homogeneous image
Cette thèse est accessible à l'adresse : http://theses.insa-lyon.fr/publication/2017LYSEI059/these.pdf © [J. Bolivar], [2017], INSA Lyon, tous droits réservés

Chapter V: Study of crack propagation by Digital Image Correlation analysis
José Bolivar 146
Thèse en Sciences des Matériaux / 2017
Institut national des sciences appliquées de Lyon
Figure V-35. Comparison between the images obtained from absorption contrast or phase contrast. The showed
cracks (I and II) correspond to a test time of 390 min (see Figure V-28 to localize the cracks)
In that context, the chosen approach consisted of using the correlation error for the
extraction of the crack shape. Despite the questionable accuracy of the estimated
displacement field (issued from DVC), the error field (issued from the correlation)
represented the three-dimensional shape of the cracks in a correct manner (see Figure V-36).
The following section details the methodology implemented for the crack morphology
identification.
Figure V-36. Extraction of 3D crack morphology from the error field issued from DVC analysis (test
S_I_600_02 at 510 min)
Cette thèse est accessible à l'adresse : http://theses.insa-lyon.fr/publication/2017LYSEI059/these.pdf © [J. Bolivar], [2017], INSA Lyon, tous droits réservés
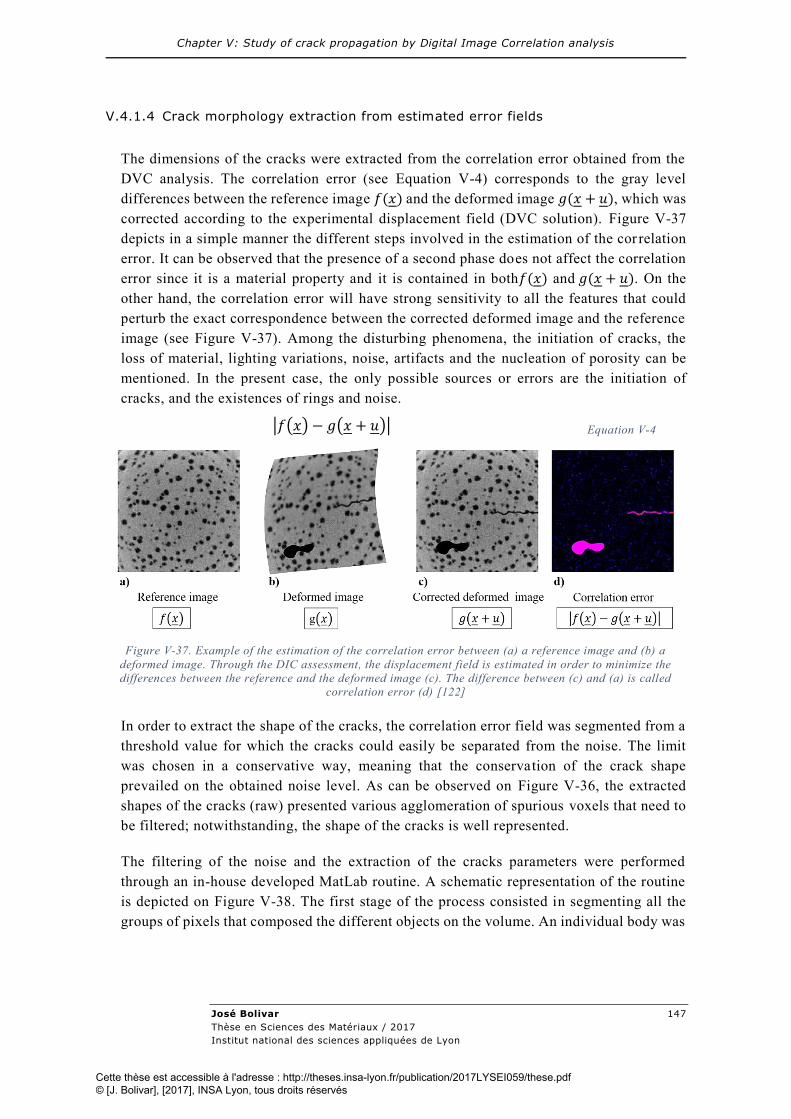
Chapter V: Study of crack propagation by Digital Image Correlation analysis
José Bolivar 147
Thèse en Sciences des Matériaux / 2017
Institut national des sciences appliquées de Lyon
V.4.1.4 Crack morphology extraction from estimated error fields
The dimensions of the cracks were extracted from the correlation error obtained from the
DVC analysis. The correlation error (see Equation V-4) corresponds to the gray level
differences between the reference image 𝑓(𝑥) and the deformed image 𝑔(𝑥 + 𝑢), which was
corrected according to the experimental displacement field (DVC solution). Figure V-37
depicts in a simple manner the different steps involved in the estimation of the cor relation
error. It can be observed that the presence of a second phase does not affect the correlation
error since it is a material property and it is contained in both𝑓(𝑥) and 𝑔(𝑥 + 𝑢). On the
other hand, the correlation error will have strong sensitivity to all the features that could
perturb the exact correspondence between the corrected deformed image and the reference
image (see Figure V-37). Among the disturbing phenomena, the initiation of cracks, the
loss of material, lighting variations, noise, artifacts and the nucleation of porosity can be
mentioned. In the present case, the only possible sources or errors are the initiation of
cracks, and the existences of rings and noise.
|𝑓(𝑥) − 𝑔(𝑥 + 𝑢)| Equation V-4
Figure V-37. Example of the estimation of the correlation error between (a) a reference image and (b) a
deformed image. Through the DIC assessment, the displacement field is estimated in order to minimize the
differences between the reference and the deformed image (c). The difference between (c) and (a) is called
correlation error (d) [122]
In order to extract the shape of the cracks, the correlation error field was segmented from a
threshold value for which the cracks could easily be separated from the noise. The limit
was chosen in a conservative way, meaning that the conservation of the crack shape
prevailed on the obtained noise level. As can be observed on Figure V-36, the extracted
shapes of the cracks (raw) presented various agglomeration of spurious voxels that need to
be filtered; notwithstanding, the shape of the cracks is well represented.
The filtering of the noise and the extraction of the cracks parameters were performed
through an in-house developed MatLab routine. A schematic representation of the routine
is depicted on Figure V-38. The first stage of the process consisted in segmenting all the
groups of pixels that composed the different objects on the volume. An individual body was
Cette thèse est accessible à l'adresse : http://theses.insa-lyon.fr/publication/2017LYSEI059/these.pdf © [J. Bolivar], [2017], INSA Lyon, tous droits réservés

Chapter V: Study of crack propagation by Digital Image Correlation analysis
José Bolivar 148
Thèse en Sciences des Matériaux / 2017
Institut national des sciences appliquées de Lyon
stated as the group of pixels in which all the pixels are interconnected between each other
according to a 27-neighbors connectivity. After this, a filtering stage was performed.
During this step, all the objects smaller than 40 voxels were suppressed. In the same
manner, all the objects identified at ti, but absent at ti+1, were eliminated. Subsequently,
each crack at time ti was enclosed with the smallest bounding box able to contain the object
(see Figure V-38). The depth of the crack was defined as the depth of its corresponding
bounding box. On the other hand, its length was defined as the diagonal of the face of the
bounding box containing the crack mouth (see Figure V-38). Finally, the opening was
defined as the maximum value of the opening of the outer surface of the crack. At the end
of this stage, all the noise has been suppressed, all the cracks have been identified (labeled),
and all their parameters and shape has been extracted. Figure V-39 displays the labeled
cracks and their extracted shape for the test S_I_600_02 at 840 min.
Figure V-38. Schematic representation of the procedure developed for the identification of cracks and for the
extraction of their parameters.
Figure V-39. Identification and crack morphology of the crack colony obtained on the test S_I_600_02 at 840
min
Cette thèse est accessible à l'adresse : http://theses.insa-lyon.fr/publication/2017LYSEI059/these.pdf © [J. Bolivar], [2017], INSA Lyon, tous droits réservés

Chapter V: Study of crack propagation by Digital Image Correlation analysis
José Bolivar 149
Thèse en Sciences des Matériaux / 2017
Institut national des sciences appliquées de Lyon
The obtained results, allowed assessing the mean values of the crack parameters (length,
opening, depth and CGRs). It should be mentioned that for the evaluation of all the
statistical values, the crack initiated on the FIB-notch was not taken into account, as the
initial configuration of this crack favored a faster growth than the other ones. Hence, its
size was always much larger than the rest of the cracks which strongly influences the mean
values of the assessed parameters. Figure V-40 gathers the evolution of mean values of the
crack dimensions, together with the shape factor ηDVC. ηDVC was calculated as the ratio of
the depth d to the half-length c of each crack. This aspect ratio was already introduced in
the description of the tests performed with 2D-DIC (Section V.3.1.4). As mentioned in that
section, η describes the crack shape and the manner the defect propagates. A decreasing η
indicates mostly surface propagation, while an increasing η is the indication of a crack
propagating primarily in depth. It is important to highlight that when using DVC, the aspect
ratio is obtained from direct measurements, whereas it was obtained from an analytical
estimation in the 2D previous approach (see Equation V-3 and Figure V-21).
According to the results obtained for the test S_I_600_02 (Figure V-40), it can be observed
that the mean ηDVC factor decreases during the first part of the experiment (300 to 500 min).
After, it remains almost constant during a period of about 200 minutes, and then finally
increases in the last part of the test, suggesting that the crack colony propagated in three
stages: a first phase (I) where the colony develops mostly on the surface (300 – 500 min),
a second stage (II) where the cracks seem to grow in both directions (in surface and inside
the material) and finally, a third period where the defects grow primarily towards the bulk
of the material (700 to 900 min).
Figure V-40. Evolution of the mean dimensions of the cracks: length, opening and depth (test S_I_600_02)
V.4.2 Discussion
The previous section detailed the SCC experiments performed under X-ray tomography
(S_I_600_01 and S_I_600_02). As mentioned, those experiments were made with slightly
Cette thèse est accessible à l'adresse : http://theses.insa-lyon.fr/publication/2017LYSEI059/these.pdf © [J. Bolivar], [2017], INSA Lyon, tous droits réservés

Chapter V: Study of crack propagation by Digital Image Correlation analysis
José Bolivar 150
Thèse en Sciences des Matériaux / 2017
Institut national des sciences appliquées de Lyon
different conditions compared with the usual tests (LTS samples) . Indeed, the load was
higher in order to reduce the test duration. Despite this change, it was observed that the
conditions allowed obtaining a colony of cracks with the same characteristics of those
studied by 2D-DIC (Section V.3.2).
It can be first observed that changing the pH induced some differences in the development
of the cracks. Figure V-41 depicts the sample surface after the last scan for both tests. It
shows that diminishing the pH increased the final crack density. The initiation time was
also affected by the pH-value. Concerning the test performed at pH 3.0 (S_I_600_01), it
was found that the cracks were immediately detected since the loading started (see Figure
V-25). In contrast, at pH 4.0, the cracks were detected only 270 min after loading. As
mentioned in the literature review (Section II.2.1 and II.4.2), this phenomenon is closely
related to the properties of the passive film. For test S_I_600_01, the potential decreases
during the pre-immersion period (see Figure V-24), suggesting that the passive film was
unstable and weak. In contrast, when looking at the pre-immersion stage of the sample
S_I_600_02 (Figure V-27), it can be seen that the potential exhibited higher values and
followed an increasing tendency, suggesting that the passive film was more resistant at pH
4.0.
Another interesting fact is that the crack density obtained at pH 4.0 on the STS samples,
resulted to be much higher than those obtained on the experiments presented in Section
IV.2.4 (see Figure IV.10, LTS specimens). It has to be mentioned that in that case, the LTS
samples were loaded in the macroscopic elastic domain, while the experiments performed
at SOLEIL, were conducted in the plastic domain. In the latter case, loading the sample at
higher stresses favors plastic processes such as the emergence of slip bands that would
break the surface film and promote crack initiation.
Figure V-41. Sample slice plane Z-X of the outer surface at the end of each test. (Left) Test S_I_600_01 (pH
3.0) and (Right) Test S_I_600_02 (pH 4.0)
Moreover, the crack propagation rate was also altered by the pH values. The differences in
their dynamics were evaluated through the Z-projections presented in Figure V-26 and
Figure V-29. Actually, that kind of representation allows observing the evolution of the
front of the cracks. The depth of the crack front (projected) was determined by image
treatment. The procedure is schematized in Figure V-42. The obtained mean depth of the
Cette thèse est accessible à l'adresse : http://theses.insa-lyon.fr/publication/2017LYSEI059/these.pdf © [J. Bolivar], [2017], INSA Lyon, tous droits réservés

Chapter V: Study of crack propagation by Digital Image Correlation analysis
José Bolivar 151
Thèse en Sciences des Matériaux / 2017
Institut national des sciences appliquées de Lyon
crack front was then divided by the active cracking period of each test. The latter comprised
the time elapsed since the detection of the first cracks and the end of the test. The results
of such estimation are compiled in Table V.6. The crack front (projected) propagated twice
time faster at pH 3.0 than at pH 4.0. These results confirm how susceptible can be the SCC
mechanism on variations in electrochemical and mechanical factors.
Figure V-42. Schematic representation of the method used to calculate the mean advancement of the cracks
fronts. In red, the crack front edge. In yellow, the mean depth of the crack front.
Table V.6. Estimated values of the mean advance of the crack front inside the material
Sample pH Active period
(min)
Mean CGR
(µm/min)
S_I_600_01 3.0 7-360 0.33
S_I_600_02 4.0 270-840 0.17
Another point addressed during this work was the way the cracks propagate. During the
experiment S_I_600_01 the cracks displayed two phases of propagation. During the first
period of the experiment (from 7 to 115 min), the cracks propagated considerably more all
over the surface rather than into the bulk (see Figure V-25 and Figure V-26). Secondly,
from 270 minutes until the end of the test, it was observed that the variations of the crack
propagation at the surface were inhibited while both the crack opening and depth increased
(see Figure V-25 and Figure V-26). This behavior was confirmed by the assessment of the
aspect ratio ηDVC (d/c) for the cracks detected in the test S_I_600_02. The evolution of ηDVC
(Figure V-40) displayed mainly three stages: a first decreasing ηDVC stage which means that
the surface crack length variations were more significant that the increments in depth (from
300 to 500 min), followed by a second stage between 500 and 700 minutes for which the
cracks seemed to grow in both directions (constant ηDVC) then, a third period for which ηDVC
increases, indicating a predominant propagation inside the material.
In this context, the results presented just above validate the trends observed through 2D-
DIC analysis (Section V.3.2), where direct measurements of crack depth could not be
obtained. The same first decrease and last increase stages of η and ηDVC were observed. In
between, a constant ηDVC stage was identified, which can be associated to a period during
Cette thèse est accessible à l'adresse : http://theses.insa-lyon.fr/publication/2017LYSEI059/these.pdf © [J. Bolivar], [2017], INSA Lyon, tous droits réservés

Chapter V: Study of crack propagation by Digital Image Correlation analysis
José Bolivar 152
Thèse en Sciences des Matériaux / 2017
Institut national des sciences appliquées de Lyon
which the interactions between the cracks do not significantly influence the propagation of
the colony. A possible explanation is that the crack opening is wide enough to facilitate the
anodic process responsible for the whole crack front propagation. Such hypothesis could
explain why the cracks propagate both at the surface and inside the material during this
stage.
Figure V-43. Three-dimensional representation of the propagation of the crack that initiated on the FIB-notch
(test S_I_600_02)
Moreover, the second objective of the in situ micro-tomography SCC experiments was to
determine the 3D shape of the propagating cracks (within the colony). In that context, it
was generally observed that relatively isolated cracks tended to propagate under a shape
close to a semi-elliptical (see Figure V-43). The closeness to a perfect semi-elliptical shape
was observed to be disturbed by the interactions between the cracks (e.g. coalescence
events) and also by microstructural factors (e.g. triple points, resistant grains boundaries,
special grains orientations). Nevertheless, it was observed that the cracks exhibit a tendency
to return to their original shape after a disturbing episode.
It should be noted that finding a crack shape very close to that one observed in fatigue
failures (e.g. semi-elliptical), where the cracks propagate mainly by mechanical effects, is
of great significance for this study. Obtaining such a defect shape is not possible by
considering only metal dissolution. Mechanical factors play therefore a major role in crack
growth, more than just increasing crack opening and enhancing electrochemical exchanges.
V.4.3 Synopsis
Through this section, two in-situ SCC experiments performed under high-resolution X-ray
tomography were presented. The tomography data provided successfully non-destructive
and three-dimensional information of both the shape and the depth of the initiated defects.
The resulting crack colonies displayed characteristics very close to those identified in
Section V.3 (LTS samples). The evolution of the crack colony was evaluated through the
Cette thèse est accessible à l'adresse : http://theses.insa-lyon.fr/publication/2017LYSEI059/these.pdf © [J. Bolivar], [2017], INSA Lyon, tous droits réservés

Chapter V: Study of crack propagation by Digital Image Correlation analysis
José Bolivar 153
Thèse en Sciences des Matériaux / 2017
Institut national des sciences appliquées de Lyon
assessment of an aspect ratio (ηDVC = d/c), which was evaluated from direct measurements
instead of using the analytical estimation implemented in the 2D-previous approach. The
results of this approach validated the crack colony behavior already observed from indirect
measurements.
Finally, the shape of the propagating defects was also analyzed. It was observed that the
relatively isolated defects propagate with a shape close to a semi-ellipse. It was found that
the shape of cracks varied according to (i) local mechanical stresses and ( ii) microstructural
features. Moreover, it was noted that when two cracks coalesce, the resulting crack shape
can differ from a semi-ellipse. Nevertheless, it was observed that the newly defect tends to
return to its original shape when it propagates.
Cette thèse est accessible à l'adresse : http://theses.insa-lyon.fr/publication/2017LYSEI059/these.pdf © [J. Bolivar], [2017], INSA Lyon, tous droits réservés

Chapter V: Study of crack propagation by Digital Image Correlation analysis
José Bolivar 154
Thèse en Sciences des Matériaux / 2017
Institut national des sciences appliquées de Lyon
Chapter Summary
An experimental methodology based on Digital Image Correlation, and complementary
Acoustic Emission and Electrochemical Noise measurements was implemented to study the
processes involved in the different stages of the growth of intergranular stress corrosion
cracks. Two cases were analyzed: (I) the propagation of a single intergranular crack and
(II) the propagation of a dense cracks colony.
The first section aimed at characterizing the growth of a single crack in the absence of cr ack
interactions. Thank to several correlations between the different techniques, the
propagation of the crack was split into three stages. During the first stage, it was observed
that the crack propagated mostly at the surface rather than into the material. The resulting
defect is long and exhibits small COD. Moreover, it was observed that the CGR of the
defect (in length) decreases as the crack propagated. The behavior involved within this
stage was attributed to a significant contribution of anodic dissolution in the propagation
mechanisms. The latter was supported by the active trend of EN records and to the low
energy of the AE bursts. The preference for a surface propagation was linked to the fact
that the small COD should limit electrochemical reactions at the bottom of the defect,
preventing metal dissolution in this region. The latter agrees with the decreasing CGR (in
length) as the opening of the crack increased, which suggests that the transport of species
is enhanced, and hence the propagation of the deepest part of the defect starts to be
encouraged. During the second stage, the growth behavior of the crack changed. The defect
started to grow preferentially towards the depth of the sample, which can be related to the
fact that the shallow shape of the crack is not stable from a mechanical point of view and
promotes in-depth propagation. Yet, the defect continued to propagate mostly due to anodic
dissolution. During this phase, it was also noted that the defect becomes larger by
coalescing adjacent cracks rather than by the growth of the primary crack. The neighboring
defects nucleated within the plastic zone of the primary crack tips and then coalesced with
the primary crack as the latter advanced. The process required stress/strain concentration
in order to promote film-rupture and initiation. Hence, models devoted to describe crack
growth exhibiting this kind of features must take into account both the electrochemical and
mechanical contributions to the crack advance processes and the influence of local
stress/strain on the initiation of adjacent defects.
On the other hand, the second section of this chapter was devoted to the study of the
propagation of a crack colony. The main objective was to evidence, according to a statistical
approach, the influence of crack interactions in the development of the defects. The
evolution of the colony was divided into three stages based on the results obtained by the
complementary monitoring techniques used (DIC, EN, and AE). During the first stage, the
majority of the cracks propagated as isolated defects, following the same behavior as the
one of a single crack (surface propagation and active anodic dissolution). In the second
Cette thèse est accessible à l'adresse : http://theses.insa-lyon.fr/publication/2017LYSEI059/these.pdf © [J. Bolivar], [2017], INSA Lyon, tous droits réservés

Chapter V: Study of crack propagation by Digital Image Correlation analysis
José Bolivar 155
Thèse en Sciences des Matériaux / 2017
Institut national des sciences appliquées de Lyon
stage of development, interactions between cracks (coalescence + shielding) begin to occur
but do not modify the general behavior of the colony, whose growth remains mainly
governed by active anodic dissolution. Finally, the intensification of interactions leads to a
decrease in the number of cracks and the mean crack growth rate (in the surface). Yet,
cracks displayed a tendency to propagate predominantly inside the material but their 3D
growth rate and shape remained inaccessible by direct measurements.
In this context, a complementary 3D experimental approach involving in situ micro -
tomography SCC tests and Digital Volume Correlation was developed in order to obtain
more information about the propagation processes. The experiments were performed on
smaller samples and under conditions slightly different (higher load) from the test carried
on larger specimens. Nevertheless, the obtained cracks colony exhibited a morphology very
close to the former one (e.g. crack density, aspect, morphology). Among the most relevant
results obtained through this approach, the extraction of the three-dimensional shape of the
propagating defects and the validation of the stages of the crack colony growth already
obtained through 2D-DIC measurements can be underlined. Actually, it was observed that
the defects were asymptotically converging towards a semi-elliptical shape, which can vary
according to microstructural features (e.g. resistant grains) and crack interactions (e.g.
coalescence and shielding). In the case of coalescing cracks, the newly formed defect tends
to return to its original shape. These observations suggest that despite the major
contribution that the electrochemistry represents to the propagation of the cracks, a synergy
between anodic dissolution and local stress/strain must be considered in order to account
for such a crack shape (also observed in fatigue processes).
The part of the work presented through this chapter allowed characterizing the growth of
intergranular cracks in an Alloy 600 in a tetrathionate solution. A general synthesis
discussing the mode of propagation and the mechanisms involved in the crack advance
process will be proposed in Chapter VII. The contribution of the present experimental
results to the development of a phase-field based model for simulating the cracks colony
behavior [37] will be presented. Yet, in order to improve the experimental approach
developed in this work and to enrich the general synthesis that will be proposed in the last
chapter of this manuscript, next chapter (VI) is entirely devoted to a deep analysis of EN
measurements in Stress Corrosion Cracking studies. It is specially focused on the
deleterious effects that can have both instrumental noise and the development of asymmetry
between electrodes on the EN records.
Cette thèse est accessible à l'adresse : http://theses.insa-lyon.fr/publication/2017LYSEI059/these.pdf © [J. Bolivar], [2017], INSA Lyon, tous droits réservés

Chapter VI: Analysis of Electrochemical Noise during Stress Corrosion Cracking Tests
José Bolivar 156
Thèse en Sciences des Matériaux / 2017
Institut national des sciences appliquées de Lyon
Chapter VI
VI Analysis of Electrochemical
Noise during Stress Corrosion
Cracking Tests
VI.1 Introduction ................................................................................................. 157
VI.2 Theoretical background about the evaluation of the noise generated during
Electrochemical Noise Measurements (ENM) ............................................... 157
VI.2.1 Current partition according to Bertocci et al. model [172] ........................ 158
VI.2.2 Methodology for the evaluation of instrumental noise .............................. 161
VI.3 Evaluation of the instrumental noise generated by the REF600 Gamry
potentiostat .................................................................................................... 164
VI.3.1 Results and discussion ............................................................................ 164
VI.3.2 Synopsis ................................................................................................. 168
VI.4 Application of ENM in SCC studies: influence of current partition and
instrumental noise ......................................................................................... 169
VI.4.1 Presentation of the results ....................................................................... 171
VI.4.2 Discussion .............................................................................................. 173
VI.4.3 Synopsis ................................................................................................. 178
VI.5 Critical analysis of the rise in the asymmetry between electrodes during SCC
process ........................................................................................................... 179
VI.5.1 Results and discussions ........................................................................... 180
Chapter Summary ................................................................................................ 184
Cette thèse est accessible à l'adresse : http://theses.insa-lyon.fr/publication/2017LYSEI059/these.pdf © [J. Bolivar], [2017], INSA Lyon, tous droits réservés

Chapter VI: Analysis of Electrochemical Noise during Stress Corrosion Cracking Tests
José Bolivar 157
Thèse en Sciences des Matériaux / 2017
Institut national des sciences appliquées de Lyon
VI.1 Introduction
lectrochemical Noise (EN) measurements have been increasingly
implemented in Stress Corrosion Cracking (SCC) studies, due to their
non-intrusive characteristics and their performance for (i) crack initiation
detection, (ii) SCC progression monitoring and (iii) quantitative evaluation
of the dissolved amount of metal during discontinuous cracking, by
measuring the current generated by each cracking step and using the Faraday
law. However, the influence of both the current partition (in the measuring
circuit) and the instrument noise on the obtained results remained sometimes
delicate and misleading.
In that context, this chapter is focused on the investigation of the influence
of both the instrumental noise and the rise in asymmetry between the
electrodes (inherent in the SCC tests when only the working electrode is
stressed) on the EN data. The analysis that will result from this chapter will
allow determining how instrumental noise can affect EN measurements for
low emissive systems, and how the current produced after a corrosion event
occurring at the WE is registered. In addition, the latter should allow
obtaining more reliable quantitative data such as the amount of dissolved
metal deduced from the Faraday equation and current measurements.
For this, the present chapter is divided into four sections. Firstly, a theoretical
background will present a model introduced by Huet and coworkers which
describes EN measurements. Moreover, a procedure proposed in the
literature to evaluate the instrumental noise by using dummy cells will be
detailed. The same procedure will be adopted during this work, and the
obtained results will be reported in the second part. Finally, the third and the
fourth parts will detail the analysis of EN data obtained during SCC tests,
taking into account the contribution of external noise and the effect of current
partition during the measurements.
VI.2 Theoretical background about the
evaluation of the noise generated during
Electrochemical Noise Measurements
(ENM)
So far, EN has encountered big difficulties in becoming a popular technique for corrosion
studies. This is mainly due to (i) the arduousness of data interpretation, and (ii) the
misleading influence of both the current partition and the instrumental noise on the
E
Cette thèse est accessible à l'adresse : http://theses.insa-lyon.fr/publication/2017LYSEI059/these.pdf © [J. Bolivar], [2017], INSA Lyon, tous droits réservés

Chapter VI: Analysis of Electrochemical Noise during Stress Corrosion Cracking Tests
José Bolivar 158
Thèse en Sciences des Matériaux / 2017
Institut national des sciences appliquées de Lyon
measurements. The first point was already detailed in the literature review of this
manuscript. On the other hand, the second aspect will be developed within this chapter with
a theoretical approach and through experimentation.
In this context, several works introduced by Bertocci et al. [166], [169], [172], [195], [231],
[232] detailed a model describing the potential and current fluctuations in an
electrochemical cell submitted to ENM. The model allows better understanding how current
is registered, taking into account the current partition and the instrumental noise.
VI.2.1 Current partition according to Bertocci et al. model [172]
Figure VI-1 displays the electrical scheme of an EN setup in ZRA mode. Note that this
representation is valid for any ENM performed under free corroding conditions (ZRA
mode). The electrochemical cell consists in two working electrodes (WE1 and WE2) and a
true Reference Electrode (RE). The potential signal ∆Vmeas, is measured between the WE1
and RE, using a Voltage Amplifier (VA). Moreover, the ZRA keeps both WEs at the same
potential and allows the measurement of the current signal ∆Imeas which flows in the solution
between WE1 and WE2. Z1 and Z2 correspond to the impedance of WE1 and WE2
respectively. It is important to highlight that the instrumental noise was not taken into
account during the description of this model. Its contribution has been taken in subsequent
papers by the authors, but the analytical relation issued from those works is not directly
applicable to this study. The reason is because the electronic of the measuring instrument
is not the same as the one of the instrument used in this study.
Figure VI-1. Representation of the equivalent circuit of the electrochemical cell with the current noise sources
(i1, i2) of the Working Electrodes[166]
Bertocci et al. [172] solved the equivalent electrical circuit presented in Figure VI-1
assuming that the fluctuations of the electrochemical cell are produced by current noise
Cette thèse est accessible à l'adresse : http://theses.insa-lyon.fr/publication/2017LYSEI059/these.pdf © [J. Bolivar], [2017], INSA Lyon, tous droits réservés

Chapter VI: Analysis of Electrochemical Noise during Stress Corrosion Cracking Tests
José Bolivar 159
Thèse en Sciences des Matériaux / 2017
Institut national des sciences appliquées de Lyon
sources (i1, i2). It can be assumed that the corrosion events liberate electrons (i.e. produce
a current), which leads to potential fluctuations. In that context, the subscript "1" describes
the WE1 (sample of interest) while the subscript "2" describes the WE2 (Counter-Electrode
for EN measurements), and hence i1 and i2 correspond to the current emitted after a
corrosion event at the WE1 and WE2 respectively.
In order to ease both the analysis and the equations which describe the fluctuations of ∆Imeas
and ∆Vmeas, the authors have done the following simplifications [166]:
It is stated that there does not exist any current crossing the RE (or Z3) because of
the high-impedance input of the voltmeter.
If the impedance modulus of WE1 and WE2 is much larger than the solution
resistance (Rs) in the frequency range studied, then the effect of the solution
resistance between the WEs can be neglected.
It is assumed that all the current noises are uncorrelated, hence allowing to calculate
the corresponding PSDs of the current and potential noises.
Considering all above and applying the Ohm and Kirchhoff's laws to both the current and
voltage channels (frequency domain) give Equations VI-1 and VI-2. In the following
analysis, all the terms are complex and frequency-dependent.
∆𝑉 = 𝑍1(∆𝐼 − 𝑖1) Equation VI-1
𝑍1(∆𝐼 − 𝑖1) + 𝑍2(∆𝐼 + 𝑖2) = 0 Equation VI-2
from which the fluctuations in the current of the electrochemical cell ∆I can be derived (see
Equation VI-3):
∆𝐼 =𝑍1(𝑖1)−𝑍2(𝑖2)
𝑍1+𝑍2 Equation VI-3
The equations describing the measured potential ∆Vmeas and current fluctuations ∆Imeas are
represented by Equation VI-4 and Equation VI-5 respectively. Note that if a true Reference
Electrode (RE) is used (e.g. SCE), the term Z3i3 can be neglected as the RE can be
considered as noiseless.
∆𝑉𝑚𝑒𝑎𝑠 = 𝑍1(∆𝐼 − 𝑖1) + 𝑍3𝑖3 = −𝑍1𝑍2
𝑍1+𝑍2(𝑖1 + 𝑖2) + 𝑍3𝑖3 Equation VI-4
∆𝐼𝑚𝑒𝑎𝑠 = ∆𝐼 =𝑍1(𝑖1)−𝑍2(𝑖2)
𝑍1+𝑍2 Equation VI-5
Finally, the PSD of a random signals X, ∆X, is proportional to the square of the modulus of
the Fourier Transform of X. Therefore, Equation VI-6 and Equation VI-7 describe,
respectively, the PSDs of the measured potential (𝛹𝑉𝑚𝑒𝑎𝑠) and current (𝛹𝐼𝑚𝑒𝑎𝑠
) signals.
Cette thèse est accessible à l'adresse : http://theses.insa-lyon.fr/publication/2017LYSEI059/these.pdf © [J. Bolivar], [2017], INSA Lyon, tous droits réservés

Chapter VI: Analysis of Electrochemical Noise during Stress Corrosion Cracking Tests
José Bolivar 160
Thèse en Sciences des Matériaux / 2017
Institut national des sciences appliquées de Lyon
𝛹𝑉𝑚𝑒𝑎𝑠=
|𝑍1𝑍2|2
|𝑍1+𝑍2|2(𝛹𝑖1
+ 𝛹𝑖2) + |𝑍3|2𝛹𝑖3
Equation VI-6
𝛹𝐼𝑚𝑒𝑎𝑠=
|𝑍1|2
|𝑍1+𝑍2|2𝛹𝑖1
+|𝑍2|2
|𝑍1+𝑍2|2𝛹𝑖2
Equation VI-7
where 𝛹𝑖1, 𝛹𝑖2
and 𝛹𝑖3 are the PSD of the noise sources i1, i2 and i3 respectively.
Given these points, the equations here developed permit to rationalize the influence of
asymmetry on ENM. It can be noticed from Equation VI-5 that the totality of the current
source i1, which corresponds to the current originated by a corrosion event on the WE under
study is not registered. In fact, the current partition depends on the impedances of the two
WEs. In cases when the electrodes are perfectly symmetric (Z1=Z2=Z) Equation VI-5
becomes:
∆𝐼𝑚𝑒𝑎𝑠 =𝑖1−𝑖2
2 Equation VI-8
Note that if a corrosion event takes place in electrode 1, while nothing happens in electrode
2 (i2 = 0), the fluctuation in current passing through the ZRA is only ∆Imeas= i1/2. The latter
means that even in an ideal case, where both electrodes have the same modulus of
impedance and where the instrumental noise is negligible, the registered current fluctuation
is only the half of the real current (see Figure VI-2). On the other hand, the problem
becomes more critical when asymmetry appears (see Figure VI-2). The most extreme cases,
but in the same time the most common in Stress Corrosion Cracking studies, is when the Z2
>> Z1. In this case, only a small part of the current coming from a corrosion event (in WE1)
crosses the WE2 and is measured by the ZRA (see Equation VI-5, Figure VI-2). This is
why asymmetry is very important to be taken into account, especially when dealing with
very low emissive systems or for quantitative purpose.
Figure VI-2. Partition of the current “i1” produced by a localized corrosion event on electrode 1 for symmetric
electrodes (a), and asymmetric electrodes (b) Z2<<Z1, (c) Z2>>Z1[195]
Note that the measurements in potential are much less sensitive to asymmetry than the
current channel. Actually, there is only a single coefficient affecting the current noise
sources in Equation VI-4 which dependency on the impedance modulus of both electrodes
is less critical that in Equation VI-5.
Cette thèse est accessible à l'adresse : http://theses.insa-lyon.fr/publication/2017LYSEI059/these.pdf © [J. Bolivar], [2017], INSA Lyon, tous droits réservés

Chapter VI: Analysis of Electrochemical Noise during Stress Corrosion Cracking Tests
José Bolivar 161
Thèse en Sciences des Matériaux / 2017
Institut national des sciences appliquées de Lyon
VI.2.2 Methodology for the evaluation of instrumental noise
Another stage of prime importance when analyzing EN data is the evaluation of the
instrumental noise and its influence on ENM. If the instrument noise level is known, then,
the ENM can be validated, and the frequency domains where the corroding system is noisy
can be determined. In that context, the "European Cooperative Group on Corrosion
Monitoring of Nuclear Materials (ECG-COMON)" has recently published a simple
procedure aimed at evaluating the performances and the noise levels of the measuring EN
devices [233], [234]. The procedure consists in measuring the potential and current noise
of a dummy cell in ZRA mode. The dummy cell is composed of three equal resistors
connected in a star arrangement (see Figure VI-3). Each resistor corresponds respectively
to the Working Electrode (WE), the Counter-Electrode (CE) and the Reference Electrode
(RE). Such configuration is known to provide a well-defined source of both impedance and
noise levels which allows comparing the theoretical noise amplitudes vs. the experimental
measurements.
Figure VI-3. Configuration of the dummy cell composed of three equal resistors (R)
Under this configuration, the theoretical minimum noise expected to be recorded is the
thermal noise of the resistors given by Equation II-10 and Equation II-11 (see Section
II.5.3.1 in Chapter II). Considering the above, the PSDs levels can be estimated from
Equation VI-6 and Equation VI-7 by considering Z1 = Z2 = Z3 = R. In that case, the PSD of
the signals that is expected to be measured corresponds to:
𝛹𝑉 = 6𝑘𝑇𝑅 Equation VI-9
𝛹𝐼 = 2𝑘𝑇/𝑅 Equation VI-10
Nevertheless, it is very unlikely that the instrument will always be capable of detecting such
thermal noises which are very often of low amplitude. Notwithstanding, the objective is to
determine the instrument noise levels which are expected to vary according to the
impedance of the sources.
As can be imagined, each instrument builder designs its EN devices with different
electronic architectures. Hence, the noise "fingerprint" might vary considerably from one
instrument to another one. In this study, a REF600 Gamry potentiostat was used for
performing all the measurements. Figure VI-4 depicts a simplified electrical circuit of this
potentiostat. Huet and coworkers [235] have already analyzed the electronic circuit of this
potentiostat and have deduced the equations that describe the measured PSDs of both the
Cette thèse est accessible à l'adresse : http://theses.insa-lyon.fr/publication/2017LYSEI059/these.pdf © [J. Bolivar], [2017], INSA Lyon, tous droits réservés

Chapter VI: Analysis of Electrochemical Noise during Stress Corrosion Cracking Tests
José Bolivar 162
Thèse en Sciences des Matériaux / 2017
Institut national des sciences appliquées de Lyon
current and potential under a dummy cell configuration. Such relationships are depicted in
Equation VI-11 and Equation VI-12. It can be observed that they take into account several
sources of instrumental noise (𝛹𝑒𝑛𝑖/Rm2, 4kT/Rm, 𝛹𝑒𝑛0 and 𝛹𝑒𝑛1
) as well as the thermal
noise emitted by the resistors.
Figure VI-4. Simplified schematic diagram of the REF600 Gamry Potentiostat circuit [235]
𝛹𝑉𝑚𝑒𝑎𝑠= 6𝑘𝑇𝑅 +
𝛹𝑒𝑛0
4+ 𝛹𝑒𝑛1
Equation VI-11
𝛹𝐼𝑚𝑒𝑎𝑠=
𝛹𝑒𝑛𝑖
𝑅𝑚2+
1
1+42𝜋2𝑅𝑚2𝐶2𝑓2[
4𝑘𝑇
𝑅𝑚+
𝛹𝑒𝑛0
4𝑅2+
2𝑘𝑇
𝑅] Equation VI-12
The term Rm is indirectly defined by the user by choosing the measuring range of the current
channel (IE range); the corresponding values are compiled in Table VI-1. The term C
represents the value of the capacitance related to the IE stability range (user -defined, see
Table VI-2). The term f is the frequency. Moreover, the noise sources en0, en1 and eni can
be localized on Figure VI-4. 𝛹𝑒𝑛0 corresponds to the noise produced by the Operational
Amplifier (OPA) of regulation of the potentiostat (CA in Figure VI-4). In addition, 𝛹𝑒𝑛1is
originated by both the amplifier of gain 1 in front of the differential electrometer of tension
and by the amplifier Vch of gain 1, 10 or 100 (related to Vch range, user-defined). Finally,
𝛹𝑒𝑛𝑖 comes from both the amplifier of gain 25 and the amplifier Ich of gain 1, 10 or 100
(related to Ich range, user defined).
Cette thèse est accessible à l'adresse : http://theses.insa-lyon.fr/publication/2017LYSEI059/these.pdf © [J. Bolivar], [2017], INSA Lyon, tous droits réservés

Chapter VI: Analysis of Electrochemical Noise during Stress Corrosion Cracking Tests
José Bolivar 163
Thèse en Sciences des Matériaux / 2017
Institut national des sciences appliquées de Lyon
Table VI-1. Values of the resistance (Rm) of the current measurement circuit of the REF600 Gamry potentiostat
IE range 1 2 3 4 5 6 7 8 9 10 11
Imax 600 mA 60 mA 6 mA 600 µA 60 µA 6 µA 600 nA 60 nA 6 nA 600 pA 60 pA
Rm (Ω) 0,2 2 20 200 2 k 20 k 200 k 2 M 20 M 200 M 2 G
Table VI-2. Values of the capacitance (C) associated to the IE stability parameter of the REF600 Gamry
potentiostat
IE
Stability
Capacitance
(C)
Fast Cable limited
≈ 150 pF
MedFast 1nF
Normal 33 nF
Slow 1 µF
Regarding the equations obtained by Huet et al. [235], it can be noted that the PSD of the
measured potential noise (𝛹𝑉𝑚𝑒𝑎𝑠) presents two instrumental noises sources 𝛹𝑒𝑛0
and 𝛹𝑒𝑛1.
The latter are expected to be relatively constant as they do not depend neither on any set-
up parameters nor on the value of the resistances (see Equation VI-11). In contrast, the
current signal is very sensitive to the instrumental noise (see Equation VI-12), especially
those provided by the ZRA (𝛹𝑒𝑛𝑖/Rm2, 4kT/Rm) and 𝛹𝑒𝑛0. Nevertheless, it can be observed
that their contribution can be managed by the user. In fact, the noise can be reduced by
choosing the value of Rm as large as possible (IE range related). It is very often
recommended to use a ratio R/Rm at least less that one tenth in order to reduce its
contribution. Moreover, it can be appreciated that the contribution of 𝛹𝑒𝑛0 will be more
important at higher frequencies where the impedance modulus of the WEs is small.
In this context, the next section aims at implementing the methods and the theory here
described, in order to characterize experimentally the susceptibility and the domains of
frequencies of the instrumental noise.
Cette thèse est accessible à l'adresse : http://theses.insa-lyon.fr/publication/2017LYSEI059/these.pdf © [J. Bolivar], [2017], INSA Lyon, tous droits réservés

Chapter VI: Analysis of Electrochemical Noise during Stress Corrosion Cracking Tests
José Bolivar 164
Thèse en Sciences des Matériaux / 2017
Institut national des sciences appliquées de Lyon
VI.3 Evaluation of the instrumental noise
generated by the REF600 Gamry
potentiostat
During this section, four dummy cells were analyzed. Each cell was composed of three
equal resistors whose impedances were comprised within the range of values of the
impedance modulus that the samples (WE and CE) adopt during the SCC process (including
the double layer). As will be seen later, the impedance modulus of the WE and the CE (|Z1|
and |Z2| respectively) were actually measured by EIS during SCC experiments. The values
of the resistor were therefore chosen equal to 100 Ω, 1 kΩ, 10 kΩ and 1 MΩ. Prior to the
experiments, the cells were connected to the potentiostat for at least 15 minutes in order to
heat the system. The measurements were performed under the same conditions as those of
the SCC tests. In this manner, the dummy cell was introduced within the Faraday Cage (see
Figure III-9, Section III.2.7) which was connected to the floating ground of the potentiostat.
In order to reproduce the same environmental noise, all the electronic devices (tensile
machine and computers), normally used during the SCC test were turned on during the
recording period.
A sampling frequency of 100 Hz was adopted for the acquisitions. The acquisitions lasted
180 seconds and were performed for each resistor value and each IE range (from 60 pA to
600 µA). Both the Vch range and the Ich range were kept constant, and were respectively 30
mV and 300 mV. Previous tests have demonstrated that varying either the Vch range or the
Ich range had very small consequences on the obtained PSDs. In this manner, a bank of
reference for the instrumental noise was constituted for each impedance and IE range
values.
The Power Spectral Density (PSD) curves were obtained by using the same MatLab routine
described in Section III.3.2.3. The procedure implied a linear detrending of each data block
before the estimation of its corresponding PSD. In cases when the FFT method was adopted
(Periodogram MatLab function), the PSDs were calculated taking into account a block
length of 4096 points and averaged 4 times. In the cases when the MEM algorithm (Pyulear
MatLab function) was implemented, the estimation was performed by taking into ac count
a single block of 16384 points and a MEM degree of 100.
VI.3.1 Results and discussion
Figure VI-5 to VI-8 represent the results obtained for each dummy cell. Each figure
compiles both the PSD potential and current noises obtained for each IE range. The
displayed PSDs were estimated according to the MEM method. In fact, both the MEM and
the FFT PSDs were compared, and both were observed to display the same levels.
Nevertheless, the advantage of using the MEM algorithm is that the obtained PSD are
Cette thèse est accessible à l'adresse : http://theses.insa-lyon.fr/publication/2017LYSEI059/these.pdf © [J. Bolivar], [2017], INSA Lyon, tous droits réservés

Chapter VI: Analysis of Electrochemical Noise during Stress Corrosion Cracking Tests
José Bolivar 165
Thèse en Sciences des Matériaux / 2017
Institut national des sciences appliquées de Lyon
naturally smoothed and do not need to be averaged as in the case of the FFT-based method.
The latter implies that there is no need to acquire lengthy data in order to obtain smooth
PSDs unlike the FFT method were the results need to be averaged in order to diminish the
noisy aspect. Hence, the MEM method is much more suitable when multiple acquisitions
have to be done.
Note that all the results respected the Nyquist-Shannon theorem (see Appendix A), meaning
that the minimum analyzed frequency (fmin) corresponds to the inverse of the duration of
the time record (0.006 Hz) while the maximum frequency corresponds to the half of the
sampling frequency, namely 50 Hz (fmax). Moreover, it can be noted that all the PSDs
showed a drastic fall at high frequencies, close to fmax. The latter is due to the presence of
antialiasing filter inherent to the REF600 Gamry potentiostat (see Appendix A for aliasing).
Regarding the measurements of potential (voltage channel), the instrument was not able to
detect the potential thermal noise of the resistors, regardless both the IE range and the value
of the resistors used for the acquisitions. Generally, the levels of the PSDs of potential
noise (ΨV) were several order of magnitude higher than the theoretical values (6kTR), except
for the measurements performed on the dummy cell of 1 MΩ (see Figure VI-8). In that case,
the potential PSDs (ΨV) at higher frequencies was close to the potential thermal noise of the
resistor (same magnitude).
Moreover, it was also observed that all the potential power spectrums ΨV were relatively
constant, showing any dependence to the IE range used (Rm resistance). Figure VI-9 depicts
the compilation of all the PSDs of potential fluctuations ΨV for all the resistors and all the
IE range. It can be noted that the only group of curves that do not superimpose entirely are
those corresponding to the 1 MΩ dummy cell, which displayed a more significant noise
level at higher frequencies, probably due to a contribution of the thermal noise (6kTR) and
the instrumental noise. On the other hand, at very low frequencies (<0.007 Hz) the potential
PSDs displayed considerable disagreement between each of them. Nevertheless, no
dependency on the used IE range was noted. Therefore, it is believed that this behavior
could be originated by some artifact induced by the de-trending stage (e.g. signal
conditioning before signal processing, see Appendix B).
Note that the behavior observed in the power spectrum of the potential noise ΨV agrees with
Equation VI-11 derived by Huet. In fact, Equation VI-11 establishes that the measured
potential noise depends on both the value of the resistors (thermal noise) and the potential
noise sources 𝛹𝑒𝑛0 and 𝛹𝑒𝑛1
. Consequently, the instrumental noise in the voltage channel is
constant regardless the IE range implemented on the measurements. Moreover, it was
observed that their values were always greater than the thermal potential noise of the
resistors studied, particularly at low frequency when the baseline noise of the instrument
was significant.
Cette thèse est accessible à l'adresse : http://theses.insa-lyon.fr/publication/2017LYSEI059/these.pdf © [J. Bolivar], [2017], INSA Lyon, tous droits réservés

Chapter VI: Analysis of Electrochemical Noise during Stress Corrosion Cracking Tests
José Bolivar 166
Thèse en Sciences des Matériaux / 2017
Institut national des sciences appliquées de Lyon
Figure VI-5. Potential and current power spectra for tests on dummy cells of 100 Ω, for acquisition with
different IE range (Rm)
Figure VI-6. Potential and current power spectra for tests on dummy cells of 1000 Ω, for acquisition with
different IE range (Rm)
Figure VI-7. Potential and current power spectra for tests on dummy cells of 10 kΩ, for acquisition with
different IE range (Rm)
Cette thèse est accessible à l'adresse : http://theses.insa-lyon.fr/publication/2017LYSEI059/these.pdf © [J. Bolivar], [2017], INSA Lyon, tous droits réservés

Chapter VI: Analysis of Electrochemical Noise during Stress Corrosion Cracking Tests
José Bolivar 167
Thèse en Sciences des Matériaux / 2017
Institut national des sciences appliquées de Lyon
Figure VI-8. Potential and current power spectra for tests on dummy cells of 1 MΩ, for acquisition with
different IE range (Rm)
Figure VI-9. Comparison of all the potential power spectra acquired for the different dummy cells (including
all the IE ranges)
The current noise, generated by the different dummy cells was also analyzed. The results
are included in Figure VI-5 to VI-8. In this case, it was noted that the level of the PSD of
the current noise ΨI, varied according to the IE range employed for the acquisitions, unlike
the voltage channel where the instrumental noise was constant. Moreover, it was noticed
that increasing the sensitivity of the IE range (by increasing Rm), the measured ΨI tended
to decrease, excepting for some ranges of Rm for which the current PSDs ΨI kept a constant
level. The values of the IE range (Rm) for which the ΨI were constant varied according to
the impedance of the resistors. In order to depict the above result, the reader can refer to
the ΨI of the 1 MΩ dummy cell in Figure VI-8. It can be appreciated that the current PSD
decreases as the Rm values (used for the current measurements) increase, except for the Rm
of 2 MΩ, 20 MΩ and 200 MΩ for which the ΨI remained constant. In addition, it can be
seen that the PSD of current noise ΨI achieves values lower than the current thermal noise
of the resistors, which is the minimum theoretically expected. The above can be described
Cette thèse est accessible à l'adresse : http://theses.insa-lyon.fr/publication/2017LYSEI059/these.pdf © [J. Bolivar], [2017], INSA Lyon, tous droits réservés

Chapter VI: Analysis of Electrochemical Noise during Stress Corrosion Cracking Tests
José Bolivar 168
Thèse en Sciences des Matériaux / 2017
Institut national des sciences appliquées de Lyon
by the formula deduced by Huet (Equation VI-12). In fact, it can be observed that for small
values of Rm, the measured signal is very polluted by instrumental noise (𝛹𝑒𝑛𝑖
𝑅𝑚2 ,4𝐾𝑇
𝑅𝑚,
𝛹𝑒𝑛0
4𝑅2 )
whose contribution decreases as Rm increases, except for 𝛹𝑒𝑛0 which is constant and whose
contribution only depends on the impedance of the resistors. The latter can be depicted in
the decreasing trend of the PSD as the Rm increases from 20 kΩ to 200 kΩ. Nevertheless,
it is observed that for 2 MΩ and 20 MΩ, the PSDI does not decrease despite the increase of
the Rm values. The only explanation for this behavior is that the term 𝛹𝑒𝑛𝑖
𝑅𝑚2 is now small
enough and does not contribute anymore to the measured signal (1/Rm2 dependency). In
contrast, the dominating noise is now the term 𝛹𝑒𝑛0
4𝑅2 . This can be confirmed by a simple
assessment either at low or high frequencies, by comparing the level of ΨV which can be
approximated by 𝛹𝑒𝑛0/4. Finally, it can be observed that for the IE ranges corresponding to
Rm values of 200 MΩ or 2 GΩ, the measured ΨI achieved levels lower than 2kT/R. In fact,
it can be observed in Figure VI-4 that the current measuring channel is composed by the
measuring resistor Rm in parallel with a capacitor C which forms a Low Pass Filter. The
latter is the origin of the second coefficient in Equation VI-12. The coefficient is equal to
one in most of the cases, but for specific values of Rm, C and f, the signal is attenuated,
which induces the obtaining of PSDs with lower levels than the thermal noise of the
resistors. In this manner, it can be argued that the optimum IE ranges to perform ENM will
be those for which the obtained PSD superimpose, meaning that the contributions of both
the 𝛹𝑒𝑛𝑖 and the 4kT/Rm are negligible. As un example, the optimum IE ranges to measure
the current noise in a 1 kΩ resistor are respectively 6µA (Rm = 2 kΩ ), 600 nA (Rm = 20
kΩ ) and 60 nA (Rm = 200 kΩ). The IE range of 60 nA will be in that case privileged
because it will allow having a better resolution for current measurements. However, it must
be considered that in a corrosion test, the system can evolve and the Open Circuit Potentials
(OCPs) of the electrodes can differ. In this case, the ZRA will polarize the CE to bring its
potential to that one of the WE, by imposing a DC current. Hence, a sensitive IE range (high
Rm) could lead to an overload of the current measuring channel if the amplitude of the DC
current is larger than the maximum limit of the corresponding IE range, resulting in a loss
of information.
Given these points, it was not possible to measure the thermal noise of the resistances (100
Ω, 1 kΩ, 10 kΩ and 1 MΩ) in the bandwidth analyzed (0.006 to 50 Hz) . Nevertheless, the
obtained results represented the fingerprint of the instrumental noise level (baseline noise).
Consequently, these results will be used in the next section in order to distinguish the
bandwidth where the corrosion events are the primary source of noise from the remaining
bandwidth where the instrumental noise is expected to be dominant.
VI.3.2 Synopsis
Through this section, an experimental procedure was presented and implemented in order
to evaluate the instrumental noise during ENM. The procedure was based on testing
different dummy cells composed of three equal resistors, whose impedance and noises
Cette thèse est accessible à l'adresse : http://theses.insa-lyon.fr/publication/2017LYSEI059/these.pdf © [J. Bolivar], [2017], INSA Lyon, tous droits réservés

Chapter VI: Analysis of Electrochemical Noise during Stress Corrosion Cracking Tests
José Bolivar 169
Thèse en Sciences des Matériaux / 2017
Institut national des sciences appliquées de Lyon
values are well defined. The values of the resistors were chosen so that they correspond to
the impedance modulus adopted by the WE and the CE during the SCC tests. In the same
manner, the experimental conditions during the different acquisitions were as close as
possible to those used during the SCC tests. The obtained results allowed identifying the
different sources of instrumental noise according to the different parameters (mainly IE
range). Moreover, the collected data allowed assessing the baseline noise of the EN
equipment which will be used to ensure data validity in the next section.
VI.4 Application of ENM in SCC studies:
influence of current partition and
instrumental noise
The present section is devoted to a detailed study of the EN records obtained during the
development of multiple IG-SCC. Much of the analysis will be focused on the study of the
influence of both the instrumental noise and the rise in asymmetry, in Electrochemical
Noise Measurements. For this, the analysis will be based on the SCC experiment CC 04-
16, which is equivalent to the experiments presented in Section V.3 (Chapter V). The
experiment was performed under constant load (0.8 σy) on a MAS specimen in a 0.01 M
potassium tetrathionate solution at pH 3.0. The parameters describing the crack density
curve (see Section V.3.1.1, in Chapter V) are gathered in Table VI-3. It can be noted that
the development of the present cracks colony was equivalent to those characterized in
Section V.3.1.1, i.e. the CC 04-16 test exhibits equivalent values of initiation time ta,
maximal crack density, and tb.
Table VI-3.Crack density values and characteristic times for constant load tests (at 0,9 σy) conducted in 0.01 M
potassium tetrathionate solution at pH 3.0 with different pre-immersion times
ID test
Immersion
time before
loading (h)*
Crack
initiation
(ta, min)
Maximal
crack density
(𝐜𝐫𝐚𝐜𝐤𝐬
𝐜𝐦𝟐 )
tb
(min) m (
𝒄𝒓𝒂𝒄𝒌𝒔
𝒎𝒊𝒏∗𝒄𝒎𝟐)
CC 02-15 4 493 232 763 1.36
CC 03-15 1 378 240 830 1.37
CC 01-15 5 187 307 712 1.43
CC 05-15 24 71 169 391 1.45
CC 04-16 5 170 182 669 1.26
* The time t=0 corresponds to the moment where the loading is applied
For the tests presented in the precedent section, the samples were not completely electrically
isolated from the tensile machine, which was incompatible with quantitative ENM (only
trends were interpreted). For the present CC 04-16 test, the sample was completely isolated
from the tensile machine by placing emery paper between the sample and the tensile test
Cette thèse est accessible à l'adresse : http://theses.insa-lyon.fr/publication/2017LYSEI059/these.pdf © [J. Bolivar], [2017], INSA Lyon, tous droits réservés

Chapter VI: Analysis of Electrochemical Noise during Stress Corrosion Cracking Tests
José Bolivar 170
Thèse en Sciences des Matériaux / 2017
Institut national des sciences appliquées de Lyon
grips. That insulation solution was not applied in the previous tests (presented in Chapter
V), because it is incompatible with AE measurements as the sliding/rupture of the SiC
particles (of the emery paper) polluted in a significant manner the AE records.
The test was monitored by DIC and EN. The EN was acquired with a REF600 Gamry
potentiostat with a sampling frequency of 10 Hz. The acquisition parameters were: Vch range
= 30 mV, Ich range = 300 mV and IE range = 60 µA. The acquisition was performed under
free corroding conditions in a ZRA mode. The CE (used for ENM) was spaced 5 mm from
the rear side of the WE; all the system was contained inside a Faraday Cage connected to
the floating ground of the potentiostat. The reader can refer to Section III.2.6 and III.2.7.2
(in Chapter III) for more details about the experimental procedure and sample preparation.
Moreover, three Electrochemical Impedance Spectroscopy (EIS) measurements were
performed during the advance of the damage. The EIS measurements were carried out on
both the WE and the CE (see Section III.3.4 for details), by the use of a Pt auxiliary
electrode.
The development of the test is depicted in Figure VI-10, where the load, the raw EN data
and the evolution of the crack density are plotted. Note that the main time scale is given in
hours for convenience reasons (but a secondary axis ranged in minutes is also provided for
comparison with the results presented in Chapter V) and that the zero time corresponds to
the moment when the loading started, that is to say, after 5 hours of pre-immersion. The
experiment lasted around 23 h, including the 5 hours of pre-immersion (span without load).
It must be mentioned that this test was performed until rupture, marked by the peak in
current around 18 h. Moreover, the moments when the EIS measurements were done are
represented by orange circles (e.g. EIS 00, EIS 01 and EIS 02). As can be seen, their
distribution was not regular because of the extended duration of the test. Selected images
captured by the CCD camera are also presented in the lower part of Figure VI-10 to illustrate
the development of the IG-SCC process. The morphology of the obtained crack colony is
the same than those studied by DIC in Chapter V. Note that the first crack was detected by
DIC after 3 hours of test under applied load, however, crack initiation rate significantly
increases 8 hours after sample loading. Moreover, the maximum of cracks density is
achieved after 11 hours; from this moment the cracks density starts to decrease due to the
lack of further initiations and the increase on coalescence events (see V.3.1.4).
In that context, the rest of the section is organized as follows. A first subsection will detail
the obtained results. There, the general trends of the EN data in the temporal and frequency
domains will be discussed. A subsequent section will be dedicated to the discussion of the
obtained results, notably the influence of instrumental noise and the electrode asymmetry
on ENM. Finally, a synopsis of the section will summarize the main points and conclusions.
Cette thèse est accessible à l'adresse : http://theses.insa-lyon.fr/publication/2017LYSEI059/these.pdf © [J. Bolivar], [2017], INSA Lyon, tous droits réservés

Chapter VI: Analysis of Electrochemical Noise during Stress Corrosion Cracking Tests
José Bolivar 171
Thèse en Sciences des Matériaux / 2017
Institut national des sciences appliquées de Lyon
Figure VI-10. Compilation of DIC and EN data of the test CC 04-16. (Top) Evolution of the EN signals and
crack density during the experiment. (Bottom) CCD picture of the sample surface showing the development of
the crack colony
VI.4.1 Presentation of the results
As mentioned, Figure VI-10 depicts the evolution of the raw EN signals during the SCC
process. It can be noted that the general evolution of the Electrochemical Potential Noise
(EPN) and Electrochemical Current Noise (ECN) followed the same trends as those
observed in the precedent chapter: a drastic fall of the EPN signal is observed at the sample
loading moment, accompanied by a sharp increase of the ECN. Subsequently, the EPN
continues to decrease until the end of the test while the ECN follows a different evolution.
The ECN displays an increasing tendency until around 7 h, then the ECN remains relatively
constant until 10 h where it started to slightly decrease until the rupture of the sample. As
already discussed, those trends are characteristic of the development of an active process
such as Intergranular Attack or Intergranular Stress Corrosion Cracking.
The signals were also analyzed in the frequency domain trough the estimation of the Power
Spectrum Density (PSD). The PSDs were obtained through the FFT method, using a block
length of 8192 points (819.2 s) and averaging 10 PSDs. The results are gathered in Figure
VI-11 together with the PSD of the instrumental noise previously determined in Section
VI.3. Those PSDs will be cited as the "reference" spectra, as they represent the instrument
Cette thèse est accessible à l'adresse : http://theses.insa-lyon.fr/publication/2017LYSEI059/these.pdf © [J. Bolivar], [2017], INSA Lyon, tous droits réservés

Chapter VI: Analysis of Electrochemical Noise during Stress Corrosion Cracking Tests
José Bolivar 172
Thèse en Sciences des Matériaux / 2017
Institut national des sciences appliquées de Lyon
noise level for the same acquisition parameters than those used during the SCC test (Vch,
Ich, IE range), according to the different values of impedance (from 100 Ω to 10 kΩ). It is
important to highlight that only 5 spectra belonging to the SCC experiment are depicted in
order to facilitate the understanding. They are presented for the periods of time ranging
from 6.3 h to 15.4 h. Regarding the shape of the PSDs, very few discrepancies were
observed: their shape and levels varied slightly during the development of the experiment.
A noticeable characteristic on both potential and current PSDs was the apparition of a bump
between 0.1 and 1 Hz. Nevertheless, its amplitude was not constant through all the
experiment. In fact, the amplitude of the bump decreased as the test advanced. Note that
the apparition of this hump suggests the presence of periodic transient whose rate of
appearance is within this frequency range. Another remarkable feature is the observation of
one peak at 2 Hz and its harmonics at 4 Hz on the PSD of the current noise. Their amplitude
was observed to increase over the time. Note that the PSD of potential noise did not present
those peaks.
Figure VI-11. Power Spectrum Density plots for the potential and current noise. The PSD corresponding to the
instrumental noise according to different impedance magnitudes are also included (dummy cell of 100 Ω, 1 kΩ,
and 10 kΩ)
Furthermore, the Standard Deviation (SD, σ) of the EN signals was calculated taking into
account 4096 points/blocks. Its assessment was performed both in the temporal and in the
frequency domains (see Section III.3.2.3 in Chapter III). The results are presented in Figure
VI-12. Despite the intensification of the IG-SCC process all along the test, the SDs of the
signals remain constant without showing any correlation with the intensification of the
damage.
Finally, Figure VI-13 gathers the three EIS measurements performed during the test. Figure
VI-13 includes an extract of the evolution of the impedance modulus of both the Working
Electrode and the Counter Electrode. The range of showed frequencies is comprised
between 10 mHz and 100 Hz. For this range, it can be appreciated that the impedance
modulus is globally comprised between 10 kΩ and 100 Ω. Regarding the modulus of the
WE, it can be seen that its magnitude decreases as time went by, which agrees with the
advancement of the IG-SCC process. In contrast, the evolution of the impedance modulus
Cette thèse est accessible à l'adresse : http://theses.insa-lyon.fr/publication/2017LYSEI059/these.pdf © [J. Bolivar], [2017], INSA Lyon, tous droits réservés

Chapter VI: Analysis of Electrochemical Noise during Stress Corrosion Cracking Tests
José Bolivar 173
Thèse en Sciences des Matériaux / 2017
Institut national des sciences appliquées de Lyon
of the CE displays an increase between -4 h and 4 h (i.e. between 1 hour after immersion
and 9 hours after test starts) and then remained relatively stable until the end of the test.
The latter suggests the building of a passive state as the time went.
Figure VI-12. Evolution of the standard deviations of the potential and current noise, calculated from the time
domain (statistic) and from the frequency domain (FFT): 4096 points/block and de-trended with a polynomial
of degree 5
Figure VI-13. Results of the EIS measurements performed on the WE (at the Left) and the CE (at the Right)
during the SCC experiment (CC 04-16)
VI.4.2 Discussion
The first results described in the previous section concerned the visual examination of the
raw EN records, particularly the evolution of the EPN and ECN. It was observed that the
EPN was relatively stable before loading starts, then, once the stress was applied, it felt
drastically. The drop continued during the entire test until the rupture of the sample. On the
other hand, the ECN showed a low DC level in the absence of stress. Once the stress began,
Cette thèse est accessible à l'adresse : http://theses.insa-lyon.fr/publication/2017LYSEI059/these.pdf © [J. Bolivar], [2017], INSA Lyon, tous droits réservés

Chapter VI: Analysis of Electrochemical Noise during Stress Corrosion Cracking Tests
José Bolivar 174
Thèse en Sciences des Matériaux / 2017
Institut national des sciences appliquées de Lyon
the ECN increased sharply towards high anodic current values. This behavior has been
observed during all the experiments performed during this work and has been explained by
the significant contribution of anodic dissolution in the initiation and propagation of cracks.
Based on the slip dissolution model, it can be argued that the drastic fall in potential
corresponds to the exposure (after some film-rupture events) of the bare metal towards the
solution. The latter creates a mixed potential between the noble potential of the passive
surface and the potential of the bare metal, which is generally more anodic. Hence, the
potential decreases as the cracks propagate. On the other hand, the trends observed in the
DC level of ECN have been used to monitor the progress of IG-SCC process. The
dissolution processes occurring at the crack tips (and walls) have been identif ied for being
responsible for increase in the DC ECN level [129], [188], [236]. However, during the IG-
SCC phenomena, the electrodes (WE and CE) develop some asymmetry as they are not
experiencing the same damage (e.g. CE is neither stressed nor cracked). Hence, the ZRA
may provide some current in order to keep both electrodes (WE and CE) at same potential,
which in turn, can also contribute to the DC level of the current records. Yet, in spite that
it is very difficult to discern its exact origin, its trends provide information about the active
state of the WE compared to one of the CE.
Another result evidenced in the precedent section is the evolution of the SD of the EPN and
ECN during the SCC process. It was noted that despite the intensification of the cracking
process, the SDs remained relatively constant, without showing any correlation with the
initiation and propagation of multiple cracks. Because of this puzzling result, the temporal
records were examined to see if some transients/fluctuations could be associated with
cracking. Figure VI-14 presents the extraction of 1 hour of both the EPN and the ECN. It
can be noticed that both signals display fluctuations of large amplitude which are not
correlated to each other, which means that a drop in potential does not correspond to an
increase in current as it would be expected according to the slip dissolution model. Such
low-frequency fluctuations are therefore believed to be more related to the CE rather than
to events happening on the WE. However, it was observed that both signals presented low
amplitude and high frequency correlated transients. An enlarged detail about those high-
frequency fluctuations is included on the right hand side of Figure VI-14. Indeed, the
frequency of such variations was observed to be within the range where the PSD displayed
a hump (0.1 - 1 Hz). It is believed that these high-frequency fluctuations are related to IG-
SCC process rather than some instrumental noise. Actually, if they were originated by some
external noise, they should also be present in the test associated with the analysis of
instrumental noise. Moreover, it was noticed that the amplitude of these transients decreases
when the test goes on, which is correlated to the diminution of the bumps in the potential
and current PSDs. Consequently, it can be argued that those transients are directly related
to the bump observed on the power spectra. Nevertheless, if the transients are related to the
cracking process they should not disappear during the experiment, unless if a possible rise
in the asymmetry of the system induces its attenuation. This point will be developed in the
next paragraphs.
Cette thèse est accessible à l'adresse : http://theses.insa-lyon.fr/publication/2017LYSEI059/these.pdf © [J. Bolivar], [2017], INSA Lyon, tous droits réservés

Chapter VI: Analysis of Electrochemical Noise during Stress Corrosion Cracking Tests
José Bolivar 175
Thèse en Sciences des Matériaux / 2017
Institut national des sciences appliquées de Lyon
Figure VI-14. Extract of a portion of the time records of the de-trended EPN and ECN for the test CC 04-16
As detailed in the theoretical section of this chapter, the current partition during ENM will
depend on the impedance modulus of the electrodes (here WE and CE) which constitute the
electrochemical cell (see Equation VI-5). In order to see if the studied system experienced
significant asymmetry, some EIS measurements were performed during the SCC test on the
WE and CE. The results of such measurements shown that |ZWE| decreases during the test,
which is the normal behavior of an electrode submitted to localized corrosion (IGA, SCC).
The magnitude of its modulus at 10 mHz decreases approximately one decade (10 kΩ to 1
kΩ). On the other hand, the modulus of the CE increased slightly at the beginning of the
experiment and then remained relatively stable around 10 kΩ. The latter suggests the
establishment of a more passive state compared to the WE. Such differences on the
impedances modulus of the WE and CE might naturally develop a continuous rise in the
asymmetry of the system as the IG-SCC process progresses.
Only three EIS measurements were performed during the experiments , including one after
the rupture of the sample (EIS 02). This measurement might have a limited reliability for
analysis. Nevertheless, it can be observed on Figure VI-10 that after 18 h of test under load,
the sample is deeply cracked and hence, its modulus should be very close to that one of a
broken sample. In order to study the rise in asymmetry, the obtained modulus of the WE
(|ZWE|) were interpolated in the time domain. A power law was assumed to describe the
evolution of the magnitude of the impedance (for each frequency10
, fi) at time ti. The
10
For each frequency value (fi) of the measured impedance modulus of the WE (EIS 00, EIS 01, EIS
02), Equation VI-13 was applied for the interpolation in the time domain of the impedance modulus.
Cette thèse est accessible à l'adresse : http://theses.insa-lyon.fr/publication/2017LYSEI059/these.pdf © [J. Bolivar], [2017], INSA Lyon, tous droits réservés

Chapter VI: Analysis of Electrochemical Noise during Stress Corrosion Cracking Tests
José Bolivar 176
Thèse en Sciences des Matériaux / 2017
Institut national des sciences appliquées de Lyon
relationship is given by Equation VI-13, where t is time and A, B and C are constants
determined by fitting. The power law is widely used to describe the rate of consumption of
chemical reactant in a reaction and was observed to fit very well the input data ( R2 ∈ [0.9 -
1]).
|𝑍𝑊𝐸| (𝑡, 𝑓𝑖) = (𝐴 ∗ 𝑡𝐵) + 𝐶 at fi Equation VI-13
The graph on the left hand side of Figure VI-15 compiles the results obtained from the
interpolation of |ZWE|, together with the mean impedance modulus of the CE (|ZCE|). On the
other hand, the graph on the right hand side displays the ratio between |ZCE| and |ZWE| for
different times. Note that a ratio larger than one means that the electrodes are asymmetric.
As can be seen, the ratio is larger than one and increases as time went by, evolving from
around 1.5 at 2 hours, until approximately 5.5 at 18 hours. A ratio of 3 means that the
contribution to the measured current from a corrosion event occurring on the WE represents
only 25 % of the total current (see Equation VI-5). The latter explains why the bump on the
PSD decreases with time, and shows how important is asymmetry if EN is employed for
quantitative purposes.
Figure VI-15. Evaluation of the asymmetry of the SCC system during the experiment CC 04-16. (Left) results of
the interpolation of |ZWE| with time. (Right) Evolution of the ratio between the impedances of the CE and the WE
Another point that was addressed during this work was the identification of the frequency
bandwidth containing the information on the IG-SCC process. It was previously observed
that there exist uncorrelated low-frequency transients, whose origin is doubtful, indicating
the presence of a lower limit from which no information related to the advance of cracking
could be obtained. Moreover, it seems that there exists an upper limit from which the
instrumental noise is dominant. Actually, it can be noted on Figure VI-11 that from 1 Hz,
the PSD of the potential noise superimposes with the PSD of the dummy cell, suggesting
Cette thèse est accessible à l'adresse : http://theses.insa-lyon.fr/publication/2017LYSEI059/these.pdf © [J. Bolivar], [2017], INSA Lyon, tous droits réservés

Chapter VI: Analysis of Electrochemical Noise during Stress Corrosion Cracking Tests
José Bolivar 177
Thèse en Sciences des Matériaux / 2017
Institut national des sciences appliquées de Lyon
that from 1 Hz the obtained signal is mainly produced by the instrument. Additionally, from
0.1 Hz, the PSD in current is located between the instrumental noise for a resistor of 100 Ω
and the one for a resistor of 1 kΩ (see Figure VI-11). In order to better determine the upper
limit, the time for which |ZWE| was equal to 1000 Ω and 500 Ω was determined (from Figure
VI-15). The results are depicted in Figure VI-16; above 1 Hz, |ZWE| is always lower than
1000 Ω. Moreover, at least until 0.1 Hz, |ZWE| is always higher than 500 Ω. Consequently,
it can be stated that above 1 Hz the recorded signals can be related to the instrumental noise
of a resistor whose impedance is between 500 Ω and 1000 Ω. In addition, between 0.1 Hz
and 1 Hz the recorded signal correspond to some corrosion events on the WE (bump in
PSDs) but, due to the progressive rise in asymmetry, the instrumental noise might
potentially become more and more dominant and also contribute to the attenuation.
Figure VI-17 presents the standard deviations of the current σECN and potential noise σEPN
signals calculated in the frequency domain. The SD were assessed in the frequency range
comprised between 0.01 Hz and 1 Hz, which is expected to be dominated by the corrosion
processes. For this, both EPN and ECN were digitally filtered by using a bandpass filter in
MatLab. After the digital treatment, σEPN is relatively constant until around 8 h, then,
displays continuous increase over the time. Note that, this time, the SD was correlated with
the significant increase on the crack density curve (see Figure VI-10). In contrast, σECN is
much less sensitive to the intensification of the cracking process; the increase of σECN is
only noted from approximately 16 h. In order to be more realistic, the rise in asymmetr y
was taken into account on the current partition. In this manner, the system formed by
Equation VI-6 and Equation VI-7 was solved in order to estimate the power of the signal
produced only by events provided by the WE (WE1 in the theoretical description), that is to
say 𝛹𝑖1. Subsequently, the standard deviation of the current was calculated from the 𝛹𝑖1
over the frequency range dominated by the corrosion events (from 0.01 Hz to 1 Hz) . The
result is presented in Figure VI-18. It can be clearly appreciated that taking into account
the instrumental noise and the asymmetry of the system, the standard deviations of the
signal give an indication of the progress of the corrosion process, even for a very low EN
emissive system.
Figure VI-16. Evolution of the cutoff frequency for which the |ZWE| is equal to (i) 500 Ω (in red) or (ii) 1000 Ω
(in black)
Cette thèse est accessible à l'adresse : http://theses.insa-lyon.fr/publication/2017LYSEI059/these.pdf © [J. Bolivar], [2017], INSA Lyon, tous droits réservés

Chapter VI: Analysis of Electrochemical Noise during Stress Corrosion Cracking Tests
José Bolivar 178
Thèse en Sciences des Matériaux / 2017
Institut national des sciences appliquées de Lyon
Figure VI-17. Standard deviations of the EPN and ECN during the SCC test (CC 04-16), calculated from the
PSDs by using Equation II-17 (4096 points/block). The signal was band-pass filtered (fc1 = 0.01 Hz, fc2 = 1
Hz)
Figure VI-18. Standard deviations of the ECN during the SCC test (CC 04-16) taking into account the
asymmetry of the system, calculated from the PSDi1 by using Equation II-17 (4096 points/block). The signal
was band-pass filtered (fc1 = 0.01 Hz, fc2 = 1 Hz)
VI.4.3 Synopsis
This section described the EN records obtained during the development of multiple IG-
SCC. It was observed that following a classical analysis without any data treatment
(filtering), the obtained standard deviations of the signals did not show any correlation with
the intensification of the IG-SCC. Two points were therefore investigated, (i) the frequency
domain where the instrumental noise dominated the EN records and (ii) the influence of
current partition on the obtained data. The first point was determined by using the
"reference" signature of the baseline noise levels of the potentiostat. The latter was
previously identified through EN measurements performed on dummy cells. A comparison
between the reference PSDs and the EN data obtained from the IG-SCC experiment
permitted to state that the instrumental noise was dominant for frequencies larger than 1
Hz. Moreover, uncorrelated low-frequency fluctuations (< 0.01 Hz) were neglected in the
analysis because of their doubtful origin. Consequently, the frequency bandwidth analyzed
was comprised between 0.01 Hz and 1 Hz and corresponded to signals mainly generated by
corrosion. On the other hand, thanks to EIS measurements (performed during the SCC test)
and the use of Bertocci and coworkers model (presented in Section VI.2.1), the level of
asymmetry was determined. The results show that due to the stressing condition acting on
Cette thèse est accessible à l'adresse : http://theses.insa-lyon.fr/publication/2017LYSEI059/these.pdf © [J. Bolivar], [2017], INSA Lyon, tous droits réservés

Chapter VI: Analysis of Electrochemical Noise during Stress Corrosion Cracking Tests
José Bolivar 179
Thèse en Sciences des Matériaux / 2017
Institut national des sciences appliquées de Lyon
the WE and the relative passive state of the CE, a natural asymmetric system develops. The
latter was observed to influence current partition which induces a partial registering of the
current produced by the corrosion events on the WE.
VI.5 Critical analysis of the rise in the
asymmetry between electrodes during
SCC process
One attempt was made to develop an experimental approach for the quantification of the
anodic dissolution involved in the propagation of a single IG-SCC crack. The methodology
also aimed at obtaining mechanistic information about the process involved in crack
propagation, notably the determination of the continuous character of the crack advance
process. Unfortunately, the propagation of a single crack was very difficult to be achieved
in the system of study. However, the approach permitted to rationalize how significant
could be electrode asymmetry in ENM. The reasons and the results will be presented in this
section.
In order to nucleated a single crack, samples with a lateral transversal notch (LTNS sample,
see Section III.2.2) were used. The initiation and the propagation of a pre-crack were
performed by fatigue tests which were carried out in an MTS hydraulic tensile machine of
200 kN. The waveform was a sine signal with a frequency of 3 Hz. The ratio between the
maximal and minimal load was R f = 0.1. Hence, the sample was always submitted to a
tensile stress. The maximum stress was equal to 1.10 σy at the ligament. Usually, the tests
took around 150.000 cycles in order to obtain a pre-crack length ranging between 200 and
500 µm. The initiation and the growth of the pre-crack was monitored by DIC. Before the
fatigue test, sample surfaces were prepared for DIC measurements as usual. For more
details about sample preparation, the reader can refer to Section III.2.6.
The test that is presented here is the experiment CC 06-16. Table VI-4 gathers the main
information about this experiment. Note that this test was performed at pH 4.0 and was
monitored by EN, EIS and DIC measurements. The experiment was carried out until rupture
and lasted 30 h. Also note that the specimen was stressed until 1.10 σy during the SCC test
on the remaining ligament, instead of 0.8 σy for smooth samples. In this context, the next
section will present the more important results and their respective discussion.
Cette thèse est accessible à l'adresse : http://theses.insa-lyon.fr/publication/2017LYSEI059/these.pdf © [J. Bolivar], [2017], INSA Lyon, tous droits réservés

Chapter VI: Analysis of Electrochemical Noise during Stress Corrosion Cracking Tests
José Bolivar 180
Thèse en Sciences des Matériaux / 2017
Institut national des sciences appliquées de Lyon
Table VI-4. Stress Corrosion Cracking test CC 06-16 on an MAS Alloy 600 sample immersed in 0.01 M K2S4O6
at pH 4.0
Test ID Loading pH
Test
duration
(h)
Pre-
immersion
(h)
Techniques Vch Ich I/E
range
CC 06-16 CL 1,1 σy 4.0 30 2 DIC -EN - EIS 30 mV 300 6 µA
VI.5.1 Results and discussions
Figure VI-19 exhibits the EN raw data together with the stress curve. The evolution of the
DC levels of the EN signals follows exactly the same trends already observed in previous
experiments. The only difference was the presence of spikes in the ECN, going both in
positive and negative directions. Such high-frequency fluctuations did not show a direct
correlation with the EPN signals, and their origin is unknown.
Figure VI-19. Compilation of data for the test CC 06-16 performed on a notched sample (LTNS)
Figure VI-20. Images of the surface of the notched sample CC 06-16. (a) Length of the pre-crack obtained after
the fatigue test. (b) CCD picture of the sample at time t=0 h during the SCC test. (c) CCD picture of the sample
at time t =21 h during the SCC test
Cette thèse est accessible à l'adresse : http://theses.insa-lyon.fr/publication/2017LYSEI059/these.pdf © [J. Bolivar], [2017], INSA Lyon, tous droits réservés

Chapter VI: Analysis of Electrochemical Noise during Stress Corrosion Cracking Tests
José Bolivar 181
Thèse en Sciences des Matériaux / 2017
Institut national des sciences appliquées de Lyon
Moreover, Figure VI-20 presents three images of the surface of the sample CC 06-16. As
can be seen, the obtained fatigue pre-crack had a length of 393 µm at the beginning of the
SCC test. A stress corrosion crack initiated from the fatigue pre-crack and caused the final
rupture of the specimen. Nevertheless, it can be noticed in Figure VI-20.c that multiple
cracks also initiated over the sample surface. As already observed in Chapter V, the
initiation process is closely related to local strains/stresses. Due to the presence of the
transversal notch and the axial loading, the stress/strain concentrated near the notch crack
tip and promoted crack initiations. Figure VI-21 depicts the size of this plastic zone at the
end of the propagation by fatigue of the pre-crack. Within this zone the strain is
significantly times higher than elsewhere on the gauge length. Moreover, the size of this
zone and the strain amplitude increase as the crack (nucleated at the notch) propagates. The
additional cracks therefore initiated within this plastic zone. This multiple crack initiation
was not desired as the EN signals comprises the additional influence of the propagation of
these surface cracks.
Figure VI-21. Longitudinal strain of the sample CC 06-16 at the end of the propagation of the pre-crack by
fatigue
Nevertheless, despite the intensification of the degradation over the time, the standard
deviation of the ECN signal did not display any sign of aggravation of the damage
(propagation of cracks). For this reason, the ECN signal was carefully checked in order to
obtain more information. Figure VI-22 depicts an extract of the de-trended EN record at
around 14 h of the test. There, two events pointed out by two green circles were identified.
Both were probably due to the propagation of a crack over some distance. The sharp
decrease in potential could be produced by film rupture at the crack tip . After this drop a
constant potential is measured ended by a significant increase. This period could well be
associated to crack propagation finalized by crack tip passivation. Similar transients have
already been mentioned in the literature and related to crack initiation and propagation
[145], [187], [191], [192] in sensitized 304 Stainless Steels in solutions containing
thiosulfates [194], [236]. Both events seem to produce a positive current; hence they could
be related to an anodic process happening on the WE. Nevertheless, it can be observed in
Cette thèse est accessible à l'adresse : http://theses.insa-lyon.fr/publication/2017LYSEI059/these.pdf © [J. Bolivar], [2017], INSA Lyon, tous droits réservés

Chapter VI: Analysis of Electrochemical Noise during Stress Corrosion Cracking Tests
José Bolivar 182
Thèse en Sciences des Matériaux / 2017
Institut national des sciences appliquées de Lyon
the ECN records that the current recorded during both events barely increased. Note also
that the amplitude of the increase of the current remained in the same order of magnitude
than the noise’s one, which could explain the constant standard deviation obtained for the
ECN. The weak amplitude of the corresponding current transient suggests the influence of
a certain degree of asymmetry as observed in the previous section.
Figure VI-22. Extract of a portion of the time records of the de-trended EPN and ECN for the test CC 06-16
As in test CC 04-16 (precedent section), four EIS measurements were also performed in
this experiment both on the WE and the CE. The temporal localization of each measurement
is depicted on Figure VI-19 as EIS 00, EIS 01, EIS 02 and EIS 03. For the present analysis,
only EIS 00 to 02 were used for the analysis of the WE behavior. On the other hand, the
impedance modulus of the CE was observed to be very stable. Hence, the mean of the four
measurements was taken. The analysis was performed following the same methodology as
the one detailed in the previous section, i.e., the four measured |ZWE| were interpolated in
the time domain according to a power law (see Section VI.4.2). The results of such analysis
are depicted in Figure VI-23, which includes |ZWE| but also the |ZCE|. It can be observed that
the modulus of the CE is more than one decade larger than the one of the WE (|ZCE| >|ZWE|).
Moreover, it can be noticed that |ZWE| diminishes during the entire experiment due to the
advancement of the IG-SCC. The ratio defining the asymmetry (|ZCE|/|ZWE|) of the system
was also calculated and is depicted on the right hand side of Figure VI-23. This time, the
asymmetry of the system was several times higher than during CC 04-16 test (see previous
section). In order to assess the criticalness of the asymmetry level experienced during this
Cette thèse est accessible à l'adresse : http://theses.insa-lyon.fr/publication/2017LYSEI059/these.pdf © [J. Bolivar], [2017], INSA Lyon, tous droits réservés

Chapter VI: Analysis of Electrochemical Noise during Stress Corrosion Cracking Tests
José Bolivar 183
Thèse en Sciences des Matériaux / 2017
Institut national des sciences appliquées de Lyon
test, the ratio corresponding to 15 h was chosen (see Figure VI-23), which is the closest to
the portion of the EN records showed in Figure VI-22. From Figure VI-23, it can be seen
that the ratio between 10 mHz and 100 mHz is comprised between 45 and 30. The latter
means that at that moment, the modulus of the CE is 45 to 30 times higher than the modulus
of the WE. According to Equation VI-5, it can be deduced that only 2.2 to 3.2 % of the
current originated by a corrosion event is measured by the ZRA, which explains the weak
level of current of the transient exhibited in Figure VI-22. This result is extremely important
because it demonstrates how critical can be the rise in asymmetry during an SCC test and
how current partition can affect the registered transients. In this case, an important
asymmetry gives rise to misleading results and to over-conservative measurements of the
real current released by a corrosion event on the WE. This results should alert emerging
techniques were noble CE are used in ENM, notably micro platinum counter-electrodes.
Figure VI-23. Evaluation of the asymmetry of the SCC system during the experiment CC 06-16. (Left) results of
the interpolation of |ZWE| with time. (Right) Evolution of the ratio between the impedances of the CE and the
WE
Cette thèse est accessible à l'adresse : http://theses.insa-lyon.fr/publication/2017LYSEI059/these.pdf © [J. Bolivar], [2017], INSA Lyon, tous droits réservés

Chapter VI: Analysis of Electrochemical Noise during Stress Corrosion Cracking Tests
José Bolivar 184
Thèse en Sciences des Matériaux / 2017
Institut national des sciences appliquées de Lyon
Chapter Summary
This chapter was focused on the investigation of the influence of both the instrumental noise
and the rise in asymmetry between the electrodes (inherent to the SCC tests when only the
working electrode is stressed) on the EN data.
The instrumental noise was evaluated through reference tests performed on dummy cells,
constituted by three identitcal resistors. The impedance of the resistors was chosen keeping
them within the range of values than those of the impedance modulus of the electrodes (WE
and CE) during the SCC experiments. The comparison between the obtained data and the
analytical formulas proposed by Huet and coworkers, allowed identifying the main noise
sources that contributed to the recorded data. Actually, the voltage channel did not show
any dependency on the IE range chosen for the EN measurements. In fact, the measured ΨI
appeared to be relatively constant regardless the value of the resistors and the chosen IE
range. Their magnitude was imposed by the regulation of the potentiostat and the amplifiers
on the voltage channel (𝛹𝑒𝑛0 and 𝛹𝑒𝑛1
). On the other hand, the current channel displayed a
more complex dependency to the instrumental noise. Indeed, the noise recorded by the
current channel displayed a high dependency to the chosen IE range. Nevertheless,
depending on the magnitude of the WE impedance, the noise can be highly reduced by
choosing an optimum IE range. The optimum IE range was described as those for which the
term 𝛹𝑒𝑛𝑖/Rm2 (in Equation VI-12) becomes very small compared to the noise term
𝛹𝑒𝑛0/4R2. In this situation, the measured PSDs superimpose to each other and can be
approximated to 𝛹𝐼= corrosion noise + 𝛹𝑒𝑛0/4R2. However, it was noted that increasing
too much the resistance related to the IE range (Rm) induces the attenuation of the measured
signal by the low-pass filter formed by Rm and C (related to the IE stability range ). Finally,
the obtained PSDs represented the baseline noise level of the potentiostat according to the
different impedances and IE range. Those acquisitions were used for the validation of EN
measurements associated to IG-SCC test.
The influence of electrode asymmetry on EN measurements was then demonstrated. The
EN data were acquired by using two electrodes made from Alloy 600 connected with a
Zero-Resistance ammeter (ZRA) and a Saturated Calomel Electrode (SCE) as a reference
electrode. Only one of the Alloy 600 electrodes (WE) was undergoing SCC in an acidified
0.01 M tetrathionate solution under constant load, while the other electrode (CE) remained
unstressed. The results showed that the measured current did not correspond to the totality
of the current released by the anodic process occurring on the stressed specimen. Actually,
only a fraction of the current due to localized corrosion phenomena at the WE was recorded
because of the higher impedance of the CE, which remains less active. The rest of the
registered current comes from the instrumental noise and the CE. Due to the rise in
asymmetry, the electrodes are not at the same potential and hence, the ZRA furnishes a DC
current in order to bring the CE at the same potential than the WE, thereby, contributing to
Cette thèse est accessible à l'adresse : http://theses.insa-lyon.fr/publication/2017LYSEI059/these.pdf © [J. Bolivar], [2017], INSA Lyon, tous droits réservés

Chapter VI: Analysis of Electrochemical Noise during Stress Corrosion Cracking Tests
José Bolivar 185
Thèse en Sciences des Matériaux / 2017
Institut national des sciences appliquées de Lyon
the recorded ECN. It must be highlighted that the above statements can sometimes
complicate the work with an optimum IE range. This polarization can saturate the optimum
IE range, imposing to work under a non-optimized set-up. Consequently, the introduction
of instrumental noise due to the use of lower Rm values is increased. Moreover, the
instrumental noise was identified, and its effective frequency bandwidth was compared with
that of the EN data related to the corrosion process. The consequences of the asymmetry of
the system were evaluated in the frequency domain. It was finally demonstrated that the
contribution of the instrumentation noise could represent the major part of the EN for very
weakly emissive SCC systems. In that case, the quantitative evaluation of dissolution
processes from EN data appears to be questionable.
Cette thèse est accessible à l'adresse : http://theses.insa-lyon.fr/publication/2017LYSEI059/these.pdf © [J. Bolivar], [2017], INSA Lyon, tous droits réservés

Chapter VII: General synthesis, conclusions and future works
José Bolivar 186
Thèse en Sciences des Matériaux / 2017
Institut national des sciences appliquées de Lyon
Chapter VII
VII General synthesis, conclusions
and future works VII.1 Introduction ............................................................................................. 187
VII.2 General Synthesis ..................................................................................... 187
VII.2.1 Influence of experimental parameters on the development of the crack
colony... ................................................................................................. 187
VII.2.2 Development of the in-situ experimental methodology for the study of SCC
crack colonies ......................................................................................... 189
VII.2.3 Crack detection and crack monitoring ..................................................... 190
VII.2.4 Evolution of intergranular stress corrosion cracks (Alloy 600 /
tetrathionate)…. ...................................................................................... 191
VII.2.5 Mechanisms involved for crack propagation in sensitized Alloy 600 in a
solution containing tetrathionate ions ...................................................... 192
VII.2.6 Evaluation of Electrochemical Noise measurements in SCC
experiments………. ................................................................................ 194
VII.3 Contribution of the experimental approach to modeling ......................... 196
VII.4 Transposition of the methodology towards intermediate temperature and
pressure environments ............................................................................. 200
Cette thèse est accessible à l'adresse : http://theses.insa-lyon.fr/publication/2017LYSEI059/these.pdf © [J. Bolivar], [2017], INSA Lyon, tous droits réservés

Chapter VII: General synthesis, conclusions and future works
José Bolivar 187
Thèse en Sciences des Matériaux / 2017
Institut national des sciences appliquées de Lyon
VII.1 Introduction
his Ph.D. thesis was part of the ANR ECCOFIC project, which was
aimed at improving the current understanding of the processes that are
involved in the interaction stages participating to the life of a stress corrosion
cracks colony.
In the ECCOFIC framework, two different approaches were simultaneously
developed: (i) the experimental study of the behavior of an SCC colony and
(ii) the development of a numerical approach aimed at simulating all the
stages involved in the propagation of multiple neighboring SCC defects. In
this context, the present work focused on the first objective (i).
The experimental approach developed here consisted in choosing and opti-
mizing a material/environment system for which the phenomenon of multiple
cracking has already been described. An innovative experimental setup was
designed in order to study the development of cracks colonies. Digital Image
Correlation (DIC), Electrochemical Noise (EN), and Acoustic Emission (AE)
were identified as the most relevant techniques able to provide statistical data
and local measurements for the study of a colony of cracks. With this ap-
proach, mechanistic information (mechanical and electrochemical) concern-
ing crack propagation and interactions were obtained in order to be used as
a basis for the numerical simulation.
This last chapter is divided into three sections. Firstly, a general synthesis
assembling the main findings and conclusions of this work is presented. A
second section introduces the numerical model proposed to simulate the
propagation of an SCC crack colony for the Alloy 600/ tetrathionate system.
Within this section, the contribution of the experimental observations to the
development of the numerical model will be emphasized. Finally, some
short-term outlooks and future works are proposed.
VII.2 General Synthesis VII.2.1 Influence of experimental parameters on the development of the
crack colony
During this work, a sensitized Alloy 600 (nickel base alloy) and a solution of potassium
tetrathionate were chosen. This system was adopted after an extensive literature survey
which allowed supporting this choice: sensitized Alloy 600 is indeed particularly
susceptible to suffer IG-SCC in polythionate solutions with the particularity that multiple
defects can initiate and propagate as a colony. Moreover, the system is known to present
low incubation times and fast crack growth rates at room temperature, which facilitate the
T
Cette thèse est accessible à l'adresse : http://theses.insa-lyon.fr/publication/2017LYSEI059/these.pdf © [J. Bolivar], [2017], INSA Lyon, tous droits réservés

Chapter VII: General synthesis, conclusions and future works
José Bolivar 188
Thèse en Sciences des Matériaux / 2017
Institut national des sciences appliquées de Lyon
feasibility study of monitoring techniques implementation and the study of intergranular
cracking under very accessible experimental conditions.
In this context, several experimental parameters affecting the morphology of the obtained
crack colonies were studied; their effects can be summarized as follows:
• Sensitization treatment: three different material conditions were analyzed. They
consisted in As Received (AR), Mild Annealed and Sensitized (MAS) and Solution
Annealed and Sensitized (SAS) material thermal treatments. It was observed that only
the sensitized materials (MAS and SAS) suffered IG-SCC within the range of exposition
times investigated. However, due to the solution annealing treatment involved in the
SAS material preparation, the material recrystallized under a coarse microstructure,
several times larger than that of the MAS material. For this reason, the MAS material
preparation was adopted for the rest of the study, as the material keeps a relatively small
grain size and an homogeneous equiaxed microstructure. Indeed, it is known that the
larger the microstructure the more influenced is the growth of small cracks by
microstructural and crystallographic features.
• pH of the solution: for the same stress level, it was observed that acidic pH-values
promoted higher crack densities and Crack Growth Rates (CGRs). Such behavior was
related to the properties of the passive film. According to the literature review, the
stability of the film depends in a great part of the pH of the aqueous media to which the
material is exposed. In this manner, low pH-values impair the stability of the passive
film and promote a decrease in the repair capacities of the protective film
(repassivation). As a consequence, the number of crack initiations increases.
• Stress: for a given pH, higher stresses promoted an increase in the number of initiated
cracks (see Table V.6 in Section V.4.2). It is argued that is not the stress that contributes
to the increase of the cracks density but its consequence, that is to say, the strain
produced by the stress. Increasing the stress leads to an intensification of the processes
related to plastic deformation (e.g. slip planes) which promote film-rupture events. As
a consequence, it leads to an increase in the crack density.
The SCC system selected for this study is particularly sensitive to the variations of the
experimental parameters cited above. Their modification influenced the morphology of the
obtained crack colonies, especially the number of initiated defects. The most important
finding was that the density of the cracks colony can be easily modified by changing the
pH of the solution. This property was used in order to analyze crack colonies with different
features.
Cette thèse est accessible à l'adresse : http://theses.insa-lyon.fr/publication/2017LYSEI059/these.pdf © [J. Bolivar], [2017], INSA Lyon, tous droits réservés

Chapter VII: General synthesis, conclusions and future works
José Bolivar 189
Thèse en Sciences des Matériaux / 2017
Institut national des sciences appliquées de Lyon
VII.2.2 Development of the in-situ experimental methodology for the study
of SCC crack colonies
The experimental approach was based on the simultaneous in-situ application of DIC, EN
and AE measurements. A special attention was paid to the surface conditioning of the SCC
specimens in order to allow DIC measurements. The process was called surface "patterning"
and represented an important stage in the development of the experimental procedure,
because if the material does not exhibit a random pattern on its surface (natural or artificial)
the algorithm used for the correlation does not converge. In this context, several surface
patterning were characterized on Square Samples. They consisted of sandblasting, chemical
attack and electro-etchings. They were compared on the basis of (i) the physical aspect of
the surface (matte/bright, random/homogeneous), (ii) their performance to resolve
numerical tests (imposed numerical displacements) and (iii) the ease to be transposed to
Long Tensile Samples. On this basis, the surface conditioning treatment ST-IV, which was
composed of a series of two electroetching stages was chosen (see Section IV.3.1). This
patterning method produced a matte random surface which was easily transposed to large
specimens with reproducible results. Moreover, this patterning method displayed good
performance to resolve displacements ranging from tenths of a pixel until hundreds of
pixels. Polarization curves were performed in order to study the influence of the surface
preparation on the electrochemical behavior of the alloy. The results showed that its
application induces a slight activation of the surface that could modify the initiation of
cracks. However, as this work is focused on crack propagation rather than on the elementary
processes involved in crack initiation, this surface treatment was judged acceptable.
Moreover, two modes of loading for performing SCC tests were analyzed and compared.
They were Slow Strain Rate (SSRT) tests and Constant Load (CL) tests. The CL tests were
performed at 80 % of the yield stress, therefore, in the macroscopic elastic region.
Nevertheless, no substantial differences were observed on the obtained crack colony
morphology according to the different loading techniques. As expected, plastic deformation
was more important in the samples loaded by SSRT than those tested at CL. However, the
differences on the obtained cracks were barely noticeable. Subsequently, their suitability
for AE and DIC measurements was also evaluated. In the SSRT tests, the risk that the
Region Of Interest goes out of the frame of the camera exists, resulting in a loss of
information. Moreover, the extensive plastic strain during SSRT activated a lot of AE
sources related to plasticity which "polluted" the AE records. In contrast, such "pollution"
was less present in the CL test. For these reasons, the CL tests were more adapted to this
work and were used for the implementation of all subsequent tests.
Considering the above conclusions concerning the experimental conditions for the study of
a crack colony by DIC, AE and EN, several campaigns of tests were performed in order to
characterize the behavior of intergranular stress corrosion cracks by the correlations
between the different monitoring techniques. Next sections detail the main observations
Cette thèse est accessible à l'adresse : http://theses.insa-lyon.fr/publication/2017LYSEI059/these.pdf © [J. Bolivar], [2017], INSA Lyon, tous droits réservés

Chapter VII: General synthesis, conclusions and future works
José Bolivar 190
Thèse en Sciences des Matériaux / 2017
Institut national des sciences appliquées de Lyon
and conclusions concerning the way cracks were detected and the propagation stages were
monitored.
VII.2.3 Crack detection and crack monitoring
In the experimental approach based on 2D-DIC, the detection of the defects was performed
by DIC measurements. Actually, the appearance of defects within the ROI leads to the
emergence of discontinuities (jumps) in the displacement field, which were identified by a
post-treatment allowing both the location of cracks and the extraction of their parameters
(opening, length, CGR). The limits of detection depended on the element size used for the
correlation and on the noise in the measurements. Typically, the methodology allowed to
detect defects longer than 55 µm (element size used, 16 px) and opened more than 0.45 µm
(noise level) within a ROI of 7090 µm X 8500 µm.
In addition, the initiation of the SCC process was stated by visual inspection of the EN time
records. Actually, crack initiation produced a decrease of the Electrochemical Potential
Noise (EPN) and a remarkable increase of the DC level of the Electrochemical Current
Noise (ECN). Crack initiation was always detected first by EN and then confirmed by DIC
measurements. Moreover, crack propagation caused both a gradual decrease of the
corrosion potential and a raise of the standard deviations of the EN signals. In this manner,
the collected EN data contribute to crack detection but also to the monitoring of the
electrochemical processes involved in crack propagation.
AE measurements were also beneficial to the monitoring of crack propagation. The
monitoring of AE activity (cumulative hits, cumulative energy) and its correlation with DIC
and EN measurements allowed to identify the different stages involved in the propagation
of cracks, notably the periods of incubation and surface propagation involving significant
anodic dissolution (Stages I and II, either for single crack or a colony) and the period of
macro-cracking. It must be highlighted that, during this work, all the AE data collected
during the SCC tests were analyzed in details by MISTRAS Group SAS (ECCOFIC
partner). The treatment focused on the classification of the different AE sources in order to
differentiate the acoustic emission originated by: (i) metal dissolution/intergranular
corrosion, (ii) plastic deformation and (iii) macro-cracking, coalescences and rupture. The
analysis was based on a parametric approach coupled with Principal Component Analysis
(PCA). The results of the study were reported in Appendix C. The results of such analysis
revealed that the features of the AE bursts registered during the periods mainly governed
by anodic dissolution (Stage I for a colony, Stage II for a single crack), did not present
significant differences compared to the AE hits acquired during the loading stage or the
macro cracking phase, which are more related to plasticity processes. The latter suggests
that the metal dissolution did not produce significant AE by itself, but might have induced
some stress/strain reorganization, resulting in very local plasticity processes which
produced some AE.
Cette thèse est accessible à l'adresse : http://theses.insa-lyon.fr/publication/2017LYSEI059/these.pdf © [J. Bolivar], [2017], INSA Lyon, tous droits réservés

Chapter VII: General synthesis, conclusions and future works
José Bolivar 191
Thèse en Sciences des Matériaux / 2017
Institut national des sciences appliquées de Lyon
VII.2.4 Evolution of intergranular stress corrosion cracks (Alloy 600 /
tetrathionate)
The correlation between the different techniques implemented during this work (DIC, AE,
EN, X-ray tomography) allowed characterizing the different stages involved during the
development of intergranular cracks, either in the case of a single crack or in the case of a
colony. In this framework, several important trends can be identified during the crack
development process regardless the pH of the solution. During the first stage of propagation
(immediately after initiation), the nucleated cracks propagated very fast in surface
compared to their variations in the depth direction. This mode of propagation resulted in a
very tight aspect for which opening and depth of the defects were much smaller than their
length. In the case of a single defect, where the interactions with neighboring cracks are not
present, it was observed that the CGR (in the surface) followed a decreasing trend while
the variation of opening continued to increase. The above means that the cracks started to
display less and less preference to propagate along the surface and started to favor the
propagation inside the material. It was stated that during this first stage, the narrow
openings of the defects limits the electrochemical processes (diffusion, mass transport,
electrochemical reactions) at the bottom of the cracks. On the surface, this kind of
limitations are less significant as environment is easily replaced by the bulk solution
(compared to the environment inside the crack), hence, surface propagation was privileged
in narrow defects.
Subsequently, it was observed that in the absence of interactions , the defects change their
preference to propagate along the surface, and started to propagate in both directions. It
was suggested that, from a mechanical point of view, keeping such an elongated shape
should be physically unstable. This is because in the case of an elongated defect subjected
to tension, Raju and Newman equations [217] predict higher K-values at the deepest point
of the crack, which favors in-depth propagation. Hence, during the second phase of
propagation, the defects started to develop a more stable shape (e.g. semi-circle). The above
could not be verified by direct 3D observations because it was not possible to perform a
test with a single crack in the conditions of X-ray tomography experiments. However, it
was observed that the single defect propagating in the LTS sample (Section V.2.1.4)
progressed at relatively constant CGR (in the surface) but displayed an increasing variation
of opening during this stage, suggesting that the crack front was propagating faster inside
the material. Such indirect observation agrees with the hypotheses that the defects tend to
adopt a more stable shape.
The above described behavior accounts for isolated defects. During the first stages of the
development of a colony, the defects are spaced enough, so that they behave as isolated
cracks. However, as they start to grow, they become closer and closer and interactions start
to take place. It was observed that the intensification of interactions (shielding,
coalescences) induced a decrease of the CGR (in surface) and promoted in -depth
Cette thèse est accessible à l'adresse : http://theses.insa-lyon.fr/publication/2017LYSEI059/these.pdf © [J. Bolivar], [2017], INSA Lyon, tous droits réservés

Chapter VII: General synthesis, conclusions and future works
José Bolivar 192
Thèse en Sciences des Matériaux / 2017
Institut national des sciences appliquées de Lyon
propagation where the shielding was less effective. Note that in contrast with the second
stage observed for an isolated defect, here the in-depth propagation is accentuated by the
strong general shielding that exists in the surface.
In-situ X-ray tomography allowed characterizing the three-dimensional shape that the
cracks adopted during their propagation within the colony. It was observed that during the
second stage of propagation, the defects (within a colony) exhibited a close to a semi-
elliptical shape with a tendency to grow into the bulk of the material, even when the defects
had a size close to that of the microstructure (microstructurally small cracks) and after a
coalescence event.
Moreover, it was noted that the defects propagated by a particular mechanism. Actually,
during the crack propagation, new defects initiated near the crack tip of the initial crack
and coalesced, hence, the main defect became larger by coalescing adjacent cracks rather
than by the propagation of the initial defect. This mechanism of propagation has also been
reported for other systems (e.g. 304 SS in high-temperature water) [64] and has been cited
as Initiation Dominant Growth (IDG). The process has been pointed out to be characteristic
to environment sensitive cracking because the initiation of the newly defects is originated
by the synergy between local stresses and electrochemical processes (e.g. corrosive
medium). Due to stress concentration at the tips of the prime crack (see Section VII.2.1),
the passive film within this zone breaks and the bare metal is exposed to the environment,
which favors crack initiation. In this context, such behavior should be taken into account in
numerical approaches aimed at simulating SCC. This requires a better understanding of the
mechanisms involved in the initiation stage and above all, the access to the local strain
rates.
The experimental observations also provided information concerning the mechanisms
involved during the propagation of the defects, which are discussed in the next section.
VII.2.5 Mechanisms involved for crack propagation in sensitized Alloy 600 in
a solution containing tetrathionate ions
The experiments performed during this work are not sufficient to state, or completely
clarify, the different elementary processes involved in crack propagation. However, the
experimental approach here developed allowed to confirm/reveal several features that can
be cited as follows:
During the first stage of propagation of the cracks, they adopt a very shallow and
narrow shape. Very few AE was recorded during this stage. Moreover, the AE
activity was characterized by weak energies.
In addition, the EN records displayed features (EPN decrease and ECN increase)
characteristic to a very active process, such as anodic dissolution.
Cette thèse est accessible à l'adresse : http://theses.insa-lyon.fr/publication/2017LYSEI059/these.pdf © [J. Bolivar], [2017], INSA Lyon, tous droits réservés

Chapter VII: General synthesis, conclusions and future works
José Bolivar 193
Thèse en Sciences des Matériaux / 2017
Institut national des sciences appliquées de Lyon
Despite the propagation of numerous cracks, no individual high amplitude
transients were observed in the EN records at pH 3.
Cracks displayed a tendency to adopt a shape close to a semi-ellipse.
Cracks at pH 3 propagated faster than at pH 4
The low and weak AE activity recorded during the first stage of crack propagation is
consistent with an important contribution of anodic dissolution in the crack advance
process. Such mechanisms are also supported by the trends of the EN records and the shape
of the propagating defects. On this basis, it can be argued that anodic dissolution takes place
within the active path formed by the Cr-depleted zone (e.g. chromium carbide precipitation)
and the matrix. As noted, the intensity of the dissolution depended in the pH of the solution.
Acidic pH-values impair the stability of the passive film and delay its self-repair. At low
pH, the contribution of anodic dissolution to crack propagation increases, which was
evidenced by higher CGR at pH 3 compared to pH 4.
At pH 3, no correlated EN transients of significant amplitudes were observed. The only
correlated features were high-frequency transients of very low amplitude, which produced
a hump on both PSDs (potential and current). Their high frequency and low amplitude
suggest that the IG-SCC can be considered as continuous at pH 3. On the other hand, the
situation was slightly different at pH 4. In this case, some correlated individual transients
of higher amplitude were noticed, which suggests that the cracking process is more likely
to be discontinuous. As mentioned above, acidic pH-values limit repassivation which could
favor a continuous process (continuous anodic dissolution). In contrast, a stronger passive
film formed at higher pH (e.g. pH = 4.0) could give rise to a sequence of film-rupture, metal
dissolution, and film repairs events that is rather a discontinuous process. Hence, it can be
argued that the crack propagation mechanism may vary according to the pH of the solution.
Note that results exposed in the literature review (see Section II.4.2), which show that
damage morphology depends in both the pH of the solution and the potential, are consistent
with these assumptions. However, whether continuous or not, anodic dissolution at the
crack tip was observed to be the main process responsible for crack propagation in
sensitized Alloy 600 in tetrathionate solution. The participation of others mechanisms (e.g.
hydrogen embrittlement) as suggested by others works [73], [77], was not evidenced.
Another interesting observation was that the defects shape is close to semi-ellipse. Such a
shape under conditions for which repassivation is unlikely to occur (e.g. pH 3), suggests
that local stresses at the crack front may influence the rate of metal dissolution. Considering
a single very elongated crack subjected to a tensile stress and propagating in an inert
environment, the SIF-value at the deepest location of the crack will be more important that
the one at the crack tips at the surface. Such a state promotes in-depth propagation for
reaching a more physically stable shape. If the experimental conditions can promote
Cette thèse est accessible à l'adresse : http://theses.insa-lyon.fr/publication/2017LYSEI059/these.pdf © [J. Bolivar], [2017], INSA Lyon, tous droits réservés

Chapter VII: General synthesis, conclusions and future works
José Bolivar 194
Thèse en Sciences des Matériaux / 2017
Institut national des sciences appliquées de Lyon
repassivation (e.g. at pH 4), such a shape can be adopted simply because the SIF values
influence the rupture of the passive film. However, in the case where repassivation is
strongly limited, such a crack cannot adopt this shape considering pure mechanical
processes. Accordingly, it is very likely that local stresses may influence the rate of metal
dissolution in order to promote the evolution toward a shape close to those obtained by pure
mechanical effects. This observation disagrees with current understanding of the
mechanism (for Alloy 600/ tetrathionate system), where the role of the stress is strictly
reduced to an enhancement of the electrochemical processes due to crack opening (e.g.
access to the solution to the crack bottom, mass transport enhancement) [92].
VII.2.6 Evaluation of Electrochemical Noise measurements in SCC
experiments
During this work, a special focus was made on the analysis of EN data collected during
SCC experiments. The influence of both the instrumental noise and the rise in asymmetry
between the electrodes (inherent to the SCC tests when only the working electrode is
stressed) on the EN data was investigated.
The instrumental noise was identified and quantified thanks to tests performed on dummy
cells, which were composed of three equal resistors representing a well -defined source of
impedance. Several EN acquisitions were performed with different resistor values and
different sensitivities for current measurements (IE range). The obtained results allowed
building a database which represented the fingerprint of the instrumental noise level
(baseline noise). Such results were named "reference" and were subsequently used for data
treatment. It was stated that the instrumental noise in the potential records was constant
regardless the impedance values of the resistors and the IE range used. In contrast, the
current measuring channel was observed to be much more sensitive to both variations of
the impedance of the electrodes and the IE range. In this context , an optimum IE range
allowing minimizing the contribution of the instrumental noise in the EN records was
defined. As a thumbs rule, the ratio between the impedance modulus of the WE and the Rm
value of the corresponding IE range must be less than one tenth.
Crack propagation during the SCC tests was mainly monitored by both visual inspections
of the EN records (see Section VII.2.3) and by the evolution the Standard Deviation (SD)
of the signals. The SDs were generally assessed from the analysis in the frequency domain.
Such approach permitted to filter the data and also to account for electrode asymmetry.
Uncorrelated low frequencies fluctuations were digitally filtered from the EN records
because they were unlinked to the corrosion process on the WE. Moreover, it was
demonstrated that instrumental noise represented an important part of the frequency content
of the signals recorded during SCC. A direct comparison between the reference PSDs
(obtained on dummy cells) and those obtained during the SCC experiments allowed the
identification of the effective bandwidth of the instrumental noise, and its distinction from
the one of the corrosion processes. The identification of the corrosion dominating frequency
Cette thèse est accessible à l'adresse : http://theses.insa-lyon.fr/publication/2017LYSEI059/these.pdf © [J. Bolivar], [2017], INSA Lyon, tous droits réservés

Chapter VII: General synthesis, conclusions and future works
José Bolivar 195
Thèse en Sciences des Matériaux / 2017
Institut national des sciences appliquées de Lyon
range was very useful for the treatment of the EN data. Actually, working within the range
of frequencies where the corrosion processes were the dominating noise sources, allowed
better monitoring crack propagation through the assessment of SDs.
As previously mentioned, the rise in asymmetry between the electrodes during the
development of SCC was also studied. Actually, it was observed that during the SCC tests,
the total current originated by the corrosion process was not always measured by the
potentiostat/ZRA, due to the development of asymmetric electrodes as the SCC processes
became intensified in the stressed sample (WE). The analysis was based on a model
proposed by Bertocci and coworkers [172], which describes current partition during EN
measurements. Current partition was observed to depend on the impedance modulus of the
electrodes, which is at the origin of electrode symmetry/asymmetry. EIS measurements
were performed in order to study the evolution of electrodes impedance during the tests. It
was noted that SCC induced a progressive decrease of the impedance modulus of WE, while
the CE, which usually does not suffer corrosion, kept a higher and stable impedance
modulus. Two cases where asymmetry was present were analyzed: (i) IG-SCC at pH 3 and
(ii) IG-SCC at pH 4. At the middle part of the tests, the measured current at pH 3 was
estimated to 25 % of the total current coming from the WE, while at pH 4 it was estimated
to 3 %. Such a difference was due to the impedance modulus of the passive material which
depends on the state of its passive film, which is more stable at pH 4 than at pH 3. Moreover,
the measured current varied according to the degree of asymmetry, which becomes more
and more critical as the SCC phenomenon progresses. Consequently, the rise in asymmetry
has very deleterious consequences in the measuring capabilities of ECN and must be
carefully taken into account permanently when using such measurements for quantitative
purposes.
Note that the approach here developed is particularly interesting to be applied to systems
where the crack propagates through an anodic mechanism but in a discontinuous manner
(e.g. 304L SS aqueous solutions containing chlorides). In this case, the continuous
evaluation of the asymmetry ratio should allow better quantifying the amount of current
involved in the individual steps of the crack advance process, which is very attractive for
lifetime prediction purposes.
Finally, the approach developed here allowed filtering the frequency bandwidth of the
signals generated by corrosion processes occurring on the stressed electrode, and extracting
them from the instrumental noise. Moreover, the assessment of electrode asymmetry
permitted to correct the recorded data (in the frequency domain) by considering the
progressive rise in asymmetry. The above results constitute a progress in the crack
propagation monitoring capabilities of Electrochemical Noise for very low emissive
systems.
Cette thèse est accessible à l'adresse : http://theses.insa-lyon.fr/publication/2017LYSEI059/these.pdf © [J. Bolivar], [2017], INSA Lyon, tous droits réservés

Chapter VII: General synthesis, conclusions and future works
José Bolivar 196
Thèse en Sciences des Matériaux / 2017
Institut national des sciences appliquées de Lyon
VII.3 Contribution of the experimental
approach to modeling
Parallel works were carried out in the frame of the ECCOFIC project in order to develop a
numerical approach for modeling the development of a stress corrosion cracks colony. The
model is based on a phase field method involving brittle failure [237]. Such a method
presents the advantage of requiring no prescription of the crack shape geometry and allows
simulating crack nucleation and interactions, therefore providing a very robust framework
for crack propagation simulation of complex crack networks. The phase field method
alleviates the shortcomings of re-meshing crack geometry by using a fixed mesh and a
regularized description of the discontinuities. Therefore, the propagation of complex 3D
crack morphologies and multiple fronts, as those observed in Section V.3, can be
successfully simulated [238].
It is not the aim of this section to give a detailed description of the mathematical background
implemented in the model. For this, the reader can refer to Appendix E where the model is
presented in details. Yet, the concepts and definitions incorporated into the model [238], as
well as the experimental observations that contributed to its construction are outlined
below.
The experimental results presented in Chapter V and summarized in the previous section
permitted to rationalize the behavior of an IG-SCC colony developed in the Alloy
600/tetrathionate system. Initiation and propagation of the defects involved the anodic
dissolution of the metal and the CGRs were closely related to the pH of the solution and the
strain, which is in agreement with the elementary processes involved in slip-dissolution
based models. In this context, the numerical approach was funded on the concepts relative
to the slip dissolution mechanism. As described in Section II.2.2.1, this mechanism states
that the propagation of the cracks depends on the rupture of the passive film at the crack tip
(due to the local dynamic plastic strain), which allows the dissolution of the metal in this
region and provides the advance of the crack front. This mechanism considers that the crack
flanks remain passive. Therefore, the crack velocity is directly related to the rate of metal
dissolution at the crack tip. Considering all above, it can be stated that the film repair kinetic
is important parameters that should be considered in the model, and that the local strain rate
at the crack tip is supposed to be a limiting factor for SCC rate. However, obtaining both
the mechanical properties of the passive film and the instantaneous strain rate at the crack
tip is not straightforward and remains a difficult question. In this context, the developed
model takes into account a diffusing degradation c, in order to simulate the dissolution
processes (after film-rupture). c affects the material properties in order to favor crack
propagation. This parameter varied between 0 and 1, "1" meaning maximum degradation.
A unit value was thus prescribed by c at the crack front, and its variation was assumed to
be governed by a process which can be described by a diffusion law (Fick's law). Moreover,
Cette thèse est accessible à l'adresse : http://theses.insa-lyon.fr/publication/2017LYSEI059/these.pdf © [J. Bolivar], [2017], INSA Lyon, tous droits réservés

Chapter VII: General synthesis, conclusions and future works
José Bolivar 197
Thèse en Sciences des Matériaux / 2017
Institut national des sciences appliquées de Lyon
the strain rate was replaced by the crack propagation rate ��. In this manner, a crack
propagates under a mechanical and electrochemical synergy if �� is larger than a critical
value (𝑑��), otherwise, the film does not "break" and the degradation c does not affect the
material properties.
As observed through this work, the studied defects had a preference to propagate initially
on the surface of the samples. In order to reproduce this behavior, the diffusion coefficient
of the diffusing degradation (D(x)) was a decreasing function of the depth. Figure VII-1
depicts this point in a graphical manner. If this aspect is disregarded, the obtained crack
morphologies are far away from the experimental observations because the crack
propagation will be governed by mechanical factors (SIF-values).
Figure VII-1. Slip dissolution phenomena at crack tip: distribution of diffusing degradation for the case of
structure containing a semi-elliptical crack [238]
Figure VII-2. Description of the influence of slip dissolution on fracture mechanics by using an equivalent
model based on degradation diffusion [238]
The model requires the knowledge of mechanical parameters of the materials (yield stress,
Young modulus, Poisson coefficient) which are easily identified through mechanical data ,
e.g. furnished by the material supplier. The phase field method requires also some other
variables linked to the description of the brittle failure, in particular, a failure energy gc and
Cette thèse est accessible à l'adresse : http://theses.insa-lyon.fr/publication/2017LYSEI059/these.pdf © [J. Bolivar], [2017], INSA Lyon, tous droits réservés

Chapter VII: General synthesis, conclusions and future works
José Bolivar 198
Thèse en Sciences des Matériaux / 2017
Institut national des sciences appliquées de Lyon
an internal length lc (regularization parameters proper to the phase field modeling,). gc is
supposed to be a decreasing function of the diffusing degradation c. In this way, a location
displaying significant dissolution (related to c) will adopt a lower gc. In analogy with Linear
Elastic Fracture Mechanic, gc can be compared to the fracture toughness of the material,
which evolves according to the SCC phenomena. Hence, the SCC process can be seen as
the embrittlement source which reduces locally the value of gc (see Figure VII-2). In order
to describe gc, the function proper to c has to be identified, in particular, the coefficient of
diffusion D(x) included in the Fick's law. This parameter was determined by inverse
analysis, considering the experimental data furnished by DIC measurements, notably the
crack density and the displacement field (see section 6.2.1 of the paper in Appendix E). In
this way, all the parameters describing the crack growth are known and the simulation of
the crack colony growth can be determined.
In order to compare with experimental results, a sub-domain of the zone analyzed by 2D-
DIC was modeled. The measured displacement field ( 𝑈𝑖 ) which was obtained from the
experiments through DIC measurements, was applied on the boundary of this domain as
boundary conditions. Crack initiation was actually imposed by defects in the
microstructure. The model did not include prediction of crack nucleation, but the analysis
of the measured displacement fields allowed detecting where and when new crack initiate
at the surface (see Section V.3.1.3, Chapter V). This information was introduced in the
model by modifying the history function governing the evolution of damage, indicating
where and when crack initiation was observed. Then, the evolution of damage was solved
in 3D to predict the behavior of the cracks colony. Note that only crack initiation sites were
defined, then, the crack propagates based on numerical prediction according to the model,
without any prescription for their shape. The procedure mentioned above is depicted in
Figure VII-3.
Figure VII-3. Crack onset by using the result of DIC for three different loading steps: (a) first loading step; (b)
second loading step; and (c) third loading step. Note that the number of initiation, their locations as well as the
Cette thèse est accessible à l'adresse : http://theses.insa-lyon.fr/publication/2017LYSEI059/these.pdf © [J. Bolivar], [2017], INSA Lyon, tous droits réservés

Chapter VII: General synthesis, conclusions and future works
José Bolivar 199
Thèse en Sciences des Matériaux / 2017
Institut national des sciences appliquées de Lyon
boundary limit conditions (displacement of the ROI edges, 𝑈𝑖 ) are obtained from DIC measurements. Then
cracks propagates according to the SCC model
The results of the simulation are depicted in Figure VII-4, including: (i) a 3D view rendering
for the sub-volume studied, (ii) a surface view of the predicted propagation and (iii) the
experimental observations which are basically the segmented strain field (see Section
III.3.1.2). The simulated cracks adopted a shape very close to a semi-ellipse, which agrees
very well with the experimental observations (Section V.4.1.2). Moreover, it was observed
that the model successfully represented the interactions between cracks and the subsequent
shielding effects (see Figure 27 in Appendix E).
It must be admitted that the diffusing degradation is a purely phenomenological concept,
with no common physical features with true mechanisms, but it allows taking into account
the electrochemical contribution to the crack growth in a simple manner . Moreover, the
proposed model demonstrated to be robust and predictive for crack propagation and crack
interactions as illustrated in Figure VII-4. Nevertheless, in its present state of development,
it remains limited to the mesoscale and is not able to take into account microstructural
effects on crack propagation and therefore to treat intergranular and transgranular
propagation in a different way. It is going to be adapted to polycrystalline materials in order
to incorporate intergranular/transgranular crack paths and preferential planes for cleavage
(anisotropic behaviors). This constitutes the main step in modeling and requires
complementary experimental data. Finally, the improvement of the SCC modeling will be
also undertaken in order to replace the diffusion law by a more physically appropriate
concept.
Figure VII-4. Simulation over a sub-volume of the propagation of a cracks colony, (a) 3D view of the sub -
volume, (b) Surface view, simulation, (c) Surface view, experimental data
Cette thèse est accessible à l'adresse : http://theses.insa-lyon.fr/publication/2017LYSEI059/these.pdf © [J. Bolivar], [2017], INSA Lyon, tous droits réservés

Chapter VII: General synthesis, conclusions and future works
José Bolivar 200
Thèse en Sciences des Matériaux / 2017
Institut national des sciences appliquées de Lyon
VII.4 Transposition of the methodology
towards intermediate temperature and
pressure environments
The experimental methodology developed in the context of this study can be extended to
other SCC systems, involving a different pathway (e.g. transgranular) and a more
severe/representative environments (e.g. higher temperature and pressure). As mentioned
in Chapter I, TG-SCC can actually be encountered in some locations of the Primary Cooling
Circuit (PCC) of nuclear reactors.
304 L stainless steel (not sensitized) in aerated, weakly polluted water (containing 10 ppm
of Cl− and 1 ppm of SO42−) at 200 °C and 40 bars is an SCC system prone to suffer TG-SCC
(see Figure VII-5) [239]. In these conditions, previous works carried out by AREVA and
the Institut de la Corrosion (partners of ECCOFIC project), demonstrated that multiple
transgranular stress corrosion cracks can be obtained with short incubation times (few hours
or tens of hours). Actually, the presence of chloride promotes numerous shallow pitting
from which cracks can nucleate and form a colony (see Figure VII-6).
Figure VII-5. Experimental conditions for which 304 L SS is susceptible to suffer TG-SCC in a weakly polluted
media at 200 °C and 40 bars
Cette thèse est accessible à l'adresse : http://theses.insa-lyon.fr/publication/2017LYSEI059/these.pdf © [J. Bolivar], [2017], INSA Lyon, tous droits réservés

Chapter VII: General synthesis, conclusions and future works
José Bolivar 201
Thèse en Sciences des Matériaux / 2017
Institut national des sciences appliquées de Lyon
Figure VII-6. SCC cracks in a 304L SS tested in a solution containing 10 ppm of 𝐶𝑙− and 1 ppm of 𝑆𝑂42−at
200°C and 40 bars (polarized at +151 mV/Ag/AgCl)
Many studies [239]–[241] concerned SCC of Austenitic Stainless Steels (ASS) in hot
aqueous environments, in order to better understand the mechanisms involved in the crack
propagation. The literature survey reports a characteristic cleavage-like fracture surface
where the cracks seem to display preferential propagation through both specific
crystallographic planes (e.g. {100} and {110} ) and directions (e.g. <110> for plane {110})
[20]. Such features are curiously close to those observed for SCC and Liquid Metal
Embrittlement of Al-Zn-Mg single crystals and SCC of Cu-Zn, Cu-AU and Ag-Au alloys,
suggesting that a similar mechanism could be involved (i.e. Adsorption-Induced
Dislocation Emission, Film Induced Cleavage). However, some other studies have also
suggested slip dissolution mechanisms and Hydrogen-enhanced localized plasticity (HELP)
for explaining TG-SCC in ASS. The subject is therefore still in discussion as there remains
a big controversy concerning the mechanisms responsible for crack propagation. In this
context, it is believed that the methodology developed in this work coupled with extensive
post-mortem examinations, can contribute to the clarification of this issue. The
discontinuous nature of cracking in this system is expected to furnish a rich variety of EN
transients. An in-depth study of the EN records and correlation between DIC, AE and
microscopy examinations should be very useful for a mechanistic study. Moreover, DIC
measurements would provide the information necessary to adapt the developed model
(presented in the previous section) to TG-SCC.
In this way, the ECCOFIC project, and the present Ph.D. work contributed to the
development a test device relying on the same measurements but under more aggressive
experimental conditions (e.g. intermediate temperature and pressure). For this, an autoclave
was designed and fabricated by AREVA NP in collaboration with MATEIS and LaMCoS
labs, the Institut de la Corrosion, MISTRAS Group SAS and ACXCOR (partners of
ECCOFIC project). The basic description of the autoclave is detailed in Appendix F. It was
designed to work up to 200°C and 40 bars and has been specially adapted to perform DIC,
AE and EN measurements (see Appendix F for details). The experimental setup is currently
Cette thèse est accessible à l'adresse : http://theses.insa-lyon.fr/publication/2017LYSEI059/these.pdf © [J. Bolivar], [2017], INSA Lyon, tous droits réservés

Chapter VII: General synthesis, conclusions and future works
José Bolivar 202
Thèse en Sciences des Matériaux / 2017
Institut national des sciences appliquées de Lyon
under validation and some difficulties to overcome were identified. In fact, DIC
measurements need to be validated at high temperature, where the heating of the solution
can create some liquid convection that could induce some artifacts in the displacement field.
In addition, the exposition of the sample to high temperatures will induce surface oxidation
that could disturb the application of DIC measurements. Moreover, EN measurements at
such high temperatures are not straightforward, especially when working with very weak
conductive media. In this case, special care needs to be taken regarding the WE and CE
spacing, electrode asymmetry, and instrumental noise.
Finally, once this system will be fully studied, a transposition towards realistic Primary
Cooling Circuit (PCC) environments can be envisaged. The studies at 200 °C and 40 bars
should help to overcome the huge technical limitations before increasing the temperature
and pressure towards 350 °C and 155 bars, in particular the need for a transparent optical
access in the autoclave body in order to carry out DIC measurements, which implies a
porthole with a sapphire or zirconia window. Due to the brittle mechanical behavior of such
materials, their application in PCC condition remains a challenge. Moreover, EN
measurements have previously to be validated at high temperature and in low conductive
media.
Cette thèse est accessible à l'adresse : http://theses.insa-lyon.fr/publication/2017LYSEI059/these.pdf © [J. Bolivar], [2017], INSA Lyon, tous droits réservés

Appendix A: Issues during EN signal acquisition
José Bolivar 203
Thèse en Sciences des Matériaux / 2017
Institut national des sciences appliquées de Lyon
A. Appendix A
Issues during EN signal acquisition
Performing EN measurements is not often straightforward and represents one of the main
shortcomings of the technique. In this section, two basic notions about the acquisition process
of the EN signals are introduced.
Nowadays, all the EN acquisition systems are based on Analog-Digital converters (A/D
converter) which transform a continuous, infinite analogic input into a quantified discrete-
time signal (see Figure A-1). Accordingly, the final signal is formed by a sequence of
quantities (discontinuous) of discrete values (finite). This sampling process introduces two
possible sources of perturbations/limitations which are Aliasing and Quantization [242].
Figure A-1. Example of an analogic to digital conversion in a sampling process of a signal
Aliasing: it is represented by the erroneous sampling of a signal with frequency f1
which is digitalized at a frequency fs (lower than 2f1). Under these conditions, the
registered signal will appear with much lower frequencies than the original one ,
leading to misleading records (see Figure A-2). In order to avoid this problem, the
signal must be analyzed according to the Nyquist-Shannon theorem. This theorem
establishes that the minimum sampling frequency has to be at least twice the maximal
expected frequency (fs = 2*fmax). In addition, the minimal frequency for analysis has
to be the inverse of the duration of the time record (fmin = 1/T). The later mean that
the part of a signal between 1/2 fs and fs have to be filtered before the digital
acquisition, in order to avoid “aliasing” [243]. This stage is performed by the Anti-
Aliasing filters (AA-filters) of the equipment, which are basically Low-pass filters
with a cutoff frequency equal to 1/2 fs. It is recommended to verify that the instrument
used for EN measurements have those AA-filters. Finally, the fulfillment of the
conditions mentioned above guarantees that all the information recorded in that
bandwidth are part of the original signal.
Cette thèse est accessible à l'adresse : http://theses.insa-lyon.fr/publication/2017LYSEI059/these.pdf © [J. Bolivar], [2017], INSA Lyon, tous droits réservés

Appendix A: Issues during EN signal acquisition
José Bolivar 204
Thèse en Sciences des Matériaux / 2017
Institut national des sciences appliquées de Lyon
Figure A-2. Aliasing effect of an analogic signal (f = f1) which have been sampled at a frequency f s < 2*f1
Quantization: the analogic signals have amplitudes comprising infinite numbers. Once
the analogic signal is sampled, its amplitudes are rounded and truncated to becomes a
“discrete” signal (see Figure A-1 and Figure A-3) [171]. This stage gives place to the
apparition of a quantization error which depends on the resolution of the A/D
converter. The amplitude of this error might be important when measuring weak EN.
Figure A-3. Schematic representation of a quantization process
Another important point concerns the environment interferences that can suddenly overload
the amplifier and degrade the minimal resolution of the equipment [151], [166]. Their effects
on the EN records can be minimized by insulating (when possible) the working electrodes
from the environment and by verifying the earth connections of the different instruments.
Especially the absence of “Ground loops.” A ground loop is formed when there exists a
continuous circuit between the signal and the ground, giving place to interferences. In order
to avoid ground loops, it is important to verify that the electrochemical cell and the instrument
do not share the same earth ground connection.
Another source of pollution are the electromagnetic interferences. The principal source is the
ac power supply (50 – 60 Hz) but it can also come from others electrical apparatus near to the
experiment. This kind of interferences can be
Cette thèse est accessible à l'adresse : http://theses.insa-lyon.fr/publication/2017LYSEI059/these.pdf © [J. Bolivar], [2017], INSA Lyon, tous droits réservés

Appendix A: Issues during EN signal acquisition
José Bolivar 205
Thèse en Sciences des Matériaux / 2017
Institut national des sciences appliquées de Lyon
reduced by using a Faraday cage which needs to be connected to the ground. Surrounding the
electrochemical cell with a conductor material (e.g. aluminum foil) sometimes it is enough.
Another more effective method is using battery power equipment which does not need to be
permanently connected to the power supply. For more details about dealing with interferences,
the reader is encouraged to see reference [151] for more details.
Cette thèse est accessible à l'adresse : http://theses.insa-lyon.fr/publication/2017LYSEI059/these.pdf © [J. Bolivar], [2017], INSA Lyon, tous droits réservés

Appendix B: Signal conditioning before data analysis/interpretation in EN measurements
José Bolivar 206
Thèse en Sciences des Matériaux / 2017
Institut national des sciences appliquées de Lyon
B. Appendix B
Signal conditioning before data
analysis/interpretation in EN measurements
EN records have to be conditioned before starting to perform either a statistics analysis or a
study within the frequency-domain. This stage consists in the validation of the stationarity of
the signals. Basically, stationarity means, that the statistic properties of a signal should not
change over the time (standard deviation, the mean value, and higher order statistics). In EN
measurements, stationarity is usually considered to be achieved when the mean value of the
signal does not change [170]. A more detailed definition adds that the characteristic
fluctuations of interest should be sufficiently repeated in the recorded signal. The latter is
specific to data obtained from localized corrosion processes (metastable pitting, crevice, stress
corrosion cracking, etc.) where the occurrence of fluctuations can sometimes be very sporadic.
The main cause of lack of stationarity is generally due to the apparition of a drift [244]. DC
drift (also called “trend”) is almost always produced by the progressive deterioration of
electrodes undergoing corrosion [245]. Therefore, the signal should be treated before
performing any statistical and frequency analysis in order to delete those low-frequency
components which influence the derived parameters (e.g. standard deviation). Several
methods have been proposed to remove the trend after data acquisition [170], [244]. The most
popular are the application of a polynomial detrending (with degree going from 1 to 5) and a
High-pass Digital filtering (see Figure B-1). Once the trend is removed, the statistic
parameters of the signal can be derived and analyzed with confidence.
With respect to a frequency analysis, the de-trending stage very often generates a difference
in amplitude between the first and the last point of the time record (see Figure B-2). The
algorithm used for the frequency analysis supposes that the signal repeats from -∞ to +∞.
Therefore, the discontinuity existing between the first and the last point has to be repaired
before the calculations. A widely operation for the suppression of this kind of discontinuity is
called windowing [244]. It consists in multiplying the time-record by a function (window)
which will taper 0 at the extremities and gradually evolve until 1 at the center of the time-
record (see Figure B-2). Several windows have been proposed in the literature, being among
the most popular the Hann-Window (Equation B-1). Once all the operations mentioned above
are performed, the estimation of the frequency composition of the signals can be done with
confidence.
Cette thèse est accessible à l'adresse : http://theses.insa-lyon.fr/publication/2017LYSEI059/these.pdf © [J. Bolivar], [2017], INSA Lyon, tous droits réservés

Appendix B: Signal conditioning before data analysis/interpretation in EN measurements
José Bolivar 207
Thèse en Sciences des Matériaux / 2017
Institut national des sciences appliquées de Lyon
Figure B-1. An example of the application of different detrending methods on an EPN time record. A) original
EPN record, B) polynomial fitting curve order 5, C) after MAR de-trending (p=3), D) after MAR de-trending
(p=30) and E) after analog HP filter with a fc of 0.01 Hz [244]. All the curves has been vertically shifted in
order to be more clear [244]
𝑤(𝑛) = 1
2(1 − cos
2𝜋𝑛
𝑁 − 1) Equation B-1
Figure B-2. Schematic representation of the different steps involved in signal conditioning before data
analysis. a) signal de-trending, b) windowing and c) conditioned signal [151]
Cette thèse est accessible à l'adresse : http://theses.insa-lyon.fr/publication/2017LYSEI059/these.pdf © [J. Bolivar], [2017], INSA Lyon, tous droits réservés

Appendix C: Report MISTRAS RF 2017.01
José Bolivar 208
Thèse en Sciences des Matériaux / 2017
Institut national des sciences appliquées de Lyon
C. Appendix C
Report MISTRAS RF 2017.01: Analysis of
Acoustic Emission data collected during IG-SCC
experiments
This appendix introduces a report done by MISTRAS Group SAS (ECCOFIC partner), which
details a deep analysis of the AE data collected during this work. The report aims at
determining the characteristics of the AE signals, recorded during different stages of
propagation of either a single crack or a colony of intergranular SCC defects. In this manner,
this appendix describes the tests carried out and the basis of the data treatment.
Introduction to the analyzed experiments
Table C-1 gathers the experiments that were analyzed. Tests CC 02-15, CC 03-15 and CC 04-
15 were already described in Chapter V. Test CC 04-15 was performed at pH 5.3 and was the
object of Section V.2, where the propagation of a single IG-SCC defect was achieved. On the
other hand, the experiments CC 02-15, CC 03-15 and CC 07-15 were performed at conditions
where a dense crack colony propagated (see Section V.3). It must be highlighted that the test
CC 07-15 was not presented in Section V.3 because the experimental setup employed in this
experiment was different to those presented in that section. Actually, test CC 07-15 was not
monitored by EN measurements. Additionally, the telecentric lens used for DIC measurements
had a magnification of 2X instead of 1X, which was habitually used during this work. Finally,
the test CI 01-15 corresponds to an immersion test, which was aimed at acquiring the AE
signature of the processes involved during pure intergranular corrosion (e.g. anodic
dissolution). In this manner, such family of AE hits will be used to identify, AE bursts with
similar characteristics within the SCC data.
For details about the experimental procedure and sample preparation for the SCC test, the
reader can refer to Chapter III. On the other hand, Figure C-1 depicts the experimental set-up
used to perform the immersion test CI 01-15. Note that the measurements were performed
with the half-part of an LTS sample presenting both the same exposed area and the same
surface treatment that was used in the SCC tests. Figure C-1 also includes an optical
micrograph of the sample surface (right-hand side). The image was taken at the end of the test
in order to validate the occurrence of intergranular corrosion.
Cette thèse est accessible à l'adresse : http://theses.insa-lyon.fr/publication/2017LYSEI059/these.pdf © [J. Bolivar], [2017], INSA Lyon, tous droits réservés

Appendix C: Report MISTRAS RF 2017.01
José Bolivar 209
Thèse en Sciences des Matériaux / 2017
Institut national des sciences appliquées de Lyon
Table C-1. Description of the AE tests analyzed in the Report MISTRAS RF 2017.01
ID test Experimental
conditions pH
Immersion
time before
loading (h)
Test
duration
(h)
CC 02-15 MAS Alloy 600
tested in a
0.01 M K2S4O6
solution under
Constant Load
(0.8 σy)
3.0 4 24
CC 03-15 3.0 1 23
CC 04-15 5.3 4 100
CC 07-15 3.0 1 25
CI 01-15
(Immersion test)
MAS Alloy 600 in a
solution of
0.01 M K2S4O6
3.0 - 113
Figure C-1. Description of the immersion test CI 01-15. (Left) Representation of the experimental setup and
(Right) optical micrograph of the exposed surface showing intergranular corrosion and the heterogeneous
attack from the surface patterning (see Figure IV.17)
In this context, the data treatment focused on the classification of different AE sources in
order to differentiate the acoustic emission originated by (i) metal dissolution/intergranular
corrosion, (ii) plastic deformation and (iii) macro-cracking, coalescences, and rupture. For
this, the analysis was based on the experimental observations presented in Chapter V, where
the different stages in the propagation of both a single crack and a colony of cracks were
identified. The tests were divided into three stages that were slightly different from those
defined in Chapter V. Figure C-2 schematizes how the AE data were divided. The stage I' was
defined as the lapse of time comprised from the moment when the loading started until the
detection of the cracks by DIC (ta). During this stage, no crack was detected by DIC but the
EN measurements suggested that some intergranular attack could have been occurring; hence,
the AE activity recorded during this lapse of time could be predominately linked to
intergranular corrosion and/or anodic dissolution. Subsequently, Stage II' was defined as the
Cette thèse est accessible à l'adresse : http://theses.insa-lyon.fr/publication/2017LYSEI059/these.pdf © [J. Bolivar], [2017], INSA Lyon, tous droits réservés

Appendix C: Report MISTRAS RF 2017.01
José Bolivar 210
Thèse en Sciences des Matériaux / 2017
Institut national des sciences appliquées de Lyon
lapse of time between the end of Stage I' and the moment where the crack density was maximal
(tb). During this stage, the cracks propagated mostly in surface under a narrow shape and with
an important contribution of anodic dissolution in the propagation mechanism. Finally, stage
III was defined from tb until the end of the test. At this stage, the interactions between the
cracks were more and more intense (coalescences and shielding) with an important implication
of plastic mechanisms (macro cracking, plastic deformation, rupture). For sake of simplicity,
MISTRAS Group SAS decided to use a set of common characteristic times for all the SCC
test that implied the propagation of a crack colony (CC 02-15, CC 03-15 and CC 0715). In
that manner, they adopt ta equal to 24000 seconds and tb equal to 48000 seconds.
Figure C-2. Representation of the different times and phases used for the analysis of the AE data
Table C-2. Characteristic times for test CC 02-15, CC 03-15 and CC 07-15
ID test
Immersion
time before
loading (h)
ta(s) tb (s)
CC 02-15 4 28980 47580
CC 03-15 1 25186 53321
CC 07-15 1 36794 68000
Cette thèse est accessible à l'adresse : http://theses.insa-lyon.fr/publication/2017LYSEI059/these.pdf © [J. Bolivar], [2017], INSA Lyon, tous droits réservés

PDS-RB-213 - Rév. A4
Edition du 20/04/15
RF 2017.01 1/21
MISTRAS Group, SAS – Siège Social : 27, rue Magellan – 94 370 Sucy en Brie - France
Tél. : +33 (0)1 49 82 60 40 - Fax : +33 (0)1 49 82 60 42 – Email : [email protected] – Web : www.mistrasgroup.eu – www.mistrasgroup.com S.A.S. au capital de 4 513 600 € - RCS Créteil B 329 168 033 - Siret 329 168 033 00028 - APE 7120B – TVA FR 73 329 168 033
Traitement de Données EA : Projet ECCOFIC [INSA – Lyon].
Deuxième campagne d’essais [CC 01-15 au CC 07-15] Site de l'examen : INSA LYON – Laboratoire MATEIS Commande N° : BT 40109887 Pour le compte de :
Rév. Rapport Date Commentaires A 17/03/2017 1ère édition
Rédacteur(s) : Omar AL HAJ
Approbateur :
Alain PROUST AT3 COFREND
Cette thèse est accessible à l'adresse : http://theses.insa-lyon.fr/publication/2017LYSEI059/these.pdf © [J. Bolivar], [2017], INSA Lyon, tous droits réservés

RAPPORT D'EXAMEN PDS-RB-213 - Rév. A4
Traitement de Données EA : Projet ECCOFIC
Rapport n° RF 2017.01
2/21
MISTRAS GROUP SA – Division EPA Copyright, 1994, Paris, EPA
Table des matières
1 INTRODUCTION 2
2 ETUDE EXPERIMENTALE 3
2.1 Essais (MATEIS – INSA LYON) 3
2.2 Analyse des données (Noesis 7.0) 4
2.2.1 Phase I (0 et 24 000 s) : 5 2.2.2 Phase II (24 000 s – 48 000 s) : 11 2.2.3 Phase III (t > 48 000 s) : 14
3 CONCLUSION 20
1 INTRODUCTION
Ce rapport présente l’analyse des données issues de la deuxième campagne des essais réalisés dans le cadre du projet ECOFFIC au laboratoire MATEIS de l’INSA LYON. Ce rapport fait suite au premier rapport [RF 15.04].
Cette thèse est accessible à l'adresse : http://theses.insa-lyon.fr/publication/2017LYSEI059/these.pdf © [J. Bolivar], [2017], INSA Lyon, tous droits réservés

RAPPORT D'EXAMEN PDS-RB-213 - Rév. A4
Traitement de Données EA : Projet ECCOFIC
Rapport n° RF 2017.01
3/21
MISTRAS GROUP SA – Division EPA Copyright, 1994, Paris, EPA
2 ETUDE EXPERIMENTALE
2.1 ESSAIS (MATEIS – INSA LYON)
Les essais expérimentaux sont réalisés au laboratoire (MATEIS – INSA Lyon) dans le cadre du projet ANR ECCOFIC. Le Tableau 1 résume les différents essais traités au cours de ce rapport. En ce qui concerne le suivi EA, nous avons optimisé le paramétrage de la chaine d’acquisition d’EA (voir Tableau 2), afin de pouvoir optimiser la détection des signaux liés à l’endommagement de l’échantillon (corrosion intergranulaire, propagation des fissures, déformation plastique, fragilisation par H2 …). L’optimisation de la chaine d’acquisition a induit une diminution du bruit parasite et une meilleure résolution des caractéristiques fréquentielles des salves d’EA.
Tableau 1 : Les différents essais réalisés au cours de la deuxième campagne
Test Conditions
expérimentales pH Date
CC 02-15
Inconel 600 MAS dans 0,01 M K
2S
4O
6 à
Charge Constante
(80 % σy)
3.0 16/03/2015
CC 03-15 3.0 16/04/2015
CC 04-15 5.3 04/05/2015
CC 07-15 3.0 29/10/2015
CI 01-15 * Avec immersion
Inconel 600 MAS dans 0,01 M K2S4O6 sans
charge externe
3.0 02/12/2015
Tableau 2 : paramétrage optimisé de la chaine d’acquisition d’EA
Paramètre EA 1 (avant) EA 2
Préamplification 40 dBEA 60 dBEA
Filtre fréquentiel 20 kHz – 1200 kHz 100 kHz – 400 kHz
Fréquence d’acquisition 1 MHz 2 MHz
Pre-trigger 200 pts 50 pts
Longueur forme d’onde 2k pts soit 2048 ms 1k pts soit 512 ms
PDT – HDT – HLT (RAS) 300 – 600 – 1000 µs 300 – 600 – 1000 µs
Seuil 26 dBEA 23 dBEA
Les essais consistent à suivre la corrosion d’un alliage (Inconel 600) présent dans un milieu acide [S4O6
2-, pH = 3.0] et soumis à une charge constante. Les essais CC 02-15, CC 03-15 et CC 07-15 ont été réalisés dans les mêmes conditions expérimentales à l’exception du temps d’immersion avant application de l’effort de l’échantillon qui est de 4 heures pour l’essai CC 02-15 et d’une heure pour les essais CC 03-15 et CC 07-15. Cependant les conditions expérimentales ont été modifiées pour l’essai CC 04-15 (pH =5.3 au lieu de 3.0), la présence d’un milieu moins acide devrait entraîner une diminution de la densité de fissures.
Cette thèse est accessible à l'adresse : http://theses.insa-lyon.fr/publication/2017LYSEI059/these.pdf © [J. Bolivar], [2017], INSA Lyon, tous droits réservés

RAPPORT D'EXAMEN PDS-RB-213 - Rév. A4
Traitement de Données EA : Projet ECCOFIC
Rapport n° RF 2017.01
4/21
MISTRAS GROUP SA – Division EPA Copyright, 1994, Paris, EPA
Le dernier essai (CI 01-15) consiste à suivre uniquement l’immersion de l’échantillon sans charge. Ceci va nous permettre de favoriser les phénomènes de corrosion intergranulaire sans application de contraintes externes et donc de faciliter leur caractérisation par EA.
2.2 ANALYSE DES DONNEES (NOESIS 8.1)
Nous avons utilisé le logiciel Noesis 8.1 afin d’analyser les données de différents essais. Dans un premier temps nous procédons à une analyse multiparamétrique basée sur les caractéristiques extraites des salves d’EA. Cette méthode d’analyse consiste à mettre en évidence, par le biais de multiples corrélations, s’il existe une ou plusieurs relations de dépendances particulières entre ces différents paramètres. L’observation de ces relations de dépendance par la représentation choisie permet alors d’identifier parmi la totalité des signaux d’EA (ou pour un nombre plus restreint) s’il existe une seule et unique population de signaux ou plusieurs. Il est alors possible d’en déduire en partie le nombre de mécanismes émissifs au cours de l’essai et/ou d’établir un filtrage particulier pour supprimer éventuellement les mécanismes "parasites" ou indésirables. Le traitement des différents essais (traction, DIC et potentiel chimique) a permis d’identifier, trois phases lors de la propagation d’une colonie de fissures (voir Figure 1).
Figure 1 : Différentes phases lors de la propagation d’une colonie de fissures (réf. Travaux de José BOLIVAR – INSA MATEIS). Selon les résultats obtenus par MATEIS, la phase I est caractérisée par l’absence de détection des fissures (par DIC) et par un comportement très actif au niveau de la surface de l’échantillon mesuré par bruit électrochimique (vraisemblablement phénomènes de corrosion intergranulaire). La phase II est plutôt caractérisée par la détection des fissures superficielles par DIC, et donc les phénomènes actifs seraient la corrosion intergranulaire ainsi que la propagation des fissures. Pour la phase III, des macro-fissures sont détectées et il existe des interactions entre fissures (coalescences).
Cette thèse est accessible à l'adresse : http://theses.insa-lyon.fr/publication/2017LYSEI059/these.pdf © [J. Bolivar], [2017], INSA Lyon, tous droits réservés
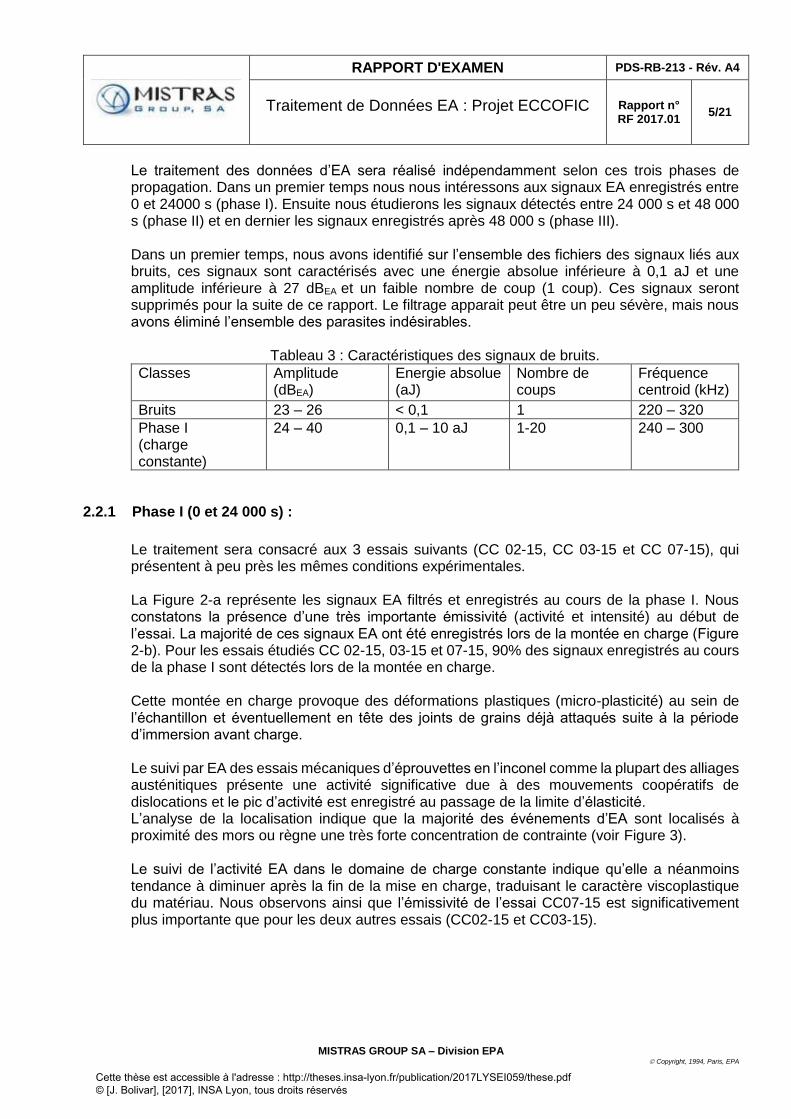
RAPPORT D'EXAMEN PDS-RB-213 - Rév. A4
Traitement de Données EA : Projet ECCOFIC
Rapport n° RF 2017.01
5/21
MISTRAS GROUP SA – Division EPA Copyright, 1994, Paris, EPA
Le traitement des données d’EA sera réalisé indépendamment selon ces trois phases de propagation. Dans un premier temps nous nous intéressons aux signaux EA enregistrés entre 0 et 24000 s (phase I). Ensuite nous étudierons les signaux détectés entre 24 000 s et 48 000 s (phase II) et en dernier les signaux enregistrés après 48 000 s (phase III). Dans un premier temps, nous avons identifié sur l’ensemble des fichiers des signaux liés aux bruits, ces signaux sont caractérisés avec une énergie absolue inférieure à 0,1 aJ et une amplitude inférieure à 27 dBEA et un faible nombre de coup (1 coup). Ces signaux seront supprimés pour la suite de ce rapport. Le filtrage apparait peut être un peu sévère, mais nous avons éliminé l’ensemble des parasites indésirables.
Tableau 3 : Caractéristiques des signaux de bruits.
Classes Amplitude (dBEA)
Energie absolue (aJ)
Nombre de coups
Fréquence centroid (kHz)
Bruits 23 – 26 < 0,1 1 220 – 320
Phase I (charge constante)
24 – 40 0,1 – 10 aJ 1-20 240 – 300
2.2.1 Phase I (0 et 24 000 s) :
Le traitement sera consacré aux 3 essais suivants (CC 02-15, CC 03-15 et CC 07-15), qui présentent à peu près les mêmes conditions expérimentales. La Figure 2-a représente les signaux EA filtrés et enregistrés au cours de la phase I. Nous constatons la présence d’une très importante émissivité (activité et intensité) au début de l’essai. La majorité de ces signaux EA ont été enregistrés lors de la montée en charge (Figure 2-b). Pour les essais étudiés CC 02-15, 03-15 et 07-15, 90% des signaux enregistrés au cours de la phase I sont détectés lors de la montée en charge. Cette montée en charge provoque des déformations plastiques (micro-plasticité) au sein de l’échantillon et éventuellement en tête des joints de grains déjà attaqués suite à la période d’immersion avant charge. Le suivi par EA des essais mécaniques d’éprouvettes en l’inconel comme la plupart des alliages austénitiques présente une activité significative due à des mouvements coopératifs de dislocations et le pic d’activité est enregistré au passage de la limite d’élasticité. L’analyse de la localisation indique que la majorité des événements d’EA sont localisés à proximité des mors ou règne une très forte concentration de contrainte (voir Figure 3). Le suivi de l’activité EA dans le domaine de charge constante indique qu’elle a néanmoins tendance à diminuer après la fin de la mise en charge, traduisant le caractère viscoplastique du matériau. Nous observons ainsi que l’émissivité de l’essai CC07-15 est significativement plus importante que pour les deux autres essais (CC02-15 et CC03-15).
Cette thèse est accessible à l'adresse : http://theses.insa-lyon.fr/publication/2017LYSEI059/these.pdf © [J. Bolivar], [2017], INSA Lyon, tous droits réservés

RAPPORT D'EXAMEN PDS-RB-213 - Rév. A4
Traitement de Données EA : Projet ECCOFIC
Rapport n° RF 2017.01
6/21
MISTRAS GROUP SA – Division EPA Copyright, 1994, Paris, EPA
Figure 2-a : Activité filtrée enregistrée au cours des différents essais (Phase I : CC02-15, CC03-15 et CC07-15).
Graphe 1 : Activité cumulée des salves filtrées en fonction du temps
Graphe 2 : Intensité cumulée (log) des salves filtrées en fonction du temps
Graphe 3 : Nombre de salves filtrées en fonction de leur amplitude
Graphe 4 : Amplitude des salves filtrées en fonction du temps
Cette thèse est accessible à l'adresse : http://theses.insa-lyon.fr/publication/2017LYSEI059/these.pdf © [J. Bolivar], [2017], INSA Lyon, tous droits réservés

RAPPORT D'EXAMEN PDS-RB-213 - Rév. A4
Traitement de Données EA : Projet ECCOFIC
Rapport n° RF 2017.01
7/21
MISTRAS GROUP SA – Division EPA Copyright, 1994, Paris, EPA
Figure 2-b : Activité filtrée enregistrée au cours de différents essais (CC02-15, C03-15 et CC07-15) dans le domaine de montée en charge (Stress MPa).
Graphe 1 : Activité cumulée des salves filtrées en fonction du temps
Graphe 2 : Intensité cumulée (log) des salves filtrées en fonction du temps
Graphe 3 : Nombre de salves filtrées en fonction de leur amplitude
Graphe 4 : Amplitude des salves filtrées en fonction du temps
Cette thèse est accessible à l'adresse : http://theses.insa-lyon.fr/publication/2017LYSEI059/these.pdf © [J. Bolivar], [2017], INSA Lyon, tous droits réservés

RAPPORT D'EXAMEN PDS-RB-213 - Rév. A4
Traitement de Données EA : Projet ECCOFIC
Rapport n° RF 2017.01
8/21
MISTRAS GROUP SA – Division EPA Copyright, 1994, Paris, EPA
Figure 3 : Amplitude des événements EA localisés par les deux capteurs (capteur 1 et 2 – projection sur X) et enregistrés au cours de la montée en charge de la phase I. La Figure 4 représente les données 100 sec après la fin de l’application de la charge. Nous observons ainsi que les signaux détectés pour l’essai CC07-15 sont également plus nombreux et de plus forte amplitude que les signaux enregistrés au cours de deux autres essais (CC02-15 et CC03-15). Pour les autres phases de l’étude, les signaux étant d’amplitude beaucoup plus faible, la localisation est assez peu pertinente et donc ne sera pas présentée.
Cette thèse est accessible à l'adresse : http://theses.insa-lyon.fr/publication/2017LYSEI059/these.pdf © [J. Bolivar], [2017], INSA Lyon, tous droits réservés

RAPPORT D'EXAMEN PDS-RB-213 - Rév. A4
Traitement de Données EA : Projet ECCOFIC
Rapport n° RF 2017.01
9/21
MISTRAS GROUP SA – Division EPA Copyright, 1994, Paris, EPA
Figure 4 : Activité filtrée enregistrée au cours des différents essais (CC02-15, CC03-15 et CC07-15) dans le domaine de charge constante (100 sec après la fin de l’application de la charge).
Graphe 1 : Activité cumulée des salves filtrées en fonction du temps
Graphe 2 : Intensité cumulée (log) des salves filtrées en fonction du temps
Graphe 3 : Nombre de salves filtrées en fonction de leur amplitude
Graphe 4 : Amplitude des salves filtrées en fonction du temps
Cette thèse est accessible à l'adresse : http://theses.insa-lyon.fr/publication/2017LYSEI059/these.pdf © [J. Bolivar], [2017], INSA Lyon, tous droits réservés

RAPPORT D'EXAMEN PDS-RB-213 - Rév. A4
Traitement de Données EA : Projet ECCOFIC
Rapport n° RF 2017.01
10/21
MISTRAS GROUP SA – Division EPA Copyright, 1994, Paris, EPA
Dans le but de comprendre l’origine de cette différence, nous avons comparé les signaux d’EA enregistrés lors de la phase d’immersion avant l’application de la charge. Le suivi des signaux EA montre que les essais CC 02-15 et CC 03-15 ont été fortement émissifs lors de la phase d’immersion (Figure 5). Cependant l’essai CC 07-15 présente une très faible activité lors de la période d’immersion (Figure 5). L’émissivité significative détectée lors de l’immersion de deux éprouvettes (CC 02-15 et CC 03-15) pourrait résulter de l’amorçage et propagation de corrosion intergranulaire. Cet effet est bien moins marqué pour l’essai CC 07-15.
Figure 5 : Activité filtrée enregistrée au cours de la phase d’immersion avant chargement (CC 02-15, CC 03-15 et CC 07-15).
Graphe 1 : Activité cumulée des salves filtrées en fonction du temps
Graphe 2 : Intensité cumulée des salves filtrées en fonction du temps
Graphe 3 : Nombre de salves filtrées en fonction de leur amplitude
Graphe 4 : Amplitude des salves filtrées en fonction du temps
Cette thèse est accessible à l'adresse : http://theses.insa-lyon.fr/publication/2017LYSEI059/these.pdf © [J. Bolivar], [2017], INSA Lyon, tous droits réservés

RAPPORT D'EXAMEN PDS-RB-213 - Rév. A4
Traitement de Données EA : Projet ECCOFIC
Rapport n° RF 2017.01
11/21
MISTRAS GROUP SA – Division EPA Copyright, 1994, Paris, EPA
2.2.2 Phase II (24 000 s – 48 000 s) :
Lors deuxième phase, les signaux EA sont caractérisés par des amplitudes faibles à moyennes (24 dBEA à 50 dBEA) (voir Figure 6). L’énergie absolue de la majorité des signaux d’EA enregistrés au cours de cette phase est inférieure à 10 aJ. Les caractéristiques de ces signaux sont comparables à ceux détectés au cours de la phase I dans le domaine de charge constante. L’activité EA est constante tout au long de cette phase II (voir Figure 6). Le suivi de l’intensité indique la détection de signaux intenses au début de la phase II pour les essais CC 03-15 & CC 07-15. Dans le but d’identifier l’origine des signaux EA enregistrés au cours de cette phase, nous avons comparé les caractéristiques de ces signaux de la phase II à ceux de l’essai d’immersion (CI 01-15).
Figure 6 : Activité filtrée enregistrée au cours des différents essais (CC 02-15, CC 03-15 et CC 07-15) phase II.
Graphe 1 : Activité cumulée des salves filtrées en fonction du temps
Graphe 2 : Intensité cumulée (log) des salves filtrées en fonction du temps
Graphe 3 : Nombre de salves filtrées en fonction de leur amplitude
Graphe 4 : Amplitude des salves filtrées en fonction du temps
Cette thèse est accessible à l'adresse : http://theses.insa-lyon.fr/publication/2017LYSEI059/these.pdf © [J. Bolivar], [2017], INSA Lyon, tous droits réservés

RAPPORT D'EXAMEN PDS-RB-213 - Rév. A4
Traitement de Données EA : Projet ECCOFIC
Rapport n° RF 2017.01
12/21
MISTRAS GROUP SA – Division EPA Copyright, 1994, Paris, EPA
Essai d’immersion (CI 01-15) Le but de l’essai d’immersion est d’avoir la signature acoustique des phénomènes de corrosion intergranulaire « seuls ». Les conditions de l’essai d’immersion (milieu acide pH = 3.0) favorisent l’amorçage de la corrosion intergranulaire au niveau des joints de grains qui peuvent devenir des sites préférentiels d’amorçage de fissuration. Ce phénomène peut être accompagné de mécanismes potentiellement émissifs comme l’évolution de l’hydrogène, l’expansion des produits de corrosion au niveau des joints de grains et/ou la propagation de fissures, ... Deux facteurs peuvent limiter l’efficacité de la comparaison entre les deux types des essais (essai CC et essai d’immersion). Le premier est lié au fait que les échantillons ont été soumis à des contraintes mécaniques lors des essais à charge constante (CC) et ce qui n’est pas le cas de l’échantillon utilisé lors de l’essai d’immersion. Le deuxième facteur est lié à l’utilisation d’une demi-éprouvette lors de l’essai d’immersion sachant que des éprouvettes entières ont été utilisées lors des essais de CC. Cette différence de géométrie peut potentiellement induire une légère différence au niveau des caractéristiques des signaux EA (via leur fonction de transfert et modes de résonances). Une faible activité et intensité acoustique sont observées lors de l’essai d’immersion (24 000 s et 48 000 s). Cette émissivité (activité et intensité) reste de même ordre que celle détectée au cours des 3 essais de charge constante (Voir Figure 7). Le suivi de l’amplitude indique que des salves d’amplitude faible à moyenne sont détectés au cours des différents essais (CI et CC). Les analyses multiparamétriques indiquent que les signaux EA enregistrés lors des essais à charge constante présentent les mêmes caractéristiques que les signaux détectés lors de l’essai d’immersion seule. Le Tableau 4 détaille les caractéristiques de ces signaux (Durée, temps de montée, fréquence centroïde, …). Donc, il n’y a pas de différence entre les signaux détectés sous charge et en l’absence de celle-ci. Tableau 4 : Caractéristiques des signaux liés aux phénomènes de corrosion intergranulaire
Les résultats EA sont également bien corrélés avec les résultats des observations par DIC et le suivi du bruit électrochimique, qui indique la détection des fissures superficielles par DIC, et les phénomènes potentiellement actifs sont donc la corrosion intergranulaire ainsi que la propagation des fissures superficielles.
Classes Amplitude (dBEA)
Energie absolue (aJ)
Nombre de coups Fréquence centroid (kHz)
Phase II et CI
24 – 50 < 100 1 - 100 200 – 300
Cette thèse est accessible à l'adresse : http://theses.insa-lyon.fr/publication/2017LYSEI059/these.pdf © [J. Bolivar], [2017], INSA Lyon, tous droits réservés

RAPPORT D'EXAMEN PDS-RB-213 - Rév. A4
Traitement de Données EA : Projet ECCOFIC
Rapport n° RF 2017.01
13/21
MISTRAS GROUP SA – Division EPA Copyright, 1994, Paris, EPA
Figure 7 : Activité filtrée enregistrée au cours des différents essais (CC02-15, C03-15, CC07-15 et CI 01-15 phase II).
Graphe 1 : Activité cumulée des salves filtrées en fonction du temps
Graphe 2 : Intensité cumulée des salves filtrées en fonction du temps
Graphe 3 : Nombre de salves filtrées en fonction de leur amplitude
Graphe 4 : Amplitude des salves filtrées en fonction du temps
Cette thèse est accessible à l'adresse : http://theses.insa-lyon.fr/publication/2017LYSEI059/these.pdf © [J. Bolivar], [2017], INSA Lyon, tous droits réservés

RAPPORT D'EXAMEN PDS-RB-213 - Rév. A4
Traitement de Données EA : Projet ECCOFIC
Rapport n° RF 2017.01
14/21
MISTRAS GROUP SA – Division EPA Copyright, 1994, Paris, EPA
2.2.3 Phase III (t > 48 000 s) :
Pour la phase III, les essais CC 02-15 et CC 07-15 sont arrêtés avant la rupture de l’éprouvette. En revanche l’essai CC-03 était mené jusqu’à la rupture. Nous présentons dans un premier temps les données EA enregistrés lors de deux essais CC 02-15 et CC 07-15 (voir Figure 8). Les résultats EA indiquent une augmentation significative de l’activité et surtout de l’intensité à partir de 57 000 s pour les deux essais (CC 02-15 et CC 07-15 voir Figure 8). La corrélation entre les résultats EA et les suivis par DIC et par EN (bruit électrochimique) nous permettent d’attribuer cette augmentation de l’émissivité à la formation des fissures et au début coalescence de fissures.
Figure 8 : Activité filtrée enregistrée au cours des différents essais (CC 02-15 et CC 03-15) phase III.
Graphe 1 : Activité cumulée des salves filtrées en fonction du temps
Graphe 2 : Intensité cumulée des salves filtrées en fonction du temps
Graphe 3 : Nombre de salves filtrées en fonction de leur amplitude
Graphe 4 : Amplitude des salves filtrées en fonction du temps
Cette thèse est accessible à l'adresse : http://theses.insa-lyon.fr/publication/2017LYSEI059/these.pdf © [J. Bolivar], [2017], INSA Lyon, tous droits réservés

RAPPORT D'EXAMEN PDS-RB-213 - Rév. A4
Traitement de Données EA : Projet ECCOFIC
Rapport n° RF 2017.01
15/21
MISTRAS GROUP SA – Division EPA Copyright, 1994, Paris, EPA
Nous poursuivons le traitement des données EA en s’intéressant à l’essai CC 03-15 (Essai avec rupture – Figure 9). Les données EA enregistrées au cours de cet essai (t > 48 000 s) montre une augmentation de l’activité à partir de 57 000 s (voir Figure 9). Cette augmentation devient très importante à partir de 68 000 s et s’accroit régulièrement jusqu’à la fin de l’essai où l’activité est intense (Figure 9). L’augmentation de l’émissivité observée pour t = 57 000 s, donne un critère d’amorçage des fissures vraisemblablement résultantes de déformations plastiques locales. Ceci montre l’intérêt et la sensibilité de la technique de l’EA dans la détection des déformations plastiques localisées ainsi que l’amorçage et la propagation des fissures. Dans le but d’identifier la signature acoustique de ces deux phénomènes (déformation plastique et macro-fissuration), nous comparons les signaux EA de l’essai CC 03-15 avec les signaux d’un essai à monofissure (CC 04-15). La modification des conditions expérimentales pour l’essai CC 04-15 (pH = 5.3 au lieu de 3.0 pour les autres essais), a induit une diminution de la densité de fissures. Le suivi de l’essai CC 04-15 (« monofissure ») montre un amorçage moins précoce de l’émissivité (augmentation à partir de 270 000 s – Figure 10). Dans le but d’affiner la comparaison entre les signaux enregistrés au cours de ces deux essais (CC 03-15 et CC 04-15), nous avons réalisé une analyse en composante principale. Cette analyse est réalisée dans les cas complexes, i.e. lorsque l’ensemble des données en représentation 2D se superpose ou lorsque le nombre de paramètres corrélés est supérieur à deux. La première étape de cette analyse consiste en une mise en forme des données. Chaque signal d’Emission Acoustique est représenté dans un espace multidimensionnel par un vecteur, dont les coordonnées sont les différents paramètres acoustiques. Par exemple, un signal acoustique peut-être défini de la façon suivante :
Les données sont ensuite normalisées. Pour chaque signal d’EA, chaque paramètre est divisé par sa valeur moyenne (zero mean). Cette normalisation permet de donner des poids statistiques équivalant à la variation des chacun des paramètres. L’analyse en composante principale permet de maximiser la dispersion des vecteurs. La dimension du réseau de données correspond au nombre de paramètres projetés. Ainsi, deux vecteurs ayant des caractéristiques proches sont représentés dans la même région de l’espace (PCA Axis 0, PCA Axis 1 : plus forte valeur des vecteurs propres cf. Figure 11).
Les résultats de cette analyse ACP nous permettent aisément de distinguer dans un premier temps et facilement les signaux liés à la macro-fissuration et/ou coalescence de fissures. Les caractéristiques de ces signaux (signaux fortement énergétiques – Ea > 1 000 aJ) et le moment de leur apparition (fin des essais mécaniques) nous a permis d’attribuer ces signaux à des phénomènes de macro-fissuration.
S = f (amplitude, énergie, nombre de coups, durée, temps de montée, etc.)
Cette thèse est accessible à l'adresse : http://theses.insa-lyon.fr/publication/2017LYSEI059/these.pdf © [J. Bolivar], [2017], INSA Lyon, tous droits réservés

RAPPORT D'EXAMEN PDS-RB-213 - Rév. A4
Traitement de Données EA : Projet ECCOFIC
Rapport n° RF 2017.01
16/21
MISTRAS GROUP SA – Division EPA Copyright, 1994, Paris, EPA
Figure 9 : Activité filtrée enregistrée au cours des différents essais (CC 03-15 - t > 48 000 s) phase III.
Graphe 1 : Activité cumulée des salves filtrées en fonction du temps
Graphe 2 : Intensité cumulée des salves filtrées en fonction du temps
Graphe 3 : Nombre de salves filtrées en fonction de leur amplitude
Graphe 4 : Amplitude des salves filtrées en fonction du temps
Cette thèse est accessible à l'adresse : http://theses.insa-lyon.fr/publication/2017LYSEI059/these.pdf © [J. Bolivar], [2017], INSA Lyon, tous droits réservés

RAPPORT D'EXAMEN PDS-RB-213 - Rév. A4
Traitement de Données EA : Projet ECCOFIC
Rapport n° RF 2017.01
17/21
MISTRAS GROUP SA – Division EPA Copyright, 1994, Paris, EPA
Figure 10 : Activité filtrée enregistrée au cours de deux essais (CC 03-15, CC 04-15 t > 48 000 s) phase III.
Graphe 1 : Activité cumulée des salves filtrées en fonction du temps
Graphe 2 : Intensité cumulée des salves filtrées en fonction du temps
Graphe 3 : Nombre de salves filtrées en fonction de leur amplitude
Graphe 4 : Amplitude des salves filtrées en fonction du temps En tenant compte de l’analyse en composante principale (ACP Figure 12-a et 12-b) l’analyse des distances inter populations, nous constatons que les signaux EA enregistrés lors de deux essais (CC 04-15 et CC 03-15 phase III) présentent les mêmes caractéristiques que les signaux EA détectés lors de la montée en charge (CC 03-15 phase I). Ceci confirme que ces signaux résultent majoritairement des déformations plastiques intenses localisées (voir Figure 12). Le Tableau 5 détaille les caractéristiques de ces signaux (Durée, temps de montée, fréquence centroid, …). Tableau 5 : Caractéristiques des signaux liés aux phénomènes de déformations plastiques.
Cette thèse est accessible à l'adresse : http://theses.insa-lyon.fr/publication/2017LYSEI059/these.pdf © [J. Bolivar], [2017], INSA Lyon, tous droits réservés

RAPPORT D'EXAMEN PDS-RB-213 - Rév. A4
Traitement de Données EA : Projet ECCOFIC
Rapport n° RF 2017.01
18/21
MISTRAS GROUP SA – Division EPA Copyright, 1994, Paris, EPA
Figure 11 : Activité filtrée enregistrée au cours de deux essais (CC 03-15, CC 04-15 phase III).
Graphe 1 : ACP des signaux EA, représentation selon les deux axes (PCA 0 & PCA 1)
Graphe 2 : Amplitude des salves filtrées en fonction du temps (essai CC 03-15)
Graphe 3 : Amplitude des salves filtrées en fonction du temps (essai CC 04-15)
Classes Amplitude (dBEA)
Energie absolue (aJ)
Nombre de coups Fréquence centroid (kHz)
Phase III et CC 04-15
24 – 50 < 150 1 - 100 190 – 310
Cette thèse est accessible à l'adresse : http://theses.insa-lyon.fr/publication/2017LYSEI059/these.pdf © [J. Bolivar], [2017], INSA Lyon, tous droits réservés

RAPPORT D'EXAMEN PDS-RB-213 - Rév. A4
Traitement de Données EA : Projet ECCOFIC
Rapport n° RF 2017.01
19/21
MISTRAS GROUP SA – Division EPA Copyright, 1994, Paris, EPA
-a-
-b-
Figure 12 : ACP des signaux EA enregistrés au cours des essais (CC03-15 phase I, CC03-15 phase III et CC 04-15).
Cette thèse est accessible à l'adresse : http://theses.insa-lyon.fr/publication/2017LYSEI059/these.pdf © [J. Bolivar], [2017], INSA Lyon, tous droits réservés

RAPPORT D'EXAMEN PDS-RB-213 - Rév. A4
Traitement de Données EA : Projet ECCOFIC
Rapport n° RF 2017.01
20/21
MISTRAS GROUP SA – Division EPA Copyright, 1994, Paris, EPA
3 CONCLUSION
Le traitement de l’ensemble de données qui nous ont été communiqués de la deuxième campagne d’essais réalisée dans le cadre du projet ECCOFIC, nous a permis d’identifier les populations de signaux d’émission acoustique suivantes :
Bruits : Les signaux classifiés comme bruits ont été enregistrés tout au long de différentes essais. Ils sont caractérisés par une énergie absolue inférieure à 0,1 aJ et une amplitude inférieure à 27 dBEA et un faible nombre de coup (1 coup). Ces signaux résultent du bruit instrumental et électromagnétique ils ont été supprimés lors du traitement de données de différents essais. Montée en charge : Une importante activité acoustique est détectée lors de la montée en charge au niveau de différents essais traités. Cette montée en charge créé des déformations plastiques localisées au sein du matériau (mouvements coopératifs de dislocations), ces phénomènes sont à l’origine de l’émission importante enregistrée lors la sollicitation initiale. Corrosion intergranulaire : Les signaux d’EA représentatifs de la corrosion intergranulaire ont été enregistrés dans le domaine de charge constante de la phase I et II et également au début la phase III. Les signaux de cette classe sont caractérisés par une amplitude faible à moyenne comprise entre (24 dBEA
– 50 dBEA). L’énergie absolue de la majorité de ces salves est inférieure à 10 aJ, le nombre de coups par salve de ces signaux est inférieure à 30 coups/salve. Nous avons effectué une comparaison entre les signaux EA détectés lors de trois essais (CC 02-15, CC 03-15 et CC 07-15) et un essai d’immersion (CI). L’essai d’immersion sans application des contraintes mécaniques, permet de favoriser la détection de la signature acoustique des phénomènes de corrosion intergranulaire. Aucune différence notable entre les signaux de la phase II et de l’immersion seule sans contrainte n’a été mise en évidence. Nous pouvons donc d’avancer l’hypothèse que les signaux d’EA sont les mêmes avec ou sans application de contrainte externe. Macrofissurations : Les signaux EA appartenant à cette classe ont été enregistrés bien avant la rupture (quelques heures) de l’éprouvette pour l’essai CC 03-15 et au niveau de l’essai CC 04-15. Les signaux de cette classe sont significativement plus énergétiques en comparaissant aux signaux des autres classes (Ea > 1000 aJ) et présentent des fortes amplitudes comprises entre (50 dBEA – 80 dBEA). Les résultats EA sont bien corrélés avec les autres techniques de mesure (DIC et EN) qui ont révélés la présence des macrofissures et coalescence de fissures lors de la phase III. Déformation plastique : Les signaux EA appartenant à cette classe ont été enregistrés majoritairement au niveau de deux essais (CC 03-15 et CC 04-15). Ces signaux de cette classe sont caractérisés par une amplitude moyenne comprise entre (24 dBEA – 50 dBEA). L’énergie absolue de la majorité de
Cette thèse est accessible à l'adresse : http://theses.insa-lyon.fr/publication/2017LYSEI059/these.pdf © [J. Bolivar], [2017], INSA Lyon, tous droits réservés

RAPPORT D'EXAMEN PDS-RB-213 - Rév. A4
Traitement de Données EA : Projet ECCOFIC
Rapport n° RF 2017.01
21/21
MISTRAS GROUP SA – Division EPA Copyright, 1994, Paris, EPA
ces salves est inférieure à 100 aJ, le nombre de coups par salve de ces signaux est inférieure à 100 coups/salve. L’identification de cette population des salves EA est réalisée en effectuant une comparaison entre les signaux enregistrés lors des essais CC 03-15 phase III et CC 04-15 avec les signaux enregistrés lors de la montée en charge (CC03-15 phase I) où nous favorisons la détection des phénomènes de déformations plastiques.
Nous constatons aussi que les signaux représentatifs de phénomènes de déformations plastiques présentent les mêmes caractéristiques que les signaux représentant des phénomènes de corrosion intergranulaire (Tableau 6). Ceci nous indique que pour l’ensemble des essais étudiés, nous détectons la même signature acoustique liée à des phénomènes de déformations plastiques. La corrélation entre les résultats EA et les observations par DIC confirme la détection des phénomènes de déformations plastiques au cours de l’ensemble des essais suivis. Tableau 6 : Caractéristiques des signaux liés aux phénomènes de déformations plastiques et
de la corrosion intergranulaire.
Il est également très intéressant de noter que l’essai qui s’est avéré significativement moins émissif lors des phases d’immersion est celui qui présente une très forte émissivité lors du chargement initial. Il serait intéressant de comprendre le lien entre les conditions de stabilisation dans le milieu corrosif dans le milieu corrosif et la plasticité localisée due au chargement qui s’en suit.
Un enregistrement informatique des données EA relevées lors de cet examen et des documents internes manuscrits d'essai sont conservés par Euro Physical Acoustics en vue de toute analyse ultérieure pendant une durée minimale de 10 ans.
###
Classes Amplitude (dBEA)
Energie absolue (aJ)
Nombre de coups
Fréquence centroïde (kHz)
Durée (µs)
Déformations plastiques
24 – 50 < 150 1 - 100 190 – 310 < 1000
Corrosion intergranulaire
24 - 50 < 100 1 - 100 200 - 300 < 500
Cette thèse est accessible à l'adresse : http://theses.insa-lyon.fr/publication/2017LYSEI059/these.pdf © [J. Bolivar], [2017], INSA Lyon, tous droits réservés

Appendix D: Assessment of Stress Intensity Factors from DIC measurements
José Bolivar 232
Thèse en Sciences des Matériaux / 2017
Institut national des sciences appliquées de Lyon
D. Appendix D
Assessment of Stress Intensity Factors from
DIC measurements On the basis of Linear Elastic Fracture Mechanics (LEFM), the crack driving force can be
described by the Stress Intensity Factors at the crack tip. These quantities can be assessed
from the displacement fields estimated by DIC analysis [117], [246], [247]. The methodology
is based on a least-squares minimization of the gap between the obtained displacement fields
(experimental,𝑢𝐷𝐼𝐶) and analytical solutions describing the kinematic of the crack tip
neighborhood. Such analytical solutions consist in the William's series [248]. In that context,
the present appendix aims at describing the extraction of SIF-values by using William's series
and the experimental displacement fields obtained by DIC.
Principle
Considering an infinite homogeneous elastic solid with isotropic behavior, Williams [248] has
obtained the in-plane and out-of-plane solutions for the stress distribution produced by a semi-
infinite crack. The solutions are given for the complex plane by the double sum of terms
describing the mode of load m and the order of the series n (Equation D-1). In this coordinate
system, X is the direction of the crack (see Figure D-1). The fields of William's series are
decomposed into a base formed by the functions 𝜙𝑚𝑛 (𝑥, 𝑦). The expressions of the William's
series for modes I and II are given by the Equation D-2 and Equation D-3 respectively.
𝑢𝑤(𝑥, 𝑦) = 𝑢𝑥(𝑥, 𝑦) + 𝑖 ∙ 𝑢𝑦(𝑥, 𝑦) = ∑ ∑ 𝑎𝑚𝑛 𝜙𝑚
𝑛 (𝑥, 𝑦)+∞𝑛= −∞
2𝑚=1 Equation D-1
𝜙𝐼𝑛(𝑟, 𝜃) = 𝑟𝑛 2⁄ (𝑘𝑒𝑖𝑛𝜃 2⁄ −
𝑛
2𝑒𝑖(4−𝑛)𝜃 2⁄ + (
𝑛
2+ (−1)𝑛) 𝑒−𝑖𝑛𝜃 2⁄ ) Equation D-2
𝜙𝐼𝐼𝑛 (𝑟, 𝜃) = 𝑟𝑛 2⁄ (𝑘𝑒𝑖𝑛𝜃 2⁄ −
𝑛
2𝑒𝑖(4−𝑛)𝜃 2⁄ − (
𝑛
2+ (−1)𝑛) 𝑒−𝑖𝑛𝜃 2⁄ ) Equation D-3
where the real part of these fields is the displacement component along the crack path and the
imaginary part its component along the orthogonal direction (see Figure D-1). Note that in
these equations, i is the pure imaginary number, r the distance to the crack tip, and θ the angle
with respect to the coordinate system (X, Y). Hence, by adopting complex notations, the
position of a material point is defined by M which can be expressed as x+ iy or by 𝑟𝑒𝑖𝜃 (see
Figure D-1). Note that κ is the Kolossov' constant, namely, 𝜅 = (3 − 𝜈)/(1 + 𝜈) for plane
stress or 𝜅 = (3 − 4𝜈) for plane strain conditions, where 𝜈 is the Poisson's ratio.
Depending on the order n, different interpretations can be given. They are described in Table
D-1.
Cette thèse est accessible à l'adresse : http://theses.insa-lyon.fr/publication/2017LYSEI059/these.pdf © [J. Bolivar], [2017], INSA Lyon, tous droits réservés

Appendix D: Assessment of Stress Intensity Factors from DIC measurements
José Bolivar 233
Thèse en Sciences des Matériaux / 2017
Institut national des sciences appliquées de Lyon
Table D-1. Interpretation of the different orders of the William's series
value of n -1 0 1 2 >2
Interpretation
Crack tip
position for
an equivalent
elastic crack
Rigid body
translations
Usual asymptotic
terms that are
weighted by
Stress Intensity
factors
Rigid body
in-plane
rotation and
T-stress
Sub-singular terms, i.e.
the corresponding elastic
stress field is not
singular at the crack tip
Figure D-1. Schematic representation of the coordinate system for the William's series. (Right) As defined by
the William series [67] and (Left) used for the iterative process during least-square minimization
On this basis, William's series can be used as a base of function for the displacement field
obtained through DIC. When the origin of the polar coordinate system matches with the crack
tip, the displacement field can be described by Equation D-1. In this case, the comparison of
the Williams series of order 1 with the displacement field obtained by DIC allows obtaining
the SIF values (Km) through Equation D-4.
𝐾𝑚 = 2𝜇√2𝜋𝑎𝑚1 Equation D-4
where µ is the shear modulus.
However, when the position of the crack tip is unknown. The problem is ill -posed because
both the coefficients 𝑎𝑚𝑛 , the position of the crack tip and its orientation cannot be assessed
directly. However, finding the orientation of the crack from a displacement field (or an image)
is usually easy. Eventually, the only remaining unknown is the position of the crack tip along
a line defining the crack orientation. For this, an iterative search is performed so that the
position of the equivalent elastic crack tip is obtained.
Roux et al. [117] have demonstrated that a recursive formula can be obtained when Equation
D-2 is differentiated respect to the abscissa X:
𝑑𝜙𝑚𝑛
𝑑𝑋=
𝑛
2𝜙𝑚
𝑛−2 Equation D-5
Supposing that the estimated crack tip position (𝑧 = 𝑥 + 𝑖𝑦) is shifted by a small distance dx
and that the displacement field is now expressed as a function of the William's series (𝑢𝑤) in
the shifted coordinate system (�� = ( 𝑥 + 𝑑𝑥) + 𝑖𝑦) gives
Cette thèse est accessible à l'adresse : http://theses.insa-lyon.fr/publication/2017LYSEI059/these.pdf © [J. Bolivar], [2017], INSA Lyon, tous droits réservés

Appendix D: Assessment of Stress Intensity Factors from DIC measurements
José Bolivar 234
Thèse en Sciences des Matériaux / 2017
Institut national des sciences appliquées de Lyon
𝑢𝑤 = ∑ 𝑎𝑚𝑛 𝜙𝑚
𝑛 (𝑧)
𝑛≥0,𝑚
= ∑ ��𝑚𝑛 𝜙𝑚
𝑛 (��)
𝑛𝑚
Equation D-6
Using a first order Taylor expansion of 𝜙𝑚𝑛 (��) and Equation D-5 allows consideration of not
only 𝑛 ≥ 0 but also 𝑛 < 0 terms. Then, Equation D-7 can be written by considering that the
expression of 𝑢𝑤 from Equation D-1 has a zero term for 𝑛 = −1 and mode I:
−𝑑𝑥
2��𝐼
1 + ��𝐼−1 = 0 Equation D-7
The implication is that using the first super-singular (𝑛 = −1), term, one can identify the mis-
positioning of the crack tip (dx). In practice, the process is iterative: the inverse problem is
solved in a least-squares sense, finding 𝑎𝑚𝑛 for mode I, mode II and for n between -3 to 5.
Then, the mis-positioning dx of the crack tip is estimated using Equation D-7. The coordinate
system is progressively corrected until sufficient precision (for the crack tip position) is
reached. When material non-linearities occur in the vicinity of the crack tip, the obtained crack
tip location is the one generated by the elastic fields that best describe the actual displacement
field 𝑢𝑤, namely the equivalent elastic crack tip. After obtaining the position of the crack tip,
the term 𝑛 = 1 is used for the extraction of the SIF values according to the Equation D-8.
𝜂2 = ∑ [𝑢𝐷𝐼𝐶 − ∑ 𝑎𝑚𝑛 𝜙𝑚
𝑛 (𝑧)𝑛≥0,𝑚 ]2
𝑊𝑖=1 Equation D-8
where 𝑢𝐷𝐼𝐶 is the displacement field obtained by DIC according to the mode m and W the
plane for which the William's series are defined (see Figure D-2). W is defined by a disc of
external radius (Re) and internal radius (Ri) centered at the crack tip. The exclusion of the
internal disc of radius Ri is because of the presence of the singularity. Moreover, a band of
width d is also excluded due to the roughness of the crack flanks.
Figure D-2. Definition of the William plane (W) within which the least-square minimization is performed
[122].
Cette thèse est accessible à l'adresse : http://theses.insa-lyon.fr/publication/2017LYSEI059/these.pdf © [J. Bolivar], [2017], INSA Lyon, tous droits réservés

Appendix E: A phase field method for modelling stress corrosion crack propagation
José Bolivar 235
Thèse en Sciences des Matériaux / 2017
Institut national des sciences appliquées de Lyon
E. Appendix E
A phase field method for modelling stress
corrosion crack propagation
Article abstract:
Stress Corrosion Cracking (SCC) is a very common failure mechanism characterized by a
slow, environmentally influenced crack propagation in structural components. The
mechanisms proposed to explain, at the microscopic scale, the cracking propagation
processes are not able to elucidate all aspects of this phenomenon in different
metal/environment systems. This work is concerned with the development of a new
multiphysics model for understanding the phenomena of crack propagation under the effect
of SCC. This new model is based upon: (i) a phase field method, based on a variational
formulation of brittle fracture with regularized approximation of discontinuities; (ii) a
robust algorithm capable to prescribe the displacements (over the boundary of a small sub -
volume) and crack onset obtained by image processing based on digital image correlation
in the sample during the numerical simulations; (iii) a coupling with a diffusion model
informed with first-principles computations of diffusion coefficient. In this new model, the
phenomenon of environmentally assisted cracking phenomena was successfully represented
as well the interactions between cracks and the subsequent shielding effects. The analyses,
performed on several samples of Inconel 600 alloy containing a crack network, show a
remarkable agreement between the crack morphology and history obtained by the model
and by the experiments.
Cette thèse est accessible à l'adresse : http://theses.insa-lyon.fr/publication/2017LYSEI059/these.pdf © [J. Bolivar], [2017], INSA Lyon, tous droits réservés

International Journal of Solids and Structures 112 (2017) 65–82
Contents lists available at ScienceDirect
International Journal of Solids and Structures
journal homepage: www.elsevier.com/locate/ijsolstr
A phase field method for modeling stress corrosion crack propagation
in a nickel base alloy
Thanh-Tung Nguyen
a , José Bolivar b , Julien Réthoré a , ∗, Marie-Christine Baietto
a , Marion Fregonese
b
a LaMCoS, Université de Lyon, INSA Lyon, CNRS UMR 5259, 27 Avenue Jean Capelle, F-69621 Villeurbanne Cedex, France b MATEIS, Université de Lyon, INSA Lyon, CNRS UMR 5510, 21 Avenue Jean Capelle, F-69621 Villeurbanne Cedex, France
a r t i c l e i n f o
Article history:
Received 3 October 2016
Revised 16 January 2017
Available online 20 February 2017
Keywords:
Stress corrosion cracking
Crack propagation
Phase field
Digital image correlation
Slip dissolution
Crack coalescence
Complex crack networks
a b s t r a c t
Stress Corrosion Cracking (SCC) is a very common failure mechanism characterized by a slow, environ-
mentally influenced crack propagation in structural components. The mechanisms proposed to explain,
at the microscopic scale, the cracking propagation processes are not able to elucidate all aspects of this
phenomenon in different metal/environment systems. This work is concerned with the development of
a new multiphysics model for understanding the phenomena of crack propagation under the effect of
SCC. This new model is based upon: (i) a phase field method, based on a variational formulation of brit-
tle fracture with regularized approximation of discontinuities; (ii) a robust algorithm capable to prescribe
the displacements (over the boundary of a small sub-volume) and crack onset obtained by image process-
ing based on digital image correlation in the sample during the numerical simulations; (iii) a coupling
with a diffusion model informed with first-principles computations of diffusion coefficient. In this new
model, the phenomenon of environmentally assisted cracking phenomena was successfully represented
as well the interactions between cracks and the subsequent shielding effects. The analyses, performed on
several samples of Inconel 600 alloy containing a crack network, show a remarkable agreement between
the crack morphology and history obtained by the model and by the experiments.
© 2017 Elsevier Ltd. All rights reserved.
1. Introduction
Predicting the strength and durability of engineering compo-
nents and structures using numerical simulations of fracture phe-
nomena induced by Stress Corrosion Cracking (SCC) is a very
challenging problem. SCC can often be regarded as the result of lo-
calized oxidation enhanced by stress/strain: a combined action of a
sustained mechanical loading and a chemically aggressive environ-
ment. The occurrence of SCC in a structure can lead to catastrophic
failures, it has thus long been recognized as potentially danger-
ous. One of the mechanisms responsible for this process noted in
the literature is the embrittlement of the material due to local an-
odic dissolution of fresh metal created by slip band emergence at
the crack tip. In this area recent developments and correspond-
ing issues have been reviewed in Newman and Healey (2007) , fol-
lowed by some original contributions related to different aspects of
the problem: loading rate effects, harmonization of different for-
mulations of the model, and sensitivity of the model to various
∗ Corresponding author. Present address: Research Institute in Civil and Mechan-
ical Engineering (GeM), CNRS UMR 6183 CNRS, Ecole Centrale de Nantes, Université
de Nantes, France.
E-mail address: [email protected] (J. Réthoré).
parameters. Developing numerical models for the quantitative
evaluation of stress corrosion cracking growth rates in terms of key
engineering parameters is highly required.
Various experimental methods have been proposed in the liter-
ature to study cracks induced by SCC. The measurements of cor-
rosion contribution is usually based on electrochemical methods
such as Electrochemical Noise (EN) ( Hladky and Dawson, 1981 ;
Kearns, 1996 ; Kovac et al., 2010 ). Due to its capacity of distin-
guishing between different corrosion types, the (EN) method is
mostly applied to detect and evaluate SCC activity. Acoustic Emis-
sion (AE) ( Bellenger et al., 2002; Jomdecha et al., 2007; Shaikh
et al., 2007 ) is also widely used because of its ability to detect ma-
terial deformation, cracking and fracture. Many microscopy tech-
niques have been applied to characterize SCC at different scales.
For example, magnetic force microscopy (MFM) has been used to
detect the chromium depleted regions of type 304 stainless steel
( Takaya et al., 2004 ), the early stages of pitting and localized cor-
rosion have been studied by combining in situ observations and
electromechanical atomic force microscopy (EAFM) ( Williford et al.,
20 0 0 ), and scanning electron microscopy (SEM) is used to study
the pitting corrosion of Al ( Richardson and Wood, 1970 ). This tech-
nique is also used to observe the fracture surface of SCC in high
http://dx.doi.org/10.1016/j.ijsolstr.2017.02.019
0020-7683/© 2017 Elsevier Ltd. All rights reserved.
Cette thèse est accessible à l'adresse : http://theses.insa-lyon.fr/publication/2017LYSEI059/these.pdf © [J. Bolivar], [2017], INSA Lyon, tous droits réservés

66 T.-T. Nguyen et al. / International Journal of Solids and Structures 112 (2017) 65–82
strength steel fasteners ( Abhay et al., 2010 ). The Diffraction Con-
trast Tomography (DCT) is another technique used to character-
ize SCC, for example the work of King et al. (2008) study the
interaction between intergranular stress corrosion cracking and mi-
crostructure in a Grain-Mapped Polycrystal. In the work of Babout
et al. (2006) , the phenomenon of intergranular stress corrosion
cracking in a sensitized type 302 stainless steel wire has been ob-
served in situ using high resolution X-ray microtomography. An im-
portant step after image acquisition by OM/SEM is the process-
ing of microstructural images to obtain a qualitative/quantitative
analysis of the sample. Many techniques have been developed in
the literature with this aim. Among these techniques, digital im-
age correlation (DIC), or digital volume correlation (DVC) in 3D,
is one of the most efficient and versatile tool. This procedure is
based on the comparison of images acquired at different stages of
a mechanical test and provides quantitative descriptions of local
deformation. DIC could be used instead of, or in addition to the
prevailing methods to detect defects, by observing the singularity
due to the change in the strain distribution, or a step jump in the
displacement field across the cracks.
In the literature, most of the models proposed to predict SCC
rates are based on linear elastic fracture mechanics concepts
without deeply considering corrosion kinetics. A numerical sim-
ulation scheme of SCC is developed in the work of Choi et al.
(2007) for a thermoplastic material based on crack layer theory.
SCC is here considered as a superposition of creep, it induces aging
and chemical degradation. Then, they use the phenomenological
power laws to describe the loss of material toughness due to
these two mechanisms. In addition, this work proposed a generic
kinetic parameter to represent the rate of chemical corrosion.
Both SCC and mechanically driven crack growth were simulated.
In the work of Saito and Kuniya (2001) , a predictive methodology
for SCC crack growth using a mechanochemical model based
on a slip formation/dissolution mechanism is presented. The
mechanochemical model consists of the combined kinetics of the
plastic deformation process as a mechanical factor and the slip
dissolution–repassivation process as an environmental factor at
the crack tip. The role of the passive film has also been studied
in many works, its physical degradation is usually expressed by
a unique parameter namely the “crack tip strain rate”. Many
works in literature use this concept that is applied to study SCC
in many cases, such as those by Vermilyea (1972) , Vermilya and
Diegle (1976) , Parkins (1980, 1987) , Ford and Andresen (1987) , ....
However, the results of these models are rarely compared with
experimental ones, especially concerning crack morphology.
With recent advances in numerical simulation methods new
studies are now possible, allowing the development of fracture
models at microscale, in particular for complex cracks morphol-
ogy including phenomena of crack initiation, coalescence and
propagation. The objective of this proposed paper is to construct
a numerical model to simulate the failure of a nickel base al-
loy under SCC in an acidified tetrathionate environment. The
reaction–dissolution process is simulated with a kinetics model,
and integrated into a mechanical analysis. The anodic dissolution,
that is involved in the decrease of fracture property is considered
to be dependent on the extent of corrosion, and such dependence
is implemented within a fracture model. For this purpose, we use
the phase field method based on the variational formulation of
the crack evolution problem due to Francfort and Marigo (1998) .
The regularized setting of their framework has been considered
in Bourdin et al. (20 0 0) . Another contribution for the phase field
method based on LandauGinzburg type phase-field evolution
equations can be found in Karma et al. (2001) . The phase field
method may be approached both theoretically and practically,
providing an excellent framework for taking into account envi-
ronmental effects on the failure phenomenon. This framework is
also extremely suitable for establishing parametric trends besides
enabling the assessment of safety margins. This work is concerned
with the development of a new multiphysics model for simulating
the phenomena of crack propagation under the effect of SCC based
on the phase field method and the numerical implementation
proposed by Miehe et al. (2010) . Direct comparisons between the
simulationed crack paths and experimental data are performed. In
addition, a strategy is proposed to identify the parameters of the
constitutive model by using DIC results.
The overview of the paper is as follows. A brief introduc-
tion of experimental methods is described in Section 2 . Then, we
present a short review about the slip dissolution model for SCC in
Section 3 . The new model proposed for SCC propagation based on
the phase field method is presented in Section 4 . The proposed al-
gorithm is described in Section 5 . Finally, the method is evaluated
and illustrated by damage benchmarks and practical examples in-
volving crack onset and propagation provided by SCC, and then we
present the direct comparisons between the model and the exper-
iments in Section 6 .
2. Experimental method for observation of crack propagation
2.1. Experimental procedures
This study focuses on Inconel 600 alloy material. Its chemi-
cal composition is given in Table 1 . The presented experiments
were performed on specimens with a gauge dimension of 117 mm
length, 8 mm width and 2 mm thickness as depicted in Fig. 1 (a).
(see Bolivar et al., 2016 for more details of sample preparation)
To use DIC, a specific procedure has been proposed to improve
the grey level contrast on the sample surface. Finally, the samples
exhibit many random heterogeneities that give local contrast of
grey levels in the images, what is promising for DIC. The details
of experimental setup has been described in Bolivar et al. (2016)
Constant load tests were performed for this study. First, the
samples are immersed in the test solution (10 mM K 2 S 4 O 6 , pH
= 3) for about 45 min. Then, the specimens are subjected to a
constant applied load corresponding to 80% of the yield stress
(263 MPa) by using an electromechanical tensile machine (LLOYD
LR30K Plus).
The sample surface was observed in-situ through a 2/3” CCD
Stingray camera of 5 Mpx with a pixel size of 3.45 μm (see
Fig. 1 (b)). The camera was coupled with a 1X telecentric lens. The
surface was enlighted with a led lamp in order to eliminate the
light variation on the surface. Two polarizing filters (linear and cir-
cular) were also used in order to avoid light reflection.
The test is stopped when crack colonies are observed and the
electric potential is stable (around −195 mv/SCE). Finally, we use
either Optical Microscopy (OM) or Scanning Electron Microscopy
(SEM) to observe the cracked surfaces, this step will be used to
validate the results of crack detection by DIC.
2.2. Detection of crack network by using image processing based on
DIC
DIC is a full-field measurement technique, based on the com-
parison of images acquired at different stages of a mechanical test.
DIC provides access the displacement field at the surface of the
sample. DIC principles have been introduced in experimental solid
mechanics more than 20 years ago by Sutton et al. (1983) and this
technique is currently used for many applications.
We refer to Sutton et al. (2009) for a detailed description of
this technique. The specific 2D-DIC procedure used in this work is
similar to the one used in Besnard et al. (2006) .
The DIC analysis is performed using the in-house software. The
procedure is based on four main steps:
Cette thèse est accessible à l'adresse : http://theses.insa-lyon.fr/publication/2017LYSEI059/these.pdf © [J. Bolivar], [2017], INSA Lyon, tous droits réservés

T.-T. Nguyen et al. / International Journal of Solids and Structures 112 (2017) 65–82 67
Table 1
Composition of the Inconel 600 alloy.
Elements Ni Fe Cr Mn Cu Co Ti-Al C S
Wt. Pct. Bal. 9 .25 15 .52 0 .12 0 .1 0 .1 0 .25 0 .03 0 .002
Fig. 1. Description of experimental procedures: (a) geometry of specimen and counter electrode and (b) schematic illustration of experimental set-up.
Fig. 2. Crack detection by using image processing based on DIC: (a) displacement field; (b) Postprocessed displacement fields; and (c) crack paths obtained by segmentation.
• DIC analysis: the correlation analysis is performed. We use here
a mesh size of 16 pixels (55 μm). After this step, we ob-
tain the displacement fields for series of deformed images (see
Fig. 2 (a)).
• Postprocessing displacement fields: crack detection by using
only displacement field is not straightforward see Fig. 2 (a). A
method has been proposed to reduce the noise and increase the
contrast due to displacement jumps. This method is based on
the removal of Rigid Body Movement (RBM) and the displace-
ment due to the overall homogeneous strain. A median filter is
subsequently applied to the resulting displacement to remove
the fluctuation that doesn’t have a discontinuity feature. Then,
the element-wise displacement variations in the loading direc-
tion are calculated. The obtained result is depicted in Fig. 2 (b)
• Crack extraction: a segmentation procedure is performed to ex-
tract the cracked area from the post-processed displacement
field. In this example, we perform the extraction of cracks by
using the classical threshold criterion for the post-processed
displacement field (threshold value 0.45 μm). The obtained re-
sult is depicted in Fig. 2 (c).
• Parameters identifications: Finally, cracks are labeled and fol-
lowed during the image sequence. We also identify several frac-
ture parameters such as: crack length, crack growth rate, crack
initiation... (see Bolivar et al., 2016 for more details).
In this work, DIC crack extraction results will be compared with
those of the numerical simulation. For this purpose, an algorithm
is proposed to construct input modeling from these data, this pro-
cedure will be introduced in Section 6.2.1 .
3. Slip dissolution model for stress corrosion cracking
One of the models that successfully rationalizes the phe-
nomenology and the kinetics of stress-corrosion cracking (SCC) in
this situation, is the slip dissolution model (also called the film
rupture or slip-oxidation model). In this model, the propagation of
cracks is mainly due to the rupture of a passive film at the crack
tip. In the initial state, the passive film forms over the crack faces
and at the crack tip. SCC results from the dynamic synergy be-
tween passive film formation, crack tip strain rate, depassivation,
repassivation.... The slip dissolution model postulates that the rup-
ture of passive film at the crack tip is due to the local dynamic
plastic strain; this process allows the dissolution of metal in this
region and provides the advance of cracks. The main ideas of this
model are illustrated in Figs. 3 and 4 . Crack velocity in this case
is directly related to the rate of metal dissolution. However, this
assumption leads to consider another aspect that is repassivation
of the crack faces. The works of Scully (1971 , 1972 , 1980) proposed
that crack propagation can only be observed when re-passivation
rate and crack tip strain rate are close.
The slip dissolution model can be divided into three steps: (S1)
the crack tip is covered by the passive film and the loading is ap-
plied; (S2) the rupture of the passive film occurs when the strain
rate reaches a threshold value, then metal dissolution at the crack
tip takes place and crack propagation occurs; (S3) the passive film
is reformed. The detail of these steps are illustrated in Fig. 3
Four main “postulates” can be enhanced and re-inserted in the
model that will be developed in this work. (i) the strain rate can be
considered as the rate-limiting step of SCC in this system due to the
Cette thèse est accessible à l'adresse : http://theses.insa-lyon.fr/publication/2017LYSEI059/these.pdf © [J. Bolivar], [2017], INSA Lyon, tous droits réservés

68 T.-T. Nguyen et al. / International Journal of Solids and Structures 112 (2017) 65–82
Fig. 3. Three steps of crack propagation in the slip dissolution model provided by stress corrosion cracking by anodic dissolution.
Fig. 4. Description of chemi-mechanical phenomena of stress corrosion cracking by slip dissolution at crack tip.
rupture of the passive film at the crack tip ( P1 ). At higher strain rate,
the time available for corrosion process to develop is too short and
the ductile fracture remains predominant. At lower strain rate, the
passive film at crack tip does not fail and dissolution of the metal
at the crack tip is inhibited. So, ductile failure due to insufficient
corrosion is observed.
At a smaller scale, SCC is related to the micro-structure of the
material as dissolution occurs preferentially within specific fea-
tures, for example along the grain boundaries (see Figs. 3 and 4 ).
Because they are areas of high energy, many impurities segregate
to them, and they are a preferential site for precipitation of car-
bides. However, in this work, the macroscopic scale (the scale of
the homogeneous material) is used. Hence, (ii) only the SCC at the
crack tip will be considered ( P2 ).
On the other hand, the experimental observations show that,
SCC cracks present a ratio between crack length and crack open-
ing that can be found within the range 100–1000, sometime above
10 0 0. This result means that, when the crack propagates, the crack
faces are expected to show neither corrosion nor plastic deforma-
tion. Moreover, we observe no stress appearing in these regions
(crack faces), whereas a high-stress concentration is found at the
crack tip. Thus, (iii) the environment is in contact with a material
over a short distance close to the crack tip ( P3 ).
In addition, one has to make a difference between material
points along the crack front that are located on the specimen sur-
face (in direct contact with the solution) or in the bulk material.
It provides (iv) the different influences of SCC on the crack tip with
respect to the depth ( P4 ). This aspect has to be accounted for in the
model.
Simulation of slip dissolution induced SCC is an open question
in the literature. The mechanical properties of the passive films
forming on the specimen surface are difficult to obtain. Therefore
the simulation of film rupture is not possible. In this work, we pro-
pose a new way to model our four principal points (P1, P2, P3 and
P4) of SCC processes, in which corrosion occurs when the dynamic
at crack tip (called activated crack) satisfies a condition related to
strain rate (introduced in the next section). SCC provides here the
removal of material, so the control volume just ahead of crack tip
is softening. Consequently, crack propagation occurs at a stress in-
tensity factor K ISCC below the fracture toughness K IC or at a stress
σSCC below the ultimate tensile stress σ C .
4. Modeling
4.1. Description of film rupture phenomena by using diffusion of
degradation
In this section, we propose a model to describe the influence
of film rupture on the fracture problem. As discussed above, the
major impact of slip dissolution is the change of the material be-
havior. In more details, material embrittlement occurs and reduces
the resistance of material. To introduce these phenomena in the
modeling, we use here a diffusion model to describe the evolution
of the softening of material around the crack tip.
In the activated crack, i.e. when the crack tip strain rate is
higher than a critical value, the passive film fails. Then, with the
presence of chemical products and SCC conditions in this region,
the dissolution of the material occurs. However, modeling these
phenomena by using numerical simulations is not straightforward,
so we use here another way: the dissolution of material is replaced
by the diffusing degradation c . In addition, the criterion of strain
rate ˙ ε (see P1 ) is replaced by the crack propagation rate ˙ d because
the definition of strain at the crack tip is a difficult question.
Cette thèse est accessible à l'adresse : http://theses.insa-lyon.fr/publication/2017LYSEI059/these.pdf © [J. Bolivar], [2017], INSA Lyon, tous droits réservés

T.-T. Nguyen et al. / International Journal of Solids and Structures 112 (2017) 65–82 69
Fig. 5. Description of the influence of slip dissolution on fracture mechanics by using an equivalent model based on diffusion of degradation.
Fig. 6. Slip dissolution phenomena at crack tip: distribution of diffusing degradation for the case of structure containing a semi elliptical crack.
The main idea of the proposed model is depicted in Fig. 5 .
We describe here the equivalent meaning of the two models that
yields a pronounced softening behavior of material at the crack tip
(due to the slip dissolution or the appearing of “micro-cracks”).
The distribution of the diffusing degradation is described by us-
ing the Fick’s laws of diffusion. The first law states that the dif-
fusing degradation flux q is proportional to the diffusing concen-
tration gradient. q represents the source of SCC (slip dissolution
in the crack tip) that induces the propagation of “micro-cracks” or
material degradation. In mathematical terms this can be expressed
as:
q = −D (x ) ∇c (1)
where D ( x ) is the diffusion coefficient and ∇ is the gradient oper-
ator.
Fick’s second law relates the diffusing flux q at a given point to
its degradation rate by means of the equation
∂c
∂t = −∇q (2)
We apply this principle only for activated crack tips (see P2,3 ),
i.e. we impose c = 1 at the crack tip by using Dirichlet boundary
conditions and then the diffusion problem is solved for the whole
sample. Note that the crack tips are updated for each time steps
corresponding to crack propagation.
Following ( P4 ), the influence of film rupture phenomena in the
surface and within the volume are different, that provides the ten-
dency of crack propagation preferentially on the surface. To model
this effect, we use here an in-homogeneous diffusion coefficient,
i.e depending on the depth. We present an example of a structure
containing a semi elliptical crack (see Fig. 6 ) subjected to SCC. The
degradation coefficient is taken D (x ) = D 0 in the surface, and D ( x )
is a monotonically increasing function of depth ( x in this case).
From these properties, we can construct a simple solution for this
example: {D (x ) = D 0 ∀ x ∈ ∂�x =0
D (x ) = D 0
(B −x
B
)m ∀ x ∈ �/∂�x =0
(3)
Where the coefficient m ≥ 2
For an in-homogeneous isotropic medium, ( D ( x ) depends only
on the position x ) the diffusion equation is rewritten as
∂c
∂t = D (x ) � c +
3 ∑
i =1
∂ D (x )
∂x i
∂c
∂x i (4)
For more complex sample geometries, a levelset function (the
distance to the surface in contact with the aggressive medium) is
used to compute the value of D at any point inside the sample. To
model macroscopic material embrittlement, the fracture toughness
g c directly depends on the diffusing degradation. The increasing of
c induces the decreasing of g c . However, when full diffusing degra-
dation occurs ( c = 1 ), the material is still resistant, thus g c should
not vanish for c = 1 . We define the relation between g c and c by
the following expression:
g c =
[(1 − k c ) ( 1 − c )
n + k c ].g 0 c (5)
An example of this typical function is depicted in Fig. 7 , for sev-
eral values of n = 2 , 3 , 6 . We use here k c = 10% , i.e for c = 1 , 10%
of the material resistance remains.
Cette thèse est accessible à l'adresse : http://theses.insa-lyon.fr/publication/2017LYSEI059/these.pdf © [J. Bolivar], [2017], INSA Lyon, tous droits réservés

70 T.-T. Nguyen et al. / International Journal of Solids and Structures 112 (2017) 65–82
Fig. 7. Influence of diffusing degradation on the fracture toughness.
4.2. Phase field modeling of stress corrosion cracking
In the following, the basic concepts of the phase field method
are briefly summarized. For more details and practical implemen-
tation aspects, the interested reader may refer to Miehe et al.
(2010) and Nguyen et al. (2015) . The phase field method is based
on a regularized formulation of a sharp crack description. A regu-
larized variational principle describing both the evolution of the
mechanical problem and of an additional field d describing the
damage (called phase field), is discretized by a finite element pro-
cedure and a staggered algorithm. The method alleviates the short-
comings of re-meshing crack geometry by using a fixed mesh and a
regularized description of the discontinuities. In addition, crack ini-
tiation can be modeled in a straightforward manner. In contrast to
volume damage models, usually implemented in non-linear codes,
such regularized approach is directly connected to the brittle fail-
ure theory of crack propagation. In the present work, the phase
field method has been implemented in a house-made code both in
2D and 3D.
In the phase field method, assuming small strains, the regu-
larized form of the energy describing the cracked structure is ex-
pressed by:
E(u , d) =
∫ �
W u ( ε (u ) , d ) d � +
∫ �
g c (x , τ ) γ (d, ∇d) d�, (6)
where ε is the linearized strain tensor, W u is the elastic strain
energy density, depending on the displacements u ( x ) and on the
phase field d ( x ) describing the damage of the solid. g c is a func-
tion of the fracture toughness at initial state g 0 c and the diffusing
degradation c . Note that, the irreversibility condition is applied for
the fracture toughness, by the following expression:
g c (x , t) = min
τ∈ [ 0 ,t ]
{g c
(g 0 c , c(x , τ )
)}. (7)
For the sake of simplicity, we write g c = g c (x , τ ) . In (6) , γ ( d ,
∇d ) is the crack density function per unit volume (see e.g. Miehe
et al., 2010; Nguyen et al., 2015 ), defined by:
γ (d , ∇d ) =
1
2 l d 2 +
l
2
∇d · ∇d , (8)
where l is the regularization parameter. l can be considered as a
pure numerical parameter of the regularized model of brittle frac-
ture or seen as a real material parameter for a gradient damage
model. In the first case, it is recommended to take l as small as
possible to better approximate brittle fracture, with regards to the
size of the mesh. In the second case, l should be identified from
experimental data. Such analysis with experimental validations has
been recently published in Nguyen et al. (2016) . It is demonstrated
that this kind of regularized model converge to the brittle failure
theory when l vanishes. In the case considered herein when g c is
heterogeneous, this convergence is maintained if l is smaller than
the shortest wave length of the g c field. It will checked latter on
that this condition is satisfied and thus that the ability of the phase
field model to approximate brittle failure is effective.
The total energy is then rewritten as E =
∫ � W d� with
W = W u ( ε (u ) , d) + g c γ (d, ∇d) (9)
The unilateral contact formulation following the work of Miehe
et al. (2010) is chosen to ensure damage induced by traction only,
(assuming isotropic elastic behavior of the body) through:
W u ( u , d ) = �+ ( ε (u ) ) { g(d) + k } + �−( ε (u ) ) . (10)
With
�+ ( ε ) =
λ
2
(〈 T r( ε ) 〉 + )2 + μT r
{ (ε
+ )2 }
, (11)
�−( ε ) =
λ
2
(〈 T r( ε ) 〉 −)2 + μT r
{ (ε
−)2 }
, (12)
where ε + and ε − are the extensive and compressive modes of
strain field ε = ε + + ε −. In (11) and (12) 〈 x 〉 + = ( x + | x | ) / 2 and
〈 x 〉 − = ( x − | x | ) / 2 . The degradation function g ( d ) in Eq. (10) is as-
sumed to have the simple form:
g(d) = (1 − d) 2 + k. (13)
The function g ( d ) has been chosen such that g ′ (1) = 0 to guar-
antee that the strain energy density function takes a finite value as
the domain is locally cracked (see e.g. Braides, 1998 ) and g(0) = 1
to guarantee that the material is initially undamaged. g(1) = 0 is
the limit for fully damaged material. The small parameter k < < 1
is introduced to maintain the well-posedness of the system for par-
tially broken parts of the domain ( Miehe et al., 2010 ).
In the following, a crack phase field evolution law is derived
that can guarantee the irreversibility of the process. Assuming
isothermal processes, without external micro forces, the reduced
form of the Clausius–Duhem inequality is written as (see Nguyen
et al., 2015 for more details):
A
˙ d ≥ 0 , (14)
where A = − δW
δd = − ∂W
∂d + ∇ .
(∂W
∂∇d
)is the variational derivative of
W with respect to the phase field d . At this stage, a threshold func-
tion F (A ) such that
F (A ) ≤ 0 (15)
is introduced. Assuming the principle of maximum dissipation
then requires the dissipation A
˙ d to be maximum under the con-
straint (15) . Using the method of Lagrange multipliers and the fol-
lowing Lagrangian:
L = −A
˙ d + λF (A ) , (16)
yields the Kuhn–Tucker equations:
∂L
∂A
= 0 , λ ≥ 0 , F ≤ 0 , λF = 0 . (17)
The first equality in (17) gives:
˙ d = λ∂F (A )
∂A
. (18)
Without loss of generality, the threshold function F (A ) is as-
sumed in the form F (A ) = A . From (18) and using the second in-
equality in (17) , we obtain:
˙ d = λ ≥ 0 (19)
For ˙ d > 0 , and from (14), (19) and the third equality in (17) ,
which give F = 0 , implying:
F = −δW
δd = −∂W u ( u , d )
∂d − g c δγ (d , ∇d ) = 0 . (20)
With (see e.g. Miehe et al., 2010 ):
δγ (d , ∇d ) =
d
l − l�d (21)
Cette thèse est accessible à l'adresse : http://theses.insa-lyon.fr/publication/2017LYSEI059/these.pdf © [J. Bolivar], [2017], INSA Lyon, tous droits réservés

T.-T. Nguyen et al. / International Journal of Solids and Structures 112 (2017) 65–82 71
From (10), (13) and (20) we obtain
2(1 − d)�+ − g c δγ (d , ∇d ) = 0 (22)
that is the evolution law for the phase field d . As 2(1 − d)�+ ≥ 0 ,
then
δγ (d , ∇d ) ≥ 0 . (23)
We can thus check that due to (23) , the variation of crack
length:
˙ �l =
∫ �
δγ (d , ∇d ) ˙ d d � ≥ 0 , (24)
satisfying irreversible evolution of cracks.
The strain energy density function H(t) is introduced to de-
scribe a dependence on history ( Miehe et al., 2010 ) and to make
possible loading-unloading. In this work, this function can be de-
fined by the following:
H(x , t) = max τ∈ [ 0 ,t ]
{l
g c �+ ( x , τ )
}, (25)
which is substituted to �+ in (22) and using (21) it yields the fol-
lowing phase field problem to be solved to evaluate the field d ( x ,
t ) at time t : ⎧ ⎨
⎩
2(1 − d) H −{
d − l 2 �d }
= 0 in �,
d(x ) = 1 on �,
∇d(x ) · n = 0 on ∂�,
(26)
5. Numerical formulation and algorithm
5.1. Diffusion problem
The strong form defined in (2) can be expressed as:
∂c
∂t +
∂q i ∂x i
= 0 (27)
where q i represents the components of the flux vector expressed
in an orthonormal basis with coordinates x i . The corresponding
boundary conditions are given by ⎧ ⎨
⎩
c(x ) = c with x ∈ ∂�1
q i (x ) = q i with x ∈ ∂�2
∂ �1 ∪ ∂ �2 = ∂ � and ∂ �1 ∩ ∂ �2 = ∅ (28)
Multiplying the strong form by a test function δc and integrat-
ing over �, we obtain: ∫ �
{δc
∂c
∂t + δc
∂q i ∂x i
}d� = 0 . (29)
where δc satisfy: ∫ �
∂δc
∂x i d� < ∞ and δc = 0 on ∂�1 (30)
Using the integral by parts and the divergence theorem, we fi-
nally obtain: ∫ �
{δc
∂c
∂t − ∂δc
∂x i q i
}d� +
∫ ∂�
δcq i n i dS = 0 . (31)
5.2. Phase field problem
Starting from (26) 1 , multiplying by a test function δd and inte-
grating over �, we obtain: ∫ �
{2(1 − d) Hδd −
(d − l 2 �d
)δd
}d� = 0 . (32)
Using the property:
(�d ) δd = ∇ · ( ∇d δd ) − ∇d · ∇(δd) (33)
and the divergence theorem, Eq. (32) is rewritten as: ∫ �
{ 2(1 − d) H − d } δd −∫ �
l 2 ∇d · ∇(δd ) d �
+
∫ ∂�
l 2 ∇d · n δd d� = 0 (34)
Using ( 26 3 ), we finally obtain: ∫ �
{( 2 H + 1 ) dδd + l 2 ∇d · ∇(δd)
}d� =
∫ �
2 Hδdd�. (35)
In the present work, the computations are performed in quasi-
static conditions. Then, the time steps introduced in the follow-
ing actually refer to load increments. Introducing a time stepping,
the problem to be solved at time t n +1 is expressed by seeking
d(x ) ∈ S d , such that: ∫ �
{( 2 H n + 1 ) d n +1 δd + l 2 ∇d n +1 · ∇(δd)
}d� =
∫ �
2 H n δdd�.
∀ δd(x ) ∈ H
1 0 (�) . (36)
where H n = H(u n ) and the fracture toughness g c n are computed
from the previous time step (load increment) by: {g c n (x ) = g c n
(g 0 c , c n (x )
)if g c n (x ) ≤ g c n −1
(x ) ,
g c n (x ) = g c n −1
(g 0 c , c n (x )
)if g c n (x ) > g c n −1
(x ) . (37)
and {
H n (x ) =
l g c n
�+ n (x ) if �+
n (x ) > �+ n −1
(x ) ,
H n (x ) =
l g c n
�+ n −1
(x ) if �+ n (x ) ≤ �+
n −1 (x ) .
(38)
Note that Eqs. (38) and (37) are the algorithmic counterpart of
Eqs. (25) and (7) .
5.3. Displacement problem
The weak form associated with the displacement problem is
found by solving the variational problem:
u (x ) = Arg −{
inf u ∈S u
(E(u , d) − W
ext )}
(39)
where S u =
{u | u (x ) = u on ∂�u , u ∈ H
1 (�) }
and W
ext =
∫ � f ·
u d� +
∫ ∂�F
F · u d� with f and F body forces and prescribed trac-
tion over the boundary ∂�F . We obtain the classical weak form for
u (x ) ∈ S u : ∫ �
σ : ε (δu ) d� =
∫ �
f · δu d� +
∫ ∂�F
F · δu d� ∀ δu ∈ H
1 0 (�) ,
(40)
where the second-order Cauchy stress tensor σ =
∂W u ∂ ε
is given us-
ing (10) and (13) , by:
σ =
((1 − d) 2 + k
){λ〈 T r ε 〉 + 1 + 2 με
+ } + λ〈 T r ε 〉 −1 + 2 με
−.
(41)
5.4. Crack onset by using experimental data
Using the experimental procedures introduced in Section 2 , we
present here a typical result in Fig. 8 , six steps are depicted. We
recognize the crack onset at different points in the sample surface.
Faults of micro-structure lead to stress concentrations in the sur-
rounding region, in which the passive film fails and provides new
crack nucleation sites. Then, crack merging is observed, and finally
Cette thèse est accessible à l'adresse : http://theses.insa-lyon.fr/publication/2017LYSEI059/these.pdf © [J. Bolivar], [2017], INSA Lyon, tous droits réservés

72 T.-T. Nguyen et al. / International Journal of Solids and Structures 112 (2017) 65–82
Fig. 8. Crack extraction by using DIC: crack propagation for several loading steps.
Fig. 9. Crack onset by using result of DIC for three different loading steps: (a) first loading step; (b) second loading step; and (c) third loading step. (For interpretation of
the references to color in this figure, the reader is referred to the web version of this article).
a continuous crack network is created, the coalescence process be-
comes an essential characteristics.
In this work, we study the fracture phenomena at meso scale.
The sources (for example: the fault of micro-structure) of these
phenomena come from smaller scales. With our experimental
setup, we do not have the access to micro-structural details. This
lack provides the difficulties to model the initiation of cracks, also
the complex trajectory of crack propagation. A solution has been
proposed to treat this problem: crack initiation is assumed follow-
ing experimental crack detection obtained using DIC analysis (see
Section 2.2 ). This solution is suitable for the main objective of this
work: studying crack interaction phenomena.
The main idea of the method is the following: at a loading step
n , experimental results are used to initiate cracks. Then, cracks
are free to propagate by themselves. We present here an exam-
ple in Fig. 9 . At loading step 1, the structure is subjected to a pre-
scribed displacement U 1 . This time step shows a crack (black color)
and two crack onsets, which are depicted by two blue squares in
Fig. 9 (a). At step 2, with a new loading (prescribed displacement
U 2 ), the previously considered cracks (those of step 1) propagate
and two crack onsets occur, see Fig. 9 (b). Note that, this process
is intrinsically modeled by the fracture model. We only prescribe
the initiation of four new crack onsets (red square) by using ex-
perimental data. Similarly at step 3, the structure is subjected to
new prescribed displacements U 3 , we observe the propagation of
cracks, and we also add two new crack onsets following experi-
mental results (green square). This typical simulation gives us the
evolution of cracks under loading. This result is used to study the
interaction of cracks and to compare with experiments at a chosen
loading.
The initial crack can be modeled as either a discrete crack in
the geometry or as an induced crack in the phase-field. However,
the crack initiation is promoted by a micro-structurally induced
stress concentration. When crack initiation is detected experi-
Cette thèse est accessible à l'adresse : http://theses.insa-lyon.fr/publication/2017LYSEI059/these.pdf © [J. Bolivar], [2017], INSA Lyon, tous droits réservés

T.-T. Nguyen et al. / International Journal of Solids and Structures 112 (2017) 65–82 73
mentally from DIC data, stress concentrations have already played
their role of crack initiation precursor. By using the discontinuous
geometry, the discrete crack always requires a period of time
(several loading steps) to induce stress concentration, and then
propagate. The propagation of cracks obtained in the simulations
is thus delayed if discrete cracks are introduced at the time when
they are detected experimentally. We propose here a solution to
treat this issue, the crack is initiated at earlier state (for example:
nucleation) by using the strain history function defined in Eq. (25) .
This method has been introduced in the work of Borden et al.
(2012) to initiate cracks. We use this method to nucleate cracks
( d = 0 . 25 , see Amor et al., 2009 ) in the numerical model before
they can be detected experimentally.
For the induced crack nucleation, an initial strain history field
is specified such that an initial crack in the phase-field is defined.
To define the initial strain-history field we let L be a line that rep-
resents the discrete crack we wish to include and DisT ( x , L ) is the
distance from x to the line L . The strain history field is then defined
as:
H 0 (x ) =
{d 0
2(1 −d 0 )
(1 − DisT (x ,L )
l
)for DisT (x , L ) ≤ l
0 for DisT (x , L ) > l (42)
where d 0 is the initial prescribed value of the phase field. We can
use this principle to initiate cracks anywhere in the domain with-
out reference to the mesh. This method proves highly advanta-
geous in specifying complex surface cracks in 3D bodies. We also
set the intial state of crack by defining a corresponding value for
d 0 which is here set to the crack nucleation threshold, i.e d 0 =
0 . 25 . Crack nucleation introduces stress concentration, providing a
source to crack onset later. This mechanism is similar to stress con-
centrations induced by the fault in micro-structure.
However, this method requires a new parameter, that is the de-
lay between the time to nucleate cracks and the time when they
are detected from DIC data. We define �t as the delay between
crack nucleation and crack onset (observed by DIC). This parame-
ter will be determined by using inverse analyzes (introduced in the
next section). Moreover, in order to account for experimental ob-
servations ( rupture of passive films at a region in the surface provides
the stress concentration and then crack nucleation ), cracks are nuclu-
ated within an finite element in the surface, and we immediately
activate SCC by means of the diffusing degradation i.e. prescribing
c = 1 at the surface nodes of this element.
5.5. Algorithm
The overall algorithm, involving the coupled SCC – damage me-
chanics model, is described as follows:
Initialization : Initialize the displacement field u 0 ( x ), the phase
field d 0 ( x ), and the degradation field c 0 ( x ).
FOR all loading increments (pseudo time t n +1 ):
Given u n ( x ), d n ( x ) and c n ( x ):
1. Compute phase field d n +1 (x )
1.1 Update fracture toughness g c ( x , τ ) from (5) and (7)
1.2 Nucleate cracks from experimental data following
Section 5.4
1.3 Solve the phase field problem (36)
2. Compute diffusing degradation field c n +1 (x )
2.1 Update the crack tips
2.2 Check crack propagation rate
if ˙ d ≥ d c at the crack tips
Solve the diffusion problem (31)
end
3. Compute displacement field u n +1 (x )
3.1 Update the elastic parameters:
E (x ) = g(d(x ) , k ) E 0 and ν(x ) = g(d(x ) , k ) ν0
3.2 Solve the displacement problem (40)
4. (. ) n ← − (. ) n +1 and go to (1).
END
In this algorithm, the overall coupled problem is solved in a
staggered manner. This is made possible by the use of the history
function in the phase field problem. This strategy avoids iterating
between the displacement and the phase field problems but the
load increment has to be small enought to ensure converge of in
the space-time domain.
6. Results and discussion
6.1. Benchmark test of a structure containing a semi elliptical crack
The main purpose of this first example is to consider the in-
fluence of SCC on fracture mechanics. For this aim, we consider
the benchmark problem of the propagation of a semi elliptical
crack. A domain whose edge lengths are L × B × H = 1 . 0 × 0 . 4 ×
Fig. 10. Tensile test of a structure containing a semi elliptical crack: (a) geometry and boundary conditions; (b) surface view of FEM mesh; and (c) mesh view of process
zone.
Cette thèse est accessible à l'adresse : http://theses.insa-lyon.fr/publication/2017LYSEI059/these.pdf © [J. Bolivar], [2017], INSA Lyon, tous droits réservés

74 T.-T. Nguyen et al. / International Journal of Solids and Structures 112 (2017) 65–82
Fig. 11. Tensile test of an homogeneous sample with a semi elliptical crack: the iso surface of phase field d(x ) = 0 . 95 is plotted. Figures (a), (b) and (c) depict the cracks
onset and propagation by using the classical phase field method and correspond to U = 0 . 0031 mm, U = 0 . 0032 mm, and U = 0 . 0033 mm, respectively. Figures. (d), (e) and
(f) depict crack propagation for the model including both phases and SCC correspond to U = 0 . 002 mm, U = 0 . 0022 mm, and U = 0 . 0023 mm, respectively.
1 . 0 mm
3 contains an initial crack (semi elliptical form), as depicted
in Fig. 10 . The lower surface ( z = 0 ) of the domain is constrained
along z -directions, while the displacement along x, y -directions are
free. On the upper surface ( z = H), the uniform z−displacement U
increases with time (the displacement along x, y -directions are also
free). Due to this tensile loading, the semi elliptical crack propa-
gates.
The mesh used to model the cracked domain is refined in the
expected crack propagation zone. It involves 1,337,605 elements as
shown in Fig. 10 (b). A slice of the mesh in the plane of the semi
elliptical crack is depicted in Fig. 10 (c). The typical size of an ele-
ment in the crack propagation zone is h min ≈ 5 μm. In the rest of
the domain the typical mesh size is h max = 0 . 05 mm.
The material is supposed to be homogeneous, elastic and
isotropic with properties E = 210 GPa and ν = 0 . 3 GPa. The frac-
ture toughness is g 0 c = 100 N/m, and the length scale parameter is
chosen as l = 0 . 01 mm to satisfy the condition h min ≤ l /2. Mono-
tonic tensile displacement increments of �U = 8 . 10 −5 mm have
been prescribed as long as d < 0.9 in all elements. To ensure, the
convergence of the staggered scheme, we use �U = 1 . 10 −5 mm as
soon as d > 0.9 at one integration point.. The evolution of the crack
during the simulation is shown in Fig. 11 (a)–(c) for 3D view and
Fig. 12 (a)–(c) for a plane of investigation.
In the following, SCC will be considered through the proposed
model. The parameter for diffusion is chosen as a monotonically
increasing function of depth:
D (x ) = D 0
(B − x
B
)6
(43)
The influence of diffusing degradation on the fracture toughness
is defined by the following expression:
g c =
[(1 − k c ) ( 1 − c )
3 + k c ].g 0 c (44)
Where D 0 = 3 . 10 −3 mm
2 /s and k c = 10% . The same loading con-
dition is considered as in the case of purely mechanical phase
field model which results are presented above. SCC at the crack
tips is activated after 20 loading steps. The evolution of the crack
during the simulation is shown in Fig. 11 (d)–(f) for 3D view and
Fig. 12 (d)–(f) for a plane of investigation.
The crack evolution predicted by the two models are strongly
different (see Fig. 12 ). In the case of classical phase field model
(purely mechanical), the propagation tendency agrees with the
theory of semi-elliptic surface crack growth ( Newman and Raju,
1981; Smith and Cooper, 1989; Kikuchi and Suga, 2011 ). Depend-
ing on the ratio of crack depth to crack length, the crack first
propagates to obtain a reasonable ratio, then propagates in both
Cette thèse est accessible à l'adresse : http://theses.insa-lyon.fr/publication/2017LYSEI059/these.pdf © [J. Bolivar], [2017], INSA Lyon, tous droits réservés

T.-T. Nguyen et al. / International Journal of Solids and Structures 112 (2017) 65–82 75
Fig. 12. Crack propagation in a chosen plane ( z = 0 . 5 H). The phase field d ( x ) is plotted. Figures (a), (b) and (c) depict the cracks onset and propagation by using the classical
phase field method and correspond to U = 0 . 0031 mm, U = 0 . 0032 mm, and U = 0 . 0033 mm, respectively. Figures. (d), (e) and (f) depict crack propagation for the model
including both phases and SCC correspond to U = 0 . 002 mm, U = 0 . 0022 mm, and U = 0 . 0023 mm, respectively.
Fig. 13. Observation of SCC in a chosen plane ( z = 0 . 5 ). The diffusing degradation c ( x ) is plotted. (a), (b) and (c) depict the degradation correspond to U = 0 . 00205 mm,
U = 0 . 0021 mm, and U = 0 . 00215 mm, respectively.
Cette thèse est accessible à l'adresse : http://theses.insa-lyon.fr/publication/2017LYSEI059/these.pdf © [J. Bolivar], [2017], INSA Lyon, tous droits réservés

76 T.-T. Nguyen et al. / International Journal of Solids and Structures 112 (2017) 65–82
Fig. 14. The influence of SCC on fracture energy: distribution of g c along a line of
investigation corresponding to U = 0 . 0021 mm. We observe here the variation in
zone about of 0.15 mm above crack tip.
Fig. 15. Evolution of surface energy along a line of investigation, corresponding to
one undamaged step and three damaged steps.
Fig. 16. Comparison of stress–displacement curve for two models.
directions (depth and surface) in order to keep this ratio. In the
case when SCC is considered, we observe that the crack propagates
in the surface more than in depth. We recognize that, the propa-
gation tendency of crack in the SCC model is strongly dependent
on the diffusing direction of degradation. The evolution of the dif-
fusing degradation on a plane of observation is plotted in Fig. 13 .
Due to the expression adopted for D (see Eq. (43) ), the degradation
diffuses more along y -direction than along x -direction. This result
reproduces very well the phenomena mentioned in experiments
in the literature, that is promising for direct comparisons of cracks
morphology between experiments and numerical simulations.
As mentioned above, in this frame work, the SCC is accounted
by using a spatially varying fracture energy g c , depending on the
diffusing degradation. To see better this phenomenon, in Fig. 14 we
plot the variation of g c along a line of investigation located at the
intersection of two planes z = 0 . 5 and y = 0 . 5 . The fracture energy
reaches the minimum value g min c = k c g
0 c = 10 −5 kN/mm at crack tip
and the maximum value g min c = g 0 c = 10 −4 kN/mm away from crack
tip. The variation take place in a region about of 0.15 mm that
is much higher than the regularization parameter l = 0 . 01 mm.
This ensures that the two diffusion problems, governing the evo-
lution of c (or g c ) and d have well separate characteristic length.
Fig. 17. The iso surface of phase field d(x ) = 0 . 95 is plotted. (a), (b) and (c) depict the cracks onset and propagation by using the classical phase field method and correspond
to ε zz = 0 . 0022 , ε zz = 0 . 0025 , and ε zz = 0 . 0027 , respectively.
Cette thèse est accessible à l'adresse : http://theses.insa-lyon.fr/publication/2017LYSEI059/these.pdf © [J. Bolivar], [2017], INSA Lyon, tous droits réservés

T.-T. Nguyen et al. / International Journal of Solids and Structures 112 (2017) 65–82 77
Fig. 18. Stress–strain curve for SCC model subjected constant load test and com-
parison with classical phase field model.
Fig. 19. Main principle to define cost function of inverse analysis algorithm.
Fig. 15 plots the surface energy along the same line of investiga-
tion, for one loading step when damage has not yet occurred and
three cracked steps (depicted in Fig. 13 ). This figure allows to check
that there is no interaction between the variation of g c which is
Fig. 21. Experimental validation, first sub-volume (2 × 2.2 × 1.925 mm
3 ): (a) ge-
ometry; (b) FEM mesh.
very smooth as depicted in Fig. 14 and the phase field evolution
that is related to the distribution of dissipated energy.
The stress–displacement curves obtained for both cases are de-
picted in Fig. 16 . SCC crack propagates at a stress level below the
one observed for classical case (without SCC).
In the following, we illustrate the performance of the new
model in the case of constant load tests as usually performed ex-
perimentally to study SCC. Neumann boundary conditions are used
in this test. The same structure as in the previous example is
loaded until 80% of the critical stress, and then the load is kept
constant. Then, SCC is activated. Because of the diffusing degrada-
tion, that reduces the resistance of the material, the crack propa-
gates. The result is depicted in Fig. 17 . The stress–strain curve is
plotted in Fig. 18 . This test confirms the ability of the proposed
model to simulate experimental observations of SCC.
6.2. Experimental validation
In this section, the crack network obtained from the experi-
ments and the one predicted by the simulations will be compared.
The proposed procedure to identify some parameters of the consti-
tutive relations of the model is presented. This procedure is based
on the inverse analysis combining experiments and simulations.
6.2.1. Identification of model parameters by inverse analysis
The elastic parameters have been taken from literature (e.g.
Mills, 1981; Mills and Brown, 2001; Al-Rubaie et al., 2007 ). We
have E = 210 GPa and ν = 0 . 3 , the fracture toughness at initial
Fig. 20. Displacement of boundary for an experimental load step obtained by DIC and its Savitzky–Golay filtering.
Cette thèse est accessible à l'adresse : http://theses.insa-lyon.fr/publication/2017LYSEI059/these.pdf © [J. Bolivar], [2017], INSA Lyon, tous droits réservés

78 T.-T. Nguyen et al. / International Journal of Solids and Structures 112 (2017) 65–82
Fig. 22. Comparison between experimental crack obtained from DIC procedures and from phase field method of the Inconel 600 alloy sample in sub-volume size 2 × 2.2 ×1.925 mm
3 , (left: experiment; right: numerical simulation.).
Fig. 23. Comparison between experimental crack obtained from DIC procedures and from phase field method of the Inconel 600 alloy sample in sub-volume size 2 × 3.025
× 3.025 mm
3 , (left: experiment; right: numerical simulation.).
Fig. 24. Comparison between experimental crack obtained from DIC procedures and from phase field method of the Inconel 600 alloy sample in sub-volume size 2 × 3.85
× 3.85 mm
3 , (left: experiment; right: numerical simulation).
state (without SCC) is g 0 c ≈ 300 N/m, the regularization length is
considered as a pure numerical parameter, it is chosen correspond-
ing to mesh size l = 0 . 11 mm. To perform the numerical simula-
tions, some parameters are still to be defined. The first one is the
diffusing degradation coefficient D 0 in Eq. (3) , (we assume m = 6 ).
The second parameter is the coefficient n in Eq. (5) (we use here
k c = 1% ). Another parameter is �t , the delay between crack nucle-
ation and crack onset, as discussed above in Section 5.4 .
For the sake of simplicity, the identification is restricted to a
comparison between experimental and simulation results within a
small region. The main idea is described in Fig. 19 . At time step
s , the experimental data allows us to know, the displacement pre-
scribed on the boundary U s and the initiation of several cracks,
as depicted in Fig. 19 (b). We perform a numerical simulation with
the boundary conditions defined by DIC data until time step s . The
regular mesh used for DIC is used to built a 3D mesh of 8-node
elements. Note that, the crack is nucleated at time step s − �t .
In addition, the displacement field of DIC clearly shows fluctu-
ations due to noise (see Fig. 20 ). These spurious local displace-
ment fluctuations could induce nonphysical damage. Hence, in or-
der to avoid this issue, we propose to filter the DIC measurements
along the sub-volume boundary at each experimental load step
by a Savitzky–Golay filtering (see Orfanidis, 1995 ), as illustrated in
Fig. 20 (black points).
The cost function to minimize for identifying the model param-
eters is defined as:
f ( D
i 0 , n
i , �t i ) =
N ∑
k
‖ d exp
k − d num
k ( D
i 0 , n
i , �t i ) ‖
2 (45)
Where k = 1 ..N are the number of crack nodes obtained from
experiments; d exp
k = 1 , and d num
k are the phase field values ob-
tained for given D
i 0 , n
i , �t i at the iterations i . We perform this min-
imization over several regions, and then take the average of the
converged parameter values, we obtain: D 0 ≈ 3 . 32 × 10 −6 mm
2 / s ,
n ≈ 3 and �t ≈ 4800 s.
6.2.2. Surface comparison of crack morphology between numerical
simulations and experiments
In the following, three sub-volumes are considered for a de-
tailed comparison between the experimentally observed cracks
Cette thèse est accessible à l'adresse : http://theses.insa-lyon.fr/publication/2017LYSEI059/these.pdf © [J. Bolivar], [2017], INSA Lyon, tous droits réservés

T.-T. Nguyen et al. / International Journal of Solids and Structures 112 (2017) 65–82 79
Fig. 25. Error estimation of cracks morphology between experiment and predictive
result from simulation.
from DIC processing and the numerical predictions using the pro-
posed model.
The sub-volume dimensions we first consider are 2 × 2.2 ×1.925 mm
3 , the material and model parameters are taken from the
previous Section 6.2.1 . The regular mesh used for DIC is used to
build a 3D mesh of 8-node elements (see Fig. 21 ). By this way,
we can apply the same segmentation procedure on the simulation
results to construct a binary map (cracked or undamaged) of ele-
ments on the sample surface. The mesh of the sub-volume consists
in 50,400 elements with linear interpolation. The evolving bound-
ary conditions obtained from DIC data are applied on the boundary
of the sub-volume during 95 steps. Before applying these boundary
conditions both spatial and temporal interpolation and filtering as
described in the previous section are used. Note that, the DIC dis-
placement has been interpolated in time into 10 sub-increment to
ensure the convergence of the staggered scheme. We compare the
crack network obtained from the simulation with that one from
the experiment at the same loading step. The result is depicted in
Fig. 22 .
We perform the same analysis on other sub-volumes of differ-
ent dimensions. The results are depicted in Figs. 23 and 24 for
two different sub-volume sizes. We obtain here a good agreement
between the experiment and the simulations for the three sub-
volumes considered. However, we recognize that the agreement is
better for the smaller size, i.e increasing structure size provides
more incoherence. For a quantitative estimation of this effect, we
compute the normalized inner product between the binary ele-
ment map obtained from DIC (called f exp ) and that one obtained
from the simulations (called f num
):
Error = 1 −∫
D
[f exp . f num
]d �√ ∫
D f 2 exp d �.
√ ∫ D f
2 num
d �(46)
This error is bounded between 0 (if f exp and f num
are identi-
cal) and 1 (when fluctuations of f exp and f num
are opposite). The
obtained result is plotted in Fig. 25 . The sub-volume size decrease
induces a reduction in the problem due to lack of micro-structure
details. Hence, we obtain the better agreement, i.e the crack mor-
phology error will be smaller.
6.2.3. 3D observations of cracks morphology by using numerical
simulations and comparison with experiments
In this section, we will observe the crack propagation not only
on the surface, but also within the volume. Moreover, in order to
demonstrate the performance of the new procedures, an finer un-
structured mesh is used. The considered sub-volume dimensions
Fig. 26. Experimental validation, sub-volume (2 × 2.2 × 2.2 mm
3 ): (a) geometry
and (b) FEM mesh.
are 2.2 × 2.2 × 2 mm
3 (see Fig. 26 ), the material and model pa-
rameters are taken from the previous Section 6.2.1 . The mesh of
the sub-volume consists in 668,972 tetrahedal elements with linear
interpolation (4-node elements). The mesh is refined in the vicin-
ity of the surface x = 0 in contact with the aggressive solution in
the experiments, as shown in Fig. 26 (b). The typical size of an el-
ement in the crack propagation zone is about h min ≈ 0 . 0225 mm
and about h max = 0 . 06 mm elsewhere in the domain. Note that,
the length scale l is kept to the same value as for the previous tests
(in the case of regular meshes). The evolving boundary conditions
obtained from DIC data are applied on the sub-volume boundary
during 100 steps. Before applying these boundary conditions both
spatial and temporal interpolation and filtering as described in the
previous section are used.
Numerical and experimental crack propagations are compared
for several loading steps. For the sake of clarity, in the 3D view,
we plot only the iso surface of phase field (d = 0 . 95) . The results
are presented in Fig. 27 for several loading steps. We observe the
initiation of several cracks in the step presented in Fig. 27 (a). In
the next step, these cracks are merging and their propagation is
more pronounced at the surface. A complex crack network with 3D
crack morphology is obtained. After creating the continuous crack
path at the sample surface, crack propagation occurs within the
volume. These results are in very good agreement with the experi-
mental observations. In order to perform quantitative comparisons
with experiments, we plot the cracks obtained numerically at the
surface x = 0 for several loadings. Results are compared in Fig. 28 .
Remarkably we observe similar crack morphology and lengths for
all three loading steps. To confirm, we compare the numerical sim-
ulation’s displacement and one obtained from experiment along a
line of investigation at the surface x = 0 . The very good agreement
on crack opening is obtained in Fig. 29 . One should again keep
in mind that in the simulations, only initiation sites are prescribed
from experimental data, there is no a priori about crack paths and
the model parameters have been identified by an inverse approach.
Finally, the simulation and experiments are compared for the same
load.
7. Conclusions
In this work, a new multiphysics model based on the phase
field method is proposed to simulate the failure of the nickel
base alloy under SCC. The slip dissolution induced SCC process is
Cette thèse est accessible à l'adresse : http://theses.insa-lyon.fr/publication/2017LYSEI059/these.pdf © [J. Bolivar], [2017], INSA Lyon, tous droits réservés

80 T.-T. Nguyen et al. / International Journal of Solids and Structures 112 (2017) 65–82
Fig. 27. Experimental validation, sub-volume (2 × 2.2 × 2.2 mm
3 ): The iso surface of phase field d ( x ) is plotted. (a), (b), (c) and (d) depict the cracks onset and propagation
corresponding to U = 0 . 014 mm, U = 0 . 015 mm, and U = 0 . 016 mm, respectively.
Fig. 28. Comparison between experimental crack obtained from DIC procedures and from phase field method of the Inconel 600 alloy sample in sub-volume size 2 × 2.2 ×2.2 mm
3 , for several loading steps (bottom: experiment; top: numerical simulation.).
Cette thèse est accessible à l'adresse : http://theses.insa-lyon.fr/publication/2017LYSEI059/these.pdf © [J. Bolivar], [2017], INSA Lyon, tous droits réservés

T.-T. Nguyen et al. / International Journal of Solids and Structures 112 (2017) 65–82 81
Fig. 29. Comparison of local displacement between DIC measurements and numerical simulation.
modeled by using an equivalent modeling: SCC crack growth is
controlled by combining the kinetics of the diffusing degradation
as an environmental factor and fracture mechanics at the crack
tip.
The proposed model simulates the effects of SCC on fracture
mechanics, such as crack coalescence and propagation in 3D. SCC
crack initiation is strongly related to the micro-structure of the
materials. In order to reproduce the crack initiation without incor-
porating the actual micro-structure, an approach combining sim-
ulations and experiments to nucleate cracks is carried out. This
method uses the cracks onset position obtained from experimental
DIC data, then imposes the strain history function in the numeri-
cal model. The cracks are then free to propagate in the numerical
model, only the locations and times for crack initiation are pre-
scribed.
Some material and model parameters are identified by an in-
verse approach combining experimental data and the 3D simula-
tions. Then, they are used to perform predictive simulations. Di-
rect comparisons between experimental results and predictions of
the numerical simulation are performed ans several steps of vali-
dation are proposed. Firstly, the crack path at a chosen loading is
compared and a good agreement about crack geometry and crack
length are obtained. Secondly, the accurate estimation of cracks
morphologies shows a very good agreement between experiments
and predictions by numerical simulations. However, the lack of mi-
crostructure details still provides some incoherence when increas-
ing the size of the analyzed structure.
The predictions provided by the proposed coupled SCC – phase
field model are in good agreement with many observations of
the effect on SCC by anodic dissolution crack growth. The new
method opens a new way to study the SCC assisted crack coales-
cence and propagation. In the same direction, this model could ap-
ply for 3D experimental results, such as 3D crack morphology de-
fined from X-ray tomography. Especially, the proposed framework
become very efficient to study the case of hydrogen induced stress
cracking.
Acknowledgments
The authors would like to acknowledge the National French
Research Agency (ANR) for its financial support under contract
MATETPRO ANR - 12 - RMNP - 0020 (ECCOFIC project). The authors
would like also to thank their partners AREVA, ANDRA, Institut de
la Corrosion, ACXCOR and MISTRAS by their participation into the
fruitful discussion during this work.
References
Abhay, J. , Sreekumar, K. , Sinha, P. , 2010. Stress corrosion cracking of high strength
steel fasteners for space applications. J. Fail. Anal. Prev. 10 (4), 270–281 . Al-Rubaie, K. , Godefroid, L. , Lopes, J. , 2007. Statistical modeling of fatigue crack
growth rate in inconel alloy 600. Int. J. Fatigue 29 (5), 931–940 .
Amor, H. , Marigo, J. , Maurini, C. , 2009. Regularized formulation of the variational brittle fracture with unilateral contact: numerical experiments. J. Mech. Phys.
Solids 57 (8), 1209–1229 . Babout, L., Marrow, T.J., Engelberg, D., Withers, P.J., 2006. X-ray microtomo-
graphic observation of intergranular stress corrosion cracking in sensitised austenitic stainless steel. Mater. Sci. Technol. 22 (9), 1068–1075. doi: 10.1179/
174328406X114090 . Bellenger, F. , Mazille, H. , Idrissi, H. , 2002. Use of acoustic emission technique for
the early detection of aluminum alloys exfoliation corrosion. NDT & E Int. 35
(6), 385–392 . Besnard, G. , Hild, F. , Roux, S. , 2006. ‘Finite-element’ displacement fields analysis
from digital images: application to portevin-le châtelier bands. Exp. Mech. 46 (6), 789–803 .
Bolivar, J., Fregonese, M., Rethore, J., Duret-Thual, C., Combrade, P., 2016. Evaluation of Multiple Stress Corrosion Cracks Interactions by In-situ Digital Image Corre-
lation. Unpublished.
Borden, M. , Verhoosel, C. , Scott, M. , Hughes, T. , Landis, C. , 2012. A phase-field de- scription of dynamic brittle fracture. Comput. Methods Appl. Mech. Eng. 217,
77–95 . Bourdin, B. , Francfort, G. , Marigo, J.-J. , 20 0 0. Numerical experiments in revisited
brittle fracture. J. Mech. Phys. Solids 48 (4), 797–826 . Braides, D. , 1998. Approximation of Free Discontinuity Problems. Springer Verlag,
Berlin .
Choi, B., Chudnovsky, A., Sehanobish, K., 2007. Stress corrosion cracking in plas- tic pipes: observation and modeling. Int. J. Fract. 145 (1), 81–88. doi: 10.1007/
s10704-007-9092-3 . Ford, F.P. , Andresen, P.L. , 1987. Development and use of a predictive model of crack
propagation in 304/316L, A533B/A508 and Inconel 600/182 alloys in 288 °C wa- ter. Proceedings of International Conference on Environmental Degradation of
Materials in Nuclear Power Systems–Water Reactors 789–800 .
Francfort, G. , Marigo, J. , 1998. Revisiting brittle fracture as an energy minimization problem. J. Mech. Phys. Solids 46 (8), 1319–1342 .
Hladky, K. , Dawson, J. , 1981. The measurement of localized corrosion using electro- chemical noise. Corros. Sci. 21 (4), 317–322 .
Jomdecha, C. , Prateepasen, A. , Kaewtrakulpong, P. , 2007. Study on source location using an acoustic emission system for various corrosion types. NDT & E Int. 40
(8), 584–593 .
Karma, A. , Kessler, D. , Levine, H. , 2001. Phase-field model of mode III dynamic frac- ture. Phys. Rev. Lett. 87 (4), 045501 .
Kearns, J. , 1996. Electrochemical Noise Measurement for Corrosion Applications, 1277. ASTM International .
Kikuchi, M. , Suga, Y.W.K. , 2011. Surface crack growth simulation under mixed mode cyclic loading condition. Procedia Eng. 10, 427–432 .
King, A. , Johnson, G. , Engelberg, D. , Ludwig, W. , Marrow, J. , 2008. Observations of intergranular stress corrosion cracking in a grain-mapped polycrystal. Science
321 (5887), 382–385 .
Kovac, J. , Alaux, C. , Marrow, T. , Govekar, E. , Legat, A. , 2010. Correlations of electro- chemical noise, acoustic emission and complementary monitoring techniques
during intergranular stress-corrosion cracking of austenitic stainless steel. Cor- ros. Sci. 52 (6), 2015–2025 .
Miehe, C. , Hofacker, M. , Welschinger, F. , 2010. A phasefield model for rate-indepen- dent crack propagation: robust algorithmic implementation based on operator
splits. Comput. Methods Appl. Mech. Eng. 199, 2765–2778 .
Cette thèse est accessible à l'adresse : http://theses.insa-lyon.fr/publication/2017LYSEI059/these.pdf © [J. Bolivar], [2017], INSA Lyon, tous droits réservés

82 T.-T. Nguyen et al. / International Journal of Solids and Structures 112 (2017) 65–82
Mills, W. , 1981. On the relationship between stretch zone formation and the j inte- gral for high strain-hardening materials. J. Test Eval. 9 (1), 56–62 .
Mills, W. , Brown, C. , 2001. Fracture toughness of alloy 600 and an en82h weld in air and water. Metall. Mater. Trans. A 32 (5), 1161–1174 .
Newman, J. , Raju, I. , 1981. An empirical stress-intensity factor equation for the sur- face crack. Eng. Fract. Mech. 15 (1), 185–192 .
Newman, R., Healey, C., 2007. Stability, validity, and sensitivity to input parameters of the slip-dissolution model for stress-corrosion cracking. Corros. Sci. 49 (10),
4040–4050. doi: 10.1016/j.corsci.20 07.05.0 01 .
Nguyen, T. , Yvonnet, J. , Bornert, M. , Chateau, C. , Sab, K. , Romani, R. , Roy, R.L. , 2016. On the choice of parameters in the phase field method for simulating crack
initiation with experimental validation. Int. J. Fract. 197 (2), 213–226 . Nguyen, T. , Yvonnet, J. , Zhu, Q.-Z. , Bornert, M. , Chateau, C. , 2015. A phase field
method to simulate crack nucleation and propagation in strongly heterogeneous materials from direct imaging of their microstructure. Eng. Fract. Mech. 139,
18–39 .
Orfanidis, S. , 1995. Introduction to Signal Processing. Prentice-Hall, Inc . Parkins, R. , 1980. Predictive approaches to stress corrosion cracking failure. Corros.
Sci. 20 (2), 147–166 . Parkins, R. , 1987. Current topics in corrosion: factors influencing stress corrosion
crack growth kinetics. Corrosion 43 (3), 130–139 . Richardson, J. , Wood, G. , 1970. A study of the pitting corrosion of al by scanning
electron microscopy. Corros. Sci. 10 (5), 313–323 .
Saito, K., Kuniya, J., 2001. Mechanochemical model to predict stress corrosion crack growth of stainless steel in high temperature water. Corros. Sci. 43 (9), 1751–
1766. doi: 10.1016/S0010-938X(00)00173-6 . Scully, J. , 1971. The Theory of Stress Corrosion Cracking in Alloys. North Atlantic
Treaty Organization, Scientific Affairs Division .
Scully, J. , 1972. The current situation in stress-corrosion studies. Metal Sci. J. 6 (1), 238–240 .
Scully, J. , 1980. The interaction of strain-rate and repassivation rate in stress corro- sion crack propagation. Corros. Sci. 20 (8), 997–1016 .
Shaikh, H. , Amirthalingam, R. , Anita, T. , Sivaibharasi, N. , Jaykumar, T. , Manohar, P. , Khatak, H. , 2007. Evaluation of stress corrosion cracking phenomenon in an AISI
type 316ln stainless steel using acoustic emission technique. Corros. Sci. 49 (2), 740–765 .
Smith, R., Cooper, J., 1989. A finite element model for the shape development of
irregular planar cracks. Int. J. Press. Vessels Pip. 36 (4), 315–326. doi: 10.1016/ 0308- 0161(89)90054- 9 .
Sutton, M. , Orteu, J. , Schreier, H. , 2009. Book-Image Correlation for Shape, Motion and Deformation Measurements, Hardcover. Technical Report. ISBN
978-0-387-78746-6 . Sutton, M. , Wolters, W. , Peters, W. , Ranson, W. , McNeill, S. , 1983. Determination of
displacements using an improved digital correlation method. Image Vis. Com-
put. 1 (3), 133–139 . Takaya, S. , Suzuki, T. , Matsumoto, Y. , Demachi, K. , Uesaka, M. , 2004. Estimation of
stress corrosion cracking sensitivity of type 304 stainless steel by magnetic force microscope. J. Nucl. Mater. 327 (1), 19–26 .
Vermilya, D. , Diegle, R. , 1976. Concerning strain-enhanced corrosion mechanisms of SCC. Corrosion 32 (1), 26–29 .
Vermilyea, D. , 1972. A theory for the propagation of stress corrosion cracks in met-
als. J. Electrochem. Soc. 119 (4), 405–407 . Williford, R. , Windisch, C. , Jones, R. , 20 0 0. In situ observations of the early stages
of localized corrosion in type 304 SS using the electrochemical atomic force microscope. Mater. Sci. Eng. A 288 (1), 54–60 .
Cette thèse est accessible à l'adresse : http://theses.insa-lyon.fr/publication/2017LYSEI059/these.pdf © [J. Bolivar], [2017], INSA Lyon, tous droits réservés

Appendix F: Description of the experimental apparatus for performing in-situ SCC experiments at intermediate temperatures and pressures
José Bolivar 254
Thèse en Sciences des Matériaux / 2017
Institut national des sciences appliquées de Lyon
F. Appendix F
Description of the experimental apparatus for
performing in-situ SCC experiments at
intermediate temperatures and pressures
This appendix aims to introduce an autoclave built it within the frame of the ECCOFIC project
for the study of Stress Corrosion Cracking at intermediate temperatures and pressures (200°C
and 40 bars). The autoclave (see Figure F-1) was designed and fabricated by AREVA NP in
collaboration with the MATEIS Laboratory, the LAMCOS laboratory, the Institute de la
Corrosion (IC), MISTRAS and ACXCOR. The autoclave was designed to work up to 200 °C
and 40 bars and was specially adapted to perform in-situ measurements (see Figure F-1) such
as: optical observations of the sample surface (e.g. DIC, photos), Acoustic Emission
measurements and electrochemical measurements (e.g. EN, EIS, polarization curves). The
next section will introduce the loading system of the apparatus as well as the heating
mechanism. Subsequently, the compatibility of the apparatus for DIC, AE and EN
measurements is detailed.
Figure F-1. Autoclave ECCOFIC adapted for in-situ measurements of AE, EN and DIC
E.1 Basis of autoclave operation
E.1.1 Mechanical loading
The whole body of the autoclave was built in Alloy 625 (base nickel alloy) with an internal
volume of approximately 400 mL. The Figure F-2 shows an internal view of the body. The
Cette thèse est accessible à l'adresse : http://theses.insa-lyon.fr/publication/2017LYSEI059/these.pdf © [J. Bolivar], [2017], INSA Lyon, tous droits réservés

Appendix F: Description of the experimental apparatus for performing in-situ SCC experiments at intermediate temperatures and pressures
José Bolivar 255
Thèse en Sciences des Matériaux / 2017
Institut national des sciences appliquées de Lyon
loading of the sample is performed by the compression of a spring situated in the outside part
of the autoclave body. Once the spring is compressed, a screw blocks the relaxation of the
spring and transmits a tensile force to the specimen.
Figure F-2. Description of the internal part of the ECCOFIC autoclave
E.1.2 Heating, temperature and pressure control
The autoclave system is heated by four heating cartridges that are embedded in the metallic
body of the autoclave. The heating rate is controlled manually and the temperature is measured
by 3 thermocouples. Two of the thermocouples are embedded together with the heating
cartridges and are dedicated to the overheating security control (prevent excessive heating).
The third thermocouple is directly inserted close to the tensile sample and is dedicated to
temperature recording. On the other hand, the control of the pressure is performed by gas
injection (Oxygen or Nitrogen). The autoclave is equipped with an analogic pressure
manometer and with a digital pressure sensor. Both temperature and pressure signals go to an
acquisition system (Agilent 34972A) that transmits the information to a computer for
recording. In the case of overpressure, the apparatus has a safety head containing a bursting
disc which breaks at 50 ± 5 bars.
E.2 Compatibility with in-situ measurements
E.2.1 Compatibility with AE measurement
The autoclave has two AE waveguides welded to the body of the autoclave (see Figure F-3)
that allow the positioning of AE sensors. In such a manner, the AE sensors are far away from
the hot body of the autoclave which allows performing AE measurements.
Cette thèse est accessible à l'adresse : http://theses.insa-lyon.fr/publication/2017LYSEI059/these.pdf © [J. Bolivar], [2017], INSA Lyon, tous droits réservés

Appendix F: Description of the experimental apparatus for performing in-situ SCC experiments at intermediate temperatures and pressures
José Bolivar 256
Thèse en Sciences des Matériaux / 2017
Institut national des sciences appliquées de Lyon
Figure F-3. Waveguide and AE sensor holder for AE measurements
E.2.2 Compatibility with optical measurements
The autoclave is equipped with an optical window (e.g. porthole) that allows performing
optical measurements of the sample surface (see Figure F-2). The porthole has an effective
diameter of 15 mm and is made of Yttrium stabilized Zirconia.
It must be highlighted that in order to perform DIC measurements, a telecentric 1X lens having
a Working distance greater than 160 mm and compatible with our 2/3" CCD camer a is
required. Such a limit is because there must be enough place for the lighting dispositive and
to achieving colder temperatures outside the autoclave. Nevertheless, does not exists in the
market a telecentric lens assembling those characteristics. For this reason, a classical lens
(entocentric, AF Micro 200 lens) has to be used. The performance of this lens for DIC
measurements are evaluated in appendix G, in particular, the deformation induced by an out-
of-plane displacement.
E.2.3 Compatibility with electrochemical measurements
The experimental device allows performing electrochemical measurements under a three -
electrode cell configuration. An Ag/AgCl reference electrode is situated at the right side of
the autoclave. A capillary tube goes from the cold part of the reference electrode to the vicinity
of the WE. Moreover, either a Pt wire or the autoclave body can be used as auxiliary electrode.
A counter-electrode for Electrochemical Noise measurements is situated 5 mm back to the
tensile sample (WE). The CE has the same exposed surface than the tensile sample and the
same surface preparation (see Figure F-4). An electrical connection is made on each sample
to perform electrochemical measurements (EIS, EN, polarization, etc.). For this, a 304 L SS
wire of 0.8 mm diameter is welded to one of the extremities of the sample (see Figure F-5).
The weld is localized in a very small zone, hence, no important damage is provided to the
samples. The resulting wire is then isolated with a PTFE shrink sleeve tube in order to avoid
Cette thèse est accessible à l'adresse : http://theses.insa-lyon.fr/publication/2017LYSEI059/these.pdf © [J. Bolivar], [2017], INSA Lyon, tous droits réservés

Appendix F: Description of the experimental apparatus for performing in-situ SCC experiments at intermediate temperatures and pressures
José Bolivar 257
Thèse en Sciences des Matériaux / 2017
Institut national des sciences appliquées de Lyon
all possible electrical contact with the autoclave. All the electrodes of the autoclave are
electrically insulated from the autoclave body by structural PEEK and oxidized Zr-alloy
elements. The electrical connections of the electrodes pass through a Conax® type waterproof
element situated at the bottom of the autoclave (see Figure F-1).
Figure F-4. Geometry of the samples used for the experiments in the autoclave system
Figure F-5. Schematic representation of the electrical contact of the samples for the electrochemical
measurements
Cette thèse est accessible à l'adresse : http://theses.insa-lyon.fr/publication/2017LYSEI059/these.pdf © [J. Bolivar], [2017], INSA Lyon, tous droits réservés

Appendix G: Evaluation of the induced deformation by an out-of-plane movement: AF Micro 200 Lens
José Bolivar 258
Thèse en Sciences des Matériaux / 2017
Institut national des sciences appliquées de Lyon
G. Appendix G
Evaluation of the induced deformation by an
out-of-plane movement: AF Micro 200 Lens
Unlike telecentric lenses, the conventional lenses (also named entocentrics) are prone to
distort the image of the object that is being observed. Those distortions can be observed as a
magnification change due to the object displacement and as perspective errors (see Figure
G-1). This behavior is critical in measurement applications (e.g. displacement measurements,
DIC) where the perspective projections and an incorrect image scaling can cause important
measuring errors.
Figure G-1. Comparison between the images obtained from a standard lens and a telecentric lens
In our case, the AF Micro 200 (model AF Micro-Nikkor 200 mm f/4D IF-ED) is an entocentric
lens with a fixed-focal distance. Consequently, this lens is prone to generate a fictitious
deformation of the image by an out-of-plane movement. The evaluation of this deformation
is of prime importance for a DIC application using this optical device.
Experimental procedure and results
This evaluation was performed with the same tensile sample used in the SCC tests in the
autoclave (see Appendix G). The gage length of the sample was atomized with a sequence of
black and white spray paints. This sequence produces a suitable surface patterning for the DIC
Cette thèse est accessible à l'adresse : http://theses.insa-lyon.fr/publication/2017LYSEI059/these.pdf © [J. Bolivar], [2017], INSA Lyon, tous droits réservés

Appendix G: Evaluation of the induced deformation by an out-of-plane movement: AF Micro 200 Lens
José Bolivar 259
Thèse en Sciences des Matériaux / 2017
Institut national des sciences appliquées de Lyon
evaluation (see Figure G-2). Subsequently, the sample was positioned in the autoclave in the
same way as for an SCC test. The autoclave was filled with distilled water in order to be closer
to real measuring conditions. The DIC acquisition system is represented in the Figure G-3. It
consisted of a 2/3" Stingray CCD camera of 5 Mpx (with a pixel size of 3.45 µm), a clamping
stage for the lens with 5 degrees of freedom and the AF Micro 200. The lens was focused in
order to get 1X magnification, this configuration is achieved with a WD of 260 mm (1px =
3.45 µm).
Figure G-2. CCD image of the black and white surface patterning
Figure G-3. Experimental montage used for the evaluation of the M200 lens
Cette thèse est accessible à l'adresse : http://theses.insa-lyon.fr/publication/2017LYSEI059/these.pdf © [J. Bolivar], [2017], INSA Lyon, tous droits réservés

Appendix G: Evaluation of the induced deformation by an out-of-plane movement: AF Micro 200 Lens
José Bolivar 260
Thèse en Sciences des Matériaux / 2017
Institut national des sciences appliquées de Lyon
Figure G-4. Schematic representation of the experimental montage for the evaluation of the M200 lens
Figure G-5. Results of the deformation induced by an out-of-plane movement with the M200 lens
A first image was obtained at the point named y0 (see Figure G-4). This image corresponded
to the reference image for the DIC assessment. Then, the lens clamping stage was moved each
100 µm (with the micrometric screws) to the positive and negative direction taking a new
picture at each time (see Figure G-4). A total of 7 images were taken. Grouping 5 images in
the positive direction (+100 µm, +200 µm, +300 µm and +400 µm vs y0), one image at -100
µm vs y0 and the reference (at y0).
Cette thèse est accessible à l'adresse : http://theses.insa-lyon.fr/publication/2017LYSEI059/these.pdf © [J. Bolivar], [2017], INSA Lyon, tous droits réservés

Appendix G: Evaluation of the induced deformation by an out-of-plane movement: AF Micro 200 Lens
José Bolivar 261
Thèse en Sciences des Matériaux / 2017
Institut national des sciences appliquées de Lyon
A DIC assessment was performed using the UFreckles software. Square elements of 45 px
were used in the analysis. The results consisted of the displacement and strain field of each
analyzed image. The strain field allows calculating the mean longitudinal and transversal
strain for each of the images. Finally, both strains were plotted in function of the displacement
imposed. Then, the curves were fitted with a linear model. The slope of each curve represents
directly the induced deformation by the out-of-plane movement in %/µm. As observed in
Figure G-5, the M200 lens induced a longitudinal strain of 0.013 % 100 µm⁄ and a transversal
strain of 0.016 % 100 µm⁄ .
Conclusion
It can be noted that those deformations are very small. It is expected that those level s of
deformation will be "attenuated" by the virtual deformation due to crack opening. In addition,
the image acquisition will start after the loading of the sample. Therefore, the out-of-plane
movement is expected to be very small. Consequently, it can be stated that the AF Micro 200
lens can be used for DIC measurements for in-situ SCC tests
Cette thèse est accessible à l'adresse : http://theses.insa-lyon.fr/publication/2017LYSEI059/these.pdf © [J. Bolivar], [2017], INSA Lyon, tous droits réservés

References
José Bolivar 262
Thèse en Sciences des Matériaux / 2017
Institut national des sciences appliquées de Lyon
REFERENCES [1] B. W. Brook, A. Alonso, D. A. Meneley, J. Misak, T. Blees, and J. B. van Erp, “Why
nuclear energy is sustainable and has to be part of the energy mix,” Sustain. Mater.
Technol., vol. 1–2, pp. 8–16, Dec. 2014.
[2] J. Baek, “Do nuclear and renewable energy improve the environment? Empirical evi-
dence from the United States,” Ecol. Indic., vol. 66, pp. 352–356, Jul. 2016.
[3] M. Lehtveer and F. Hedenus, “How much can nuclear power reduce climate mitigation
cost? – Critical parameters and sensitivity,” Energy Strategy Rev., vol. 6, pp. 12–19, Jan.
2015.
[4] C. Bataille and C. Birraux, “La durée de vie des centrales nucleaires et les nouveaux
types de reacteurs,” Assamblée Nationale, 832, 2003.
[5] J.-P. Chanteguet, “Rapport d’information sur l’application de la lo i n° 2015-992 du 17
août 2015 relative à la transition energetique pour la croissance verte,” Assembléé Na-
tionale, 4157, 2016.
[6] D. Féron, Ed., Corrosion issues in light water reactors: stress corrosion cracking . Boca
Raton, Fla.: CRC Press [u.a.], 2007.
[7] P. Marcus, Corrosion mechanisms in theory and practice. Boca Raton; Florence: C R C
Press LLC Taylor & Francis Group [Distributor], 2002.
[8] P. M. Scott and C. Benhamou, “An overview of recent observations and interpretation
of PWSCC innickel-base alloys in PWR primary water,” presented at the Proceedings of
10th Int. Symposium on Environmental Degradation of Materials in Nuclear Power Sys-
tems - Water Reactors, Lake Tahoe, 2001.
[9] P. M. Scott, “An analysis of primary water stress corrosion cracking in PWR steam gen-
erators,” presented at the Proceedings of NEA/CSNI – UNIPEDE Specialist Meeting on
Operating Experience with Steam Generators, Brussels, Belgium, 1991, vol. 5.
[10] Ito and Kameyama, “Trend of PWSCC Trend of PWSCC in Nuclear Reactor Vessel Head
Penetrations,” Japan Society of MAintenology, 2005.
[11] R. N. Parkins, “Stress corrosion spectrum,” Br. Corros. J., vol. 7, no. 1, pp. 15–28, 1972.
[12] R. H. Jones, Ed., Stress-corrosion cracking. Materials Park, Ohio: ASM International,
1992.
[13] J. Hickling, “Status Review of Initiation of Environmentally assisted cracking and short
crack growth,” EPRI, Palo Alto, CA, Technical report 1011788, 2005.
[14] J. Kruger and K. Rhyne, “Current understanding of pitting and crevice corrosion and its
application to test methods for determining the corrosion susceptibility of nuclear waste
metallic containers,” Nucl. Chem. Waste Manag., vol. 3, no. 4, pp. 205–227, 1982.
[15] J. H. Qiu, “Passivity and its breakdown on stainless steels and alloys,” Surf. Interface
Anal., vol. 33, no. 10–11, pp. 830–833, Oct. 2002.
[16] Y.-Z. Wang, R. W. Revie, M. T. Shehata, R. N. Parkins, and K. Krist, “Initiation of
environment induced cracking in pipeline steel: microstructural correlations,” in 1998
2nd International Pipeline Conference, 1998, pp. 529–542.
[17] R. N. Parkins, “Some electrochemical aspects of the mechanisms of corrosion fatigue,”
Met. Sci., vol. 13, no. 7, pp. 381–386, 1979.
[18] J. C. Scully, “Kinetic features of stress-corrosion cracking,” Corros. Sci., vol. 7, no. 4,
pp. 197–207, 1967.
[19] G. Bombara, “The role of oxide films in stress corrosion cracking initiation,” Corros.
Sci., vol. 19, no. 7, pp. 991–999, 1979.
Cette thèse est accessible à l'adresse : http://theses.insa-lyon.fr/publication/2017LYSEI059/these.pdf © [J. Bolivar], [2017], INSA Lyon, tous droits réservés

References
José Bolivar 263
Thèse en Sciences des Matériaux / 2017
Institut national des sciences appliquées de Lyon
[20] S. Lynch, “Mechanistic and fractographic aspects of stress corrosion cracking,” Corros.
Rev., vol. 30, no. 3–4, Jan. 2012.
[21] H. L. Logan, “Film-rupture mechanism of stress corrosion,” J. Res. Natl. Bur. Stand.,
vol. 48, no. 2, pp. 99–105, 1952.
[22] R. C. Newman and C. Healey, “Stability, validity, and sensitivity to input parameters of
the slip-dissolution model for stress-corrosion cracking,” Corros. Sci., vol. 49, no. 10,
pp. 4040–4050, Oct. 2007.
[23] O. F. Aly and M. Mattar Neto, “The slip-step dissolution and film rupture model-a crit-
ical review and an alternative modeling proposal,” Corros Sci, 2011.
[24] F. P. Ford, “Slip dissolution model,” in Corrosion sous contrainte: phénoménologie et
mécanismes, D. Desjardins and R. Oltra, Eds. Les Editions de Physique, 1990, p. 307.
[25] R. C. Newman, “Developments in the slip-dissolution model of stress corrosion crack-
ing,” Corrosion, vol. 50, no. 9, pp. 682–686, 1994.
[26] M. M. Hall, “An alternative to the Shoji crack tip strain rate equation,” Corros. Sci., vol.
50, no. 10, pp. 2902–2905, Oct. 2008.
[27] D. G. Kolman and J. R. Scully, “Continuum mechanics characterization of plastic defor-
mation-induced oxide film rupture,” Philos. Mag. A, vol. 79, no. 10, pp. 2313–2338, Oct.
1999.
[28] M. M. Hall, “Crack tip strain rate equation with applications to crack tip embrittlement
and active path dissolution models of stress corrosion cracking,” in Environment-In-
duced Cracking of Materials, Elsevier, 2008, pp. 59–68.
[29] T. Shoji, Z. Lu, and H. Murakami, “Formulating stress corrosion cracking growth rates
by combination of crack tip mechanics and crack tip oxidation kinetics,” Corros. Sci.,
vol. 52, no. 3, pp. 769–779, Mar. 2010.
[30] H. Xue and T. Shoji, “Quantitative Prediction of EAC Crack Growth Rate of Sensitized
Type 304 Stainless Steel in Boiling Water Reactor Environments Based on EPFEM,” J.
Press. Vessel Technol., vol. 129, no. 3, p. 460, 2007.
[31] J. C. Scully, “Stress corrosion crack propagation: A constant charge criterion,” Corros.
Sci., vol. 15, no. 4, pp. 207–224, 1975.
[32] S. C. Lu, G. M. Gordon, and P. L. Andresen, “Validation of Stress Corrosion Cracking
Model for High Level Radioactive-Waste Packages,” in ASME/JSME 2004 Pressure
Vessels and Piping Conference, 2004, pp. 61–68.
[33] A. Turnbull, “Modelling of environment assisted cracking,” Corros. Sci., vol. 34, no. 6,
pp. 921–960, juin 1993.
[34] A. Barnes, N. A. Senior, and R. C. Newman, “Film-Induced Cleavage of Ag-Au Alloys,”
Metall. Mater. Trans. A, vol. 40, no. 1, pp. 58–68, Jan. 2009.
[35] T. B. Cassagne, W. F. Flanagan, and B. D. Lichter, “Transgranular stress-corrosion
cracking of disordered Cu-25Au in aqueous chloride and sulfate media,” Metall. Trans.
A, vol. 19, no. 2, pp. 281–292, 1988.
[36] V. S. Raja and T. Shoji, Eds., Stress corrosion cracking: Theory and Practice . Cam-
bridge, UK ; Phildelphia, PA: Woodhead Publishing, 2011.
[37] M. Sato, “Studies on the Wetting Effect and the Surface Tension of Solids,” Proceedings
of the Japan Academy, vol. 31, no. 9, pp. 620–623, 1955.
[38] J. A. Clum, “The role of hydrogen in dislocation generation in iron alloys,” Scripta Met-
allurgica, vol. 9, no. 1, pp. 51–58, 1975.
[39] H. Matsui, H. Kimura, and S. Moriya, “The effect of hydrogen on the mechanical prop-
erties of high purity iron I. Softening and hardening of high purity iron by hydrogen
charging during tensile deformation,” Mater. Sci. Eng., vol. 40, no. 2, pp. 207–216,
1979.
Cette thèse est accessible à l'adresse : http://theses.insa-lyon.fr/publication/2017LYSEI059/these.pdf © [J. Bolivar], [2017], INSA Lyon, tous droits réservés

References
José Bolivar 264
Thèse en Sciences des Matériaux / 2017
Institut national des sciences appliquées de Lyon
[40] D. S. Shih, I. M. Robertson, and H. K. Birnbaum, “Hydrogen embrittlement of α tita-
nium: In situ tem studies,” Acta Metallurgica, vol. 36, no. 1, pp. 111–124, 1988.
[41] H. K. Birnbaum, “Mechanisms of hydrogen related fracture of metals,” DTIC Document,
1989.
[42] S. Lynch, “Hydrogen embrittlement phenomena and mechanisms,” Corros. Rev., vol.
30, no. 3–4, Jan. 2012.
[43] R. A. Oriani, “Equilibrium aspects of hydrogen-induced cracking of steels,” Acta Met-
allurgica, vol. 22, no. 9, pp. 1065–1074, 1974.
[44] H. K. Birnbaum and P. Sofronis, “Hydrogen-enhanced localized plasticity—a mecha-
nism for hydrogen-related fracture,” Mater. Sci. Eng. A, vol. 176, no. 1–2, pp. 191–202,
1994.
[45] A. Turnbull, “The environmentally small/short crack growth effect: current understand-
ing,” Corros. Rev., vol. 30, no. 1–2, pp. 1–17, Jan. 2012.
[46] R. Jones and S. Pitt, “Multiple-site and widespread fatigue damage in aging aircraft,”
Engineering Failure Analysis, vol. 4, no. 4, pp. 237–257, 1997.
[47] J.-Y. Jeon, Y.-J. Kim, and J.-S. Kim, “Multiple Axial Surface PWSCC Growth Assess-
ment of Steam Generator Tube Using the PWSCC Initiation Model and Damage Me-
chanics Approach,” Procedia Mater. Sci., vol. 3, pp. 811–816, 2014.
[48] Y. Okamura, A. Sakashita, T. Fukuda, H. Yamashita, and T. Futami, “Latest SCC issues
of core shroud and recirculation piping in Japanese BWRs,” in Transactions of the 17th
International Conference on Structural Mechanics in Reactor Technology, WG01-1,
Prague, Czech Republic, 2003.
[49] Y. F. Cheng, Stress corrosion cracking of pipelines. Hoboken, New Jersey: Wiley, 2013.
[50] C. Manfredi and J. L. Otegui, “Failures by SCC in buried pipelines,” Eng. Fail. Anal.,
vol. 9, no. 5, pp. 495–509, 2002.
[51] E. Sadeghi Meresht, T. Shahrabi Farahani, and J. Neshati, “Failure analysis of stress
corrosion cracking occurred in a gas transmission steel pipeline,” Eng. Fail. Anal., vol.
18, no. 3, pp. 963–970, avril 2011.
[52] Y. Ochi, A. Ishii, and S. K. Sasaki, “An Experimental and Statistical Investigation of
Surface Fatigue Crack Initiation and Growth,” Fatigue Fract. Eng. Mater. Struct., vol.
8, no. 4, pp. 327–339, avril 1985.
[53] T. Winkler, A. Brückner-Foit, and H. Riesch-Oppermann, “Statistical Characterization
of Random Crack Patterns Caused by Thermal Fatigue,” Fatigue Fract. Eng. Mater.
Struct., vol. 15, no. 10, pp. 1025–1039, Oct. 1992.
[54] H. Kitagawa, T. Fujita, and K. Miyazawa, “Small randomly distributed cracks in corro-
sion fatigue,” Philadelphia, 1978, vol. STP 624, pp. 98–114.
[55] Y.-Z. Wang, K. Ebtehaj, D. Hardie, and R. N. Parkins, “The behaviour of multiple stress
corrosion cracks in a Mn-Cr and a Ni-Cr-Mo-V steel: II—Statistical characterisation,”
Corros. Sci., vol. 37, no. 11, pp. 1677–1703, 1995.
[56] R. N. Parkins, “A Review of Stress Corrosion Cracking of High Pressure Gas Pipelines,”
in NACE-00363, NACE, 2000.
[57] Y.-Z. Wang, D. Hardie, and R. N. Parkins, “The behaviour of multiple stress corrosion
cracks in a Mn-Cr and a Ni-Cr-Mo-V steel: III—Monte Carlo simulation,” Corros. Sci.,
vol. 37, no. 11, pp. 1705–1720, 1995.
[58] Y.-Z. Wang, K. Ebtehaj, D. Hardie, and R. N. Parkins, “The behaviour of multiple stress
corrosion cracks in a Mn-Cr and Ni-Cr-Mo-V Steel - I - Metallography,” Corros. Sci.,
vol. 37, no. 11, pp. 1651–1675, 1995.
[59] “Stress Corrosion Cracking Recommended Practices,” Canadian Energy Pipeline Asso-
ciation, 2007.
Cette thèse est accessible à l'adresse : http://theses.insa-lyon.fr/publication/2017LYSEI059/these.pdf © [J. Bolivar], [2017], INSA Lyon, tous droits réservés

References
José Bolivar 265
Thèse en Sciences des Matériaux / 2017
Institut national des sciences appliquées de Lyon
[60] M. Kamaya, “Growth evaluation of multiple interacting surface cracks. Part I: Experi-
ments and simulation of coalesced crack,” Eng. Fract. Mech., vol. 75, no. 6, pp. 1336–
1349, avril 2008.
[61] M. Kamaya and N. Totsuka, “Influence of interaction between multiple cracks on stress
corrosion crack propagation,” Corros. Sci., vol. 44, no. 10, pp. 2333–2352, Oct. 2002.
[62] P. J. E. Forsyth, “A unified description of micro and macroscopic fa tigue crack behav-
iour,” Int. J. Fatigue, vol. 5, no. 1, pp. 3–14, Jan. 1983.
[63] Y.-Z. Wang, J. D. Atkinson, R. Akid, and R. N. Parkins, “Crack Interaction, Coalescence
and Mixed Mode Fracture Mechanics,” Fatigue Fract. Eng. Mater. Struct., vol. 19, no.
4, pp. 427–439, avril 1996.
[64] M. Kamaya and T. Haruna, “Influence of local stress on initiation behavior of stress
corrosion cracking for sensitized 304 stainless steel,” Corros. Sci., vol. 49, no. 8, pp.
3303–3324, août 2007.
[65] M. Kamaya and M. Itakura, “Simulation for intergranular stress corrosion cracking based
on a three-dimensional polycrystalline model,” Eng. Fract. Mech., vol. 76, no. 3, pp.
386–401, février 2009.
[66] R. N. Parkins and P. M. Singh, “Stress Corrosion Crack Coalescence.,” Corrosion, vol.
46, no. 6, pp. 485–499, 1990.
[67] Anderson, Fracture Mechanics: Fundamentals and Applications , Third. CRC Press,
2005.
[68] M. Kamaya, “Influence of the Interaction on Stress Intensity Factor of Semielliptical
Surface Cracks,” J. Press. Vessel Technol., vol. 130, no. 1, p. 011406, 2008.
[69] M. Kamaya, E. Miyokawa, and M. Kikuchi, “Growth prediction of two interacting sur-
face cracks of dissimilar sizes,” Eng. Fract. Mech., vol. 77, no. 16, pp. 3120–3131, Nov.
2010.
[70] M. Kamaya, “A Crack Growth Evaluation Method for Interacting Multiple Cracks,”
JSME Int. J. Ser. A, vol. 46, no. 1, pp. 15–23, 2003.
[71] M. Kamaya, “Flaw proximity rules for parallel surface cracks based on elastic,elastic -
plastic fracture mechanics and limit load analyses,” Vancouver, Canada, 2006.
[72] P. L. Andresen and F. P. Ford, “Life prediction by mechanistic modeling and system
monitoring of environmental cracking of iron and nickel alloys in aqueous systems,”
Mater. Sci. Eng. A, vol. 103, no. 1, pp. 167–184, 1988.
[73] L. Choudhary, D. D. Macdonald, and A. Alfantazi, “Role of Thiosulfate in the Corrosion
of Steels: A Review,” Corrosion, vol. 71, no. 9, pp. 1147–1168, Sep. 2015.
[74] S. Tsujikawa, A. Miyasaka, and M. Ueda, “Alternative for Evaluating Sour Gas Re-
sistance of Low-Alloy Steels and Corrosion-Resistant Alloys,” Corrosion, vol. 49, no.
5, pp. 409–419.
[75] R. Bandy, R. Roberge, and R. C. Newman, “Low temperature stress corrosion cracking
of Inconel 600 under two different conditions of sensitization,” Corros. Sci., vol. 23, no.
9, pp. 995–1006, 1983.
[76] W. Tsai, Z.-H. Lee, J.-T. Lee, M.-C. Tsai, and Ping-Holo, “Pitting and stress corrosion
cracking behaviour of INCONEL 600 alloy in thiosulphate solution,” Mater. Sci. Eng.
A, vol. 118, pp. 121–129, Oct. 1989.
[77] M. Gomez-Duran and D. D. Macdonald, “Stress corrosion cracking of sensitized Type
304 stainless steel in thiosulfate solution: I. Fate of the coupling current,” Corros. Sci.,
vol. 45, no. 7, pp. 1455–1471, Jul. 2003.
[78] G. H. Kelsall and I. Thompson, “Redox chemistry of H2S oxidation in the British Gas
Stretford Process Part I: Thermodynamics of sulphur-water systems at 298 K,” J. Appl.
Electrochem., vol. 23, no. 4, pp. 279–286, 1993.
Cette thèse est accessible à l'adresse : http://theses.insa-lyon.fr/publication/2017LYSEI059/these.pdf © [J. Bolivar], [2017], INSA Lyon, tous droits réservés

References
José Bolivar 266
Thèse en Sciences des Matériaux / 2017
Institut national des sciences appliquées de Lyon
[79] G. S. Was and V. B. Rajan, “The mechanism of intergranular cracking of Ni-Cr-Fe alloys
in sodium tetrathionate,” Metall. Trans. A, vol. 18, no. 7, pp. 1313–1323, Jul. 1987.
[80] R. C. Newman, K. Sieradzki, and H. S. Isaacs, “Stress-corrosion cracking of sensitized
type 304 stainless steel in thiosulfate solutions,” Metall. Trans. A, vol. 13, no. 11, pp.
2015–2026, 1982.
[81] G. Cragnolino and D. D. Macdonald, “Intergranular stress corrosion cracking of austen-
itic stainless steel at temperatures below 100 C a review,” Corrosion, vol. 38, no. 8, pp.
406–424, 1982.
[82] P. G. Caceres, B. Ralph, G. C. Allen, and R. K. Wild, “Sensitization of inconel 600. I.
Scanning auger and optical microscopy,” Philos. Mag. A, vol. 59, no. 6, pp. 1119–1136,
Jun. 1989.
[83] J. J. Kai, C. H. Tsai, and G. P. Yu, “The IGSCC, sensitization, and microstructure study
of Alloys 600 and 690,” Nucl. Eng. Des., vol. 144, no. 3, pp. 449–457, Nov. 1993.
[84] J. J. Kai, C. H. Tsai, T. A. Huang, and M. N. Liu, “The effects of heat treatment on the
sensitization and SCC behavior of INCONEL 600 alloy,” Metall. Trans. A, vol. 20, no.
6, pp. 1077–1088, Jun. 1989.
[85] M. J. Fox and R. D. McCright, “Overview of low temperature sensitization,” Lawrence
Livermore National Lab., CA (United States), 1983.
[86] W. D. Callister and D. G. Rethwisch, Materials science and engineering: an introduc-
tion, 8th ed. Hoboken, NJ: John Wiley & Sons, 2010.
[87] W.-T. Tsai, M.-J. Sheu, and J.-T. Lee, “The stress corrosion crack growth rate in sensi-
tized alloy 600 in thiosulfate solution,” Corros. Sci., vol. 38, no. 1, pp. 33–45, Jan. 1996.
[88] D. B. Wells, J. Stewart, R. Davidson, P. M. Scott, and D. E. Williams, “The mechanism
of intergranular stress corrosion cracking of sensitised austenitic stainless steel in dilute
thiosulphate solution,” Corros. Sci., vol. 33, no. 1, pp. 39–71, 1992.
[89] C.-O. . Olsson and D. Landolt, “Passive films on stainless steels—chemistry, structure
and growth,” Electrochimica Acta, vol. 48, no. 9, pp. 1093–1104, Apr. 2003.
[90] Z. Gao et al., “Passivity degradation of nuclear materials in reduced sulfur environments:
A review,” Trans. Tianjin Univ., vol. 22, no. 3, pp. 189–201, Jun. 2016.
[91] S. S. Hsu, S. C. Tsai, J. J. Kai, and C. H. Tsai, “SCC behavior and anodic dissolution of
Inconel 600 in low concentration thiosulfate,” J. Nucl. Mater., vol. 184, no. 2, pp. 97–
106, Sep. 1991.
[92] G. S. Was, Fundamentals of Radiation Materials Science: Metals and Alloys , 2nd Edi-
tion. Springer, 2017.
[93] G. Schmitt, “Effect of elemental sulfur on corrosion in sour gas systems,” Corrosion,
vol. 47, no. 4, pp. 285–308, 1991.
[94] J. Oudar and P. Marcus, “Role of adsorbed sulphur in the dissolution and passivation of
nickel and nickel-sulphur alloys,” Appl. Surf. Sci., vol. 3, no. 1, pp. 48–67, 1979.
[95] M. Gomez-Duran and D. D. Macdonald, “Stress corrosion cracking of sensitized Type
304 stainless steel in thiosulphate solution. II. Dynamics of fracture,” Corros. Sci., vol.
48, no. 7, pp. 1608–1622, Jul. 2006.
[96] K. Hosoya, K. Yamamoto, and N. Kagawa, “IGSCC Susceptibility of Austenitic Stain-
less Steels in Acidified K2S4O6 Solutions New Polythionic Acid SCC Test Solution,”
Corrosion engineering, vol. 34, no. 10, 1985.
[97] I. Matsushima, “An Electrochemical Study on Stress Corrosion Cracking of Stainless
Steels in Polythionic Acid Environment,” Corrosion engineering digest, vol. 22, no. 4,
pp. 141–147, 1973.
Cette thèse est accessible à l'adresse : http://theses.insa-lyon.fr/publication/2017LYSEI059/these.pdf © [J. Bolivar], [2017], INSA Lyon, tous droits réservés

References
José Bolivar 267
Thèse en Sciences des Matériaux / 2017
Institut national des sciences appliquées de Lyon
[98] ASTM E1681-03, “Standard Test Method for Determining Threshold Stress Intensity
Factor for Environment-Assisted Cracking of Metallic Materials,” ASTM International,
West Conshohocken, PA, 2013.
[99] H. Schreier, J.-J. Orteu, and M. A. Sutton, Image Correlation for Shape, Motion and
Deformation Measurements. Boston, MA: Springer US, 2009.
[100] B. Pan, K. Qian, H. Xie, and A. Asundi, “Two-dimensional digital image correlation
for in-plane displacement and strain measurement: a review,” Meas. Sci. Technol., vol.
20, no. 6, p. 062001, Jun. 2009.
[101] G. Crammond, S. W. Boyd, and J. M. Dulieu-Barton, “Speckle pattern quality assess-
ment for digital image correlation,” Opt. Lasers Eng., vol. 51, no. 12, pp. 1368–1378,
décembre 2013.
[102] J. S. Lyons, J. Liu, and M. A. Sutton, “High-temperature deformation measurements
using digital-image correlation,” Exp. Mech., vol. 36, no. 1, pp. 64–70, 1996.
[103] J. Li, A. Lau, and A. S. L. Fok, “Application of digital image correlation to full-field
measurement of shrinkage strain of dental composites,” J. Zhejiang Univ. Sci. A, vol.
14, no. 1, pp. 1–10, Jan. 2013.
[104] P. SMIGIELSKI, “Holographie optique Interférométrie holographique,” Tech. Ing. Mét-
rologie Opt. Photonique, vol. TIB143DUO., no. r6330, 2010.
[105] P. SMIGIELSKI, “Interférométrie de speckle,” Tech. Ing. CND Méthodes Surfaciques,
vol. TIB586DUO., no. r6331, 2010.
[106] P. K. Rastogi, Ed., Photomechanics. Berlin ; New York: Springer, 2000.
[107] M. L. L. Wijerathne, K. Oguni, and M. Hori, “Stress field tomography based on 3D
photoelasticity,” J. Mech. Phys. Solids, vol. 56, no. 3, pp. 1065–1085, Mar. 2008.
[108] B. M. B. Grant, H. J. Stone, P. J. Withers, and M. Preuss, “High-temperature strain field
measurement using digital image correlation,” J. Strain Anal. Eng. Des., vol. 44, no. 4,
pp. 263–271, May 2009.
[109] E. Durif, M. Fregonese, J. Réthoré, A. Combescure, and C. Alemany-Dumont, “Meth-
odology for a mechano-electrochemical evaluation of the coupling at the crack tip. Ap-
plication of halide-induced Stress Corrosion Cracking of Zircaloy-4,” Corros. Sci., vol.
93, pp. 39–47, avril 2015.
[110] L. Chevalier, S. Calloch, F. Hild, and Y. Marco, “Digital image correlation used to
analyze the multiaxial behavior of rubber-like materials,” ArXiv Prepr. Physics0511148,
2005.
[111] D. Choi, J. L. Thorpe, and R. B. Hanna, “Image analysis to measure strain in wood and
paper,” Wood Sci. Technol., vol. 25, no. 4, pp. 251–262, 1991.
[112] J. Réthoré, S. Roux, and F. Hild, “Optimal and noise-robust extraction of Fracture Me-
chanics parameters from kinematic measurements,” Eng. Fract. Mech., vol. 78, no. 9,
pp. 1827–1845, Jun. 2011.
[113] S. Roux, J. Réthoré, and F. Hild, “Digital image correlation and fracture: an advanced
technique for estimating stress intensity factors of 2D and 3D cracks,” J. Phys. Appl.
Phys., vol. 42, no. 21, p. 214004, Nov. 2009.
[114] J. A. Duff and T. J. Marrow, “In-situ observations of intergranular stress corrosion
cracking,” in ASME 2008 Pressure Vessels and Piping Conference, 2008, pp. 847–854.
[115] D. S. Dawicke and M. A. Sutton, “CTOA and crack-tunneling measurements in thin
sheet 2024-T3 aluminum alloy,” Exp. Mech., vol. 34, no. 4, pp. 357–368, 1994.
[116] J. Réthoré, A. Gravouil, F. Morestin, and A. Combescure, “Estimation of mixed-mode
stress intensity factors using digital image correlation and an interaction integral,” Int.
J. Fract., vol. 132, no. 1, pp. 65–79, Mar. 2005.
Cette thèse est accessible à l'adresse : http://theses.insa-lyon.fr/publication/2017LYSEI059/these.pdf © [J. Bolivar], [2017], INSA Lyon, tous droits réservés

References
José Bolivar 268
Thèse en Sciences des Matériaux / 2017
Institut national des sciences appliquées de Lyon
[117] S. Roux and F. Hild, “Stress intensity factor measurements from digital image correla-
tion: post-processing and integrated approaches,” Int. J. Fract., vol. 140, no. 1–4, pp.
141–157, Jul. 2006.
[118] F. Hild and S. Roux, “Digital image correlation: from displacement measurement to
identification of elastic properties–a review,” Strain, vol. 42, no. 2, pp. 69–80, 2006.
[119] G. Besnard, F. Hild, and S. Roux, “‘Finite-Element’ Displacement Fields Analysis from
Digital Images: Application to Portevin–Le Châtelier Bands,” Exp. Mech., vol. 46, no.
6, pp. 789–803, Dec. 2006.
[120] J. Réthoré, J.-P. Tinnes, S. Roux, J.-Y. Buffière, and F. Hild, “Extended three-dimen-
sional digital image correlation (X3D-DIC),” Comptes Rendus Mécanique, vol. 336, no.
8, pp. 643–649, août 2008.
[121] J. Réthoré, F. Hild, and S. Roux, “Extended digital image correlation with crack shape
optimization,” Int. J. Numer. Methods Eng., vol. 73, no. 2, pp. 248–272, Jan. 2008.
[122] J. Lachambre, “Développement d’une Méthode de Caractérisation 3D des Fissures de
Fatigue à l’aide de la Corrélation d’Images Numériques obtenues par Tomographie X,”
INSA de Lyon, 2014.
[123] B. K. Horn and B. G. Schunck, “Determining optical flow,” Artif. Intell., vol. 17, no.
1–3, pp. 185–203, 1981.
[124] J. Lachambre, J. Réthoré, A. Weck, and J.-Y. Buffiere, “Extraction of stress intensity
factors for 3D small fatigue cracks using digital volume correlation and X-ray tomogra-
phy,” Int. J. Fatigue, vol. 71, pp. 3–10, Feb. 2015.
[125] S. Rahimi, D. l. Engelberg, J. a. Duff, and T. j. Marrow, “In situ observation of inter-
granular crack nucleation in a grain boundary controlled austenitic stainless steel,” J.
Microsc., vol. 233, no. 3, pp. 423–431, Mar. 2009.
[126] A. Stratulat, J. A. Duff, and T. J. Marrow, “Grain boundary structure and intergranular
stress corrosion crack initiation in high temperature water of a thermally sensitised aus-
tenitic stainless steel, observed in situ,” Corros. Sci., vol. 85, pp. 428–435, août 2014.
[127] A. B. Cook, J. Duff, N. Stevens, S. Lyon, A. Sherry, and J. Marrow, “Preliminary Eval-
uation of Digital Image Correlation for In-situ Observation of Low Temperature Atmos-
pheric-Induced Chloride Stress Corrosion Cracking in Austenitic Stainless Steels,”
2010, pp. 119–132.
[128] J. A. Duff and T. J. Marrow, “In situ observation of short fatigue crack propagat ion in
oxygenated water at elevated temperature and pressure,” Corros. Sci., vol. 68, pp. 34–
43, Mar. 2013.
[129] J. Kovac, C. Alaux, T. J. Marrow, E. Govekar, and A. Legat, “Correlations of electro-
chemical noise, acoustic emission and complementary monitoring techniques during in-
tergranular stress-corrosion cracking of austenitic stainless steel,” Corros. Sci., vol. 52,
no. 6, pp. 2015–2025, Jun. 2010.
[130] C. B. Scruby, “An introduction to acoustic emission,” J. Phys. [E], vol. 20, no. 8, p.
946, Aug. 1987.
[131] S. Yuyama, “Fundamental Aspects of Acoustic Emission Applications to the Problems
Caused by Corrosion,” presented at the Corrosion Monitoring in Industrial Plants Using
Nondestructive Testing and Electrochemical Methods, Philadelphia, 1986, vol. ASTM
STP 908, pp. 43–74.
[132] R. Van Nieuwenhove and R. W. Bosch, “Acoustic emission detection during stress cor-
rosion cracking at elevated pressure and temperature,” J. Acoust. Emiss., vol. 18, pp.
293–298, 2001.
Cette thèse est accessible à l'adresse : http://theses.insa-lyon.fr/publication/2017LYSEI059/these.pdf © [J. Bolivar], [2017], INSA Lyon, tous droits réservés

References
José Bolivar 269
Thèse en Sciences des Matériaux / 2017
Institut national des sciences appliquées de Lyon
[133] J. Kovač, M. Leban, and A. Legat, “An attempt to detect SCC by combined measure-
ments of electrochemical noise and acoustic emission,” Mater. Corros., vol. 58, no. 12,
pp. 970–976, Dec. 2007.
[134] H. Shaikh et al., “Evaluation of stress corrosion cracking phenomenon in an AISI type
316LN stainless steel using acoustic emission technique,” Corros. Sci., vol. 49, no. 2,
pp. 740–765, Feb. 2007.
[135] J. Kovač, A. Legat, B. Zajec, T. Kosec, and E. Govekar, “Detection and characterization
of stainless steel SCC by the analysis of crack related acoustic emission,” Ultrasonics,
vol. 62, pp. 312–322, Sep. 2015.
[136] R. C. Newman and K. Sieradzki, “Correlation of acoustic and electrochemical noise in
the stress-corrosion cracking of α-brass,” Scr. Metall., vol. 17, no. 5, pp. 621–624, mai
1983.
[137] M. G. Alvarez, P. Lapitz, and J. Ruzzante, “AE response of type 304 stainless steel
during stress corrosion crack propagation,” Corros. Sci., vol. 50, no. 12, pp. 3382–3388,
Dec. 2008.
[138] M. G. Alvarez, P. Lapitz, and J. Ruzzante, “Analysis of acoustic emission signals gen-
erated from SCC propagation,” Corros. Sci., vol. 55, pp. 5–9, Feb. 2012.
[139] R. H. Jones, M. A. Friesel, and W. W. Gerberich, “Acoustic emission from integranular
subcritical crack growth,” Metall. Trans. A, vol. 20, no. 4, pp. 637–648, 1989.
[140] R. H. Jones and M. A. Friesel, “Acoustic emission during pitting and transgranular crack
initiation in type 304 stainless steel,” Corrosion, vol. 48, no. 9, pp. 751–758, 1992.
[141] A. Yonezu, R. Kusano, and X. Chen, “On the mechanism of intergranular stress corro-
sion cracking of sensitized stainless steel in tetrathionate solution,” J. Mater. Sci., vol.
48, no. 6, pp. 2447–2453, Mar. 2013.
[142] A. Yonezu, H. Cho, and M. Takemoto, “Detection of Stress Corrosion Cracking of Type
304 Stainless Steel Using Acoustic Emission and Corrosion Potential Fluctuation,” Adv.
Mater. Res., vol. 13–14, pp. 243–250, 2006.
[143] W. Zhang, L. Dunbar, and D. Tice, “Monitoring of stress corrosion cracking of sensi-
tised 304H stainless steel in nuclear applications by electrochemical methods and acous-
tic emission,” Energy Mater., vol. 3, no. 2, pp. 59–71, Jun. 2008.
[144] G. Du, J. Li, W. K. Wang, C. Jiang, and S. Z. Song, “Detection and characterization of
stress-corrosion cracking on 304 stainless steel by electrochemical noise and acoustic
emission techniques,” Corros. Sci., vol. 53, no. 9, pp. 2918–2926, Sep. 2011.
[145] M. Leban, Ž. Bajt, and A. Legat, “Detection and differentiation between cracking pro-
cesses based on electrochemical and mechanical measuremen ts,” Electrochimica Acta,
vol. 49, no. 17–18, pp. 2795–2801, juillet 2004.
[146] C. Gabrielli, F. Huet, M. Keddam, and R. Oltra, “A review of the probabilistic aspects
of localized corrosion,” Corrosion, vol. 46, no. 4, pp. 266–278, 1990.
[147] P. R. Roberge, “Analysis of spontaneous electrochemical noise for corrosion studies,”
J. Appl. Electrochem., vol. 23, no. 12, pp. 1223–1231, 1993.
[148] Iverson, “Transient Voltage Changes Produced in Corroding Metals and Alloys,” 1970.
[149] R. A. Cottis and S. Turgoose, “Electrochemical Noise Measurements - A Theoretical
Basis,” Mater. Sci. Forum, vol. 192–194, pp. 663–672, 1995.
[150] K. Hladky and J. L. Dawson, “The measurement of localized corrosion using electro-
chemical noise,” Corros. Sci., vol. 21, no. 4, pp. 317–322, 1981.
[151] S. Turgoose and R. A. Cottis, Corrosion Testing Made Easy: Electrochemical Imped-
ance and Noise. Houston TX.: NACE International, 2000.
Cette thèse est accessible à l'adresse : http://theses.insa-lyon.fr/publication/2017LYSEI059/these.pdf © [J. Bolivar], [2017], INSA Lyon, tous droits réservés

References
José Bolivar 270
Thèse en Sciences des Matériaux / 2017
Institut national des sciences appliquées de Lyon
[152] P. C. Searson and J. L. Dawson, “Analysis of Electrochemical Noise Generated by Cor-
roding Electrodes under Open-Circuit Conditions,” J. Electrochem. Soc., vol. 135, no.
8, pp. 1908–1915, 1988.
[153] C. D. Motschenbache and F. C. Fitchen, Low-Noise Electronic Design. New York: J.
Wiley & Sons, 1973.
[154] J. B. Johnson, “Thermal agitation of electricity in conductors,” Phys. Rev., vol. 32, no.
1, p. 97, 1928.
[155] H. Nyquist, “Thermal agitation of electric charge in conductors,” Phys. Rev., vol. 32,
no. 1, p. 110, 1928.
[156] U. Bertocci and F. Huet, “Noise analysis applied to electrochemical systems,” Corro-
sion, vol. 51, no. 2, pp. 131–144, 1995.
[157] W. Schottky, “Über spontane Stromschwankungen in verschiedenen Elektrizitätslei-
tern,” Ann. Phys., vol. 362, no. 23, pp. 541–567, 1918.
[158] J. M. Sanchez-Amaya, R. A. Cottis, and F. J. Botana, “Shot noise and statistical param-
eters for the estimation of corrosion mechanisms,” Corros. Sci., vol. 47, no. 12, pp.
3280–3299, Dec. 2005.
[159] L. Marton and C. Marton, Advances in electronics and electron physics. Vol. 49, 1979
Vol. 49, 1979. New York, N.Y.: Academic Press, 1979.
[160] R. A. Cottis, “Sources of electrochemical noise in corroding systems,” Russ. J. Electro-
chem., vol. 42, no. 5, pp. 497–505, May 2006.
[161] U. Bertocci and J. Kruger, “Studies of passive film breakdown by detection and analysis
of electrochemical noise,” Surf. Sci., vol. 101, no. 1–3, pp. 608–618, 1980.
[162] G. S. Frankel and L. Stocker, “Metastable pitting of stainless steel,” Corrosion, vol. 43,
no. 7, pp. 425–429, 1987.
[163] H. Isaacs, “The localized breakdown and repair of passive surfaces during pitting,” Cor-
rosion Science, vol. 29, pp. 313–326, 1989.
[164] C. Gabrielli, F. Huet, M. Keddam, and A. Sahar, “Investigation of water electrolysis by
spectral analysis. I. Influence of the current density,” J. Appl. Electrochem., vol. 19, no.
5, pp. 683–696, 1989.
[165] A. Benzaıd, F. Huet, M. Jérôme, F. Wenger, C. Gabrielli, and J. Galland, “Electrochem-
ical noise analysis of cathodically polarised AISI 4140 steel. I. Characterisation of hy-
drogen evolution on vertical unstressed electrodes,” Electrochimica Acta, vol. 47, no.
27, pp. 4315–4323, 2002.
[166] U. Bertocci and F. Huet, “Noise resistance applied to corrosion measurements III. In-
fluence of the instrumental noise on the measurements,” J. Electrochem. Soc., vol. 144,
no. 8, pp. 2786–2793, 1997.
[167] P. Marcus and F. Mansfeld, Eds., Analytical methods in corrosion science and engi-
neering. Boca Raton: CRC Press, 2006.
[168] D. A. Eden, K. Hladky, D. G. John, and J. L. Dawson, “EN - simultaneous monitoring
of potential and current noise signals from corroding electrodes,” no. 274, pp. 1–9, 1986.
[169] A. Bautista, U. Bertocci, and F. Huet, “Noise Resistance Applied to Corrosion Meas-
urements: V. Influence of Electrode Asymmetry,” J. Electrochem. Soc., vol. 148, no. 10,
p. B412, 2001.
[170] M. Leban, V. Doleček, and A. Legat, “Electrochemical noise during non-stationary cor-
rosion processes,” Mater. Corros., vol. 52, no. 6, pp. 418–425, juin 2001.
[171] V. Madisetti and D. Williams, Digital signal processing handbook on CD-ROM. CRC
Press, 1999.
Cette thèse est accessible à l'adresse : http://theses.insa-lyon.fr/publication/2017LYSEI059/these.pdf © [J. Bolivar], [2017], INSA Lyon, tous droits réservés

References
José Bolivar 271
Thèse en Sciences des Matériaux / 2017
Institut national des sciences appliquées de Lyon
[172] U. Bertocci, C. Gabrielli, F. Huet, and M. Keddam, “Noise resistance applied to corro-
sion measurements I. theoretical analysis,” J. Electrochem. Soc., vol. 144, no. 1, pp. 31–
37, 1997.
[173] F. Mansfeld and H. Xiao, “Electrochemical noise analysis of iron exposed to NaCl so-
lutions of different corrosivity,” J. Electrochem. Soc., vol. 140, no. 8, pp. 2205–2209,
1993.
[174] H. A. . Al-Mazeedi and R. . Cottis, “A practical evaluation of electrochemical noise
parameters as indicators of corrosion type,” Electrochimica Acta, vol. 49, no. 17–18, pp.
2787–2793, Jul. 2004.
[175] C. Cuevas-Arteaga and J. Porcayo-Calderón, “Electrochemical noise analysis in the fre-
quency domain and determination of corrosion rates for SS-304 stainless steel,” Mater.
Sci. Eng. A, vol. 435–436, pp. 439–446, Nov. 2006.
[176] S. Girija, U. K. Mudali, H. S. Khatak, and B. Raj, “The application of electrochemical
noise resistance to evaluate the corrosion resistance of AISI type 304 SS in nitric acid,”
Corros. Sci., vol. 49, no. 11, pp. 4051–4068, Nov. 2007.
[177] U. Bertocci, J. Frydman, C. Gabrielli, F. Huet, and M. Keddam, “Analysis of Electro-
chemical Noise by Power Spectral Density Applied to Corrosion Studies Maximum En-
tropy Method or Fast Fourier Transform?,” J. Electrochem. Soc., vol. 145, no. 8, pp.
2780–2786, 1998.
[178] U. Bertocci, F. Huet, B. Jaoul, and P. Rousseau, “Frequency analysis of transients in
electrochemical noise: mathematical relationships and computer simulations,” Corro-
sion, vol. 56, no. 7, pp. 675–683, 2000.
[179] S. Girija, U. K. Mudali, V. R. Raju, R. K. Dayal, H. S. Khatak, and B. Raj, “Determi-
nation of corrosion types for AISI type 304L stainless steel using electrochemical noise
method,” Mater. Sci. Eng. A, vol. 407, no. 1–2, pp. 188–195, Oct. 2005.
[180] C. C. Lee and F. Mansfeld, “Analysis of electrochemical noise data for a passive system
in the frequency domain,” Corros. Sci., vol. 40, no. 6, pp. 959–962, juin 1998.
[181] T. Anita, M. G. Pujar, H. Shaikh, R. K. Dayal, and H. S. Khatak, “Assessment of stress
corrosion crack initiation and propagation in AISI type 316 stainless steel by electro-
chemical noise technique,” Corros. Sci., vol. 48, no. 9, pp. 2689–2710, Sep. 2006.
[182] Y. Tan, “Sensing localised corrosion by means of electrochemical noise detection and
analysis,” Sens. Actuators B Chem., vol. 139, no. 2, pp. 688–698, Jun. 2009.
[183] R. A. Cottis and C. A. Loto, “Electrochemical Noise Generation during Stress Corrosion
Cracking,” Mater. Sci. Forum, vol. 8, pp. 201–214, 1986.
[184] C. A. Loto and R. A. Cottis, “Electrochemical noise generation during stress corrosion
cracking of alpha-brass,” Corrosion, vol. 43, no. 8, pp. 499–504, 1987.
[185] C. A. Loto and R. A. Cottis, “Electrochemical noise generation during stress corrosion
cracking of the high-strength aluminum AA 7075-T6 alloy,” Corrosion, vol. 45, no. 2,
pp. 136–141, 1989.
[186] R. A. Cottis, “Electrochemical Noise Generation during SCC of a High -Stregth carbon
steel,” Corrosion, vol. 46, no. 1, pp. 12–19, 1990.
[187] M. Leban, V. Dolecek, and A. Legat, “Comparative analysis of electrochemical noise
generated during stress corrosion cracking of AISI 304 stainless steel,” Corrosion, vol.
56, no. 9, pp. 921–927, 2000.
[188] Y. Watanabe and T. Kondo, “Current and potential fluctuation characteristics in inter-
granular stress corrosion cracking processes of stainless steels,” Corrosion, vol. 56, no.
12, pp. 1250–1255, 2000.
Cette thèse est accessible à l'adresse : http://theses.insa-lyon.fr/publication/2017LYSEI059/these.pdf © [J. Bolivar], [2017], INSA Lyon, tous droits réservés

References
José Bolivar 272
Thèse en Sciences des Matériaux / 2017
Institut national des sciences appliquées de Lyon
[189] C. R. Arganis-Juarez, J. M. Malo, and J. Uruchurtu, “Electrochemical noise measure-
ments of stainless steel in high temperature water,” Nucl. Eng. Des., vol. 237, no. 24,
pp. 2283–2291, décembre 2007.
[190] J. Stewart, D. B. Wells, P. M. Scott, and D. E. Williams, “Electrochemical Noise meas-
urements of stress corrosion cracking of sensitised austenitic stainless steel in high -pu-
rity oxygenated water at 288°C,” Corrosion Science, vol. 33, pp. 73–88, 1992.
[191] M. Breimesser, S. Ritter, H.-P. Seifert, T. Suter, and S. Virtanen, “Application of elec-
trochemical noise to monitor stress corrosion cracking of stainless steel in tetrathionate
solution under constant load,” Corros. Sci., vol. 63, pp. 129–139, Oct. 2012.
[192] M. Breimesser, S. Ritter, H.-P. Seifert, S. Virtanen, and T. Suter, “Application of the
electrochemical microcapillary technique to study intergranular stress corrosion crack-
ing of austenitic stainless steel on the micrometre scale,” Corros. Sci., vol. 55, pp. 126–
132, février 2012.
[193] L. Calabrese, L. Bonaccorsi, M. Galeano, E. Proverbio, D. Di Pietro, and F. Cappuccini,
“Identification of damage evolution during SCC on 17-4 PH stainless steel by combining
electrochemical noise and acoustic emission techniques,” Corros. Sci., vol. 98, pp. 573–
584, Sep. 2015.
[194] S. Ritter and H.-P. Seifert, “Detection of SCC initiation in austenitic stainless steel by
electrochemical noise measurements,” Mater. Corros., vol. 64, no. 8, pp. 683–690, août
2013.
[195] A. Aballe and F. Huet, “Noise Resistance Applied to Corrosion Measurements: VI. Par-
tition of the Current Fluctuations Between the Electrodes,” J. Electrochem. Soc., vol.
149, no. 3, pp. B89–B96, Mar. 2002.
[196] R. A. Cottis, “Interpretation of electrochemical noise data,” Corrosion, vol. 57, no. 3,
pp. 265–285, 2001.
[197] M.-C. Tsai, W.-T. Tsai, and J.-T. Lee, “The effect of heat treatment and applied poten-
tial on the stress corrosion cracking of alloy 600 in thiosulfate solution,” Corros. Sci.,
vol. 34, no. 5, pp. 741–757, mai 1993.
[198] J. M. Park, W. S. Ryu, and Y. H. Kang, “DSC study on carbide precipitation reaction in
Inconel 600,” J. Nucl. Mater., vol. 209, no. 3, pp. 221–225, mai 1994.
[199] J. J. Kai, G. P. Yu, C. H. Tsai, M. N. Liu, and S. C. Yao, “The effects of heat treatment
on the chromium depletion, precipitate evolution, and corrosion resistance of INCONEL
alloy 690,” Metall. Trans. A, vol. 20, no. 10, pp. 2057–2067, Oct. 1989.
[200] M.-K. Ahn, H.-S. Kwon, and J.-H. Lee, “Predicting susceptibility of alloy 600 to inter-
granular stress corrosion cracking using a modified electrochemical potentiokinetic re-
activation test,” Corrosion, vol. 51, no. 6, pp. 441–449, 1995.
[201] S. Rahimi, D. L. Engelberg, and T. J. Marrow, “A new approach for DL-EPR testing of
thermo-mechanically processed austenitic stainless steel,” Corros. Sci., vol. 53, no. 12,
pp. 4213–4222, Dec. 2011.
[202] P. Walker and W. H. Tarn, Eds., CRC handbook of metal etchants. Boca Raton: CRC
Press, 1991.
[203] ASTM G39, “Standard Practice for Preparation and Use of Bent-Beam Stress-Corrosion
Test Specimens,” ASTM International, West Conshohocken, PA, 2016.
[204] S. Müller, “Réalisation d’éprouvettes modèles multi-entaillées permettant la caracteri-
sation 3D de fissures par tomographie X in-situ,” INSA de Lyon, PFE, 2014.
[205] G. P. Sabol and R. Stickler, “Microstructure of Nickel-Based Superalloys,” Phys. Status
Solidi B, vol. 35, no. 1, pp. 11–52, Jan. 1969.
[206] D. A. Douglas and J. R. Weir, “The recrystallization and grain growth of Inconel,” Oak
Ridge National Laboratory, ORNL-2406, 1958.
Cette thèse est accessible à l'adresse : http://theses.insa-lyon.fr/publication/2017LYSEI059/these.pdf © [J. Bolivar], [2017], INSA Lyon, tous droits réservés
References
José Bolivar 273
Thèse en Sciences des Matériaux / 2017
Institut national des sciences appliquées de Lyon
[207] G. S. Was, H. H. Tischner, and R. M. Latanision, “The influence of thermal treatment
on the chemistry and structure of grain boundaries in Inconel 600,” Metall. Trans. A,
vol. 12, no. 8, pp. 1397–1408, 1981.
[208] K. Takizawa, “Effect of Austenite Grain Size on Stress Corrosion Cracking Behavior
of 25Cr-6Ni-2Mo Duplex Stainless Steel,” Tetsu-to-Hagane, vol. 69, no. 7, pp. 829–836,
1983.
[209] J. J. Ritter and J. Kruger, “Passive films, surface structure and stress corrosion and
crevice suceptibility,” 1980.
[210] M. Kamaya and T. Haruna, “Crack initiation model for sensitized 304 stainless steel in
high temperature water,” Corros. Sci., vol. 48, no. 9, pp. 2442–2456, Sep. 2006.
[211] J. Kovač, M. Leban, and A. Legat, “An attempt to detect SCC by combined measure-
ments of electrochemical noise and acoustic emission,” Mater. Corros., vol. 58, no. 12,
pp. 970–976, Dec. 2007.
[212] J. E. Hack and G. R. Leverant, “On the prediction of the surface crack opening displace-
ment of a part through crack,” Int. J. Fract., vol. 16, no. 1, pp. R15–R18, Feb. 1980.
[213] J. Xu, X. Wu, and E.-H. Han, “Acoustic emission response of sensitized 304 stainless
steel during intergranular corrosion and stress corrosion cracking,” Corros. Sci., vol. 73,
pp. 262–273, août 2013.
[214] S. Gourdin, L. Doremus, Y. Nadot, G. Hénaff, and S. Pierret, “Fatigue crack growth
from handling surface anomalies in a nickel based superalloy at high temperature,”
MATEC Web Conf., vol. 14, p. 16003, 2014.
[215] S. Dezecot et al., “In situ 3D characterization of high temperature fatigue damage mech-
anisms in a cast aluminum alloy using synchrotron X-ray tomography,” Scr. Mater., vol.
113, pp. 254–258, Mar. 2016.
[216] S. Zhou, M. Lukaszewicz, and A. Turnbull, “Small and short crack growth and the so-
lution-conductivity dependent electrochemical crack size effect,” Corros. Sci., vol. 97,
pp. 25–37, août 2015.
[217] I. S. Raju and J. C. Newman Jr., “Stress-intensity factors for a wide range of semi-
elliptical surface cracks in finite-thickness plates,” Eng. Fract. Mech., vol. 11, no. 4, pp.
817–829, 1979.
[218] J.-Y. Buffiere, E. Maire, J. Adrien, J.-P. Masse, and E. Boller, “In Situ Experiments
with X ray Tomography: an Attractive Tool for,” Exp. Mech., vol. 50, no. 3, pp. 289–
305, Jan. 2010.
[219] A. King et al., “Tomography and imaging at the PSICHE beam line of the SOLEIL
synchrotron,” Rev. Sci. Instrum., vol. 87, no. 9, p. 093704, Sep. 2016.
[220] L. Salvo et al., “X-ray micro-tomography an attractive characterisation technique in
materials science,” Nucl. Instrum. Methods Phys. Res. Sect. B Beam Interact. Mater. At. ,
vol. 200, pp. 273–286, 2003.
[221] P. Cloetens et al., “Observation of microstructure and damage in materials by phase
sensitive radiography and tomography,” J. Appl. Phys., vol. 81, no. 9, pp. 5878–5886,
May 1997.
[222] H. Toda et al., “Assessment of the fatigue crack closure phenomenon in damage-tolerant
aluminium alloy by in-situ high-resolution synchrotron X-ray microtomography,”
Philos. Mag., vol. 83, no. 21, pp. 2429–2448, Jul. 2003.
[223] M. Gates, J. Lambros, and M. T. Heath, “Towards High Performance Digital Volume
Correlation,” Exp. Mech., vol. 51, no. 4, pp. 491–507, Apr. 2011.
[224] T. J. Marrow et al., High-resolution, in-situ, tomographic observations of stress corro-
sion cracking. Elsevier, New York, 2005.
Cette thèse est accessible à l'adresse : http://theses.insa-lyon.fr/publication/2017LYSEI059/these.pdf © [J. Bolivar], [2017], INSA Lyon, tous droits réservés

References
José Bolivar 274
Thèse en Sciences des Matériaux / 2017
Institut national des sciences appliquées de Lyon
[225] L. K. Zhu, Y. Yan, J. X. Li, L. J. Qiao, and A. A. Volinsky, “Stress corrosion cracking
under low stress: Continuous or discontinuous cracks?,” Corros. Sci., vol. 80, pp. 350–
358, Mar. 2014.
[226] L. J. Qiao, K. W. Gao, A. A. Volinsky, and X. Y. Li, “Discontinuous surface cracks
during stress corrosion cracking of stainless steel single crystal,” Corros. Sci., vol. 53,
no. 11, pp. 3509–3514, Nov. 2011.
[227] T. L. Burnett, N. J. H. Holroyd, G. M. Scamans, X. Zhou, G. E. Thompson, and P. J.
Withers, “The role of crack branching in stress corrosion cracking of aluminium alloys,”
Corros. Rev., vol. 33, no. 6, Jan. 2015.
[228] P. J. Withers, “Fracture mechanics by three-dimensional crack-tip synchrotron X-ray
microscopy,” Philos. Trans. R. Soc. Math. Phys. Eng. Sci. , vol. 373, no. 2036, pp.
20130157–20130157, Jan. 2015.
[229] B. K. Bay, “Methods and applications of digital volume correlation,” J. Strain Anal.
Eng. Des., vol. 43, no. 8, pp. 745–760, Aug. 2008.
[230] N. Lenoir, M. Bornert, J. Desrues, P. Bésuelle, and G. Viggiani, “Volumetric digital
image correlation applied to X-ray microtomography images from triaxial compression
tests on argillaceous rock,” Strain, vol. 43, no. 3, pp. 193–205, 2007.
[231] U. Bertocci, C. Gabrielli, F. Huet, and M. Keddam, “Noise resistance applied to corro-
sion measurements II Experimental test,” J. Electrochem. Soc., vol. 144, no. 1, pp. 31–
37, 1997.
[232] A. Bautista and F. Huet, “Noise resistance applied to corrosion measurements: IV.
Asymmetric coated electrodes,” J. Electrochem. Soc., vol. 146, no. 5, pp. 1730–1736,
1999.
[233] S. Ritter, F. Huet, and R. A. Cottis, “Guideline for an assessment of electrochemical
noise measurement devices,” Mater. Corros., vol. 63, no. 4, pp. 297–302, avril 2012.
[234] R.-W. Bosch et al., “Reliability of electrochemical noise measurements: Results of
round-robin testing on electrochemical noise,” Electrochimica Acta, vol. 120, pp. 379–
389, 2014.
[235] F. Huet, “EN measurements with a GAMRY Ref 600 and ESA 410 software,” presented
at the 4th annual ECG-COMON meeting, Cadiz, Spain, 15-Jun-2008.
[236] A. Aballe, R. C. Newman, and R. A. Cottis, “Electrochemical noise study of stress cor-
rosion cracking of sensitized 304 H in thiosulfate,” Corrosion, no. 03403, 2003.
[237] T. T. Nguyen, J. Yvonnet, Q.-Z. Zhu, M. Bornert, and C. Chateau, “A phase field
method to simulate crack nucleation and propagation in strongly heterogeneous materi-
als from direct imaging of their microstructure,” Eng. Fract. Mech., vol. 139, pp. 18–39,
May 2015.
[238] T.-T. Nguyen, J. Bolivar, J. Réthoré, M.-C. Baietto, and M. Fregonese, “A phase field
method for modeling stress corrosion crack propagation in a nickel base alloy,” Int. J.
Solids Struct., vol. 112, pp. 65–82, May 2017.
[239] T. Couvant et al., “Effect of chlorides and sulfates on the EAC of austenitic stainless
steel in PWR environment,” Corros. Issues Light Water React. Corros. Crack. Eur. Fed.
Corros. Publ., no. 51, 2007.
[240] T. Terachi, T. Yamada, T. Miyamoto, and K. Arioka, “SCC growth behaviors of aus-
tenitic stainless steels in simulated PWR primary water,” J. Nucl. Mater., vol. 426, no.
1–3, pp. 59–70, Jul. 2012.
[241] S. Cissé, L. Laffont, B. Tanguy, M.-C. Lafont, and E. Andrieu, “Effect of surface prep-
aration on the corrosion of austenitic stainless steel 304L in high temperature steam and
simulated PWR primary water,” Corros. Sci., vol. 56, pp. 209–216, Mar. 2012.
Cette thèse est accessible à l'adresse : http://theses.insa-lyon.fr/publication/2017LYSEI059/these.pdf © [J. Bolivar], [2017], INSA Lyon, tous droits réservés

References
José Bolivar 275
Thèse en Sciences des Matériaux / 2017
Institut national des sciences appliquées de Lyon
[242] S. W. Smith, The scientist and engineer’s guide to digital signal processing . San Diego
(Calif.): California Technical Pub., 1999.
[243] I. N. Bastos, F. Huet, R. P. Nogueira, and P. Rousseau, “Influence of Aliasing in Time
and Frequency Electrochemical Noise Measurements,” J. Electrochem. Soc., vol. 147,
no. 2, pp. 671–677, Feb. 2000.
[244] U. Bertocci, F. Huet, R. P. Nogueira, and P. Rousseau, “Drift removal procedures in the
analysis of electrochemical noise,” Corrosion, vol. 58, no. 4, pp. 337–347, 2002.
[245] F. Mansfeld, Z. Sun, C. H. Hsu, and A. Nagiub, “Concerning trend removal in electro-
chemical noise measurements,” Corros. Sci., vol. 43, no. 2, pp. 341–352, février 2001.
[246] J. Réthoré and R. Estevez, “Identification of a cohesive zone model from digital images
at the micron-scale,” J. Mech. Phys. Solids, vol. 61, no. 6, pp. 1407–1420, juin 2013.
[247] J. Réthoré, “Automatic crack tip detection and stress intensity factors estimation of
curved cracks from digital images: automatic crack tip detection and SIF estimation of
curved cracks,” Int. J. Numer. Methods Eng., vol. 103, no. 7, pp. 516–534, Aug. 2015.
[248] M. L. Williams, “On the Stress Distribution at the Base of a Stationary Crack,” Journal
of Applied Mechanics, vol. 24, no. 1, pp. 109–114, 1956.
Cette thèse est accessible à l'adresse : http://theses.insa-lyon.fr/publication/2017LYSEI059/these.pdf © [J. Bolivar], [2017], INSA Lyon, tous droits réservés

FOLIO ADMINISTRATIF
THESE DE L’UNIVERSITE DE LYON OPEREE AU SEIN DE L’INSA LYON
NOM : BOLIVAR DATE de SOUTENANCE : le 07 juillet 2017 Prénoms : José TITRE : EXPERIMENTAL STUDY OF THE BEHAVIOR OF COLONIES OF ENVIRONMENTALY-ASSISTED SHORT CRACKS BY DIGITAL IMAGE CORRELATION, ACOUSTIC EMISSION AND ELECTROCHEMICAL NOISE NATURE : Doctorat Numéro d'ordre : 2017LYSEI059 Ecole doctorale : ED Matériaux Spécialité : Matériaux RESUME : Ce travail s'inscrit dans le contexte d'une meilleure prédiction de la durée de vie de structures soumises au risque d'amorçage et de propagation de fissures multiples de corrosion sous contrainte (CSC). Ainsi, en développant une méthodologie expérimentale originale basée sur des mesures conjointes de corrélation d'images numériques (DIC), d'émission acoustique (EA) et de bruit électrochimique (EN), et leur analyse, ce travail vise à contribuer à l'amélioration de la compréhension des mécanismes impliqués dans le développement de colonies de fissures courtes de CSC qui interagissent entre elles, et à la simulation du comportement de cette colonie. Le choix de conditions optimales de traitement thermique d'un alliage base-Ni et de pH d'une solution de polythionate, a permis la maitrise des paramètres géométriques et morphologiques de colonies de fissures intergranulaires, qui ont été investiguées par DIC grâce à l'optimisation d'une préparation de surface adaptée. Les différentes phases de propagation d'une fissure unique et d'une colonie de fissures ont été identifiées, de même que les mécanismes associés, par des expérimentations et analyses réalisées en 2D et en 3D. Cette approche expérimentale innovante a permis de poser les bases d'une approche numérique puis de la valider. Un focus particulier a été porté sur l'EN au travers d'une analyse critique des perturbations engendrées par le bruit de l'instrumentation et par l'asymétrie du système d'étude. Les limitations de la technique pour son application à l'étude quantitative de la corrosion sous contrainte ont été évaluées sur la base des résultats de l'étude. Une transposition de la démarche expérimentale à hautes pressions et températures est proposée comme perspective à court terme de ce travail, qui permet également d'envisager la prise en compte de différents modes de propagation des fissures en lien avec la microstructure du matériau dans l'approche numérique. MOTS-CLÉS : Stress Corrosion Cracking, Digital Image Correlation, Acoustic Emission, Electrochemical Noise, Multiple cracking, X-ray tomography, cracks interactions, short crack. Laboratoire (s) de recherche : MATEIS – UMR CNRS 5510 – INSA de Lyon. 21 Avenue Jean Capelle. 69621 Villeurbanne Cedex (France) LAMCOS – UMR CNRS 5259 – INSA de Lyon. 27 Avenue Jean Capelle. 69621 Villeurbanne Cedex (France) Directeur de thèse: Marion FREGONESE (Professeur des Universités) et Julien RÉTHORÉ (Directeur de recherche CNRS) Président de jury : Krzysztof WOLSKI (Professeur des Universités, Examinateur) Composition du jury : Ricardo NOGUEIRA (Professeur des Universités, Rapporteur) Jean DESQUINES (Docteur HDR, Rapporteur) Krzysztof WOLSKI (Professeur des Universités, Examinateur) Marion FREGONESE (Professeur des Universités, Directrice de thèse) Julien RÉTHORÉ (Directeur de recherche CNRS, co-Directeur de thèse) Claude DURET-THUAL (Docteur, Invité) Pierre COMBRADE (Docteur, Invité)
Cette thèse est accessible à l'adresse : http://theses.insa-lyon.fr/publication/2017LYSEI059/these.pdf © [J. Bolivar], [2017], INSA Lyon, tous droits réservés