Test and Characterization of Some Zeolite Supported Gas ...
22
Test and Characterization of Some Zeolite Supported Gas Phase Desulfurization Sorbents by Charles Rong, Deryn Chu, and John Hopkins ARL-TR-4859 June 2009 Approved for public release; distribution unlimited.
-
Upload
khangminh22 -
Category
Documents
-
view
3 -
download
0
Transcript of Test and Characterization of Some Zeolite Supported Gas ...
Test and Characterization of Some Zeolite Supported Gas
Phase Desulfurization Sorbents
by Charles Rong, Deryn Chu, and John Hopkins
ARL-TR-4859 June 2009
Approved for public release; distribution unlimited.
NOTICES
Disclaimers The findings in this report are not to be construed as an official Department of the Army position unless so designated by other authorized documents. Citation of manufacturer’s or trade names does not constitute an official endorsement or approval of the use thereof. Destroy this report when it is no longer needed. Do not return it to the originator.
Army Research Laboratory Adelphi, MD 20783-1197
ARL-TR-4859 June 2009
Test and Characterization of Some Zeolite Supported Gas Phase Desulfurization Sorbents
Charles Rong, Deryn Chu, and John Hopkins Sensors and Electron Devices Directorate, ARL
Approved for public release; distribution unlimited.
ii
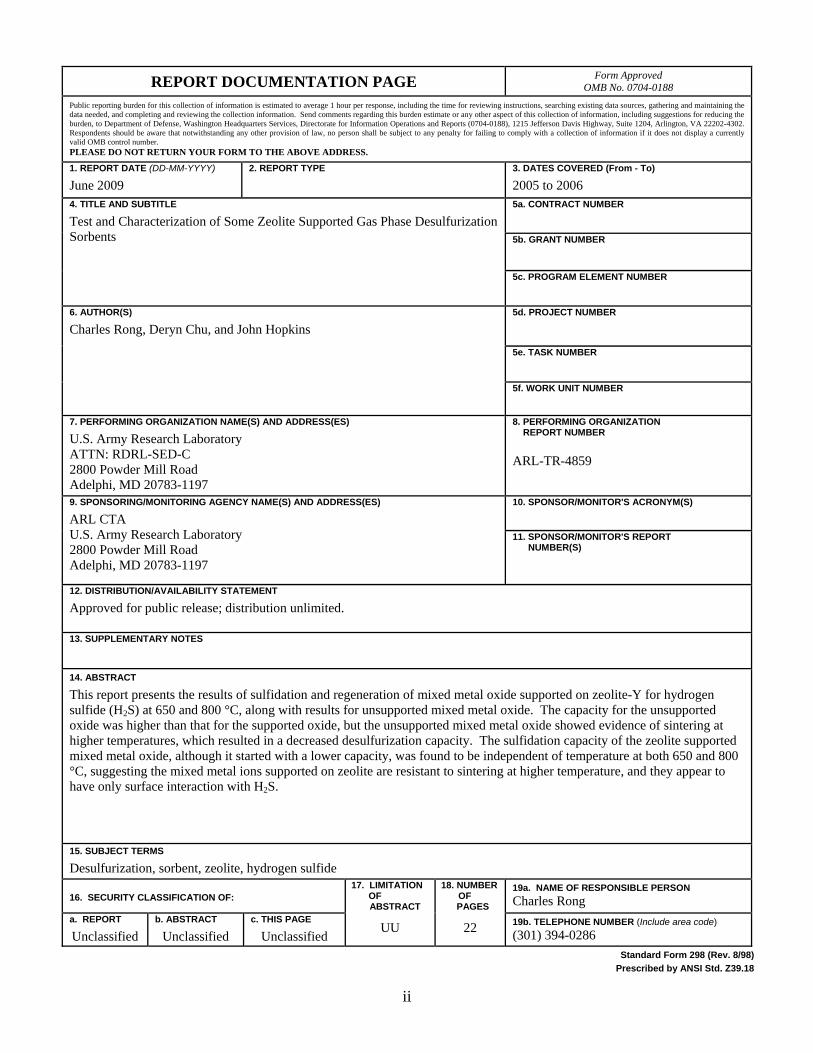
REPORT DOCUMENTATION PAGE Form Approved OMB No. 0704-0188
Public reporting burden for this collection of information is estimated to average 1 hour per response, including the time for reviewing instructions, searching existing data sources, gathering and maintaining the data needed, and completing and reviewing the collection information. Send comments regarding this burden estimate or any other aspect of this collection of information, including suggestions for reducing the burden, to Department of Defense, Washington Headquarters Services, Directorate for Information Operations and Reports (0704-0188), 1215 Jefferson Davis Highway, Suite 1204, Arlington, VA 22202-4302. Respondents should be aware that notwithstanding any other provision of law, no person shall be subject to any penalty for failing to comply with a collection of information if it does not display a currently valid OMB control number. PLEASE DO NOT RETURN YOUR FORM TO THE ABOVE ADDRESS.
1. REPORT DATE (DD-MM-YYYY)
June 2009 2. REPORT TYPE
3. DATES COVERED (From - To)
2005 to 2006 5a. CONTRACT NUMBER
5b. GRANT NUMBER
4. TITLE AND SUBTITLE
Test and Characterization of Some Zeolite Supported Gas Phase Desulfurization Sorbents
5c. PROGRAM ELEMENT NUMBER
5d. PROJECT NUMBER
5e. TASK NUMBER
6. AUTHOR(S)
Charles Rong, Deryn Chu, and John Hopkins
5f. WORK UNIT NUMBER
7. PERFORMING ORGANIZATION NAME(S) AND ADDRESS(ES)
U.S. Army Research Laboratory ATTN: RDRL-SED-C 2800 Powder Mill Road Adelphi, MD 20783-1197
8. PERFORMING ORGANIZATION REPORT NUMBER
ARL-TR-4859
10. SPONSOR/MONITOR'S ACRONYM(S)
9. SPONSORING/MONITORING AGENCY NAME(S) AND ADDRESS(ES)
ARL CTA U.S. Army Research Laboratory 2800 Powder Mill Road Adelphi, MD 20783-1197
11. SPONSOR/MONITOR'S REPORT NUMBER(S)
12. DISTRIBUTION/AVAILABILITY STATEMENT
Approved for public release; distribution unlimited.
13. SUPPLEMENTARY NOTES
14. ABSTRACT
This report presents the results of sulfidation and regeneration of mixed metal oxide supported on zeolite-Y for hydrogen sulfide (H2S) at 650 and 800 °C, along with results for unsupported mixed metal oxide. The capacity for the unsupported oxide was higher than that for the supported oxide, but the unsupported mixed metal oxide showed evidence of sintering at higher temperatures, which resulted in a decreased desulfurization capacity. The sulfidation capacity of the zeolite supported mixed metal oxide, although it started with a lower capacity, was found to be independent of temperature at both 650 and 800 °C, suggesting the mixed metal ions supported on zeolite are resistant to sintering at higher temperature, and they appear to have only surface interaction with H2S.
15. SUBJECT TERMS
Desulfurization, sorbent, zeolite, hydrogen sulfide
16. SECURITY CLASSIFICATION OF: 19a. NAME OF RESPONSIBLE PERSON
Charles Rong a. REPORT
Unclassified b. ABSTRACT
Unclassified c. THIS PAGE
Unclassified
17. LIMITATION OF
ABSTRACT
UU
18. NUMBER OF
PAGES
22 19b. TELEPHONE NUMBER (Include area code)
(301) 394-0286
Standard Form 298 (Rev. 8/98)
Prescribed by ANSI Std. Z39.18
iii
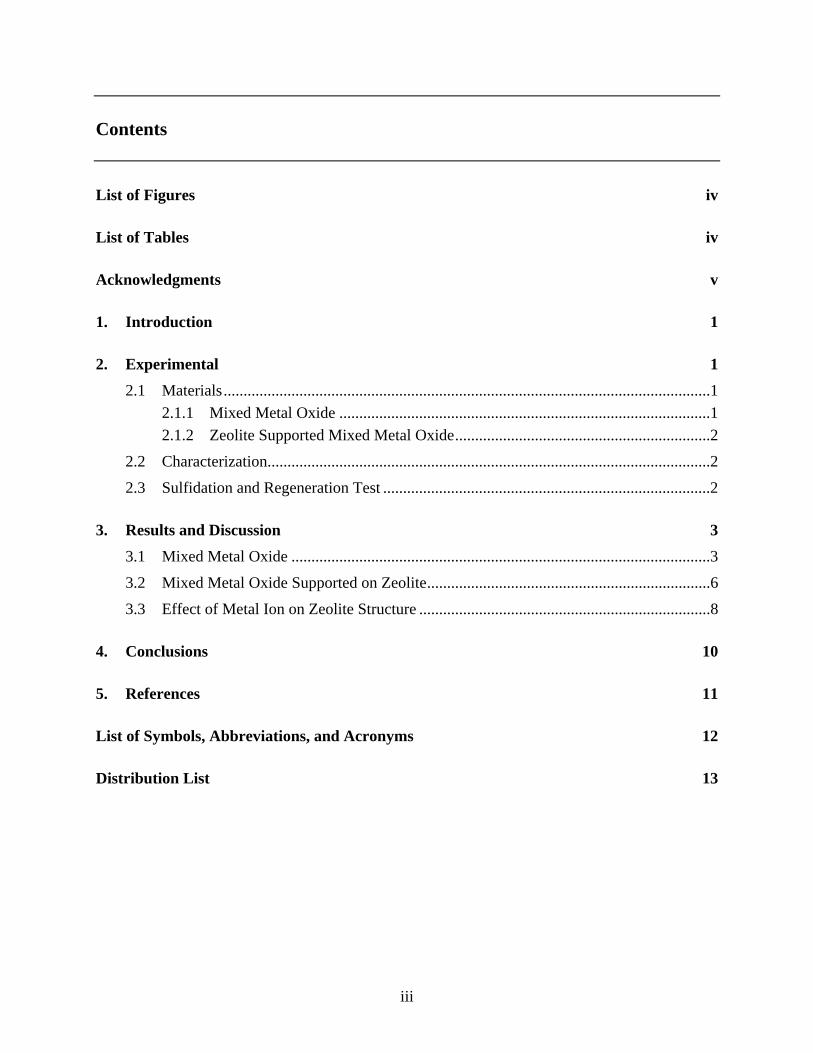
Contents
List of Figures iv
List of Tables iv
Acknowledgments v
1. Introduction 1
2. Experimental 1
2.1 Materials..........................................................................................................................1
2.1.1 Mixed Metal Oxide .............................................................................................1
2.1.2 Zeolite Supported Mixed Metal Oxide................................................................2
2.2 Characterization...............................................................................................................2
2.3 Sulfidation and Regeneration Test ..................................................................................2
3. Results and Discussion 3
3.1 Mixed Metal Oxide .........................................................................................................3
3.2 Mixed Metal Oxide Supported on Zeolite.......................................................................6
3.3 Effect of Metal Ion on Zeolite Structure .........................................................................8
4. Conclusions 10
5. References 11
List of Symbols, Abbreviations, and Acronyms 12
Distribution List 13
iv
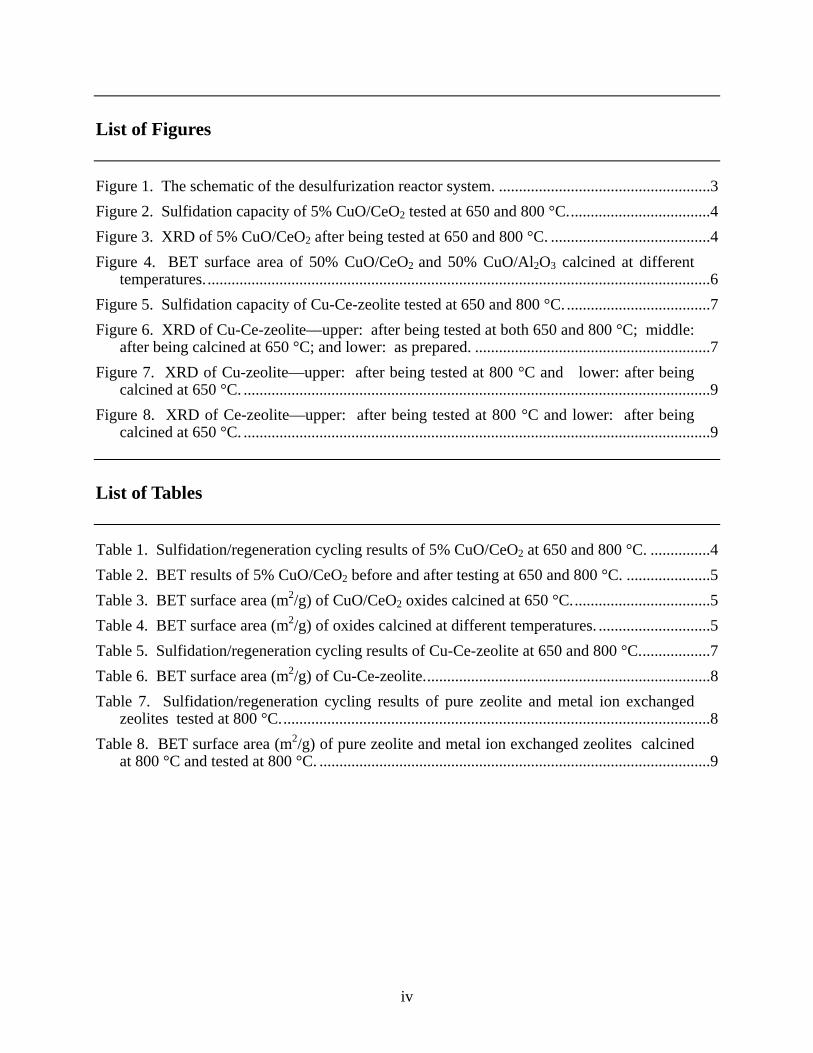
List of Figures
Figure 1. The schematic of the desulfurization reactor system. .....................................................3
Figure 2. Sulfidation capacity of 5% CuO/CeO2 tested at 650 and 800 °C....................................4
Figure 3. XRD of 5% CuO/CeO2 after being tested at 650 and 800 °C. ........................................4
Figure 4. BET surface area of 50% CuO/CeO2 and 50% CuO/Al2O3 calcined at different temperatures...............................................................................................................................6
Figure 5. Sulfidation capacity of Cu-Ce-zeolite tested at 650 and 800 °C. ....................................7
Figure 6. XRD of Cu-Ce-zeolite––upper: after being tested at both 650 and 800 °C; middle: after being calcined at 650 °C; and lower: as prepared. ...........................................................7
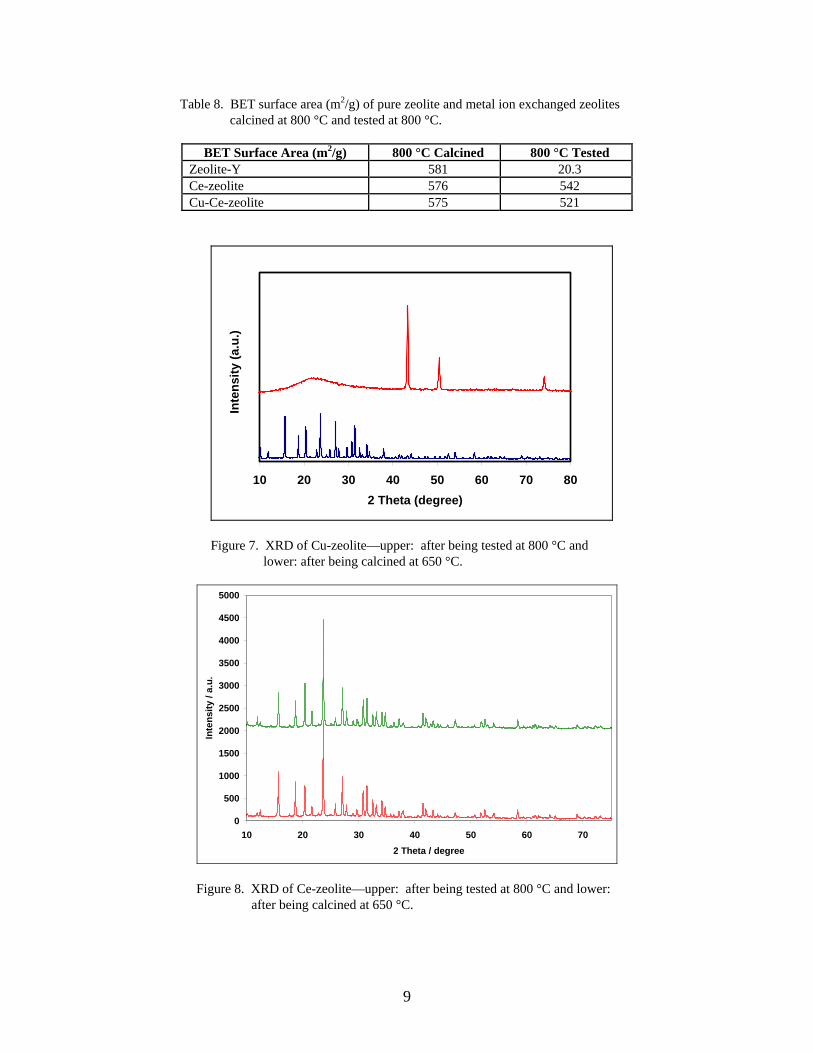
Figure 7. XRD of Cu-zeolite—upper: after being tested at 800 °C and lower: after being calcined at 650 °C. .....................................................................................................................9
Figure 8. XRD of Ce-zeolite—upper: after being tested at 800 °C and lower: after being calcined at 650 °C. .....................................................................................................................9
List of Tables
Table 1. Sulfidation/regeneration cycling results of 5% CuO/CeO2 at 650 and 800 °C. ...............4
Table 2. BET results of 5% CuO/CeO2 before and after testing at 650 and 800 °C. .....................5
Table 3. BET surface area (m2/g) of CuO/CeO2 oxides calcined at 650 °C...................................5
Table 4. BET surface area (m2/g) of oxides calcined at different temperatures. ............................5
Table 5. Sulfidation/regeneration cycling results of Cu-Ce-zeolite at 650 and 800 °C..................7
Table 6. BET surface area (m2/g) of Cu-Ce-zeolite........................................................................8
Table 7. Sulfidation/regeneration cycling results of pure zeolite and metal ion exchanged zeolites tested at 800 °C............................................................................................................8
Table 8. BET surface area (m2/g) of pure zeolite and metal ion exchanged zeolites calcined at 800 °C and tested at 800 °C. ..................................................................................................9
v
Acknowledgments
Part of the work was the result of a Collaborative Technology Alliance (CTA) staff rotation with the assistance provided by Tufts University. Zheng Wang, Mann Sakbodin, and Dr. Maria Flytzani-Stephanopoulos are gratefully acknowledged for their help with the sulfidation and regeneration measurements. We would also like to thank the U.S. Army Materiel Command for the support.
vi
INTENTIONALLY LEFT BLANK.

1
1. Introduction
The development of fuel cell technology and logistics fuel reformation technology for power generation in the battlefield has received much attention in the Science & Technology (S&T) community in recent years (1–5). One of the key issues to be understood and addressed is the desulfurization of logistics fuels such as JP-8, in which the sulfur content may be up to a few thousands ppm while commercial fuels contain less sulfur due to strict Environmental Protection Agency (EPA) requirements for low sulfur fuels. The sulfur contents in the logistics fuel must be reduced to a near zero level since fuel cells require a clean and essentially sulfur-free fuel stream for proper operation. The Army relies on JP-8 as a major logistics fuel; thus, the desulfurization of JP-8 becomes a unique problem to be solved for advanced energy conversion technology development. Technically, sulfur removal from the fuel can be achieved by either liquid phase desulfurization or gas phase desulfurization, and in most cases with high sulfur contents in the fuel, both of the liquid and gas phase processes may be required.
Advanced energy conversion technology includes components such as fuel reformation and solid oxide fuel cell (SOFC) development. SOFCs have the advantages of using a non-noble-metal catalyst and working at high temperatures, and they are more versatile, being able to run on different fuels, than polymer electrolyte membrane fuel cells. JP-8 reformation converts liquid hydrocarbon fuel to a gaseous reformate consisting of hydrogen, carbon monoxide, carbon dioxide, water, and some lower molecular weight hydrocarbon molecules such as methane. SOFCs can be fed with this gas mixture as a suitable fuel stream as long as it is sulfur free. From a system integration and heat management point of view, SOFCs should be coupled closely with the fuel reformer. Therefore, gas phase desulfurization should be accomplished at a temperature range of 600 to 800 ºC, the temperature at which both of the reformer and SOFC operate. Although the sulfur tolerance of the-state-of-the-art SOFC electrode material is improving, the gas phase desulfurization step at high temperature is still essential to SOFCs. Our report focuses on gas phase desulfurization at these high temperature conditions.
2. Experimental
2.1 Materials
2.1.1 Mixed Metal Oxide
The copper (Cu) and cerium (Ce) mixed metal oxide was prepared by hydrothermal synthesis and is described as follows. A 5% (in molar ratio) of copper to cerium (CuO/CeO2) was formed by reaction of copper nitrate (Cu(NO3)2), cerium nitrate (Ce(NO3)3), and potassium hydroxide
2
(KOH) in aqueous solution at 180 ºC for 48 h. The product was then filtered out and washed with water thoroughly. It was further calcined at 650 or 800 °C for 4 h before the corresponding sulfidation test.
2.1.2 Zeolite Supported Mixed Metal Oxide
The copper and cerium oxide incorporated in zeolite-Y was prepared by ion-exchange method as described:
• Cu-zeolite: 2 g of zeolite-Y was placed in 20 ml 0.5 M Cu(NO3)2 solution and stirred for 48 h at room temperature. It was then filtered out, washed with water, and dried at 110 ºC for 2 h.
• Ce-zeolite: 2 g of zeolite-Y was placed in 20 ml 0.5 M Ce(NO3)2 solution (with a few drops of HNO3 added) and stirred for 48 h at room temperature. It was then filtered out, washed with water, and dried at 110 ºC for 2 h.
• Cu-Ce-zeolite: 1 g of Cu-zeolite was placed in 20 ml 0.014 M of Ce(NO3)3 solution with 10–3 M HNO3, which is close to ¼ of the exchangeable site of the zeolite, and stirred overnight. It was filtered out, washed with water, and dried at 110 ºC for 2 h. The copper to cerium ratio on the zeolite support is expected to be larger than 0.05.
2.2 Characterization
The x-ray diffraction (XRD) results were obtained using a Rigaku Ultima III instrument with Cu Kα radiation with a Bragg-Brentano Configuration, and a Philips PW1840 X-ray Diffractometer with iron (Fe) Kα radiation. A Micromeritics ASAP 2010 instrument was used to measure the surface area of the samples.
2.3 Sulfidation and Regeneration Test
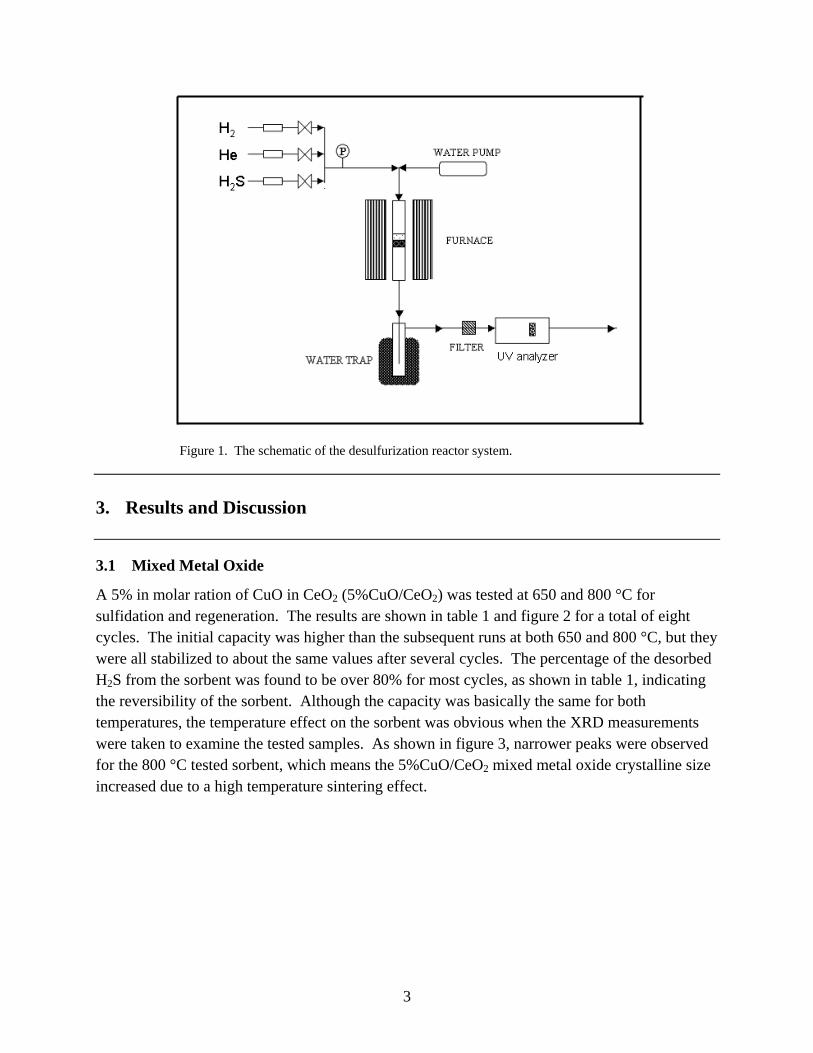
The sulfidation and regeneration test was carried out at Tufts University, a Collaborative Technology Alliance (CTA) Power and Energy consortium member of the Army, as part of a CTA staff rotation effort. The schematic of the reactor system is shown in figure 1. About 0.2 g of sorbent materials was used for the test. After the test, the material was recovered for further characterization. The sorbent was first subjected to pre-reduction under the conditions of 50%H2-10%H2O-balanced helium (He) for 1 h. Then it was subjected to sulfidation under the conditions of 0.1%H2S-50%H2-10%H2O-balanced He with a space velocity of 80,000/h. When the concentration of H2S in the stream after the reactor reached 30 ppm, which is the pre-defined breakthrough point, the reactor conditions were changed to regeneration mode of 50%H2-10%H2O-balanced He, space velocity 80,000/h. The sulfidation and regeneration test was conducted at two temperatures, 650 and 800 °C. The hydrogen sulfide (H2S) level in the exit gas was measured in real time using an AMETEK 922 UV Photometric Analyzer.
3
Figure 1. The schematic of the desulfurization reactor system.
3. Results and Discussion
3.1 Mixed Metal Oxide
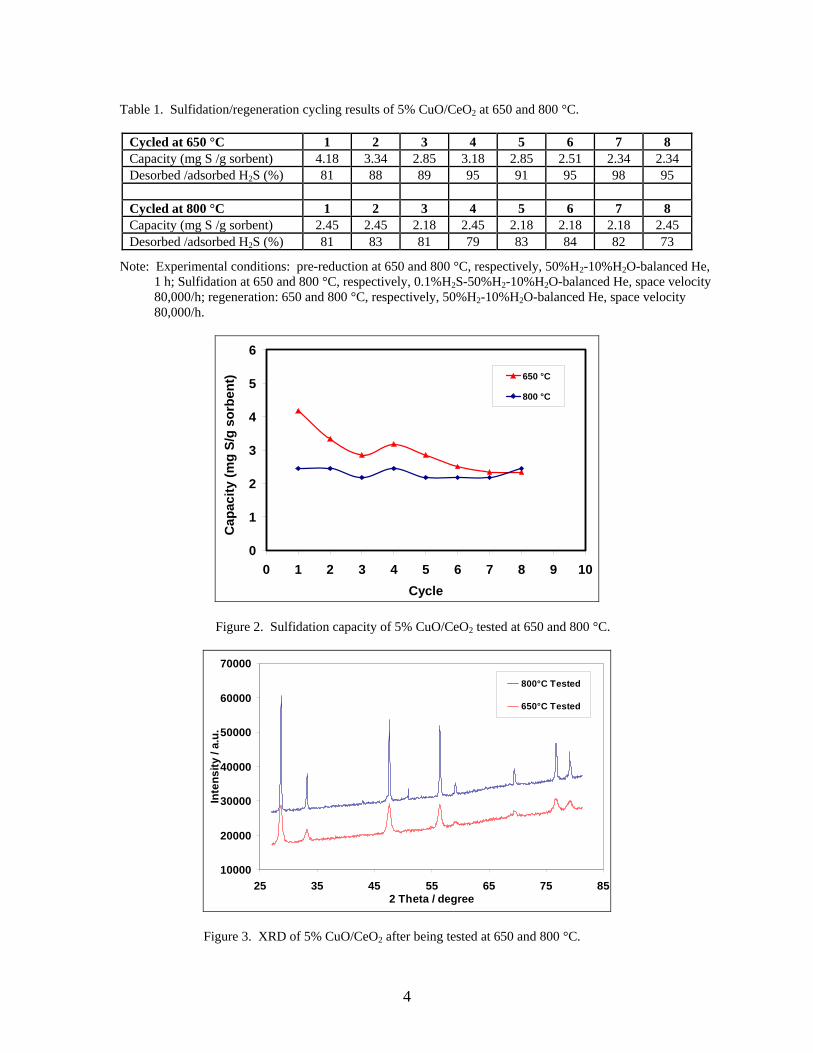
A 5% in molar ration of CuO in CeO2 (5%CuO/CeO2) was tested at 650 and 800 °C for sulfidation and regeneration. The results are shown in table 1 and figure 2 for a total of eight cycles. The initial capacity was higher than the subsequent runs at both 650 and 800 °C, but they were all stabilized to about the same values after several cycles. The percentage of the desorbed H2S from the sorbent was found to be over 80% for most cycles, as shown in table 1, indicating the reversibility of the sorbent. Although the capacity was basically the same for both temperatures, the temperature effect on the sorbent was obvious when the XRD measurements were taken to examine the tested samples. As shown in figure 3, narrower peaks were observed for the 800 °C tested sorbent, which means the 5%CuO/CeO2 mixed metal oxide crystalline size increased due to a high temperature sintering effect.
4
Table 1. Sulfidation/regeneration cycling results of 5% CuO/CeO2 at 650 and 800 °C.
Cycled at 650 °C 1 2 3 4 5 6 7 8 Capacity (mg S /g sorbent) 4.18 3.34 2.85 3.18 2.85 2.51 2.34 2.34 Desorbed /adsorbed H2S (%) 81 88 89 95 91 95 98 95 Cycled at 800 °C 1 2 3 4 5 6 7 8 Capacity (mg S /g sorbent) 2.45 2.45 2.18 2.45 2.18 2.18 2.18 2.45 Desorbed /adsorbed H2S (%) 81 83 81 79 83 84 82 73
Note: Experimental conditions: pre-reduction at 650 and 800 °C, respectively, 50%H2-10%H2O-balanced He, 1 h; Sulfidation at 650 and 800 °C, respectively, 0.1%H2S-50%H2-10%H2O-balanced He, space velocity 80,000/h; regeneration: 650 and 800 °C, respectively, 50%H2-10%H2O-balanced He, space velocity 80,000/h.
0
1
2
3
4
5
6
0 1 2 3 4 5 6 7 8 9 10
Cycle
Ca
pac
ity
(m
g S
/g s
orb
en
t) 650 °C
800 °C
Figure 2. Sulfidation capacity of 5% CuO/CeO2 tested at 650 and 800 °C.
10000
20000
30000
40000
50000
60000
70000
25 35 45 55 65 75 852 Theta / degree
Inte
ns
ity
/ a
.u.
800°C Tested
650°C Tested
Figure 3. XRD of 5% CuO/CeO2 after being tested at 650 and 800 °C.
5
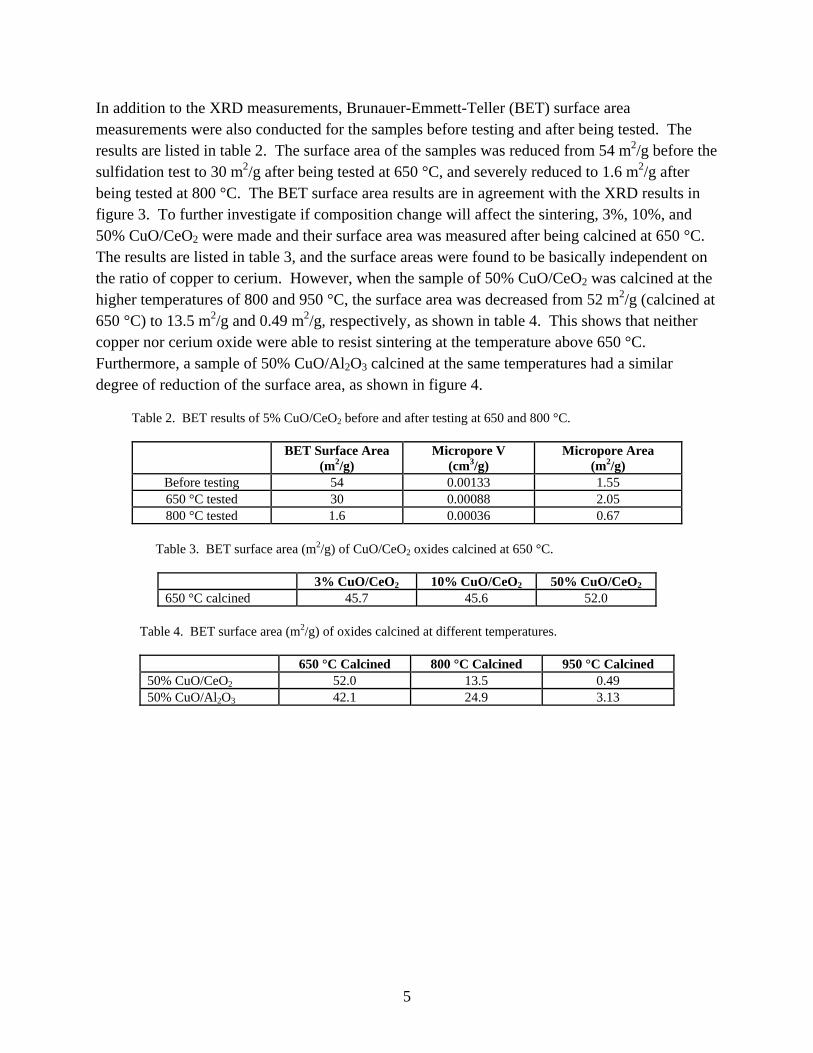
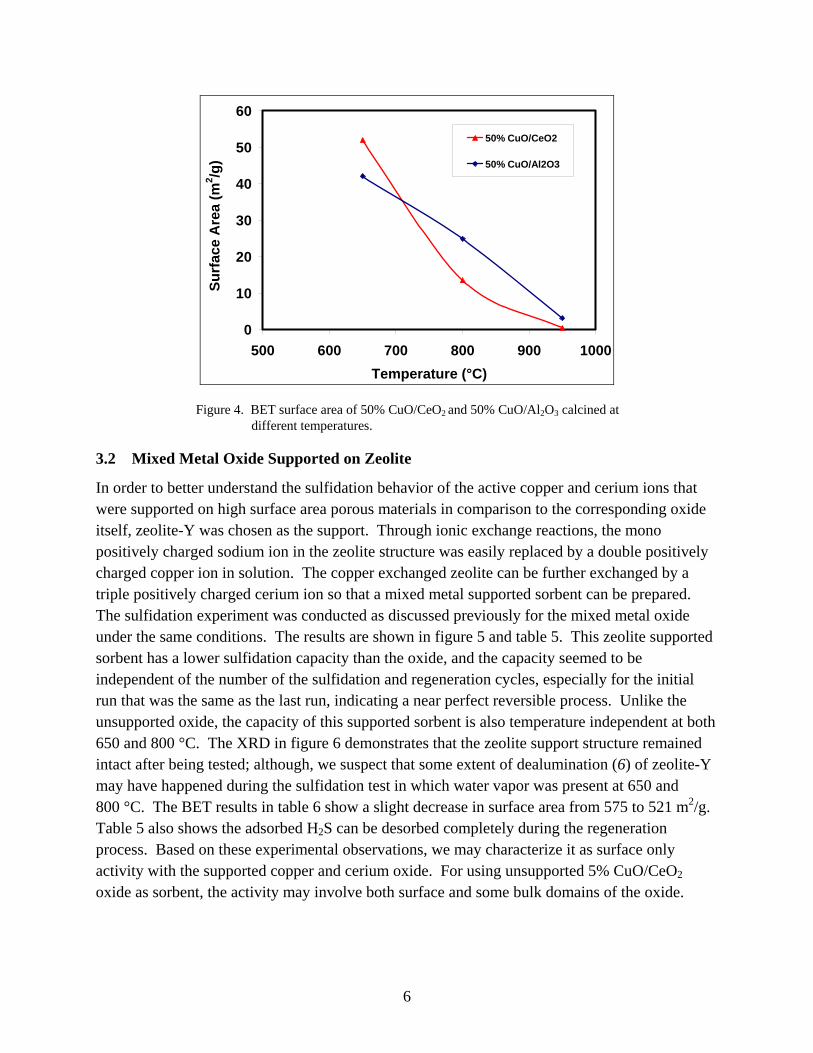
In addition to the XRD measurements, Brunauer-Emmett-Teller (BET) surface area measurements were also conducted for the samples before testing and after being tested. The results are listed in table 2. The surface area of the samples was reduced from 54 m2/g before the sulfidation test to 30 m2/g after being tested at 650 °C, and severely reduced to 1.6 m2/g after being tested at 800 °C. The BET surface area results are in agreement with the XRD results in figure 3. To further investigate if composition change will affect the sintering, 3%, 10%, and 50% CuO/CeO2 were made and their surface area was measured after being calcined at 650 °C. The results are listed in table 3, and the surface areas were found to be basically independent on the ratio of copper to cerium. However, when the sample of 50% CuO/CeO2 was calcined at the higher temperatures of 800 and 950 °C, the surface area was decreased from 52 m2/g (calcined at 650 °C) to 13.5 m2/g and 0.49 m2/g, respectively, as shown in table 4. This shows that neither copper nor cerium oxide were able to resist sintering at the temperature above 650 °C. Furthermore, a sample of 50% CuO/Al2O3 calcined at the same temperatures had a similar degree of reduction of the surface area, as shown in figure 4.
Table 2. BET results of 5% CuO/CeO2 before and after testing at 650 and 800 °C.
BET Surface Area (m2/g)
Micropore V (cm3/g)
Micropore Area (m2/g)
Before testing 54 0.00133 1.55 650 °C tested 30 0.00088 2.05 800 °C tested 1.6 0.00036 0.67
Table 3. BET surface area (m2/g) of CuO/CeO2 oxides calcined at 650 °C.
3% CuO/CeO2 10% CuO/CeO2 50% CuO/CeO2 650 °C calcined 45.7 45.6 52.0
Table 4. BET surface area (m2/g) of oxides calcined at different temperatures.
650 °C Calcined 800 °C Calcined 950 °C Calcined 50% CuO/CeO2 52.0 13.5 0.49 50% CuO/Al2O3 42.1 24.9 3.13
6
0
10
20
30
40
50
60
500 600 700 800 900 1000
Temperature (°C)
Su
rfac
e A
rea
(m
2/g
)
50% CuO/CeO2
50% CuO/Al2O3
Figure 4. BET surface area of 50% CuO/CeO2 and 50% CuO/Al2O3 calcined at different temperatures.
3.2 Mixed Metal Oxide Supported on Zeolite
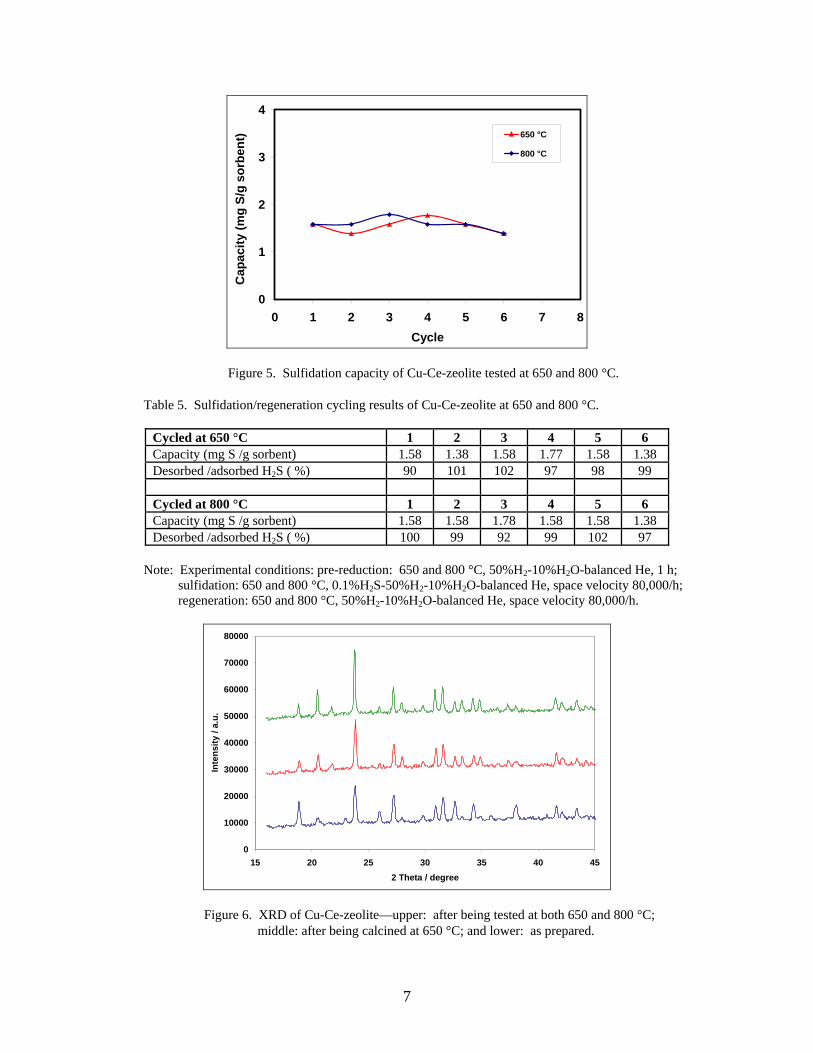
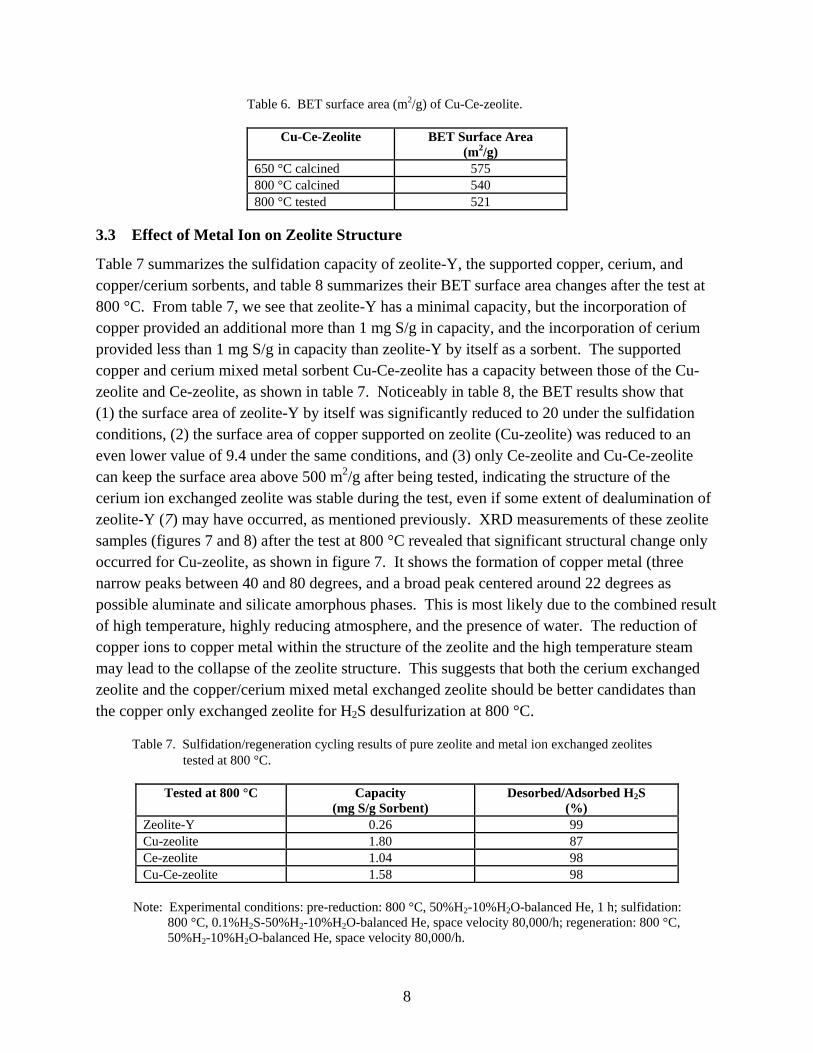
In order to better understand the sulfidation behavior of the active copper and cerium ions that were supported on high surface area porous materials in comparison to the corresponding oxide itself, zeolite-Y was chosen as the support. Through ionic exchange reactions, the mono positively charged sodium ion in the zeolite structure was easily replaced by a double positively charged copper ion in solution. The copper exchanged zeolite can be further exchanged by a triple positively charged cerium ion so that a mixed metal supported sorbent can be prepared. The sulfidation experiment was conducted as discussed previously for the mixed metal oxide under the same conditions. The results are shown in figure 5 and table 5. This zeolite supported sorbent has a lower sulfidation capacity than the oxide, and the capacity seemed to be independent of the number of the sulfidation and regeneration cycles, especially for the initial run that was the same as the last run, indicating a near perfect reversible process. Unlike the unsupported oxide, the capacity of this supported sorbent is also temperature independent at both 650 and 800 °C. The XRD in figure 6 demonstrates that the zeolite support structure remained intact after being tested; although, we suspect that some extent of dealumination (6) of zeolite-Y may have happened during the sulfidation test in which water vapor was present at 650 and 800 °C. The BET results in table 6 show a slight decrease in surface area from 575 to 521 m2/g. Table 5 also shows the adsorbed H2S can be desorbed completely during the regeneration process. Based on these experimental observations, we may characterize it as surface only activity with the supported copper and cerium oxide. For using unsupported 5% CuO/CeO2 oxide as sorbent, the activity may involve both surface and some bulk domains of the oxide.
7
0
1
2
3
4
0 1 2 3 4 5 6 7 8
Cycle
Ca
pa
city
(m
g S
/g s
orb
ent) 650 °C
800 °C
Figure 5. Sulfidation capacity of Cu-Ce-zeolite tested at 650 and 800 °C.
Table 5. Sulfidation/regeneration cycling results of Cu-Ce-zeolite at 650 and 800 °C.
Cycled at 650 °C 1 2 3 4 5 6 Capacity (mg S /g sorbent) 1.58 1.38 1.58 1.77 1.58 1.38 Desorbed /adsorbed H2S ( %) 90 101 102 97 98 99 Cycled at 800 °C 1 2 3 4 5 6 Capacity (mg S /g sorbent) 1.58 1.58 1.78 1.58 1.58 1.38 Desorbed /adsorbed H2S ( %) 100 99 92 99 102 97
Note: Experimental conditions: pre-reduction: 650 and 800 °C, 50%H2-10%H2O-balanced He, 1 h; sulfidation: 650 and 800 °C, 0.1%H2S-50%H2-10%H2O-balanced He, space velocity 80,000/h; regeneration: 650 and 800 °C, 50%H2-10%H2O-balanced He, space velocity 80,000/h.
0
10000
20000
30000
40000
50000
60000
70000
80000
15 20 25 30 35 40 45
2 Theta / degree
Inte
nsi
ty /
a.u
.
Figure 6. XRD of Cu-Ce-zeolite––upper: after being tested at both 650 and 800 °C; middle: after being calcined at 650 °C; and lower: as prepared.
8
Table 6. BET surface area (m2/g) of Cu-Ce-zeolite.
Cu-Ce-Zeolite BET Surface Area (m2/g)
650 °C calcined 575 800 °C calcined 540 800 °C tested 521
3.3 Effect of Metal Ion on Zeolite Structure
Table 7 summarizes the sulfidation capacity of zeolite-Y, the supported copper, cerium, and copper/cerium sorbents, and table 8 summarizes their BET surface area changes after the test at 800 °C. From table 7, we see that zeolite-Y has a minimal capacity, but the incorporation of copper provided an additional more than 1 mg S/g in capacity, and the incorporation of cerium provided less than 1 mg S/g in capacity than zeolite-Y by itself as a sorbent. The supported copper and cerium mixed metal sorbent Cu-Ce-zeolite has a capacity between those of the Cu-zeolite and Ce-zeolite, as shown in table 7. Noticeably in table 8, the BET results show that (1) the surface area of zeolite-Y by itself was significantly reduced to 20 under the sulfidation conditions, (2) the surface area of copper supported on zeolite (Cu-zeolite) was reduced to an even lower value of 9.4 under the same conditions, and (3) only Ce-zeolite and Cu-Ce-zeolite can keep the surface area above 500 m2/g after being tested, indicating the structure of the cerium ion exchanged zeolite was stable during the test, even if some extent of dealumination of zeolite-Y (7) may have occurred, as mentioned previously. XRD measurements of these zeolite samples (figures 7 and 8) after the test at 800 °C revealed that significant structural change only occurred for Cu-zeolite, as shown in figure 7. It shows the formation of copper metal (three narrow peaks between 40 and 80 degrees, and a broad peak centered around 22 degrees as possible aluminate and silicate amorphous phases. This is most likely due to the combined result of high temperature, highly reducing atmosphere, and the presence of water. The reduction of copper ions to copper metal within the structure of the zeolite and the high temperature steam may lead to the collapse of the zeolite structure. This suggests that both the cerium exchanged zeolite and the copper/cerium mixed metal exchanged zeolite should be better candidates than the copper only exchanged zeolite for H2S desulfurization at 800 °C.
Table 7. Sulfidation/regeneration cycling results of pure zeolite and metal ion exchanged zeolites tested at 800 °C.
Tested at 800 °C Capacity (mg S/g Sorbent)
Desorbed/Adsorbed H2S (%)
Zeolite-Y 0.26 99 Cu-zeolite 1.80 87 Ce-zeolite 1.04 98 Cu-Ce-zeolite 1.58 98
Note: Experimental conditions: pre-reduction: 800 °C, 50%H2-10%H2O-balanced He, 1 h; sulfidation: 800 °C, 0.1%H2S-50%H2-10%H2O-balanced He, space velocity 80,000/h; regeneration: 800 °C, 50%H2-10%H2O-balanced He, space velocity 80,000/h.
9
Table 8. BET surface area (m2/g) of pure zeolite and metal ion exchanged zeolites calcined at 800 °C and tested at 800 °C.
BET Surface Area (m2/g) 800 °C Calcined 800 °C Tested Zeolite-Y 581 20.3 Ce-zeolite 576 542 Cu-Ce-zeolite 575 521
10 20 30 40 50 60 70 80
2 Theta (degree)
Inte
nsi
ty (
a.u
.)
Figure 7. XRD of Cu-zeolite—upper: after being tested at 800 °C and lower: after being calcined at 650 °C.
0
500
1000
1500
2000
2500
3000
3500
4000
4500
5000
10 20 30 40 50 60 70
2 Theta / degree
Inte
nsi
ty /
a.u
.
Figure 8. XRD of Ce-zeolite—upper: after being tested at 800 °C and lower: after being calcined at 650 °C.
10
4. Conclusions
The overall sulfidation capacity of the mixed metal oxides was found to be higher than corresponding zeolite supported counterparts, but the mixed metal oxide also showed evidence of sintering at higher temperatures, which resulted in a decreased capacity. The sulfidation capacity of the zeolite supported mixed metal oxide, although started with a lower capacity, was found to be independent of the temperature at both 650 and 800 °C, suggesting the mixed metal ions supported on zeolite are resistant to the sintering at higher temperature. The experimental evidence confirmed that the mixed metal ions supported on zeolite have only surface interaction with H2S.
11
5. References
1. Flytzani-Stephanopoulos, M.; Sakbodin, M.; Wang, Z. Science 2006, 312, 1508–1510.
2. Yang, H. Y.; Cahela, D. R.; Tatarchuk, B. J. Chem. Eng. Sci. 2008, 63, 2707–2716.
3. Wang, X. X.; Ma, X. L.; Xu, X. C.; Sun, L.; Song, C. S. Top. Catal. 2008, 49, 108–117.
4. Wang, Y.; Yang, R. T.; Heinzel, J. M. Chem. Eng. Sci. 2008, 63, 356–365.
5. Huang, X. W.; King, D. A.; Zheng, F.; Stenkamp, V. S.; TeGrotenhuis, W. E.; Roberts, B. Q.; King, D. L. Catal. Today 2008, 136, 291–300.
6. Garcia, P.; Lima, E.; Aguilar, J.; Lara, V. Catal. Lett. 2009, 128, 385–391.
12
List of Symbols, Abbreviations, and Acronyms
BET Brunauer-Emmett-Teller
Ce cerium
Ce(NO3)3 cerium nitrate
CTA Collaborative Technology Alliance
Cu copper
Cu(NO3)2 copper nitrate
CuS copper sulfide
EPA Environmental Protection Agency
Fe iron
H2S hydrogen sulfide
He helium
KOH potassium hydroxide
S&T Science & Technology
Si elementary silicon
SOFCs solid oxide fuel cells
XRD x-ray diffraction
13
NO. OF COPIES ORGANIZATION 1 PDF ADMNSTR DEFNS TECHL INFO CTR ATTN DTIC OCP 8725 JOHN J KINGMAN RD STE 0944 FT BELVOIR VA 22060-6218 1 HC DARPA ATTN IXO S WELBY 3701 N FAIRFAX DR ARLINGTON VA 22203-1714 1 CD OFC OF THE SECY OF DEFNS ATTN ODDRE (R&AT) THE PENTAGON WASHINGTON DC 20301-3080 1 HC US ARMY RSRCH DEV AND ENGRG CMND ARMAMENT RSRCH DEV AND ENGRG CTR ARMAMENT ENGRG AND TECHNLGY CTR ATTN AMSRD AAR AEF T J MATTS BLDG 305 ABERDEEN PROVING GROUND MD 21005-5001 1 HC PM TIMS, PROFILER (MMS-P) AN/TMQ-52 ATTN B GRIFFIES BUILDING 563 FT MONMOUTH NJ 07703 1 HC US ARMY INFO SYS ENGRG CMND ATTN AMSEL IE TD F JENIA FT HUACHUCA AZ 85613-5300 1 HC COMMANDER US ARMY RDECOM ATTN AMSRD AMR W C MCCORKLE 5400 FOWLER RD REDSTONE ARSENAL AL 35898-5000 1 HC US GOVERNMENT PRINT OFF DEPOSITORY RECEIVING SECTION ATTN MAIL STOP IDAD J TATE 732 NORTH CAPITOL ST NW WASHINGTON DC 20402
NO. OF COPIES ORGANIZATION 1 HC US ARMY RSRCH LAB ATTN RDRL CIM G TECHL LIB T LANDFRIED BLDG 4600 ABERDEEN PROVING GROUND MD 21005-5066 6 HCs US ARMY RSRCH LAB ATTN RDRL CIM P TECHL PUB ATTN RDRL CIM L TECHL LIB ATTN RDRL SED C C RONG ATTN RDRL SED C D CHU ATTN RDRL SED P J HOPKINS ATTN IMNE ALC HR MAIL & RECORDS MGMT ADELPHI MD 20783-1197 TOTAL: 15 (1 PDF, 1 CD, 13 HCS)
14
INTENTIONALLY LEFT BLANK.