Supported by UNDP Ethiopia
256
Supported by UNDP Ethiopia
-
Upload
khangminh22 -
Category
Documents
-
view
0 -
download
0
Transcript of Supported by UNDP Ethiopia
Proceedings of the Quarterly Executive Idea Exchange Forum
Supported by UNDP Ethiopia


© Department of Management, College of Business and Economics,
Addis Ababa University, 2017

Assistant

Executive MBA Students, First Batch
Former
Current
Ismail Kedir
193
178
171
110
94
75
63
45
30
1
12

1
Value Innovation and the Ethiopian Economy: Scanning the Policy Environment
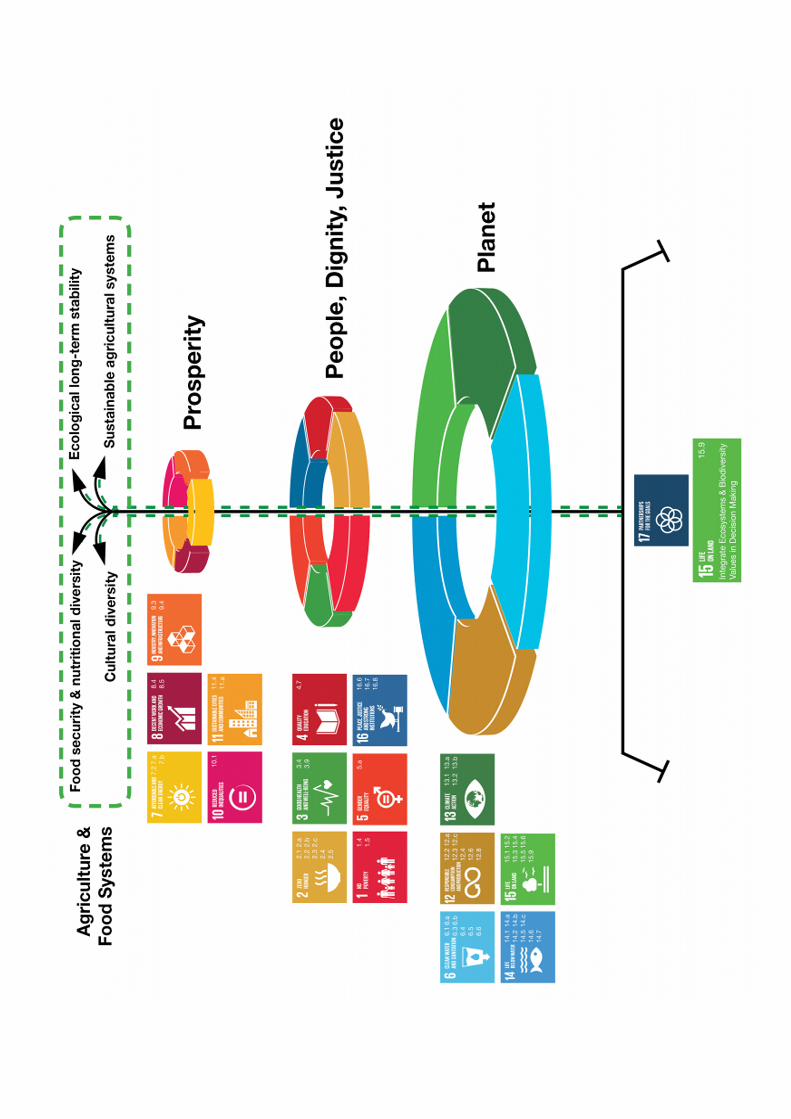
Yitbarek Takele1 and Fenta Mandefro2 Abstract Given the ever-growing threats of global climate change, non-renewable nature of most natural resources, the growing inequality, high population pressure and unemployment and lower global competitiveness score, developing countries need to design a robust innovation policy that can lessen the evils and ensure sustainable development. Thus, innovation has become the way forward for an economy to prosper and ensure sustainable development. In this paper, the strengths and weaknesses of the Ethiopian National Science, Technology and Innovation Policy has been identified and adequately addressed and the way forward has been suggested. It is argued that while technological innovation is a necessary condition for innovation to take place, it is not sufficient on its own; the marketing aspect is equally important. Keywords: Value innovation, Ethiopian economy, policy environment
1. Introduction Innovation is mostly attributed to one of the main variables explaining the ever-growing disparity in the global economic prosperity between the developed and the developing world. The developed world uses innovation as its source of building core competence which in turn ensures sustainable development. This can be better explained by pointing the developed world’s use of innovation to add value to the consumer and reduce cost to the producer, introduce unique tastes, protect imitation and ensure leverage across systems ranging from military to business, which is finally reflected through improved productivity and thereby global competitiveness and astonishing welfare (Kim and Mauborgne, 2005; Coulter, 1998). This has been well captured by Trajtenberg (2005: pp. 6-7) in which he indicated that a vast array of empirical research over half a century has conclusively shown that at least half of the growth in per capita income in virtually every country studied is associated with the growth of Total Factor Productivity (TFP) which is strongly associated with innovation rather than with more traditional factors.
Given above, it should not take one by surprise if scholars single out innovation as the main factor attributable to the differing long-term economic performance among countries of the
1 Associate Professor, Department of Management, College of Business and Economics, Addis Ababa University, Email: [email protected] 2 Assistant Professor, Department of Public Administration and Development Management, College of Business and Economics, Addis Ababa University, Email: [email protected]

2
globe. Of course, countries that are able to create, maintain and sustain an enabling innovative environment are able to reap both the short-term outcomes (such as job creation, growth, inclusion and greater equity, etc) and long-term impacts (such as improved wellbeing, green and transformed economy, cultural change, global influence and leverage, etc). For instance, two- thirds of the differences in the growth performance of Ghana and the Republic of Korea over four decades are attributable to technology-related improvements (World Bank, 2010).
However, it is important to note that the activity of innovation is dynamic, complex, non-linear and global and a systems approach is implicit in innovation policy (Gualt, 2012). This very nature of innovation emphasizes involvement of multiple stakeholders (Governments, education, health and research institutions, business, foreign institutions, etc), undertaking of different activities (R&D, invention, diffusion of technologies and practices, design, HR development, etc), coordinated linkages (such as contracts, collaborations, co-publication, grants, monitoring, etc), multiple short term outcomes (such as jobs, growth, inclusion, greater equity, etc), wider long term impacts (wellbeing, culture change, global influence and leverage, etc) (ibid). From the above analysis, one can imagine the potential challenge that developing countries could face in the pursuit of developing innovative policies. To this end, the conduciveness of the legal and institutional environment to stimulating innovative activity such as existence and smooth operation of company law, bankruptcy law, regulatory and financial supervision, and competition policy, taxation policy (such as existence of tax incentives for innovation, and protection of intellectual property rights) will be critically important though most developing countries mostly lack such an integrated and efficient regulatory systems.
To lessen the ever-growing threats of global climate change, non-renewable nature of most natural resources that many developing countries currently count on, growing inequality, growing population and high unemployment, low global competitiveness, developing countries have to design an enabling innovation policy that can improve these evils and ensure sustainable development (World Bank, 2010). In doing so, the main levers, which innovation policies for sustainable development, should focus on four pillars are skills formation, provision of incentives, access to information, and availability of finance (Trajtenberg, 2005). Besides, the policy shall include innovations of all stripes including product innovation, process innovation and the blend of both. While innovation of products can mainly help create jobs and grow the economy, process innovation can be mainly used to minimize waste, create value and accordingly enhance global competitiveness and ensure environmental friendly production system and thereby maintain sustainable development that imbibes equity, green economy, long- term prosperity and thereby peaceful coexistence among citizens of the globe.
Above all, the design of innovation policy requires an integrated action in many different policy areas—education, trade, investment, finance, and decentralization, among others—and it is the

3
right combination of interventions in these diverse domains that create a fruitful innovation climate. This just emphasizes the need to follow a systems or whole government approach.
In this paper, while section two addresses the role of government in promoting innovation, section three analyses the misconceptions of innovation and innovation policy. Section four articulates the need for innovation and innovation policy and section five evaluates the National Science, Technology and Innovation Policy of Ethiopia. The paper closes with section six by providing conclusive remarks and policy implications.
2. The Role of Government in Promoting Value Innovation According to World Bank (2010), the role of government in fostering innovation could target four generic functions: supporting innovators through appropriate incentives and mechanisms, removing obstacles to innovative initiatives by enacting enabling regulatory and legal frameworks, establish government sponsored Research and Development structures and building a creative and receptive population through appropriate educational systems. These roles can be best played if the government designs a robust innovation policy which advocates a systems approach and same time contingent enough to consider the situation prevailing in the country it is leading. For example, developed countries often provide the business sector with fiscal incentives such as tax rebates to stimulate R&D and innovation-related efforts. Such incentives, which work best for medium and large-scale industry, are generally not adapted to the situation of low- and medium-income countries, which lack sufficient accounting capabilities and have a large informal sector of small firms with no R&D expenses. Besides, a systems approach is required to removing obstacles to innovative initiatives by mobilizing many areas of government—taxes, customs, procurement, and standards, for example—and requires vigilant action. The World Bank investment climate assessments and Doing Business surveys can help identify such obstacles (World Bank, 2010). Moreover, governments of developing countries should establish government sponsored research as public and university laboratories are often cut off from local needs and poorly funded and staffed. Establishing a responsive research infrastructure depends principally on creating adequate competencies and laboratories with adequate funding mechanisms (Ibid). This is what is critically lacking in most developing countries including Ethiopia and thus the government needs to devise an innovation policy that can fairly alleviate this very problem. Finally, as a matter of the long-term initiative promoted by the World Bank, building a creative and receptive population through appropriate educational systems can play paramount importance while using innovation as the main instrument for promoting and ensuring sustainable development. Most importantly, this could involve investing in primary and secondary schooling that consequently facilitate lifelong learning, which may include customized learning, learning by doing, and team working.

4
3. Innovation and Innovation Policy: The Misconceptions An innovation is the implementation of a new or significantly improved product (good or service), or process, a new marketing method, or a new organizational method in business practices, workplace organization or external relations (OECD/Eurostat, 2005 quoted in Gualt, 2012). Innovation means technologies or practices that are new to a given society that are not necessarily new in absolute terms (World Bank, 2010). From the above definitions, it can be inferred that innovation is more than invention that also includes adoption, adaptation and adeption. Moreover, it can be noted that innovation is multifaceted in that it is process based, product based and product-process based in its approach. More importantly, the definitions aptly underscored the need for conceptualizing innovation as a process of solving problems than the invention of something that lack marketability. Thus, a full concept of innovation emphasizes the use of both science and technology and the application of dynamic business models to solve human problems than misconceptualizing innovation to mean only progress in science and technology while disemphsizing the other most important component which casts doubt on the construct validity of the construct “innovation”. Therefore, this paper accentuates the need to see the big picture of innovation as a mechanism to provide solution to human problems than mere technical inventions which is mainly linked to science and technology alone.
4. Innovation and Innovation Policy: The Essence Innovation has become the way forward for an economy to prosper and ensure sustainable development through improved global competitiveness given the ever-increasing interconnectedness of the world. To this end, innovation deserves to be the center of government policy, especially in developing economies whether they are well endowed with natural resources or otherwise. Even countries which are well endowed with natural resources can only ensure temporary growth but not sustainable development. This is due to the fact that for a resource to be a source of competitive advantage it should be unique, it shall add value to the consumer without further processing, be inimitable and get easily leveraged to other uses and areas of application. Such competitive advantage couldn’t be gained by simply relying on natural resources. Of course, natural resources where countries are well endowed may serve to be a source of comparative advantage than competitive advantage given the low level of innovation taking place in most developing countries. This can be easily proved by the negative trade balance record of most developing countries that mainly export non-value added (primary) goods. More importantly, it has to be noted that most natural resources are non-renewable whose extensive use could endanger the wellbeing of the posterity. As a solution to this, innovation could at least be part of the solution for the efficient use of same.
In view of the above discussions, the basic argument of this paper, especially with regards to the innovation policy initiatives of the governments of developing countries (to extend support to Research & Development endeavors of their own respective countries) such as Ethiopia is that while innovation is clearly a critical factor for growth (and hence inter alia for poverty

5
alleviation), a well-functioning market economy cannot generate by itself the optimal levels of investment in innovation. This is so primarily because of two sources of market failures (Arrow, 1962 as quoted in Trajtenberg, 2005 pp. 7-8) necessitating the intervention of the government to fill the gap. This has a lot to do with partial appropriability due to spillovers that through which the social rate of return on Research and Development expenditures often exceed private returns by as much as a factor of three (Ibid). Besides, the obvious cost of information asymmetries and lack of financial capacity which unquestionably lead to a serious “funding gap” that inhibit private firms from investing enough in innovation and Research & Development, thus depriving the economy from one of the key levers of sustained growth and development.
5. National Science, Technology and Innovation Policy of Ethiopia: An Evaluation Three major strengths and eight major weaknesses of the Ethiopian National Science, Technology and Innovation Policy have been identified and adequately addressed. The methodological basis of this evaluation is the conceptual framework adapted from World Bank (2010), Chandra et al. (2008) launched by World Bank and OECD, and Trajtenberg (2005) that outline the policy principles and thinking frameworks about innovation policies that can promote sustainable development in developing countries.
5.1 Strengths The major strength of the NSTI policy is its governance structure whose approach is horizontal, interdepartmental and whole government centered. It embraces at least thirteen government ministries including the Prime Minister office as its council members. Besides, it includes top- level representatives of the concerned public sectors, representatives of the private sector and selected renowned scientists and engineers.
Secondly, one of the main reasons for the success of many policy initiatives is the strong backing of the top leadership. The Ethiopian NSTI policy states the Prime Minister of the Federal Democratic Republic of Ethiopia as the chairperson of the National Science, Technology and Innovation Council (FDRE, 2010: pp. 15). This implicates the success of the policy to draw the attention of the country’s top leadership and win its support thereby coordination across different spectrums of the government can easily be gained which paves the way for its successful implementation. This could be taken as a gesture of showing absolute commitment for the full realization of the policy.
The final and most important strength of the Ethiopian NSTI policy is the emphasis it gives for designing appropriate financing and incentive mechanisms in its bid to promote scientific, technological and innovative activities. This is very important given that the current total research expenditure in Ethiopia is one of the lowest in the world while the existing financial system of the country is not designed to address the needs of innovative activities in the enterprises sector (FDRE, 2010: pp. 7). In view of this, the policy emphasizes the need to create
6
national technology and innovation funds, introduce fiscal incentives such as tax exemption and duty free privileges for scientific, technological and innovative activities of Ethiopian SMEs, create a system of special privileges and awards for outstanding innovations/achievements, develop and implement pro-innovative government procurement policy, increase budget allocation for adaptive and applied research at tertiary education institutions and TVET centers.
5.2 Weaknesses Innovation in developing countries shall simultaneously focus on adoption (acquisition), usage (adaption), adeption (mastering) or creating new (indigenous) technologies, of course, with different levels of emphasis. For this, developing countries need to improve their R&D resources and technological absorptive capacity. In view of the above, a developing country’s innovation strategy should include policies and mechanisms that affect the country’s ability to draw on global knowledge while the optimal policy shall be country- and sometimes even sector-specific, investment in domestic R&D as well as policies that foster the development of high tech industries can make a difference (Chandra et al, 2008)). However, a policy priority is therefore to improve the allocation of public resources and build supporting institutions, public and private, to create, acquire, and disseminate new knowledge (Ibid). In view of this, the Ethiopian National Science, Technology and Innovation Policy (2010) aimed at providing the basic framework to initiate, guide, coordinate and support the efforts of the country to acquire, use and master technologies that deemphasize the promotion of novel country specific innovations. This is partly against the mission and vision of this policy that aspires to see Ethiopia undertaking coherent NSTI initiatives which reduce technological dependence of the country and eventually lead the country to begin exporting its own technologies by the year 2025 (FDRE, 2010 pp 1-2). This can mainly be realized by promoting new indigenous innovations than relying on the adoption, adaption and adeption of existing technologies. If the visions and missions reflected in this policy document are to be realized then it is imperative to emphasize the need for promoting indigenous innovations that can reduce technological dependence of the country and subsequently enhance its global competitiveness in a very sustainable manner. Besides, such indigenous innovations shall center on the green concept that the government of Ethiopia is promoting most, if it has to be well aligned with the overall government policy and strategy while capitalizing on the comparative advantage the country. This, of course, comes with a need for strong political commitment and considerable resource deployment to serve same.
The second major weakness of the Ethiopian National Science, Technology and Innovation (NSTI) Policy is its conceptualization of innovation to mean mere progress in science and technology. However, it is important to note that innovation policy is broader than, and different from, science and technology policy, with which it usually tends to be merged with (World Bank, 2010). This is what exactly is reflected in the Ethiopian NSTI policy. The right approach is to view innovation as a process (end-to-end) from idea generation to full commercialization,
7
i.e., to understand innovation as an issue of both technology and market; problem solving than mere invention; as an outcome driven than process oriented. Accordingly, the Ethiopian National Science, Technology and Innovation (NSTI) Policy as it is usually the case for most developing countries embraces scientific ideology and ignored market ideology. While technological innovation is the necessary condition for innovation to take place, it is not sufficient. The marketing aspect is equally important. Thus, the Ethiopian NSTI needs to promote the idea that the Ethiopian government need do no more than building a good science base which that made it incomplete. This is well reflected by the government’s 70-30 student enrollment policy that requires both public and private universities of the country to make arrangements of admitting 70 percent of their total students in science and technology fields while the rest 30 percent in the social science and business studies. Of course, it is appreciable that the field of science and technology is given proper attention though it will not help the economy much, if the market ideology that complements it is not given due attention. The central thesis of this argument is the fact that helpful technologies fail due to poor business models that support it. Thus, the Ethiopian government needs to create an open and competitive business environment (promoting the market ideology) and avail enough funds for the conduct of basic research (promoting scientific ideology), which the business community may fail to finance.
In general, it can be fairly claimed that the Ethiopian government is prompting the outdated first- generation innovation policy than adapting the more dynamic second-generation innovation policy, which according to World Bank (2010) is more complex and aims at facilitating interactions between the various actors and institutions involved in innovation processes: universities, research laboratories, banks for venture capital, and government agencies in charge of various sectors. Moreover, the second-generation innovation policy requires action in many different policy areas—education, trade, investment, finance, and decentralization, among others—and it is the right combination of interventions in these diverse domains that creates a fruitful innovation climate than mere focus on the scientific ideology alone (Ibid).
The third major weakness of NSTI’s policy is the approach it follows towards skill development. The policy states that prior attention shall be given to the creation of competent and innovative manpower, predominantly in the fields of engineering, technology and natural sciences and again disregards the need to develop the required managerial and business acumen skills. This wrong approach takes its root from the narrow conceptualization of innovation to mean only advancement in science and technology. This partly goes well with the first and foremost policy goal of providing universal access to literacy and basic math, though little has been stated about the rudiments of English and of computer literacy which are essential as a gateway to ICTs and to global markets, which sooner or later need to be accessed for innovation to succeed (Trajtenberg, 2005). However, the policy failed to make sure that the institutions and markets responsible for the supply of skills respond indeed to changes in demand. Rather, the government
8
follows 70-30 enrollment policy that limits the flexibility of colleges and universities to proactively and responsively act to shifts in the demand for skills.
The fourth limitation of the NSTI’s policy is its failure to mention about the need to avail information which can help understand the wider technological context such as the physical properties of various materials, including their durability, to know the existing best practices, and specific issues, for example, the relationship between design and manufacturing requirements and materials used (Ibid). This will hinder the passage of intimate knowledge of the market for the (improved) product as well for the innovation to have reasonable chances of commercial (and not just technological) success.
Fifth, according to Trajtenberg (2005: pp. 12) any innovation policy designed to promote Research & Development should not aim just at increasing total R&D, but to do justice to foster local spillovers rather than external leakages, develop absorptive capacity, and ultimately impact the productivity of a wide range of sectors of the local economy. None has been outlined in the NSTI policy document as what shall be done to incentivize local spillovers and minimize global spillovers so that the fruits of innovation can be retained within the Ethiopian economy.
Sixth, the Ethiopian NSTI policy failed to place priority to the development and use of General Purpose Technologies (GPT) over more Specific Purpose Technologies (SPT). Of course, technological change contributes to growth, wherever it happens, but there are certain technological advances that play a critical role in fostering growth in the economy as a whole over the long haul than others. Indeed, in any era there are General Purpose Technologies (GPT) that drive growth by spreading over the different sectors of the economy and prompting them to innovate as well. The preeminent General Purpose Technology (GPT) of our era is undoubtedly Information and Communication Technology (ICT), and as such it is enabling and fostering economic growth in developed countries, as well as in many transition and developing countries (Trajtenberg, 2005: 13). Coming to the Ethiopian NSTI, no statement has been made whether the approach to be followed is developing a local ICT industry, joining forces with ICT multinationals, otherwise encouraging the ICT producing sectors or a combination of some or all of them.
The seventh major weakness of the NSTI policy of Ethiopia is its failure to, at least, implicitly indicate the focus of innovation as export or local oriented. It is well on the record that the government of Ethiopia failed to meet its export targets. For its economy to continue to grow in double digits, strengthening the export sector is inevitable. For this, the government’s export strategy shall be innovation oriented than a vehicle for addressing the current short-term foreign currency needs of the country through the sale of mainly unprocessed agricultural goods. Thus, lack of direction with regard to same is the missing element.
9
The last major weakness of the Ethiopian NSTI policy is its poor Monitoring and Evaluation framework. It is simply stated in the policy document that stakeholders and other concerned bodies are given the mandate to examine the progress of the activities, seek for timely corrective measures and assess the efficiency and effectiveness of the allocated resources (FDRE, 2010: pp. 18). The policy failed to state the need for maintaining a two-level monitoring and evaluation as it does in other policies. This includes the monitoring of innovation systems and the assessment of innovation programs and policies. More specifically, nothing has been stated as how the monitoring will exactly be conducted and the sources of data for conducting the monitoring activity. Such a loophole will make the Monitoring and Evaluation results less critical, undependable and above all unhelpful to promote the growth aspiration of the government and people of Ethiopia. It would have been much more better to explicitly state the use of benchmarking and data from international bodies such as the World Economic Forum with its competitiveness indexes and the World Bank with its Knowledge Assessment Methodology as sources of data as they have regularly updated databases. This could have made the M&E endeavor of the NSTI policy much more palatable.
By and large, this assessment partly shares the findings of Mugabe (2011) in his evaluation of the innovation systems of developing countries. This include narrow definition of Research & Development to mean science and technology, the little emphasis given on innovation aspects such as technology prospecting, procurement and diffusion, lack of explicit innovation policies, and weak engineering and entrepreneurship linkages.
6. Conclusion and Policy Implications It is concluded that the Ethiopian National Science, Technology and Innovation Policy follows a narrow definition of innovation to mean advancement in science and technology and ignores the market development aspect of same.
The NSTI policy of Ethiopia is mainly short-sighted in that it advocates short-term objectives such as job creation and growth than long-term impacts such as improved wellbeing, green and transformed economy, cultural change, global influence and leverage, etc.
The approach followed in the design and implementation of the policy is fairly integrated. That is, whole-government approach is followed, which facilitates the establishment of efficient government machinery that can facilitate the much-needed coordination. Besides, the will and commitment of top leadership is well reflected.
The policy only partially meets some of the four main levers of any innovation policy: skill formation aspect ignores the issues of business and entrepreneurial development, though it has fairly addressed the engineering and science skills, mechanisms to ensure access to information are not put in place, provision of incentives such as intellectual property rights and financial
10
incentives are fairly covered and sources of funds got adequate attention though there is nothing on the ground.
Moreover, the policy doesn’t address all strips of innovation: it focuses on product innovation but not process innovation and the blend of both. This could be connected to meeting short-term objectives such as job creation through product innovation than value addition through process innovation as this may eliminate jobs though it could raise global competitiveness.
Finally, it is recommended that the policy should re-look at the proper conceptualization of innovation from both science and technology and business perspectives, balance short-term and long-term objectives of innovation policy as the latter was not given fair coverage, connect innovation policy with global competitiveness and export performance, and make use of general purpose technologies and give fair space for the promotion of ICT.
11
References
Bank, T. W. (2010). Innovation Policy: A Guide for Developing Countries. Washington: The International Bank for Reconstruction and Development / The World Bank.
Coulter. (1998). Strategic Management in Action. Prentice Hall Ethiopia, T. F. (October 2010). National Science, Technology and Innovation Policy: Building
Competitiveness through Innovation. Addis Ababa: The Federal Democratic Republic of Ethiopia.
EUROPE, U. N. (2012). Fostering Innovative Entrepreneurship: Challenges and Policy Options. New York and Geneva: UNITED NATIONS Gault, F. (January 16, 2012). Innovation Strategies for a Global Economy. CSLS Seminar Series on Living Standards. Ottawa.
HOBDAY, M. (June 2005). Firm-level Innovation Models:Perspectives on Research in Developed and Developing Countries . Technology Analysis & Strategic Management , 121-147.
Mauborgne, K. a. ( 2005). Blue ocean strategy: how to create uncontested market space and make the competition irrelevant. Boston, Massachusetts: Harvard Business School Publishing Corporation. Mugabe, J.O. (2011). Science, Technology and Innovation in Africa’s Regional Integration: From Rhetoric to Practice. ACODE Policy Research Series, No. 44, 2011. Kampala.
Schwab Foundation for Social Entrepreneurship . (April 2013). Breaking the Binary:Policy Guide to Scaling Social Innovation. Schwab Foundation for Social Entrepreneurship .
Stam, Erik (2008). Entrepreneurship and innovation policy, Jena economic research papers, No. 2008, 006 Trajtenberg, M. (November 21, 2005). Innovation Policy for Development: an Overview.
United Nations Conference on Trade and Development. (November 2011). Pro-poor technology, innovation and entrepreneurship policies. United Nations.
University, United Nations. (2011 ). Innovation and Entrepreneurship in Developing Countries. United Nations University. Vandana Chandra, D. E. (November 2008). Innovation and Growth: Chasing a Moving Frontier. Innovation and Growth in a Globalised World.
World Intellectual Property Organization. (April 1999). Guidelines on Developing Intellectual Property Policy. Geneva: World Intellectual Property.
12
The Impact of Human Capital on Company Performance: The Case of the Footwear Sector in Ethiopia
Abera Demsis1 Abstract Human capital is getting wider attention with the increasing globalization and also the saturation of the job market due to the recent downturn in the various economies of the world. Developed and developing countries put emphases on a more human capital development towards accelerating the economic growth by devoting necessary time and efforts. Thus, human capital development is one of the fundamental solutions to enter the international arena. Specifically, firms must invest necessary resources in developing human capital which tends to have a great impact on performance. There is some emerging evidence that human capital investment leads to greater company performance particularly in small enterprises. This study adopts the human capital theory to address this gap in knowledge. A survey research design was adopted to test this proposition using a sample of 143 small scale footwear sector in Addis Ababa, Ethiopia. Estimation results using a regression model indicates that having human capital investment in company leads to the improved Company Performance. The findings of this study have important implications for theory, policy and practice. An important theoretical contribution of this study relates to its application of the human capital theory to examine the drivers of Company Performance by small firms in a developing economy. Another theoretical significance of this study relates to the ability of this study to link human capital theory and the concept of performance empirically.
Keywords: Company Performance, Human Capital, innovation 1. Introduction Existing literatures provide evidence that aspects of an individual’s human capital facilitate the recognition or development of Company Performance (Marvel and Lumpkin 2007; Shane 2000). Moreover, the human capital theory indicates that individuals with more or higher quality human capital will reap more desirable outcomes (Becker 1964).
In the current global market, companies are composed by competitors, regardless of industry. To develop a competitive advantage, it is important that firms truly leverage on the workforce as a competitive weapon. A strategy for improving workforce productivity to drive higher value for the firms has become an important focus. Firms seek to optimize their workforce through comprehensive human capital development programmes not only to achieve business goals but most important is for a long-term survival and sustainability. To accomplish this undertaking, firms
1 BA, MBA, PhD candidate of Business Leadership, E-mail: [email protected]
13
will need to invest resources to ensure that employees have the knowledge, skills, and competencies they need to work effectively in a rapidly changing and complex environment.
In response to the changes, most firms have embraced the notion of human capital as a good competitive advantage that will enhance higher performance. Human capital development becomes a part of an overall effort to achieve cost-effective and firm performance. Hence, firms need to understand human capital that would enhance employee satisfaction and improve performance. Although there is a broad assumption that human capital has positive effects on firms’ performance, the notion of performance for human capital remains largely untested. Hence, this paper attempts to look into the connection between human capital and firm’s performance in the transition economies such as Ethiopia. Therefore, the following research question is used to guide the investigation: to what extent does human capital create impact on firm performance? This study attempted to address this gap in knowledge by examining the relationship between human capital and Company Performance using a sample of 143 small-scale footwear firms in Addis Ababa, Ethiopia.
The remainder of this paper is organized as follows: the next section reviews the human capital theory and links it to the concept of innovation. The research questions of this study are given thereafter. Then, the procedures employed in primary data generation, construct measurement and data analysis are outlined. Next, the present paper’s propositions are assessed and the results presented and discussed. The final section presents the key conclusions of the study and highlights relevant managerial and policy implications.
1.1 Statement of the Problem International involvement of local firms is a major source of revenue for any nation and represents a significant share of GDP. Particularly, firms in developing countries exchange goods in the international market with low income elasticity of demand for most of the exported goods are primary and semi-processed products. Consequently, the foreign earning generated from export is very low. Leather and leather producing firms in Ethiopia have been involving in the international leather markets for more than 68 years now. Till 2010 the majority of their exports are semi- processed leather products such as pickled and wet blue hides and skins. Only few firms are able to reach the highest stage of the value chain, produce and export finished leather products. On the other hand, in spite of the fact that the Ethiopian leather industry seems to try to produce and export leather and leather products, the industry lacks competitiveness both in the domestic and international markets, makes it a sluggish and non- innovative industry.
Furthermore, although the industry has a comparative advantage of producing leather and leather products at relatively lower cost, local firms were not able to make use of it due to the reasons mentioned in the previous section. At the same time, the industry has witnessed erratic export
14
growth over the past 10 years. This may be attributed mainly to shoe manufacturers and leather goods and garments producers exporting their products with intermittent variation and lack of sufficient market information and competitive capacity.
Though the Government of Ethiopia is promoting the leather footwear industry as a priority area and the sector has a huge potential for developing an economy, its performance is unsatisfactory due to external and internal problems that hinder its competitiveness (Umer, 2012).
1.2 Objectives of the Study 1.2.1 General objective of the Study The general objective of the study was to establish the relationship between human capital components and firm performance of the leather footwear manufacturing SMEs in Ethiopia.
1.2.2 Objectives of the Study i. To establish the relationship between formal education status and performance of the
leather footwear manufacturing SMEs. ii. To establish the relationship between innovation skills and performance of the leather
footwear manufacturing SMEs. iii. To establish the relationship between experience and performance of the leather footwear
manufacturing SMEs. iv. To establish the relationship between human capital components and firm performance of
the leather footwear manufacturing SMEs in Ethiopia. 1.3 Research Questions
(i) What is the relationship between formal education status and performance of the leather footwear manufacturing SMEs in Ethiopia.?
(ii) What is the relationship between innovation skills and performance of the leather footwear manufacturing SMEs in Ethiopia.?
(iii) What is the relationship between experience and performance of the leather footwear manufacturing SMEs in Ethiopia.?
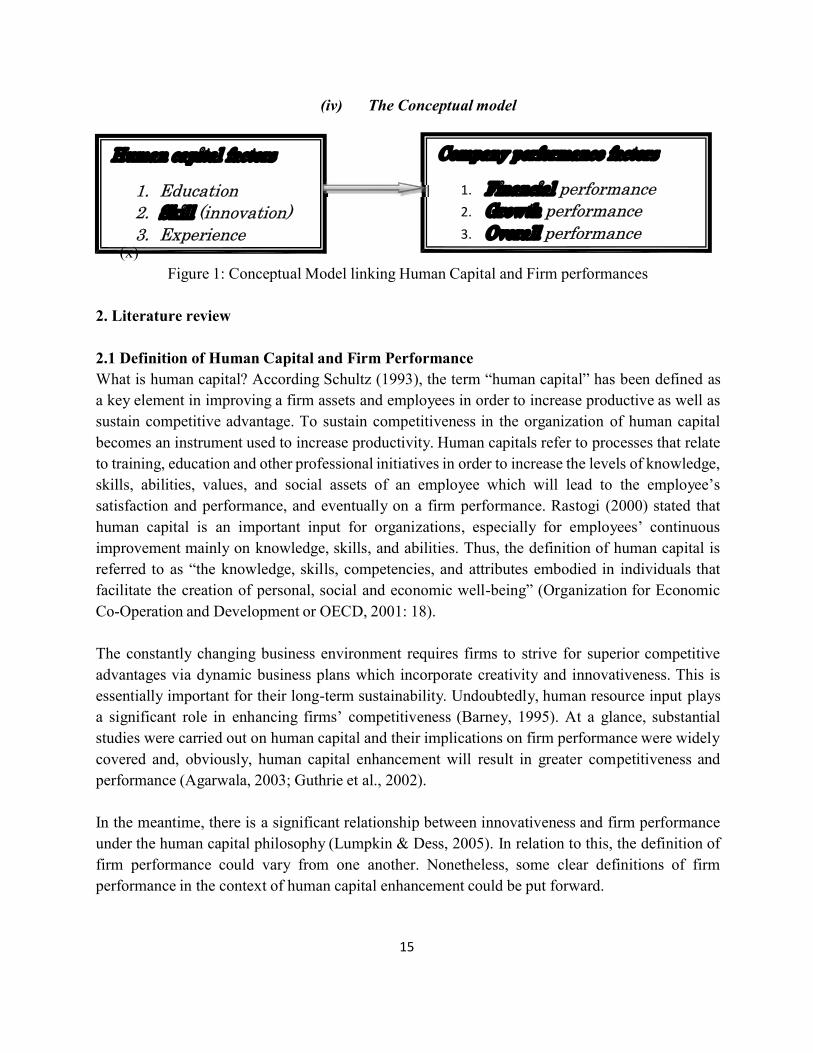
1.4 Conceptual Model The purpose of this study is to develop a model to show the relationship between human capital and firm performance. As argued in the earlier discussions, the general human capital investment includes education, skills and experience that will lead to greater firm performance. Firm performance can be viewed in three different perspectives; financial performance, non-financial (growth) performance and overall performance. The details are given in Figure 1
15
(v) (vi) (vii) (viii) (ix)
(iv) The Conceptual model Human capital factors 1. Education
2. Skill (innovation) 3. Experience (x)
Company performance factors 1. Financial performance 2. Growth performance 3. Overall performance
Figure 1: Conceptual Model linking Human Capital and Firm performances 2. Literature review 2.1 Definition of Human Capital and Firm Performance What is human capital? According Schultz (1993), the term “human capital” has been defined as a key element in improving a firm assets and employees in order to increase productive as well as sustain competitive advantage. To sustain competitiveness in the organization of human capital becomes an instrument used to increase productivity. Human capitals refer to processes that relate to training, education and other professional initiatives in order to increase the levels of knowledge, skills, abilities, values, and social assets of an employee which will lead to the employee’s satisfaction and performance, and eventually on a firm performance. Rastogi (2000) stated that human capital is an important input for organizations, especially for employees’ continuous improvement mainly on knowledge, skills, and abilities. Thus, the definition of human capital is referred to as “the knowledge, skills, competencies, and attributes embodied in individuals that facilitate the creation of personal, social and economic well-being” (Organization for Economic Co-Operation and Development or OECD, 2001: 18).
The constantly changing business environment requires firms to strive for superior competitive advantages via dynamic business plans which incorporate creativity and innovativeness. This is essentially important for their long-term sustainability. Undoubtedly, human resource input plays a significant role in enhancing firms’ competitiveness (Barney, 1995). At a glance, substantial studies were carried out on human capital and their implications on firm performance were widely covered and, obviously, human capital enhancement will result in greater competitiveness and performance (Agarwala, 2003; Guthrie et al., 2002).
In the meantime, there is a significant relationship between innovativeness and firm performance under the human capital philosophy (Lumpkin & Dess, 2005). In relation to this, the definition of firm performance could vary from one another. Nonetheless, some clear definitions of firm performance in the context of human capital enhancement could be put forward.
16
In some cases, financial performance measures such as percentage of sales resulting from new products, profitability, capital employed and return on assets (ROA) (Selvarajan et al., 2007; Hsu et al., 2007). Besides, return on investment (ROI), earnings per share (EPS) and net income after tax (NIAT) can also be used as measures of financial performance (Grossman, 2000). Interestingly, researchers also tend to benchmark managerial accounting indicators against the financial measures in six dimension; ‘workers compensation’ (workers’ compensation expenses divided by sales); ‘quality’ (number of errors in production); ‘shrinkage’ (e.g. inventory loss, defects, sales return); ‘productivity’ (payroll expenses divided by output); ‘operating expenses’ (total operating expenses divided by sales) (Wright et al., 2005). On the other hand, firm performance can also be measured using ‘perceived performance approach’ (also referred to as subjective performance measure) where Likert-like scaling is used to measure firm performance from the top management perspectives (Selvarajan, 2007).
2.2 The Relationship between Human Capital and Firm Performance The human capital focuses on two main components: individuals and organizations. This concept has further been described by Garavan et al. (2001) that human capitals have four key attributes: (1) flexibility and adaptability (2) enhancement of individual competencies (3) the development of organizational competencies and (4) individual employability. It shows that these attributes in turn generate add values to individual and organizational outcomes. There are various findings that incorporate human capital with higher performance and sustainable competitive advantage (Noudhaug, 1998); higher organizational commitment (Iles et al., 1990); and enhanced organizational retention (Robertson et al., 1991).
Hence, all these debates fundamentally focuse on individual and organizational performance. From the individual level, Collis and Montgomery (1995) point out that the importance of human capital depends on the degree to which it contributes to the creation of a competitive advantage. From an economic point of view, transaction-costs indicate that firms gain a competitive advantage when they own firm-specific resources that cannot be copied by rivals. Thus, as the uniqueness of human capital increases, firms have incentives to invest resources into its management and the aim to reduce risks and capitalize on productive potentials. Hence, individuals need to enhance their competency skills in order to be competitive in their organizations.
The human capital theory has undergone a rapid development. Within its development, greater attention has been paid to training related aspects. This is much related to the individual perspective. Human capital investment is any activity which improves the quality (productivity) of the worker. Therefore, training is an important component of human capital investment. This refers to the knowledge and training required and undergone by a person that increases his or her capabilities in performing activities of economic values.
17
From the organizational level, human capital plays an important role in the strategic planning on how to create competitive advantages. Following the work of Snell et al., (1999) it stated that a firm’s human capital has two dimensions, which are value and uniqueness. Firm indicates that resources are valuable when they allow improving effectiveness, capitalizing on opportunities and neutralizing threats. In the context of effective management, value focuses on increasing profits in comparison with the associated costs. In this sense, firm’s human capital can add value, if it contributes to lower costs, provide increased performances.
Another study by Seleim et al. (2007) analysed on the relationship between human capital and organizational performance of software companies. They found that the human capital indicators had a positive association on organizational performances. These indicators such as training attended and team-work practices, tended to result in superstar performers, where more productivity could be translated to organizational performances.
2.3 The Human Capital Theory This study adopts the human capital theory as its theoretical framework. It also extends the human capital theory to incorporate both its direct and indirect effects on Company Performance. The human capital theory suggests that individuals with more or higher human capital achieve higher performance when executing tasks (Becker 1964). Human capital comprises the stock of knowledge and skills that reside within individuals. Specifically, human capital includes the unique insights, skills, cognitive characteristics and aptitudes of entrepreneurs (Ventakaraman 1997). It also includes achieved attributes, accumulated work and habits that may have a positive or negative effect on productivity (Becker 1964). Human capital represents a resource that is heterogeneously distributed across individuals and is thus central to understanding differences in opportunity identification and exploitation (Shane and Venkataraman 2000). In this study, Company Performance is viewed as aspects of productivity. Since human capital can be seen as an input, this study explores the human capital determinants of Company Performance among a sample of small scale footwear sector in Addis Ababa.
Becker (1964) suggests that human capital can be categorized in to two groups: general and specific human capital. General human capital is generic, implying that it can be transferable across all industries and firms. Examples of general human capital include family background characteristics, education, age and gender. In contrast, specific human capital includes aspects such as prior knowledge, experience, attitude towards innovations, technical and managerial competencies and industry specific know-how.
Shane (2000) isolates prior knowledge of ways to serve markets, prior knowledge of customer problems, and prior knowledge of markets as important prerequisites of innovation outcomes. Existing literature indicates that human capital has significant influences on Company
18
Performance by small enterprises (Marvel and Lumpkin 2007). Thus, the overall human capital profile of an entrepreneur may be a key determinant of Company Performance.
Empirical studies have mainly focused on the direct link between individual strands or configurations of human capital factors and Company Performance, while less attention has been devoted to how management can utilize these factors more effectively. In other words, there has been little consideration in literature on the interrelationships between human capital factors in explaining Company Performance.
The above discussion leads us to the following research questions: From the human capital theory: Does a bundle of superior human capital factors enhance Company Performance?
3. Research Method This section begins by first outlining the research design that was adopted in this study. It then identifies the study population and sampling procedures before discussing the data collection methods. Next, it describes the methods that were used in analyzing data.
3.1 Research Design This is a survey that aims at examining the determinants of Company Performance in a sample of small scale footwear enterprises in Ethiopia. This research design is useful in examining the relationship between different company phenomena (Saunders et al. 2003). This study was conducted in SMEs Division in Addis Ababa. Small scale footwear sector is a prominent economic activity in this area. The population for this study included all small scale footwear sector that have registered in the MSEs. A sampling list of all small scale footwear sector was constructed from lists of members of MSEs in the study area. From this exercise, a total of 322 small scale footwear sector were identified in the study site as registered in the MSEs.
From the sampling frame, simple random sampling procedures were used to select the study sample. Following the seminal sample size determination formula produced by Krejcie and Morgan (1970), this study’s sample size is 175 enterprises.
3.2 Measurement of Variables Human capital The study measured human capital with four metrics; skill (innovation) factor, education factor, and experience factor. Hence, the three variables (education, experience as a manager and innovative skill) were used to measure general human capital.
19
Company Performance In measuring company performance, subjective and self-reported measures by the owners/ managers will be utilized which are consistent with the earlier studies (Covin and Slevin, 1989; Smart and Conant, 1994). Because company owners tend not to reveal their company financial data (Naman and Slevin, 1993) and asking for such data might have precluded any response at all (Poon et.al 2006). The researcher will use perceptual measures to assess firm performance. As suggested by Knight (2000), the majority of earlier studies have adopted self-reported measures to gather company performance data, which have proven to be reliable. Furthermore, there is research evidence that top managers’ perceptions of the performance of their firm are highly consistent with how their firm actually performed as indicated by objective measures (Dess and Robinson, 1984; Wall et al., 2004). The Company Performance Questionnaire was used to measure the performance of the SMEs. The BPQ consists of 7 questions that relates to sales growth, employment growth, market growth, gross profit, ROA, ROI, and overall performance.
Only the entrepreneurs/managers will complete the questionnaire as they are typically operationalized from the perspective of its CEO. This is an accepted approach (Covin and Slevin, 1989). The respondents must choose a position based from 1 to 5 ranges on the Likert scale format.
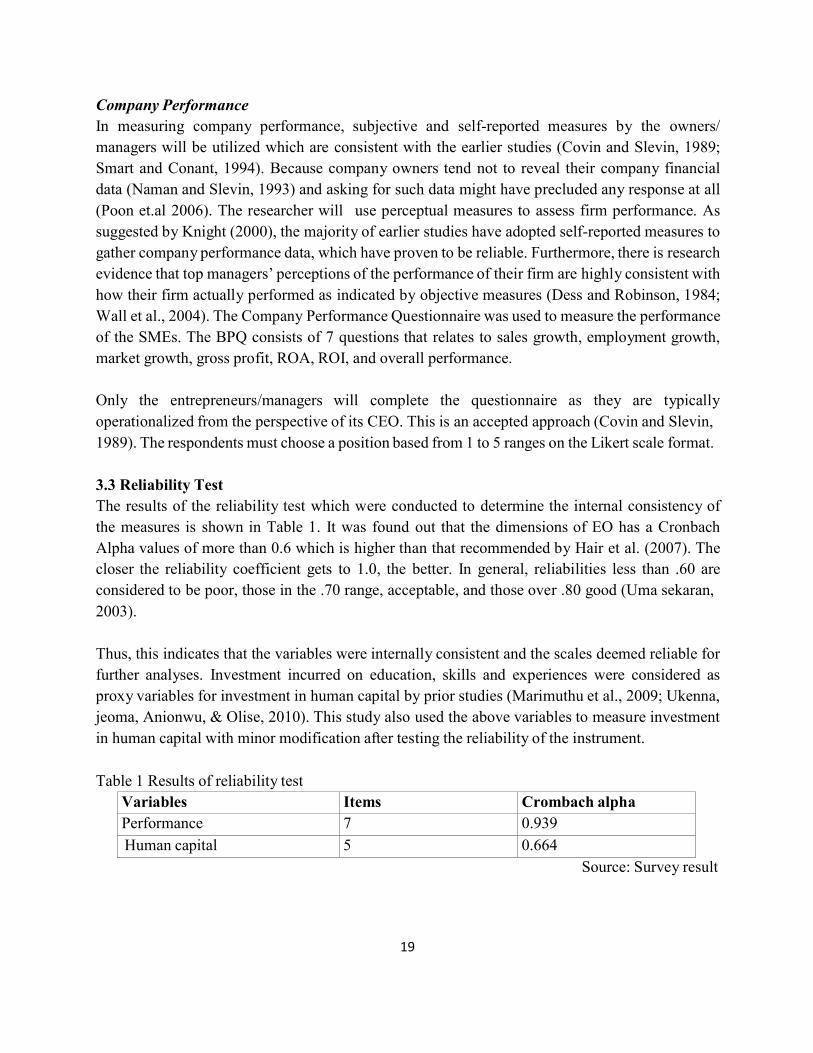
3.3 Reliability Test The results of the reliability test which were conducted to determine the internal consistency of the measures is shown in Table 1. It was found out that the dimensions of EO has a Cronbach Alpha values of more than 0.6 which is higher than that recommended by Hair et al. (2007). The closer the reliability coefficient gets to 1.0, the better. In general, reliabilities less than .60 are considered to be poor, those in the .70 range, acceptable, and those over .80 good (Uma sekaran, 2003).
Thus, this indicates that the variables were internally consistent and the scales deemed reliable for further analyses. Investment incurred on education, skills and experiences were considered as proxy variables for investment in human capital by prior studies (Marimuthu et al., 2009; Ukenna, jeoma, Anionwu, & Olise, 2010). This study also used the above variables to measure investment in human capital with minor modification after testing the reliability of the instrument.
Table 1 Results of reliability test Variables Items Crombach alpha
Performance 7 0.939 Human capital 5 0.664
Source: Survey result
20
3.4 Data Collection A structured questionnaire was used to collect data. The research tool for this study was tested for reliability and validity in several ways. First, the variables selected for this study were obtained from previous studies and tested for relevance. Secondly, experts in entrepreneurship were used in the selection of the study variables.
The questionnaire was double translated into Amharic to cater for the members of the sample that were not conversant with English. The questionnaire was pre-tested on 30 Small Scale Footwear sectors that operate in EIFCOS, which is found near the study area. This exercise helped to rephrase and reorganize the format of the questionnaire.
Data was collected using interviews with the owners of Small Scale Footwear sector in the study area. The pre-tested questionnaire was administered by the researcher with the help of two research assistants. The research assistants were trained on the handling of the research tool and the topic under study before they were allowed to collect data. The research assistants were closely supervised by the researcher during data collection. The questionnaire took approximately twenty minutes to administer. The data collection took 21 working days to complete.
4. Data Analysis and Results Several methods for analyzing data were adopted in this study. The survey data was initially summarized and presented using descriptive statistics such as means, standard deviation and correlation coefficients.
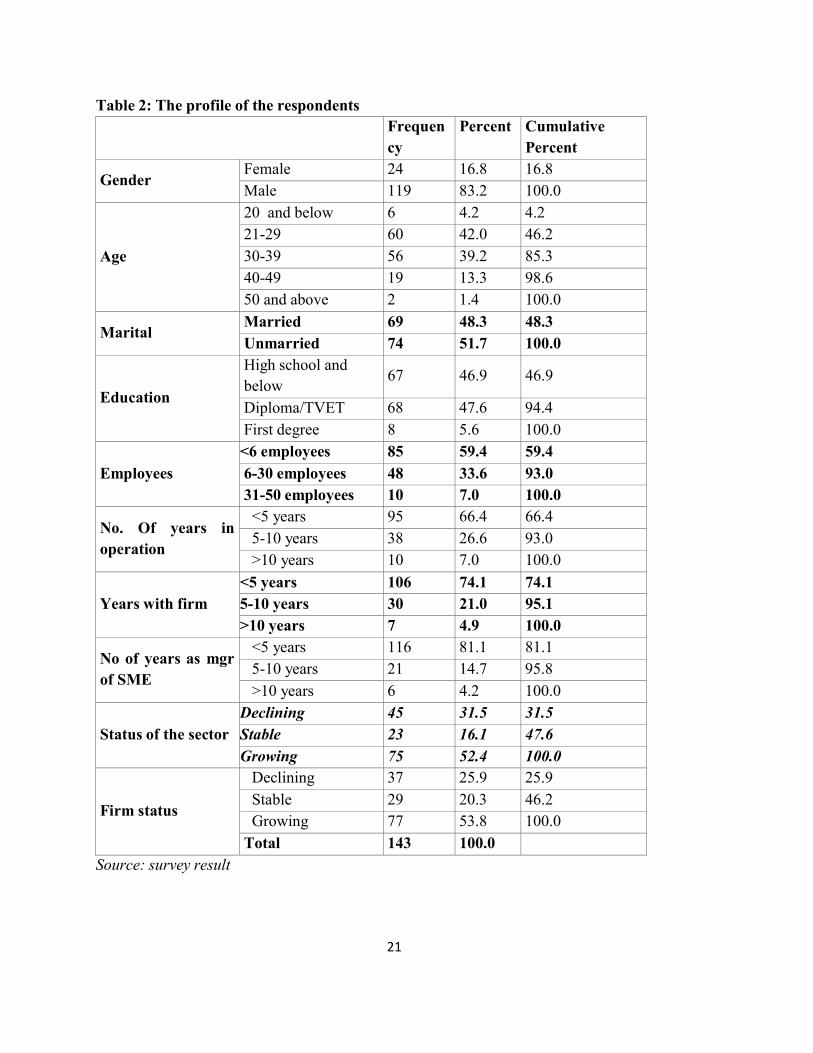
4.1 Sample Characteristics The profile of the respondents is illustrated in Table 2. The respondents consisted of 83.2 percent male and 16.8 percent females, majority of which were in the age group of between 21-39 years (81.2 percent). With regard to marital status almost it is equal with respondents (51.7 percent unmarried and 48.3 percent married). The majority of them had achieved a diploma education 47.6 percent. Most of the respondents in the leather footwear manufacturing sector have worked less than 5 years (74.1 percent). 66.4 percent of the firms have been established less than 5 years. And 81.1 percent respondents have been in that specific firm as a manager with less than 5 years.
21
Table 2: The profile of the respondents Frequen
cy Percent Cumulative
Percent Gender Female 24 16.8 16.8
Male 119 83.2 100.0 Age
20 and below 6 4.2 4.2 21-29 60 42.0 46.2 30-39 56 39.2 85.3 40-49 19 13.3 98.6 50 and above 2 1.4 100.0
Marital Married 69 48.3 48.3 Unmarried 74 51.7 100.0
Education
High school and below
67 46.9 46.9 Diploma/TVET 68 47.6 94.4 First degree 8 5.6 100.0
Employees <6 employees 85 59.4 59.4 6-30 employees 48 33.6 93.0 31-50 employees 10 7.0 100.0
No. Of years in operation
<5 years 95 66.4 66.4 5-10 years 38 26.6 93.0 >10 years 10 7.0 100.0
Years with firm <5 years 106 74.1 74.1 5-10 years 30 21.0 95.1 >10 years 7 4.9 100.0
No of years as mgr of SME
<5 years 116 81.1 81.1 5-10 years 21 14.7 95.8 >10 years 6 4.2 100.0
Status of the sector Declining 45 31.5 31.5 Stable 23 16.1 47.6 Growing 75 52.4 100.0
Firm status
Declining 37 25.9 25.9 Stable 29 20.3 46.2 Growing 77 53.8 100.0
Total 143 100.0 Source: survey result
22
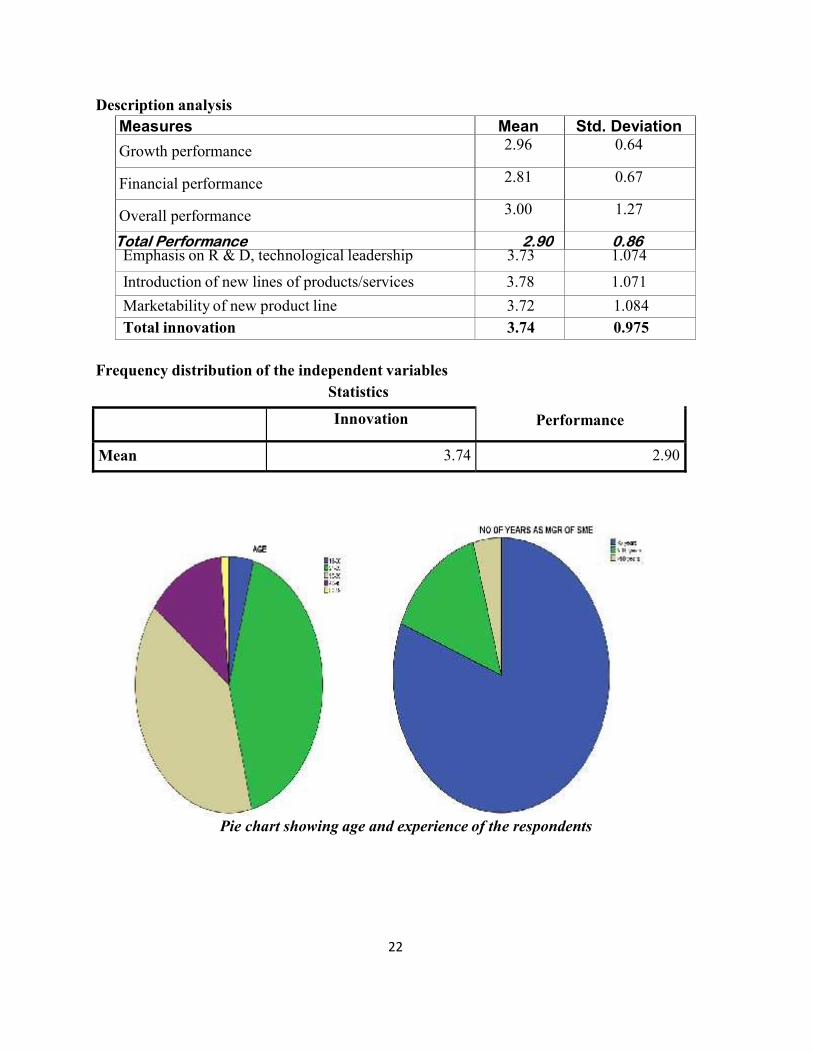
Description analysis Measures Mean Std. Deviation
Growth performance 2.96 0.64 Financial performance 2.81 0.67
Overall performance 3.00 1.27 Total Performance 2.90 0.86 Emphasis on R & D, technological leadership 3.73 1.074
Introduction of new lines of products/services 3.78 1.071 Marketability of new product line 3.72 1.084 Total innovation 3.74 0.975
Frequency distribution of the independent variables Statistics
Innovation Performance Mean 3.74 2.90
Pie chart showing age and experience of the respondents
23
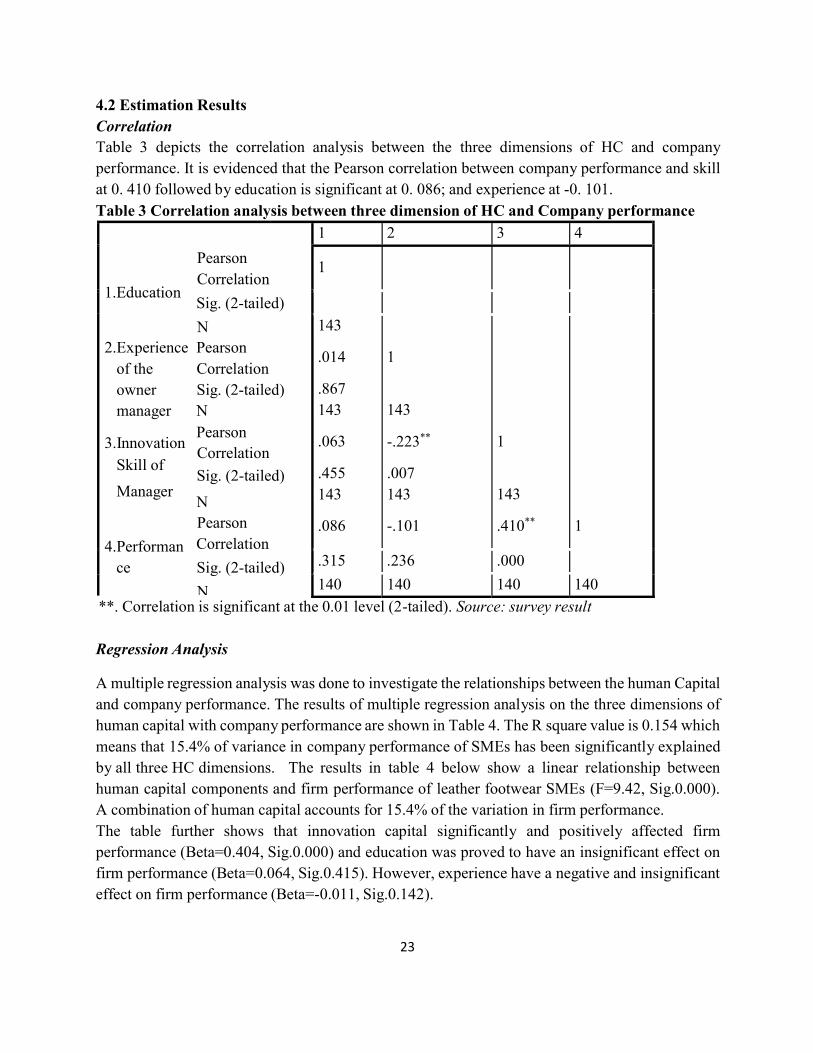
4.2 Estimation Results Correlation Table 3 depicts the correlation analysis between the three dimensions of HC and company performance. It is evidenced that the Pearson correlation between company performance and skill at 0. 410 followed by education is significant at 0. 086; and experience at -0. 101. Table 3 Correlation analysis between three dimension of HC and Company performance
1 2 3 4 Pearson Correlation 1.Education Sig. (2-tailed) N
2.Experience Pearson of the Correlation owner Sig. (2-tailed) manager N
3.Innovation Pearson Correlation Skill of Sig. (2-tailed) Manager N Pearson 4.Performan Correlation
ce Sig. (2-tailed) N
1
143
.014 .867 143
.063 .455 143
.086
1 143 -.223** .007 143
-.101
1 143 .410**
1 .315 .236 .000 140 140 140 140
**. Correlation is significant at the 0.01 level (2-tailed). Source: survey result Regression Analysis A multiple regression analysis was done to investigate the relationships between the human Capital and company performance. The results of multiple regression analysis on the three dimensions of human capital with company performance are shown in Table 4. The R square value is 0.154 which means that 15.4% of variance in company performance of SMEs has been significantly explained by all three HC dimensions. The results in table 4 below show a linear relationship between human capital components and firm performance of leather footwear SMEs (F=9.42, Sig.0.000). A combination of human capital accounts for 15.4% of the variation in firm performance. The table further shows that innovation capital significantly and positively affected firm performance (Beta=0.404, Sig.0.000) and education was proved to have an insignificant effect on firm performance (Beta=0.064, Sig.0.415). However, experience have a negative and insignificant effect on firm performance (Beta=-0.011, Sig.0.142).
24
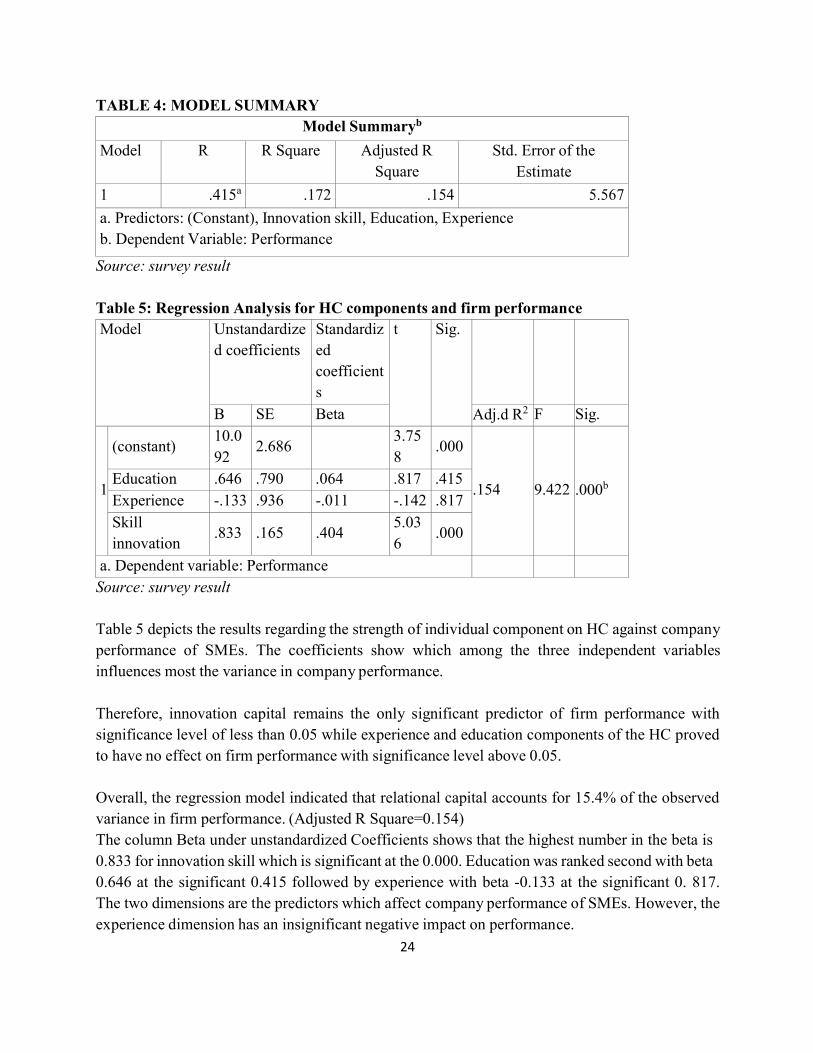
TABLE 4: MODEL SUMMARY Model Summaryb
Model R R Square Adjusted R Square
Std. Error of the Estimate
1 .415a .172 .154 5.567 a. Predictors: (Constant), Innovation skill, Education, Experience b. Dependent Variable: Performance
Source: survey result Table 5: Regression Analysis for HC components and firm performance Model Unstandardize
d coefficients Standardiz ed coefficient s
t Sig.
B SE Beta Adj.d R2 F Sig. 1
(constant) 10.0 92
2.686 3.75 8
.000 .154
9.422
.000b Education .646 .790 .064 .817 .415
Experience -.133 .936 -.011 -.142 .817 Skill innovation
.833 .165 .404 5.03 6
.000 a. Dependent variable: Performance
Source: survey result Table 5 depicts the results regarding the strength of individual component on HC against company performance of SMEs. The coefficients show which among the three independent variables influences most the variance in company performance.
Therefore, innovation capital remains the only significant predictor of firm performance with significance level of less than 0.05 while experience and education components of the HC proved to have no effect on firm performance with significance level above 0.05.
Overall, the regression model indicated that relational capital accounts for 15.4% of the observed variance in firm performance. (Adjusted R Square=0.154) The column Beta under unstandardized Coefficients shows that the highest number in the beta is 0.833 for innovation skill which is significant at the 0.000. Education was ranked second with beta 0.646 at the significant 0.415 followed by experience with beta -0.133 at the significant 0. 817. The two dimensions are the predictors which affect company performance of SMEs. However, the experience dimension has an insignificant negative impact on performance.

25
A significant level of ρ value of less than 0.05 was considered significant in this study. All the quantitative analyses for this study were tested using the Statistical Package for the Social Sciences (SPSS) version 20.0.
5. Conclusion In conclusion, the results of this study offer support for human capitals push on company performance. Moreover, other important implications are that males were more likely to be owners of small scale footwear sector in the study site. Only 16.8 percent of women were sampled in the study. This finding is consistent with previous reports that show that women tend to shy away from owning manufacturing based enterprises (Bird 1989; ICEG et al., 1999). This finding suggests that despite the increased interest in women entrepreneurship (Brush 2007), little progress has been made in encouraging women to venture into male dominated sectors like footwear.
Education was found to be insignificantly associated with the introduction of Company Performance. This finding collaborates the literature that argues that education is not associated with entrepreneurship (Bosma et al. 2008). This is particularly relevant in the Ethiopian situation where the education system has been criticized for promoting rote learning at the expense of creativity and independence.
The estimation results indicate that experience is negatively associated with the Company Performance. This finding partially collaborates the findings reported in Salavous and Loiukas (2003). The differences in the direction of association between experience and Company Performance in these studies are not easy to explain. This situation opens up a research agenda for the future in this study.
Consequently, it is safe to conclude that there is a relationship between human capital factors and in explaining Company Performance. Further, this study offers support to the claim by Barney (1991) that the way a firm is organized, when combined with firm resources, can enhance the positive relationship between resources and performance. It also supports the empirical evidence offered by Wiklund and Shepherd (2003) that the interrelationship between human capital and the way a firm is organized is important in attaining higher company performance.
6. Recommendation Owners The study has shown a clear understanding of Human capital components and they influence firm performance. This promotes the efforts of managers to improve their firms’ performance which can be done through appropriate management of Human capital components. Thus, management should intensify initiatives to encourage greater understanding and acceptance of human capital components that boosts performance in the Ethiopian leather footwear manufacturing sector.
26
In light of this, the understanding of firm performance in relation to human capitals should not be regarded as a phenomenon that only adds ‘more zeros’ in a firm’s profits; it is rather transforming the entire workforce as the most ‘valuable assets’ in order for the organization to pav e ways for greater achievements via innovativeness and creativity. Hence, companies should come up with some effective plans especially in investing the various aspects of human capital as not only does it direct firms to attain greater performance, but also it ensures firms to remain competitive for their long-term survival. In order to boost the wealth of manufacturing leather footwear firms, the management should endeavour to find and employ a viable human capital composition that increases firm performance. Therefore, management should mainly focus on increasing the budget towards funding intellectual activities. This will enable the community to have the company at heart and will always buy from them as a way of pay back. Since there was a significant and positive relationship between innovation capital and firm performance, more capital should be invested in research and development to attract more customers and sale highly in the local market.
Policy makers Policy makers interested in enhancing the development of Company Performance in small firms can benefit from this study. Policy makers should consider the role of HC on Company Performance. The study findings suggest that policy makers should focus on developing the HC strategic competencies of small firms if they wish to enhance the development of Company Performance. Thus, building a fertile entrepreneurial environment will accelerate Company Performance in small firms. The findings of this study can also help to qualify policies for the development of small enterprises particularly in Ethiopia.
Academicians An important theoretical contribution of this study relates to its application of the human capital theory to examine the drivers of Company Performance by firms in a developing economy. Another theoretical significance of this study relates to the ability of this study to link human capital theory and the concept of performance empirically.
7. Suggested Areas for Further Research The study concentrated on capital components and firm performance of manufacturing leather footwear firms. A further study needs to be carried out on how to improve human capital in manufacturing companies not necessarily leather footwear firms. An in-depth research exactly on “How to improve Human capital in manufacturing companies in order to sustain companies in business” is necessary. Further research should be carried out to establish how human capital can be measured over time and how the results from the measurement can improve on managerial decision making for companies.

27
8. Limitation of the Research A limitation of this study is that it is a cross sectional study and, therefore, the causal direction between human capital and company performance can be called into question. While there are conceptual arguments in favor of both human capital in affecting company performance, the other causal direction is also possible. The development of company may enhance the human capital stock. A suitable approach would be to conduct a panel study where data are repeatedly gathered from a cohort of new ventures as this would allow cross-lagged regression analysis, which could help tease out the causal relationship between human capital and Company Performance.
28
References Barney J. (1991). “Firm Resources and Sustained Competitive Advantage.” Journal of
Management 17: 99–120. Baumol, W.J. (2002). The Free-market Innovation Machine. Princeton, NJ: Princeton University
Press. Becker, G.S. (1964). Human Capital: A Theoretical and Empirical Analysis, with Special
Reference to Education. Chicago: University of Chicago Press. Bird J.B. (1989). Entrepreneurial Behaviuor. Illinois: Scott, Foremann and Company Bosma,N., K., Jones, E. Autio and J. Levie (2008). Global Entrepreneurship Monitor 2007
Executive Report. Babson, London Company School and Global Entrepreneurship Research Consortium (GERA).
Available internet: Collis, D.J. and Montgomery, C.A. (1995). Competing on resources: Strategy in the 1990s.
Harvard Business Review. July & August, pp.118-28. Covin, J. G., and Slevin, D. P. (1986). “The Development and Testing of an Organizational – level
Entrepreneurship Scale.” In R. Ronstadt, J. A. Hornaday, R. Peterson, and K. H. Vesper (Eds.), Frontiers of Entrepreneurship Research. 628–639. Wellesley, MA: Babson College.
Garavan, T. N., Morley, M., Gunnigle, P., & Collins, E. (2001). Human Capital accumulation: The role of human resource development. Journal of European Industrial Training, 25(2/3/4), 48-68.
Hosmer, D. W. and Lemeshow, S. (2004) Applied Logistic Regression. New York: Willey-Inter Science.
Khalil-Timamy M.H. (2002). Pursuing Technology Policy Research in Sub-Saharan Africa: Reflections on the Dimensions, Applications and Implications of a Methodological Framework. ATPS Special Paper No. 7. Nairobi: African Technology Policy Studies.
Kreiser P., L. Marino and K.M. Weaver (2002). Assessing the Psychometric Properties of the Entrepreneurial Orientation Scale: A Multi Country Analysis. Entrepreneurial Theory and Practice pp 72 -94
Lumpkin, G. T., and Dess, G. G. (1996). Clarifying the Entrepreneurial Orientation Construct and Linking it to Performance. Academy of Management Review 21 (1), 135 –172.
Marvel M.R. and Lumpin G. T. (2007). Technology Entrepreneurs Human Capital and its Effects on Innovation Radicalness. Entrepreneurial Theory and Practice. 807-828
McKelvie, A. (2007) “Innovation in New Firms: Examining the Role of Knowledge and Growth Willingness,” Ph.D dissertation. University of Jonkoping. Jonkoping International Company School Disertation Number 038.
Miller, D. (1983). The Correlates of Entrepreneurship in Three Types of Firms. Management Science, 29 (7), 70-791.
Matanda M. (2007). “Entrepreneurial Orientation and Company Performance by Small Scale Footwear sector in Nairobi,” paper presented at the 1st International Conference on Micro, Small and Medium Enterprises (MSMEs) Organised by Centre for Enterprise and
29
Entrepreneurship Development, School of Company , Kenyatta University Held on Novemeber 14th -17th at Kenyatta University, Nairobi
Mukras M. S. (1993) Elementary Econometrics Theory, Application and Policy. Nairobi: East African Educational Publishers.
Nordhaug, O. (1998). Competencies specificities in organizations. International Studies of Management and Organisation, 28(1), 8-29.
Organization for Economic Co-operation and Development (OECD) (2001). The Well- Being of Nations: The Role of Human and Social Capital. Paris: OECD.
Rauch A., J. Wiklund, M. Frese, and G.I. Lumpkin (2006). Entrepreneurial Orientation and Company Performance: Cumulative Empirical Evidence. Entrepreneurship Theory and Practice 30 (2), 145-160.
Robertson, I. T., Iles, P. A., Gratton, L., & Sharpley, D. (1991). The psychological impact of selection procedures on candidates. Human Relations, 44, 1963-1982.
Salavou H. and S. Lioukas (2003). Company Performance in SMEs: The Dominance of Entrepreneurial Orientation. Creativity and Innovation Management 12 (2), 94 -108
Saunders M., Lewis P. and Thornhill A. (2003). Research Methods for Company Students. London: Prentice Hall.
Shane, S. and Eckhardt, J. (2003). Opportunities and Entrepreneurship. Journal of Management, 29 (3), 333-49.
Shane S. (2000). Prior knowledge and the Discovery of Entrepreneurial Opportunities. Organization Science 11: 448–469.
Shane S. and Venkataraman S. (2000). The Promise of Entrepreneurship as a Field of Research. Academy of Management Review. 25: 217–226.
Schultz, T.W. (1993). The economic importance of human capital in modernization. Education Economics, 1(1), 13-19.
Schumpeter, J. A. (1942). Capitalism, Socialism, and Democracy. New York: Harper and Brothers.
Seleim, A., Ashour, A., & Bontis, N. (2007). Human capital and organizational performance: A study of Egyptian software companies. Management Decision. 45(4), 789-801.
Snell, S.A., Lepak, D.P. and Youndt, M.A. (1999). Managing the architecture of intellectual capital: implications for strategic human resource management, in Ferris, G.R. (Ed.). Research in Personnel and Human Resource Management. S4 159-74.
Umer a.a. (2012); The Dynamics of Internationalization of Ethiopian Leather Industry Development Institute, AAU MSc thesis economics department
Venkataraman, S. (1997). The Distinctive Domain of Entrepreneurship Research: An Editor’s Perspective. In J.A. Katz (Ed.), Advances in Entrepreneurship, Firm Emergence and Growth. (3) 119–138. Greenwich, CT: JAI Press.
Wiklund J. and Shepherd D. (2003). Knowledge-based Resources, Entrepreneurial Orientation, and the Performance of Small and Medium-sized Company es. Strategic Management Journal 24: 1307–1314.
30
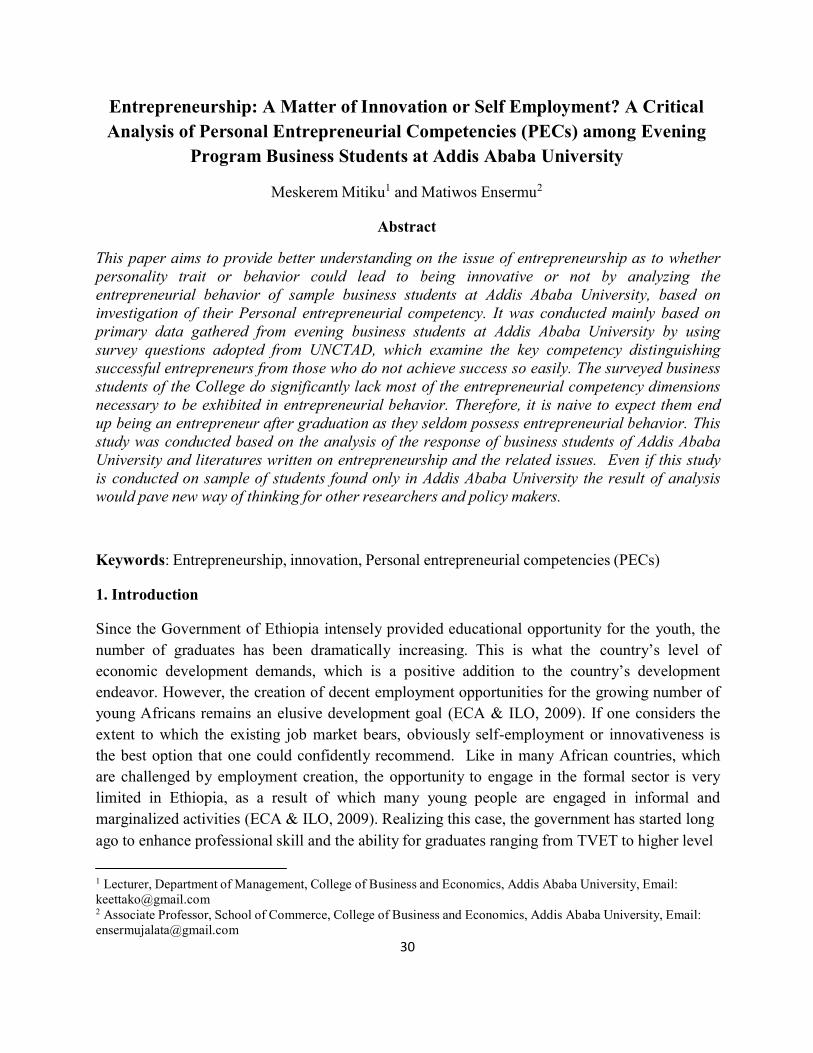
Entrepreneurship: A Matter of Innovation or Self Employment? A Critical Analysis of Personal Entrepreneurial Competencies (PECs) among Evening
Program Business Students at Addis Ababa University Meskerem Mitiku1 and Matiwos Ensermu2 Abstract This paper aims to provide better understanding on the issue of entrepreneurship as to whether personality trait or behavior could lead to being innovative or not by analyzing the entrepreneurial behavior of sample business students at Addis Ababa University, based on investigation of their Personal entrepreneurial competency. It was conducted mainly based on primary data gathered from evening business students at Addis Ababa University by using survey questions adopted from UNCTAD, which examine the key competency distinguishing successful entrepreneurs from those who do not achieve success so easily. The surveyed business students of the College do significantly lack most of the entrepreneurial competency dimensions necessary to be exhibited in entrepreneurial behavior. Therefore, it is naive to expect them end up being an entrepreneur after graduation as they seldom possess entrepreneurial behavior. This study was conducted based on the analysis of the response of business students of Addis Ababa University and literatures written on entrepreneurship and the related issues. Even if this study is conducted on sample of students found only in Addis Ababa University the result of analysis would pave new way of thinking for other researchers and policy makers. Keywords: Entrepreneurship, innovation, Personal entrepreneurial competencies (PECs) 1. Introduction Since the Government of Ethiopia intensely provided educational opportunity for the youth, the number of graduates has been dramatically increasing. This is what the country’s level of economic development demands, which is a positive addition to the country’s development endeavor. However, the creation of decent employment opportunities for the growing number of young Africans remains an elusive development goal (ECA & ILO, 2009). If one considers the extent to which the existing job market bears, obviously self-employment or innovativeness is the best option that one could confidently recommend. Like in many African countries, which are challenged by employment creation, the opportunity to engage in the formal sector is very limited in Ethiopia, as a result of which many young people are engaged in informal and marginalized activities (ECA & ILO, 2009). Realizing this case, the government has started long ago to enhance professional skill and the ability for graduates ranging from TVET to higher level 1 Lecturer, Department of Management, College of Business and Economics, Addis Ababa University, Email: [email protected] 2 Associate Professor, School of Commerce, College of Business and Economics, Addis Ababa University, Email: [email protected]
31
graduates to create their own employment, by offering entrepreneurship as a course at the level of degree granting universities and different training institutions (FDRE & MOFED, 2002).
However, the basic thing to be considered her is that, does anyone graduated with or taken entrepreneurship training become an entrepreneur? The answer might be yes and/or no. Peter F Druker argues that:
“Entrepreneurship is not a personality trait; in thirty years I have seen people of the most diverse personalities and temperaments perform well in entrepreneurial challenges. To be sure, people who need certainty are unlikely to make good entrepreneurs. But such people are unlikely to do well in a host of other activities as well—in politics, for instance, or in command positions in a military service, or as the captain of an ocean liner. In all such pursuits decisions have to be made, and the essence of any decision is uncertainty. But everyone who can face up to decision making can learn to be an entrepreneur and to behave entrepreneurially. Entrepreneurship, then, is behavior rather than personality trait.”(Drucker, 1993)
Entrepreneurial competence is beyond personality traits. Competency is a combination of experiences, knowledge, skills and attitude that a person acquires for effective performance in a task or job. Entrepreneurial competency is associated with individual characteristics (Kaur, 2013), and because they represent the flexible, learnable, and dynamic criteria of entrepreneurship activity (Santos, Caetano, & Curral, 2014), Drucker (1993) argues that Entrepreneurship is neither a science nor an art, rather it is a practice.
With the current notion of Entrepreneurship context in Ethiopia, the training has long been focused on the issue of self-employment for graduates and the youth, in general, as the government is desperate to reduce youth unemployment than creation of entrepreneurial competency that is characterized by innovation and risk-taking (decision making) with the objective of creating economic and social benefit to the society.
Under all circumstances it is difficult to say that all entrepreneurs or entrepreneurship provide productive contribution to the nation or society’s wealth/income, and it depends on the entrepreneur’s motive whether there is the need for freedom to exercise creativity, power, and prestige or what so ever (Stam, 2008). However, according to Drucker (1993), an innovation should yield change in market or society, produce capacity for the society, higher value or greater satisfaction, i.e., innovation is described in terms of what it does for the user, indicating that entrepreneurship always needs to be market driven. In a similar manner, ECA and ILO (2009), also characterize entrepreneurship as the process of creating value, innovating, and taking risk that has both economic and potentially social benefit, which goes beyond just self- employment. Despite these debates among scholars, in the context of Ethiopia, apart from giving different entrepreneurial trainings, no research has been carried out to investigate entrepreneurial behavior as to whether it leads to a real innovation or ends up in self-employment.
32
In general, the purpose of this research is to investigate the distinctive personality behavior of evening program business students at Addis Ababa University, as to whether they do possess entrepreneurial quality for innovation or may end up in simply become self-employed or get employed.
1.1. Background of the Study The downside of the government’s focus on creating an efficient civil service is that independent entrepreneurship has never been encouraged. Successful entrepreneurs are not seen as important role models in Ethiopian society and opportunities for advancement are more often sought in the public sector than in entrepreneurship. During the Imperial regime, private investment in import- substituting industries was encouraged, but no performance requirements were imposed on protected industries and little effort was made to develop technological capability and promote exports (Ethiopian Economic Association 2005, 63 f.). Hence the policy helped to advance industrialization, but not competitive entrepreneurship.
During the socialist dictatorship of the Derg (1974-1990), entrepreneurial activities were suppressed and private medium and large enterprises nationalized, discouraging private sector activities (Brixiova & Asaminew, 2010). Nevertheless, the incoming EPRDF-led government recognized the need for a market economy and adopted a pragmatic economic policy, which encourages rapid growth of private sector, (Brixiova & Asaminew, 2010; Tilman, 2010), even if it is restricted to exceptional sectors such as leather and flowers until recent times (Brixiova & Asaminew, 2010).
Even if the SME policy served job creation scheme that is providing poor people a decent source of base income, it does little to nurture innovation and growth oriented entrepreneurship. (Tilman, 2010). The productive SME are still underdeveloped, and the urban labor market is characterized by persistently high unemployment, which is affecting the young people (Brixiova & Asaminew, 2010).
1.2. Problem Statement It has been long since entrepreneurship is recognized as a development engine for not only Ethiopia but also the entire world. However, the contribution of productive entrepreneurship to growth and employment has been limited, especially in low income and fragile countries (Brixiova & Ncube, 2013). Particularly, Ethiopian economy is heavily reliant on agriculture, and since mid-2000, the government also has shifted its attention towards modernization of agriculture and high levels of public investment (in infrastructure, public enterprises). It is only recently that the role of entrepreneurship has been recognized and a number of institutions have been established to enhance entrepreneurial skills of the workforce of the country including that of graduating students. Albeit such an attempt is made, entrepreneurial competitiveness of the
33
country is rated low; some attributed such poor competitiveness to a weak business environment and policy (Brixiova & Ncube, 2013), while others signify the importance of more sophisticated skill as the most important factor for competitiveness (UNDP, 2012). In a similar manner, a study conducted by Kellow et al.(2010) revealed the problems of mismatch of skill, i.e., starting a small business without the capacity to sustain it or scope with other related challenges as a problem for competency which leads to unemployment of the youth3 .
Entrepreneurship involves innovating new product, process, and tools by taking risk. It is not about duplicating some activities or processes that are already available (Drucker, 1993) to be entrepreneurial, an enterprise has to have special characteristics over and above being new and small (Ibid). Even if all new small businesses have many factors in common, for entrepreneurial ventures entrepreneurial competency is very vital for survival and competitiveness of businesses, whether small or large ones (Kaur, 2013).
In the context of Ethiopia, regardless of the attempts made by the government as well as different training institutions, personal competency of individual potential and actual entrepreneurs has not been assessed so far.
Thus, the general purpose of this research is to assess the level of personal competency among evening students of Addis Ababa University in the College of Business and Economics, while answering the following research questions.
1.3. Research Questions The general research question deemed to get answer through this research is: What are the Personal Entreprenurial Competencies that business students’ possess? And, What is the implication of such qualities for entrepreneurship? (Does it end up in innovativeness or self-employment?)
1.4. Scope of the Study This study was undertaken in the case of higher education business students attending evening program at Addis Ababa University, where the to be entrepreneurs are hoped to be. Since entrepreneurship requires entrepreneurial competency, entrepreneurial behavior of these students was assessed using personal entrepreneurial competency variables. Students of Addis Ababa University were chosen for this particular research, because of accessibility of the unit of analysis and the limited time frame during which this research was conducted. 3 Youth is defined here as those persons between the ages of 18 and 24 years
34
1.5. Limitation of the Study Despite the contributions this research makes, there are nevertheless some limitations. The composition and size of the samples considered for the purpose of this research pause some limitations making it less generalizable in the context of other students.
2. Review of Related Literature 2.1. Entrepreneurs and Entrepreneurship The word entrepreneur is derived from the French word “entreprendre’, which means to do something, and in the Middle era it was originally used in the sense of a person who is active, and gets things done (Kaur, 2013).
Entrepreneurs are marvelous people who are capable of devising new ideas, evaluating opportunities and risks, or starting and running a business (Wu, 2009). Entrepreneurs bring to light the resources, technologies and trading opportunities that make economic development possible (Harper, 2003). Entrepreneurship is, therefore, about creation of ‘social and economic value’ which could be applied to both private, entrepreneurial ventures as well as social enterprises (Chell, 2007). It is not about duplicating or copying technologies, processes or working system, rather, it is all about invention and innovation of new product, service, processor system.
2.2. Entrepreneurship, Innovation and Self-employment “An entrepreneur wakes up and he says; Good Morning Lord, I thank you for your abundant blessings. A man with a mindset of poverty, wakes and laments, he says; O Lord, it is another morning. Can I continue this way? Why the lamentation when there is the entrepreneurship option?”(Raheem, 2010), Entrepreneurs see every day and incidence as an opportunity to innovate new things, they consider change as the norm and as healthy. Entrepreneur usually do not bring about the change themselves, but they always search for change, responds to it, and exploit it as an opportunity (Drucker, 1993).
Innovation and entrepreneurship are considered interwoven, which is apparent for start up and running enterprise. Thus some scholars perceive entrepreneurship as a micro deriver of innovation (Stam, 2008).
Innovation is the successful implementation of creative ideas within an organization; it is a starting point for innovation, but is not a sufficient condition by itself. Creativity is not the quality of a person (i.e., whatever a creative person does must not be creative), rather creativity arises from a particular behaviour and results in a particular product or idea.
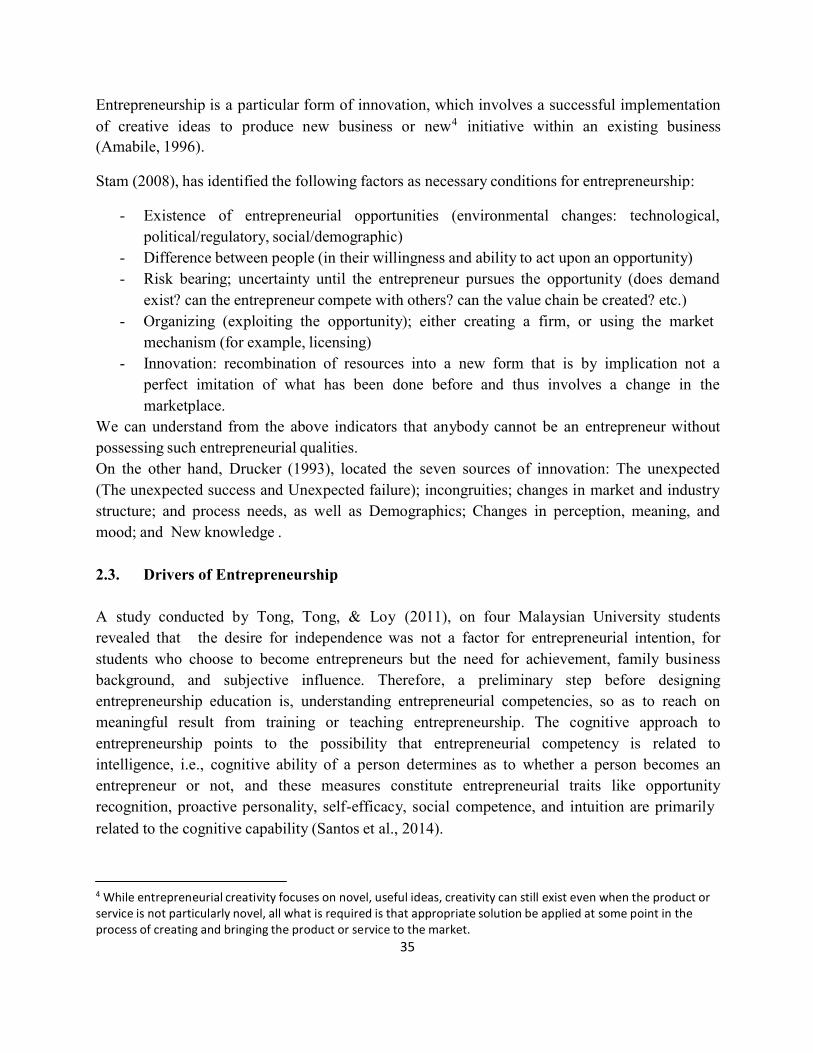
35
Entrepreneurship is a particular form of innovation, which involves a successful implementation of creative ideas to produce new business or new4 initiative within an existing business (Amabile, 1996).
Stam (2008), has identified the following factors as necessary conditions for entrepreneurship: - Existence of entrepreneurial opportunities (environmental changes: technological, political/regulatory, social/demographic)
- Difference between people (in their willingness and ability to act upon an opportunity) - Risk bearing; uncertainty until the entrepreneur pursues the opportunity (does demand
exist? can the entrepreneur compete with others? can the value chain be created? etc.) - Organizing (exploiting the opportunity); either creating a firm, or using the market
mechanism (for example, licensing) - Innovation: recombination of resources into a new form that is by implication not a
perfect imitation of what has been done before and thus involves a change in the marketplace.
We can understand from the above indicators that anybody cannot be an entrepreneur without possessing such entrepreneurial qualities. On the other hand, Drucker (1993), located the seven sources of innovation: The unexpected (The unexpected success and Unexpected failure); incongruities; changes in market and industry structure; and process needs, as well as Demographics; Changes in perception, meaning, and mood; and New knowledge .
2.3. Drivers of Entrepreneurship A study conducted by Tong, Tong, & Loy (2011), on four Malaysian University students revealed that the desire for independence was not a factor for entrepreneurial intention, for students who choose to become entrepreneurs but the need for achievement, family business background, and subjective influence. Therefore, a preliminary step before designing entrepreneurship education is, understanding entrepreneurial competencies, so as to reach on meaningful result from training or teaching entrepreneurship. The cognitive approach to entrepreneurship points to the possibility that entrepreneurial competency is related to intelligence, i.e., cognitive ability of a person determines as to whether a person becomes an entrepreneur or not, and these measures constitute entrepreneurial traits like opportunity recognition, proactive personality, self-efficacy, social competence, and intuition are primarily related to the cognitive capability (Santos et al., 2014). 4 While entrepreneurial creativity focuses on novel, useful ideas, creativity can still exist even when the product or service is not particularly novel, all what is required is that appropriate solution be applied at some point in the process of creating and bringing the product or service to the market.

36
A study conducted by Izquierdo & Deschoolmeester (2008), towards investigation of specific competency indicators on Ecuadorian entrepreneurs and academicians revealed that entrepreneurs rate decision making as a very important quality to embark on and run an entrepreneurial venture, while academicians are in favor of identifying business opportunity, risk taking behavior and innovative thinking were given low rate, among both entrepreneurs and the academicians. A common concern among academics is to get students to become more entrepreneurial and more innovative for such purpose, and this could be achieved by applying management techniques such as adding value to customers (Drucker, 1993).
3. Research Methodology Under this section, source of data, method of collection of data, population and sample are included andmethod of analyzing the collected data are presented.
3.1. Research Design, Source of Data and Method of Collection The study deployed perception survey of evening program business students of Addis Ababa
University to measure their personal entrepreneurial competence dimensions identified and used by UNCTAD. There are two sources of data: primary and secondary; the primary source helps in getting first- hand information from participants, while secondary data is the type of data that has been collected by other researchers for different purpose. In the case of this research both primary and secondary data were utilized for analysis.
Primary data will be gathered using structured questionnaire that is to be adopted from the entrepreneurial personal competency measurement dimensions developed by ‘‘empretec’’ UNCTAD. UNCTAD adopted the key competency distinguishing successful entrepreneurs from those who do not achieve success so easily from the work of David McClelland (Psychologist from Harvard University), and categorized the ten personal entrepreneurial competencies (PECs)5 into three major clusters as follow: 5 Personal Competency: Personal competency refers to” important personal qualities and abilities of the competencies that help in building up personal strength and enhance an individual effectiveness in performing certain challenging tasks such as managing one’s own business”(Kaur, 2013).
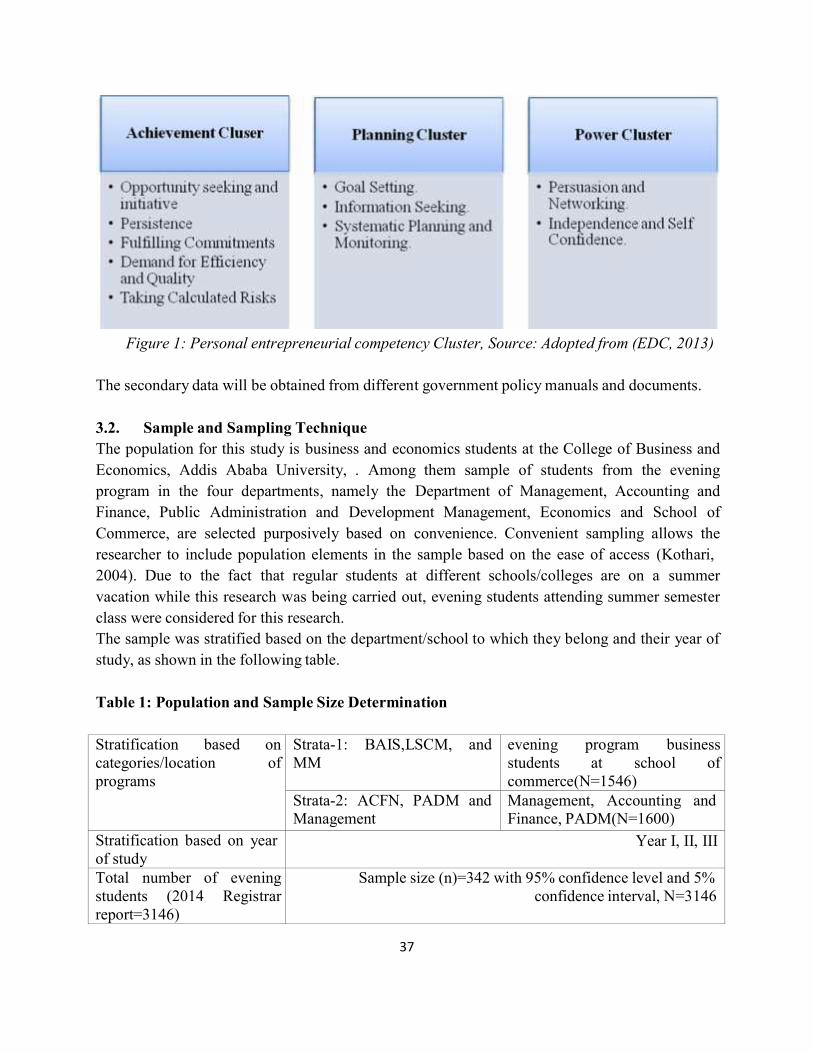
37
Figure 1: Personal entrepreneurial competency Cluster, Source: Adopted from (EDC, 2013)
The secondary data will be obtained from different government policy manuals and documents. 3.2. Sample and Sampling Technique
The population for this study is business and economics students at the College of Business and Economics, Addis Ababa University, . Among them sample of students from the evening program in the four departments, namely the Department of Management, Accounting and Finance, Public Administration and Development Management, Economics and School of Commerce, are selected purposively based on convenience. Convenient sampling allows the researcher to include population elements in the sample based on the ease of access (Kothari, 2004). Due to the fact that regular students at different schools/colleges are on a summer vacation while this research was being carried out, evening students attending summer semester class were considered for this research. The sample was stratified based on the department/school to which they belong and their year of study, as shown in the following table.
Table 1: Population and Sample Size Determination Stratification based on
categories/location of programs
Strata-1: BAIS,LSCM, and MM
evening program business students at school of commerce(N=1546)
Strata-2: ACFN, PADM and Management
Management, Accounting and Finance, PADM(N=1600)
Stratification based on year of study Year I, II, III Total number of evening students (2014 Registrar report=3146)
Sample size (n)=342 with 95% confidence level and 5% confidence interval, N=3146
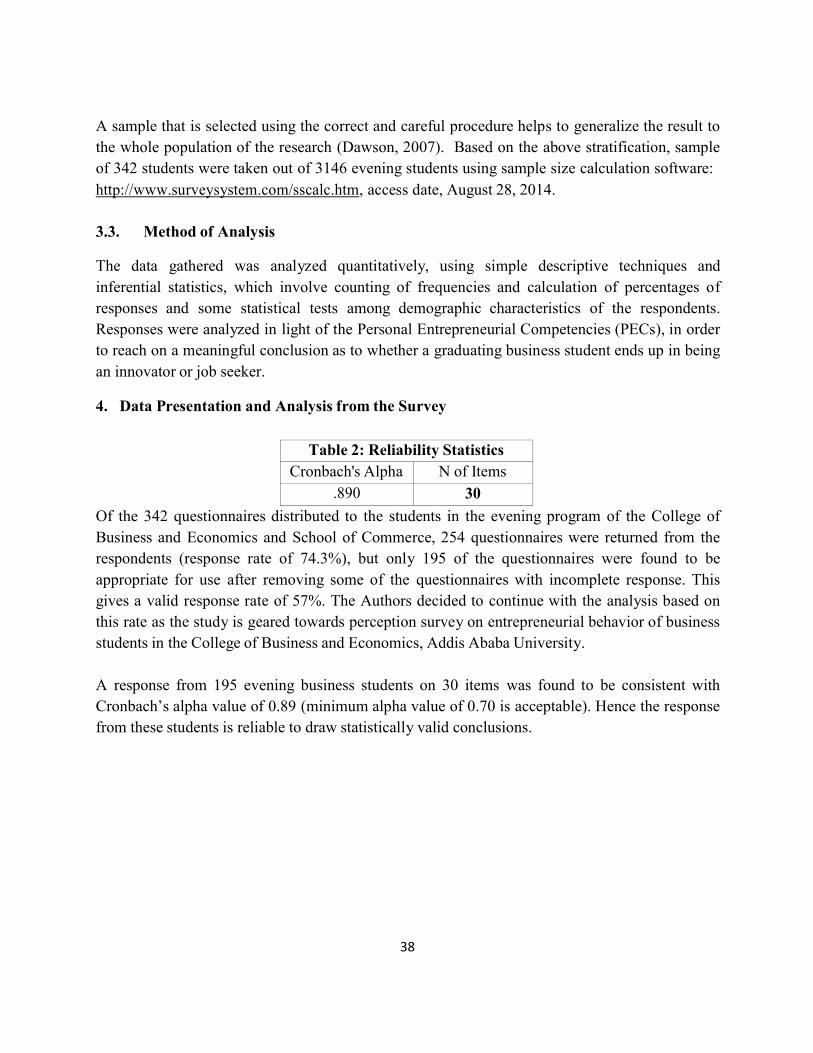
38
A sample that is selected using the correct and careful procedure helps to generalize the result to the whole population of the research (Dawson, 2007). Based on the above stratification, sample of 342 students were taken out of 3146 evening students using sample size calculation software: http://www.surveysystem.com/sscalc.htm, access date, August 28, 2014.
3.3. Method of Analysis The data gathered was analyzed quantitatively, using simple descriptive techniques and inferential statistics, which involve counting of frequencies and calculation of percentages of responses and some statistical tests among demographic characteristics of the respondents. Responses were analyzed in light of the Personal Entrepreneurial Competencies (PECs), in order to reach on a meaningful conclusion as to whether a graduating business student ends up in being an innovator or job seeker.
4. Data Presentation and Analysis from the Survey Table 2: Reliability Statistics
Cronbach's Alpha N of Items .890 30
Of the 342 questionnaires distributed to the students in the evening program of the College of Business and Economics and School of Commerce, 254 questionnaires were returned from the respondents (response rate of 74.3%), but only 195 of the questionnaires were found to be appropriate for use after removing some of the questionnaires with incomplete response. This gives a valid response rate of 57%. The Authors decided to continue with the analysis based on this rate as the study is geared towards perception survey on entrepreneurial behavior of business students in the College of Business and Economics, Addis Ababa University.
A response from 195 evening business students on 30 items was found to be consistent with Cronbach’s alpha value of 0.89 (minimum alpha value of 0.70 is acceptable). Hence the response from these students is reliable to draw statistically valid conclusions.

39
Table 3: Gender of Respondents * Department of respondents Cross-tabulation Department of respondents Total Accounting
and Finance Manageme
nt PAD
M School of Commerce
Gender of Respondents
Male 28 43 1 44 116(59.5%) Female 19 22 1 37 79(40.5%)
Total 47 65 2 81 195 Source: Survey, 2014 Data from the three Departments and School of Commerce were gathered from the personal entrepreneurial competency measurement metric used to demonstrate entrepreneurial behavior of business students of the College of business and Economics. Accordingly, 116 (59.5%) of the respondents are male while 79 (40.5%) of the 195 respondents are female.
Table 4: Gender of Respondents * Class Year Cross-tabulation Class Year Year I Year II Year III Total Gender of Respondents
Male 30 21 65 116 Female 14 29 36 79
Total 44 50 101 195 Source: Survey, 2014
Among the 195 respondents, 44(22%) of them are year I students, 50 (25.6%) are year II students, and the remaining 101 (51.7%) respondents are year III evening business students. This shows that the majority of the respondents are senior students of year three with a one year academic year left and appropriate time to demonstrate entrepreneurial competence whether to start own business or not.
Table 5: Job Owner
Frequency Percent
Valid Percent
Cumulative Percent
Valid Yes 165 84.6 84.6 84.6 No 30 15.4 15.4 100.0 Total 195 100.0 100.0
Source: Survey, 2014
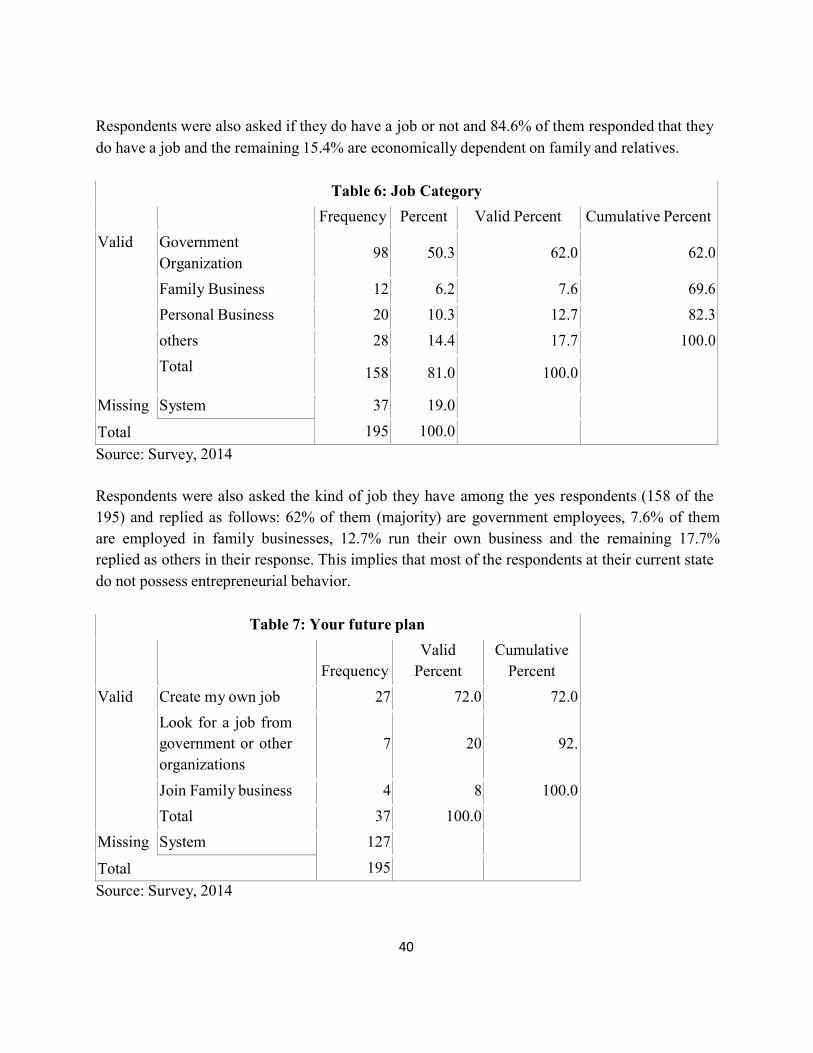
40
Respondents were also asked if they do have a job or not and 84.6% of them responded that they do have a job and the remaining 15.4% are economically dependent on family and relatives.
Table 6: Job Category Frequency Percent Valid Percent Cumulative Percent Valid Government
Organization 98 50.3 62.0 62.0
Family Business 12 6.2 7.6 69.6 Personal Business 20 10.3 12.7 82.3 others 28 14.4 17.7 100.0 Total 158 81.0 100.0
Missing System 37 19.0 Total 195 100.0 Source: Survey, 2014
Respondents were also asked the kind of job they have among the yes respondents (158 of the 195) and replied as follows: 62% of them (majority) are government employees, 7.6% of them are employed in family businesses, 12.7% run their own business and the remaining 17.7% replied as others in their response. This implies that most of the respondents at their current state do not possess entrepreneurial behavior.
Table 7: Your future plan Frequency
Valid Percent
Cumulative Percent
Valid Create my own job 27 72.0 72.0 Look for a job from government or other organizations
7 20
92.
Join Family business 4 8 100.0 Total 37 100.0
Missing System 127 Total 195 Source: Survey, 2014

41
Respondents who didn’t have a job (37) were also asked to reflect what their future plan would be and replied as stated below: 72% responded their future plan be to create their own job (self- employment), 20% replied to look for job from government or other organizations and the remaining 8 % replied to join family businesses in the future (possibly after graduation). From the above respondents’ data, it can be inferred that neither those who seek job from government or other organizations nor those who would join family businesses after graduation demonstrate entrepreneurial behavior. On the other hand, those with the tendency to create their own job in the future may not necessarily demonstrate entrepreneurial competence beyond self-employment.
Table 8: Prior business related experience
Frequency Percent
Valid Percent
Cumulative Percent
Valid Yes 99 50.8 52.1 52.1 No 91 46.7 47.9 100.0 Total 190 97.4 100.0
Missing System 5 2.6 Total 195 100.0 Source: Survey, 2014
Respondents were asked to respond whether they have prior business experience or not, and majority of them do have business related experience (52.1%), while the remaining 47.9% do not have any business-related experience. Respondents with business related experience may give them an opportunity to tend to behave in an entrepreneurial way.
Table 9: Personal Entrepreneurial Competency Measurement Descriptive Statistics
N
Mi n
Max
Mean Std.
Deviat ion
Opportunity seeking and Initiative Taking 195 .00 3.00 4.1333 .65570 Independence and self confidence 195 .00 3.00 4.0752 .68030 Persuasion and networking 195 .00 3.00 4.0154 .70450 Taking calculated risks 195 .00 3.00 3.0137 .64999 Information seeking 195 .00 3.00 3.0085 .71351 Systematic Planning and Monitoring 195 .00 3.00 2.9470 .72592 Persistence 195 .00 2.67 2.8940 .68375 Goal Setting 195 .00 3.67 2.8274 .68726
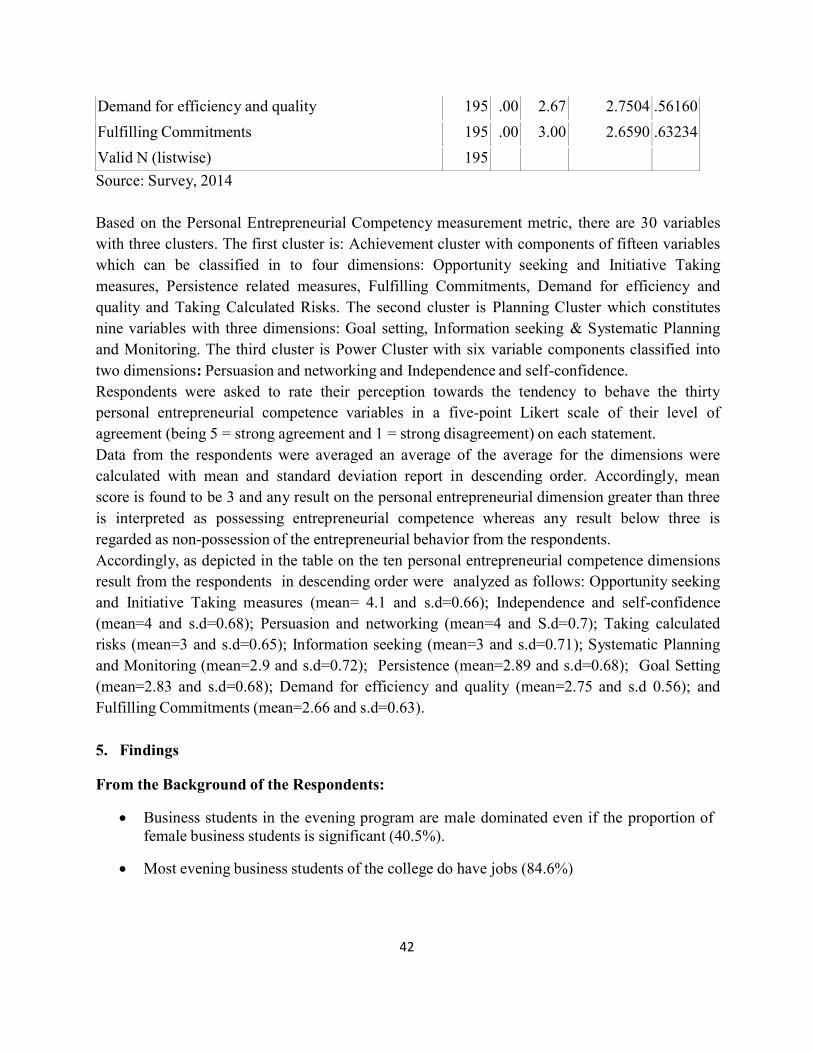
42
Demand for efficiency and quality 195 .00 2.67 2.7504 .56160 Fulfilling Commitments 195 .00 3.00 2.6590 .63234 Valid N (listwise) 195 Source: Survey, 2014
Based on the Personal Entrepreneurial Competency measurement metric, there are 30 variables with three clusters. The first cluster is: Achievement cluster with components of fifteen variables which can be classified in to four dimensions: Opportunity seeking and Initiative Taking measures, Persistence related measures, Fulfilling Commitments, Demand for efficiency and quality and Taking Calculated Risks. The second cluster is Planning Cluster which constitutes nine variables with three dimensions: Goal setting, Information seeking & Systematic Planning and Monitoring. The third cluster is Power Cluster with six variable components classified into two dimensions: Persuasion and networking and Independence and self-confidence. Respondents were asked to rate their perception towards the tendency to behave the thirty personal entrepreneurial competence variables in a five-point Likert scale of their level of agreement (being 5 = strong agreement and 1 = strong disagreement) on each statement. Data from the respondents were averaged an average of the average for the dimensions were calculated with mean and standard deviation report in descending order. Accordingly, mean score is found to be 3 and any result on the personal entrepreneurial dimension greater than three is interpreted as possessing entrepreneurial competence whereas any result below three is regarded as non-possession of the entrepreneurial behavior from the respondents. Accordingly, as depicted in the table on the ten personal entrepreneurial competence dimensions result from the respondents in descending order were analyzed as follows: Opportunity seeking and Initiative Taking measures (mean= 4.1 and s.d=0.66); Independence and self-confidence (mean=4 and s.d=0.68); Persuasion and networking (mean=4 and S.d=0.7); Taking calculated risks (mean=3 and s.d=0.65); Information seeking (mean=3 and s.d=0.71); Systematic Planning and Monitoring (mean=2.9 and s.d=0.72); Persistence (mean=2.89 and s.d=0.68); Goal Setting (mean=2.83 and s.d=0.68); Demand for efficiency and quality (mean=2.75 and s.d 0.56); and Fulfilling Commitments (mean=2.66 and s.d=0.63).
5. Findings From the Background of the Respondents: Business students in the evening program are male dominated even if the proportion of female business students is significant (40.5%).
Most evening business students of the college do have jobs (84.6%)
43
Majority of the evening business of the college are government employed (62%) and only 12.7% run their own business (this part demonstrates some part of entrepreneurial behavior).
Majority of the respondents (52.1%) do have prior business-related experience. Of those students who do not have a job, most of them have a future plan to create their
own job (72%). From Personal Entrepreneurial Competence Dimensions: Based on the results of the survey from evening business students of the College of Business and Economics, they tend to show entrepreneurial behavior on the opportunity seeking and initiative taking, independence and self-confidence, and persuasion and networking.
The evening business students of the college do not possess entrepreneurial behavior on systematic planning and monitoring, persistence, goal setting, demand for efficiency and quality and fulfilling commitments.
Evening business students of the College have average score on risk taking behavior and information seeking behavior, which is not adequate enough to be an entrepreneur.
6. Conclusion The surveyed business students of the College do significantly lack most of the entrepreneurial competency dimensions necessary to be exhibited in entrepreneurial behavior. Therefore, it is naive to expect them end up being an entrepreneur after graduation as they seldom possess entrepreneurial behavior. Therefore, to be an entrepreneur, the students should first be innovators and risk takers
7. Implication for Decision Makers Entrepreneurship is not mere self-employment or duplication of existing business practice. It requires entrepreneurial behavior to be demonstrated by the person by possessing the required personal entrepreneurial competence. This in turn requires the government to commit huge investment in entrepreneurship education and rigorous training to possess the personal entrepreneurial competence required to demonstrate entrepreneurial behavior. The entrepreneurial behavior is demonstrated through innovation (value addition on the existing goods and services) and risk taking. Therefore, to be an entrepreneur, the students should first be innovators and risk takers.
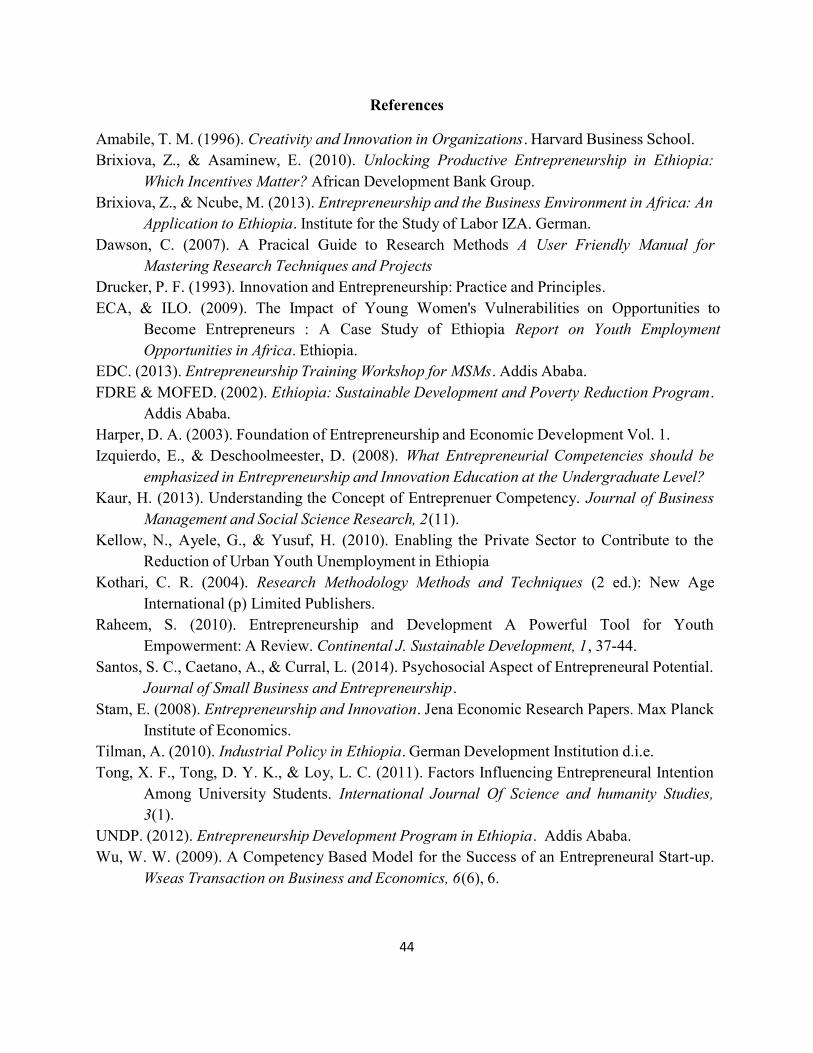
44
References Amabile, T. M. (1996). Creativity and Innovation in Organizations. Harvard Business School. Brixiova, Z., & Asaminew, E. (2010). Unlocking Productive Entrepreneurship in Ethiopia:
Which Incentives Matter? African Development Bank Group. Brixiova, Z., & Ncube, M. (2013). Entrepreneurship and the Business Environment in Africa: An
Application to Ethiopia. Institute for the Study of Labor IZA. German. Dawson, C. (2007). A Pracical Guide to Research Methods A User Friendly Manual for
Mastering Research Techniques and Projects Drucker, P. F. (1993). Innovation and Entrepreneurship: Practice and Principles. ECA, & ILO. (2009). The Impact of Young Women's Vulnerabilities on Opportunities to
Become Entrepreneurs : A Case Study of Ethiopia Report on Youth Employment Opportunities in Africa. Ethiopia.
EDC. (2013). Entrepreneurship Training Workshop for MSMs. Addis Ababa. FDRE & MOFED. (2002). Ethiopia: Sustainable Development and Poverty Reduction Program.
Addis Ababa. Harper, D. A. (2003). Foundation of Entrepreneurship and Economic Development Vol. 1. Izquierdo, E., & Deschoolmeester, D. (2008). What Entrepreneurial Competencies should be
emphasized in Entrepreneurship and Innovation Education at the Undergraduate Level? Kaur, H. (2013). Understanding the Concept of Entreprenuer Competency. Journal of Business
Management and Social Science Research, 2(11). Kellow, N., Ayele, G., & Yusuf, H. (2010). Enabling the Private Sector to Contribute to the
Reduction of Urban Youth Unemployment in Ethiopia Kothari, C. R. (2004). Research Methodology Methods and Techniques (2 ed.): New Age
International (p) Limited Publishers. Raheem, S. (2010). Entrepreneurship and Development A Powerful Tool for Youth
Empowerment: A Review. Continental J. Sustainable Development, 1, 37-44. Santos, S. C., Caetano, A., & Curral, L. (2014). Psychosocial Aspect of Entrepreneural Potential.
Journal of Small Business and Entrepreneurship. Stam, E. (2008). Entrepreneurship and Innovation. Jena Economic Research Papers. Max Planck
Institute of Economics. Tilman, A. (2010). Industrial Policy in Ethiopia. German Development Institution d.i.e. Tong, X. F., Tong, D. Y. K., & Loy, L. C. (2011). Factors Influencing Entrepreneural Intention
Among University Students. International Journal Of Science and humanity Studies, 3(1).
UNDP. (2012). Entrepreneurship Development Program in Ethiopia. Addis Ababa. Wu, W. W. (2009). A Competency Based Model for the Success of an Entrepreneural Start-up.
Wseas Transaction on Business and Economics, 6(6), 6.
45
A Preliminary Survey of Corporate Governance Practices
in the Ethiopian Banks
Tsegabrhan Mekonen1 and Fenta Mandefro2 Abstract Corporate governance is a topical issue and has become popular attracting the attention of shareholders and various groups of stakeholders especially after the corporate scandals and financial crisis of the recent times. These malpractices have eroded the public confidence in corporate governance structure and process and also the ability of boards to direct and oversee management. The financial crises and related problems have demanded a sharp focus on corporate governance that relate to boards’ role, appropriate structure and process capable of avoiding corporate failures occurring in the future. In view of the above, this study was conducted to examine and gain an understanding of corporate governance practices of the Ethiopian banks and reflect whether the practices follow internationally recognized best practices like OEDC and the Cadbury report. A survey method was used to collect data from both private and public banks’ board of directors, presidents, and board secretaries. The findings show that stakeholders’ perceptions of various aspects of corporate governance practices, as beginners, were found out to be not bad. However, Ethiopia like many emerging economies has not yet fully developed the legal and regulatory systems. Furthermore, the enforcement capacities of the regulatory organ are at a nascent stage, and a private sector that is able to support effective corporate governance has yet to emerge. The boards of directors can be characterized mainly as control oriented rather than strategic or service oriented leaders.
Keywords: Corporate governance, Board of directors, Governing body, OECD, Stakeholders’ perception.
1. Background The concept of corporate governance can be traced back to the 18 th century. It emerged to be very important when many interested individuals and groups merged their capital in order to finance huge enterprises. With the establishment of these new enterprises comes the question of their management and control since the multiple owners cannot manage and control the business they own. The large number of ownership has created a gap between ownership and control. This gap has to be filled by having an appropriate organ that functions in the best interests of the owners, which justified the need for corporate governance (Tricker, 2009; Bainbridge, 2008; Garg, 2007; Wearing, 2005; Okeahalam and Akinboade, 2003; Blair, 1995). 1 Assistant Professor, Department of Management, College of Business and Economics, Addis Ababa University, Email: [email protected]
2 Assistant Professor, Department of Public Administration and Development management, College of Business and Economics, Addis Ababa University, Email: [email protected]
46
Corporate investors/shareholders need assurance that their investments are protected and generate return. The assurance is provided through establishing effective corporate governance mechanisms one of which is board of directors. Board of directors is one of the corporate governance mechanisms that is believed to ensure sound corporate governance practices. It exists in corporate forms of organizations.
Corporate governance is a topical issue and has become popular attracting the attention of investors, academics, and policy makers in the last two decades mainly after 1990’s Asian financial crises, the collapse of Enron in 2001, WorldCom in 2002, Parmalat in 2003, the 2008 financial crises and the subsequent financial scandals of some companies in different countries (Mallin, 2010). The corporate scandal practices have eroded the public confidence in corporate governance structure and process as well as the ability of boards to direct and oversee management. The financial crises and related problems have demanded a sharp focus on corporate governance that relate to boards’ role, appropriate structure and process capable of avoiding corporate failures occurring in the future. It is not surprising to see governments’ and the public’s uplifted interest on corporate governance practices in order to ensure that such crises do not occur anymore so that the public’s, especially, the investors’ confidence is not lost (Mallin, 2010; Grant, 2003).
2. Purpose and Methodology 2.1 Purpose The purpose of the survey is to examine and gain an understanding of the practices of corporate governance of the Ethiopian banks and reflect whether they follow internationally recognized best practices like OEDC and the Cadbury report. The Commercial Code of the 1960 and Banking Business Proclamation (592/2008) of Ethiopia have also been consulted.
2.2 Survey Methodology The survey targeted groups of respondents that are believed to have exposure to the corporate governance practices. The group includes board of directors, presidents and board secretaries of private and public banks. All the banks (17), except the two recently established banks viz. Enat and Debube Global banks, are included in the study. The survey was launched in November 2013 and completed by the end of March 2014. Survey questionnaire was distributed to all targeted respondents. They were self-administered by self-delivery and collection method. A total of 154 questionnaires were distributed out of which 106 were collected with a response rate of 69%. This is a high response rate compared to similar studies conducted by Zona and Zattoni (2007) and Minichilli et al. (2009) who found only 15% response rates each. High response rate was achieved for this study due to the careful design and administration of the questionnaire. It mainly focuses on the rights and obligations of shareholders, the equitable treatment of shareholders, the role of stakeholders in corporate governance, disclosure and transparency and the responsibilities of the board.
47
3. Understanding Corporate Governances (CG) 3.1 What It Is In spite of an increasing interest in the subject of CG (Tricker, 2009), there is not a universally agreed upon definition. However, establishing a proper system and safeguarding the interests of various stakeholders is the common denominator of all definitions. The following most cited definitions help to establish some common understanding of corporate governance.
Cadbury Report of UK (1992:15) defines corporate governance broadly as “[…] the system by which companies are directed and controlled”. This refers to the establishment of appropriate governance structure and process whereby the shareholders’ role is to appoint boards responsible for the governance of their companies.
The OECD (2004:11) understands corporate governance as an important instrument of holding together interests and relationships of various stakeholders, which defines it as follows:
Corporate governance involves a set of relationships between a company’s management, its board, its shareholders and other stakeholders. Corporate governance also provides the structure through which the objectives of the company are set, and the means of attaining those objectives and monitoring performance are determined.
The above definitions elaborate that CG, as a system, implies appropriate corporate structure and process capable of maximizing shareholders value. The definitions also imply that corporate governance is concerned with both internal and external aspects of corporate form of business. While the internal aspect refers to the boards’ service task and control role, the external aspect refers to its relationship with the shareholders and stakeholders. In the definitions, corporate governance is seen as a means of setting and attaining organizational goals and also monitoring corporate performances. The definitions underlined the need for maintaining an appropriate relationship and balance between the shareholders’ and stakeholders’ (managers, employees, customers, creditors, suppliers, and investors) interests so as to ensure sustained success to all. In a nutshell, corporate governance provides the framework how corporate entities are governed so as to promote the interests of shareholders and stakeholders (Tricker, 2009).
3.2 The Role of Corporate Governance CG occupies a central role in modern economy in both developed and emerging nations as a large proportion of economic activity is undertaken by firms organized as corporations. The corporations are formed by interested citizens who demand protection. This is made possible through different mechanisms of corporate governance. The trust in CG in this regard is due to the fact that it:
Helps to define and ensure an adequate and appropriate system of controls within company so that assets are safeguarded.
48
Defines the roles and relationship between a company’s management, the board of directors, shareholders and other stakeholders. It aims to ensure that the company is managed in the best interest of the shareholders and other stakeholders;
Tries to encourage both transparency and accountability, which investors are increasingly looking for in both corporate management and performance (Mallin, 2010).
Has an economic advantage for emerging economies in attracting potential foreign/local investors (Negash, 2008).
3.3 Corporate Governance Mechanisms Common corporate governance mechanisms include: board of directors, internal controls (policies, guidelines, and procedures), balancing power, market forces, and compensation. Boards of directors, voted in by shareholders, are used in order to ensure wealth maximization and other interests of the owners. The burden of leadership rests on board of directors and they are central to corporate forms of business where ownership and management are separated. The shareholders use them to bridge the gap between owners and the management. This group is considered to be a major driving force of governance in a corporation (Tricker, 2009).
The second corporate governance mechanism is internal controls in the form of instituting policies, procedures, guideline that are used to manage activities and behaviors of the corporation. The third corporate governance mechanism is balancing power. This is a common practice of corporate governance mechanisms as it deals with demarcating and defining duties between the board and the management and between different levels of management. It ensures the balance of power in the organization so that no one individual person has the capacity to overuse resources beyond the limit that is set. A market force for corporate control is the fourth type of control mechanism that influences executive body to pursue shareholders’ interests instead of their own. This could mean that if managers ignore shareholders’ interest and pursue only their personal interests, stock prices may decrease which makes the company a target for takeover and consequently loses of jobs for managers. In order to avoid the possibility of a takeover, the management would work in the interest of the shareholders. It is, therefore, the market forces that make the executives to think in that line (ibid).
The fifth mechanism refers to compensation which is a performance-based type of management structure. Compensation as corporate governance mechanism ties managerial compensation to the firm performance so as to align the interest of management and shareholders. This aims at improving performance by motivating managers and individuals to work hard and reap the benefit from it.
3.4 Requirements for Effective Corporate Governance There is no one model of corporate governance and every country has its own distinctive type of corporate governance that reflect the political, economic, regulatory set ups and enforcement
49
capacity, the legal system, and different ownership structure and business situations. According to Gregory and Simms (2009), effective corporate governance tends to assume the prevalence of at least the following situations: well-developed and well-regulated securities markets; laws that recognize shareholders rights and the equitable treatment of minority and foreign shareholders; transparency and disclosure requirements; enforcement mechanisms on the basis of which shareholders’ and stakeholders’ rights are safeguarded; anti-corruption laws to prevent bribery and protections against fraud on investors; strong and independent courts and regulators; well-developed private sector institutions such as strong accounting and auditing sector, professional associations, rating agencies, strong financial press and capable security analysts.
3.5 The OECD Principles of Effective Corporate Governance The OECD is an international body formed by 34 developed countries to produce a set of globally accepted principles of corporate governance. The OECD principles provide a framework in developing and establishing a corporate governance system and practices of a country in line with its own political, economic, institutional, legal and regulatory environment (OECD, 2004). It also serves as a framework for assessing a country’s corporate governance. The following are some of the key elements of OECD’s good corporate governance principles:
The rights of shareholders Equitable treatment of shareholders The role of stakeholders in corporate governance Transparency and disclosure of information The responsibility of the boards
The rights of shareholders This is one of the basic rights that states that the corporate governance framework should protect and facilitate the exercise of shareholders’ rights. Shareholders have the right to vote, thus, corporate governance should ensure that there is one vote for one share. It ensures that shareholders have the right to vote in absentia, if they cannot be present physically; should have the right for authorization of additional shares and should have the right to ask questions. Furthermore, this principle seeks ensuring that shareholders obtain relevant and material information on the corporation on a timely and regular basis. It encourages shareholders to participate in general shareholder meetings; elect and remove members of the board; and share in the profits of the corporation. Shareholders also have the obligation to use their voting rights as part of ensuring sound corporate governance.
Equitable treatment of shareholders A corporate governance framework should ensure equitable treatment of all shareholders in same series of classes· It should ensure same voting rights and equal treatment of shareholders within same class of shares.
50
The role of stakeholders in corporate governance A corporate governance framework should acknowledge the key place that stakeholders have in promoting good governance. It should acknowledge the rights of stakeholders that are protected by law and ensure that these rights are respected. It should acknowledge that relationship with stakeholders is important for building sustainable enterprises and mutual development by fostering teamwork. Therefore, corporations should recognize the contributions of stakeholders for the longterm success of the corporation and should always take in to account their interests in taking decisions and actions.
Transparency and disclosure of information The corporate governance framework ensures transparency and disclosure of material information on a timely and accurate basis concerning the financial situation, operating performance, annual audit, and governance structure and policy, board and management members, and objectives of the company
The responsibilities of the board This principle aims at ensuring the strategic guidance of the corporation, the efficient monitoring of management, and accountability of the board to its corporation and the shareholders. The principle specifically states that boards have the responsibility to act on informed basis, in good faith, with due care and in the best interest of the company and the shareholders. The board has also the responsibility to take into account the interests of stakeholders in its decisions and actions. In general, board members should be able to commit themselves effectively to the responsibilities entrusted to them.
3. Brief Overview of Corporate Governance Practices in Ethiopia According to Negash (2008), the history of the establishment of share companies in Ethiopia dates back to 1960 during the Imperial regime and became routine between 1960 and 1973. It was in 1960 that the legal framework for corporate governance was laid when the two legal institutions, Commercial Code and Civil Code, were proclaimed. This did not last long due to a regime change in 1974. The Imperial regime was replaced by the Military rule which brought an end to corporate practices by nationalizing all private enterprises and put them under state ownership. The nationalized enterprises fall under the central command economy and were governed by government appointees. This, however, was changed in 1991 when the Military Government was replaced by a Transitional Government. Since then, Ethiopia has launched a series of economic adjustment and reform programmes towards building a competitive private sector. This has increased the number and role of the private sector and establishment of share companies. It is after 1992 when a major policy change to liberalize the economy was in place that led to the formation of share companies governed and controlled by the board of directors
51
(Roberston, 2009; Economic Commission for Africa, 2004). This era has marked the start for the practices of corporate governance in order to ensure sustained success for the newly formed companies.
In spite of the series of economic reforms, Ethiopia has not yet introduced stock exchange markets. Private banks have been selling shares publicly which calls upon the need for appropriate corporate governance as they are expected to operate under the framework of corporate governance. Despite such a change, neither there are well-established systems nor are regulatory agencies strong enough to ensure compliance with good principles of corporate governance.
Negash (2008) described the standards of corporate governance in Ethiopia as disappointing that he attributed it, among other things, to (i) the inadequacy of 1960 Commercial Code of Ethiopia to handle the legislative matters of the current complex issues of corporate governance, though a new corporate law is being drafted and not yet finalized, (ii) lack of ratification or incorporation of international conventions and codes, (iii) ownership concentration and pyramids creating agency problem, and (iv) lack of organized share market and the quality of professional education.
Generally, corporate governance is at its initial stage of development in Ethiopia with very weak legal framework and practices of corporate responsibility (Negash, 2008). However, since recently, there is a consensus among business and sectoral associations towards having a strong corporate governance framework and national code of business practices (AACCSA: 2009). As a result, there are several moves towards improving the weak status of corporate governance. The following are some of the most important initiations towards improved corporate governance standards (PSD Hub/AACCSA, 2009) that include:
The revision of the 1960 Commercial Code, which is considered as pivotal part in upgrading corporate governance standards,
A joint move to standardize the accounting and auditing practices of corporate firms, Increased awareness of the importance of corporate governance and commitment towards
any effort to improve it by the business community and the state. 4. Key findings of Corporate Governance Practices in the Ethiopian Banks It is believed that every country has its own distinctive type of corporate governance that reflect the political, economic and regulatory set ups. Regardless of the distinction, corporate governance principle has something in common that deals with having a system by which corporate forms of organizations are directed and controlled (OECD, 2004). This study, thus, attempts to scan corporate governance practices in the Ethiopian emerging economy settings. OECD (Organization for Economic Cooperation and Development), which is believed to be a global framework, is taken as a bench mark for assessment in this study because, so far, Ethiopia
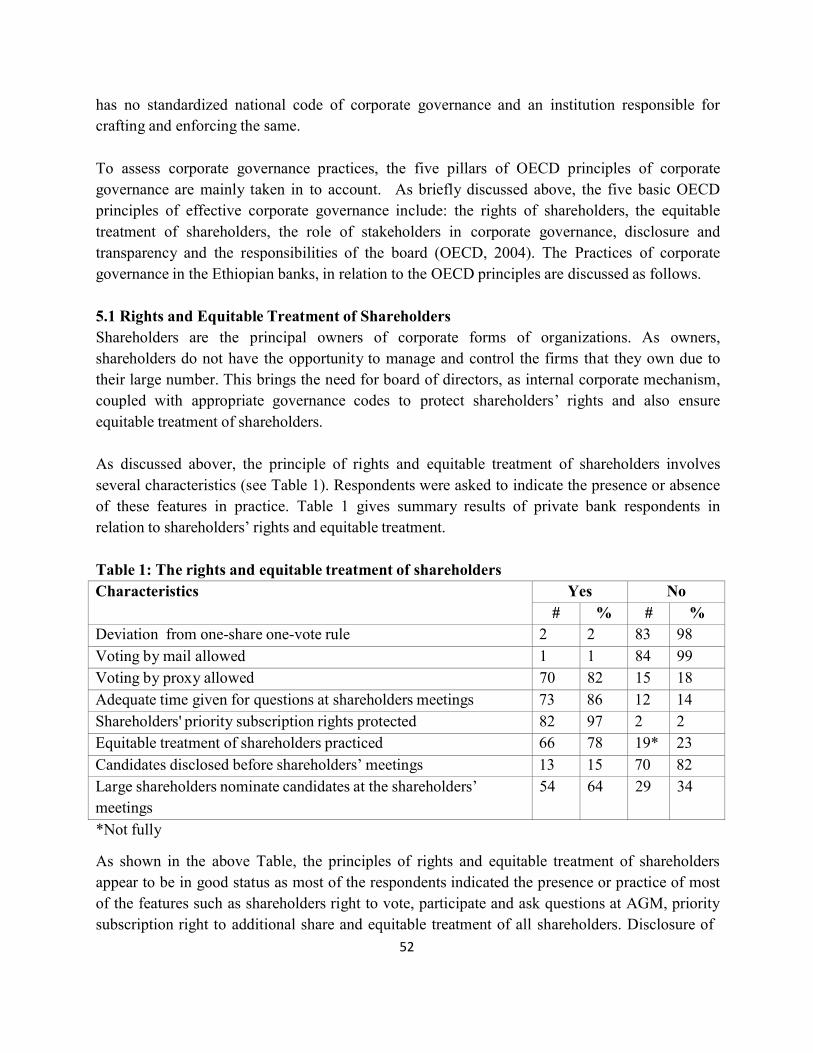
52
has no standardized national code of corporate governance and an institution responsible for crafting and enforcing the same.
To assess corporate governance practices, the five pillars of OECD principles of corporate governance are mainly taken in to account. As briefly discussed above, the five basic OECD principles of effective corporate governance include: the rights of shareholders, the equitable treatment of shareholders, the role of stakeholders in corporate governance, disclosure and transparency and the responsibilities of the board (OECD, 2004). The Practices of corporate governance in the Ethiopian banks, in relation to the OECD principles are discussed as follows.
5.1 Rights and Equitable Treatment of Shareholders Shareholders are the principal owners of corporate forms of organizations. As owners, shareholders do not have the opportunity to manage and control the firms that they own due to their large number. This brings the need for board of directors, as internal corporate mechanism, coupled with appropriate governance codes to protect shareholders’ rights and also ensure equitable treatment of shareholders.
As discussed abover, the principle of rights and equitable treatment of shareholders involves several characteristics (see Table 1). Respondents were asked to indicate the presence or absence of these features in practice. Table 1 gives summary results of private bank respondents in relation to shareholders’ rights and equitable treatment.
Table 1: The rights and equitable treatment of shareholders Characteristics Yes No
# % # % Deviation from one-share one-vote rule 2 2 83 98 Voting by mail allowed 1 1 84 99 Voting by proxy allowed 70 82 15 18 Adequate time given for questions at shareholders meetings 73 86 12 14 Shareholders' priority subscription rights protected 82 97 2 2 Equitable treatment of shareholders practiced 66 78 19* 23 Candidates disclosed before shareholders’ meetings 13 15 70 82 Large shareholders nominate candidates at the shareholders’ meetings
54 64 29 34 *Not fully As shown in the above Table, the principles of rights and equitable treatment of shareholders appear to be in good status as most of the respondents indicated the presence or practice of most of the features such as shareholders right to vote, participate and ask questions at AGM, priority subscription right to additional share and equitable treatment of all shareholders. Disclosure of
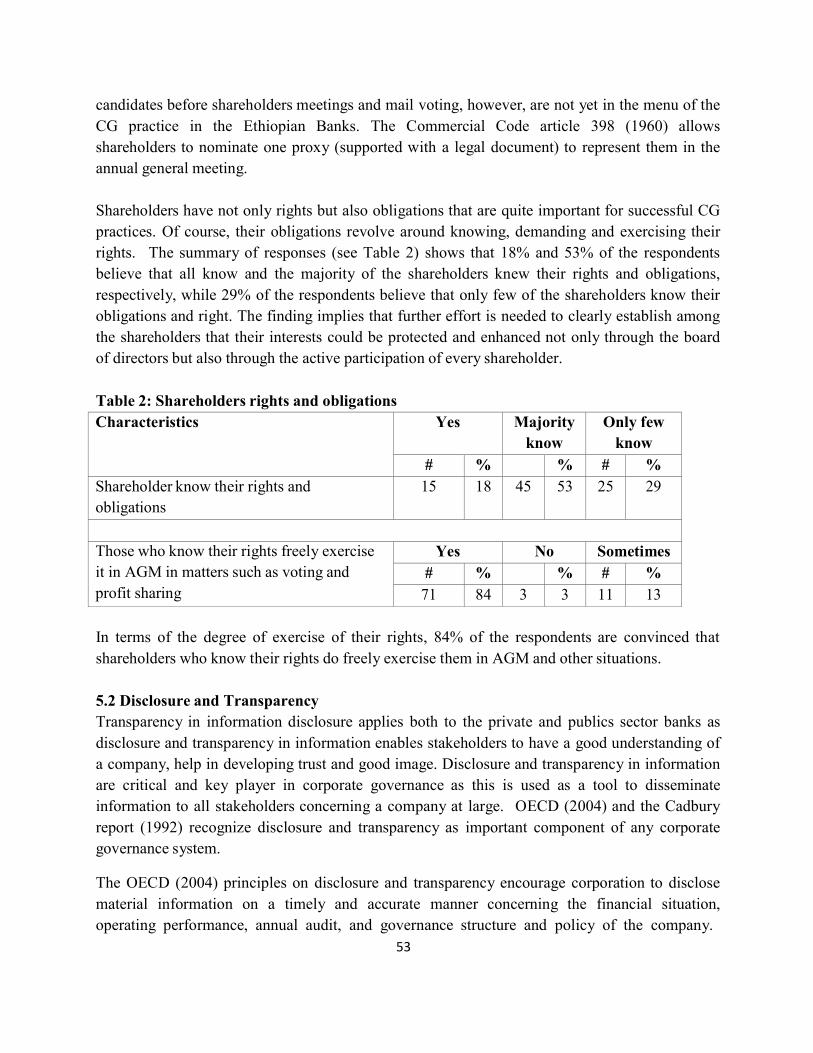
53
candidates before shareholders meetings and mail voting, however, are not yet in the menu of the CG practice in the Ethiopian Banks. The Commercial Code article 398 (1960) allows shareholders to nominate one proxy (supported with a legal document) to represent them in the annual general meeting.
Shareholders have not only rights but also obligations that are quite important for successful CG practices. Of course, their obligations revolve around knowing, demanding and exercising their rights. The summary of responses (see Table 2) shows that 18% and 53% of the respondents believe that all know and the majority of the shareholders knew their rights and obligations, respectively, while 29% of the respondents believe that only few of the shareholders know their obligations and right. The finding implies that further effort is needed to clearly establish among the shareholders that their interests could be protected and enhanced not only through the board of directors but also through the active participation of every shareholder.
Table 2: Shareholders rights and obligations Characteristics Yes Majority
know Only few
know # % % # %
Shareholder know their rights and obligations
15 18 45 53 25 29 Those who know their rights freely exercise it in AGM in matters such as voting and profit sharing
Yes No Sometimes # % % # %
71 84 3 3 11 13
In terms of the degree of exercise of their rights, 84% of the respondents are convinced that shareholders who know their rights do freely exercise them in AGM and other situations.
5.2 Disclosure and Transparency Transparency in information disclosure applies both to the private and publics sector banks as disclosure and transparency in information enables stakeholders to have a good understanding of a company, help in developing trust and good image. Disclosure and transparency in information are critical and key player in corporate governance as this is used as a tool to disseminate information to all stakeholders concerning a company at large. OECD (2004) and the Cadbury report (1992) recognize disclosure and transparency as important component of any corporate governance system.
The OECD (2004) principles on disclosure and transparency encourage corporation to disclose material information on a timely and accurate manner concerning the financial situation, operating performance, annual audit, and governance structure and policy of the company.
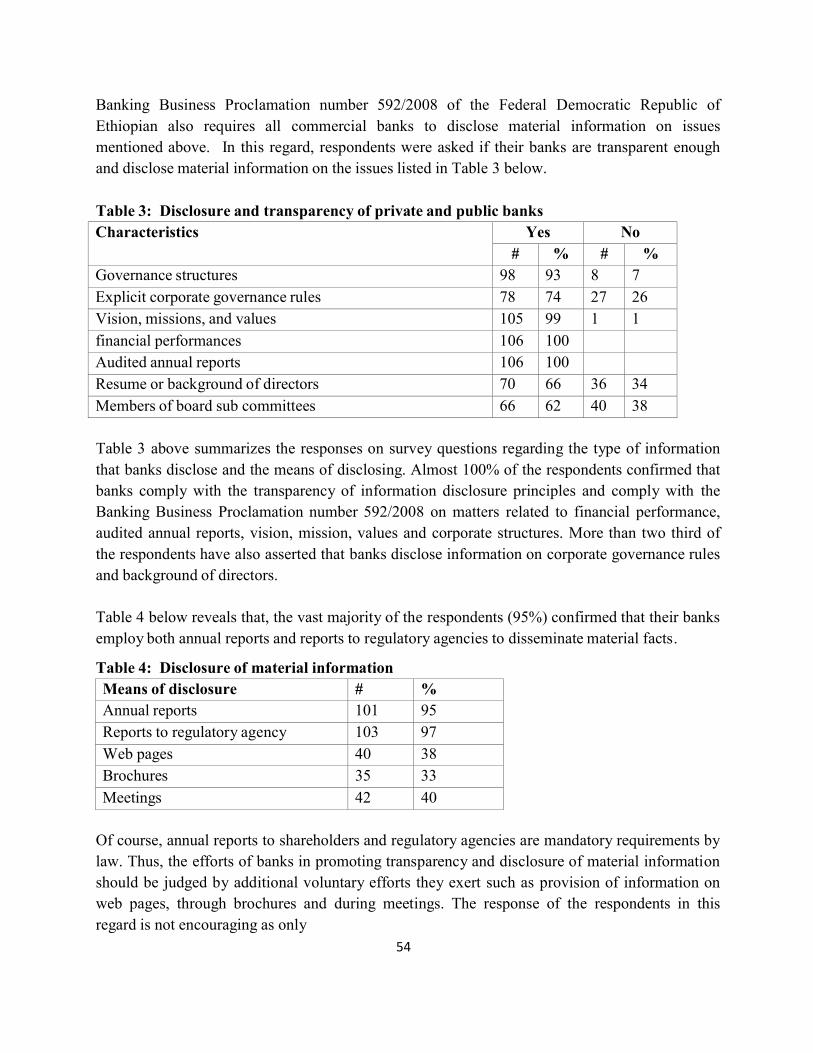
54
Banking Business Proclamation number 592/2008 of the Federal Democratic Republic of Ethiopian also requires all commercial banks to disclose material information on issues mentioned above. In this regard, respondents were asked if their banks are transparent enough and disclose material information on the issues listed in Table 3 below.
Table 3: Disclosure and transparency of private and public banks Characteristics Yes No
# % # % Governance structures 98 93 8 7 Explicit corporate governance rules 78 74 27 26 Vision, missions, and values 105 99 1 1 financial performances 106 100 Audited annual reports 106 100 Resume or background of directors 70 66 36 34 Members of board sub committees 66 62 40 38
Table 3 above summarizes the responses on survey questions regarding the type of information that banks disclose and the means of disclosing. Almost 100% of the respondents confirmed that banks comply with the transparency of information disclosure principles and comply with the Banking Business Proclamation number 592/2008 on matters related to financial performance, audited annual reports, vision, mission, values and corporate structures. More than two third of the respondents have also asserted that banks disclose information on corporate governance rules and background of directors.
Table 4 below reveals that, the vast majority of the respondents (95%) confirmed that their banks employ both annual reports and reports to regulatory agencies to disseminate material facts.
Table 4: Disclosure of material information Means of disclosure # %
Annual reports 101 95 Reports to regulatory agency 103 97 Web pages 40 38 Brochures 35 33 Meetings 42 40
Of course, annual reports to shareholders and regulatory agencies are mandatory requirements by law. Thus, the efforts of banks in promoting transparency and disclosure of material information should be judged by additional voluntary efforts they exert such as provision of information on web pages, through brochures and during meetings. The response of the respondents in this regard is not encouraging as only
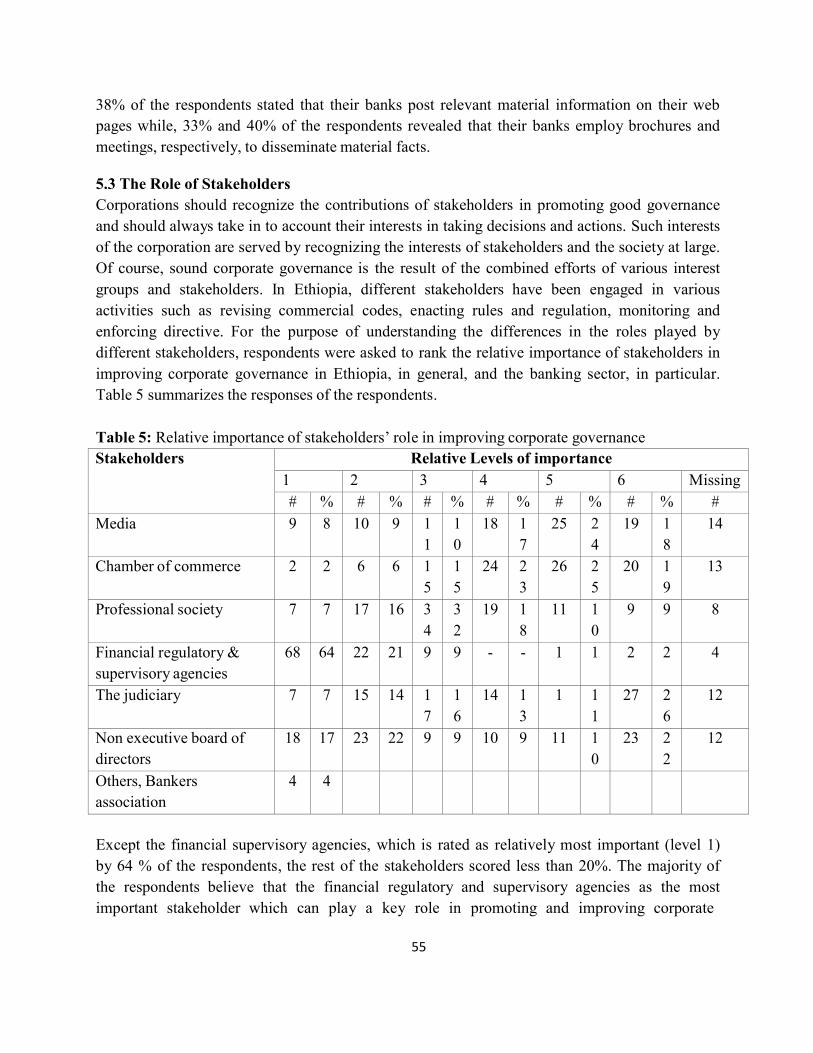
55
38% of the respondents stated that their banks post relevant material information on their web pages while, 33% and 40% of the respondents revealed that their banks employ brochures and meetings, respectively, to disseminate material facts.
5.3 The Role of Stakeholders Corporations should recognize the contributions of stakeholders in promoting good governance and should always take in to account their interests in taking decisions and actions. Such interests of the corporation are served by recognizing the interests of stakeholders and the society at large. Of course, sound corporate governance is the result of the combined efforts of various interest groups and stakeholders. In Ethiopia, different stakeholders have been engaged in various activities such as revising commercial codes, enacting rules and regulation, monitoring and enforcing directive. For the purpose of understanding the differences in the roles played by different stakeholders, respondents were asked to rank the relative importance of stakeholders in improving corporate governance in Ethiopia, in general, and the banking sector, in particular. Table 5 summarizes the responses of the respondents.
Table 5: Relative importance of stakeholders’ role in improving corporate governance Stakeholders Relative Levels of importance
1 2 3 4 5 6 Missing # % # % # % # % # % # % #
Media 9 8 10 9 1 1
1 0
18 1 7
25 2 4
19 1 8
14 Chamber of commerce 2 2 6 6 1
5 1 5
24 2 3
26 2 5
20 1 9
13 Professional society 7 7 17 16 3
4 3 2
19 1 8
11 1 0
9 9 8 Financial regulatory & supervisory agencies
68 64 22 21 9 9 - - 1 1 2 2 4 The judiciary 7 7 15 14 1
7 1 6
14 1 3
1 1 1
27 2 6
12 Non executive board of directors
18 17 23 22 9 9 10 9 11 1 0
23 2 2
12 Others, Bankers association
4 4
Except the financial supervisory agencies, which is rated as relatively most important (level 1) by 64 % of the respondents, the rest of the stakeholders scored less than 20%. The majority of the respondents believe that the financial regulatory and supervisory agencies as the most important stakeholder which can play a key role in promoting and improving corporate
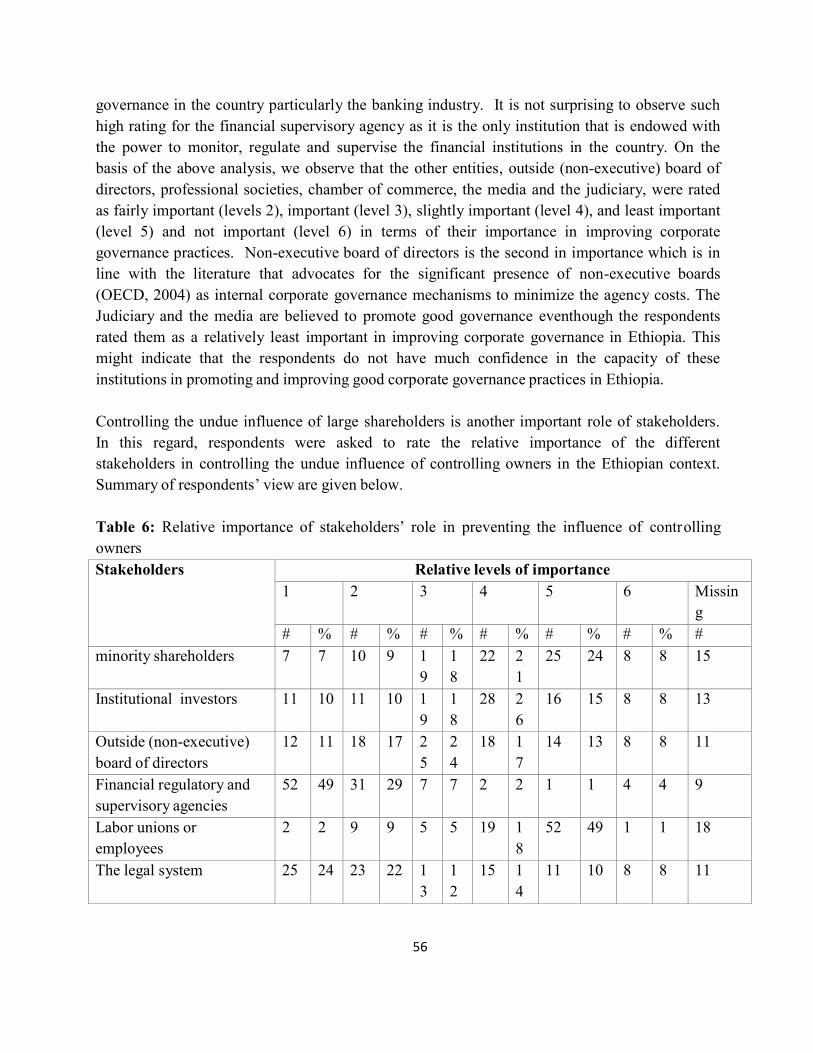
56
Stakeholders Relative levels of importance 1 2 3 4 5 6 Missin
g # % # % # % # % # % # % #
minority shareholders 7 7 10 9 1 9
1 8
22 2 1
25 24 8 8 15 Institutional investors 11 10 11 10 1
9 1 8
28 2 6
16 15 8 8 13 Outside (non-executive) board of directors
12 11 18 17 2 5
2 4
18 1 7
14 13 8 8 11 Financial regulatory and supervisory agencies
52 49 31 29 7 7 2 2 1 1 4 4 9 Labor unions or employees
2 2 9 9 5 5 19 1 8
52 49 1 1 18 The legal system 25 24 23 22 1
3 1 2
15 1 4
11 10 8 8 11
governance in the country particularly the banking industry. It is not surprising to observe such high rating for the financial supervisory agency as it is the only institution that is endowed with the power to monitor, regulate and supervise the financial institutions in the country. On the basis of the above analysis, we observe that the other entities, outside (non-executive) board of directors, professional societies, chamber of commerce, the media and the judiciary, were rated as fairly important (levels 2), important (level 3), slightly important (level 4), and least important (level 5) and not important (level 6) in terms of their importance in improving corporate governance practices. Non-executive board of directors is the second in importance which is in line with the literature that advocates for the significant presence of non-executive boards (OECD, 2004) as internal corporate governance mechanisms to minimize the agency costs. The Judiciary and the media are believed to promote good governance eventhough the respondents rated them as a relatively least important in improving corporate governance in Ethiopia. This might indicate that the respondents do not have much confidence in the capacity of these institutions in promoting and improving good corporate governance practices in Ethiopia.
Controlling the undue influence of large shareholders is another important role of stakeholders. In this regard, respondents were asked to rate the relative importance of the different stakeholders in controlling the undue influence of controlling owners in the Ethiopian context. Summary of respondents’ view are given below.
Table 6: Relative importance of stakeholders’ role in preventing the influence of contr olling owners
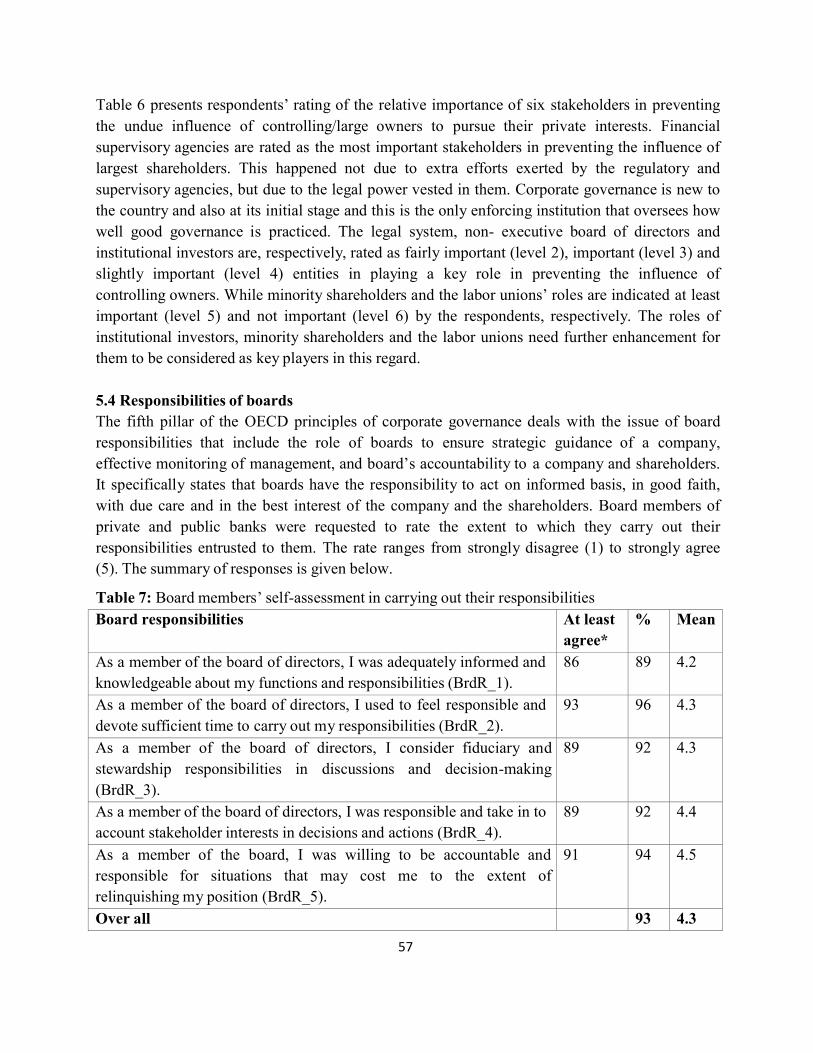
57
Table 6 presents respondents’ rating of the relative importance of six stakeholders in preventing the undue influence of controlling/large owners to pursue their private interests. Financial supervisory agencies are rated as the most important stakeholders in preventing the influence of largest shareholders. This happened not due to extra efforts exerted by the regulatory and supervisory agencies, but due to the legal power vested in them. Corporate governance is new to the country and also at its initial stage and this is the only enforcing institution that oversees how well good governance is practiced. The legal system, non- executive board of directors and institutional investors are, respectively, rated as fairly important (level 2), important (level 3) and slightly important (level 4) entities in playing a key role in preventing the influence of controlling owners. While minority shareholders and the labor unions’ roles are indicated at least important (level 5) and not important (level 6) by the respondents, respectively. The roles of institutional investors, minority shareholders and the labor unions need further enhancement for them to be considered as key players in this regard.
5.4 Responsibilities of boards The fifth pillar of the OECD principles of corporate governance deals with the issue of board responsibilities that include the role of boards to ensure strategic guidance of a company, effective monitoring of management, and board’s accountability to a company and shareholders. It specifically states that boards have the responsibility to act on informed basis, in good faith, with due care and in the best interest of the company and the shareholders. Board members of private and public banks were requested to rate the extent to which they carry out their responsibilities entrusted to them. The rate ranges from strongly disagree (1) to strongly agree (5). The summary of responses is given below.
Table 7: Board members’ self-assessment in carrying out their responsibilities Board responsibilities At least
agree* % Mean
As a member of the board of directors, I was adequately informed and knowledgeable about my functions and responsibilities (BrdR_1).
86 89 4.2 As a member of the board of directors, I used to feel responsible and devote sufficient time to carry out my responsibilities (BrdR_2).
93 96 4.3 As a member of the board of directors, I consider fiduciary and stewardship responsibilities in discussions and decision-making (BrdR_3).
89 92 4.3
As a member of the board of directors, I was responsible and take in to account stakeholder interests in decisions and actions (BrdR_4).
89 92 4.4 As a member of the board, I was willing to be accountable and responsible for situations that may cost me to the extent of relinquishing my position (BrdR_5).
91 94 4.5
Over all 93 4.3
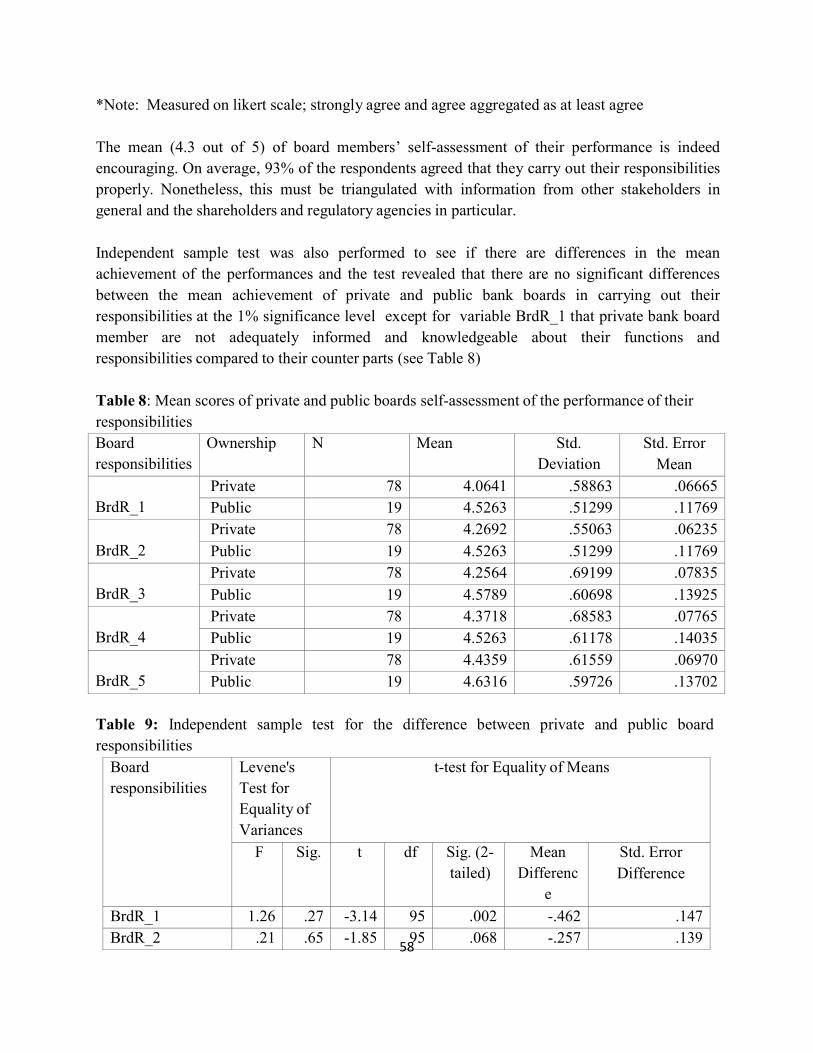
58
Board responsibilities
Levene's Test for Equality of Variances
t-test for Equality of Means
F Sig. t df Sig. (2- tailed)
Mean Differenc
e Std. Error Difference
BrdR_1 1.26 .27 -3.14 95 .002 -.462 .147 BrdR_2 .21 .65 -1.85 95 .068 -.257 .139
*Note: Measured on likert scale; strongly agree and agree aggregated as at least agree The mean (4.3 out of 5) of board members’ self-assessment of their performance is indeed
encouraging. On average, 93% of the respondents agreed that they carry out their responsibilities properly. Nonetheless, this must be triangulated with information from other stakeholders in general and the shareholders and regulatory agencies in particular.
Independent sample test was also performed to see if there are differences in the mean achievement of the performances and the test revealed that there are no significant differences between the mean achievement of private and public bank boards in carrying out their responsibilities at the 1% significance level except for variable BrdR_1 that private bank board member are not adequately informed and knowledgeable about their functions and responsibilities compared to their counter parts (see Table 8)
Table 8: Mean scores of private and public boards self-assessment of the performance of their responsibilities
Board responsibilities
Ownership N Mean Std. Deviation
Std. Error Mean
BrdR_1 Private 78 4.0641 .58863 .06665 Public 19 4.5263 .51299 .11769
BrdR_2 Private 78 4.2692 .55063 .06235 Public 19 4.5263 .51299 .11769
BrdR_3 Private 78 4.2564 .69199 .07835 Public 19 4.5789 .60698 .13925
BrdR_4 Private 78 4.3718 .68583 .07765 Public 19 4.5263 .61178 .14035
BrdR_5 Private 78 4.4359 .61559 .06970 Public 19 4.6316 .59726 .13702
Table 9: Independent sample test for the difference between private and public board responsibilities
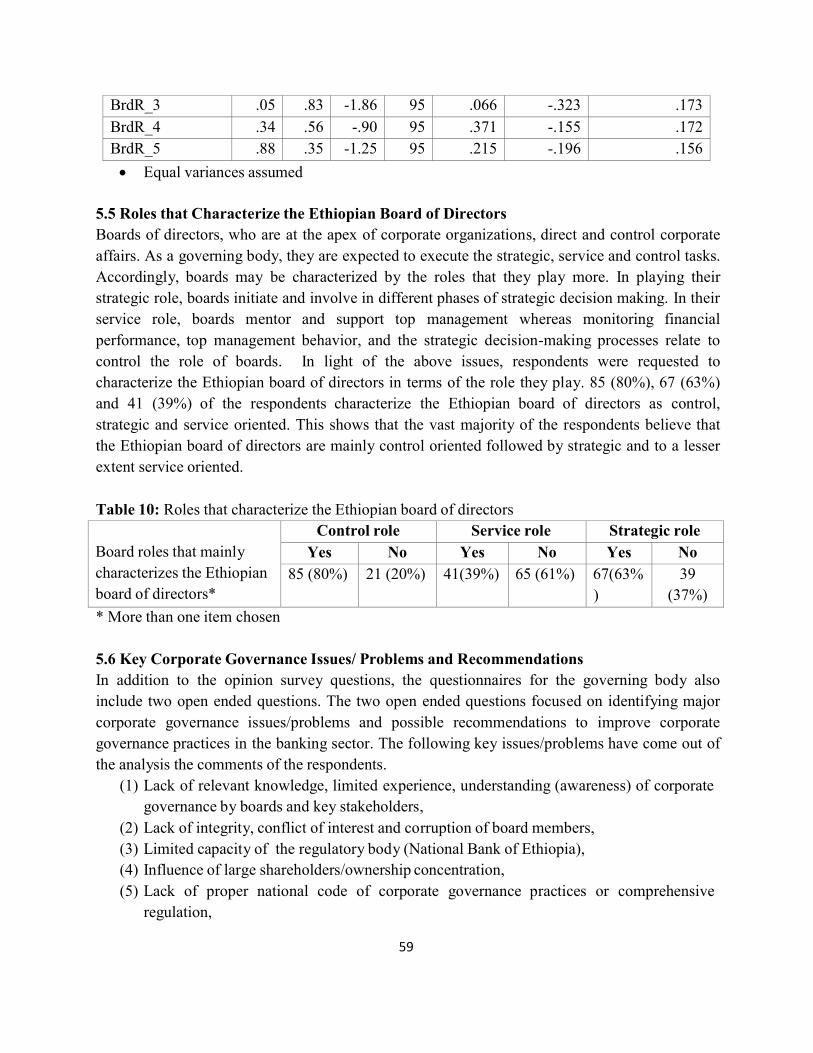
59
BrdR_3 .05 .83 -1.86 95 .066 -.323 .173 BrdR_4 .34 .56 -.90 95 .371 -.155 .172 BrdR_5 .88 .35 -1.25 95 .215 -.196 .156 Equal variances assumed
5.5 Roles that Characterize the Ethiopian Board of Directors Boards of directors, who are at the apex of corporate organizations, direct and control corporate affairs. As a governing body, they are expected to execute the strategic, service and control tasks. Accordingly, boards may be characterized by the roles that they play more. In playing their strategic role, boards initiate and involve in different phases of strategic decision making. In their service role, boards mentor and support top management whereas monitoring financial performance, top management behavior, and the strategic decision-making processes relate to control the role of boards. In light of the above issues, respondents were requested to characterize the Ethiopian board of directors in terms of the role they play. 85 (80%), 67 (63%) and 41 (39%) of the respondents characterize the Ethiopian board of directors as control, strategic and service oriented. This shows that the vast majority of the respondents believe that the Ethiopian board of directors are mainly control oriented followed by strategic and to a lesser extent service oriented.
Table 10: Roles that characterize the Ethiopian board of directors Board roles that mainly
characterizes the Ethiopian board of directors*
Control role Service role Strategic role Yes No Yes No Yes No
85 (80%) 21 (20%) 41(39%) 65 (61%) 67(63% )
39 (37%)
* More than one item chosen 5.6 Key Corporate Governance Issues/ Problems and Recommendations
In addition to the opinion survey questions, the questionnaires for the governing body also include two open ended questions. The two open ended questions focused on identifying major corporate governance issues/problems and possible recommendations to improve corporate governance practices in the banking sector. The following key issues/problems have come out of the analysis the comments of the respondents.
(1) Lack of relevant knowledge, limited experience, understanding (awareness) of corporate governance by boards and key stakeholders,
(2) Lack of integrity, conflict of interest and corruption of board members, (3) Limited capacity of the regulatory body (National Bank of Ethiopia), (4) Influence of large shareholders/ownership concentration, (5) Lack of proper national code of corporate governance practices or comprehensive
regulation,
60
(6) Interference of board of directors in managerial and operational activities that undermine the autonomy of managers
(7) Poor remuneration scheme for boards that affected their commitment to play their role, (8) Lack of proper mechanism of nomination and selection of board of directors.
The following are synthesized recommendations forwarded by respondents to address one or more of the problems identified above. Respondents believe that the Ethiopian banking business corporate governance can be improved, if the following recommendations are addressed:
(1) There should be national codes of best practices, (2) Introduce regular capacity building systems for regulatory agencies and board members, (3) Standardizing board nominations (4) Create and promote awareness on corporate governance in general and the boards’ roles
and responsibilities in particular (5) Introduce performance related remuneration schemes for board members (6) Ensure that board members and major shareholders keep the required distance form
managerial and operational activities 5. Conclusion Corporate governance is a new and recent phenomenon to Ethiopia. Ethiopia, like many emerging market economies, have not yet fully developed the legal and regulatory systems, enforcement capacities of the regulatory organ, and private sector that is required to support effective corporate governance. Given these limitations, as beginners, the achievements in terms of rights and equitable treatment of shareholders, (fairness), disclosure and transparency, recognitions of roles of stakeholders and accountability of boards are not discouraging. To improve corporate governance practices, much has to been done in the enabling elements that lead to effective corporate governance framework. These include the basic stock exchange development with listing requirements, an institution responsible for crafting the principles of good corporate governance, strong laws and regulations, and well developed private sector institutions such as, strong accounting and auditing sector, professional associations, strong financial press and capable security analysts. Finally, sound corporate governance practices is an important component for development and if a country does not ensure good practice, investors will not have confidence and capital will not easily flow for investment.
61
References AACCSA (Addis Ababa Chamber of Commerce and Sectoral Associations). (2009). ‘The Role
to Private Sector Led Economic Growth: A Strategy Document’, Private Sector Development-Hub Publication No. 5.
Bainbridge, S.M. (2008). The new corporate governance in theory and practice.USA: Oxford University Press, Inc.
Blair, B.B. (1995). Ownership and Control: Rethinking corporate governance for the twenty- first century. USA: Brookings Institution Press.
Cadbury report. (1992). The Financial Aspects of Corporate Governance. London: Gee and Co. Ltd.
Clarke, T. (2004). Theories of Corporate Governance: The philosophical foundation of corporate governance. New York: Routledge.
…………. (1998). "Research on corporate governance." Corporate Governance, 6(1): 57-66. Conyon, M.J. (2006). ‘Corporate Governance in Singapore: a case study’, in Christine A. Mallin
(ed), International Corporate Governance: A Case Study Approach, Handbook of Partial Least Squares: Concepts, Methods and Applications, Edward EIgar Publishing Limited, UK, 187-217.
Economic Commission for Africa. (2005). ‘Economic and Corporate Governance and Accountability’, Publications Economic Commission for Africa
Ethiopia. The Federal Democratic Republic of Ethiopia. (2008). The National Bank of Ethiopia Establishment (as Amended) Proclamation NO. 591/2008. Ethiopia: Federal Negarit Gazeta.
Ethiopia. The Federal Democratic Republic of Ethiopia. (2008). Banking Business Proclamation NO. 592/2008. Ethiopia: Federal Negarit Gazeta.
Ethiopia. Commercial Code of the Empire of Ethiopia Proclamation No. 166 OF 1960. Ethiopia. National Bank of Ethiopia. (2012). Directives No. SBB/54/2012: Requirements for
Persons with Significant Influence in a Bank. Ethiopia. Ethiopia. National Bank of Ethiopia. (2011). Directive No. SBB/49/2011: Limits on Board
Remuneration and Number of Employees Who sit on a Bank Board. Ethiopia Garg, A.K. (2007). ‘Influence of Board Size and Independence on Firm Performance: A Study of
Indian Companies’, The Journal of Decision makers, 32(3): 39-60. Gillies, J. and Leblanc, R. (2003).’The Coming Revolution in Corporate Governance’, Ivey
Business Journal, 1-11. Mallin, A. C. (2010).Corporate Governance. 3rd ed. New York: Oxford University Press ……… (2007).Corporate Governance. 2nd ed.USA: Oxford University Press. ………. (2006). Handbook on International Corporate Governance: Country analysis . UK:
Edward Elgar Publishing, Inc. Minichilli, A., Zattoni, A. & Zona, F. (2009). ‘Making Boards Effective: An Empirical
Examination of Board Task Performance’, British Journal of Management, 20: 55-74.
62
National Bank of Ethiopia. Available from: <www.nbe.gov.et/financial/banks.htm> [online] [Accessed 4 October 2010].
Negash, M. (2008). ‘Rethinking Corporate Governance in Ethiopia’, working paper series, Metropolitan State College of Denver.
OECD. (2004). Principles of Corporate Governance. FRANCE: OECD Publications Service Okeahalam,C. and Akinboade, O. (2003). ‘A Review of Corporate Governance in Africa:
Literature, Issues and Challenges’, Paper prepared for the Global Corporate Governance Forum.
Rossouw,G. (2005). ‘Business Ethics and corporate Governance in Africa’. Business and society. Sage publication. 44 (1): 94-106.
Transparency Ethiopia. (2011). National Integrity System Assessment Ethiopia 2011. Tricker, B. (2009). Corporate governance: Principles, Policies, and Practices. New York:
Oxford University Press Inc., Wearing, R. (2005). Cases in Corporate Governance. Great Britain: SAGE Publication Zona, F. and Zottani, A. (2007). ‘Beyond the Black Box of Demography: board process & task
effectiveness within Italian firms’ Corporate Governance an International Review, 15(5): 852-864.
63
Highlights on Sustainable Development Goals Mohammed Seid1 Abstract
While the Millennium Development Goals (MDG initiative), which guided the world development efforts in the years 2000-2015, is about to come to a close. World leaders, experts, the civil society and businesses have been working on Sustainable Development Goals for the period2015- 2030 that will replace MDGs. Although MDGs have many success stories, they also had limitations. Both are noble initiatives which would trill, most probably everybody. It has been reported that MDGs are largely achieved in cutting global poverty in half over the past couple of decades. However, many issues have been raised regarding the successes claimed. This paper tried to shed light on some of the intriguing questions surrounding these UN initiatives. It tried to explore the following questions: Has the MDG brought meaningful changes? Are there really successes at home and abroad? Will new set of goals (SDGs) be different from the business as usual path to a true sustainable development which results in inclusive growth or are they makeovers for prevailing economic order? What are the possible financing mechanisms? The paper sheds light on these issues and tried to motivate further research in the area. The research was an exploratory desk research that used relevant UN documents, articles, government reports and online materials. It was prepared for the 9th Executive Idea Exchange Forum, Organized by the Department of Management of College of Business and Economics, Addis Ababa University, in 2015. Keywords: Millenium Development Goals, Sustainable Development Goals, Ethiopia 1. Introduction The Millennium Development Goals (MDG initiative), which guided the world development efforts in the years 2000-2015, is about to come to a close and be replaced by Sustainable Development initiative for the period 2015-2030. The MDG which was conceived in 2000 and endorsed by 189 country representatives is the most recognized, discussed, promoted, and debated initiative. It “has been repeated in every official speech and appears in all of the UN’s glossy reports”2. The MDG was intended to half poverty in developing countries by 2015.
Following its expiration, the SDGs will now replace it from 2015 onwards with the objective of eradicating world poverty altogether by 2030. UN member states are expected to hold a summit on September 25-27, 2015 to discuss the 17 post 2015 SDGs as a follow up meeting to the Rio+20 Conference. The summit purposes to create awareness about the next development 1 Assistant Professor, Department of Management, College of Business and Economics, Addis Ababa University, Email: [email protected]
2 http://www.thoughtleader.co.za/jasonhickel/2015/03/31/the-delusion-at-the-heart-of-the-sustainable-development- goals/, 6/6/2015 2:34PM
64
agenda and garner support and commitment from member states. 2. Statement of the Problem
Both MDGs and SDGs are noble initiatives which would trill, most probably, everybody. It has been reported that MDGs are largely achieved in cutting global poverty in half over the past couple of decades. However, many issues have been raised regarding the successes claimed and purposes of both initiatives. While there are many who support and promote MDGs and SDGs, there are people who are skeptical about them. Though MDG is cited “as the yard stick of development progress and a new development paradigm,”3 it is also indicated that it was “created by only a few stakeholders without adequate involvement by developing countries and overlooking development objectives previously agreed upon.”4 It is also considered to be permitted with many omissions “leaving out key priorities of addressing inequality, decent work, unemployment, climate change and sustainability”5. It is very important to have clarity about MD framework, its achievement, and encounters, before developing and starting executing the framework that will replace it.
3. Objectives of the Study As it is mentioned while developing the SDGs it is very important to sift the shortcomings of MDGs and deliberate on the possible constraints associated with the framework to set expectation and improve implementation of the post-2015 agenda, SDGs. This paper, therefore, tried to shed light on some of the intriguing questions surrounding these UN initiatives. I attempted to explore the following questions: Has the MDG brought meaningful changes? Are there really successes at home and abroad? Will the new set of goals (SDGs) be different from the business as usual path to a true sustainable development which results in inclusive growth or are they makeovers for prevailing economic order? Furthermore, the paper also endeavored to address the differences between MDG and SDG, SDGs financing and the place of businesses in SDG. In addition, it reflected on the performance of Ethiopia in line with MDG and alignments of GTP II with SDGs.
4. Significance of the Study By highlighting the shortcomings and achievements of MDGs, it will provide an input for the refinement of SDGs, explore alternative sources of financing for SDGs which probability were 3 http://www.lline.fi/en/article/research/1032014/looking-back-to-move-forward-the-mdgs-and- the-road-to-post-2015, 6/6/2015, 7:48 PM
4 http://www.ncbi.nlm.nih.gov/pmc/articles/PMC3877943/, 6/6/2015, 7:42 PM
5 http://www.lline.fi/en/article/research/1032014/looking-back-to-move-forward-the-mdgs-and- the-road-to-post-2015, 6/6/2015, 7:48 PM
65
not considered in MG framework to enhance their implementation possibility, clarify the role of private sector in SDGs implementation, and sensitize stockholders for SDGs so that they will align their strategies with SDGs. By indicating different viewpoints of MDGs and SDGs, it will create an opportunity for sober academic debate on the agenda.
5. Methodology The research was an exploratory desk research that focused on the study of relevant UN documents, articles, government reports and online materials.
6. The World before MDG The Millennium Development Goals (MDG initiative), which guided the world development efforts in the years 2000-2015, is about to come to a close and be replaced by Sustainable Development initiative for the period 2015-2030. The eight international development goals were the outcome of the Millennium development declaration of the 2000 United Nations Millennium Summit. The initiative is probably the most discussed and promoted in the UN and other high-level government forums. The MDGs intended to “focus the efforts of the world community on achieving significant, measurable improvements in people's lives by the year 2015”6. It galvanized the efforts of world governments to bring about change in the life of many. The MDGs are described as “the most successful global anti-poverty push in history”7.
The declaration traces back its root to the 1990s during which UN member states at UN conference “aimed at building consensus” on development priorities for the 21st century”8. After years of search to strike firm common ground, the UN Secretariat putting itself in the driver’s seat orchestrated the year 2000 Millennium Summit in New York in September 2000 in which 189 UN member states adopted the Millennium Declaration. The signatories included 147 heads of states. However, the goals were coined by working committee experts drawn from dominant international organizations “including the World Bank, the International Monetary Fund, UNICEF, the Population Fund and the World Health Organization, as well as the Organization for Economic Cooperation and Development” implying that the initiative was 6 The World Bank Data, MDGs, 2015 the World Bank Group; http://data.worldbank.org/about/millennium- development-goals, 7/7/2015 11:26 PM
7 The Millennium Development Goals Report, 2013, UN; http://www.un.org/millenniumgoals/pdf/report-2013/mdg- report-2013-english.pdf
8 Marguerite A. Peeters, The Millennium Development Goals: Introduction and historical process, Dialogue Dynamics on Hunan Identity and Global Governance, 2010, http://www.dialoguedynamics.com/content/learning- forum/seminars/the-millennium- development-goals/the-millenium-development-goals/the-millenium-development- goals- 69/article/the-millennium-development-goals, 7/6/2015, 9:46 PM
66
“driven by the UN Secretariat and its “experts”: a fuzzy, “formal-informal” situation”9. Unlike the conventional belief, the eight MDGs were not promulgated in the year 2000. It was
after about a year, in August 2001, that the UN published the internationally agreed 8 millennium development goals10. These globally endorsed goals consist of eight goals: (1) eradicate extreme poverty and hunger, (2) achieve universal primary education, (3) promote gender equality, (4) reduce child mortality, (5) improve maternal health, (6) control HIV/AIDS, malaria and other diseases, (7) ensure environmental sustainability, (8) develop a global partnership for development. Each goal comprises a set of specific targets and indicators from 18-21 targets and 48-60 indicators1112. The indicators were originally set to monitor progress towards MD goals and targets by the joint effort of the United Nations system, including the World Bank and the International Monetary Fund, as well as the Development Assistance Committee of the Organization for Economic Co-operation and Development (OECD). The indicators together with the goals and the targets were presented by the UN Secretary General “to the General Assembly September 2001 in the Road Map Towards the Implementation of the United Nations Millennium Declaration”13. Following member states’ 2005 World Summit, the goals, targets, and indicators were revised. Since 2007, four new targets were added and more indicators to monitor progress were also identified increasing them to 60 after new ones were added and some modified or deleted.14,15
7. The Achievements of MDGs The MDGs aimed to eliminate extreme poverty by reducing poverty and its ramifications primarily in subsistence, education, and health. According to the United Nations, absolute (extreme) poverty is "a condition characterized by severe deprivation of basic human needs, including food, safe drinking water, sanitation facilities, health, shelter, education and
9 Institute for Intercultural Dialogue Dynamics, The Millennium Development Goals: Introduction and historical process, http://www.dialoguedynamics.com/content/learning-forum/seminars/the- millennium- development-goals/the-millenium-development-goals/the-millenium-development- goals-69/article/the-millennium- development-goals, 2015
10 Marguerite A. Peeters, The Millennium Development Goals: Introduction and historical process, Dialogue Dynamics on Hunan Identity and Global Governance, 2010
11 MDGs, http://www.alliance2015.org/fileadmin/user_upload/MDGs.pdf, 7/6/2015, 11:41
12 UN, The Millennium Development Goals Report, p. 58, 2013
13 UN, Indicators for Monitoring the MDGs, p. iii, 2003, New York.
14 The World Bank, MDGs, 2015, http://data.worldbank.org/about/millennium-development-goals, 7/10/15; 6:42AM
15 Dimitri Sanga, The Challenges of Monitoring and Reporting on the Millennium Development Goals in Africa by 2015 and Beyond, Journal statistique Africain, numéro 12, mai 2011 104

67
information. It depends not only on income but also on access to services."16 For practical purposes, extreme poverty is considered to mean earning below the international poverty line of $1.25/day in 2005 prices, or $1.00 a day in 1996 US prices17. Although there were skeptics describing it implausible18, the Millennium Development Goals, (MDGs) are considered the most successful collective global anti-poverty push in history which galvanized the support of governments, international organizations, businesses and civil society groups to slash in half the world’s extreme poverty rate. While there has been significant progress across all goals, in some success are recorded ahead of time, and in the rest of the cases goals are considered to be within reach.19 The first of the MDGs which is reduction of extreme poverty and hunger, reducing poverty in half was met five years ahead of schedule.20 The same is true for access to improved drinking water (about 2.3 million people were beneficiaries between 1990 and 2012). More girls are in school. Fewer children are dying. Significant gains are made in cutting chronic under nutrition among young children.
Malaria and Tuberculosis victims are substantially reduced saving over 3.3 and 22 million lives from death respectively. Gender party in primary education is achieved in all developing regions, child mortality has dropped by half, the maternal mortality declined 45 per cent between 1990 and 2013.21 More women are assuming power in the world and at the same time developing countries have experienced favorable trading system and stable date burden,22 Nevertheless, the world continues to fight killer diseases, such as malaria, tuberculosis and AIDS and (2.3 billion) people are not getting safe drinking water yet.
8. From MDGs to SDGs The Millennium Development Goals have had many positive outcomes. They have unified, galvanized, and expanded efforts to help the world's poorest people. It provided a simple, transparent and easy-to-understand framework, explicitly recognized the special needs of 16 http://www.un.org/esa/socdev/wssd/text-version/agreements/poach2.htm 17 (https://en.wikipedia.org/wiki/Extreme_poverty) 6/27/15, 11:45)
18 Michael A. Clemens, Charles J. Kenny, Todd J. Mos, The Trouble with the MDGs: Confronting Expectations of Aid and Development Success, Volume 35, Issue 5, May 2007, Pages 735–751, 2007
19 Jan Vandemoortele, Are the MDGs feasible?, United Nations Development Programme Bureau for Development Policy, New York 2002
20 UN, The Millennium Development Goals Report, 2014, p.4
21 http://www.un.org/millenniumgoals/poverty.shtml, 7/11/2015, 11:36PM
22 UN, loc cit

68
vulnerable countries and called for t h e strengthening of commitments (increase ODA to LDC, LLDCs and SIDS), availed duty-free, quota-free market access for LDCs and enhanced program of debt relief for heavily indebted poor countries, focused attention and action on key challenges and rallied the world behind common approach to development.
The initiative has drawn world governments, private businesses, non-government organizations, civic societies and other stakeholders to a common agenda and direction and improved the lives of millions of people taking them out of misery, extreme poverty, hunger, and illiteracy, which have been the symbol of human disgrace.
Ethiopia’s performance has also been commendable. By aligning the MDGs with national development plans, Ethiopia recorded remarkable progress on MDGs. It achieved MDG 4: that is reducing child mortality by 2/3rd two years ahead of 2015. Ethiopia is also in a good position to decrease poverty to 22 percent which was 46 percent at the beginning of the MDGs. Overall, it has kept six of the eight MDGs (MDGs 1, 2, 4, 6, 7, 8) on track over the last decade.23
http://www.et.one.un.org/index.php?option=com_content&view=article However, the MDGs set out to reduce poverty not to eliminate it. In 2012, it was estimated that a quarter of all children under the age of five years to be stunted, implying that 162 million young children are still suffering from chronic under nutrition, children under the age of five and maternity deaths are occurring that are preventable. Practices that exasperate environmental degradation and threaten environmental sustainability continue unabated. The Millennium Ecosystem Assessment (MA) and Millennium Project considers environmental degradation as a major barrier to the achievement of the MDGs while at the same time eradicating poverty as
23 UN, loc cit
69
precursor for reaching environmental goals24. Poverty forces people impact the environment in their desperate quest for land, food, and sustenance. Unscrupulous businesses can cause irreversible footprints25 (land, water or air) and still get away with it because the people who bear the brunt of it are the poor and unable to complain effectively. Millions of hectares of forest have been lost every year, renewable water resources have become more scarce, and many species have been driven closer to extinction.26” Global emissions of carbon dioxide (CO2) have been increasing since 1900 and more alarmingly it has shown sharp increase after 1950. In fact, emissions increased by about 1.5 times between 1990 and 2008.27
As side from all these, the MDGs targets and indicators have been described lacking precise goals to fulfill or benchmark. Though the initiative proposes generous ODA to nations, it does set any neither quantitative nor time-bound target for example.28 The MDGs also deemphasized or omitted important aspects that are curtail for sustainability. The initiative did not adequately consider non-traditional donors and innovative sources of financing, quality of education, and reaching the very poor and most excluded people. It counted out the issue of inequality, justice, poverty in non-developing countries and the integration of economic social and environmental goals. Of course, MDGs are described as too aid and social focused and donor driven.
With the anticipation of MDGs expiration in 2015, the UN has been pondering on the post 2015 agenda since 2010. Following on the outcome of the 2010 High-level Plenary Meeting of the General Assembly on the Millennium Development Goals, the United Nations Secretary-General appointed a task team in September 2011 to support UN system-wide preparations for the post- 2015 UN development agenda. In consultation with all stakeholders, the UN System Task Team produced a report entitled “Realizing The Future We Want For All”29 which emphasized globalization as a positive force for all the world’s peoples of present and future generations and followed by 2013 report that suggested five30 transformative changes the post 2015 development agenda should reflect. However, it is since the 2012 Rio and Doha without ignoring the Kyoto 24 MOFED, UN Country Team, Assessing Progress Towards MDGs, Ethiopia MDGs Report 2012
25 Jeffrey D. Sachs and Walter V. Reid, Investment Towards Sustainable Development, VOL 312, Policy Forum, 2006, AAAS
26 Mohammed Seid, Combined Energy Mix Optimization Model, IIT, 2011
27 UN, loc cit
28 http://www.epa.gov/climatechange/ghgemissions/global.html, 7/12/2015, 4:02 PM 29 UN System Task Team on the Post 2015 UN Development Agenda, Assessment of MDG8 and Lessons Learnt, 2013 30 Michael Obrovsky, Johannes Trimme,THE POST-2015 AGENDA – REFORM OR TRANSFORMATION?, ÖSTERREICHISCHE ENTWICKLUNGSPOLITIK 2014. DIE POST-2015 AGENDA – REFORM ODER TRANSFORMATION?
70
Protocol31 that world leaders have started to try to adopt a joint global approach to economic growth and to the associated issues of sustainability, climate and environmental protection32.
In this process, t h e UN and world leaders have appreciated eminent economic, social and environmental challenges that the world has faced. The common concerns have motivated the international community to deliberate on these interconnected challenges under the umbrella of Sustainable Development Goals (SDGs) to be achieved in the years beyond 2015. An open working group on Sustainable Development Goals (SDG) was set up by UN General Assembly in 2013 and commissioned to “develop a proposal for goals that are numerically limited, ambitious but easy to communicate, which are also coherent and integrated in the UN development agenda beyond 2015.”33 The SDGs are hoped to atone for the shortcomings of MDGs in terms of its formulation process as well as content. The SDGs are expected to cover the coming fifteen years, 2015 to 2030 and mobilize the world community, governments, the private sector, international organizations, non-governmental organizations (NGOs) and other stakeholders worldwide towards setting goals, targets and indicators and marshal concerted efforts to address the triple pillars of sustainability: economic, social, and environmental concerns. These goals and targets are hoped to further what have been achieved by MDGs, fill the gaps missed, and cover areas ranging from poverty eradication “to food security, health, education, employment, equality, climate change, ecosystems and biodiversity, among others”34. It is exciting and just to witness poverty eradication being included in the SDGs in spite of the prevalence of ossified income hierarchies and plutocratic governments35. Without prejudice to peculiarity in national cultural practices, capabilities, levels of development and subsequent differences in national policies and priorities, the goal for the SDGs is to be “global in nature and universally applicable”. A “universally applicable” agenda means that every country will be expected to show progress towards nationally defined targets that will contribute to the overall SDGs. The new SD goals are supposed to apply to all countries at all income levels and, therefore, SDGs will become everyone’s agenda.
The United Nations has been working concertedly to involve all stakeholders including governments, civil societies, businesses and other partners to build on the momentum generated by the MDGs and to put out an ambitious, yet realistic, post-2015 sustainable development goals, 31 “i) leave no one behind, ii) put sustainable development at the core, iii) transform economies for jobs and inclusive growth, iv) build peace and effective, open and accountable institutions for all, v) forge a new global partnership.” P. 2.
32 Mohammed Seid, combined Energy Mix Optimization Model, IIT, 2011 33 Obrovsky, Loc cit 34 Obrovsky, Loc cit
35 World Investment Report 2014, p 136, http://unctad.org/en/PublicationChapters/wir2014ch4_en.pdf

71
targets and indicators. The OWG approach and the involvement of different stakeholders including governments will probably dispel the blame ascribed to MDGs, a declaration that expressed the views of those experts that consulted the UN Secretariat rather than desire of sovereign governments and the will of the people the governments represented.
The SDGs are hoped to deal with the three pillars of sustainable development: economy, society, and environment. As its name implies sustainable development means "development that meets the needs of the present without compromising the ability of future generations to meet their own needs.” It is a process for meeting human development goals while without destroying the ecosystem’s capacity to regenerate itself.
It is expected to address social and human rights injustice, win the support of businesses and governments to take initiatives that do justice to people, the community and the environment, rather than repeating disasters like the Bhopal incident which left a total of 3,787 deaths or the 2013 Savar building collapse (Bangladesh) which caused a death toll of 1,129, or the 2010 BP oil spill in the Gulf of Mexico. It is believed that no one would like to pass on decimated social, economic, and environment (polluted water resource and villages, suffocating air, and deserts) to the future generations. Therefore, SDGs are anticipated (currently with 17 Goals and 169 targets) to be more human, rational, just, and with long term view. These will be goals that civil societies, governments, businesses, and other stakeholders have to take ownership of. SDGs should not carry the stigma that from its inception to its execution, sovereign governments have not been in the driver’s seat, but have themselves been driven by a host of “partners” whose identity often remain nebulous. 9. The Private Sector Appreciating businesses as the central solution provider for sustainable development, the Global Reporting Initiative (GRI), the United Nations Global Compact, and the World Business Council for Sustainable Development (WBCSD) have made strides to involve business in realizing SDGs which aim to end poverty, ensure a life of dignity and opportunity for all, and protect our planet’s stability. They work together to “produce an implementation guide on impact assessment, KPI selection and goal setting, with the aim of supporting businesses in assessing their impacts, aligning their strategies with the SDGs and establishing company goals”36.
The assumption is that business can play a positive role in innovation, investment, inspiration, partnership, setting and pursuing sustainable goals as well as in promoting an inclusive business model which allows businesses to “do well by doing good”. Does it mean private money for public good? No, it is distinct from philanthropy that is a commercially variable model that looks 36 Jason Hickel, How to Save Capitalism from Capitalists, July 2014, http://www.thoughtleader.co.za/jasonhickel/2014/07/10/how-to-save-capitalism-from-the-capitalists accessed 6/6/2015
72
beyond shorter profit and high income and benefits low-income communities by involving them either on the supply side or on the demand side in the sustainable way so that both businesses and the poor will work for mutual benefit in a manner that ensures the dignity of the poor.
As Nelson Mandel said: “Overcoming poverty is not a task of charity, it is an act of justice. Like Slavery and Apartheid, poverty is not natural. It is man-made and it can be overcome and eradicated by the actions of human beings.”37 So ‘the real issue is to create the wealth and then share it.’ For some this even be to the interest of the West, i.e., by creating “fairer” world, the West may prevent capitalism from destroying itself — at least in the short term38.
The media in its part has a role to play; it has to help people understand what it is, and hold governments and corporations accountable. Without such universal buy-in, the goals stand less of chance of succeeding. Besides, in addition to focusing on putting appropriate monitoring framework, countries have to appreciate and work on the human capital development to make the SDGs achieve enduring and sustainable success, since “No country has achieved sustainable economic growth and development without substantial development of its human capital”39 10. Financing Serious thoughts and plans on funding the SDGs are curtail for their implementation. The issue is so important that major world leaders and experts will hold conference in Addis Ababain July 2015. According to the Oxfam report, governments experienced deficits in supporting the MDGs implementation and the finical requirement of SDGs is even substantially greater, at least US$1.5 trillion extra a year40 signifying that financing SDGs will be much more uphill.
In other words, sustainability behooves long term view which will ensure self- sufficiency of nations and organizations to support durable growth. Therefore, the July conference is expected to explore different financing options beyond financial aid which is crucial but far from being sustainable more importantly for developing countries.
Oxfam report recommended doubling of tax revenue “through radically overhauling global tax rules and concessional development cooperation” in addition to the use of innovative public financing. It also suggested improvement of allocation effectiveness, reorientation of all spending to fight inequality, and transparent and accountable system build up. The financial plan has also to consider parties that have been left out or that have not been emphasized in the MDGs financing 37 http://www.wbcsd.org/globalpolicy/wbcsddavos2015.aspx 38 http://www.worldforumfoundation.org/nelson-mandela-1918-2013/ 7/19/2015 8:32PM
39 Loc Cit, Hickel
40 Godfrey Oshilim Nkogbu, Enhancing Sustainable Economic Growth and Development through Human Capital Development, International Journal of Human Resource Studies, Vol. 5, No. 1, 2014
73
schemes such as the private sector. Apart from public financing a partnership has to be sought with the civil society and corporations as sources of funding for SDGs implementation.
ODA may remain the dominant source of funding for development cooperation. However, non- traditional donors and innovative sources of financing including businesses, private philanthropy, innovative sources of development public financing like Hidassie Bond and Lottery are of enormous treasure. Also nations have to tape other emerging donors, like Brazil, China, India, South Africa, Saudi Arabia and Venezuela.
In addition, developing countries should be free to use their resources including dirty energy sources to fuel their development needs till they start catching up low carbon technology and carbon low economy becomes an opportunity (kind of cheap source of financing) for them. They should be allowed to set their priorities among the different combination levels of economic, social and environmental objectives and should not be penalized or denied any thing for this including ODA financing.
In the end some may ask questions like, are SDGs ‘Wishful’ or ‘Achievable’ or “Distracting” (Means of setting up command-post or micro-manage nations)? Some argue that without isolating causes of poverty, human misery, and environmental pollution, it is hard to hope that they will be overcome.
The Pope for example associated transnational corporation and foreign debt system responsible for transforming sovereign states as stooges, polluting poor countries, and causing human suffering and environmental destruction. The SDGs proposed the prevailing economic system as the sole solution for humanity “with a little bit of weeding around the edges to make life more bearable for the poor.”41 As seen from MDGs impact, even when significant GDP growth was observed, it caused only more income disparity- the poorest people getting little as a result of the trickle-down effect. The financial crisis also widened the income gap between the poor and the rich. “From 2009 to 2012, the top 1% incomes grew by 31.4% while the bottom 99% incomes grew by a mere 0.4%, according to an updated study, by University of California Berkeley economists, Emmanuel Saez and Thomas Piketty.”42 While the number of billionaires has doubled since the financial crisis, the majority of the people in countries affected by the crisis were subjected to austerities. The most recent glaring example in time of SDGs development is Greece. Another incident that may cast doubt on intentions of the architect nations of these 41 https://www.oxfam.org/sites/www.oxfam.org/files/file_attachments/rr-financing-sustainable- development-goals-110615-en.pdf
42 Jason Hickel, Joe Brewer, and Martin Kirk, POPE FRANCIS’ ENCYCLICAL VS THE UN’S SDGS: WHO WILL SAVE THE WORLD FIRST? June 25, 2015, http://therules.org/pope- francis-encyclical-vs-the-uns- sdgs-who-will-save-the-world-first/ This article originally appeared on TheGuardian on 23rd June 2015.
74
development initiatives is the UK’s Parliament July 15th 2015 deliberation to limit the workers’ rights to go on strike43.
In spite of less pronounced doubts and conspiracy ideas, the seemingly unwieldy nature of the goals and targets, SDGs are worth buying and integrating in national development plans of any country. No one need to shy away from forging all capabilities and resources available to realize noble goals like poverty eradication, economic prosperity, environmental protection, and social justice, though that should not the end of it. 43 http://fortune.com/2013/09/11/the-rich-got-a-lot-richer-since-the-financial-crisis/
75
Serving the Underserved: The Missing Middle in the Financing of Ethiopian Businesses
Yitbarek Takele1 and Yoseph Fantu2 Abstract The objective the paper is to examine the importance of access to finance to the development of
Small and Medium businesses in the context of developing countries in general and Ethiopian businesses in particular. It is strongly argued that the financing of Small and Medium Enterprises is the missing middle as the Micro businesses are financed by MFIs and larger ones by commercial and development banks and, thus, adequate space is dedicated to tracking of this missing middle both from demand and supply sides. In view of this, the paper deals in great length with the challenges and prospects of Small and Medium Businesses development in connection to access to finance. In so doing, the paper analyzed and captured the relationship and emerging patterns between the sources and disbursements of the banking sector and MFIs (in terms of developments in deposit mobilization, lending and loan collection activities) and Micro, Small, Medium and Large businesses in Ethiopia from 2004/5 to 2013/14. From the results, it is concluded that it is not the cost of credit that made it extremely difficult for Small and Medium businesses to access finance and subsequently flourish in Ethiopia, but the meager supply and stringent procedures and criteria set for accessing of same. Finally, the paper concludes by encapsulating effective mechanisms of serving credit demands of Small and Medium businesses under the established context. Keywords: Underserved, Missing Middle, Access to Finance, Small and Medium Business, Ethiopia 1. Introduction Stable and peaceful states create workable environments for economic growth. Economic growth, measured by the sustainable productive capacity of the country year after year, is derived by an increase in the capital stock, advances in technology, improved quality and level of literacy. As the economy grows, so does the need to cope with the more and more diversified activities in which the business environment operates. Industries emerge to provide resources for other industries and smaller businesses emerge striving to fill the gaps large industries cannot fill. The public sector cannot efficiently drive economic growth alone; the private sector also has a central role to play.
Ethiopia is one of the fastest growing economies in the world, despite many challenges. The country had been scoring double digit growth until recent years. Since the liberalization of the
1 Associate Professor, Department of Management, College of Business and Economics, Addis Ababa University, Email: [email protected] 2 Lecturer, School of Commerce, College of Business and Economics, AAU, Email: [email protected]
76
economy in 1991, numerous businesses have flourished. The country has made starting business easier by streamlining registration procedures in the last five years, however, according to the World Bank, Ethiopia ranks 168th, out of 189 economies, on the ease of starting a business scale. Collateral and bankruptcy laws are relatively poorly designed compared to neighboring countries such as Kenya and Uganda. Furthermore, even if there is an online platform for sharing credit information for borrowers, the depth of credit information is also considered to be poor as compared to the rest of the world. Such indicators shed light on how easy it is to get credit in the country (World Bank 2014a).
While in some parts of the world there are multitude ways of attracting external finance, in others options are limited. Businesses can access finance through Business angels, venture capitalists, friends, families and fools (3fs), crowdfunding and the like (Josef & Merri 2015). Furthermore, in some parts of the world listed companies can also raise funds by selling stock/shares of their companies. Such mechanisms of financing need to be backed by well-established systems that can monitor, regulate and sustain the growth in demand. In Ethiopia, the options are limited to some of the ways mentioned above.
Businesses use the funding that they have for growing their business by purchasing fixed assets or expanding their business to another market (Nugroho 2015). Unfortunately, SMEs also referred to as the missing middle, seem to be underserved looking at their contribution to the economy and growth potential. To say the least, it is reported that in Ethiopia alone credit constraints will affect the sales growth rate (-15%), employment growth (-5%) and labor productivity (-11%) (World Bank 2014b).
For one, the underserved are not the poorest of the poorest. They are the pharmacies we buy our medicine in, it’s the cafes that serve our macchiato, it’s the shoe and furniture producers that employ the youth and try to find market for their products. Such business may need financing to open a second store, renovate the café or buy machineries to make better products and workers’ life easier. The Ethiopian government classifies such business as small enterprises; they employ 6 to 30 people and have a total asset of 1.5 million ETB (roughly 75 thousand USD today) in the manufacturing sector and 500 ETB thousand (25 thousand USD today) (Ethiopia 2011). Medium business should have 31-99 employees and up to 20 million in total assets. Unfortunately, an official government reference on the definition of Medium Enterprises (nor large enterprises for that matter) exists (World Bank 2014b). In addition, SMEs are also referred as the seed for bigger enterprises if given the opportunity.
Therefore, the objective the paper is to examine the importance of access to finance to the development of Small and Medium Enterprises for development in general and in Ethiopian businesses in particular. This paper is a descriptive paper based on reports of national and international organization, research articles and journal articles and newspaper articles written on the source of finance for
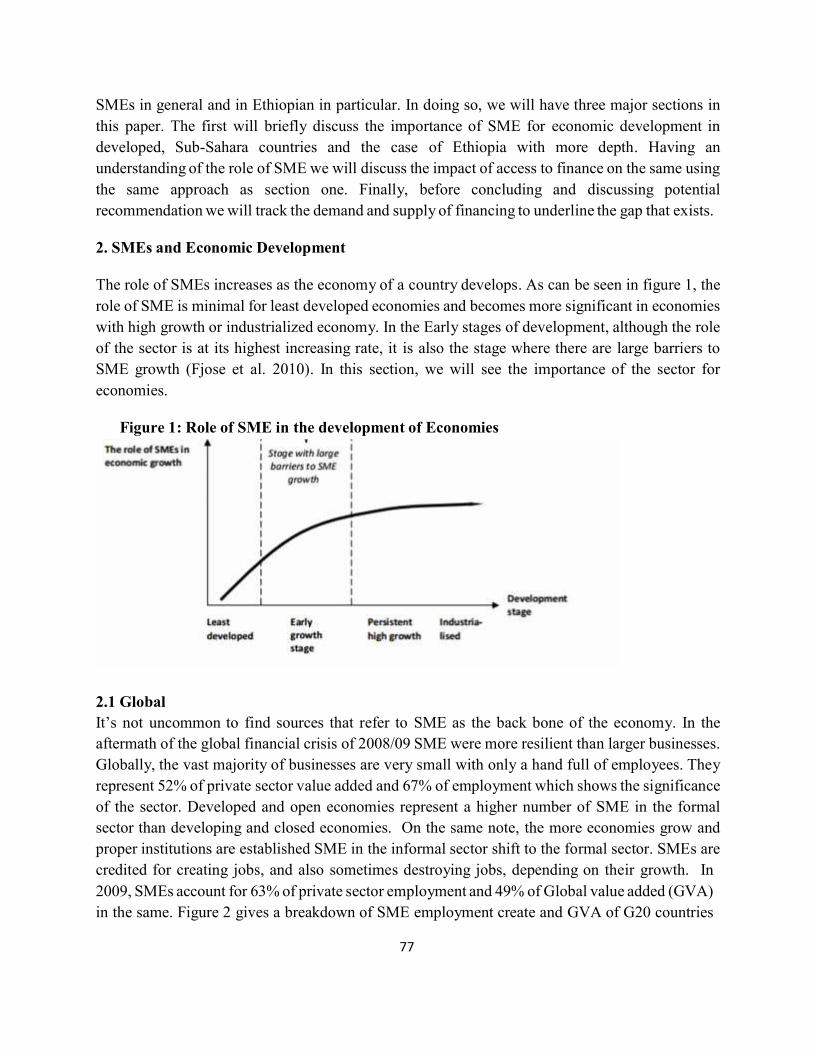
77
SMEs in general and in Ethiopian in particular. In doing so, we will have three major sections in this paper. The first will briefly discuss the importance of SME for economic development in developed, Sub-Sahara countries and the case of Ethiopia with more depth. Having an understanding of the role of SME we will discuss the impact of access to finance on the same using the same approach as section one. Finally, before concluding and discussing potential recommendation we will track the demand and supply of financing to underline the gap that exists.
2. SMEs and Economic Development The role of SMEs increases as the economy of a country develops. As can be seen in figure 1, the role of SME is minimal for least developed economies and becomes more significant in economies with high growth or industrialized economy. In the Early stages of development, although the role of the sector is at its highest increasing rate, it is also the stage where there are large barriers to SME growth (Fjose et al. 2010). In this section, we will see the importance of the sector for economies.
Figure 1: Role of SME in the development of Economies
2.1 Global It’s not uncommon to find sources that refer to SME as the back bone of the economy. In the aftermath of the global financial crisis of 2008/09 SME were more resilient than larger businesses. Globally, the vast majority of businesses are very small with only a hand full of employees. They represent 52% of private sector value added and 67% of employment which shows the significance of the sector. Developed and open economies represent a higher number of SME in the formal sector than developing and closed economies. On the same note, the more economies grow and proper institutions are established SME in the informal sector shift to the formal sector. SMEs are credited for creating jobs, and also sometimes destroying jobs, depending on their growth. In 2009, SMEs account for 63% of private sector employment and 49% of Global value added (GVA) in the same. Figure 2 gives a breakdown of SME employment create and GVA of G20 countries
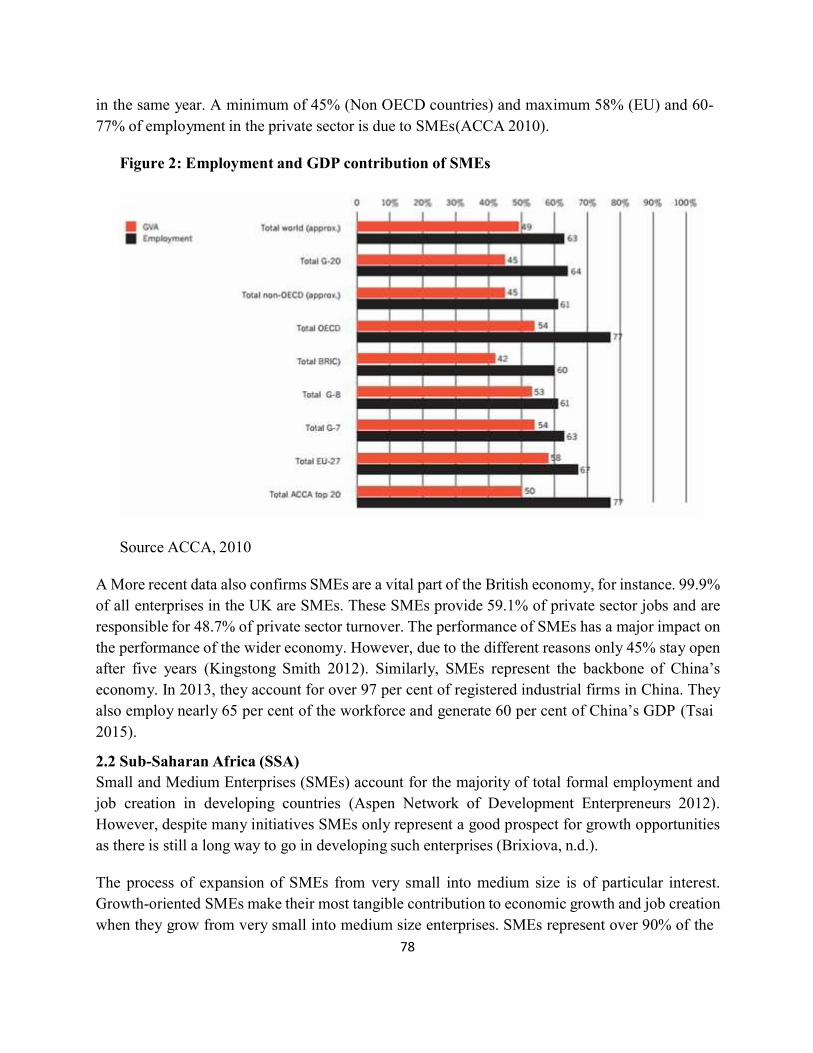
78
in the same year. A minimum of 45% (Non OECD countries) and maximum 58% (EU) and 60- 77% of employment in the private sector is due to SMEs(ACCA 2010).
Figure 2: Employment and GDP contribution of SMEs
Source ACCA, 2010 A More recent data also confirms SMEs are a vital part of the British economy, for instance. 99.9% of all enterprises in the UK are SMEs. These SMEs provide 59.1% of private sector jobs and are responsible for 48.7% of private sector turnover. The performance of SMEs has a major impact on the performance of the wider economy. However, due to the different reasons only 45% stay open after five years (Kingstong Smith 2012). Similarly, SMEs represent the backbone of China’s economy. In 2013, they account for over 97 per cent of registered industrial firms in China. They also employ nearly 65 per cent of the workforce and generate 60 per cent of China’s GDP (Tsai 2015).
2.2 Sub-Saharan Africa (SSA) Small and Medium Enterprises (SMEs) account for the majority of total formal employment and job creation in developing countries (Aspen Network of Development Enterpreneurs 2012). However, despite many initiatives SMEs only represent a good prospect for growth opportunities as there is still a long way to go in developing such enterprises (Brixiova, n.d.).
The process of expansion of SMEs from very small into medium size is of particular interest. Growth-oriented SMEs make their most tangible contribution to economic growth and job creation when they grow from very small into medium size enterprises. SMEs represent over 90% of the
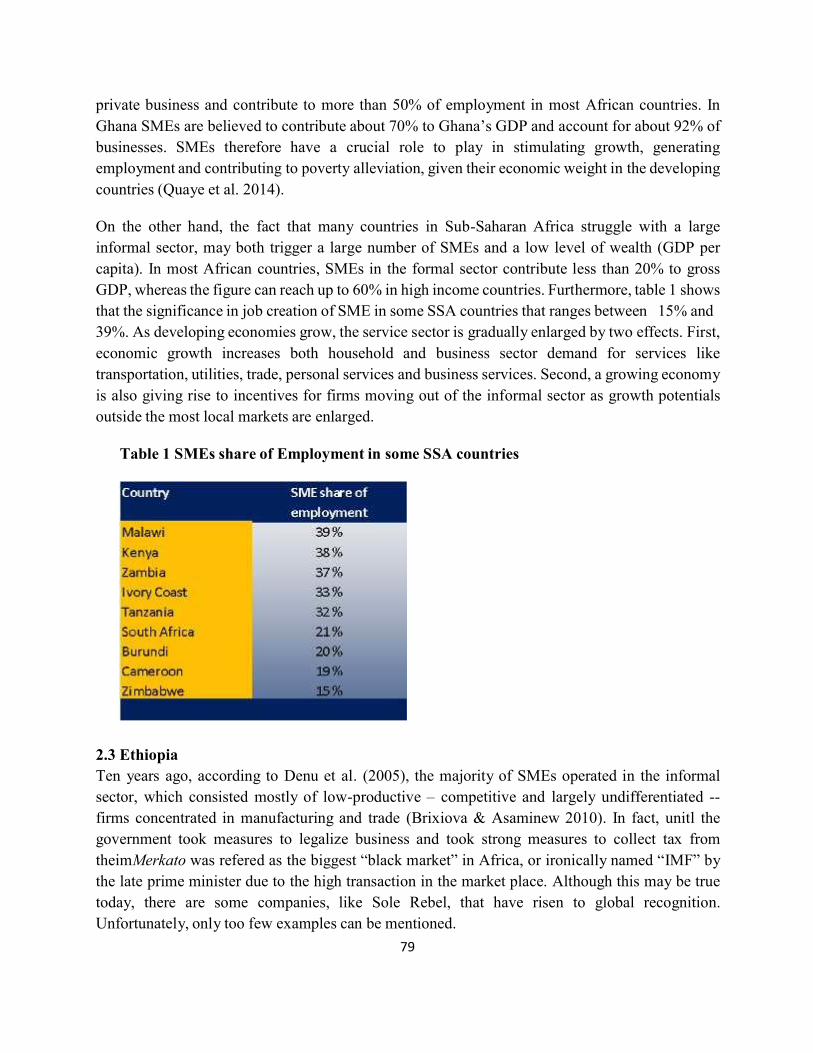
79
private business and contribute to more than 50% of employment in most African countries. In Ghana SMEs are believed to contribute about 70% to Ghana’s GDP and account for about 92% of businesses. SMEs therefore have a crucial role to play in stimulating growth, generating employment and contributing to poverty alleviation, given their economic weight in the developing countries (Quaye et al. 2014).
On the other hand, the fact that many countries in Sub-Saharan Africa struggle with a large informal sector, may both trigger a large number of SMEs and a low level of wealth (GDP per capita). In most African countries, SMEs in the formal sector contribute less than 20% to gross GDP, whereas the figure can reach up to 60% in high income countries. Furthermore, table 1 shows that the significance in job creation of SME in some SSA countries that ranges between 15% and 39%. As developing economies grow, the service sector is gradually enlarged by two effects. First, economic growth increases both household and business sector demand for services like transportation, utilities, trade, personal services and business services. Second, a growing economy is also giving rise to incentives for firms moving out of the informal sector as growth potentials outside the most local markets are enlarged.
Table 1 SMEs share of Employment in some SSA countries
2.3 Ethiopia Ten years ago, according to Denu et al. (2005), the majority of SMEs operated in the informal sector, which consisted mostly of low-productive – competitive and largely undifferentiated -- firms concentrated in manufacturing and trade (Brixiova & Asaminew 2010). In fact, unitl the government took measures to legalize business and took strong measures to collect tax from theimMerkato was refered as the biggest “black market” in Africa, or ironically named “IMF” by the late prime minister due to the high transaction in the market place. Although this may be true today, there are some companies, like Sole Rebel, that have risen to global recognition. Unfortunately, only too few examples can be mentioned.
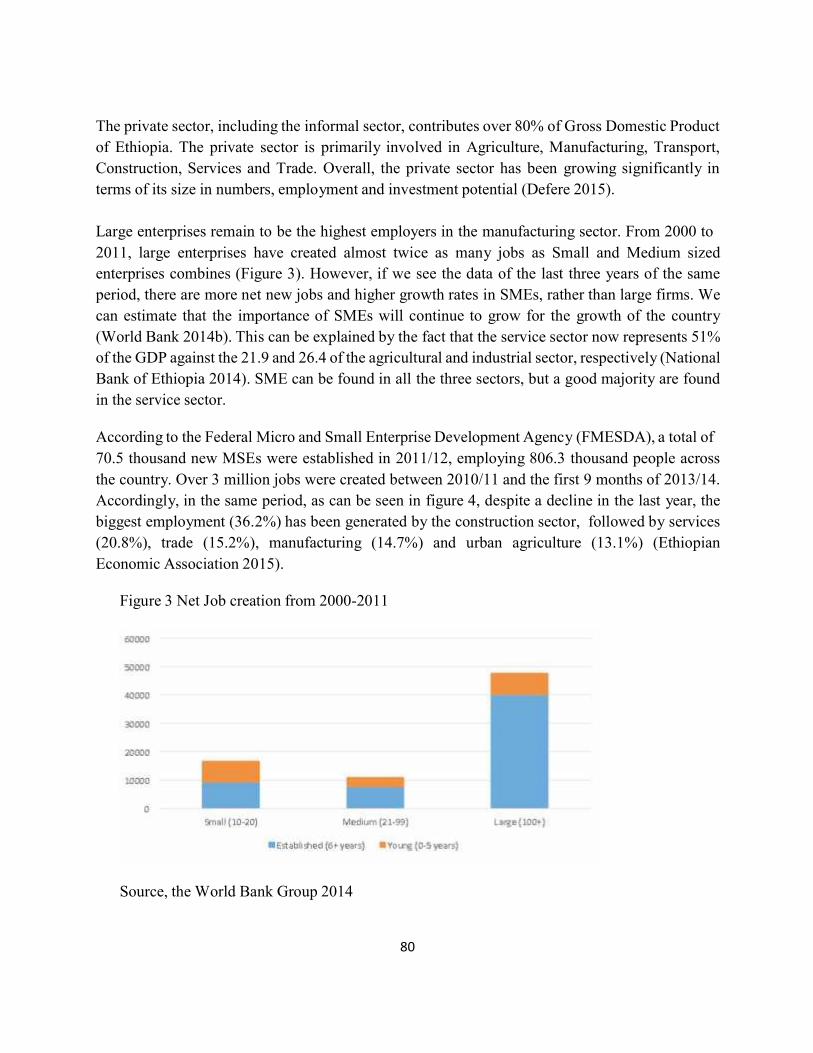
80
The private sector, including the informal sector, contributes over 80% of Gross Domestic Product of Ethiopia. The private sector is primarily involved in Agriculture, Manufacturing, Transport, Construction, Services and Trade. Overall, the private sector has been growing significantly in terms of its size in numbers, employment and investment potential (Defere 2015).
Large enterprises remain to be the highest employers in the manufacturing sector. From 2000 to 2011, large enterprises have created almost twice as many jobs as Small and Medium sized enterprises combines (Figure 3). However, if we see the data of the last three years of the same period, there are more net new jobs and higher growth rates in SMEs, rather than large firms. We can estimate that the importance of SMEs will continue to grow for the growth of the country (World Bank 2014b). This can be explained by the fact that the service sector now represents 51% of the GDP against the 21.9 and 26.4 of the agricultural and industrial sector, respectively (National Bank of Ethiopia 2014). SME can be found in all the three sectors, but a good majority are found in the service sector.
According to the Federal Micro and Small Enterprise Development Agency (FMESDA), a total of 70.5 thousand new MSEs were established in 2011/12, employing 806.3 thousand people across the country. Over 3 million jobs were created between 2010/11 and the first 9 months of 2013/14. Accordingly, in the same period, as can be seen in figure 4, despite a decline in the last year, the biggest employment (36.2%) has been generated by the construction sector, followed by services (20.8%), trade (15.2%), manufacturing (14.7%) and urban agriculture (13.1%) (Ethiopian Economic Association 2015).
Figure 3 Net Job creation from 2000-2011
Source, the World Bank Group 2014
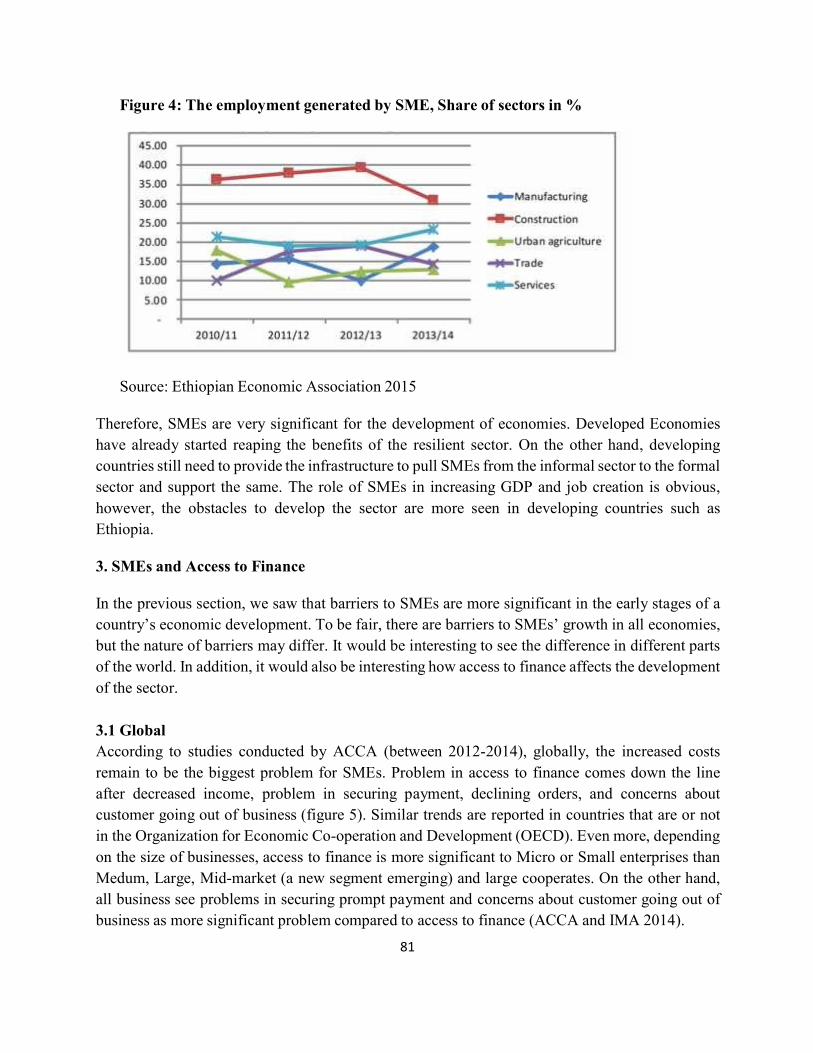
81
Figure 4: The employment generated by SME, Share of sectors in %
Source: Ethiopian Economic Association 2015 Therefore, SMEs are very significant for the development of economies. Developed Economies have already started reaping the benefits of the resilient sector. On the other hand, developing countries still need to provide the infrastructure to pull SMEs from the informal sector to the formal sector and support the same. The role of SMEs in increasing GDP and job creation is obvious, however, the obstacles to develop the sector are more seen in developing countries such as Ethiopia.
3. SMEs and Access to Finance In the previous section, we saw that barriers to SMEs are more significant in the early stages of a country’s economic development. To be fair, there are barriers to SMEs’ growth in all economies, but the nature of barriers may differ. It would be interesting to see the difference in different parts of the world. In addition, it would also be interesting how access to finance affects the development of the sector.
3.1 Global According to studies conducted by ACCA (between 2012-2014), globally, the increased costs remain to be the biggest problem for SMEs. Problem in access to finance comes down the line after decreased income, problem in securing payment, declining orders, and concerns about customer going out of business (figure 5). Similar trends are reported in countries that are or not in the Organization for Economic Co-operation and Development (OECD). Even more, depending on the size of businesses, access to finance is more significant to Micro or Small enterprises than Medum, Large, Mid-market (a new segment emerging) and large cooperates. On the other hand, all business see problems in securing prompt payment and concerns about customer going out of business as more significant problem compared to access to finance (ACCA and IMA 2014).
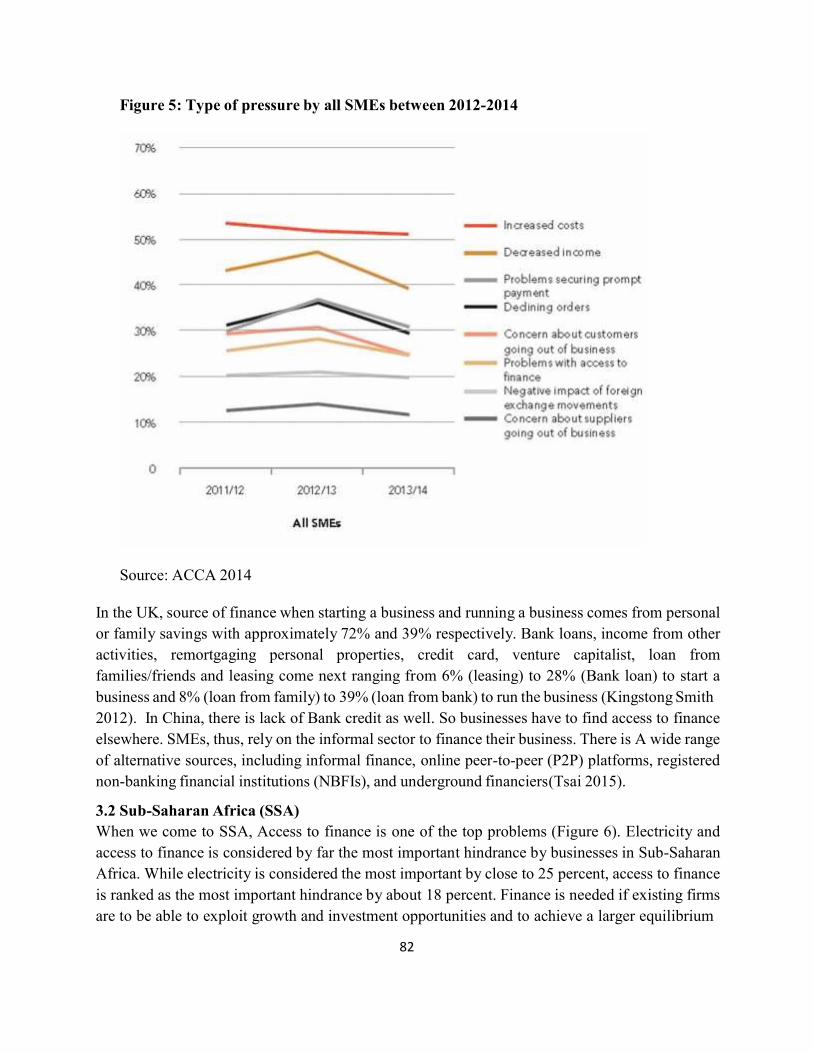
82
Figure 5: Type of pressure by all SMEs between 2012-2014
Source: ACCA 2014 In the UK, source of finance when starting a business and running a business comes from personal or family savings with approximately 72% and 39% respectively. Bank loans, income from other activities, remortgaging personal properties, credit card, venture capitalist, loan from families/friends and leasing come next ranging from 6% (leasing) to 28% (Bank loan) to start a business and 8% (loan from family) to 39% (loan from bank) to run the business (Kingstong Smith 2012). In China, there is lack of Bank credit as well. So businesses have to find access to finance elsewhere. SMEs, thus, rely on the informal sector to finance their business. There is A wide range of alternative sources, including informal finance, online peer-to-peer (P2P) platforms, registered non-banking financial institutions (NBFIs), and underground financiers(Tsai 2015).
3.2 Sub-Saharan Africa (SSA) When we come to SSA, Access to finance is one of the top problems (Figure 6). Electricity and access to finance is considered by far the most important hindrance by businesses in Sub-Saharan Africa. While electricity is considered the most important by close to 25 percent, access to finance is ranked as the most important hindrance by about 18 percent. Finance is needed if existing firms are to be able to exploit growth and investment opportunities and to achieve a larger equilibrium
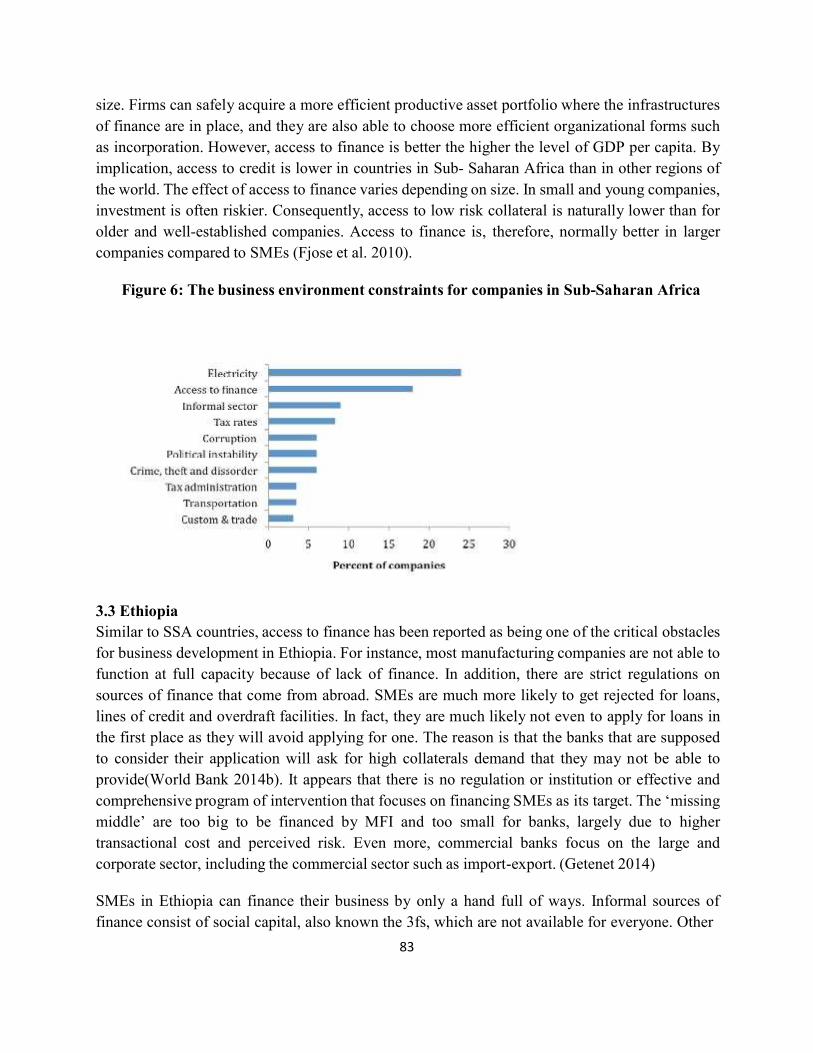
83
size. Firms can safely acquire a more efficient productive asset portfolio where the infrastructures of finance are in place, and they are also able to choose more efficient organizational forms such as incorporation. However, access to finance is better the higher the level of GDP per capita. By implication, access to credit is lower in countries in Sub- Saharan Africa than in other regions of the world. The effect of access to finance varies depending on size. In small and young companies, investment is often riskier. Consequently, access to low risk collateral is naturally lower than for older and well-established companies. Access to finance is, therefore, normally better in larger companies compared to SMEs (Fjose et al. 2010).
Figure 6: The business environment constraints for companies in Sub-Saharan Africa
3.3 Ethiopia Similar to SSA countries, access to finance has been reported as being one of the critical obstacles for business development in Ethiopia. For instance, most manufacturing companies are not able to function at full capacity because of lack of finance. In addition, there are strict regulations on sources of finance that come from abroad. SMEs are much more likely to get rejected for loans, lines of credit and overdraft facilities. In fact, they are much likely not even to apply for loans in the first place as they will avoid applying for one. The reason is that the banks that are supposed to consider their application will ask for high collaterals demand that they may not be able to provide(World Bank 2014b). It appears that there is no regulation or institution or effective and comprehensive program of intervention that focuses on financing SMEs as its target. The ‘missing middle’ are too big to be financed by MFI and too small for banks, largely due to higher transactional cost and perceived risk. Even more, commercial banks focus on the large and corporate sector, including the commercial sector such as import-export. (Getenet 2014)
SMEs in Ethiopia can finance their business by only a hand full of ways. Informal sources of finance consist of social capital, also known the 3fs, which are not available for everyone. Other

84
informal sources include Ekub, traditional and widely utilized in the country, where people come together to periodically contribute money that will be used by a single person at a time.
The formal sources of finance are largely dominated by banks. They are largely responsible to finance businesses in the country, although one in particular, the Commercial Bank of Ethiopia (CBE) plays a very dominant role. The banking industry also uses channels such as Micro Finance Institutions (MFIs) to finance micro business. The focus of this paper will be on the formal sources of finance as they represent a large volume of financing in the country (Zerayehu et al., 2013). However, the financial sector has still a long way to go to supplying for the ever-increasing demand.
According to a recent study conducted by the world bank, Micro and Small Enterprises perceive that access to finance is the biggest problem with 49.8% and 39.5% respectively. However, small enterprises have the highest rate of rejected loans with 83% compared to 57.3%, 6.2% and 10.4% for Micro, Medium and Large enterprises. Even more Medium and large enterprises have a considerably higher rate in having a line of credit, have overdraft facilities and have external source of finance (figure 7). Over all, making small enterprises the most affected by the problem in access to finance followed by Micro enterprises (World Bank 2014b).
Figure 7: Access to finance by sector in Ethiopia
Source: WB, 2014 In conclusion, access to finance is among the biggest problems form SME especially in the developing countries. Sources of finance are limited in these markets. In the developed countries, venture capitalist, credit cards, and other means can help sustain business and access to finance is not the biggest pending problem. In developing it is. The smaller the company is the higher its risk of not being able to secure loans, being underserved. In Ethiopia, this is more seen in small enterprises rather than the other, hence constituting the center of the missing middle.

85
4. Focusing on Tracking the Missing middle in Ethiopia: Demand and supply 4.1 Demand side As noted by the deputy director of Federal Micro and Small Enterprises Development Agency, cost of credit is not really an issue. What matters is the availability of funds and procedures to access what is available. With regard to the availability, Wolday (2008, as quoted by Wolday and Anteneh 2013:15) stated that an estimated 10.4 million borrowers will require access to financial services over the next decade, which will require an investment over Birr 106 billion (which is now about USD 5.5 billion). This gives a bird’s eye view to the potential demand.
Job creation in the service, especially in the retail sector, are higher than the manufacturing sector. SMEs represent more in terms of creating job opportunities than large enterprises, thereby are a class that should attract the attention of different stakeholders. Looking at the trend since 2010, the loan provided for SMEs on the one hand and the capacity of SME to save and pay back has been on a constant rise. Table 2 shows that the total loan provided for SME, in the last period have more than doubled in the four year period on the one hand and the lowest repayment percentage was in 2013 at roughly 64% (Ethiopian Economic Association 2015). Furthermore, there was less than 5% of non-performing loans suggesting that SME don’t have a problem with the cost of access to finance.
Table 2 Savings, loans and Loan Repayment by SMes
Source Ethiopian Economic association 2015
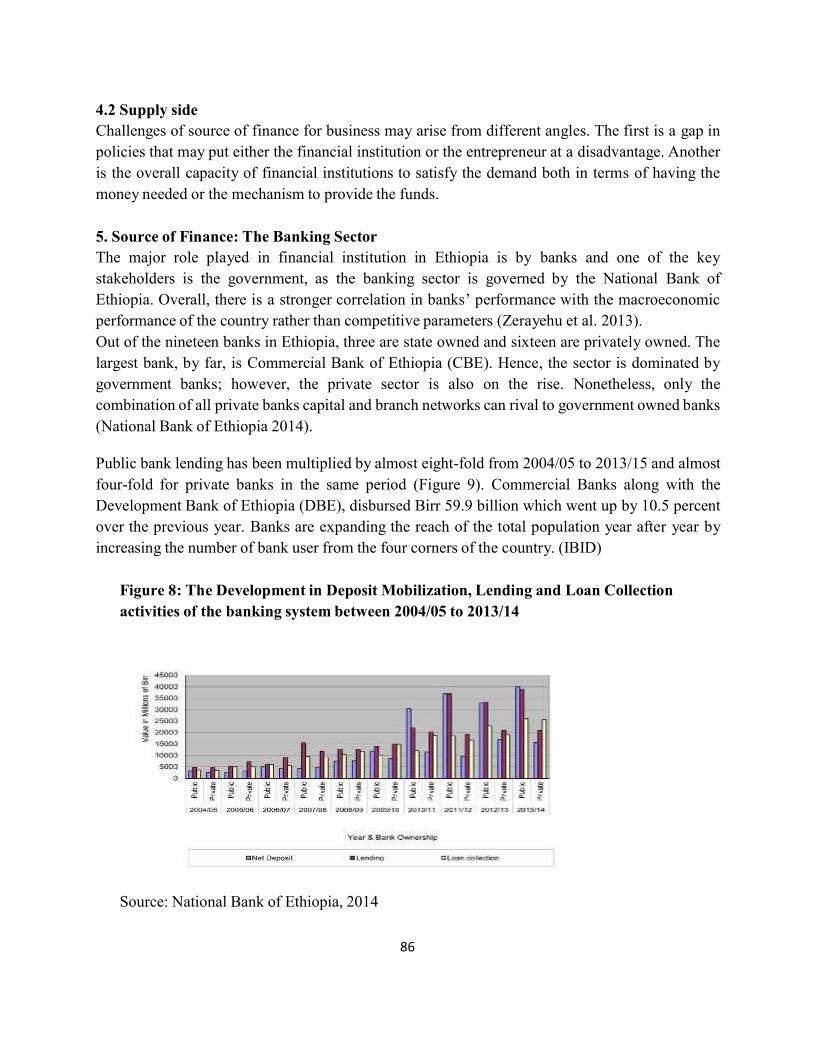
86
4.2 Supply side Challenges of source of finance for business may arise from different angles. The first is a gap in policies that may put either the financial institution or the entrepreneur at a disadvantage. Another is the overall capacity of financial institutions to satisfy the demand both in terms of having the money needed or the mechanism to provide the funds.
5. Source of Finance: The Banking Sector The major role played in financial institution in Ethiopia is by banks and one of the key stakeholders is the government, as the banking sector is governed by the National Bank of Ethiopia. Overall, there is a stronger correlation in banks’ performance with the macroeconomic performance of the country rather than competitive parameters (Zerayehu et al. 2013). Out of the nineteen banks in Ethiopia, three are state owned and sixteen are privately owned. The largest bank, by far, is Commercial Bank of Ethiopia (CBE). Hence, the sector is dominated by government banks; however, the private sector is also on the rise. Nonetheless, only the combination of all private banks capital and branch networks can rival to government owned banks (National Bank of Ethiopia 2014).
Public bank lending has been multiplied by almost eight-fold from 2004/05 to 2013/15 and almost four-fold for private banks in the same period (Figure 9). Commercial Banks along with the Development Bank of Ethiopia (DBE), disbursed Birr 59.9 billion which went up by 10.5 percent over the previous year. Banks are expanding the reach of the total population year after year by increasing the number of bank user from the four corners of the country. (IBID)
Figure 8: The Development in Deposit Mobilization, Lending and Loan Collection activities of the banking system between 2004/05 to 2013/14
Source: National Bank of Ethiopia, 2014
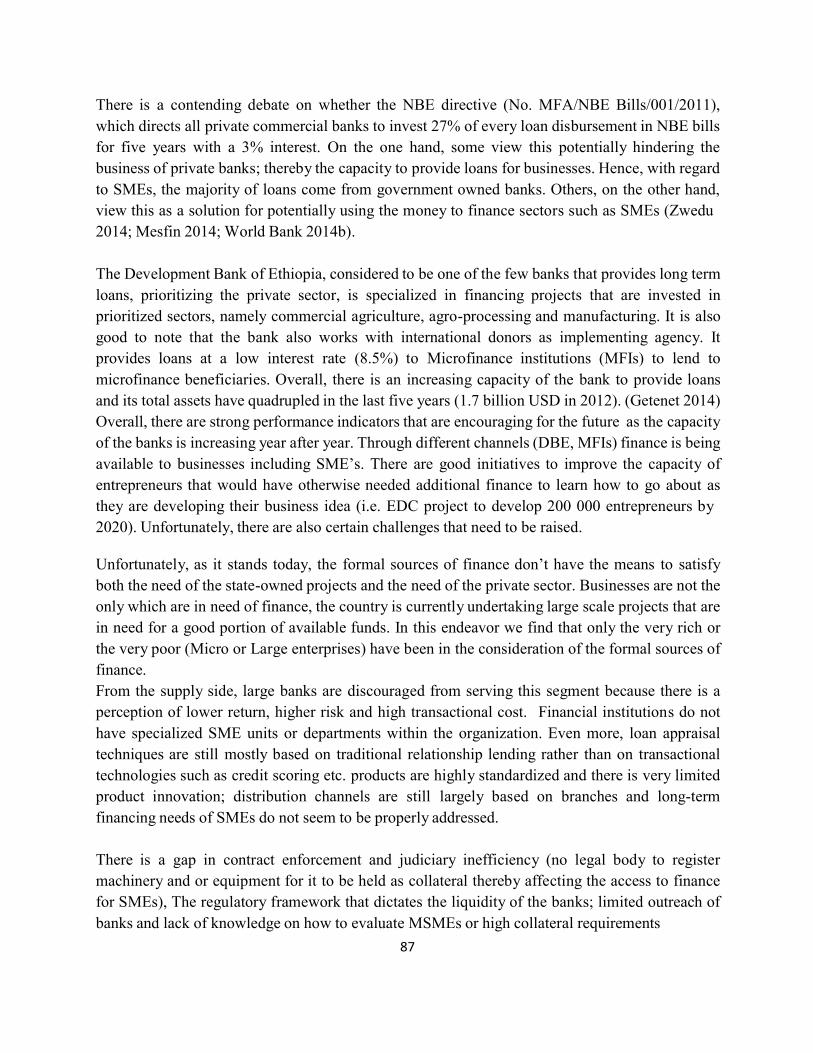
87
There is a contending debate on whether the NBE directive (No. MFA/NBE Bills/001/2011), which directs all private commercial banks to invest 27% of every loan disbursement in NBE bills for five years with a 3% interest. On the one hand, some view this potentially hindering the business of private banks; thereby the capacity to provide loans for businesses. Hence, with regard to SMEs, the majority of loans come from government owned banks. Others, on the other hand, view this as a solution for potentially using the money to finance sectors such as SMEs (Zwedu 2014; Mesfin 2014; World Bank 2014b).
The Development Bank of Ethiopia, considered to be one of the few banks that provides long term loans, prioritizing the private sector, is specialized in financing projects that are invested in prioritized sectors, namely commercial agriculture, agro-processing and manufacturing. It is also good to note that the bank also works with international donors as implementing agency. It provides loans at a low interest rate (8.5%) to Microfinance institutions (MFIs) to lend to microfinance beneficiaries. Overall, there is an increasing capacity of the bank to provide loans and its total assets have quadrupled in the last five years (1.7 billion USD in 2012). (Getenet 2014) Overall, there are strong performance indicators that are encouraging for the future as the capacity of the banks is increasing year after year. Through different channels (DBE, MFIs) finance is being available to businesses including SME’s. There are good initiatives to improve the capacity of entrepreneurs that would have otherwise needed additional finance to learn how to go about as they are developing their business idea (i.e. EDC project to develop 200 000 entrepreneurs by 2020). Unfortunately, there are also certain challenges that need to be raised. Unfortunately, as it stands today, the formal sources of finance don’t have the means to satisfy both the need of the state-owned projects and the need of the private sector. Businesses are not the only which are in need of finance, the country is currently undertaking large scale projects that are in need for a good portion of available funds. In this endeavor we find that only the very rich or the very poor (Micro or Large enterprises) have been in the consideration of the formal sources of finance. From the supply side, large banks are discouraged from serving this segment because there is a perception of lower return, higher risk and high transactional cost. Financial institutions do not have specialized SME units or departments within the organization. Even more, loan appraisal techniques are still mostly based on traditional relationship lending rather than on transactional technologies such as credit scoring etc. products are highly standardized and there is very limited product innovation; distribution channels are still largely based on branches and long-term financing needs of SMEs do not seem to be properly addressed.
There is a gap in contract enforcement and judiciary inefficiency (no legal body to register machinery and or equipment for it to be held as collateral thereby affecting the access to finance for SMEs), The regulatory framework that dictates the liquidity of the banks; limited outreach of banks and lack of knowledge on how to evaluate MSMEs or high collateral requirements

88
Some argue that the fact that there is a lack of sophisticated financing mechanism such as leasing, equity funds, etc. the financial sector is considered to be, as referred to by the African Economic Outlook (2012), shallow. Other studies show that less than 10% of household have access to formal credit. The latter problem also affects large businesses. Large and medium scale industries have been oscillating between 46% and 55% range capacity mainly due to lack of finance (Zwedu 2014). The fact that the country has been registering double digit growth for many years, and the vast and ambitious projects undertaken by the government leaves a high demand for financing; potentially at the cost of rising business in the short run. Most of the finance, over 70%, has been going to state and state-owned enterprises and less than 30% to the private sector. According to the IMF (2013) this is a critical obstacle for business development and Ethiopia may not be able to sustain the recent growth if a sustainable solution is not laid out. Long-term loans are discouraged, especially for SME’s. Short term loans, which constitute of the majority of loans banks provide to businesses, infringes the capacity of businesses to bring about sustainable change, as one year is not considered to be enough (Ibid).
Other challenges include certain aspects of the economy. For instance, unpredictable inflation affects the loan collection and disbursement activity of banks. On the other hand, the business environment of the country is rated in the lower bottom according to the World Bank (2012). As per a survey, getting credit, trading across borders, registering property and protecting investors are some the main constraints facing investors in Ethiopia.
As far as governance goes, at least some level of transparency is important in building the confidence of the business sector. Consequently, there is low level of confidence on the reasoning behind why certain loans are approved while others are not (Mesfin 2014). Corruption is considered as one of the challenges that will lead to erosion of business confidence in the country (World Bank Group 2012).
However, one of the most mentioned challenges that can be ratified purely by policy makers is to define a clear strategy for small and medium enterprises. Large and very small (the very rich and the very poor) are clearly defined and a strategy is in place to address their issue. On the other hand, SMEs are challenged by the absence of credit policy and strategy in their regard. Banks don’t have a separate policy that would consider their unique capacity and needs. The collateral required for loans is considered to be too high, especially for SMEs; hence there is a gap in the system for determining collateral and its evaluation.
The gap in the policy can be translated in the human resource capacity and weak risk management practices. The banking business without a functioning risk management system is quite risky and
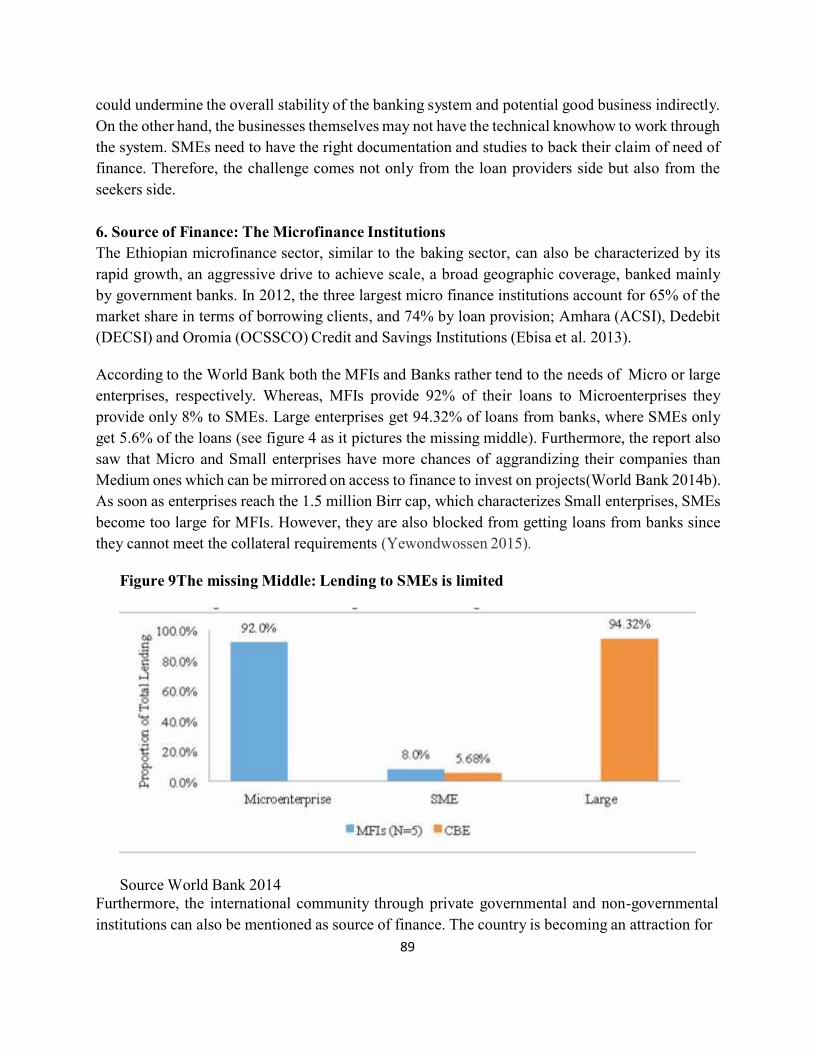
89
could undermine the overall stability of the banking system and potential good business indirectly. On the other hand, the businesses themselves may not have the technical knowhow to work through the system. SMEs need to have the right documentation and studies to back their claim of need of finance. Therefore, the challenge comes not only from the loan providers side but also from the seekers side.
6. Source of Finance: The Microfinance Institutions The Ethiopian microfinance sector, similar to the baking sector, can also be characterized by its rapid growth, an aggressive drive to achieve scale, a broad geographic coverage, banked mainly by government banks. In 2012, the three largest micro finance institutions account for 65% of the market share in terms of borrowing clients, and 74% by loan provision; Amhara (ACSI), Dedebit (DECSI) and Oromia (OCSSCO) Credit and Savings Institutions (Ebisa et al. 2013).
According to the World Bank both the MFIs and Banks rather tend to the needs of Micro or large enterprises, respectively. Whereas, MFIs provide 92% of their loans to Microenterprises they provide only 8% to SMEs. Large enterprises get 94.32% of loans from banks, where SMEs only get 5.6% of the loans (see figure 4 as it pictures the missing middle). Furthermore, the report also saw that Micro and Small enterprises have more chances of aggrandizing their companies than Medium ones which can be mirrored on access to finance to invest on projects(World Bank 2014b). As soon as enterprises reach the 1.5 million Birr cap, which characterizes Small enterprises, SMEs become too large for MFIs. However, they are also blocked from getting loans from banks since they cannot meet the collateral requirements (Yewondwossen 2015).
Figure 9The missing Middle: Lending to SMEs is limited
Source World Bank 2014 Furthermore, the international community through private governmental and non-governmental institutions can also be mentioned as source of finance. The country is becoming an attraction for
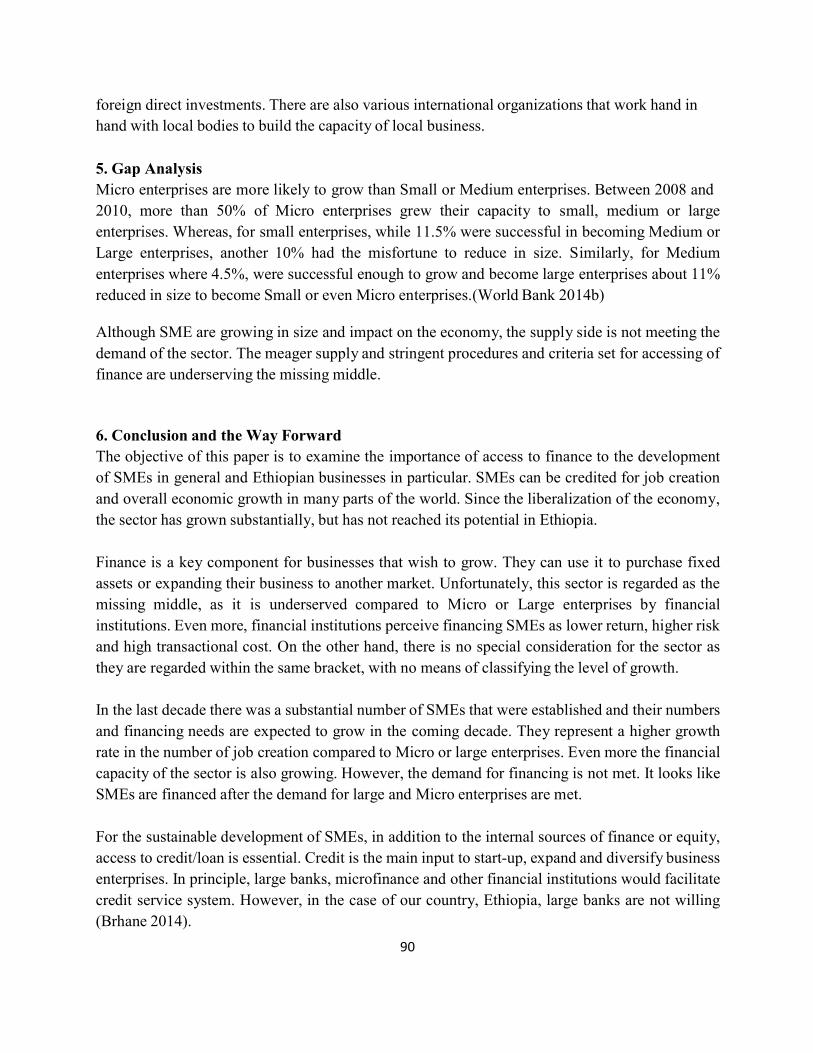
90
foreign direct investments. There are also various international organizations that work hand in hand with local bodies to build the capacity of local business.
5. Gap Analysis Micro enterprises are more likely to grow than Small or Medium enterprises. Between 2008 and 2010, more than 50% of Micro enterprises grew their capacity to small, medium or large enterprises. Whereas, for small enterprises, while 11.5% were successful in becoming Medium or Large enterprises, another 10% had the misfortune to reduce in size. Similarly, for Medium enterprises where 4.5%, were successful enough to grow and become large enterprises about 11% reduced in size to become Small or even Micro enterprises.(World Bank 2014b)
Although SME are growing in size and impact on the economy, the supply side is not meeting the demand of the sector. The meager supply and stringent procedures and criteria set for accessing of finance are underserving the missing middle.
6. Conclusion and the Way Forward The objective of this paper is to examine the importance of access to finance to the development of SMEs in general and Ethiopian businesses in particular. SMEs can be credited for job creation and overall economic growth in many parts of the world. Since the liberalization of the economy, the sector has grown substantially, but has not reached its potential in Ethiopia.
Finance is a key component for businesses that wish to grow. They can use it to purchase fixed assets or expanding their business to another market. Unfortunately, this sector is regarded as the missing middle, as it is underserved compared to Micro or Large enterprises by financial institutions. Even more, financial institutions perceive financing SMEs as lower return, higher risk and high transactional cost. On the other hand, there is no special consideration for the sector as they are regarded within the same bracket, with no means of classifying the level of growth.
In the last decade there was a substantial number of SMEs that were established and their numbers and financing needs are expected to grow in the coming decade. They represent a higher growth rate in the number of job creation compared to Micro or large enterprises. Even more the financial capacity of the sector is also growing. However, the demand for financing is not met. It looks like SMEs are financed after the demand for large and Micro enterprises are met.
For the sustainable development of SMEs, in addition to the internal sources of finance or equity, access to credit/loan is essential. Credit is the main input to start-up, expand and diversify business enterprises. In principle, large banks, microfinance and other financial institutions would facilitate credit service system. However, in the case of our country, Ethiopia, large banks are not willing (Brhane 2014).
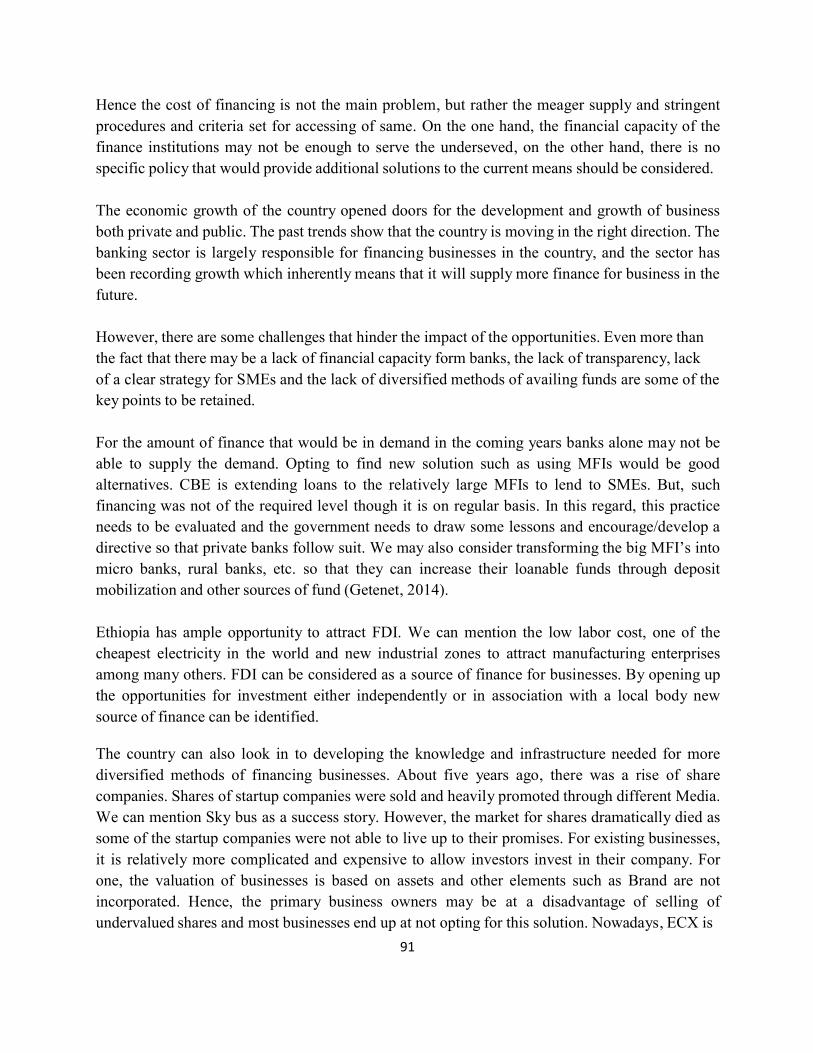
91
Hence the cost of financing is not the main problem, but rather the meager supply and stringent procedures and criteria set for accessing of same. On the one hand, the financial capacity of the finance institutions may not be enough to serve the underseved, on the other hand, there is no specific policy that would provide additional solutions to the current means should be considered.
The economic growth of the country opened doors for the development and growth of business both private and public. The past trends show that the country is moving in the right direction. The banking sector is largely responsible for financing businesses in the country, and the sector has been recording growth which inherently means that it will supply more finance for business in the future.
However, there are some challenges that hinder the impact of the opportunities. Even more than the fact that there may be a lack of financial capacity form banks, the lack of transparency, lack of a clear strategy for SMEs and the lack of diversified methods of availing funds are some of the key points to be retained.
For the amount of finance that would be in demand in the coming years banks alone may not be able to supply the demand. Opting to find new solution such as using MFIs would be good alternatives. CBE is extending loans to the relatively large MFIs to lend to SMEs. But, such financing was not of the required level though it is on regular basis. In this regard, this practice needs to be evaluated and the government needs to draw some lessons and encourage/develop a directive so that private banks follow suit. We may also consider transforming the big MFI’s into micro banks, rural banks, etc. so that they can increase their loanable funds through deposit mobilization and other sources of fund (Getenet, 2014).
Ethiopia has ample opportunity to attract FDI. We can mention the low labor cost, one of the cheapest electricity in the world and new industrial zones to attract manufacturing enterprises among many others. FDI can be considered as a source of finance for businesses. By opening up the opportunities for investment either independently or in association with a local body new source of finance can be identified.
The country can also look in to developing the knowledge and infrastructure needed for more diversified methods of financing businesses. About five years ago, there was a rise of share companies. Shares of startup companies were sold and heavily promoted through different Media. We can mention Sky bus as a success story. However, the market for shares dramatically died as some of the startup companies were not able to live up to their promises. For existing businesses, it is relatively more complicated and expensive to allow investors invest in their company. For one, the valuation of businesses is based on assets and other elements such as Brand are not incorporated. Hence, the primary business owners may be at a disadvantage of selling of undervalued shares and most businesses end up at not opting for this solution. Nowadays, ECX is

92
thinking of starting a stock exchange. Such techniques are used even in neighboring countries and can help finance business in addition to financial institution.
Therefore, the government that regulated the financial sector may need to think of certain amendments to the system and create more inclusive opportunities for SME. In addition, the country can look outward and see what other countries are doing. Finally, the government needs to balance between protecting the economy and liberalizing certain sectors to make the finance that businesses need, but the economy can’t avail at the moment.

93
References ACCA. (2010). Small business : a global agenda.
ACCA and IMA, (2014). Back in the game : Gloobal SME performance review, Aspen Network of Development Enterpreneurs. (2012). Small and Growing Businesses :
Investing in the Missing Middle for Poverty Alleviation, Brhane, T. (2014). Access to Finance for Micro and Small Enterprises in Debre Markos Town
Ethiopia Brhane Tadesse. Global Journal of current Research, 2(2), pp.36–46. Brixiova, Z. (n.d) On determinants of SME start ups in Ethiopia : A theoretical exploration.
African Development Bank, Developement Research Deaprtmetn, Tunis, Tunisia, pp.1– 20.
Brixiova, Z. & Asaminew, E. (2010). SME Start Ups in Ethiopia : Which Incentives Matter ? , (April 2008), pp.1–23.
Defere, E. (2015). Private Sector Landscape for WASH in Ethiopia. 2015 (June). Ebisa, D., Nigusies, G. & Mitiku, F. (2013). Filling the breach : Microfinance. Journal of
Business and Economic Managemtn, 1(January), pp.10–17. Ethiopia, G. of the F.D.R.E. (2011). Micro and Small Enterprise Development Strategy,
provision framework and methods of Implementation. Ethiopian Economic Association. (2015). Small and Micro Enterprises (SMEs) Development in
Ethiopia: Policies, Perfomance, Constraints and Prospects. Fjose, S., Grunfeld, L.A. & Green, C. (2010). SMEs and growth in Sub-Saharan Africa:
Identifying SME roles and obstacles to SME growth, Josef, J. & Merri, O. (2015). Crowdfunding: Success factors in the financin phase. UNiversity of
Applied Sciences and Arts Northwestern Switerlan FHNW. Kingstong, S. (2012). Success in challenging times : Key lessons for UK SMEs, Mesfin, Z. (2014). Access to Finance Still a problem in Ethiopia: World Bank. Addis Business,
p.1,4,8. National Bank of Ethiopia, 2014. Annual Report, Nugroho, S.A. (2015). Financial Inclusion in Indonesia : Enhancing SMEs ’ Growth Through
Hometown Investment Trust Fund Graduate School of Public Policy , University of Tokyo Abstract. , (January).
Quaye, I. et al. (2014). Bridging the SME Financing Gap in Ghana : The Role of Microfinance Institutions. , (October), pp.339–353.
Tsai, K.S. (2015). Financing Small and Medium Enterprises in China : Recent Trends and Prospects beyond Shadow Banking.
World Bank. (2014a). Doing business 2015: Going beyond eficiency, Washington, DC. World Bank. (2014b). SME FINANCE IN ETHIOPIA : Addressing the missing Middle
challenge. Yewondwossen, B.M., 2015. Overcoming Constraints in Ethiopia’s Manufacturing Sector.
(July), pp.5–8Zerayehu, S.E., Kagnew, W. teshome & Teshome, K.A. (2013). Competition in Ethiopian Banking Industry. African Journal of economics, 1(5), pp.176–190.
Zwedu, G.A. (2014). Financial inclusion, regulation and inclusive growth in Ethiopia. (November).
94
Mobile Money-Based Crowd funding: An Alternative to Financing Business1
Mesfin Fikre2 Abstract An inherent problem that businesses face at the very beginning of their operation is to get the necessary finance. In Ethiopia, the lack of collateral, sufficient savings, and practices of attracting investors to invest into new business projects is hindering the development of businesses. This frustrates many innovative businesses from joining the industry. Thus, it is important to examine other possibilities of financing new and innovative businesses. With the development of ICT, the literature reveals that there are trends of looking from the crowd, called crowdfunding, other than depending on traditional financial institutions like banks. Such approach has got many success stories. However, from the perspective of developing countries like Ethiopia, the possibilities of using the crowd as an alternative business financing is not documented and may not have been explored. Accordingly, this paper intends to (1) aware Ethiopian Executive and business communities about crowdfunding as an alternative means of financing businesses, (2) explore and analyze factors that might motivate individuals to support new businesses through crowdfunding platforms. Methodologically, the first objective is addressed by reviewing relevant literature while the second is addressed through a two-step empirical study. Based on the cognitive evaluation theory, pilot survey is conducted so that possible themes are identified (qualitative study). After this was done, the study was scaled up through quantitative study. Keywords: Mobile money, crowdfunding, motivating factors, business financing, 1. Introduction: Crowdfunding Finance is the necessary ingredient to establish and grow businesses (Florin et al, 2003). Most of the time, such finances are acquired from financial institutions, personal savings, family, and friends support. But, in the developing world like Ethiopia, many new starts up businesses and those that have no collaterals cannot access banks. The problem can be even worse for people who live and businesses that are located in rural areas. The high cost and risks of running formal financial institutions at rural areas made many individuals to be excluded from participating in financial inclusion (Collins et al., 2009; Duncome & Boateng, 2009; Kristof, 2010; Rutherford, 1999). This leaves may innovative business ideas to remain ideally in the mind of individuals or groups. Not only the problem of collaterals and access to banks, there are cases when individual lenders also lose confidence due to the fear of
1 This paper reports the result of the pilot study.
2 Lecturer, Department of Management, College of Business and Economics, Addis Ababa University, Email: [email protected]
95
losing their principal money. For example, lets recall the national business plan (idea) competition broadcasted for many months on EBC1 (the then ETV) in 2011 and 2012. As many of us could remember, many of those business ideas were innovative, exciting, novel, and have good profit potential. However, it is a few of those brilliant ideas which have got financing in the form of award and majority of them were left out from consideration. What a loss it was!! Many more business ideas and projects are left out due to lack of finance.
In saying this, I do not want to understate and/or overlook the role of microfinance institutions (MFIs) in financing small businesses and new start-ups. MFIs have played and are playing significant role in this respect. The down side of them is that like banks they demand some kind of collateral. The loans they provide is also returnable, which again can hinder some borrowers not to feel comfortable and feel full hearted, due to fear of lose. Such problem calls rethinking alternative ways that could address issues related to collateral and loan return. Advancement in ICT created new ways of interconnecting individuals. For example, internet based interconnectedness of individuals created an opportunity to get access to many brains, also called (open innovation)3, and to crowdsourcing, and/or crowdfunding. The emergence of the latter is dated back, when (Howe, 2008) published an article regarding harnessing the crowd for better creativity and problem solving. The claim made is that “the amount of knowledge and talent dispersed among individuals have always outstripped our capacity to harness it”. So, by using technology it is possible to leverage the power of the many, called crowdsourcing. The crowd is more creative and stunningly productive than single mind.
The existence of formal problems related to accessing formal financial institutions added wit h the development of innovations like (1) new payment systems, (2) growing market acceptance of online mediation, and (3) changing regulation of banks created opportunities for new and innovative financial approaches and models (ACCA, 2014). One of such innovative business financing approaches is crowdfunding. It is getting businesses (start-ups) financed by a large number of individuals, “the crowd” instead of, corporations, banks, or microfinance institutions. 1.1 Purpose and Research Gap Even though the potential of crowdfunding for developing countries is advocated by development experts (infoDev, 2013), it appears that there is paucity of knowledge with respect to its success factors. Specifically, the use of such platforms to finance business other than charity is not explored. Being motivated by such business or project financing problem (for example the contesting
3 http://www.openinnovation.eu/open-innovation

96
pojects that appeared on National TV in 2011 and 2012 but later left out), and gaps in the literature, this paper intends to (1) make an awareness about crowdfunding as an alternative approach to business financing among Ethiopian business community and executives, technology service providers, entrepreneurs, and innovators about financing, and from academic perspective (2) empirically examine if individuals can be motivated to participate in crowdfunding. Ethiopians are well known for their culture of helping each other during the times of economic h a r d s h ip and illness (for charity purposes). There are questions we need to address: will individuals be willing to support or finance start-up businesses that will make someone or some groups make business and livelihood out of it? What factors can motivate individuals to participate in crowdfunding? These are the questions the paper intends to answer. 1.2 Crowdfunding as an Alternative to Finance Businesses Crowdfunding platforms have enabled many individuals and businesses across the globe to raise lump sums of money from strangers and get their business moving (OECD, 2015). For example, according to Massolution4, a research firm that produces an annual report on crowdfunding industry globally, there were 283 in 2011 and 536 in 2012 active platforms. The volume of fund has also increased from USD 1.5 billion in 2011 to an estimated USD 5.1 billion in 2013. In the year 2014, the figure rose to USD 16 billion and projected to be USD 34 billion in 2020. By 2020, the World Bank estimates that developing countries alone will raise US$90 billion from such initiatives5. Such growth is attributed to the growth and use of social media, internet, and new technologies which are incredibly low-cost that enable individuals to easily reach many others out there.
1.3 Classifications of Crowdfunding Platforms According to Griffin (2012), crowdfunding can take one of the four forms: (1) donation- based crowdfunding, i.e. without any reward besides benevolence (the crowdfundee will not receive financial reward for his/her donation/contribution, (2) reward-based crowdfunding, i.e. the crowdfunding participant will not receive financial rewards but will be awarded with non- financial like products, services, public acknowledgement, promotion or others, (3) lending- based crowdfunding, i.e. the crowdfunding participant will receive financial rewards or returns like interest and the principal, and (4) equity-based crowdfunding, i.e. the crowdfunding participant will receive financial rewards in the form of financial returns such as equity, equit y-like shares or dividends. Cuesta et al. (2015), Hemer (2011), and Mitra (2012) have also come up with similar classifications of crowdfunding but with different names. The following table summarizes some of the crowdfunding platforms. 4 http://www.massolution.com
5 Phillips, Addis Ababa Ethiopia, July 2015, crowdfunding for SMEs in developing countries
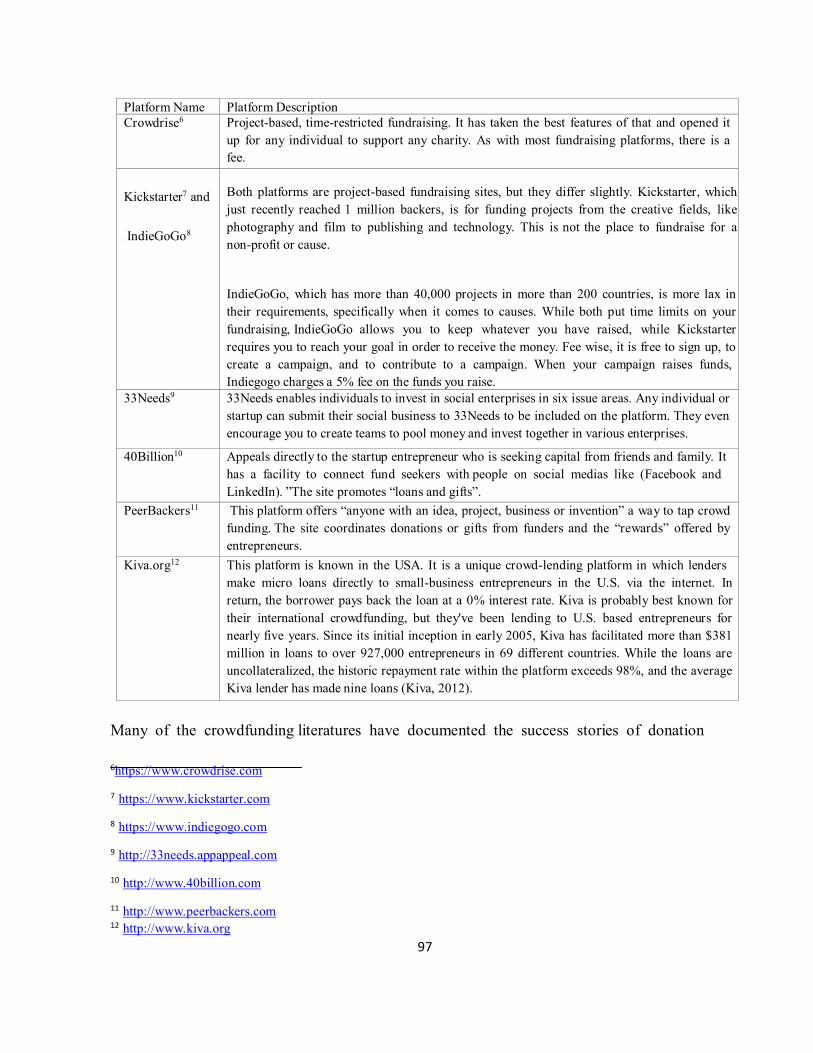
97
Platform Name Platform Description Crowdrise6 Project-based, time-restricted fundraising. It has taken the best features of that and opened it
up for any individual to support any charity. As with most fundraising platforms, there is a fee.
Kickstarter7 and IndieGoGo8
Both platforms are project-based fundraising sites, but they differ slightly. Kickstarter, which just recently reached 1 million backers, is for funding projects from the creative fields, like photography and film to publishing and technology. This is not the place to fundraise for a non-profit or cause.
IndieGoGo, which has more than 40,000 projects in more than 200 countries, is more lax in their requirements, specifically when it comes to causes. While both put time limits on your fundraising, IndieGoGo allows you to keep whatever you have raised, while Kickstarter requires you to reach your goal in order to receive the money. Fee wise, it is free to sign up, to create a campaign, and to contribute to a campaign. When your campaign raises funds, Indiegogo charges a 5% fee on the funds you raise.
33Needs9 33Needs enables individuals to invest in social enterprises in six issue areas. Any individual or startup can submit their social business to 33Needs to be included on the platform. They even encourage you to create teams to pool money and invest together in various enterprises.
40Billion10 Appeals directly to the startup entrepreneur who is seeking capital from friends and family. It has a facility to connect fund seekers with people on social medias like (Facebook and LinkedIn). ”The site promotes “loans and gifts”.
PeerBackers11 This platform offers “anyone with an idea, project, business or invention” a way to tap crowd funding. The site coordinates donations or gifts from funders and the “rewards” offered by entrepreneurs.
Kiva.org12 This platform is known in the USA. It is a unique crowd-lending platform in which lenders make micro loans directly to small-business entrepreneurs in the U.S. via the internet. In return, the borrower pays back the loan at a 0% interest rate. Kiva is probably best known for their international crowdfunding, but they've been lending to U.S. based entrepreneurs for nearly five years. Since its initial inception in early 2005, Kiva has facilitated more than $381 million in loans to over 927,000 entrepreneurs in 69 different countries. While the loans are uncollateralized, the historic repayment rate within the platform exceeds 98%, and the average Kiva lender has made nine loans (Kiva, 2012).
Many of the crowdfunding literatures have documented the success stories of donation
6https://www.crowdrise.com
7 https://www.kickstarter.com
8 https://www.indiegogo.com
9 http://33needs.appappeal.com
10 http://www.40billion.com
11 http://www.peerbackers.com 12 http://www.kiva.org
98
based crowdfunding platforms in the context of charity and equit y based crowdfunding in the context of financing private businesses. For example, according to (Herman, 2013), crowdfunding platforms such as Kickstarter has helped businesses and creative individuals to raise over US$500 million from over 4.5 million individuals on the site. These contributions come with no expectation of ownership or financial return. As the organization notes, “backers are supporting projects to help individuals come to life, not to profit financially”, which is a purely donating rather than seeking ownership and profit. But, what if one is interested to explore donation based crowdfunding concept in the context of for profit businesses, the second goal of this paper.
In some other crowdfunding platforms, participants will get mutual benefits. The borrowers will get finance to run the business; while the investors have some projects/business to invest in (Cuesta et al, 2015). Thus, crowdfunding can be characterized as a meeting place where individuals can showcase their projects to potential donors or investors, they mediate investors and those looking for funding, reduce transaction costs. As a meeting place, crowdfunding has attracted the attention of many scholars and business people. For example, platforms like KickStarter.com, Indiegogo.com, and GoFundMe.com created tremendous opportunities for both investors and businesses seeking financing. The platforms enabled people to easily invest small amounts of money into projects initiated by entrepreneurs and business looking for investors. The downside of this is that, many of the platforms were not exercised in developing countries. The exception to this is kiva.org. It targets small businesses in developing countries. It uses a more traditional micro-lending model with small online donors providing the seed capital. Such crowdfunding approach and platforms are a means to address the challenges of financing businesses.
When it comes to the use of crowdfunding as an alternative method for raising funds for the private sector (businesses), there are some good sign (attention13). For example, Baeck et al, (2014) have noted that the growth and development of ICT is simplifying the links between those who want to invest money and those who need it. Beyond funding business, (ACCA, 2014) noticed that crowdfunding can also be considered as one of the ways for savers and borrowers. Investors can save money while borrowers get it.
1.4. Model of Crowdfunding Platforms As can be seen from figure 1 below, and according to Agrawal et al. (2013), Agrawal et al. (2011) and Rodríguez (2013), the crowdfunding ecosystem consists of borrowers (fund seekers), lenders or investors, lenders or donors, service being exchanged, the price platform owners (administrators) charge, the digital platform where the two parties meet, and the
13 http://www.jamaicaobserver.com/business/Phillips-promotes-crowdfunding-for-SMEs-in-developing- countries_19219408
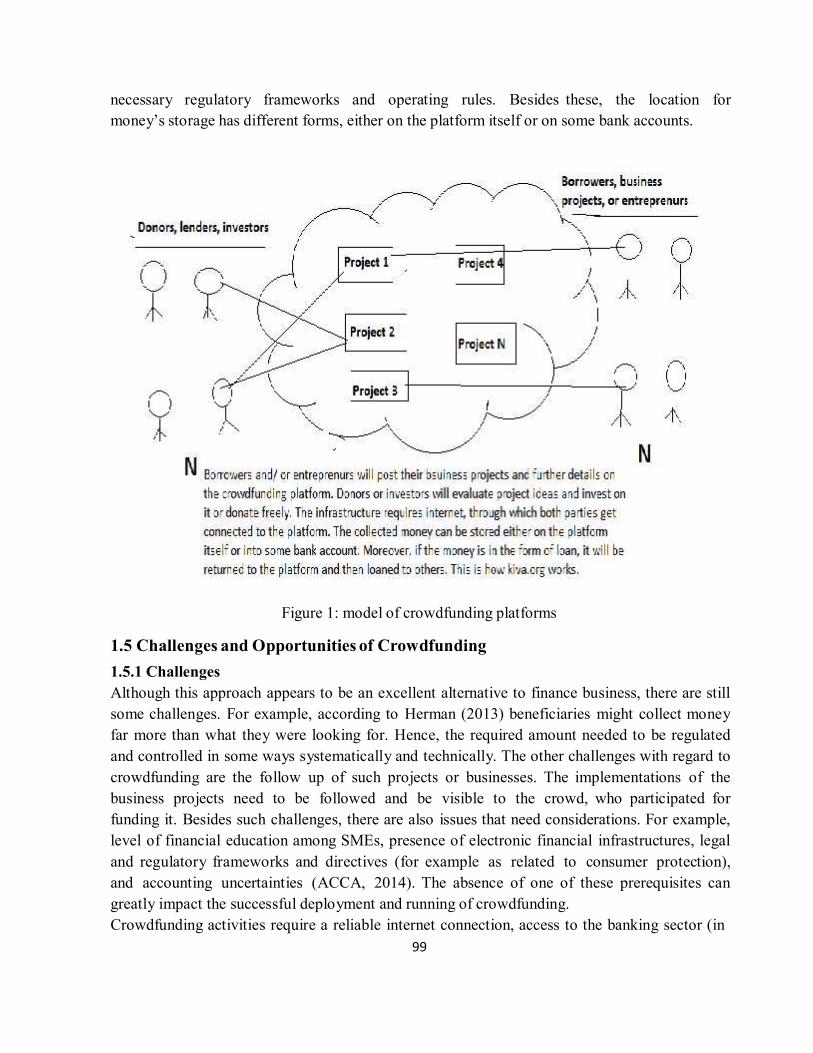
99
necessary regulatory frameworks and operating rules. Besides these, the location for money’s storage has different forms, either on the platform itself or on some bank accounts.
Figure 1: model of crowdfunding platforms 1.5 Challenges and Opportunities of Crowdfunding 1.5.1 Challenges Although this approach appears to be an excellent alternative to finance business, there are still some challenges. For example, according to Herman (2013) beneficiaries might collect money far more than what they were looking for. Hence, the required amount needed to be regulated and controlled in some ways systematically and technically. The other challenges with regard to crowdfunding are the follow up of such projects or businesses. The implementations of the business projects need to be followed and be visible to the crowd, who participated for funding it. Besides such challenges, there are also issues that need considerations. For example, level of financial education among SMEs, presence of electronic financial infrastructures, legal and regulatory frameworks and directives (for example as related to consumer protection), and accounting uncertainties (ACCA, 2014). The absence of one of these prerequisites can greatly impact the successful deployment and running of crowdfunding. Crowdfunding activities require a reliable internet connection, access to the banking sector (in
100
the form of bank accounts for entrepreneurs and investors) and/or online payment systems for the funds to be transferred (OECD, 2015). In this regard, an effic ient banking system can ease the development of crowdfunding platforms by providing the infrastructure for payments as well as information about the creditworthiness of the entrepreneurs.
1.5.2 Opportunities The approach has a number of advantages: (1) it does not affect the financial well being of lenders or donor, as it is small in its amount, (2) individuals can directly contribute to business and or projects they are interested in, (3) it can enable fund raising across geographic boundaries, (4) donors can see or follow the progress of the business etc. The infrastructure (platform) enables individuals to help each other (crowd innovation). It is a kind of extending the idea of micro finance services to individual level. It is thinking and/or leveraging ICT to enable the crowd to assist other individuals with projects and business ideas.
Moreover, many of the platforms intend to attract investors and share the ownership of the business and/or lenders who will collect their principals back. But this is not the road this paper intends to go.
Now once we are clear about the infrastructure requirements for crowdfunding it is good to look into t h e Ethiopian case. In Ethiopia, so far electronic payment is not commenced, and hence it appears that making the contribution and/or donation through credit or debit card is unthinkable. But, mobile SMS-based airtime sharing practice is well developed and already demonstrated success. In addition to this, the recent deployment of mobile money services like hellocash14 and M-birr15 are good news to give it a try to launch crowdfunding in Ethiopia. As the participation is through mobile phone based airtime sharing or mobile money, this can also be referred to as mobile fundraising (Stein, **).
2. Mobile-Based Fundraising: Challenges and Opportunities in Ethiopia Mobile phones are used across the world to raise money for social and economic problems, poverty relief, and disaster relief. Combined with other fundraising techniques, mobile fundraising is emerging as a new tool for organizations and individuals to identify potential donors and raise money (Stein, **)16. For example, breakthrough breast cancer research in UK has mobilized the research fund through mobile fundraising.
Similar to crowdfunding platforms, there are also cloud based digital fundraising platforms designed to help organizations or individuals gain new donors, increase recurring gifts and engage supporters. For example, individuals and organizations can be registered on such 14 http://www.hellocash.et 15 http://www.mossict.com 16 https://www.ndi.org/files/2247_guide_mobileactive3_english_123107.pdf

101
platforms to collect donations and support from others through platforms like GiveEasy17. In the Ethiopian context, mobile SMS based fundraising is common. For example, mobile based fundraising for GERD project-8100A, to support the construction of Kidney Dialysis center-8085 and many others. After such success were reported, Ethio Telecom is also considering the approach as one type of business model. The development of such air time sharing based contribution and payment can be considered as an alternative to electronic payments through the internet. Even though success stories are communicated through some outlets, there is no written evidences a s t o how much is raised for this purpose, what drives individuals to contribute etc..
The SMS based fundraising strategy comprises a lottery approach, awarding winners with various prizes among those sending SMS to a specified number. Two or three birr would be deducted from the account of those who send the SMS to the 8100A and the deducted amount is taken as an amount paid for the lottery. In this context, people and/or organizations in Ethiopia can use the network infrastructure of Ethio Telecom. The following table summarizes the challenges and opportunities for mobile based fundraising in the Ethiopian context.
S.No Opportunities Challenges/ issues 1 The ever increasing mobile phone
usage and mobile airtime transfer experience and practice. The new development and deployment of mobile money services
There are some basic questions that need to be addressed. Some of them are: If the money to be contributed is going to be stored on the system of third party, this brings security issues. On a ver y small scale crowdfunding (mobile fundraising) is worthwhile and useful. Beyond a certain limit it might be risky. What are the limits that make it safe and risky? Who should host or provide the services? Who will safeguard it? Possible frauds and cheatings? What are the legal and policy issues? These are outstanding issues that need further study
2 Increasing mobile air time based lottery game playing experience How to know if a project is in sourcing or pulling more than its requirements?
3 Capability and possibility to reach people at every corner of the country (diasporas and others can be fascinated by the project or idea).
How to verify and validate that the requesting individuals are really cannot finance the business themselves? What if even capable individuals are looking for funding? There are concerns that even the wealthier people can go for this alternative not to risk their own personal resources.
4 Best practices indicated that China and India have benefited significantly from Crowdfunding.
The other challenge and open question how effective and appropriate will it be for big businesses.
17 https://www.giveeasy.org
102
5 Getting fund (financial assistance) in this form will not affect the owner. The risk is distributed across many others. “Many people see it as a quick and easy way to get funding without subjecting themselves and their projects“
As any new services in the country, the issue of developing trust and credibility by participants is also requir e close consideration. As the approach is relatively new, mainly when we think its application to for-profit business, it seeks creative marketing approaches too.
6 If the money will not be paid back to the crowd, this will make beneficiaries to be free of hassles/ worries and be even more creative.
If the approach is found to be successful, it might pool many business/projects/ people. This might affect microfinance institutions, which are created to service such demands. So, as the approach of the platform overlaps with MFIs, its effects on them and way outs need more study. The last issue or concern of this approach is how to protect intellect intellectual ownership of the business idea?
Even with limitations such as these, crowdsourcing and its variants are redefining the boundaries of businesses, both in financing and access to information, making it easier for individuals and groups around the world to solve pressing social issues and support aspiring entrepreneurs.
3. Motivations to participate on crowdfunding platforms: Theoretical Insights As the idea of crowdfunding is relatively a new concept, the literature is not matured in this respect. There are some research works that tried to identify the motivating factors (what motivate individuals to participate on crowdfunding or mobile fundraising platforms?). Harms (2007) and Zhang (2012) identified the motivating factors to be: getting reward from the project (return on investment), opportunit y to support an attractive idea, altruistic intention to finance a business, the opportunity to help others realize their dreams, and reciprocity.
Specific to crowdfunding towards supporting for-profit business start-ups and/or organizations, the works of Allison et al. ( 2015) and Bretschneider ( 2014) is a good contribution to the literature. Based on cognitive evaluation theory Bretschneider (2014) identified factors that motivate individuals to participate in crowdfunding platforms: fun behind such investment, curiosity about crowdfunding platforms, altruism, reciprocit y, direct and indirect identification of oneself, recognition, the return from the business, novelty of the business idea, and characteristics of the team that run the project/ business.
There are some other scholars who identified other motivating factors. For example, the works of Martens et al. (2007) and Allison (2015) indicated that the description of the business (start- up), background of the owner (team), the amount of finance needed, the nature of the business are the central factors that motivate individuals for crowdfunding. This
103
implies the content and the language used in the project/business narration need to be designed in such a way that motivates supporters by affecting their intrinsic and extrinsic motivators.
As stated in the introduction section, one of the objectives of this paper is to explore if Ethiopians can contribute through crowdfunding platforms (mobile crowd fundraising) towards financing for-profit businesses. This is the missing point in the literature and yet important to study it. Research regarding what could motivate individuals towards supporting for-profit businesses or start-ups without expecting a financial reward or return has not got enough attention by the research communit y. Thus, focus is given to motivators of individuals and thus donations from firms of any kind will not be considered in this exploration. Many of crowdfunding studies have used cognitive evaluation theory as a lens and this study is not an exception. It appears to fit the purpose of this paper and used to derive the research direction and possible questions and/or measures to use in preparing the project narration and questions that guide data collection.
3.1 Cognitive Evaluation Theory This theory is already used and recommended for similar studies by Allison (2015) and Bretschneider et al. (2014). According to this theory (Deci and Ryan, 1985) individuals can be motivated internally (intrinsic motivators) and or externally by extrinsic motivators. When individuals are motivated internally, it means that they liked and are satisfied with the idea, they find it interesting, enjoyable, and fulfilling. On the other hand, when their motivation is extrinsic, it means that they are motivated by the consequences the idea might bring to them. Such motivating factors might include verbal praises and/or rewards or other incentives.
Moreover, according to Moss, 201218, intrinsic motivation can be affected by how much the projects or tasks are challenging (humorous) and controversial. He stated that:
Individuals are intrinsically motivated towards tasks that seem interesting and challenging. Novelty, incongruity, surprise, and humor tasks appear to be interesting. Humor comprises many features that foster interest, such as novelty and incongruity, which tend to increase arousal and generate involvement in the task. Humor increases positive emotions, and these positive emotions can also increase motivation to participate. Furthermore, controversial topics are perceived as more interesting--and thus intrinsically motivating--than uncontroversial topics. In general, individuals are more inclined to allude to topics that are moderately controversial--controversial enough to foster interest without provoking undue discomfort.
The following intrinsic and extrinsic motivating languages are taken from Allison (2015) and
18 http://www.psych-it.com.au/Psychlopedia/article.asp?id=439
104
adapted for this study, with minor modifications. Intrinsic Motivating Language The goal is to explain how persuasive language in business project description and may influence potential participants on crowdfunding platforms. This depends on the extent to which a narrative concentrate on people and their activities. Below is an example of a narrative with high levels of intrinsic and extrinsic cues. The description focuses on the people the loan will help. It provides a clear picture of the borrower, Juana, and discusses those individuals around her that are likely to benefit:
“Juana, age 48, is a good, kind, and very enterprising woman. She is a woman who is not afraid of the difficulties encountered along the way to her destiny. She was able to raise her only daughter by herself. She gave her daughter an education. She separated from her live-in partner, and from that time on she has been in charge of her household. She lives with her only daughter and her grandson in her own house. Every day they share the desire and enthusiasm of getting ahead and having a better quality of life”.
Extrinsic Motivating Language To measure the extrinsic language cue, the narration is framed in such a way that it reflects the possible profits, gains, revenues and returns from the business. This enables to assess the extent to which crowdfunding participants can be motivated to for profit start ups. Below is an example of funding appeal with high levels of extrinsic cues:
“Mubinakhon is the honest and loving mother of three children. She is married and her husband is a businessman. For more than five years, she has worked drying fruit, and she has sufficient experience to develop this business. With profits she has received, she has provided for her family. Part of the profits she used to buy a radio and furniture for her home. Mubinakhon would like to receive a loan of $1200 to process dried fruits to sell them at a profitable price and make more money. She wants to thank all the lenders for their support and encouragement”.
So the take away from this theory and its two components is that individuals that participate in equity based crowdfunding are motivated by the prospect of the return on investment, while those who participate in charity based crowdfunding are motivated by the psychological gains. Thus, in order to motivate individuals one needs to understand and change the cognition of an individuals (his/her beliefs, expectations, desires, thought, and memories or past experiences). It is also stated that it is important to pay attention to how these two elements are related to each other. For example, powerful extrinsic awards can reduce intrinsic motivations.
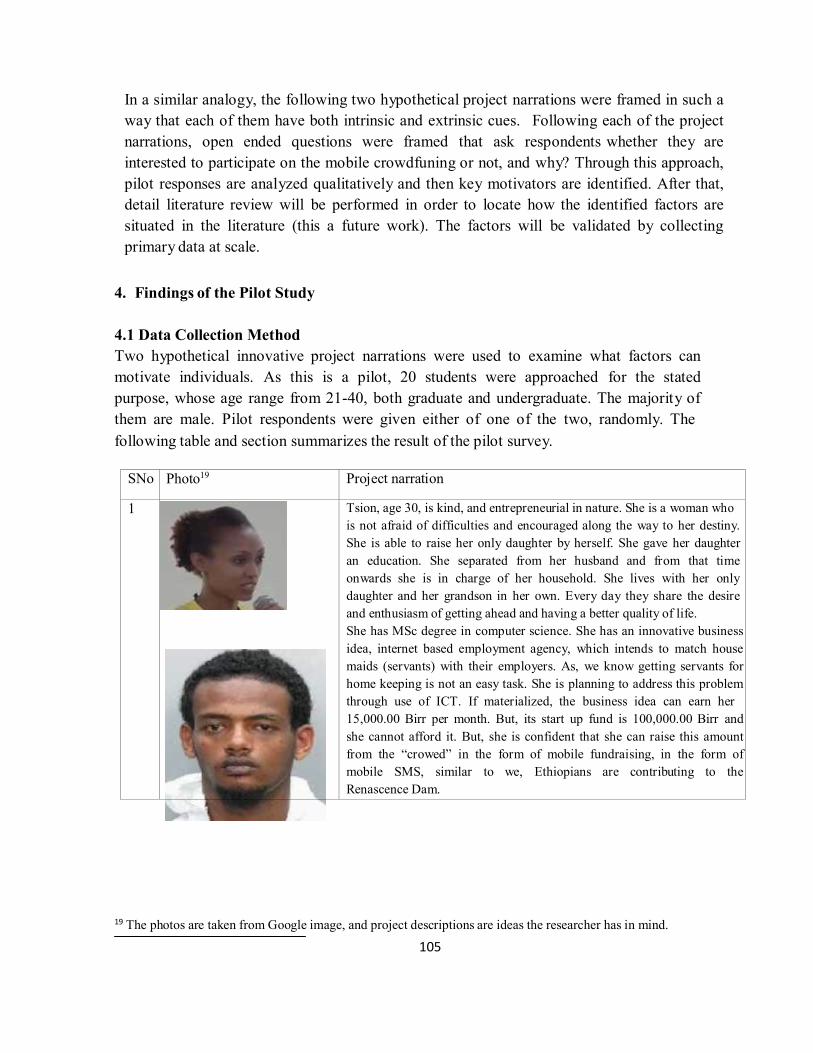
105
In a similar analogy, the following two hypothetical project narrations were framed in such a way that each of them have both intrinsic and extrinsic cues. Following each of the project narrations, open ended questions were framed that ask respondents whether they are interested to participate on the mobile crowdfuning or not, and why? Through this approach, pilot responses are analyzed qualitatively and then key motivators are identified. After that, detail literature review will be performed in order to locate how the identified factors are situated in the literature (this a future work). The factors will be validated by collecting primary data at scale.
4. Findings of the Pilot Study 4.1 Data Collection Method Two hypothetical innovative project narrations were used to examine what factors can motivate individuals. As this is a pilot, 20 students were approached for the stated purpose, whose age range from 21-40, both graduate and undergraduate. The majority of them are male. Pilot respondents were given either of one of the two, randomly. The following table and section summarizes the result of the pilot survey.
SNo Photo19 Project narration 1
Tsion, age 30, is kind, and entrepreneurial in nature. She is a woman who is not afraid of difficulties and encouraged along the way to her destiny. She is able to raise her only daughter by herself. She gave her daughter an education. She separated from her husband and from that time onwards she is in charge of her household. She lives with her only daughter and her grandson in her own. Every day they share the desire and enthusiasm of getting ahead and having a better quality of life. She has MSc degree in computer science. She has an innovative business idea, internet based employment agency, which intends to match house maids (servants) with their employers. As, we know getting servants for home keeping is not an easy task. She is planning to address this problem through use of ICT. If materialized, the business idea can earn her 15,000.00 Birr per month. But, its start up fund is 100,000.00 Birr and she cannot afford it. But, she is confident that she can raise this amount from the “crowed” in the form of mobile fundraising, in the form of mobile SMS, similar to we, Ethiopians are contributing to the Renascence Dam.
19 The photos are taken from Google image, and project descriptions are ideas the researcher has in mind.
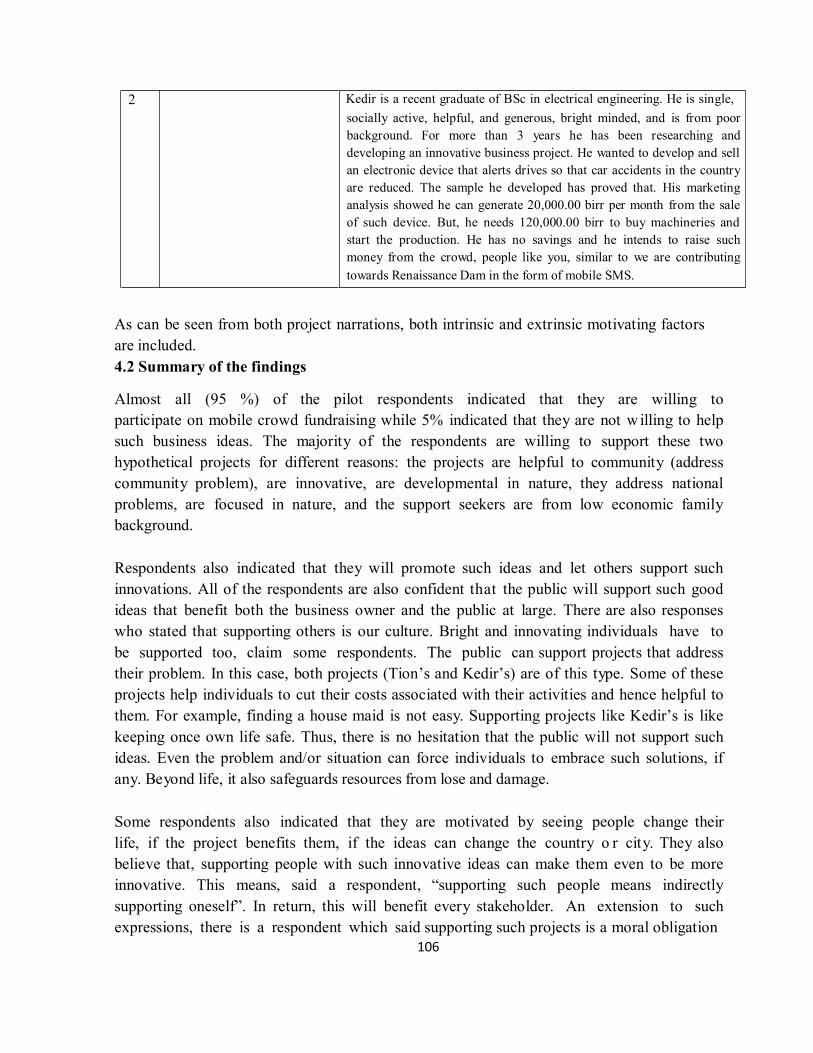
106
2 Kedir is a recent graduate of BSc in electrical engineering. He is single, socially active, helpful, and generous, bright minded, and is from poor background. For more than 3 years he has been researching and developing an innovative business project. He wanted to develop and sell an electronic device that alerts drives so that car accidents in the country are reduced. The sample he developed has proved that. His marketing analysis showed he can generate 20,000.00 birr per month from the sale of such device. But, he needs 120,000.00 birr to buy machineries and start the production. He has no savings and he intends to raise such money from the crowd, people like you, similar to we are contributing towards Renaissance Dam in the form of mobile SMS.
As can be seen from both project narrations, both intrinsic and extrinsic motivating factors are included. 4.2 Summary of the findings
Almost all (95 %) of the pilot respondents indicated that they are willing to participate on mobile crowd fundraising while 5% indicated that they are not w illing to help such business ideas. The majority of the respondents are willing to support these two hypothetical projects for different reasons: the projects are helpful to community (address community problem), are innovative, are developmental in nature, they address national problems, are focused in nature, and the support seekers are from low economic family background.
Respondents also indicated that they will promote such ideas and let others support such innovations. All of the respondents are also confident that the public will support such good ideas that benefit both the business owner and the public at large. There are also responses who stated that supporting others is our culture. Bright and innovating individuals have to be supported too, claim some respondents. The public can support projects that address their problem. In this case, both projects (Tion’s and Kedir’s) are of this type. Some of these projects help individuals to cut their costs associated with their activities and hence helpful to them. For example, finding a house maid is not easy. Supporting projects like Kedir’s is like keeping once own life safe. Thus, there is no hesitation that the public will not support such ideas. Even the problem and/or situation can force individuals to embrace such solutions, if any. Beyond life, it also safeguards resources from lose and damage.
Some respondents also indicated that they are motivated by seeing people change their life, if the project benefits them, if the ideas can change the country o r cit y. They also believe that, supporting people with such innovative ideas can make them even to be more innovative. This means, said a respondent, “supporting such people means indirectly supporting oneself”. In return, this will benefit every stakeholder. An extension to such expressions, there is a respondent which said supporting such projects is a moral obligation

107
of the public. The size of the project also matters. Relatively, large projects need to be supported. Even though owners get financial benefits from the project, the lion’s share benefit goes to the society and the government as well. So, there is no need to worry and question about the public’s attitude towards fundraising. There are also respondents who are fascinated by the above business ideas and then willing to help even in none financial things as well.
When asked about the information they want to know in detail, almost half of the respondents indicated they wanted to know more about the projects and owner’s background. They are also interested to get updates (as a follow up) about the progress of the projects.
The main concerns some respondents indicated is the trustworthiness and how such contribution can be managed and controlled effectively. Lack of such mechanisms can greatly impact th e success of such approach. As the individuals who are making the contribution do not know when the required amount is collected or not, they have concerns on this. In such cases, the money needs to be returned to owners. Some other individuals also questioned if the approach can enable individuals to give their motivational advices, praises, and some other insights. There are also respondents who indicated that their concern on the feasibility (capabilit y of the business owner) and operationalization of the projects, trustworthiness of the projects (fund seekers), and “what if this is fake”, issues related to existing infrastructures like internet.
An exception to the majority of the above responses, the researcher is surprised by two of the pilot respondents. They indicated that they are not willing to support such ideas and are not willing to promote to the public. Both of them have a stand that “if one has such innovative idea, she/he can approach organizations and work in share or partnership”. If this is not the case, one has to cover everything and do it by his/her resources.
5. Conclusion As discussed in the paper, it appears that exploring crowd based financing business projects has demonstrated its success in the world. As Ethiopia is known for its culture of supporting one another, it is good to explore the use of such approach in the Ethiopian context. The pilot survey also demonstrated this. This indicates Ethiopia is not special to be left behind in such matters. Financing business, whatever the form is, can boost the economy of the country. Some of the concerns and needs the pilot respondents indicated have a direct implication on the design of crowed fund raising platforms. 6. Future Work Once this pilot study is made, the study will be scaled up including respondents of different backgrounds. The responses of the respondents will also be discussed in line with the theory used. This will enrich the theory. Moreover, as there is a design issue both in the literature and from the pilot respondents, this issue will take an IT research and the researcher will pursue this line of work.
108
Rferences Aaker, J. L., & Akutsu, S. (2009). Why do people give? The role of identity in giving.
Journal of Consumer Psychology, 19(3), 267-270. ACCA 2014. Innovations in access to finance for SMEs.
http://www.accaglobal.com/content/dam/acca/global/PDF-technical/small-business/pol- afb- iiatf.pdf Allison, T. H., Davis, B. C., Short, J. C., & Webb, J. W. (2015). Crowdfunding in a prosocial micro lending
environment: Examining the role of intrinsic versus extrinsic cues. Entrepreneurship Theory and Practice, 39(1), 53-73.
Baeck Peter, Collins Liam, and Zhang Bryan 2014. Understanding Alternative Finance. The UK Alternative Finance Industry report. Cambridge University
Bretschneider, U., Knaub, K., & Wieck, E. (2014). Motivations for Crowdfunding: What Drives the Crowd to Invest in Start-Ups? Twenty Second European Conference on Information Systems, Tel Aviv 2014 Cuesta Carmen, Santiago Fernández de Lis, Irene Roibas, Ana Rubio, Macarena Ruesta, David Tuesta, Pablo Urbiola 2015. Digital Economy and Financial Systems. Crowdfunding in 360º: alternative financing for the digital era, BBVA research. (https://www.bbvaresearch.com/wp-content/uploads/2015/02/Crowdfunding_Watch.pdf)
Deci, E. L., & Ryan, R. M. (1985). Cognitive evaluation theory. In Intrinsic motivation and self- determination in human behavior (pp. 43-85). Springer US.
Deci, E. L., Koestner, R., & Ryan, R. M. (1999). A meta-analytic review of experiments examining the effects of extrinsic rewards on intrinsic motivation. Psychological Bulletin, 125, 627-668.
Deci, E.L. & Ryan, R.M. (1985). Intrinsic motivation and self-determination in human behavior. New York: Plenum.
Florin, J., Lubatkin, M., & Schulze, W. (2003). A social capital model of high-growth ventures. Academy of Management Journal, 46(3),374–384
Griffin, Z. J. (2012). "Crowdfunding: Fleecing the American Masses." Case Western Reserve Journal of Law, Technology & the Internet, Forthcoming.
Helmer J. (2011). A snapshot on crowdfunding, Working papers firms and regions, No. R2/2011, Fraunhofer Institute for Systems and Innovation Research ISI, Karlsruhe.
Herman Dan 2013. Crowdfunding Catalyzing growth, investment and access to capital. The Centre for Digital Entrepreneurship and Economic Performance (DEEP Centre). http://deepcentre.com/wordpress/wp-content/uploads/2013/10/DEEP-Centre-August-2013 Crowdfunding-Catalyzing-growth-investment-and-access-to-capital.pdf
Howe, J. (2008). Crowdsourcing: How the power of the crowd is driving the future of business. Random House. http://asialeds.org/sites/default/files/Alternative_financing_options_for_small_business_Cro wdfunding_Xiaochen_Zhang.pdf info Dev, 2013. Crowdfunding’s Potential for the Developing World. Finance and Private Sector Development Department. Washington, DC: World Bank.
Martens, M.L., Jennings, J.E., & Jennings, D.P. (2007). Do the stories they tell get them the money they need? The role of entrepreneurial narratives in resource acquisition. Academy of Management Journal, 50(5), 1107–1132
OECD (2014c), New approaches to SME and entrepreneurship finance: the case of crowdfunding, OECD, Paris, CFE/SME (2013)/7/REV2/ANN1
OECD (2015). New Approaches to SME and Entrepreneurship Financing: Broadening the Range of Instruments. http://www.oecd.org/cfe/smes/New-Approaches-SME-full- report.pdf
Satchell, C., & Graham, C. (2010). Conveying identity with mobile content. Personal and Ubiquitous Computing, 14(3), 251-259.
Zhang Xiaochen 2014. Alternative financing options for SMEs in climate business Exploring options and opportunities from Crowdfunding, World Bank. Accessing Finance for Green Growth and LEDS: An Asia LEDS Partnership Workshop.

109
Appendix: Screen shots of some of the crowdfunding platforms20
20 https://www.indiegogo.com/explore/small_business#/browse/popular_all
110
Entrepreneurial Orientation Factors Affecting Performance of MSEs in Ethiopia: Leadership style as a Missing Link
Abera Demsis1 Abstract The purpose of this study was to investigate the mediating effect of leadership styles on the relationship between entrepreneurial orientation (EO) and performance of MSEs in Ethiopia. Even though EO is considered as an essential prerequisite to performance, the empirical evidence of the direct effects of EO on business performance is mixed. One of the reasons for this mixed evidence is the existence of mediators, which influence EO–performance relationships. This study examines how leadership styles mediate the association between EO and performance of the SMEs leather footwear sector in Ethiopia. Quantitative cross-sectional survey was carried out to answer the research questions and test the hypothesized model. The unit of analysis of the study was MSEs. A sample size of 250 MSEs’ owner managers was used in the survey. With a response rate of 61.20%, 153 questionnaires were collected, of which 143 were used for data analysis. The Partial Least Square of Structural Equation Model (PLS-SEM) using Smart PLS software was used to analyze data with the PLS algorithm, bootstrapping and predictive relevance (Q2) to assess the predictive accuracy on performance. Results from the PLS-SEM analyses revealed that EO has a direct impact on business performance. Also, leadership style was found to have a direct impact on performance and was a partial mediator between EO and performance. From the two types of leadership styles investigated, transformational leadership has been found to have a stronger impact on business performance than transactional leadership style. These findings suggest that, besides developing EO, leaders need to focus on practicing their firm’s transformational leadership style. EO exerts a strong effect on both transformational and transactional leadership styles. However, it is only transformational leadership style which has a significant partial mediating effect on business performance. This study acknowledges EO and transformational leadership style as important resources and capabilities in an organization because the integration of these two elements can offer success for SMEs. Key implications of this study are: i. EO is an important strategic orientation for Ethiopian SMEs of the leather footwear sector. ii. Of the two types of leadership styles, transformational leadership style proved to be a more efficient
form of leadership style than transactional leadership. Thus, leaders of SMEs need to display, practice and nurture the qualities of transformational leadership style in order to achieve good performance. iii. FeMSEDA, which is the governing body that oversees MSEs’ entrepreneurial development in Ethiopia, should provide more leadership training and development programs for entrepreneurs. The training should focus on developing and nurturing the transformational leadership qualities of
entrepreneurs. Furthermore, Continuing support and assistance from the government and NGOs would undoubtedly help these enterprises to fully develop their entrepreneurial orientation. Keywords: Leadership Styles, Transformational Leadership style, Transactional
Leadershipstyle, Entrepreneurial Orientation, Business Performance, SEM-PLS, Mediation analysis, MSEs.
1 BA, MBA, PhD candidate of Business Leadership, E-mail: [email protected]

111
1. Introduction 1.1 Background of the Study In the fast changing and highly competitive global market environment, micro, small and medium enterprises (MSMEs) are found to exert a strong influence on the economy of many countries (Ghobadian and Gallear, 1996; Roslan, 2010). The vast majority of countries – developed and developing alike – rely on the dynamism, resourcefulness and risk-taking behavior of private enterprises to trigger and sustain economic growth. Micro, Amall and Medium enterprises (MSMEs) play a role in enhancing a country's economic growth (Venesaar and Loomets, 2006; Jeswal, 2012). Many nations, particularly developing countries, have recognized the value of MSMEs. While the contributions of MSMEs to development are generally acknowledged, entrepreneurs in this sector face many obstacles that limit their long-term survival and development (Yusuf, Olagbemi and Atere, 2011). Due to the unique constraints and limitations faced by SMEs, such as having a limited number of employees, insufficient financial resources, lack of educational background and experience, and lack of managerial expertise, among other limiting factors (Saleh and Ndubisi, 2006; Abu Bakar, Mad and Abdul Latif, 2006). Because of the sector’s role in economic growth and poverty reduction, a considerable number of researchers have continuously made an effort to understand how the performance of SMEs could be developed and further enhanced (Aregawi and Tilaye, 2014). In Ethiopia, while the relevant picture remains to be seen, micro and small enterprises (MSEs) have played a critical role in the economic development of the country. MSEs comprise the largest share of enterprises and employment in the non-agricultural sector in Ethiopia. Therefore, MSEs have received special attention from the government. The promotion and development of MSEs is emphasized as one of the most effective means for achieving rapid development and creating job opportunities. In this regard, the Government of Ethiopia (GoE) drafted its first Micro and Small Enterprise Development Strategy in 1997. This strategy was re-emphasized in the Plan for Accelerated and Sustainable Development to End Poverty (PASDEP) 2005/6- 2009/10 (MoFED, 2006). Moreover, a draft of a new MSE policy was developed by the Ministry of Trade and Industry (MoTI) for 2007-08 with a support from the International Labour Organization. The MSE sector is also identified as one of the pillars of the strategic focus for the industrial development of Ethiopia as stipulated in the Growth and Transformation Plan of the country (MoFED, 2010). A significant amount of strategy research has centered on the importance of top management leadership (Hambrick and Mason, 1984) and entrepreneurial behavior (Covin and Slevin, 1989; Lumpkin and Dess, 1996) in determining firm performance. However, there has been a paucity of research examining how specifically the entrepreneurial orientation of the top manager might enhance the performance of firms competing in today’s more dynamic and competitive economic environment (Bettis and Hitt, 1995). With regard to the entrepreneurial orientation of firms, some studies have found out that firms that have a stronger entrepreneurial orientation perform better (Lee and Lim, 2009; Wiklund and Shepherd, 2005; Covin and Slevin, 1989; Dess and Beard, 1984; Wiklund, 1999; Keh Keh, Nguyen, and Ng, 2007; Wang, 2008; Yucel, 2011); Others (Covin, Slevin, and Schultz, 1994; Slater and Narver, 2000; Lee, Lee and Pennings, 2001; Wiklund and Shepherd, 2005) have failed to replicate this positive relationship. Covin et al. (1994) revealed no significant relationship between strategic posture of entrepreneurial orientation
112
and firm performance. Similarly, Slater and Narver (2000) were unable to provide any evidence of a positive relationship between entrepreneurial orientation and profitability. Moreover, Lee et al. (2001) found out in their study that entrepreneurial orientation may not significantly increase firm performance. Nonetheless, an important message from past research is that simply examining the direct effect of entrepreneurial orientation on firm performance provides an incomplete picture, especially in the case of small businesses (Lumpkin and Dess, 1996; Wiklund and Shepherd, 2005; Wang, 2008; Rauch Wiklund, Lumpkin and Frese, 2009). This necessitates future research to consider internal and external factors in the examination of the entrepreneurial orientation-performance relationship (Covin, Green and Slevin, 2006; Lumpkin and Dess, 2001; Wiklund, 1999; Wiklund and Shepherd, 2003). Researches indicate that performance can be improved when key variables are correctly aligned (Naman and Slevin, 1993). This is the basic premise of the contingency theory, which holds that the relationship between two variables depends on the level of a third variable. Introducing mediators into bivariate relationships helps to reduce the potential for misleading inferences being drawn and permits a more precise and specific understanding of contingency relationships (Rosenberg, 1968). This raises the question of whether entrepreneurial orientation is always an appropriate strategic orientation or if its relationship with performance is more complex. Consequently, Lumpkin and Dess (1996) have proposed that studies on the relationship between entrepreneurial orientation and business performance of MSEs should be conducted. Furthermore, while the effect of entrepreneurial orientation on firm performance is a topic of global research interest and some researchers have found out that entrepreneurial orientation has a positive impact on firm performance, research related to MSEs’ entrepreneurial orientation and leadership styles in Ethiopia is absent. The aim of this study is, therefore, to address the gap by examining whether leadership style is a mediator (missing link) in the relationship between entrepreneurial orientation and performance of MSEs in Ethiopia. 1.2 Statement of the Problem Even though SMEs are recognised as an important agent of growth in many countries (Panitchpakdi, 2006; Leutkenhorst, 2004; Hilmi Ramayah, Mustapha and Pawanchik, 2010), their contribution to the Ethiopian economy is still low compared with the contributions of SMEs in industrialized countries as well as other developing countries (Nega and Hussein, 2014). SMEs’ contribution to the GDP in Japan and Germany is about 53%, in the UK about 51% and in Korea approximately 49%. Moreover, Singapore and Thailand recorded higher SME contributions to GDP at 49% and 38% respectively (Arham and Muenjohn, 2012). These types of enterprises, however, constitute less than 30% of employment and 17% of GDP in developing countries (MUDC, 2013). Indeed, a study conducted in Africa by the ILO found out that only 20% of the total populations of working age group in many African countries were reported to have been working in the small enterprise sector (ILO, 2003a). SMEs play an important role in Ethiopian economy, typically contributing over 99% of all enterprises, over 60% of private sector employment, and about 30% of exports (Demeke, Guta and Ferede, 2006). However, this sector only contributed about 3.4% to the Ethiopian GDP in 1992/1993 as cited in Nega and Hussein (2014). This indicates a significant opportunity to develop and refine SMEs’ performance to become a channel of growth for the country’s economy
113
and serve as a means of bringing economic transition by using the skill and the talent of people without requiring high-level training, much capital and sophisticated technology. This makes the sector more preferable to business entry, unemployment reduction, income generation, and poverty alleviation (Habtamu, Aregawi and Nigus, 2013)Finding the right balance between the leadership styles (LSPS) of entrepreneurs and entrepreneurial orientation (EO) could contribute to improving SMEs’ business performance (BP). There is a limited understanding of leadership and entrepreneurial orientation in the context of SMEs’ performance in Ethiopia (Dawit, 2007; Eshetu and Zeleke, 2008). The investigation of the effect of leadership style on the relationship between entrepreneurial orientation and business performance hopes to close this gap in the literature on SMEs of the leather footwear sector in Ethiopia. Thus, the examination of leadership styles as a mediator construct in the EO-BP relationship could add new understanding of the direct and indirect relationships between entrepreneurial orientation and business performance in the context of SMEs in Ethiopia. 1.3 Research Questions The study set out with the assumption that different leadership styles (transformational and/or transactional) mediate the relationship between entrepreneurial orientation and business performance. It is also assumed that MSEs with higher levels of entrepreneurial orientation have higher business performance. Hence, this study investigates the mediating effect of the top-level managers’ leadership styles on the relationship between entrepreneurial orientation and business performance of MSEs in the leather footwear sector in Ethiopia. Seven research questions, as listed below, were formulated to serve the purpose of the study on MSEs leather footwear sector in Ethiopia. 1. What is the state of entrepreneurial orientation among the MSE owners/managers of the
leather footwear sector in Ethiopia? 2. What leadership styles do MSE owners/managers of the leather footwear sector in Ethiopia
possess? 3. To what extent does EO influence business performance of MSEs owner/managers of the leather footwear sector in Ethiopia? 4. What is the relationship between top-level managers’ EO and leadership styles of MSEs’ owners/managers of the leather footwear sector in Ethiopia? 5. To what extent do top-level managers’ leadership styles influence business performance of MSEs in the leather footwear sector in Ethiopia? 6. Which leadership styles (transformational or transactional) influence more the business performance of the MSEs leather footwear sector in Ethiopia? 7. Do top-level managers’ leadership styles mediate the relationship between the entrepreneurial orientation and business performance of MSEs in the leather footwear sector in Ethiopia?
114
1.4 Objectives of the Study The main objective of this study is to determine the effect of leadership styles on the relationship between entrepreneurial orientation and business performance of micro and small enterprises (MSEs) in Ethiopia. The study is specifically designed to: 1. identify the entrepreneurial orientations (innovativeness, risk-taking and proactiveness) and
leadership styles (transformational and transactional) of MSE owner/managers of the leather footwear sector in Ethiopia,
2. determine the relationship between entrepreneurial orientations and business performance (growth and financial), and 3. find out to what extent EO influences business performance of the MSEs in the leather footwear sector in Ethiopia; 4. analyze the relationship between entrepreneurial orientation and leadership styles of MSEs’ owners/managers of the leather footwear sector in Ethiopia; 5. analyze the relationship between leadership styles and business performance of MSEs’ owners/managers of the footwear-leather sector in Ethiopia; 6. identify which leadership style (transformational or transactional) have more influence on the business performance of MSEs leather footwear sector in Ethiopia; 7. determine whether leadership styles mediate the relationship between entrepreneurial orientation and business performance of MSEs in the leather footwear sector in Ethiopia. 1.5 The Hypotheses of the Study In this study, the structural model has three exogenous (independent) constructs namely,
entrepreneurial orientation (X), transformational leadership styles (M1) and transactional leadership styles (M2) and one endogenous (dependent) construct: business performance (Y). The relationships proposed are explained by a review of the hypotheses as follows: H1: Entrepreneurial Orientation is significantly and positively related to Business Performance. H2: Entrepreneurial Orientation is significantly and positively related to Transformational leadership style. H3: Entrepreneurial Orientation is significantly and positively related to Transactional leadership style. H4: Transformational leadership style is significantly and positively related to Business Performance. H5: Transactional leadership style is significantly and positively related to Business Performance. H6: Transformational leadership style has a greater impact on business performance than Transactional leadership style does.
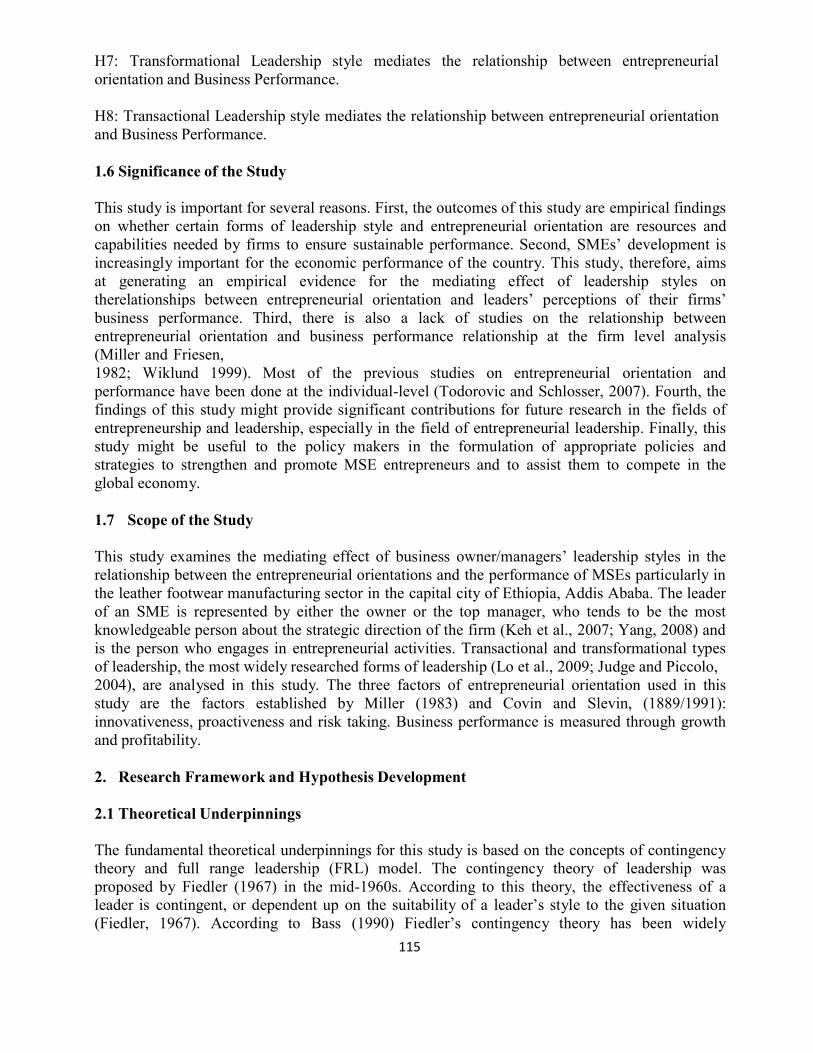
115
H7: Transformational Leadership style mediates the relationship between entrepreneurial orientation and Business Performance. H8: Transactional Leadership style mediates the relationship between entrepreneurial orientation and Business Performance. 1.6 Significance of the Study This study is important for several reasons. First, the outcomes of this study are empirical findings on whether certain forms of leadership style and entrepreneurial orientation are resources and capabilities needed by firms to ensure sustainable performance. Second, SMEs’ development is increasingly important for the economic performance of the country. This study, therefore, aims at generating an empirical evidence for the mediating effect of leadership styles on therelationships between entrepreneurial orientation and leaders’ perceptions of their firms’ business performance. Third, there is also a lack of studies on the relationship between entrepreneurial orientation and business performance relationship at the firm level analysis (Miller and Friesen, 1982; Wiklund 1999). Most of the previous studies on entrepreneurial orientation and performance have been done at the individual-level (Todorovic and Schlosser, 2007). Fourth, the findings of this study might provide significant contributions for future research in the fields of entrepreneurship and leadership, especially in the field of entrepreneurial leadership. Finally, this study might be useful to the policy makers in the formulation of appropriate policies and strategies to strengthen and promote MSE entrepreneurs and to assist them to compete in the global economy. 1.7 Scope of the Study This study examines the mediating effect of business owner/managers’ leadership styles in the relationship between the entrepreneurial orientations and the performance of MSEs particularly in the leather footwear manufacturing sector in the capital city of Ethiopia, Addis Ababa. The leader of an SME is represented by either the owner or the top manager, who tends to be the most knowledgeable person about the strategic direction of the firm (Keh et al., 2007; Yang, 2008) and is the person who engages in entrepreneurial activities. Transactional and transformational types of leadership, the most widely researched forms of leadership (Lo et al., 2009; Judge and Piccolo, 2004), are analysed in this study. The three factors of entrepreneurial orientation used in this study are the factors established by Miller (1983) and Covin and Slevin, (1889/1991): innovativeness, proactiveness and risk taking. Business performance is measured through growth and profitability. 2. Research Framework and Hypothesis Development 2.1 Theoretical Underpinnings The fundamental theoretical underpinnings for this study is based on the concepts of contingency theory and full range leadership (FRL) model. The contingency theory of leadership was proposed by Fiedler (1967) in the mid-1960s. According to this theory, the effectiveness of a leader is contingent, or dependent up on the suitability of a leader’s style to the given situation (Fiedler, 1967). According to Bass (1990) Fiedler’s contingency theory has been widely
116
experimented with for over 40 years. The full range leadership model, which includes factors of transformational, transactional and passive avoidant leadership styles, was proposed by Bass and Avolio in 1990. The fundamental premise of this model is that all leaders display varying amounts of each style of leadership. According to Kirkbride (2006), the FRL model is the most researched and validated leadership model throughout the world. The model suggests a framework that can be used to assess the relationship between entrepreneurial orientation, leadership styles, and their subsequent effect on performance of MSEs. The dependent variable is the business performance of MSEs as measured by the sales growth, employee growth, market growth, gross profit, rate of return on assets, rate of return on investment, and overall performance. The independent variables are entrepreneurial orientation (innovativeness, proactiveness, and risk taking) while the leadership styles (transformational and transactional) act as the intermediary (mediator) between entrepreneurial orientation and performance. 2.1.1 Transformational Leadership Theory It is about 40 years since the concepts of transformational and transactional leadership were introduced by Burns (1978). In his view, transactional leaders are concerned with followers’ low- level needs and transformational leaders boost the morale, motivation and focus of followers’ high-level needs. According to Bass (1999: 10), “The transformational leader emphasizes what you can do for your country; the transactional leader, on what your country can do for you.” Bass (1985) expanded Burns’ views of transformational and transactional leadership into the theory of transformational leadership. According to Bass (2000), a transformational leader is the kind of leader who develops followers through creating a vision that provides meaning and motivation. The ability of a transformational leader to communicate a convincing vision with enthusiasm and confidence results in creating a strong sense of identification among followers with the organisation and influences them to go beyond their self-interest. Bass established that an effective leader with transformational attributes has the ability to transport his or her organisation to greater heights and to achieve greater performance (Bass, 1990; Bass et al., 2003; Bass and Riggio, 2012). Based on what has been presented, transformational and transactional leadership are mediating variables in the research framework and are expected to be factors that mediate the relationship between entrepreneurial orientation and business performance of SMEs. The practice and display of both types of leadership style are expected to have significant mediating impacts on performance. But due to the different characteristics that are intrinsic to each form of leadership style, it is anticipated that one form might have a greater positive mediating impact than the other on the performance of firms. 2.1.2 Resource-Based View The resource-based view of the firm (RBV) has been a subject of discussion among researchers in the field of strategic management. The RBV posits that organisational success is dependent upon resources and capabilities that have certain characteristics (Galbreath, 2005). A firm’s resources and capabilities can be defined as including all assets, capabilities, organisational processes, firm attributes and knowledge controlled by the firm that allow the firm to develop and implement strategies that improve its efficiency and effectiveness (Barney, 1995). This is a bundle of available factors owned and controlled by the firm that can be used to build up
117
and implement their strategies (Amit and Schoemaker, 1993). Firms’ resources and capabilities can generate a sustainable competitive advantage when they have the following characteristics; value, rarity, inimitability and non-substitutability (Barney, 1991). Later, Barney (1995) emphasized that developing a sustained competitive advantage requires the unique resources and capabilities that a firm could bring to competition and its environment. Business owners and managers must discover these resources and capabilities by looking within their firm for resources that are valuable, rare and imperfectly imitable, and then exploit these resources. Galbreath (2005) claimed that only firms which have resources possessing these attributes are able to generate and sustain the competitive advantage which affords continuing superior performance. 2.1.3 Leadership and Entrepreneurial Orientation as Resources in the RBV One of the most basic assumptions of the RBV of the firm is that internal intangible resources are important in understanding an organisation’s competitive success. However, little is known about which of these resources are related to one another and, if so, how they are related (Wilderom and van den Berg, 2000). In this study, leadership style and the entrepreneurial orientation of leaders of SMEs can be seen as a firm’s internal intangible resources or capabilities. Capabilities contribute more significantly to the success of a firm than either intangible or tangible assets do (Galbreath, 2005). Strong proponents of the Capability-Based Theory of Competitive Advantage advocate that a firm can achieve sustainable competitive advantage through distinctive capabilities owned by the firm (Grant, 1991; Hayes et al., 1996) and these capabilities are the most important elements of a firm’s resources due to their high levels of causal ambiguity and strong barriers to imitation and substitution (Foon, 2011). Likewise, Shurchuluu (2002) mentioned that capabilities are essential for a firm to have the ability to combine cost efficiency with continuous productivity improvements to be more competitive. Generally, the Capability-Based Theory of Competitive Advantage suggests that a firm can achieve sustainable competitive advantage through the distinctive capabilities possessed by the firm (Grant, 1991; Prahalad and Hamel, 1990; Hayes et al., 1996) and these distinctive capabilities allow firms to make good use of their resources and achieve rents (Mahoney and Pandian, 1992). Capabilities, in fact, could be considered as the most important of a firm’s resources due to their high levels of causal ambiguity and strong barriers to imitation and substitution. Todorovic and Schlosser (2007) claimed that both of these variables, namely, leadership and entrepreneurial orientation, can be valuable rents under the RBV. They contended that appropriate leadership style by the entrepreneur may enable the firm to achieve outcomes beyond its expectations. In their views, an entrepreneur, the individual, is often identified with the firm itself. The entrepreneur’s vision may become the firm’s vision statement. The charismatic leadership (transformational leadership) of an entrepreneur can also be viewed as an organisational-level resource, thereby contributing to business performance (Todorovic and Schlosser, 2007). According to Lee et al. (2001), a high level of entrepreneurial orientation is something that firms cannot simply buy from the market. Firms need to invest a great amount of time to develop an entrepreneurial culture and then the entrepreneurial orientation can be a source of sustainable competitive advantage that leads to superior performance. Entrepreneurial orientation consisting of innovativeness, proactiveness and risk taking is considered an internal organisational capability (Lee et al., 2001) and it has been recognised as a key source of sustainable competitive advantage (Miles and Snow, 1978).
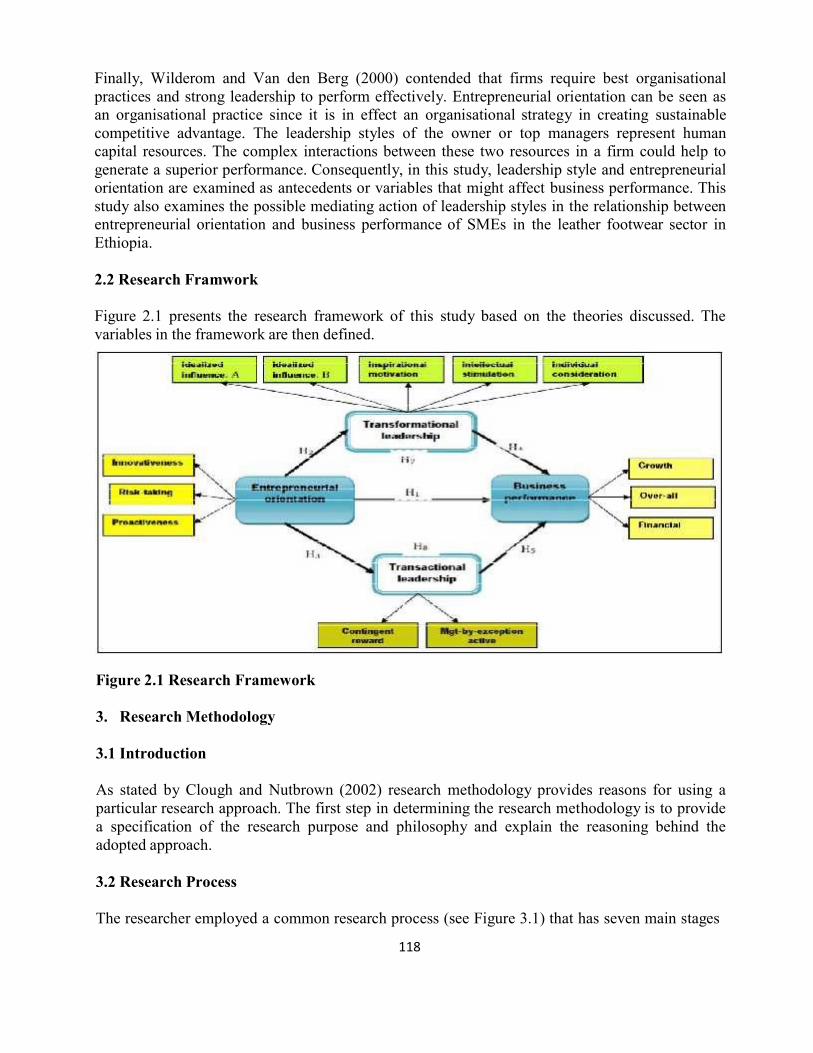
118
Finally, Wilderom and Van den Berg (2000) contended that firms require best organisational practices and strong leadership to perform effectively. Entrepreneurial orientation can be seen as an organisational practice since it is in effect an organisational strategy in creating sustainable competitive advantage. The leadership styles of the owner or top managers represent human capital resources. The complex interactions between these two resources in a firm could help to generate a superior performance. Consequently, in this study, leadership style and entrepreneurial orientation are examined as antecedents or variables that might affect business performance. This study also examines the possible mediating action of leadership styles in the relationship between entrepreneurial orientation and business performance of SMEs in the leather footwear sector in Ethiopia. 2.2 Research Framwork Figure 2.1 presents the research framework of this study based on the theories discussed. The variables in the framework are then defined.
Figure 2.1 Research Framework 3. Research Methodology 3.1 Introduction As stated by Clough and Nutbrown (2002) research methodology provides reasons for using a particular research approach. The first step in determining the research methodology is to provide a specification of the research purpose and philosophy and explain the reasoning behind the adopted approach. 3.2 Research Process The researcher employed a common research process (see Figure 3.1) that has seven main stages

119
as Frankfort-Nachmias and Nachmias (2000) describe.
120
Figure 3.1: The main stages of the research process Source: Frankfort-Nachmias and Nachmias, (2000) To begin with, the researcher conducted a literature review and developed the problem statements, research objectives, and research questions by identifying gaps and issues in the literature. Secondly, relevant theories from the literature that acted as the basis for developing the theoretical framework and hypotheses are identified for this research. Among the core theories the researcher identified for this study are: (1) entrepreneurial orientation (EO) by Covin and Slevin (1991), (2) the full range leadership model (FRLM) by Bass and Avolio (2004), and (3) the business performance (BP) by Gupta and Govindarajan (1984). At the third stage, the researcher determined a suitable research design for the study and, accordingly, a quantitative approach is adopted. Fourth, for the quantitative strategy in the measurement phase, the researcher used three different sets of questionnaires (Likert scale questions), as the research instruments, to determine the mediating effect of leadership styles (transformational and transactional) on the relationship between entrepreneurial orientation and business performance. Before the questionnaires were finalized, several experts were sought to review and validate the questionnaires’ content. At the fifth and sixth stages, the questionnaires were distributed to MSE leather footwear sector owners/managers in Ethiopia. Subsequently, the gathered quantitative data were analysed once test for outliers was conducted and an overall view of the respondents was obtained. The researcher used Structural Equation Modeling (SEM) analysis to perform a multifactor analysis. A mediation data analysis was performed to clearly specify the relationships between the variables. Finally, at the seventh stage, the researcher generalized the findings by combining all the analysis results, drew comprehensive conclusions, and made some recommendations to the parties concerned. 3.3 Research Design Quantitative and qualitative approaches are not dichotomies; instead, they represent different ends of a continuum (Newman and Benz, 1998). Data categorised as quantitative are generally gathered through structured questions in questionnaires. Qualitative data are derived from broad answers to specific questions in interviews, responses to open-ended questions in a questionnaire, through observations, or from the already available information gathered from various sources (Sekaran, 2003). Quantitative research is about testing objective theories by examining the relationship among variables (Creswell, 2009). Accordingly, these variables can be measured, typically using instruments, so that numbered data can be analysed using statistical procedures. More recently, quantitative strategy has also included elaborated structural equation modelling (SEM) that incorporate causal paths and the identification of the collective strength of multiple variables (Creswell, 2009). SEM’s popularity has grown out of the need to test complete theories and concepts (Rigdon, 1998).
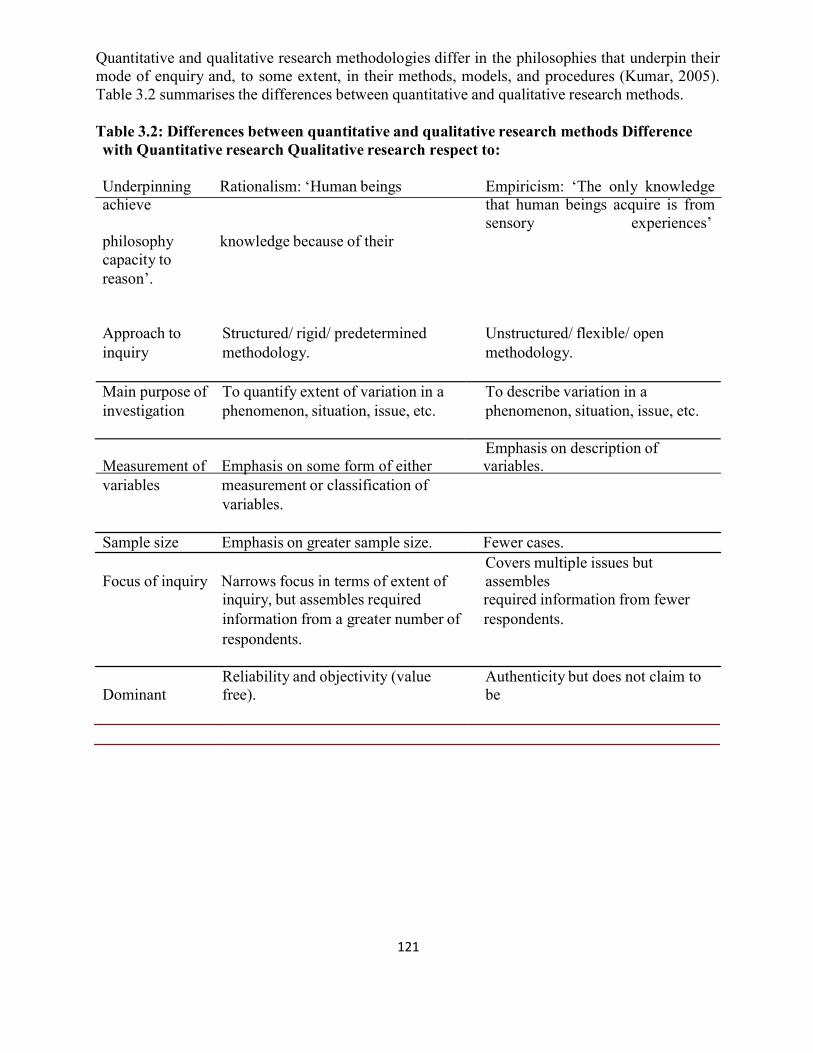
121
Quantitative and qualitative research methodologies differ in the philosophies that underpin their mode of enquiry and, to some extent, in their methods, models, and procedures (Kumar, 2005). Table 3.2 summarises the differences between quantitative and qualitative research methods. Table 3.2: Differences between quantitative and qualitative research methods Difference with Quantitative research Qualitative research respect to: Underpinning Rationalism: ‘Human beings achieve philosophy knowledge because of their capacity to reason’.
Empiricism: ‘The only knowledge that human beings acquire is from sensory experiences’
Approach to inquiry
Structured/ rigid/ predetermined methodology.
Unstructured/ flexible/ open methodology.
Main purpose of investigation
To quantify extent of variation in a phenomenon, situation, issue, etc.
To describe variation in a phenomenon, situation, issue, etc. Emphasis on description of Measurement of Emphasis on some form of either variables.
variables measurement or classification of variables.
Sample size Emphasis on greater sample size. Fewer cases. Covers multiple issues but
Focus of inquiry Narrows focus in terms of extent of assembles inquiry, but assembles required required information from fewer information from a greater number of respondents. respondents.
Dominant Reliability and objectivity (value free).
Authenticity but does not claim to be
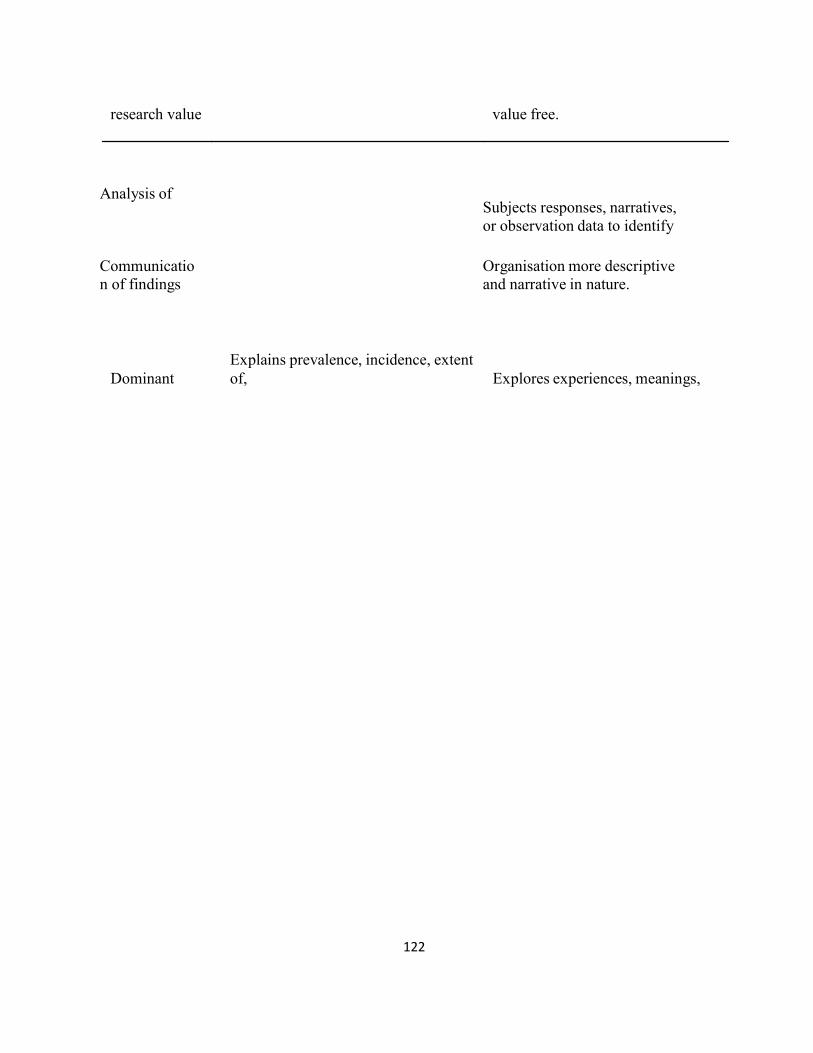
122
research value value free.
Analysis of Subjects responses, narratives, or observation data to identify
Communicatio n of findings
Organisation more descriptive and narrative in nature.
Dominant Explains prevalence, incidence, extent of, Explores experiences, meanings,

123
research topic nature of issues, opinions and attitude; perceptions, and feelings. discovers regularities and formulates
theories. Subjects variables to frequency distributions, cross-tabulations, or other statistical procedures. Organisation more analytical in nature, drawing inferences and conclusions, and testing magnitude and strength of a relationship. Source: Kumar, (2005)
In this research, the researcher uses quantitative research technique, methods, approaches, concepts and language in a single study (Tashakkori and Teddlie, 2003; Johnson and Onwuegbuzie, 2004). 3.3.1 Research Design Adopted in this Study In a context where the topic has been studied extensively, significant independent, dependant, and mediation variables are provided from the literature to clarify general mechanisms underlying the leadership styles antecedents and outcomes in the mediation process. In this regard, Edmondson and Mcmanus (2007: 1159) stated that ‘leveraging prior work allows a new study to refine the field’s knowledge, such as identifying mediators that influence a documented causal relationship’. Accordingly, the proposed methodological aspects that fit the present research can be summarised as follows (table 3.4). Table 3.4 Research Design based on Methodological Fit for Mature Theory Research elements The proposed methodology Research questions Focused mediation hypothesis that derived from existing constructs Type of data collected Quantitative data
Methods of collecting data
Survey: questionnaire was systematically coded and quantified. The data has been
obtained from the field site (MSEs leather footwear sector). Constructs and measures
Typically relying heavily on existing constructs that have been used in previous
research (e.g. MLQ, EOQ, and BPQ). Formal hypothesis testing (mediation hypotheses tested by SEM) to
Goal of data analyses investigate causal relationships between the study variables in order to explain and describe the
underpinning mechanism of the mediation relationships. Standard statistical analyses (SPSS) using multiple mediation and SEM.
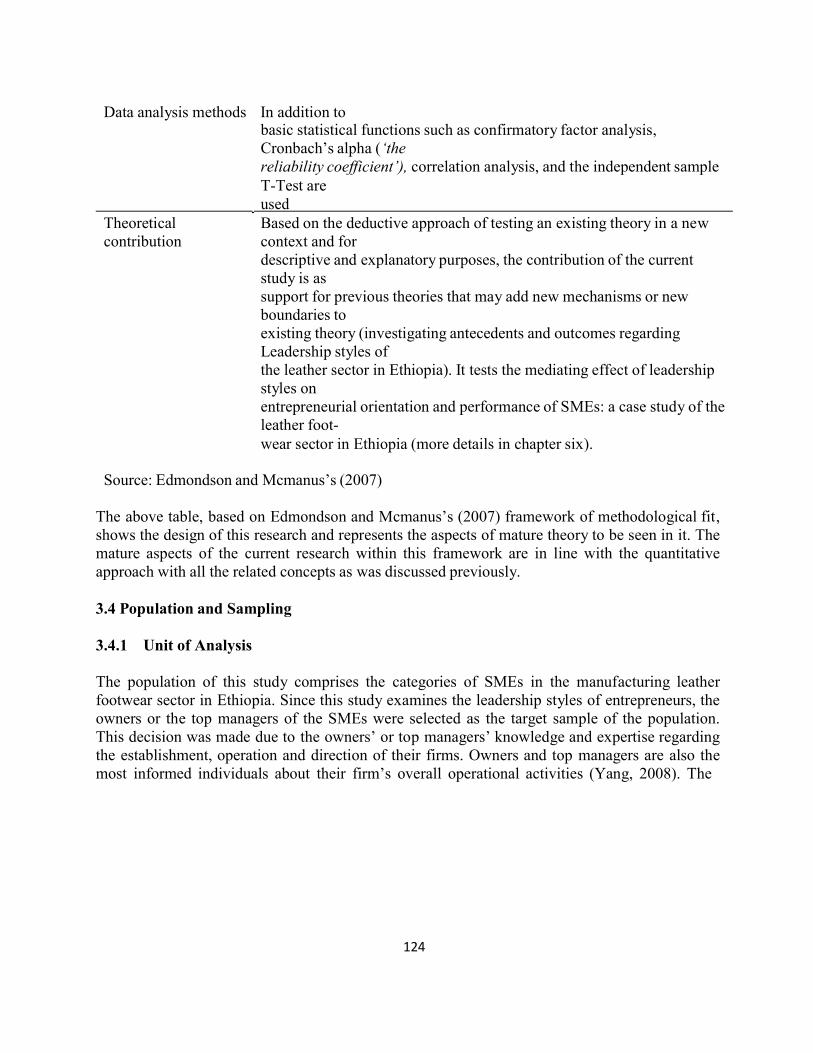
124
Data analysis methods In addition to basic statistical functions such as confirmatory factor analysis, Cronbach’s alpha (‘the reliability coefficient’), correlation analysis, and the independent sample T-Test are
used Theoretical contribution
Based on the deductive approach of testing an existing theory in a new context and for descriptive and explanatory purposes, the contribution of the current study is as support for previous theories that may add new mechanisms or new boundaries to existing theory (investigating antecedents and outcomes regarding Leadership styles of the leather sector in Ethiopia). It tests the mediating effect of leadership styles on entrepreneurial orientation and performance of SMEs: a case study of the leather foot- wear sector in Ethiopia (more details in chapter six).
Source: Edmondson and Mcmanus’s (2007) The above table, based on Edmondson and Mcmanus’s (2007) framework of methodological fit, shows the design of this research and represents the aspects of mature theory to be seen in it. The mature aspects of the current research within this framework are in line with the quantitative approach with all the related concepts as was discussed previously. 3.4 Population and Sampling 3.4.1 Unit of Analysis The population of this study comprises the categories of SMEs in the manufacturing leather footwear sector in Ethiopia. Since this study examines the leadership styles of entrepreneurs, the owners or the top managers of the SMEs were selected as the target sample of the population. This decision was made due to the owners’ or top managers’ knowledge and expertise regarding the establishment, operation and direction of their firms. Owners and top managers are also the most informed individuals about their firm’s overall operational activities (Yang, 2008). The
125
decision to rely on the single respondent approach was also based on the size of the firm and the respondent’s familiarity with the research topic and the information sought. More explicitly, the views of a single respondent when he or she is the owner or top manager are likely to represent the firms (Lyon et al., 2000). In addition, according to Isobe et al. (2004), SMEs tend to have a relatively limited number of core products and technology and, therefore, the owners or managers of SMEs are likely to have a clear understanding of their business operation, consequently enhancing the accuracy of their responses. 3.4.2 Sampling Technique and Sample Size When calculating the sample size, the most appropriate size is an important decision to be made. If too large, the sample might lead to inefficiencies and wastage of resources. Yet, too small a sample will yield information that might not be valid for making inferences about the population. Roscoe (1975) suggested that a rule of thumb for determining sample size is that a sample size of between 30 and 500 is suitable for most research. To ensure a good decision, Krejcie and Morgan2 (1970) simplified the model for the sample size needed, given the number of population for research. Based on the table they proposed, this study required a sample size of 175 to represent the entire population of 322 leather foot-wear manufacturing industries in the study area, Addis Ababa, where 70% of Ethiopia’s manufacturing industries are concentrated according to UN. (2002) report (see also Sekaran and Bougie, 2010). The use of SEM as the main analytical procedure in this study also required a careful decision with regard to the sample size. Hair et al. (1998) recommended that the sample should be at least 100 observations to obtain reliable results. Recent recommendations suggest a critical sample size of 200 to provide sufficient statistical power for data analysis and to obtain reliable results (Yuksel, Yuksel and Bilim, 2010; Hoe, 2008). Researchers have also strongly suggested avoiding a small sample size when using SEM since this might create problems and provide unstable results (Gerbing and Anderson, 1988; Fornell and Larcker, 1981). Since this study uses maximum likelihood estimation in SEM, the target of 143 samples also seemed to fit well with the requirement of sample size for PLS-SEM where 100 up 200 is appropriate. 3.5 Research Instrument In order to ensure that viable data was collected, a self-reporting instrument was developed for this research in the form of a questionnaire containing a total of 52 items in four sections: leadership styles (28 items), EO (9 items), business performance (7 items), and background of business/participant (8 items). The design of the questionnaires was based on existing instruments that had been used to collect data in previous studies. Section 1 asks for demographic information and business background of the respondents. Eight questions are in four different categories. These questions were asked to obtain information about the background of the respondents and their businesses which could be used to enhance the outcomes of this study. Section 2 measures the EO construct, which comprises the initial factors developed by Miller (1983): innovativeness, proactiveness and risk taking. The measurement of these factors was 2 ṅ = Z2NP (1− P) ÷ d2 (N −1) + X2P (1− P)

126
n = required sample size.Z =Standardized normal value, taken as 1.96 for a 95 per cent confidence interval (1.962=3.841).N = the population size.P = the population proportion (assumed to be .50 since this would provide the maximum sample size). d = the degree of accuracy expressed as a proportion (.05).
adopted from Covin and Slevin (1989/1991). They were measured on a five-point Likert scale that ranged from 1 (Strongly Disagree) to 5 (Strongly Agree). Section 3 contains the measurements for leadership styles that were adopted from the Multifactor Leadership Questionnaire (MLQ) by Bass and Avolio (1995/2004). They were measured on a five-point Likert scale that ranged from 1 (Once in a while) to 5 (Always). Section 4 measures the business performance construct through growth and profitability. The measurement of these factors was adopted from Gupta and Govindarajan (1984). All items of business performance were measured on five-point Likert scales ranged from 1 (highly dissatisfied) to 5 (extremely satisfied). 3.6 Partial Least Square-Structural Equation Model (PLS-SEM) Partial Least Square is a predictive statistical approach ‘for modeling complex multivariable relationships among observed and latent outcomes’ (Vinzi, Trinchera and Amato, 2010: 1). This approach allows for the estimation of a ‘causal theoretical network of relationships linking latent complex concepts, each measured by means of a number of observable indicators’ (Vinzi et al., 2010: 2). A PLS path model is divided into three parts: the structural model, the measurement model, and the loading scheme. The following figure 3.3 shows the data analysis processes in PLS-SEM employed in this study.
Figure 3.3: Data analysis processes in PLS-SEM
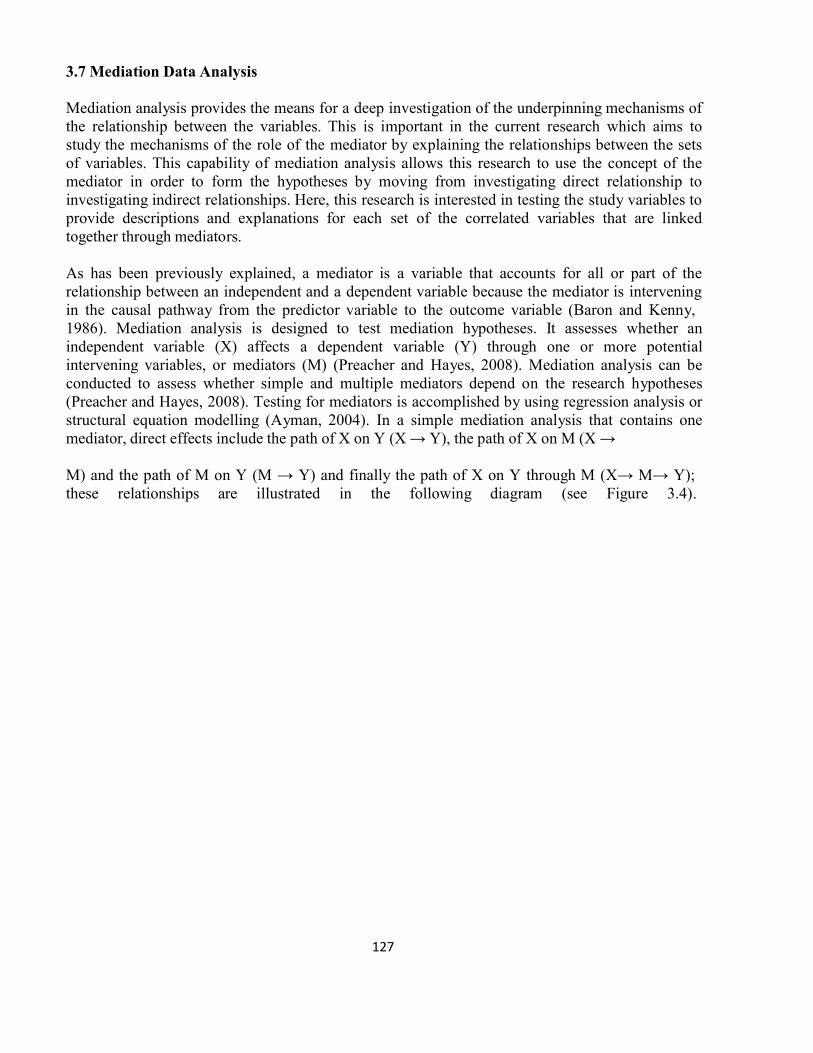
127
3.7 Mediation Data Analysis Mediation analysis provides the means for a deep investigation of the underpinning mechanisms of the relationship between the variables. This is important in the current research which aims to study the mechanisms of the role of the mediator by explaining the relationships between the sets of variables. This capability of mediation analysis allows this research to use the concept of the mediator in order to form the hypotheses by moving from investigating direct relationship to investigating indirect relationships. Here, this research is interested in testing the study variables to provide descriptions and explanations for each set of the correlated variables that are linked together through mediators. As has been previously explained, a mediator is a variable that accounts for all or part of the relationship between an independent and a dependent variable because the mediator is intervening in the causal pathway from the predictor variable to the outcome variable (Baron and Kenny, 1986). Mediation analysis is designed to test mediation hypotheses. It assesses whether an independent variable (X) affects a dependent variable (Y) through one or more potential intervening variables, or mediators (M) (Preacher and Hayes, 2008). Mediation analysis can be conducted to assess whether simple and multiple mediators depend on the research hypotheses (Preacher and Hayes, 2008). Testing for mediators is accomplished by using regression analysis or structural equation modelling (Ayman, 2004). In a simple mediation analysis that contains one mediator, direct effects include the path of X on Y (X → Y), the path of X on M (X → M) and the path of M on Y (M → Y) and finally the path of X on Y through M (X→ M→ Y); these relationships are illustrated in the following diagram (see Figure 3.4).
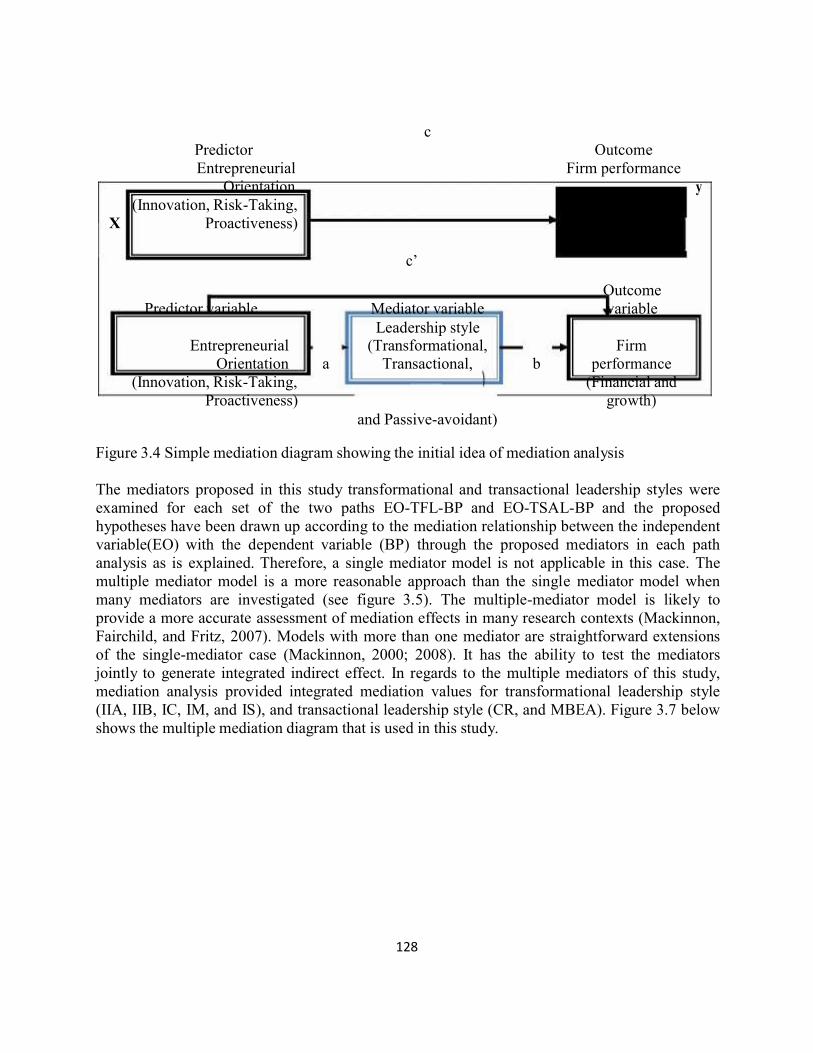
128
c
Predictor Entrepreneurial
Orientation (Innovation, Risk-Taking,
X Proactiveness) c’ Predictor variable Mediator variable
Leadership style
Outcome Firm performance
y (Financial and growth)
Outcome variable
Entrepreneurial Orientation a
(Innovation, Risk-Taking, Proactiveness)
(Transformational, Transactional, b
and Passive-avoidant)
Firm performance
(Financial and growth)
Figure 3.4 Simple mediation diagram showing the initial idea of mediation analysis The mediators proposed in this study transformational and transactional leadership styles were examined for each set of the two paths EO-TFL-BP and EO-TSAL-BP and the proposed hypotheses have been drawn up according to the mediation relationship between the independent variable(EO) with the dependent variable (BP) through the proposed mediators in each path analysis as is explained. Therefore, a single mediator model is not applicable in this case. The multiple mediator model is a more reasonable approach than the single mediator model when many mediators are investigated (see figure 3.5). The multiple-mediator model is likely to provide a more accurate assessment of mediation effects in many research contexts (Mackinnon, Fairchild, and Fritz, 2007). Models with more than one mediator are straightforward extensions of the single-mediator case (Mackinnon, 2000; 2008). It has the ability to test the mediators jointly to generate integrated indirect effect. In regards to the multiple mediators of this study, mediation analysis provided integrated mediation values for transformational leadership style (IIA, IIB, IC, IM, and IS), and transactional leadership style (CR, and MBEA). Figure 3.7 below shows the multiple mediation diagram that is used in this study.
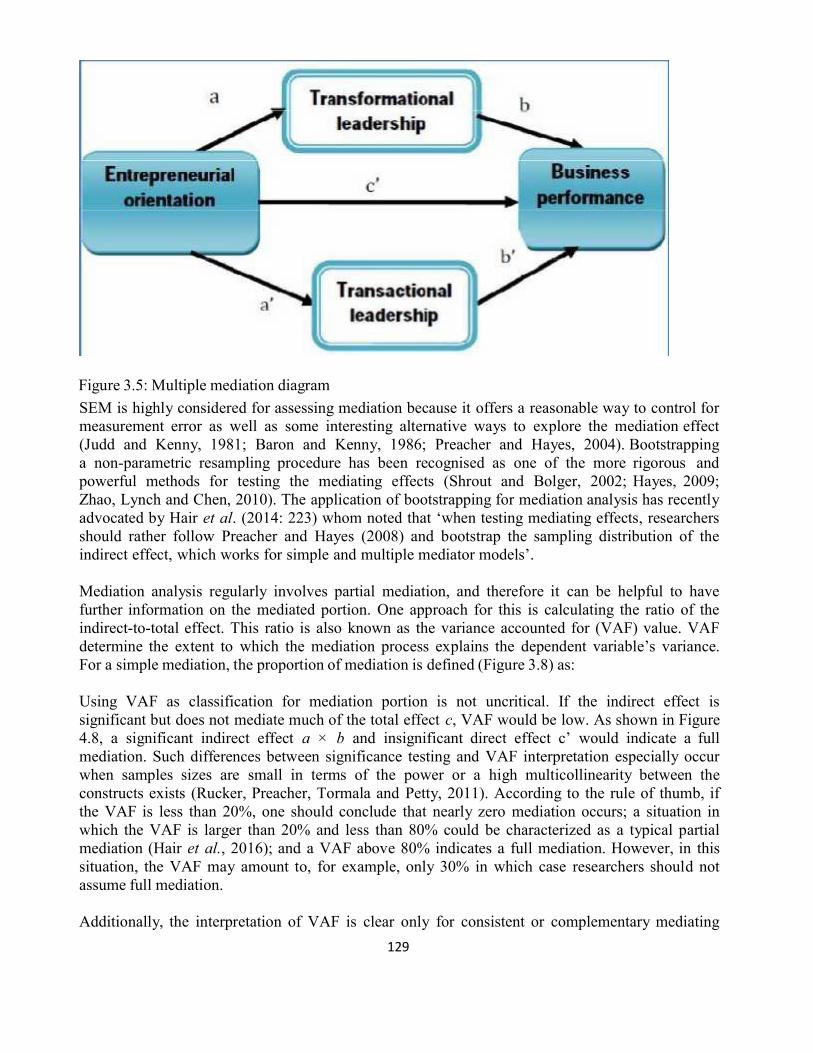
129
Figure 3.5: Multiple mediation diagram SEM is highly considered for assessing mediation because it offers a reasonable way to control for measurement error as well as some interesting alternative ways to explore the mediation effect (Judd and Kenny, 1981; Baron and Kenny, 1986; Preacher and Hayes, 2004). Bootstrapping a non-parametric resampling procedure has been recognised as one of the more rigorous and powerful methods for testing the mediating effects (Shrout and Bolger, 2002; Hayes, 2009; Zhao, Lynch and Chen, 2010). The application of bootstrapping for mediation analysis has recently advocated by Hair et al. (2014: 223) whom noted that ‘when testing mediating effects, researchers should rather follow Preacher and Hayes (2008) and bootstrap the sampling distribution of the indirect effect, which works for simple and multiple mediator models’. Mediation analysis regularly involves partial mediation, and therefore it can be helpful to have further information on the mediated portion. One approach for this is calculating the ratio of the indirect-to-total effect. This ratio is also known as the variance accounted for (VAF) value. VAF determine the extent to which the mediation process explains the dependent variable’s variance. For a simple mediation, the proportion of mediation is defined (Figure 3.8) as: Using VAF as classification for mediation portion is not uncritical. If the indirect effect is significant but does not mediate much of the total effect c, VAF would be low. As shown in Figure 4.8, a significant indirect effect a × b and insignificant direct effect c’ would indicate a full mediation. Such differences between significance testing and VAF interpretation especially occur when samples sizes are small in terms of the power or a high multicollinearity between the constructs exists (Rucker, Preacher, Tormala and Petty, 2011). According to the rule of thumb, if the VAF is less than 20%, one should conclude that nearly zero mediation occurs; a situation in which the VAF is larger than 20% and less than 80% could be characterized as a typical partial mediation (Hair et al., 2016); and a VAF above 80% indicates a full mediation. However, in this situation, the VAF may amount to, for example, only 30% in which case researchers should not assume full mediation. Additionally, the interpretation of VAF is clear only for consistent or complementary mediating
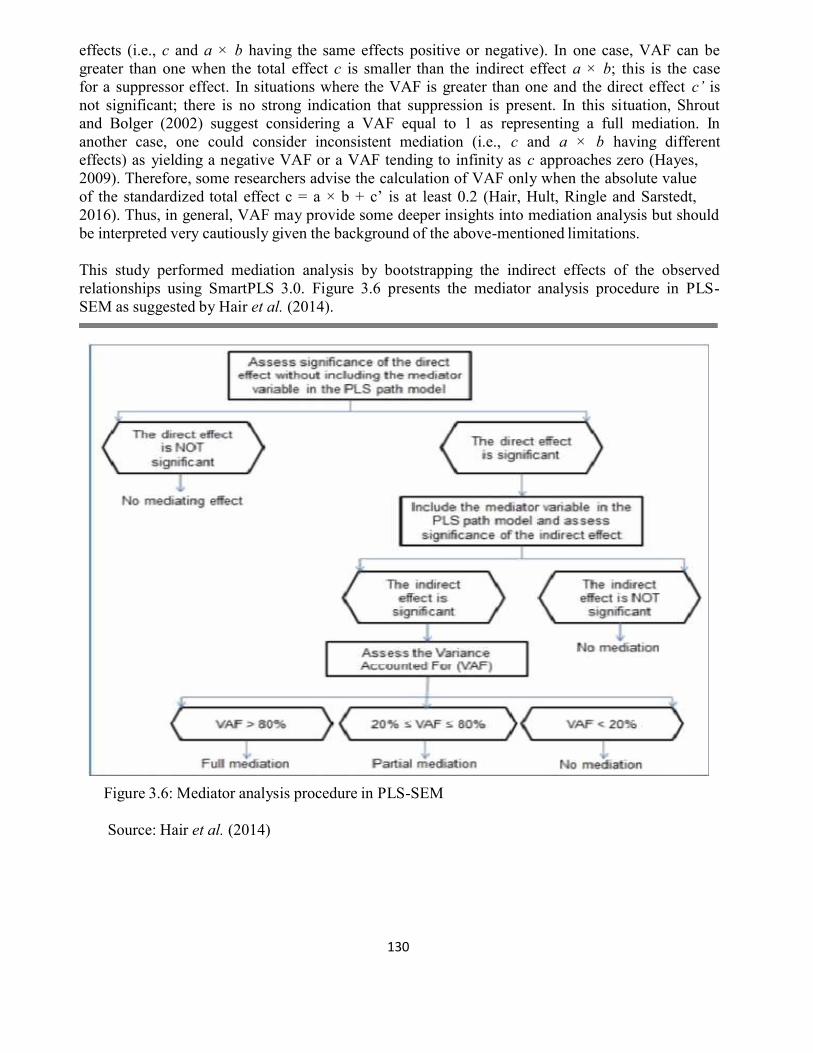
130
effects (i.e., c and a × b having the same effects positive or negative). In one case, VAF can be greater than one when the total effect c is smaller than the indirect effect a × b; this is the case for a suppressor effect. In situations where the VAF is greater than one and the direct effect c’ is not significant; there is no strong indication that suppression is present. In this situation, Shrout and Bolger (2002) suggest considering a VAF equal to 1 as representing a full mediation. In another case, one could consider inconsistent mediation (i.e., c and a × b having different effects) as yielding a negative VAF or a VAF tending to infinity as c approaches zero (Hayes, 2009). Therefore, some researchers advise the calculation of VAF only when the absolute value of the standardized total effect c = a × b + c’ is at least 0.2 (Hair, Hult, Ringle and Sarstedt, 2016). Thus, in general, VAF may provide some deeper insights into mediation analysis but should be interpreted very cautiously given the background of the above-mentioned limitations. This study performed mediation analysis by bootstrapping the indirect effects of the observed relationships using SmartPLS 3.0. Figure 3.6 presents the mediator analysis procedure in PLS- SEM as suggested by Hair et al. (2014).
Figure 3.6: Mediator analysis procedure in PLS-SEM Source: Hair et al. (2014)
131
4. Research Results 4.1 Data Collection and Survey Responses 4.1.1 Response Rate As described in chapter four, there are 322 MSEs operating in the leather and footwear sector in Addis Ababa, according to FeMSEDA data. Though the calculated sample size for the given population was 175, the researcher distributed 250 survey questionnaires to top-level managers of MSEs throughout Addis Ababa with the assumption of a 70% response rate. The respondents were selected through a stratified sampling technique according to their number of employees. The targeted respondents were owners/managers of the MSEs. The questionnaire was sent to the owners/managers via the drop-and-pick method. Of the 250 questionnaires distributed, 153 were collected representing a response rate of 61.20%. Once the 153 questionnaires were collected through self-administered survey, the data were entered in to SPSS. The quality of the data entered in to SPSS was critically examined to make it ready for statistical analysis. The dataset was rechecked to ensure the accuracy of the data entry. The minimum and maximum data values on each variable related to each case were checked to detect any irregular or unusual data values. Ten questionnaires returned were incomplete. Accordingly, these were rejected and only 143 questionnaires were accepted as usable for further analysis. This sample meets the 10 times rule for PLS-SEM, which, according to Hair et al., (2014:20), is ‘10 times the largest number of formative indicators used to measure a single construct’. The most formative indicators (indicator variables whose arrows point toward a latent variable) are three on business performance. Another sample size recommendation is addressed by Hair et al. (2014:21) in their table of sample size and statistical power, which recommends a minimum sample size of 59 in order to detect an R2 of 0.25 at a significance level of 5% (see table 4. 1).
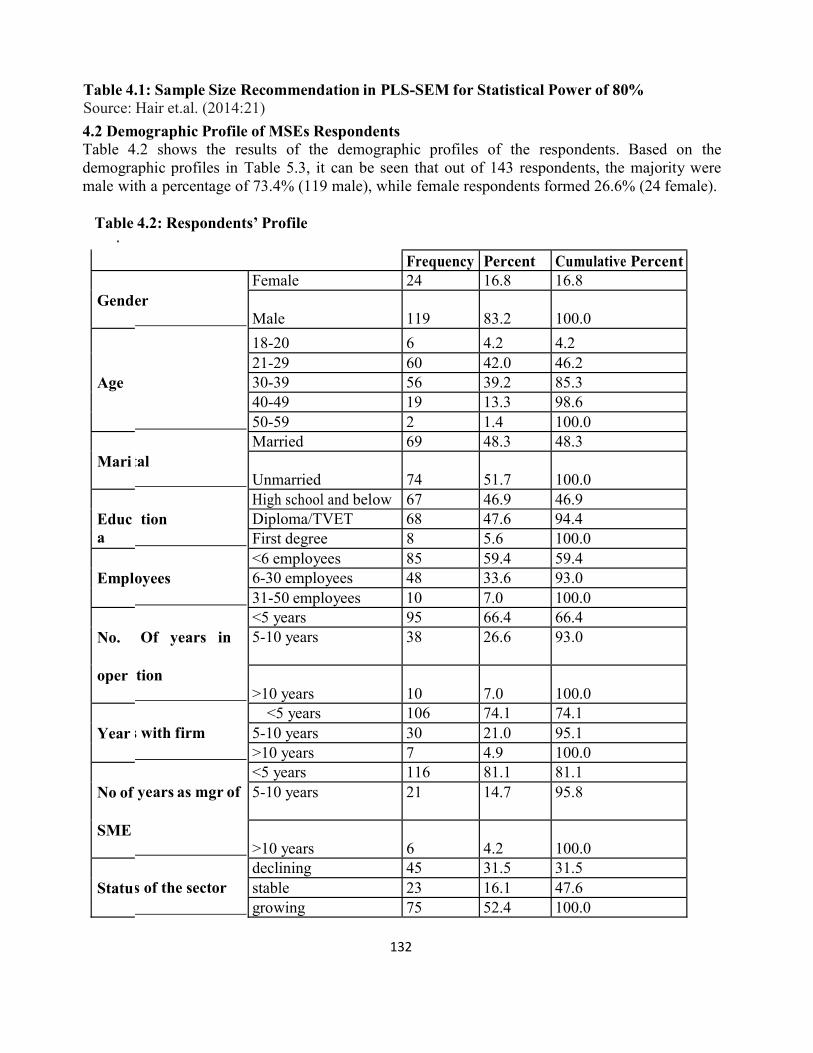
132
Table 4.1: Sample Size Recommendation in PLS-SEM for Statistical Power of 80% Source: Hair et.al. (2014:21) 4.2 Demographic Profile of MSEs Respondents Table 4.2 shows the results of the demographic profiles of the respondents. Based on the demographic profiles in Table 5.3, it can be seen that out of 143 respondents, the majority were male with a percentage of 73.4% (119 male), while female respondents formed 26.6% (24 female). Table 4.2: Respondents’ Profile
Frequency Percent Cumulative Percent Gend
er tal tion oyees Of years in
tion s with firm years as mgr of s of the sector
Female 24 16.8 16.8 Male 119 83.2 100.0
Age 18-20 6 4.2 4.2 21-29 60 42.0 46.2 30-39 56 39.2 85.3 40-49 19 13.3 98.6 50-59 2 1.4 100.0
Mari Married 69 48.3 48.3 Unmarried 74 51.7 100.0
Educa
High school and below 67 46.9 46.9 Diploma/TVET 68 47.6 94.4 First degree 8 5.6 100.0
Empl
<6 employees 85 59.4 59.4 6-30 employees 48 33.6 93.0 31-50 employees 10 7.0 100.0
No. oper
<5 years 95 66.4 66.4 5-10 years 38 26.6 93.0 >10 years 10 7.0 100.0
Year
<5 years 106 74.1 74.1 5-10 years 30 21.0 95.1 >10 years 7 4.9 100.0
No of SME
<5 years 116 81.1 81.1 5-10 years 21 14.7 95.8 >10 years 6 4.2 100.0
Statu
declining 45 31.5 31.5 stable 23 16.1 47.6 growing 75 52.4 100.0

133
Firm
status
declining 37 25.9 25.9 stable 29 20.3 46.2 growing 77 53.8 100.0 Total 143 100.0
Source: Survey Result (2014) From the above table of Respondents’ Profile: Male: 83.2 %, the sector is male dominated one and Age group of between 21-39 years (81.2 %).
Marital (51.7 % unmarried & 48.3 % married). Education < HS to a diploma 94.4%). Experience as an employee: <5 years (74.1 percent). Years in operation: <5 years (66.4%). Experience as an manager: <5 years (81.1 %). Status if sector & firm: 75(52.4%) & 77(53.8%) growing respectively. 4.3 Descriptive Analysis 4.3.1 Entrepreneurial Orientation For entrepreneurial orientation, there were 9 items on a 5-point Likert scale (1-5) to measure innovativeness, proactiveness and risk taking. The Likert scale used measures of 1 = strongly disagree, 2 = disagree, 3 = neutral, 4 = agree and 5 = strongly agree. A descriptive analysis test was performed to determine the state of entrepreneurial orientation among MSE owner/managers in Ethiopia. Based on the test which assessed the means of innovation level, risk taking level and proactiveness level, the researcher found out that innovation had the highest mean (mean= 3.74, SD = 0.96) compared to proactiveness (mean= 3.73, SD = 0.97) and risk-taking (mean = 3.56, SD = 0.86). These results indicate that the respondents perceived that their organisations display more of the innovativeness and proactiveness attribute of entrepreneurial orientation than risk taking. The descriptive analysis shows that the majority of the MSE owners/managers in Ethiopia in the selected sector possess a total entrepreneurial orientation of a mean of 3.68, SD = 0.85. This answers research question 1: What is the state of entrepreneurial orientation (innovation, proactiveness, and risk-taking) among the MSE owner/managers in Ethiopia? Table 4.3 shows the means and standard deviations for the scales used to measure entrepreneurial orientation in this study. Table 4.3: Means and Standard Deviation for Entrepreneurial Orientation Measures Mean Std. Deviation Total entrepreneurial orientation 3.68 0.85
Innovativeness 3.74 0.96 Risk taking 3.56 0.86 Proactiveness
Source: Survey Result (2014) 3.73 0.97
4.3.2 Leadership Style
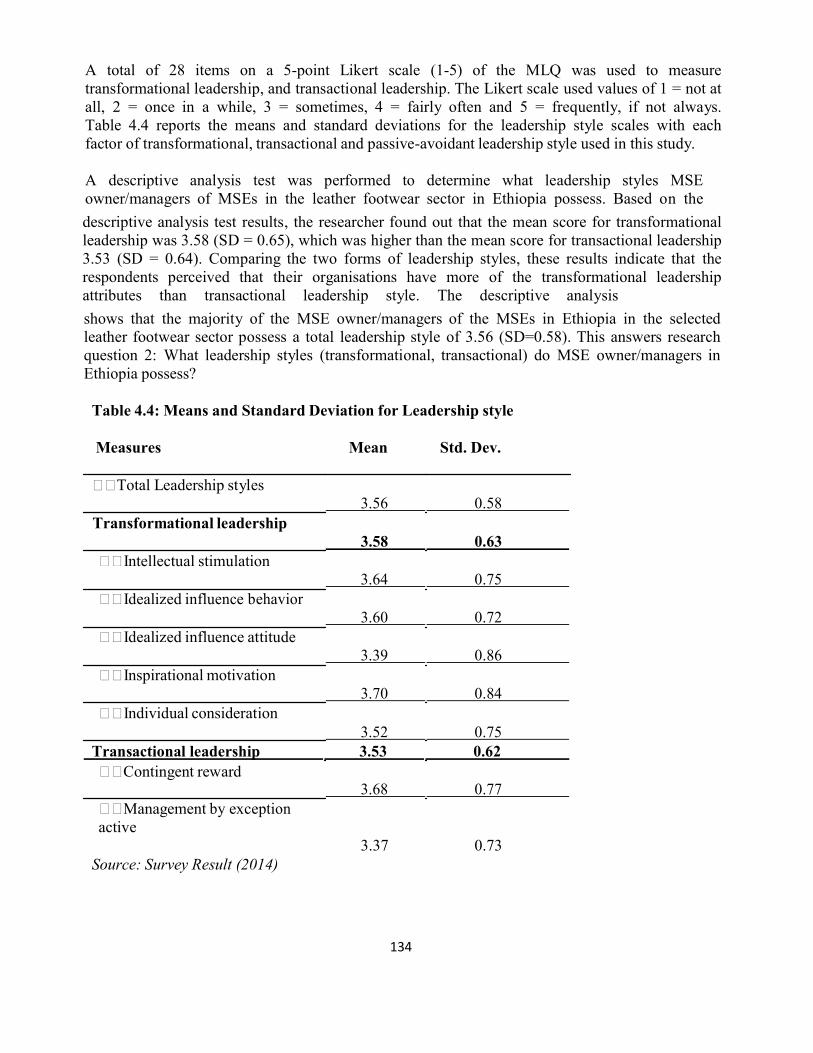
134
A total of 28 items on a 5-point Likert scale (1-5) of the MLQ was used to measure transformational leadership, and transactional leadership. The Likert scale used values of 1 = not at all, 2 = once in a while, 3 = sometimes, 4 = fairly often and 5 = frequently, if not always. Table 4.4 reports the means and standard deviations for the leadership style scales with each factor of transformational, transactional and passive-avoidant leadership style used in this study. A descriptive analysis test was performed to determine what leadership styles MSE owner/managers of MSEs in the leather footwear sector in Ethiopia possess. Based on the descriptive analysis test results, the researcher found out that the mean score for transformational leadership was 3.58 (SD = 0.65), which was higher than the mean score for transactional leadership 3.53 (SD = 0.64). Comparing the two forms of leadership styles, these results indicate that the respondents perceived that their organisations have more of the transformational leadership attributes than transactional leadership style. The descriptive analysis shows that the majority of the MSE owner/managers of the MSEs in Ethiopia in the selected leather footwear sector possess a total leadership style of 3.56 (SD=0.58). This answers research question 2: What leadership styles (transformational, transactional) do MSE owner/managers in Ethiopia possess? Table 4.4: Means and Standard Deviation for Leadership style
Measures Mean Std. Dev. Total Leadership styles Transformational leadership Intellectual stimulation Idealized influence behavior Idealized influence attitude Inspirational motivation Individual consideration
3.56 0.58 3.58 0.63 3.64 0.75 3.60 0.72 3.39 0.86 3.70 0.84 3.52 0.75
Transactional leadership 3.53 0.62 Contingent reward
Management by exception active
Source: Survey Result (2014)
3.68 0.77 3.37 0.73
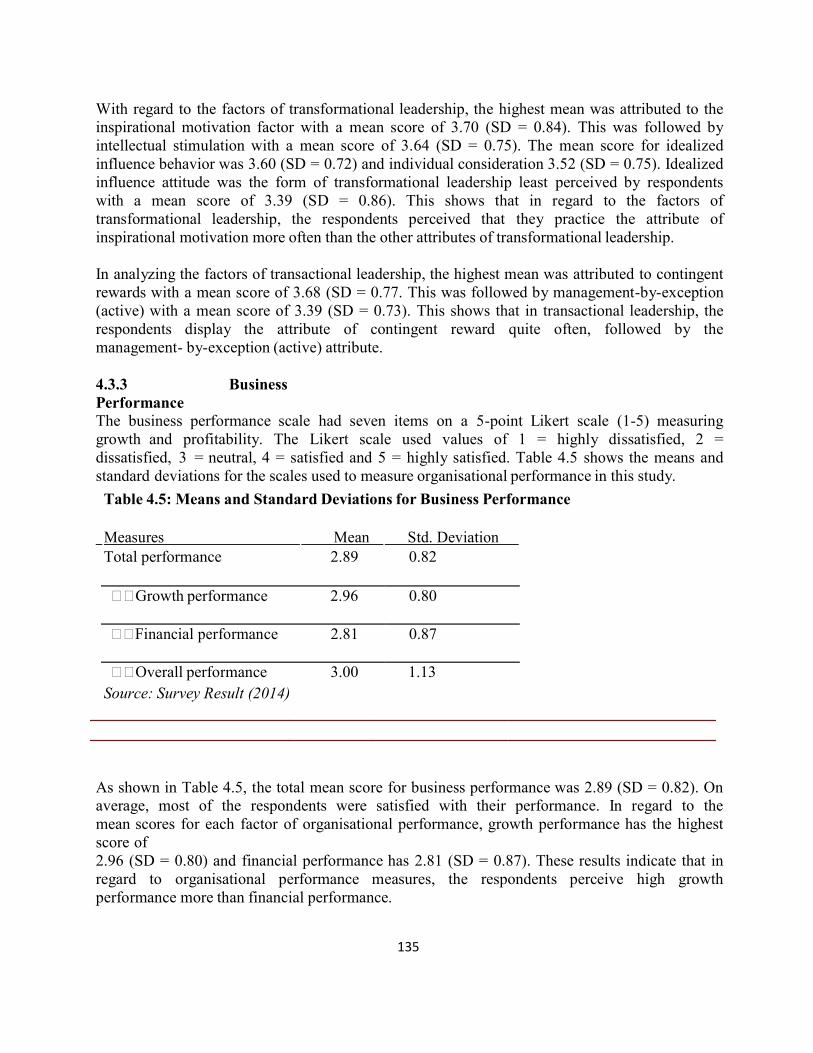
135
With regard to the factors of transformational leadership, the highest mean was attributed to the inspirational motivation factor with a mean score of 3.70 (SD = 0.84). This was followed by intellectual stimulation with a mean score of 3.64 (SD = 0.75). The mean score for idealized influence behavior was 3.60 (SD = 0.72) and individual consideration 3.52 (SD = 0.75). Idealized influence attitude was the form of transformational leadership least perceived by respondents with a mean score of 3.39 (SD = 0.86). This shows that in regard to the factors of transformational leadership, the respondents perceived that they practice the attribute of inspirational motivation more often than the other attributes of transformational leadership. In analyzing the factors of transactional leadership, the highest mean was attributed to contingent rewards with a mean score of 3.68 (SD = 0.77. This was followed by management-by-exception (active) with a mean score of 3.39 (SD = 0.73). This shows that in transactional leadership, the respondents display the attribute of contingent reward quite often, followed by the management- by-exception (active) attribute. 4.3.3 Business Performance The business performance scale had seven items on a 5-point Likert scale (1-5) measuring growth and profitability. The Likert scale used values of 1 = highly dissatisfied, 2 = dissatisfied, 3 = neutral, 4 = satisfied and 5 = highly satisfied. Table 4.5 shows the means and standard deviations for the scales used to measure organisational performance in this study.
Table 4.5: Means and Standard Deviations for Business Performance Measures Mean Std. Deviation
Total performance 2.89 0.82 Growth performance 2.96 0.80 Financial performance 2.81 0.87 Overall performance 3.00 1.13
Source: Survey Result (2014)
As shown in Table 4.5, the total mean score for business performance was 2.89 (SD = 0.82). On average, most of the respondents were satisfied with their performance. In regard to the mean scores for each factor of organisational performance, growth performance has the highest score of 2.96 (SD = 0.80) and financial performance has 2.81 (SD = 0.87). These results indicate that in regard to organisational performance measures, the respondents perceive high growth performance more than financial performance.
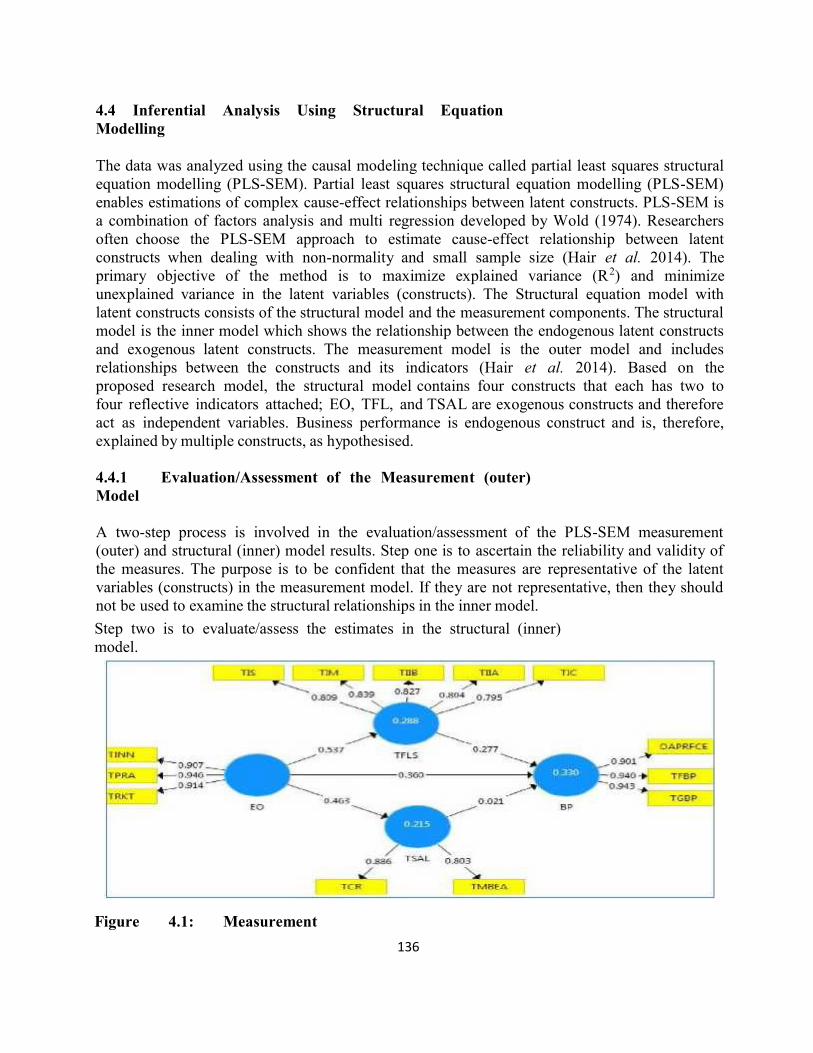
136
4.4 Inferential Analysis Using Structural Equation Modelling The data was analyzed using the causal modeling technique called partial least squares structural equation modelling (PLS-SEM). Partial least squares structural equation modelling (PLS-SEM) enables estimations of complex cause-effect relationships between latent constructs. PLS-SEM is a combination of factors analysis and multi regression developed by Wold (1974). Researchers often choose the PLS-SEM approach to estimate cause-effect relationship between latent constructs when dealing with non-normality and small sample size (Hair et al. 2014). The primary objective of the method is to maximize explained variance (R2) and minimize unexplained variance in the latent variables (constructs). The Structural equation model with latent constructs consists of the structural model and the measurement components. The structural model is the inner model which shows the relationship between the endogenous latent constructs and exogenous latent constructs. The measurement model is the outer model and includes relationships between the constructs and its indicators (Hair et al. 2014). Based on the proposed research model, the structural model contains four constructs that each has two to four reflective indicators attached; EO, TFL, and TSAL are exogenous constructs and therefore act as independent variables. Business performance is endogenous construct and is, therefore, explained by multiple constructs, as hypothesised. 4.4.1 Evaluation/Assessment of the Measurement (outer) Model A two-step process is involved in the evaluation/assessment of the PLS-SEM measurement (outer) and structural (inner) model results. Step one is to ascertain the reliability and validity of the measures. The purpose is to be confident that the measures are representative of the latent variables (constructs) in the measurement model. If they are not representative, then they should not be used to examine the structural relationships in the inner model. Step two is to evaluate/assess the estimates in the structural (inner) model.
Figure 4.1: Measurement

137
Models. The measurements in this initial model will be tested for reliability and validity in the reflective model. (Items loadings and path coefficient)
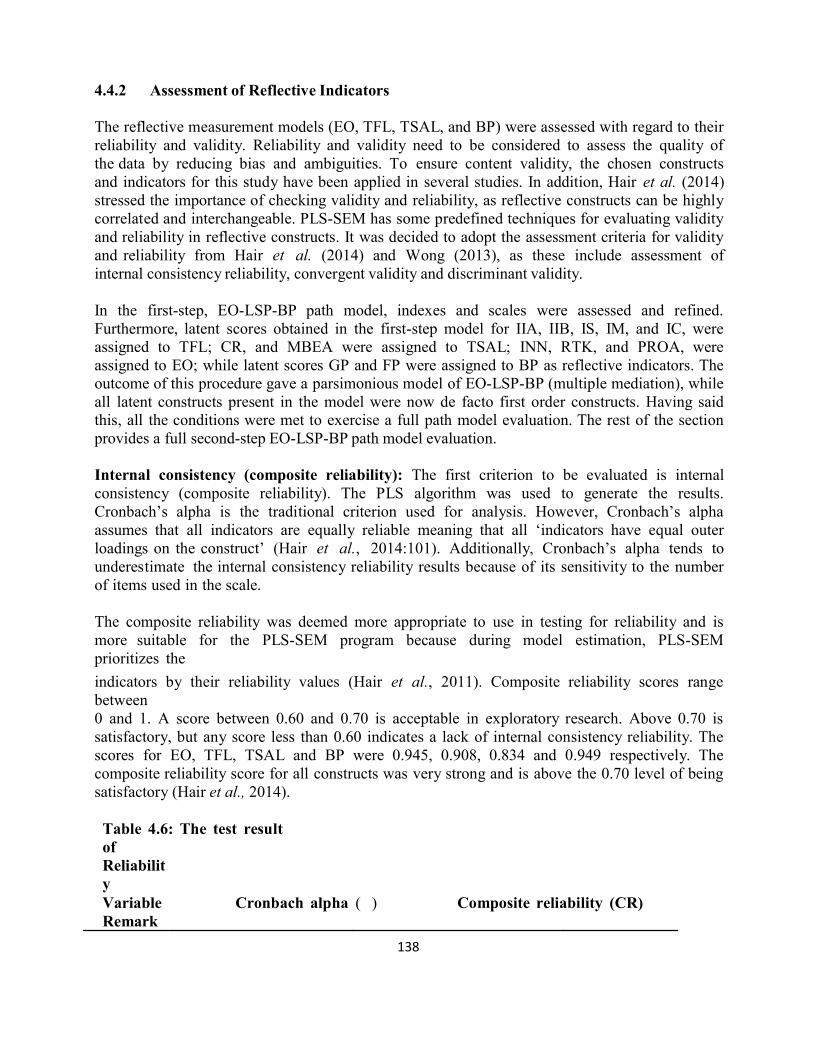
138
4.4.2 Assessment of Reflective Indicators The reflective measurement models (EO, TFL, TSAL, and BP) were assessed with regard to their reliability and validity. Reliability and validity need to be considered to assess the quality of the data by reducing bias and ambiguities. To ensure content validity, the chosen constructs and indicators for this study have been applied in several studies. In addition, Hair et al. (2014) stressed the importance of checking validity and reliability, as reflective constructs can be highly correlated and interchangeable. PLS-SEM has some predefined techniques for evaluating validity and reliability in reflective constructs. It was decided to adopt the assessment criteria for validity and reliability from Hair et al. (2014) and Wong (2013), as these include assessment of internal consistency reliability, convergent validity and discriminant validity. In the first-step, EO-LSP-BP path model, indexes and scales were assessed and refined. Furthermore, latent scores obtained in the first-step model for IIA, IIB, IS, IM, and IC, were assigned to TFL; CR, and MBEA were assigned to TSAL; INN, RTK, and PROA, were assigned to EO; while latent scores GP and FP were assigned to BP as reflective indicators. The outcome of this procedure gave a parsimonious model of EO-LSP-BP (multiple mediation), while all latent constructs present in the model were now de facto first order constructs. Having said this, all the conditions were met to exercise a full path model evaluation. The rest of the section provides a full second-step EO-LSP-BP path model evaluation. Internal consistency (composite reliability): The first criterion to be evaluated is internal consistency (composite reliability). The PLS algorithm was used to generate the results. Cronbach’s alpha is the traditional criterion used for analysis. However, Cronbach’s alpha assumes that all indicators are equally reliable meaning that all ‘indicators have equal outer loadings on the construct’ (Hair et al., 2014:101). Additionally, Cronbach’s alpha tends to underestimate the internal consistency reliability results because of its sensitivity to the number of items used in the scale. The composite reliability was deemed more appropriate to use in testing for reliability and is more suitable for the PLS-SEM program because during model estimation, PLS-SEM prioritizes the indicators by their reliability values (Hair et al., 2011). Composite reliability scores range between 0 and 1. A score between 0.60 and 0.70 is acceptable in exploratory research. Above 0.70 is satisfactory, but any score less than 0.60 indicates a lack of internal consistency reliability. The scores for EO, TFL, TSAL and BP were 0.945, 0.908, 0.834 and 0.949 respectively. The composite reliability score for all constructs was very strong and is above the 0.70 level of being satisfactory (Hair et al., 2014). Table 4.6: The test result
of Reliability Variable Cronbach alpha ( ) Composite reliability (CR) Remark
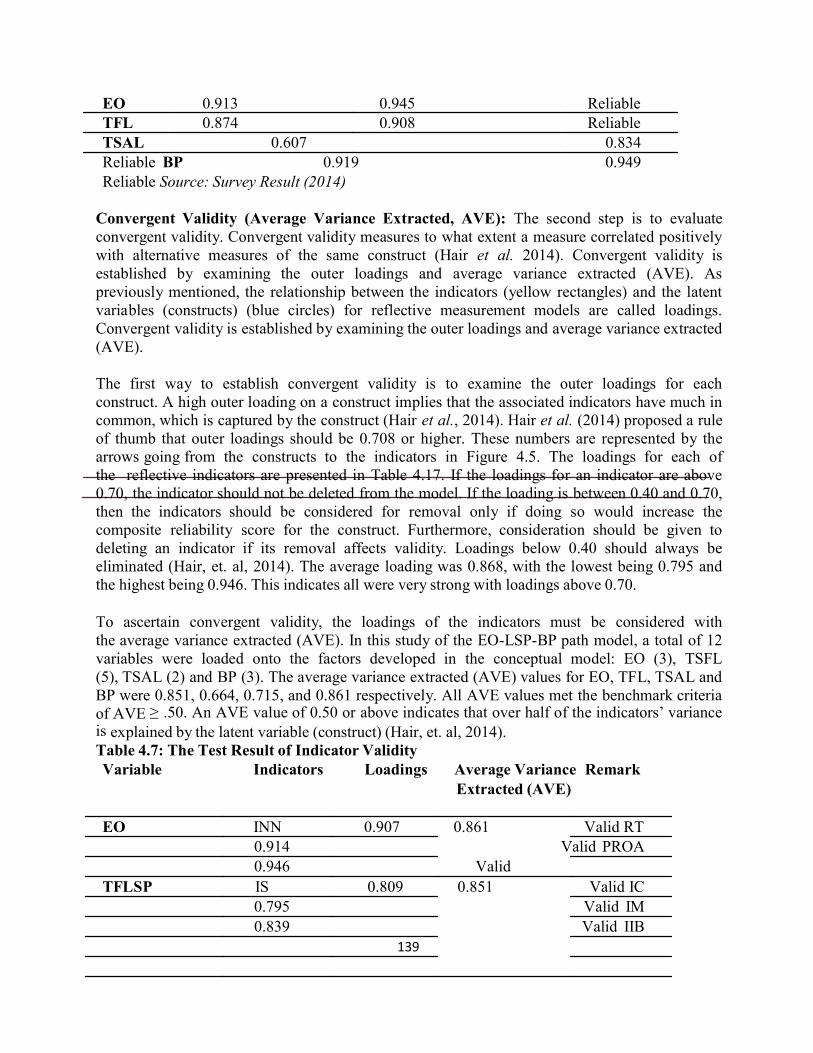
139
EO 0.913 0.945 Reliable TFL 0.874 0.908 Reliable TSAL 0.607 0.834 Reliable BP 0.919 0.949 Reliable Source: Survey Result (2014)
Convergent Validity (Average Variance Extracted, AVE): The second step is to evaluate convergent validity. Convergent validity measures to what extent a measure correlated positively with alternative measures of the same construct (Hair et al. 2014). Convergent validity is established by examining the outer loadings and average variance extracted (AVE). As previously mentioned, the relationship between the indicators (yellow rectangles) and the latent variables (constructs) (blue circles) for reflective measurement models are called loadings. Convergent validity is established by examining the outer loadings and average variance extracted (AVE). The first way to establish convergent validity is to examine the outer loadings for each construct. A high outer loading on a construct implies that the associated indicators have much in common, which is captured by the construct (Hair et al., 2014). Hair et al. (2014) proposed a rule of thumb that outer loadings should be 0.708 or higher. These numbers are represented by the arrows going from the constructs to the indicators in Figure 4.5. The loadings for each of the reflective indicators are presented in Table 4.17. If the loadings for an indicator are above 0.70, the indicator should not be deleted from the model. If the loading is between 0.40 and 0.70, then the indicators should be considered for removal only if doing so would increase the composite reliability score for the construct. Furthermore, consideration should be given to deleting an indicator if its removal affects validity. Loadings below 0.40 should always be eliminated (Hair, et. al, 2014). The average loading was 0.868, with the lowest being 0.795 and the highest being 0.946. This indicates all were very strong with loadings above 0.70. To ascertain convergent validity, the loadings of the indicators must be considered with the average variance extracted (AVE). In this study of the EO-LSP-BP path model, a total of 12 variables were loaded onto the factors developed in the conceptual model: EO (3), TSFL (5), TSAL (2) and BP (3). The average variance extracted (AVE) values for EO, TFL, TSAL and BP were 0.851, 0.664, 0.715, and 0.861 respectively. All AVE values met the benchmark criteria of AVE ≥ .50. An AVE value of 0.50 or above indicates that over half of the indicators’ variance is explained by the latent variable (construct) (Hair, et. al, 2014). Table 4.7: The Test Result of Indicator Validity Variable Indicators Loadings Average Variance Remark
Extracted (AVE) EO INN 0.907 0.861 Valid RT
0.914 Valid PROA 0.946 Valid
TFLSP IS 0.809 0.851 Valid IC 0.795 Valid IM 0.839 Valid IIB
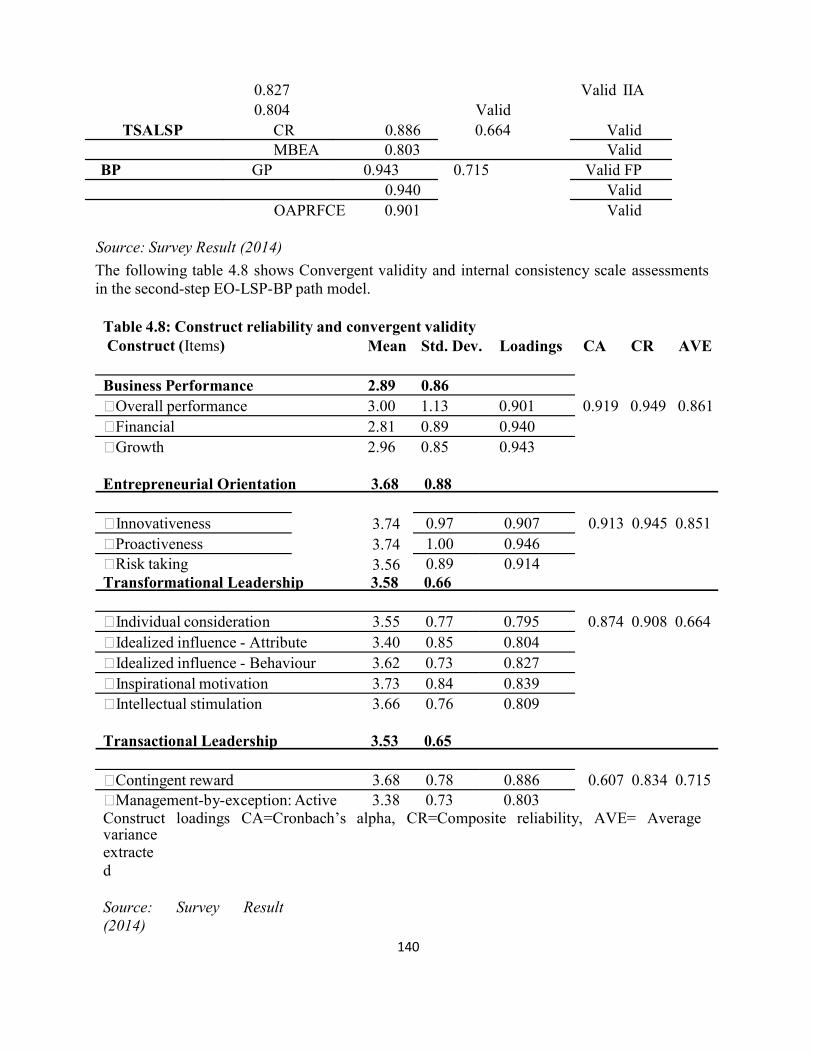
140
0.827 Valid IIA 0.804 Valid
TSALSP CR 0.886 0.664 Valid MBEA 0.803 Valid
BP GP 0.943 0.715 Valid FP 0.940 Valid
OAPRFCE 0.901 Valid Source: Survey Result (2014) The following table 4.8 shows Convergent validity and internal consistency scale assessments in the second-step EO-LSP-BP path model.
Table 4.8: Construct reliability and convergent validity Construct (Items) Mean Std. Dev. Loadings CA CR AVE
Business Performance 2.89 0.86 Overall performance 3.00 1.13 0.901 0.919 0.949 0.861 Financial 2.81 0.89 0.940 Growth 2.96 0.85 0.943
Entrepreneurial Orientation 3.68 0.88 Innovativeness 3.74 0.97 0.907 0.913 0.945 0.851 Proactiveness 3.74 1.00 0.946 Risk taking 3.56 0.89 0.914
Transformational Leadership 3.58 0.66 Individual consideration 3.55 0.77 0.795 0.874 0.908 0.664 Idealized influence - Attribute 3.40 0.85 0.804 Idealized influence - Behaviour 3.62 0.73 0.827 Inspirational motivation 3.73 0.84 0.839 Intellectual stimulation 3.66 0.76 0.809
Transactional Leadership 3.53 0.65 Contingent reward 3.68 0.78 0.886 0.607 0.834 0.715 Management-by-exception: Active 3.38 0.73 0.803 Construct loadings CA=Cronbach’s alpha, CR=Composite reliability, AVE= Average variance extracted Source: Survey Result (2014)
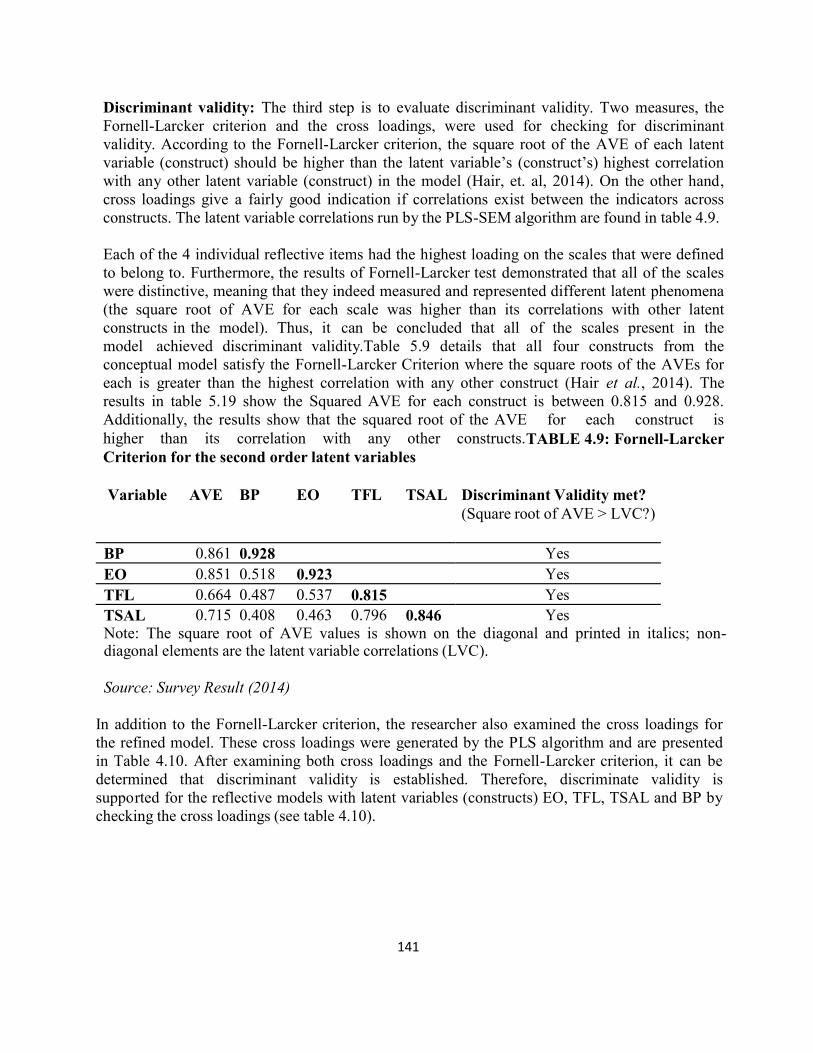
141
Discriminant validity: The third step is to evaluate discriminant validity. Two measures, the Fornell-Larcker criterion and the cross loadings, were used for checking for discriminant validity. According to the Fornell-Larcker criterion, the square root of the AVE of each latent variable (construct) should be higher than the latent variable’s (construct’s) highest correlation with any other latent variable (construct) in the model (Hair, et. al, 2014). On the other hand, cross loadings give a fairly good indication if correlations exist between the indicators across constructs. The latent variable correlations run by the PLS-SEM algorithm are found in table 4.9. Each of the 4 individual reflective items had the highest loading on the scales that were defined to belong to. Furthermore, the results of Fornell-Larcker test demonstrated that all of the scales were distinctive, meaning that they indeed measured and represented different latent phenomena (the square root of AVE for each scale was higher than its correlations with other latent constructs in the model). Thus, it can be concluded that all of the scales present in the model achieved discriminant validity.Table 5.9 details that all four constructs from the conceptual model satisfy the Fornell-Larcker Criterion where the square roots of the AVEs for each is greater than the highest correlation with any other construct (Hair et al., 2014). The results in table 5.19 show the Squared AVE for each construct is between 0.815 and 0.928. Additionally, the results show that the squared root of the AVE for each construct is higher than its correlation with any other constructs.TABLE 4.9: Fornell-Larcker Criterion for the second order latent variables Variable AVE BP EO TFL TSAL Discriminant Validity met?
(Square root of AVE > LVC?) BP 0.861 0.928 Yes EO 0.851 0.518 0.923 Yes TFL 0.664 0.487 0.537 0.815 Yes TSAL 0.715 0.408 0.463 0.796 0.846 Yes Note: The square root of AVE values is shown on the diagonal and printed in italics; non- diagonal elements are the latent variable correlations (LVC). Source: Survey Result (2014) In addition to the Fornell-Larcker criterion, the researcher also examined the cross loadings for
the refined model. These cross loadings were generated by the PLS algorithm and are presented in Table 4.10. After examining both cross loadings and the Fornell-Larcker criterion, it can be determined that discriminant validity is established. Therefore, discriminate validity is supported for the reflective models with latent variables (constructs) EO, TFL, TSAL and BP by checking the cross loadings (see table 4.10).
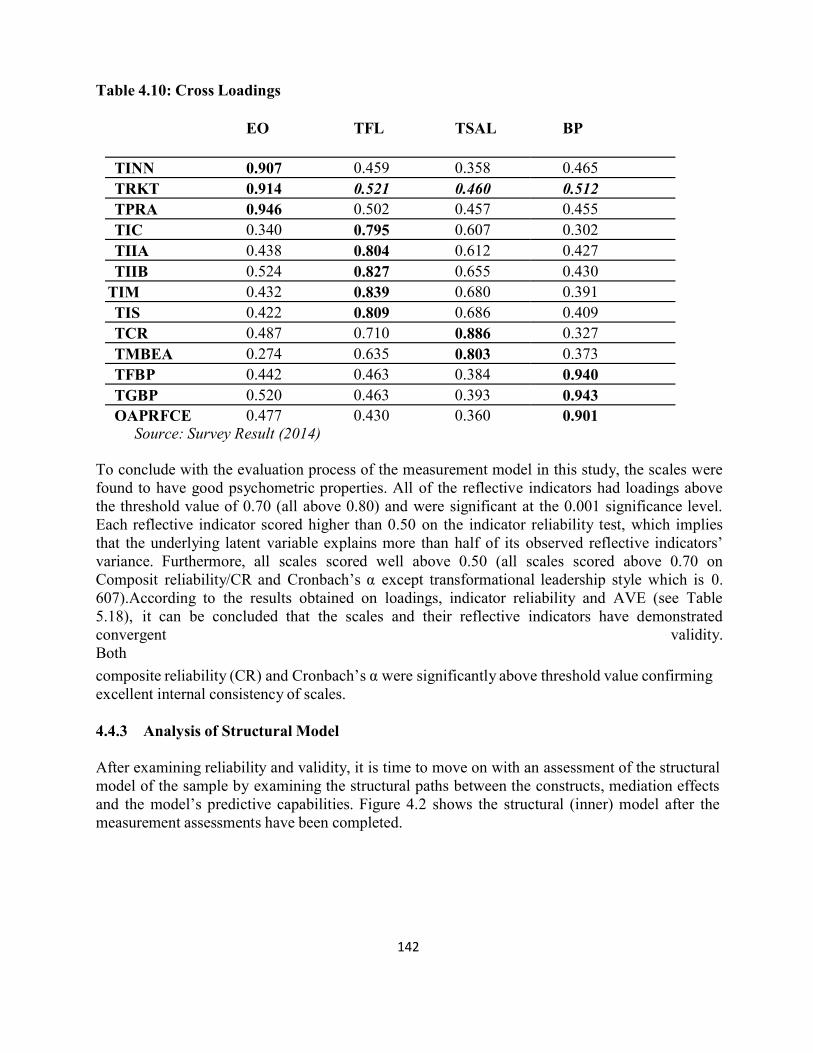
142
Table 4.10: Cross Loadings EO TFL TSAL BP TINN 0.907 0.459 0.358 0.465 TRKT 0.914 0.521 0.460 0.512 TPRA 0.946 0.502 0.457 0.455 TIC 0.340 0.795 0.607 0.302 TIIA 0.438 0.804 0.612 0.427 TIIB 0.524 0.827 0.655 0.430
TIM 0.432 0.839 0.680 0.391 TIS 0.422 0.809 0.686 0.409 TCR 0.487 0.710 0.886 0.327 TMBEA 0.274 0.635 0.803 0.373 TFBP 0.442 0.463 0.384 0.940 TGBP 0.520 0.463 0.393 0.943 OAPRFCE 0.477 0.430 0.360 0.901 Source: Survey Result (2014) To conclude with the evaluation process of the measurement model in this study, the scales were
found to have good psychometric properties. All of the reflective indicators had loadings above the threshold value of 0.70 (all above 0.80) and were significant at the 0.001 significance level. Each reflective indicator scored higher than 0.50 on the indicator reliability test, which implies that the underlying latent variable explains more than half of its observed reflective indicators’ variance. Furthermore, all scales scored well above 0.50 (all scales scored above 0.70 on Composit reliability/CR and Cronbach’s α except transformational leadership style which is 0. 607).According to the results obtained on loadings, indicator reliability and AVE (see Table 5.18), it can be concluded that the scales and their reflective indicators have demonstrated convergent validity. Both composite reliability (CR) and Cronbach’s α were significantly above threshold value confirming excellent internal consistency of scales. 4.4.3 Analysis of Structural Model After examining reliability and validity, it is time to move on with an assessment of the structural model of the sample by examining the structural paths between the constructs, mediation effects and the model’s predictive capabilities. Figure 4.2 shows the structural (inner) model after the measurement assessments have been completed.
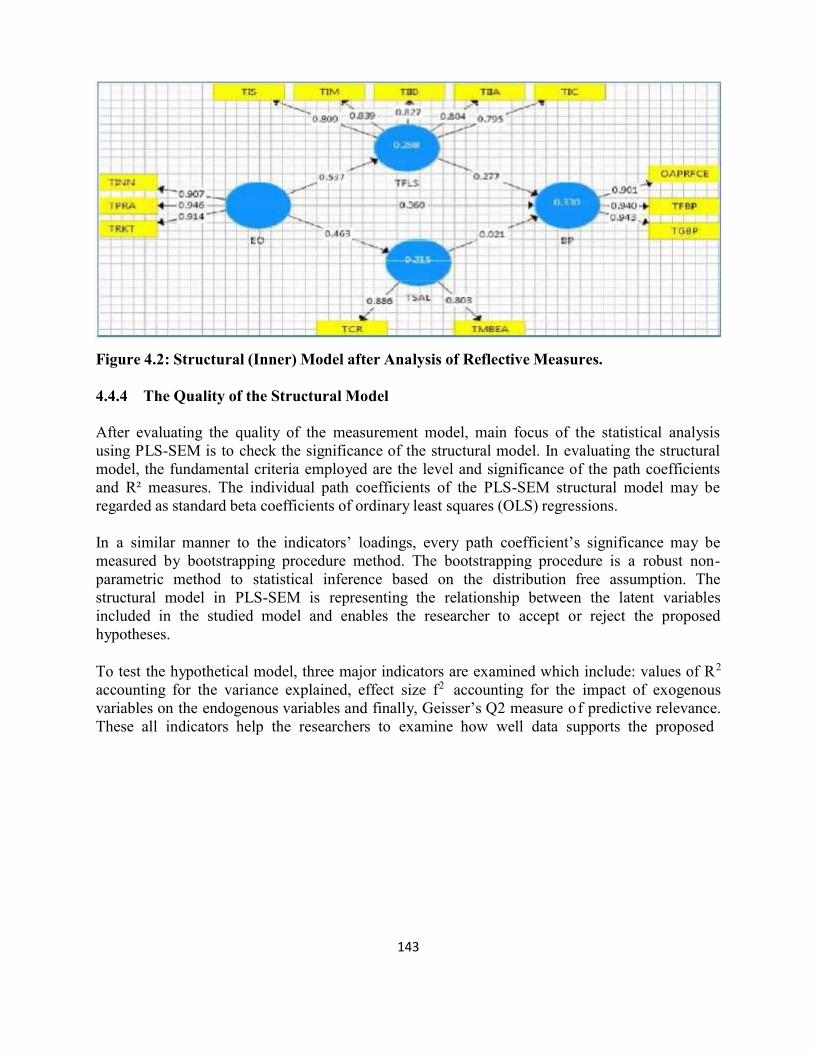
143
Figure 4.2: Structural (Inner) Model after Analysis of Reflective Measures. 4.4.4 The Quality of the Structural Model After evaluating the quality of the measurement model, main focus of the statistical analysis using PLS-SEM is to check the significance of the structural model. In evaluating the structural model, the fundamental criteria employed are the level and significance of the path coefficients and R² measures. The individual path coefficients of the PLS-SEM structural model may be regarded as standard beta coefficients of ordinary least squares (OLS) regressions. In a similar manner to the indicators’ loadings, every path coefficient’s significance may be measured by bootstrapping procedure method. The bootstrapping procedure is a robust non- parametric method to statistical inference based on the distribution free assumption. The structural model in PLS-SEM is representing the relationship between the latent variables included in the studied model and enables the researcher to accept or reject the proposed hypotheses. To test the hypothetical model, three major indicators are examined which include: values of R2 accounting for the variance explained, effect size f2 accounting for the impact of exogenous variables on the endogenous variables and finally, Geisser’s Q2 measure o f predictive relevance. These all indicators help the researchers to examine how well data supports the proposed
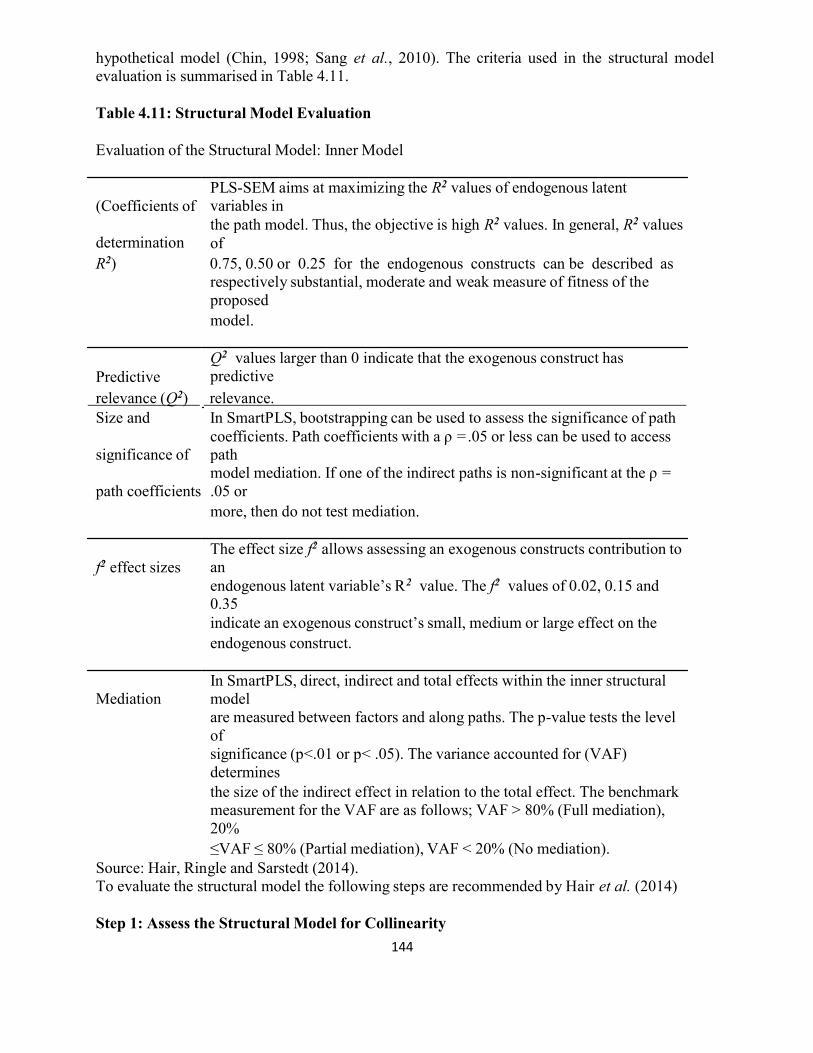
144
hypothetical model (Chin, 1998; Sang et al., 2010). The criteria used in the structural model evaluation is summarised in Table 4.11. Table 4.11: Structural Model Evaluation Evaluation of the Structural Model: Inner Model (Coefficients of determination
PLS-SEM aims at maximizing the R2 values of endogenous latent variables in the path model. Thus, the objective is high R2 values. In general, R2 values of
R2) 0.75, 0.50 or 0.25 for the endogenous constructs can be described as respectively substantial, moderate and weak measure of fitness of the proposed model.
Predictive Q2 values larger than 0 indicate that the exogenous construct has predictive
relevance (Q2) relevance. Size and In SmartPLS, bootstrapping can be used to assess the significance of path
coefficients. Path coefficients with a ρ =.05 or less can be used to access significance of path coefficients
path model mediation. If one of the indirect paths is non-significant at the ρ = .05 or more, then do not test mediation.
f2 effect sizes The effect size f2 allows assessing an exogenous constructs contribution to an endogenous latent variable’s R2 value. The f2 values of 0.02, 0.15 and 0.35 indicate an exogenous construct’s small, medium or large effect on the endogenous construct.
Mediation In SmartPLS, direct, indirect and total effects within the inner structural model are measured between factors and along paths. The p-value tests the level of significance (p<.01 or p< .05). The variance accounted for (VAF) determines the size of the indirect effect in relation to the total effect. The benchmark measurement for the VAF are as follows; VAF > 80% (Full mediation), 20% ≤VAF ≤ 80% (Partial mediation), VAF < 20% (No mediation).
Source: Hair, Ringle and Sarstedt (2014). To evaluate the structural model the following steps are recommended by Hair et al. (2014) Step 1: Assess the Structural Model for Collinearity
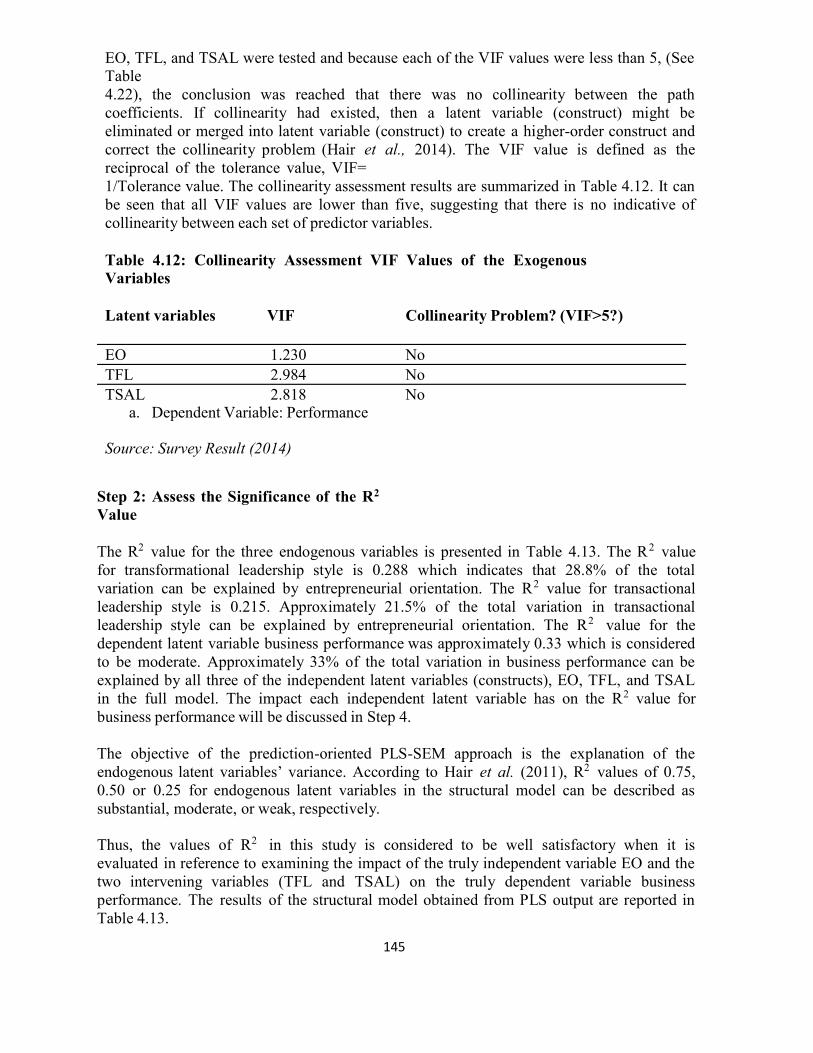
145
EO, TFL, and TSAL were tested and because each of the VIF values were less than 5, (See Table 4.22), the conclusion was reached that there was no collinearity between the path coefficients. If collinearity had existed, then a latent variable (construct) might be eliminated or merged into latent variable (construct) to create a higher-order construct and correct the collinearity problem (Hair et al., 2014). The VIF value is defined as the reciprocal of the tolerance value, VIF= 1/Tolerance value. The collinearity assessment results are summarized in Table 4.12. It can be seen that all VIF values are lower than five, suggesting that there is no indicative of collinearity between each set of predictor variables. Table 4.12: Collinearity Assessment VIF Values of the Exogenous Variables Latent variables VIF Collinearity Problem? (VIF>5?) EO 1.230 No TFL 2.984 No TSAL 2.818 No a. Dependent Variable: Performance Source: Survey Result (2014)
Step 2: Assess the Significance of the R2 Value The R2 value for the three endogenous variables is presented in Table 4.13. The R2 value for transformational leadership style is 0.288 which indicates that 28.8% of the total variation can be explained by entrepreneurial orientation. The R2 value for transactional leadership style is 0.215. Approximately 21.5% of the total variation in transactional leadership style can be explained by entrepreneurial orientation. The R2 value for the dependent latent variable business performance was approximately 0.33 which is considered to be moderate. Approximately 33% of the total variation in business performance can be explained by all three of the independent latent variables (constructs), EO, TFL, and TSAL in the full model. The impact each independent latent variable has on the R2 value for business performance will be discussed in Step 4. The objective of the prediction-oriented PLS-SEM approach is the explanation of the endogenous latent variables’ variance. According to Hair et al. (2011), R2 values of 0.75, 0.50 or 0.25 for endogenous latent variables in the structural model can be described as substantial, moderate, or weak, respectively. Thus, the values of R2 in this study is considered to be well satisfactory when it is evaluated in reference to examining the impact of the truly independent variable EO and the two intervening variables (TFL and TSAL) on the truly dependent variable business performance. The results of the structural model obtained from PLS output are reported in Table 4.13.

146
Table 4.13: R Square Endogenous variables R2 BP 0.330*** TSAL 0.215***
TSFL 0.288*** Source: Survey Result (2014) Step 3: Assess the Significance of the Path Coefficients To confirm whether the relationship is significant, the standard errors are obtained through bootstrapping. The PLS algorithm and bootstrapping results are calculated using 5000 subsamples and a two-tailed test type with a significance level of 5%. The results of the PLS algorithm and bootstrapping are provided in table 4.14. Table 4.14: Results of Structural Path Modeling
Ind. Dep. Path Std. T-values Bootstrap 95% CI var. Var. coeffs. Error (p-values)
2.5% 97.5% EO BP 0.360 0.084 4.257(0.000) 0.158
0.513 EO TFL 0.537 0.066 8.084(0.000) 0.387
0.651 EO TSAL 0.463 0.062 7.522(0.000) 0.325
0.580 TFLS BP 0.277 0.112 2.487(0.013) 0.069
0.493 TSAL BP 0.021 0.129 0.161(0.872) -0.250
0.241 CI Bias corrected confidence interval. Bootstrapping based on n = 5000 subsamples.
R-squared Values: TFL = 0.288; TSAL = 0.215; BP = 0.330 Source: Survey Result (2014)
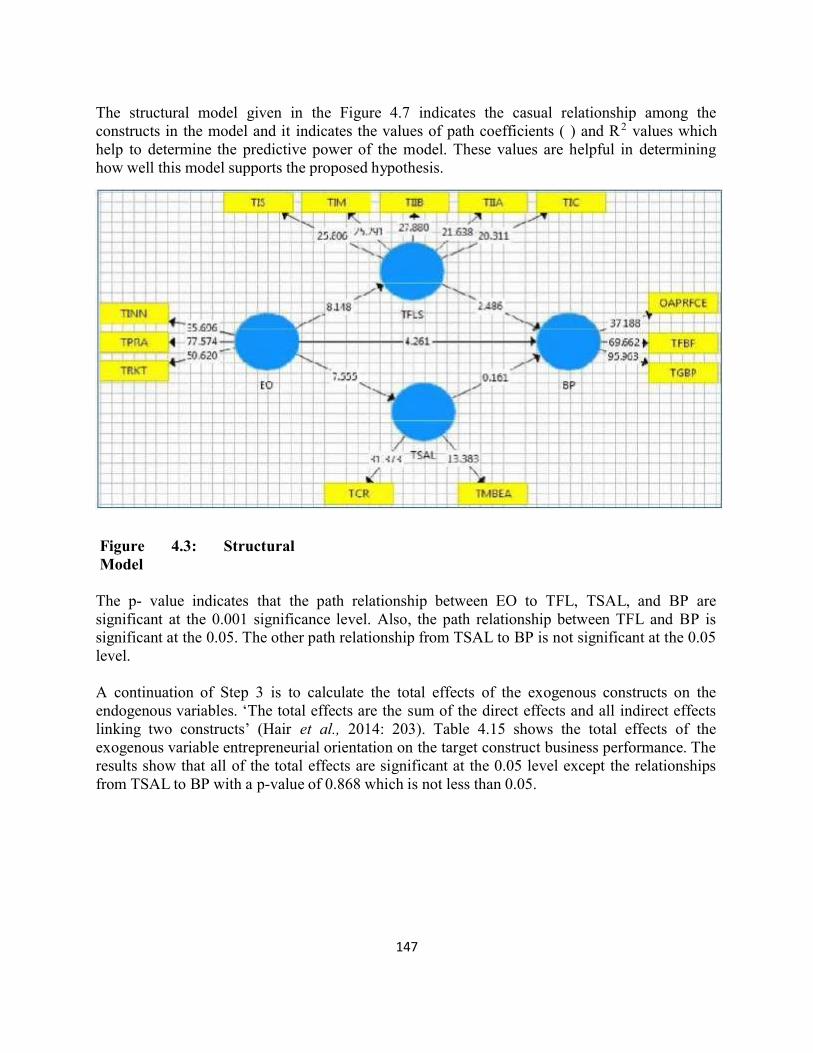
147
The structural model given in the Figure 4.7 indicates the casual relationship among the constructs in the model and it indicates the values of path coefficients ( ) and R2 values which help to determine the predictive power of the model. These values are helpful in determining how well this model supports the proposed hypothesis.
Figure 4.3: Structural Model The p- value indicates that the path relationship between EO to TFL, TSAL, and BP are
significant at the 0.001 significance level. Also, the path relationship between TFL and BP is significant at the 0.05. The other path relationship from TSAL to BP is not significant at the 0.05 level. A continuation of Step 3 is to calculate the total effects of the exogenous constructs on the endogenous variables. ‘The total effects are the sum of the direct effects and all indirect effects linking two constructs’ (Hair et al., 2014: 203). Table 4.15 shows the total effects of the exogenous variable entrepreneurial orientation on the target construct business performance. The results show that all of the total effects are significant at the 0.05 level except the relationships from TSAL to BP with a p-value of 0.868 which is not less than 0.05.
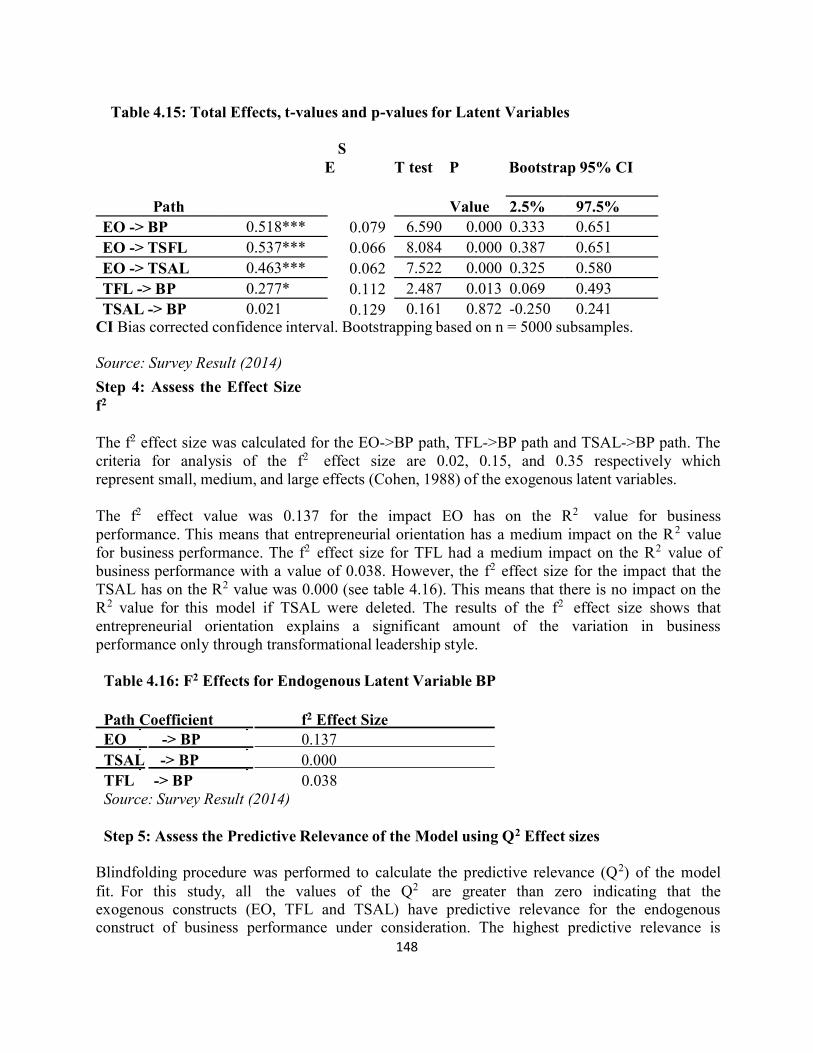
148
Table 4.15: Total Effects, t-values and p-values for Latent Variables S E T test P Bootstrap 95% CI
Path Value 2.5% 97.5% EO -> BP 0.518*** 0.079 6.590 0.000 0.333 0.651 EO -> TSFL 0.537*** 0.066 8.084 0.000 0.387 0.651 EO -> TSAL 0.463*** 0.062 7.522 0.000 0.325 0.580 TFL -> BP 0.277* 0.112 2.487 0.013 0.069 0.493 TSAL -> BP 0.021 0.129 0.161 0.872 -0.250 0.241 CI Bias corrected confidence interval. Bootstrapping based on n = 5000 subsamples. Source: Survey Result (2014)
Step 4: Assess the Effect Size f2 The f2 effect size was calculated for the EO->BP path, TFL->BP path and TSAL->BP path. The criteria for analysis of the f2 effect size are 0.02, 0.15, and 0.35 respectively which represent small, medium, and large effects (Cohen, 1988) of the exogenous latent variables. The f2 effect value was 0.137 for the impact EO has on the R2 value for business performance. This means that entrepreneurial orientation has a medium impact on the R2 value for business performance. The f2 effect size for TFL had a medium impact on the R2 value of business performance with a value of 0.038. However, the f2 effect size for the impact that the TSAL has on the R2 value was 0.000 (see table 4.16). This means that there is no impact on the R2 value for this model if TSAL were deleted. The results of the f2 effect size shows that entrepreneurial orientation explains a significant amount of the variation in business performance only through transformational leadership style.
Table 4.16: F2 Effects for Endogenous Latent Variable BP Path Coefficient f2 Effect Size
EO -> BP 0.137 TSAL -> BP 0.000
TFL -> BP 0.038 Source: Survey Result (2014) Step 5: Assess the Predictive Relevance of the Model using Q2 Effect sizes
Blindfolding procedure was performed to calculate the predictive relevance (Q2) of the model fit. For this study, all the values of the Q2 are greater than zero indicating that the exogenous constructs (EO, TFL and TSAL) have predictive relevance for the endogenous construct of business performance under consideration. The highest predictive relevance is

149
calculated for BP (0.255) and the lowest is for TSAL with (0.139). Q2 values that are higher than 0 suggest that the construct has predictive relevance and values less than zero suggest the construct lack predictive value. As can be seen in Table 4.17, all variables have predictive relevance. Table 5.28 compares R2 and Q2 of all endogenous variables. This comparison is important to this study because while R2 serves to determine the predictive relationships among constructs, Q2 helps to determine the accuracy of that prediction. A comparison therefore judges the accuracy of the predictive relationships between endogenous constructs in the model.
Table 4.17: Geisser’s Q2 Measure of Predictive Relevance (Blindfolding Results) and R2 Constructs SSO SSE Q² (=1-SSE/SSO) R2 BP 405.000 301.712 0.255*** 0.330*** EO Exogeneous variable Ind variable TFL 675.000 557.447 0.174 0.288*** TSAL 270.000 232.550 0.139 0.215***
Source: Survey Result (2014) 4.5 Goodness of Fit (GoF) of the Model Unlike the CB-SEM approach, PLS-SEM has only one measure of goodness of fit which was
defined by Tenenhaus et al. (2005) as the global fit measure (GoF). This measure is the geometric mean of the average variance extracted and the average R2 for the endogenous variables. To investigate the global validation of the PLS analysis, a global fit measure (GoF) was performed. GoF is calculated by the
following formula: The outcome of 0.464 (R2 average is 0.278 while the AVE average is 0.773) highlights that the model is above the required large effect sizes R2 value of 0.36. Therefore, the model has the capacity to support the overall PLS model (Wetzels et al., 2009). Table 4.18: Goodness of Fit Latent variables AVE R2 EO 0.861 Ind variable TFL 0.851 0.288 TSAL 0.715 0.215 BP 0.664 0.33 Average 0.773 0.278 Source: Survey Result (2014) GoF= √ . ∗ . =0.464
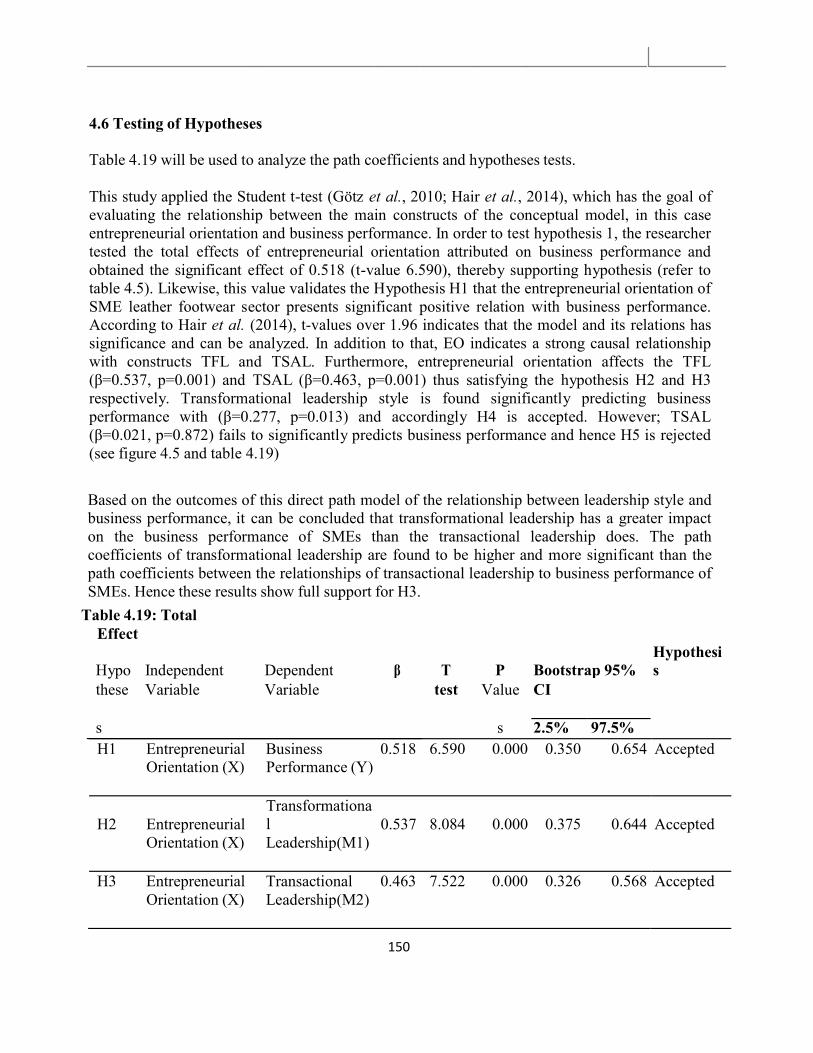
150
Hypothesi Hypo Independent Dependent β T P Bootstrap 95% s these Variable Variable test Value CI s s 2.5% 97.5%
4.6 Testing of Hypotheses Table 4.19 will be used to analyze the path coefficients and hypotheses tests. This study applied the Student t-test (Götz et al., 2010; Hair et al., 2014), which has the goal of evaluating the relationship between the main constructs of the conceptual model, in this case entrepreneurial orientation and business performance. In order to test hypothesis 1, the researcher tested the total effects of entrepreneurial orientation attributed on business performance and obtained the significant effect of 0.518 (t-value 6.590), thereby supporting hypothesis (refer to table 4.5). Likewise, this value validates the Hypothesis H1 that the entrepreneurial orientation of SME leather footwear sector presents significant positive relation with business performance. According to Hair et al. (2014), t-values over 1.96 indicates that the model and its relations has significance and can be analyzed. In addition to that, EO indicates a strong causal relationship with constructs TFL and TSAL. Furthermore, entrepreneurial orientation affects the TFL (β=0.537, p=0.001) and TSAL (β=0.463, p=0.001) thus satisfying the hypothesis H2 and H3 respectively. Transformational leadership style is found significantly predicting business performance with (β=0.277, p=0.013) and accordingly H4 is accepted. However; TSAL (β=0.021, p=0.872) fails to significantly predicts business performance and hence H5 is rejected (see figure 4.5 and table 4.19) Based on the outcomes of this direct path model of the relationship between leadership style and business performance, it can be concluded that transformational leadership has a greater impact on the business performance of SMEs than the transactional leadership does. The path coefficients of transformational leadership are found to be higher and more significant than the path coefficients between the relationships of transactional leadership to business performance of SMEs. Hence these results show full support for H3.
Table 4.19: Total Effect
H1 Entrepreneurial Business 0.518 6.590 0.000 0.350 0.654 Accepted
Orientation (X) Performance (Y) H2 Entrepreneurial
Transformationa l 0.537 8.084 0.000 0.375 0.644 Accepted
Orientation (X) Leadership(M1) H3 Entrepreneurial Transactional 0.463 7.522 0.000 0.326 0.568 Accepted
Orientation (X) Leadership(M2)
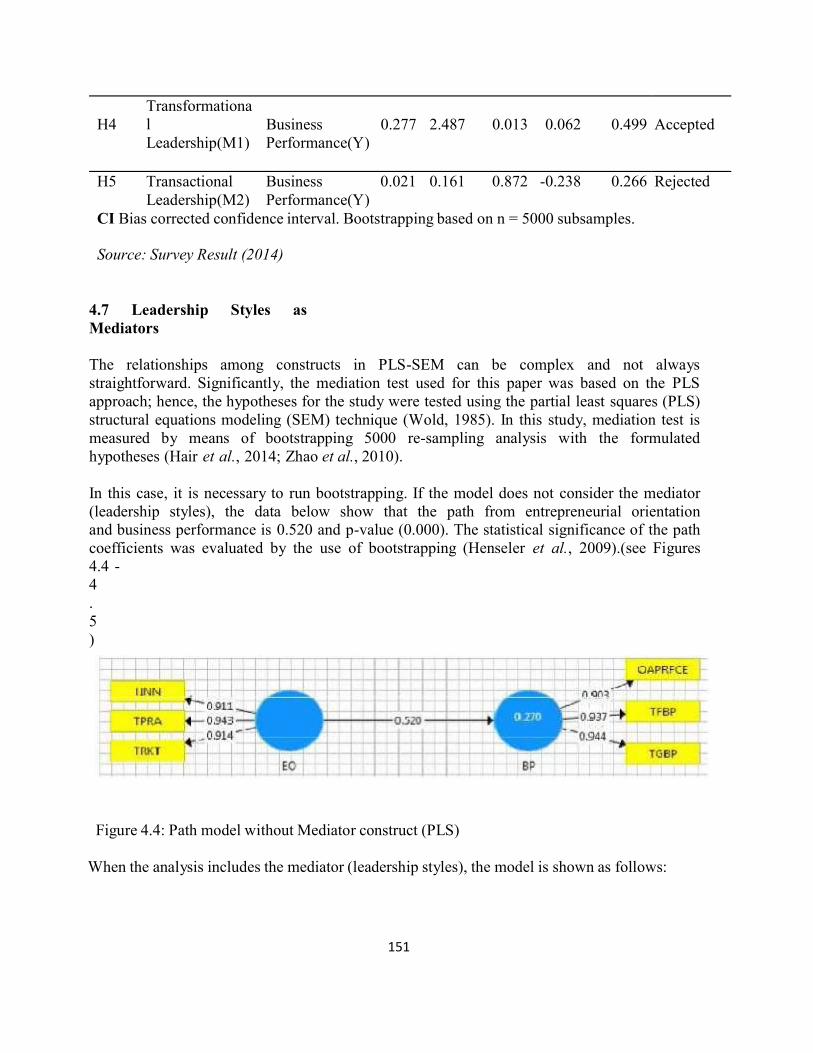
151
H4 Transformationa l Business 0.277 2.487 0.013 0.062 0.499 Accepted
Leadership(M1) Performance(Y) H5 Transactional Business 0.021 0.161 0.872 -0.238 0.266 Rejected
Leadership(M2) Performance(Y) CI Bias corrected confidence interval. Bootstrapping based on n = 5000 subsamples. Source: Survey Result (2014)
4.7 Leadership Styles as Mediators The relationships among constructs in PLS-SEM can be complex and not always straightforward. Significantly, the mediation test used for this paper was based on the PLS approach; hence, the hypotheses for the study were tested using the partial least squares (PLS) structural equations modeling (SEM) technique (Wold, 1985). In this study, mediation test is measured by means of bootstrapping 5000 re-sampling analysis with the formulated hypotheses (Hair et al., 2014; Zhao et al., 2010). In this case, it is necessary to run bootstrapping. If the model does not consider the mediator (leadership styles), the data below show that the path from entrepreneurial orientation and business performance is 0.520 and p-value (0.000). The statistical significance of the path coefficients was evaluated by the use of bootstrapping (Henseler et al., 2009).(see Figures 4.4 - 4.5)
Figure 4.4: Path model without Mediator construct (PLS) When the analysis includes the mediator (leadership styles), the model is shown as follows:
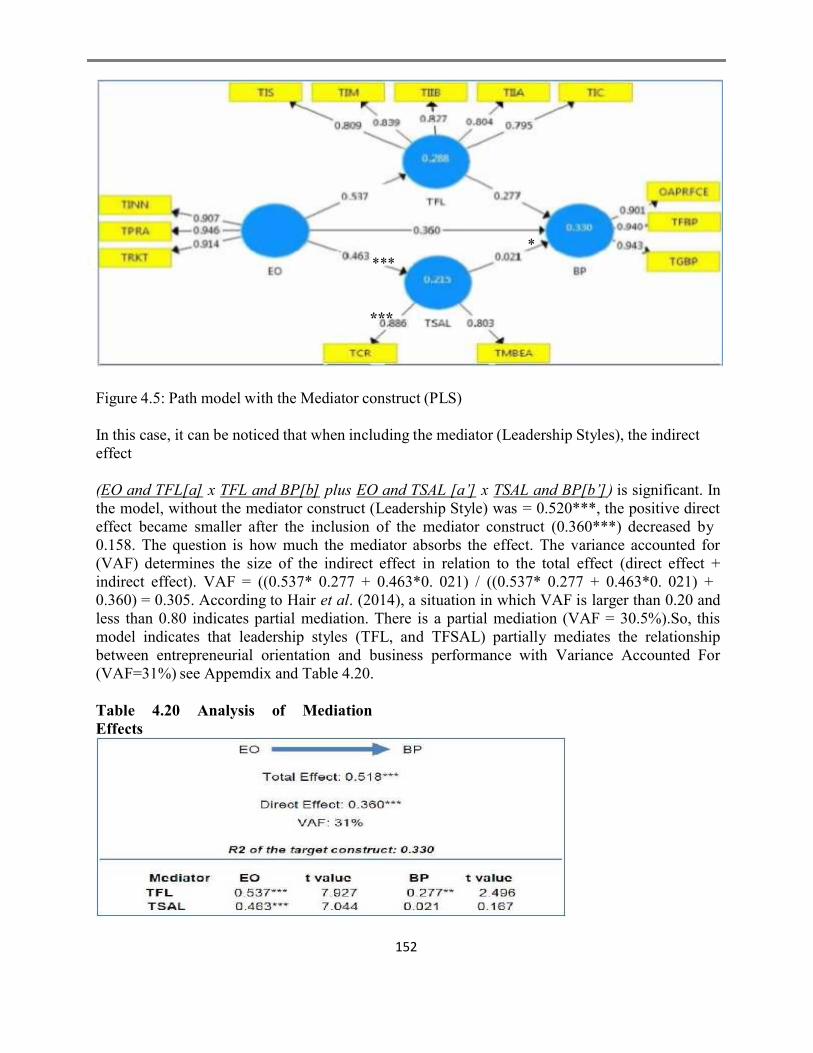
152
* ***
***
Figure 4.5: Path model with the Mediator construct (PLS) In this case, it can be noticed that when including the mediator (Leadership Styles), the indirect effect (EO and TFL[a] x TFL and BP[b] plus EO and TSAL [a’] x TSAL and BP[b’] ) is significant. In the model, without the mediator construct (Leadership Style) was = 0.520***, the positive direct effect became smaller after the inclusion of the mediator construct (0.360***) decreased by 0.158. The question is how much the mediator absorbs the effect. The variance accounted for (VAF) determines the size of the indirect effect in relation to the total effect (direct effect + indirect effect). VAF = ((0.537* 0.277 + 0.463*0. 021) / ((0.537* 0.277 + 0.463*0. 021) + 0.360) = 0.305. According to Hair et al. (2014), a situation in which VAF is larger than 0.20 and less than 0.80 indicates partial mediation. There is a partial mediation (VAF = 30.5%).So, this model indicates that leadership styles (TFL, and TFSAL) partially mediates the relationship between entrepreneurial orientation and business performance with Variance Accounted For (VAF=31%) see Appemdix and Table 4.20. Table 4.20 Analysis of Mediation Effects

153
VAF: Variance accounted for. *p < 0.10, **p < 0.05, ***p < 0.01; R2: Coefficient of Determination Source: Survey Result (2014) The researcher also assessed the effect of two mediators, transformational leadership and transactional leadership separately. The results show that the indirect effect of entrepreneurial orientation on business performance through transactional leadership style is non-significant. Transformational leadership style therefore plays the main role in the mediation effect between entrepreneurial orientation and business performance; however, both transactional leadership style and transformational leadership style combined significantly mediate the relationship between entrepreneurial orientation and business performance (see Table 4.21). As shown in the above table, to test SEM-PLS mediation, the researcher used the VAF method (Variance Accounted For) using the formula influence indirectly (indirect effect) divided the total influence (total effect). The total influence is direct influence added with indirect influence. If the VAF value above 80%, leadership style is as full mediator. If the value of the VAF 20%-80%, it is categorized mediator partial. However, if the VAF less than 20%, it is said to be virtually no effect of mediation (Hair et al., 2013:82). In testing the leadership styles as the influence mediator of entrepreneurial orientation and business performance, the calculation of VAF value can be seen in the table below:
Table 4.21: Mediation Analysis Table H4:
Mediation Paths Direct Effect, DE
Indirect Effect, IE
Total Effect
Bootstrap 95% CI
Indeffect Total
= Eff Lowe r
Higher
Leadership styles mediate the relationship between EO and BP EO>>LSPS>>BP.
0.360*** 0.159*** 0.519** *
0.074 0.248 0.306 Partial mediation
H4 a:
TFL mediates the relationship between EO and BP EO>>TFL>>BP.
0.360*** 0.149** 0.509** *
0.081 0.249 0.293 Partial mediation
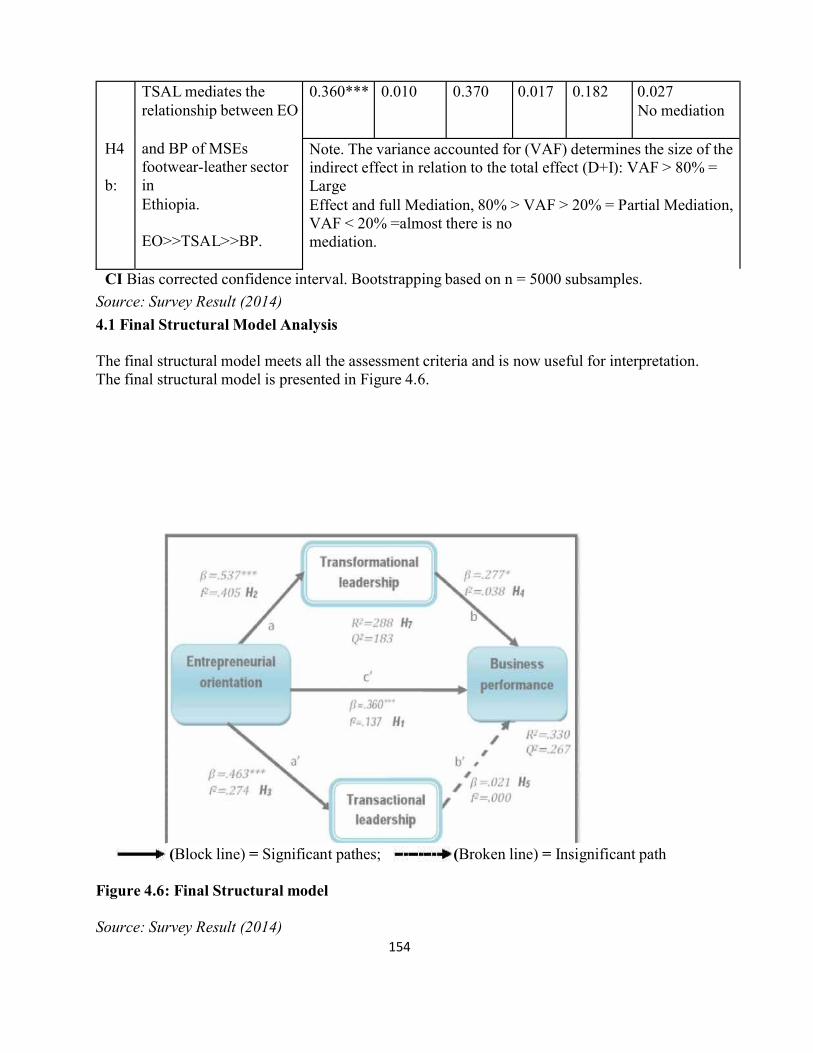
154
H4 b:
TSAL mediates the relationship between EO and BP of MSEs footwear-leather sector in Ethiopia. EO>>TSAL>>BP.
0.360*** 0.010 0.370 0.017 0.182 0.027 No mediation
Note. The variance accounted for (VAF) determines the size of the indirect effect in relation to the total effect (D+I): VAF > 80% = Large Effect and full Mediation, 80% > VAF > 20% = Partial Mediation, VAF < 20% =almost there is no mediation.
CI Bias corrected confidence interval. Bootstrapping based on n = 5000 subsamples. Source: Survey Result (2014) 4.1 Final Structural Model Analysis The final structural model meets all the assessment criteria and is now useful for interpretation. The final structural model is presented in Figure 4.6.
(Block line) = Significant pathes; (Broken line) = Insignificant path Figure 4.6: Final Structural model Source: Survey Result (2014)
155
5. Discussion, Conclusion, and Recommendations 5.1 Discussion of Findings The purpose of the study was to examine the mediating effect of leadership styles in the relationship between entrepreneurial orientation and business performance of MSE leather footwear sector in Ethiopia. It was also designed to examine the effects of these variables on business performance. The new knowledge gained through this study is envisaged to increase understanding of leadership styles and entrepreneurial orientation in explaining business performance. The main objective of this chapter is to discuss the findings presented in Chapter four in relation to the research questions and hypotheses developed. The first section of this chapter provides a key descriptive summary that are palpably suitable for further elaboration. It also includes the significant results of the PLS-SEM on the main variables of the hypotheses testing. There were 143 usable survey questionnaires in this study. These were examined for accuracy of data entry, non-response bias, missing values, reliability, and validity; 135 were without outlier data and used for hypotheses testing. The reliability and validity were consistent with previous studies involving two of the instruments used: the Multifactor Leadership Questionnaire (MLQ) (Bass and Avolio, 1995) and the Entrepreneurial Orientation Questionnaire (EOQ) (Covin and Slevin, 1989). The business performance scale also showed high reliability and inter-item correlations. 5.1.1 Discussion of Main Variables and Hypotheses Results This study used the EOQ to study the entrepreneurial orientation of MSEs in Ethiopia. The three dimensions measured by the instrument are innovation, proactiveness, and risk-taking. A large proportion of entrepreneurship studies assume entrepreneurial orientation to be a unitary concept (Covin and Slevin, 1989; Dess et al., 1997; Wiklund, 1999). The notion of a single factor entrepreneurial orientation concept also has been examined in some studies. Because the three dimensions of entrepreneurial orientation can vary independently of one another (Krauss et al., 2005; Kreiser et al., 2002; Lumpkin and Dess, 1996; Lyon et al., 2000; Venkatraman, 1989), this study included a comparison of the dimensions of entrepreneurial orientation and total entrepreneurial orientation with other variables. A comparison of the three dimensions of entrepreneurial orientation (N = 135) showed that the mean for innovation (M = 3.74) was higher than the mean for proactiveness (M = 3.73) and for risk-taking (M = 3.56). Total entrepreneurial orientation had a mean of 3.68 and a standard deviation of 0.85. These results are similar to those of Covin and Slevin (1989) who reported that the scale had a mean of 4.33 and a standard deviation of 1.23. In another study, Covin et al. (2006) found that the scale (1 to 7) had a mean of 4.05 and a standard deviation of 1.08. These results were similar to those reported by Yang (2008) and Yoo (2001). Eventhough Yang (2008) used a different scale (1 to 7) to compare the means of entrepreneurial orientation variables between low and high business performance, he also found that in both categories (low and high business performance), innovativeness scored the highest mean, followed by proactiveness and risk taking.
156
Owners and top managers of MSEs in Ethiopia seem to understand the benefits and advantages of producing and promoting new products or services and becoming the market leader. This influences their perception of the greater importance of innovativeness and proactiveness than risk-taking. Innovativeness and proactiveness are also thought to be critical for MSEs in Ethiopia to remain competitive, and to sustain organisational performance (Mahmod et al., 2013). With regard to the performance measures of the MSEs of the leather footwear sector, the overall mean of business performance was 2.95 (M = 2.95). Of the two business performance measures adopted in this study, growth scored a higher mean than financial performance (see Table 5.14). These results indicate that the owner/managers of MSEs in Ethiopia perceive growth performance as a more desirable goal than the firm’s financial performance. Perhaps due to the relatively small size of their firms, the respondents consider the most important organisational outcomes to be expanding their market share, stabilizing their operation and improving the economies of scale. They believe that financial performance (profits) will materialize once all of these are achieved. 5.2 Conclusion This study examined the mediating effects of leadership styles on the relationship between entrepreneurial orientation and performance of MSEs in Ethiopia. An important conclusion to be drawn from this study is that entrepreneurial orientation has a significant positive effect on business performance. Of the three dimensions of entrepreneurial orientation, the attribute that contributed the most to high business performance was risk-taking. Innovation and proactiveness were not significant contributors to predicting business performance, but they were certainly positively correlated in a significant way with business performance. In general, entrepreneurial orientation contributed to improved business performance. This suggests that, as the entrepreneurial orientation level increases, the degree of business performance also rises. It can be concluded that the entrepreneurial orientation of the owners/managers can influence the success and survival of the MSEs. The present study also found that, while different leadership styles may affect business performance in different ways, in general transformational leadership has a bigger effect on business performance than transactional leadership styles and partially mediates the relationship between entrepreneurial orientation and business performance. However, transactional leadership style is not a mediator at all as its relationship to business performance is significant. Based on the hypothesis tests, positive, significant and strong relationships were found between transformational leadership styles and business performance. Thus, as the use of level of the transformational leadership styles risen, the degree of business performance also increased. However, when leadership style is tested as a mediator of entrepreneurial orientation and performance, the present result demonstrates only partial mediation. Nevertheless, the studies in the literature reviewed indicate that leadership styles can fully mediate the relationship between entrepreneurial orientation and business performance, if there are efforts to upgrade the entrepreneurial characteristics of MSE owners/managers.
5.3 Contributions and Recommendations The study has made theoretical contributions and drawn implications for management. These
157
contributions and implications are based on the conclusions as discussed in the previous sections. 5.3.1 Theoretical Contributions and Recommendations As indicated earlier, this research demonstrates support for the first three hypotheses; that entrepreneurial orientation, the propensity of a firm to be innovative, proactive, and willing to take risks (Lumpkin and Dess, 1996), has a positive relationship with the performance of the firm (H1); that an entrepreneurial orientation has a positive relationship bothe with transformational and transactional leadership styles of the firm owners/managers (H2); that transformational leadership style has a significant positive relationship with the performance of the firm (H3), however, transactional leadership style has insignificant positive relationship to business performance and hence H5 is rejected. Mizik and Jacobson (2003) suggest that an entrepreneurial orientation may be a prime requisite to attain above average returns. A low level of entrepreneurial orientation may be part of the reason why the majority of business start- ups are dissolved within four years (Knaup, 2005; Timmons, 1999), a disconcerting fact since net new job creation is a result of small business activities (Timmons, 2007). The effect of leadership style as a mediator between the entrepreneurial orientation and firm performance (H7) and (H8) was partially supported. More specifically, transformational leadership style partialy mediates the relationship between entrepreneurial orientation and firm performance, while leadership style has no mediation at all between the EO and BP. The results of this research indicate that a higher level of entrepreneurial orientation with a transformational leadership style results in significantly higher firm performance. This framework augments the existing body of knowledge in the area of leadership and entrepreneurship in confirming the applicability of these Western-developed concepts to the context of a developing country such as Ethiopia. In addition, the assessment of leadership style and entrepreneurial orientation as resources and capabilities from the RBV perspective enables a conclusive examination of whether transformational, transactional leadership and each factor of entrepreneurial orientation impact organisational performance of MSEs in Ethiopia. It can be concluded that transformational leadership style and entrepreneurial orientation are important resources and capabilities that enhance and sustain business performance. It was hypothised that both transformational and transactional leadership styles have significant positive relationships with measures of business performance. However, the empirical hypothesis testing result provided evidence that leaders of MSEs in Ethiopia perceive themselves as practicing transformational leadership style which was found to have a significant positive effect on performance unlike transactional leadership style, which had a zero effect on business performance as shown in the effect size f2(See Table 4.27). This study also makes a significant contribution to the field of entrepreneurship in the context of a developing country. The results provide evidence that entrepreneurial orientation is an important strategic orientation for small and medium-sized enterprises, and the effect of each factor of entrepreneurial orientation varies independently. Quantitative data provided significant evidence that leaders of MSEs in Ethiopia believe that they are practicing this strategic orientation in their organisation. Empirical findings demonstrated positive association between each factor of entrepreneurial orientation and growth. But only risk-taking was found to have significant positive effects on financial and Growth performance. Thus, the development of this
158
strategic orientation improves business growth and financial performance. The central finding of this study is an outcome of the intention to study the leadership styles as a mediating mechanism to enrich existing theoretical models of the direct relationship between entrepreneurial orientation and business performance. Despite the independent links established between entrepreneurial orientation and performance (As-Sadeq and Khoury, 2006; Ling et al., 2008; Lo et al., 2010) and between leadership styles and performance (Moreno and Casillas 2008; Rauch et al., 2009; Wiklund, 1999), very few studies have examined the relationships between these three variables simultaneously (Todorovic and Schlosser, 2007; Yang, 2008, Arham and Muenjohn, 2012). Therefore, a further understanding of the relationships between these variables (EO, leadership style, and business performance) adds new knowledge to the leadership and entrepreneurship literature in the context of MSEs in Ethiopia. It was found out that transformational leadership style is a partial mediator between entrepreneurial orientation and business performance of the MSEs footwear leather sector in Ethiopia. This signifies that an organisation’s strategies to expand the business and to earn more profits may be realized not only through entrepreneurial orientation but also by means of the development of appropriate leadership skills (In this case transforamational leadership style). This indicates that the factors of entrepreneurial orientation are effectively compatible with transformational leadership styles to enhance higher business performance. 5.3.2 Managerial/Practical Implications and Recommendations The core objective motivating this study was to come up with leadership styles that might be beneficial to and practical for MSEs in the manufacturing footwear and leather industries. The findings of this lead to the important conclusion that the entrepreneurial orientation and transformational leadership style of owners/managers are important variables that affect a firm’s growth and financial performance. One important fact to consider based on this research is that a firm‘s entrepreneurial orientation is positively related to the firm‘s performance. This suggests that the firm and its managers may benefit from implementing a strategy to encourage and increase the firm‘s level of entrepreneurial orientation, which has been shown to be the propensity of the firm to be innovative, proactive to marketplace opportunities, and be willing to take risks. It is hoped that the outcomes of this study will help to fill the gap in the understanding of the leadership style of Ethiopian business leaders, particularly in the context of MSEs of the leather footwear manaufacturing sector. The study concludes that leaders of MSEs in Ethiopia practice transformational leadership style more than transactional leadership style. The transformational leadership style had significant positive effect on firm growth and financial performance. This study suggests that, of the two types of leadership style, transformational leadership is more efficient form of leadership style. Thus, leaders of MSEs in Ethiopia need to display, practice and nurture the qualities of transformational leadership to improve the performance of their organisation. The qualities associated with transformational leadership elevate the level of motivation of employees and encourage them to reach their full potential. At a more practical level, the outcomes from this study have significant implications for the development of entrepreneurs in Ethiopia. FeMSEDA of Ethiopia, which is the governing body
159
that oversees entrepreneurial development in Ethiopia, should provide more leadership trainings and development programs for entrepreneurs. The training should focus on developing and nurturing the transformational leadership qualities and entrepreneurial orientation dimensions of entrepreneurs. A specific leadership training courses based on entrepreneurial orientation and transformational leadership should be mandated for all entrepreneurs who received assistance from any of the entrepreneurial development agencies in the country, such as Entrepreneurship Development Centre/EDC-Ethiopia and other donor organizations like UNDP. To further improve the performance of MSEs, they need to develop their entrepreneurial orientation. Continuing support and assistance from the government and financial institutions would definitely help these enterprises to fully engage in innovation and other proactive activities and thus allow them to venture into risky territory with a high potential for profits. Another practical implication for Ethiopian entrepreneurs is that the results of this study provide a clear indication that their perceptions are not much different from those of their counterparts in Western countries. These results should be taken as an eye-opener for Ethiopian entrepreneurs to believe that they can compete locally and globally, on par with competitors from across the world. The results from this study are consistent with those of existing western studies, namely that: (1) transformational leadership is more effective than transactional leadership and (2) entrepreneurial orientation is an important attribute for an entrepreneurial firm (Arham and Muenjohn, 2012). In order to achieve success as outlined by the government, MSEs in Ethiopia need to have high ambition and be confident to expand their business and compete internationally. The final practical implication of this study pertains to the relevance of other African countries. Because of the cultural similarities that are shared, neighboring countries such as Eritrea, Kenya, Djibouti, and Sudan could definitely benefit from the outcomes of this study of an emerging economy context. 5.4 Directions for Future Research The findings of this study provide several opportunities for future research. It is hoped that despite their limitations, the findings of this study will indicate directions for further research. First, the inclusion of some environmental factors that affect the performance of entrepreneurial ventures might provide useful insights. As Kreiser et al. (2002) found environmental munificences encourage entrepreneurial orientation in predicting better business performance. Second, a longitudinal study would enable greater understanding of the leadership and entrepreneurial processes as it could measure leadership effects and the development of entrepreneurial ventures at different points in time. Thus, it would provide valuable information about variations in performance as a firm moves through different stages. Third, to improve the model, the element of culture could be incorporated. House et al. (1999) suggested that cultural difference might influence the way people perceive their leaders. Ogbanna and Harris (2000) found that organisational culture and leadership are related, and the relationship between leadership and organisational performance is mediated by the organisational culture. Thus, the inclusion of culture could further explain the relationship between leadership styles and business performance. Fourth, from an academic point of view, future research should take into account two more variables of the entrepreneurial orientation dimensions suggested by Lumpkin and

160
Dess (1996) namely: autonomy and competitive aggressiveness. Finally, it is also recommended that future research should consider exploring the leadership styles of MSE managers from employees’ perspective. A study comparing leadership effectiveness using self ratings of MSE leaders and employees’ relevant perceptions of the leaders might produce a better understanding of how performance of MSEs could be further improved by using quantitative and qualitative analysis rather than using only quantitative one. 5.5 Limitations of the Study All research has its limitations. The ability of a study to acknowledge its limitations is part of the strength of the research undertaking (Dolen, Ruyter, and Lemmink, 2004). There are several limitations in regard to what was compiled, analyzed, presented and discussed in this study. These limitations are identified in this section. First, this study relied on self-reported data from individual informants. All measures on leadership style, entrepreneurial orientation and business performance were evaluated by the leather footwear owner/managers of MSEs in Ethiopia. The informants may have exaggerated their evaluation of their own leadership style, their firm’s entrepreneurial orientation and their business performance. Thus, the findings must be interpreted in the light of this limitation; eventhough the Harman’s one-factor test showed that common method bias was not an issue in this study. The significant positive relationships between entrepreneurial orientation and measures of business performance and leadership styles, and the relationships between each factor of entrepreneurial orientation and measures of organisational performance should be discounted accordingly. . Second, this study adopted subjective measures. However, Moers (2000) argued that the use of subjective performance measures might encourage performance evaluation bias. This potential bias is acknowledged as a methodological consequence. As Zulkiffli and Parera (2011) indicated in the context of measuring the business performance of MSEs, subjective measures tend to be used since many MSEs refuse to publicly reveal their actual financial performance. Besides, Dess and Robinson (1984) mentioned that objective data may not fully represent an organisation’s actual performance, even if they are available, since the managers may manipulate the data in order to avoid personal or corporate taxes. Song et al. (2005) also suggested that subjective measures could be an effective approach to evaluate business performance as they allow comparisons to be made across firms and contexts, such as industry types and economic conditions. Finally, the cross-sectional design used in this study provides only a snapshot view of the researched phenomena where data from all measures were collected at the same time. Thus, causal inferences could not be drawn from this research. The use of longitudinal data would provide a remedy for this limitation when data on independent variables and dependent variables are measured at two or more points in time. Therefore, in view of the acknowledged potential limitations, the reader is recommended to approach the findings with some caution.
161
References Abu Bakar, J., Mad, C.A. & Abdul Latif, R. (2006). 'Liberalization and globalization: A case of Naza and a lesson to SME', paper presented to Persidangan Kebangsaan IKS (National Conference of SME) 2006, Kuala Lumpur.
Aregawi, G.T. & Tilaye, K. (2014). ‘Entrepreneurial Orientation as Growth Predictor of Small Enterprises Evidence from Tigray Regional State of Ethiopia’, Developing Country Studies, 4(11): 133-143.
Arham, A.F. & Muenjohn, N. (2012). ‘Leadership and organisational performance in Malaysian SMEs: The mediating role of entrepreneurial orientation’. Business and Information, 2(12):31–41.
Ayman, R. & Korabik, K. (2010). ‘Leadership: Why gender and culture matter', American Psychologist,65(3): 157-70.
Barney, J. (1991). 'Firm resources and sustained competitive advantage', Journal of Management, 17(1): 99-120. Bass, B.M. & Avolio, B.J. (1990). ‘The Implications of Transactional and Transformational Leadership for Individual, Team, and Organizational Development', in W Pasmore & RW Woodman (eds), Research
in Organizational Change and Development, Jai Press, Greenwich, CT. Bass, B.M. & Avolio, B.J. (1995/2004). Multifactor Leadership Questionnaire. Manual and
Sampler Set, 3rd edn, Mindgarden, Redwood City, CA. Bass, B.M. & Riggio, R.E. (2012). Transformational Leadership, 2nd edn, Taylor & Francis, New Jersey. Bass, B.M. (1985). Leadership and Performance beyond Expectations. The Free Press, New York, NY. Bass, B.M. (2000). ‘The future of leadership in learning organizations', Journal of Leadership &
Organizational Studies, 7(3): 17-40. Bass, B.M., Avolio, B.J., Jung, D.I. & Berson, Y. (2003). Predicting unit performance by
assessing transformational and transactional leadership. Journal of Applied Psychology, 88, 207-218.
Beaver, G. (2003). ‘Small business: Success and failure', Strategic Change, 12(3): 115-22. Bettis, R.A. & Hitt, M.A. (1995). ‘The new competitive landscape’, Strategic Management Journal,16(2):7-19. Burns, J. 1978. Leadership, Harper and Row, New York, NY. Chin, W.W. & Newsted, P.R. (1999). ‘Structural equation modeling analysis with small samples
using partial least squares’ in Statistical strategies for small sampleresearch, ed. R.H. Hoyle, Sage, Thousand Oaks, 307-341
Clough, P. & Nutbrown, C. (2002). A student guide to methodology (2nd Ed). London: SAGE Publication Ltd. Covin, J.G. & Covin, T. (1990). ‘Competitive aggressiveness, environmental context, and small firm
performance’, Entrepreneurship Theory and Practice, 14(4): 35-50. Covin, J.G. & Slevin, D.P. (1989). 'Strategic management of small firms in hostile and benign environments',
Strategic Management Journal, 10(1): 75-87. Covin, J.G. & Slevin, D.P. (1991). ‘A conceptual entrepreneurship as firm

162
behavior’,Entrepreneurship Theory and Practice, 16(1):7-25. Covin, J.G. & Wales, W. (2012). 'The measurement of entrepreneurial orientation’,
Entrepreneurship Theory and Practice, 36(4): 677-702. Covin, J.G., Green, K.I.M. & Slevin, D.P. (2006). Strategic process effects on the entrepreneurial
orientation – sales growth rate relationship. Entrepreneurship Theory and Practice, 30(1), 57-81.
Covin, J.G., Slevin, D.P. & Schultz, R.L. (1994). Implementing Strategic Missions: Effective Strategic. Structural and Tactical Choices. Journal of Management Studies, 3(1): 481- 505.
Creswell, J.W. (2009). Research design: Qualitative, quantitative and mixed methods approaches. 3rd Edn., Los Angeles: Sage Publications Ltd.
Dawit, E. (2007). Entrepreneurial Success in Small Enterprises: Empirical Study on Sample Entrepreneurs in Addis Ababa, Masters Thesis. SEPT University of Bremen, Germany.
Dess, G.G. & Beard, W.W. (1984). ‘Dimensions of organizational task environments’, Administrative Science Quarterly, 29(1): 52-73.
Dess, G.G. & Robinson, J.R.B. (1984). ‘Measuring organizational performance in the absence of objective measures: The case of the privately-held firm and conglomerate business unit', Strategic Management Journal, 5(3): 265-73.
Dolen, W., Ruyter, K. & Lemmink, J. (2004). 'An empirical assessment of the influence of
customer emotions and contact employee performance on encounter and relationship satisfaction', Journal of Business Research, 57: 437-44.
Edmondson, A.C. & Mcmanus, S.E. (2007). Methodological fit in management field research. Academy of Management Review, 32(4):1155-1179.
Eshetu, B. & Zeleke, W. (2008). ‘Factors that affect the long-term survival of micro, small and medium enterprises in Ethiopia’, South African Journal of Economics 76:3.
Fiedler, F.E. (1967). A theory of Leadership Effectiveness, New York: McGraw-Hill. Fornell, C. & Larcker, D. (1981). ‘Structural equation models with unobservable variables and
measurement error', Journal of Marketing Research, 18(1): 39-50. Frankfort-Nachmias, C. & Nachmias, D. (2000). Research methods in the social sciences (6th
ed.). New York: Worth. Galbreath, J. (2005). ‘Which resources matter the most to firm success? An exploratory study of
resource-based theory', Technovation, 25 (9): 979-87. Gerbing, D.W. & Anderson, J.C. (1988). ‘An Updated Paradigm for Scale Development
Incorporating Unidimensionality and its Assessment,’ Journal of Marketing Research, 25(2): 186-192.
Ghobadian, A.& Gallear, D. (1996). Total quality management SMEs. Omega, 24(1):72-83. Götz, O., Liehr-Gobbers, K. & Krafft, M. (2010). Evaluation of structural equation models using
the partial least squares (PLS) approach. In V. Esposito Vinzi, W.W. Chin, J. Henseler, H. Wang (Eds.), Handbook of partial least squares (pp. 691-711). Berlin, Heidelberg: Springer.
Grant, R.M. (1991). ‘The resource-based theory of competitive advantage: implications for
163
strategy formulation’, California Management Review, 33 (3): 114-135. Gupta, A.K. & Govindarajan, V. (1984). Business unit strategy, managerial characteristics, and
business unit effectiveness at strategy implementation. Academy of Management Journal, 27: 25-41.
Habtamu, T., Aregawi, G. & Nigus, A. (2013). Growth Determinants of micro and Small Enterprises: Evidence from Northern Ethiopia. Journal of Economics and Sustainable Development, 4(9),128-135.
Hair, J.F. Anderson, R.E., Tatham, R.L. & Black, W.C. (1998). Multivariate Data Analysis, 5th edn, Prentice Hall, Upper Saddle River, NJ.
Hair, J.F., Hult, G.T.M., Ringle, C.M. & Sarstedt, M. (2014). ‘A Primer on Partial Least Squares Structural Equation Modelling (PLS-SEM), Sage, Thousand Oaks.
Hair, J.F., Hult, G.T.M., Ringle, C.M. & Sarstedt, M. (2016). A Primer on Partial Least Squares Structural Equation Modeling (PLS-SEM), Sage, Thousand Oaks.
Hair, J.F., Ringle, C.M. & Sarstedt, M. (2011). PLS-SEM: Indeed a silver bullet. Journal of Marketing T heory and Practice, 19:139-151.
Hayes, A.F. (2009). Beyond Baron and Kenny: statistical mediation analysis in the new millennium.
Communication Monographs, 76: 408-420.Hayes, R.H., Pisano, G.P. & Upton, D.M. (1996). Strategic Operations: Competing Through Capabilities (Text and Cases), The Free Press, New York, NY.
Hilmi, M.F., Ramayah, T., Mustapha, Y. & Pawanchik, S. (2010). ‘Product and process innovativeness: Evidence from Malaysian SMEs', European Journal of Social Sciences,16(4): 547-55.
Hoe, S. (2008). ‘Issues and procedure in adopting structural equation modeling technique', Journal of Applied Quantitative Methods, 3(1): 76-83.
Howell, J.M. & Hall-Merenda, K.E. (1999). ‘The ties that bind: The impact of leader–member exchange, transformational and transactional leadership, and distance on predicting follower performance', Journal of Applied Psychology, 84: 680-94.
ILO. (2003a). Ethiopian Women Entrepreneurs: Going for Growth. ILO Sub-regional Office, Addis Ababa and Ministry of Trade and Industry, Women’s Affairs Department in association with SEED, ILO, Geneva.
Isobe, T., Makino, S. & Montgomery, D. (2004). ‘Exploitation, Exploration, and Firm Performance: The case of Small Manufacturing Firms in Japan'.
Jeswal, R. (2012). Role of SME in Indian economy. National conference on emerging challenges for sustainable business, 1(1): 289–310.
164
Johnson, R.B. & Onwuegbuzie, A.J. (2004). ‘Mixed methods research: A research paradigm
whose time has come', Educational Researcher,33(7): 14-26. Keh, H.T., Nguyen, T.M. & Ng, H.P. (2007).'The effects of entrepreneurial orientation and
marketing information on the performance of SMEs', Journal of Business Venturing, 22(1): 592-611.
Kirkbride, P. (2006). Developing transformational leaders: the full range leadership model in action. Industrial and commercial Training, 38(1): 23-33.
Knaup, A.E. (2005). ‘Survival and longevity in the business employment dynamics database’, Monthly Labor Review, 128(2): 50-56.
Kreiser, P.M., Marino, L.D. & Weaver, K.M. (2002). 'Assessing the psychometric properties of the entrepreneurial orientation scale: A multi-country analysis', Entrepreneurship Theory and Practice, 1(1): 71-94.
Krejcie, R.T.V. & Morgan, D.W. (1970). Determining sample size for research activities educational and psychological measurement, 30(1): 607-610.
Kumar, R. 2005. Research Methodology: A step by step guide for beginners. London: Sage Publication. Lee, C., Lee, K. & Pennings, J.M. 2001. 'Internal capabilities, external networks, and performance:
a study on technology-based ventures', Strategic Management Journal, 22(6/7): 615-640.
Lee, S.M. & Lim, S. 2009. ‘Entrepreneurial orientation and the performance of service business’, Service Business, 3(1): 1-13.
Luetkenhorst, W. 2004. ‘Corporate social responsibility and the development agenda: The case for actively involving small and medium enterprises', Intereconomics, 39(3): 157-66.
Lumpkin, G.T. & Dess, G.G. 1996. 'Clarifying the entrepreneurial orientation Construct and linking it to performance', The Academy of Management Review, 21(1): 135-72.
Lumpkin, G.T. & Dess, G.G. 2001. ‘Linking Two Dimensions of Entrepreneurial Orientation to Firm Performance: The Moderating Role of Environment and Industry Life Cycle’, Journal of Business Venturing, 16(5): 429–451.
Lyon, D.W., Lumpkin, G.T. & Dess, G.G. 2000. 'Enhancing entrepreneurial orientation research: Operationalizing and measuring a key strategic decision making processes, Journal of Management, 26(5): 1055-1085.
MacKinnon, D.P., Fairchild, A.J. & Fritz, M.S. 2007. Mediation analysis. Annual Review of Psychology, 58: 593–614.
Mahoney, J.T. & Pandian, J.R. 1992. ‘The resource-based view within the conversation of strategic management', Strategic Management Journal, 13: 363 – 80.
Miller, D. 1983.’The Correlates of Entrepreneurship in Three Types of Firms’, Management Science, 29(7): 770–791.
Miller, D. Friesen, P.H. 1982. ‘Innovation in conservative and entrepreneurial firms: two models of strategic momentum’, Strategic Management Journal, 3(1): 1–25.
Moers, F. 2000. 'Financial and non-financial performance measures and managerial short-term orientation: The interactive effect of performance targets'.MoFED, 2006. Ethiopia: Building
165
on Progress A Plan for Accelerated and Sustained Development to End Poverty (PASDEP) (2005/06-2009/10). Volume i: Main text Ministry of Finance and Economic Development (MoFED), Addis Ababa, Ethiopia.
MoFED, 2010. Growth and Transformation Plan (2010/11-2014/15). Volume i: Main text Ministry of Finance and Economic Development (MoFED), Addis Ababa, Ethiopia.
Moreno, A.M. & Casillas, J.C. 2008. ‘Entrepreneurial orientation and growth of SMEs: A causal model',
Entrepreneurship Theory and Practice, 32(3): 507-28. MUDC, 2013. Survey on Micro and Small Scale Enterprises in Selected Major cities of Ethiopia.
Addis Ababa, Ethiopia. Naman, J.L. & Slevin, D.P. 1993. ‘Entrepreneurship and the concept of fit: A model and empirical tests’,
Strategic Management Journal, 14(2): 137–153. Nega, F. & Hussein, E. 2014. Research Proposal On: Small and Medium Enterprises access to
finance in Ethiopia: A synthesis of supply and demand, 15th Annual conference Global Development Network, Accra, Ghana.
Newman, I. & Benz, C.R. 1998. Qualitative - quantitative research methodology: Ogbonna, E. & Harris, L.C. 2000. ‘Leadership style, organizational culture and performance:
empirical evidence from UK companies’, Int. J. of Human Resource Management, 11(4): 766–788.
Panitchpakdi, S. 2006. Statements at the 10th Session of the Commission on Enterprise, Business Facilitation and Development, Secretary-General of UNCTAD, Geneva.
Prahalad, C.K. & Hamel, G. 1990. ‘The core competence of the corporation', Harvard Business Review, 79-91. Preacher, K.J. & Hayes, A.F. 2008. Asymptotic and resampling strategies for assessing and comparing indirect
effects in multiple mediator models. Behaviour Research Methods, 40(3), 879-891. Rauch, A., Wiklund, J., Lumpkin, G.T. & Frese, M. 2009. 'Entrepreneurial orientation and
business performance: An assessment of past research and suggestions for the future', Entrepreneurship Theory and Practice, 33(3): 761-87.
Rigdon, E.E. 1998. Structural Equation Modeling.’ In GA Marcoulides (ed.), Modern Methods for Business Research, 251-294. Lawrence Erlbaum Association, London.
Roscoe, J.T. 1975. Fundamental Research Statistics for the Behavioural Sciences, 2nd edn, Holt Rinehart & Winston, New York.
Rosenberg, M. 1968. The logic of survey analysis. New York: Basic Books. Roslan, A.A. 2010. The mediating effects of Entrepreneurial orientation on the relationship
between leadership styles and performance of SMEs in Malaysia; Doctoral Dissertation. Rucker, D.D., Preacher, K.J., Tormala, Z.L. & Petty, R.E. 2011. ‘Mediation Analysis in Social
Psychology: Current Practices and New Recommendations’, Social and Personality Psychology Compass,5(6): 359-371.
Saleh, A.S. & Ndubisi, N.O. 2006. ‘An evaluation of SME development in Malaysia', International Review of Business Research Papers, 2(1): 1-14.
166
Sang, S., Lee, J.D. & Lee, J. 2010. E-government adoption in Cambodia: a partial least squares approach. In: Transforming government: people, process, and policy, Emerald Group Publishing Limited, Bingley, 138-157.
Sekaran, U. & Bougie, R. 2010. Research Methods for Business: A Skill Building Approach, 5th edn, John Wiley &Sons, United Kingdom.
Sekaran, U. 2003. Research Methods for Business, skill based approach. 4th ed., John Wiley and Sons, New York, NY.
Shrout, P.E. & Bolger, N. 2002. ‘Mediation in Experimental and Nonexperimental Studies: New Procedures and Recommendations’, Psychological Methods,7(4): 422-445.
Shurchuluu, P. 2002. ‘National productivity and competitive strategies for the new millennium', Integrated Manufacturing Systems,13(6): 408-14.
Slater, S.F. & Narver, J.C. 2000. ‘positive effect of a market orientation on business profitability: A balanced replication’, Journal of Business Research, 48(3): 69-73.
Song, M., Droge, C., Hanvanich, S. & Calantone, R. 2005. 'Marketing and technology resource complementarity: An analysis of their interaction effect in two environmental contexts', Strategic Management Journal, 26(3): 259-276.
Tashakkori, A. & Teddlie, C. 2003. Handbook of Mixed Methods in Social and Behavioural Research, Sage Publications, Thousand Oaks.
Timmons, J.A. & Spinelli, S. 2007. New venture creation. New York, NY: McGraw-Hill. Timmons, J.A. 1999. A new venture corporation, 5th edition. New York, NY: McGraw Hill. Tobora, O.O. 2015. Entrepreneurial orientation: A Remedy for Receding Productivity of Small and
Medium scale Enterprise. A Nigeria perspective, International Letters of Social and Humanistic Sciences, 47(1):77-97.
Todorovic, W. & Schlosser, F.K. 2007. 'An entrepreneur and a leader! A framework conceptualizing the influence of leadership style on a firm's entrepreneurial orientation - performance relationship', Journal of Small Business and Entrepreneurship, 20(3): 289-308.
UNCTAD, 2002. Investment and innovation policy review Ethiopia,United Nations, New York and Geneva. Venesaar, U. & Loomets, P. 2006. The Role of Entrepreneurship in Economic Development and Implications
for SME Policy in Estonia. Paper presented to the 14th Nordic Conference on Small Business Research, Stockholm, Sweden.
Vinzi, V.E., Trinchera, L. & Amato, S. 2010. PLS path modeling: from foundations to recent developments and open issues for model assessment and improvement. In V. E. Vinzi, W. Chin, J. Henseler, & H. Wang (Eds.), Partial least squares: concepts, methods and applications, 2: 47-82): Berlim, Germany: Springer-Verlag.
Wang, C.L. 2008. Entrepreneurial orientation, learning orientation, and firm performance’, Entrepreneurship Theory and Practice, 32(4):635-657.
Wetzels, M., Odekerken-Schroder, G. & Oppen, C.V. 2009. ‘Using PLS Path Modeling for Assessing Hierarchical Construct Models: Guidelines and Empirical Illustration’, MIS Quarterly, 33(1): 177-195.
167
Wiklund, J. & Shepherd, D. 2003. ‘Knowledge-based Resources, Entrepreneurial Orientation and the Performance of Small and Medium-sized Businesses’, Strategic Management Journal, 24(1): 1307– 1314
Wiklund, J. & Shepherd, D. 2005. 'Entrepreneurial orientation and small business performance: A configurational approach', Journal of Business Venturing, 20(1): 71-91.
Wiklund, J. 1999. 'The sustainability of the entrepreneurial orientation--performance relationship', Entrepreneurship Theory and Practice, 24(1): 39-50.
Wilderom, C.P.M. & van den Berg, P.T. 2000. ‘Firm culture and leadership as firm performance predictors: a resource-based perspective’, Tilburg University, Netherlands.
Wold, H. 1974. Causal flows with latent variables: Partings of the ways in the light of NIPALS modelling. European Economic Review, 5: 67-86.
Yang, C.W. 2008. ‘The relationships among leadership styles, entrepreneurial orientation, and business performance', Managing Global Transitions, 6(1): 257-275.
Yoo, S.J. 2001. 'Entrepreneurial orientation, environmental scanning intensity, and firm performance in technology-based SMEs', paper presented to Babson/Kauffman Entrepreneurship Research Conference, Jonkoeping, Sweden.
Yucel, I. 2011. Entrepreneurial orientation, Executives’ Individualism and Firm Performance: the Moderating Role of Executives’ Individualism’, Far East Journal of Psychology and Business, 5(3).
Yuksel, A., Yuksel, F. & Bilim, Y. 2010. ‘Destination attachment: Effects on customer satisfaction and cognitive, affective and conative loyalty', Tourism Management, 31(2): 274-84.
Yusuf, O.S., Olagbemi, A.A. & Atere, A.A. 2011. Factors Affecting Small-Scale Business Performance In Informal Economy In Lagos State-Nigeria: A Gendered Based Analysis, Lagos State University.
Zhao, X., Lynch, J.G. & Chen, Q. 2010. Reconsidering Baron and Kenny: Myths and truths about mediation analysis. Journal of Consumer Research, 37(2),197-206
Zulkiffli, S.N. & Perera, N. 2011. A literature analysis on business performance for SMEs: Subjective or objective measures? Paper presented to Society of Interdisciplinary Business Research (SIBR).
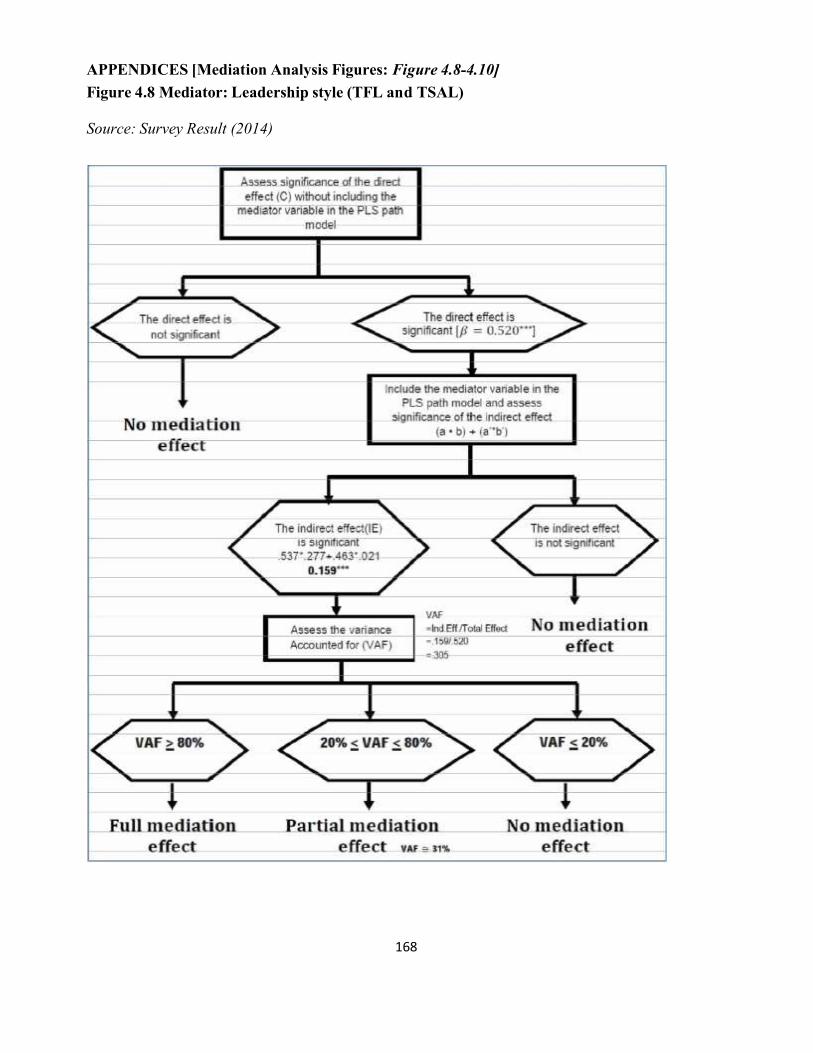
168
APPENDICES [Mediation Analysis Figures: Figure 4.8-4.10] Figure 4.8 Mediator: Leadership style (TFL and TSAL) Source: Survey Result (2014)

169
Figure 4.9 Mediator: Transformational Leadership Source: Survey Result (2014)
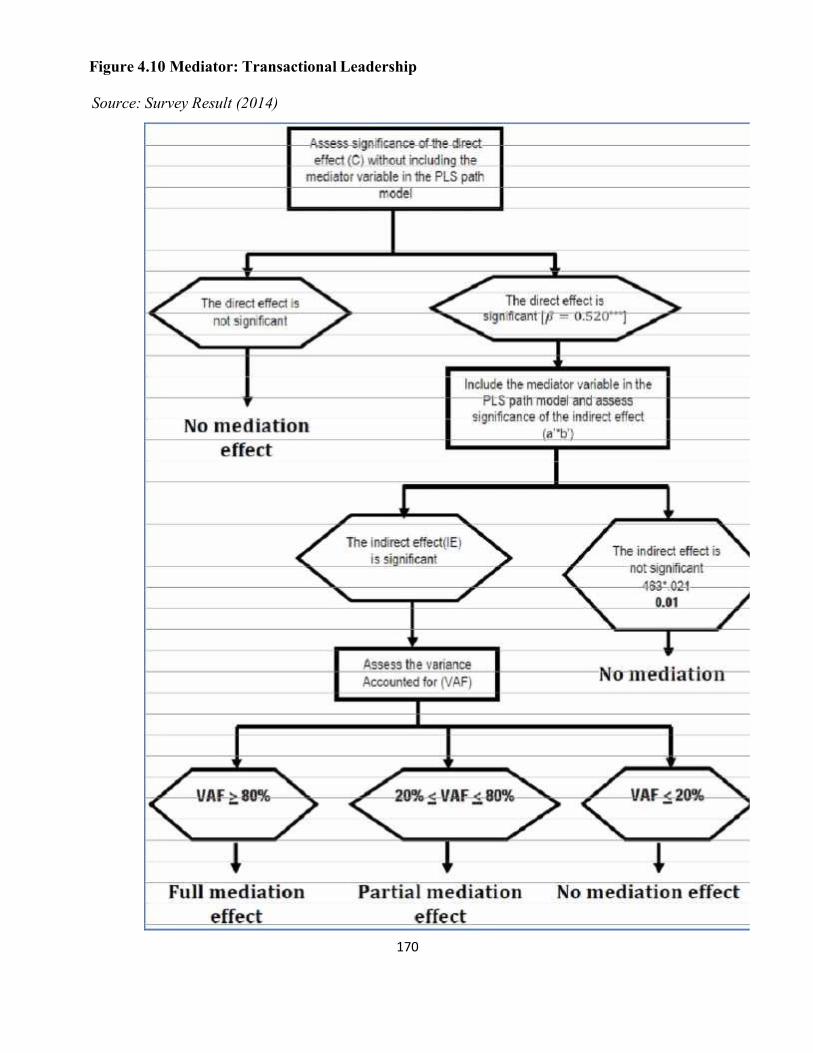
170
Figure 4.10 Mediator: Transactional Leadership Source: Survey Result (2014)
171
Management Capability Index for Ethiopia Mohammed Seid1 Abstract Poverty alleviation and economic growth as ways of enhancing quality of life are topics quiet often discussed. In spite of great accomplishment across the world towards reducing poverty, over a billion people are still under extreme poverty. However, productivity, which is affected by human capital, is considered to be a major way out of poverty and a route to development. Management capability as an aspect of human capital plays a decisive role in aligning employee skills, motivation and ability, which will result in better productivity, great wealth, and reduced poverty. Ethiopia aspiring to be a middle-income country needs to assess its stock of managerial capability in order to narrow the skill gap to be competitive and achieve sustainable growth. By adopting the MCI scheme of New Zeeland Institute of Management, this paper assessed the managerial capacity index of Ethiopia in a limited scope. It used a survey response of 75 respondents of managers from different industries2. The result indicated that the capability index is below the countries we compared Ethiopia with in all of the ten dimensions. The most alarming areas were found to be innovation, organizational capability, and people leadership. With all the limitations of the study, it behooves all concerned to do every course of action necessary to change this situation so as to have capable and versatile managers that can turn around our organizations for better performance. The survey result, I hope, provides an opportunity for organizations, industries, policy makers, development promoter, and the academia to take stock of managers’ current performance and identify areas form improvement.
Keywords: Management Capability index, Ethiopia, human capital 1. Management Capability Measures Where We Stand! Though the world slashed the 1990 poverty rate by half though the Millennium Development Goals, still over one billion people of the world (including about 17 of the population in developing countries) still leave below $ 1.25 a day income and the gap between the reach and the poor is increasing.3 Low productivity and income in poor countries are attributed to this situation4. Raising labor productivity is recognized as a critical factor for increasing economic growth and reducing poverty levels5. It is true that a number of factors are responsible for 1 Assistant Professor, Department of Management, College of Business and Economics, Addis Ababa University, Email: [email protected] 2 Most of our respondents are our EMBA students 3http://www.worldbank.org/en/topic/poverty/overview, 12/14/2014 10:11PM 4Productivity and Human Capital:The Case of Ethiopia,Martha Hailu, 2008 5Human Capital Policies: What they Can and Cannot Do for Productivity and Poverty Reduction in Latin America, Suzanne Duryea and Carmen Pages, 2002
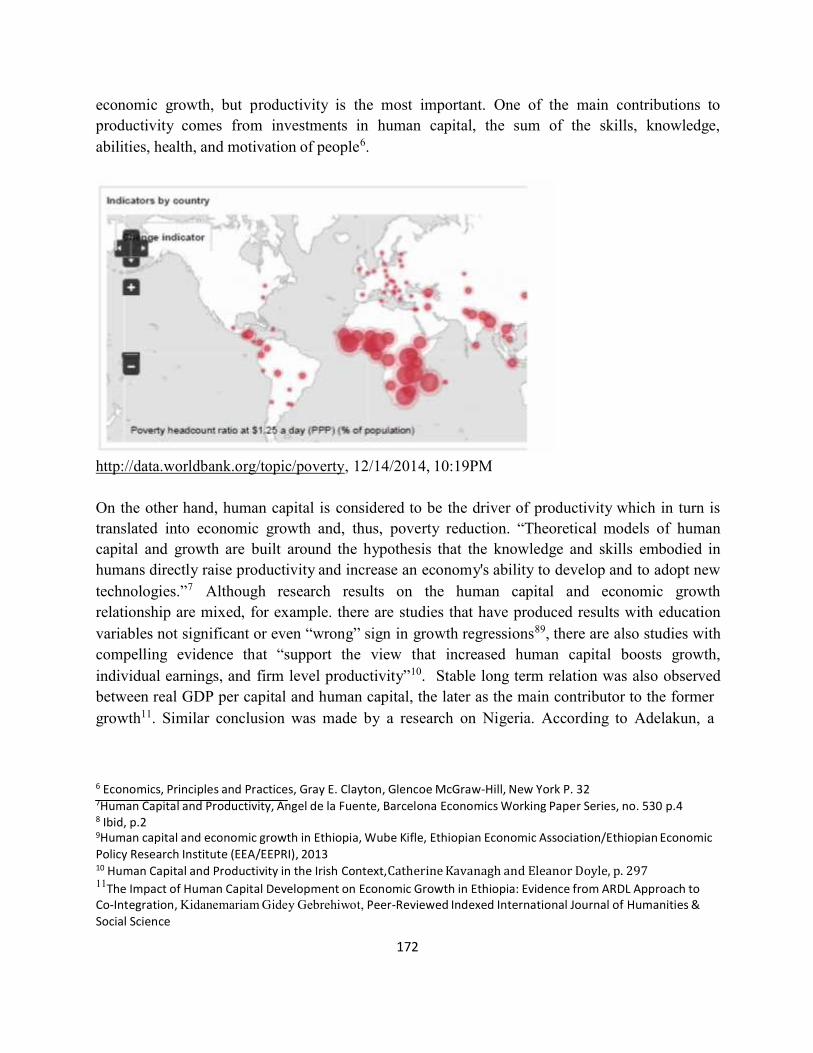
172
economic growth, but productivity is the most important. One of the main contributions to productivity comes from investments in human capital, the sum of the skills, knowledge, abilities, health, and motivation of people6.
http://data.worldbank.org/topic/poverty, 12/14/2014, 10:19PM On the other hand, human capital is considered to be the driver of productivity which in turn is translated into economic growth and, thus, poverty reduction. “Theoretical models of human capital and growth are built around the hypothesis that the knowledge and skills embodied in humans directly raise productivity and increase an economy's ability to develop and to adopt new technologies.”7 Although research results on the human capital and economic growth relationship are mixed, for example. there are studies that have produced results with education variables not significant or even “wrong” sign in growth regressions89, there are also studies with compelling evidence that “support the view that increased human capital boosts growth, individual earnings, and firm level productivity”10. Stable long term relation was also observed between real GDP per capital and human capital, the later as the main contributor to the former growth11. Similar conclusion was made by a research on Nigeria. According to Adelakun, a
6 Economics, Principles and Practices, Gray E. Clayton, Glencoe McGraw-Hill, New York P. 32 7Human Capital and Productivity, Angel de la Fuente, Barcelona Economics Working Paper Series, no. 530 p.4 8 Ibid, p.2 9Human capital and economic growth in Ethiopia, Wube Kifle, Ethiopian Economic Association/Ethiopian Economic Policy Research Institute (EEA/EEPRI), 2013 10 Human Capital and Productivity in the Irish Context,Catherine Kavanagh and Eleanor Doyle, p. 297 11The Impact of Human Capital Development on Economic Growth in Ethiopia: Evidence from ARDL Approach to Co-Integration, Kidanemariam Gidey Gebrehiwot, Peer-Reviewed Indexed International Journal of Humanities & Social Science
173
trong positive relationship was found between human capital development and economic growth12.
The human capital being a crucial element employed in converting all resources to economic value of human use, its judicious management will be paramount for Ethiopia with large reserve of human resource in Africa.
Human capital is a stock of resources— “all the knowledge, talents, skills, abilities, experience, intelligence, training, judgment, and wisdom possessed individually and collectively by individuals in a population”13. These resources are the total capacity of the people and of all managerial capability could be decisive. Human Capital Management (HCM) gives organizations the opportunity to see workforce capabilities, experience, knowledge and aspirations in a new way.
In the past, organizations have clung to the belief that as long as they had competitive products and services, they could enhance their organizations’ performance and growth. This may work in some situations but could be difficult to sustain it. More importantly, in today’s highly competitive global market, reliance on existing products and service alone without having top talent with the essential managerial capability (knowledge, skills, abilities and attitudes) will not suffice for success.
Managers’ every day decisions can make life pleasant and rewarding or unfriendly and lackluster; they can build or destroy companies’ strategies, cities even nations. According to resource view (RBV), management capability plays a crucial role in aligning employee skills, motivation and ability and studies found out that management capability was associated with the use of high performance work organization.14
Senior managers may repeatedly claim that people are their most important assets but their practice most often betrays their assertion. According to some research, most organizations neglect the role of managers, undervalue it and, therefore, suffer from a lack of strong management capability.15,16 12 Human Capital Development and Economic Growth in Nigeria, Adelakun, Ojo Johanson, European Journal of Business and Management 13http://en.wikipedia.org/wiki/Human_capital,12/23/2014 8:45PM 14 Management Capability and High Performance Work Organization, Marc Thompson and Paul Heron, Int. J. of HRM 16:6 June 2005 15Transformation challenges greater than ever for global finance functions, ACCA,http://www.accaglobal.com/gb/en/discover/news/2014/06/transformation -challenge.html, 12/24/14, 6:24 16http://www.workforce.com/articles/why-you-must-build-management-capability, 12/24/14, 6:32
174
In spite of this, however, a lot of attention has been given to managerial capability by money as key resources for organization and national success. Its role will even become more salient, especially when threat of competition is very high. Considering the Russian’s accession to the WTO, experts from the business and academic community held on October 4, 2012 an international management conference to discuss strategies for Russian and International MNCs and management skills necessary to support these organizations’ growth and development. The aim was to develop senior executives into truly inspiring leaders, able to operate successfully in the global market17. The government of UK also has the Council for Excellence in Management and Leadership (CEML) with the objective of raising the capability (ability and performance) of UK managers18.
The comments of the well know management guru also demonstrate the significance of managerial capability for national development. In the series of fax and letters correspondences Drucker exchanged with Japanese retail mogul Nakauchi in 1994-1995, he noted that “There are no underdeveloped countries anymore, only mismanaged ones.”19
The truth is. therefore, that executives are the key assets that bring all other functions into play. As shown above, the managers’ role and importance will even be prominent when companies intend to operate in global environment. In spite of the traditional belief that firms need time to obtain the necessary resources to deal with the problems and challenges of globalization, companies run by managers with international orientation managerial capability was found to move into foreign markets soon after creation.
Building management capability lifts organizational performance and productivity, and, therefore, economic performance across the economy as a whole. Capable managers are essential to employee engagement in any enterprise, private or public sector20. Ethiopia, in its transformation plan is trying to go global. The government has put in place export promoting policies to promote export earnings and thereby gradually reduce dependency on external source of finances. It also applied to join WTO in 2003 and is expecting accession sooner or later. Capable management of Ethiopian companies is fundamental to cope with these increasing complexities of the global marketplace and to ensuring that Ethiopian enterprises are able to capitalize on the myriad of business opportunities that globalization offers. This behooves Ethiopia to be concerned about its managerial capability. Since managers play a key role in maximizing and delivering individual, organizational, and national performance, 17http://www.gsom.spbu.ru/en/all_news/04_10_2012_konferenciya_strategii_rossijskih_i_inostrannyh _transnacionalnyh1/, 12/24/2014, 9:50AM 18Indicators of Management Capability:Developing a Framework,Penny Tamkin, Jim Hillage, Rebecca Willison , The Institute for Employment Studies, CEML, London 19Drucker on Asia, A dialogue between Peter Drucker and Isao Nakauchi, Nakauchi, 1997 20 2013 New Zealand Management Capability Index, New Zeland, Institute of Management, 2013
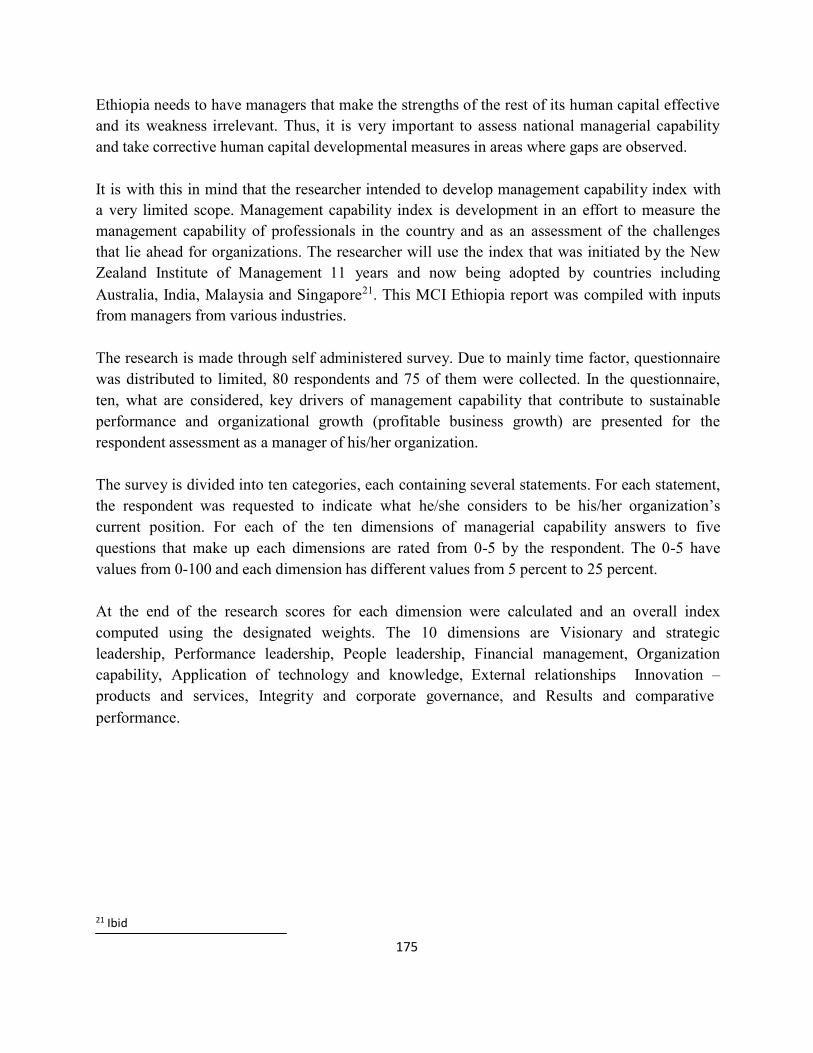
175
Ethiopia needs to have managers that make the strengths of the rest of its human capital effective and its weakness irrelevant. Thus, it is very important to assess national managerial capability and take corrective human capital developmental measures in areas where gaps are observed.
It is with this in mind that the researcher intended to develop management capability index with a very limited scope. Management capability index is development in an effort to measure the management capability of professionals in the country and as an assessment of the challenges that lie ahead for organizations. The researcher will use the index that was initiated by the New Zealand Institute of Management 11 years and now being adopted by countries including Australia, India, Malaysia and Singapore21. This MCI Ethiopia report was compiled with inputs from managers from various industries.
The research is made through self administered survey. Due to mainly time factor, questionnaire was distributed to limited, 80 respondents and 75 of them were collected. In the questionnaire, ten, what are considered, key drivers of management capability that contribute to sustainable performance and organizational growth (profitable business growth) are presented for the respondent assessment as a manager of his/her organization.
The survey is divided into ten categories, each containing several statements. For each statement, the respondent was requested to indicate what he/she considers to be his/her organization’s current position. For each of the ten dimensions of managerial capability answers to five questions that make up each dimensions are rated from 0-5 by the respondent. The 0-5 have values from 0-100 and each dimension has different values from 5 percent to 25 percent.
At the end of the research scores for each dimension were calculated and an overall index computed using the designated weights. The 10 dimensions are Visionary and strategic leadership, Performance leadership, People leadership, Financial management, Organization capability, Application of technology and knowledge, External relationships Innovation – products and services, Integrity and corporate governance, and Results and comparative performance. 21 Ibid
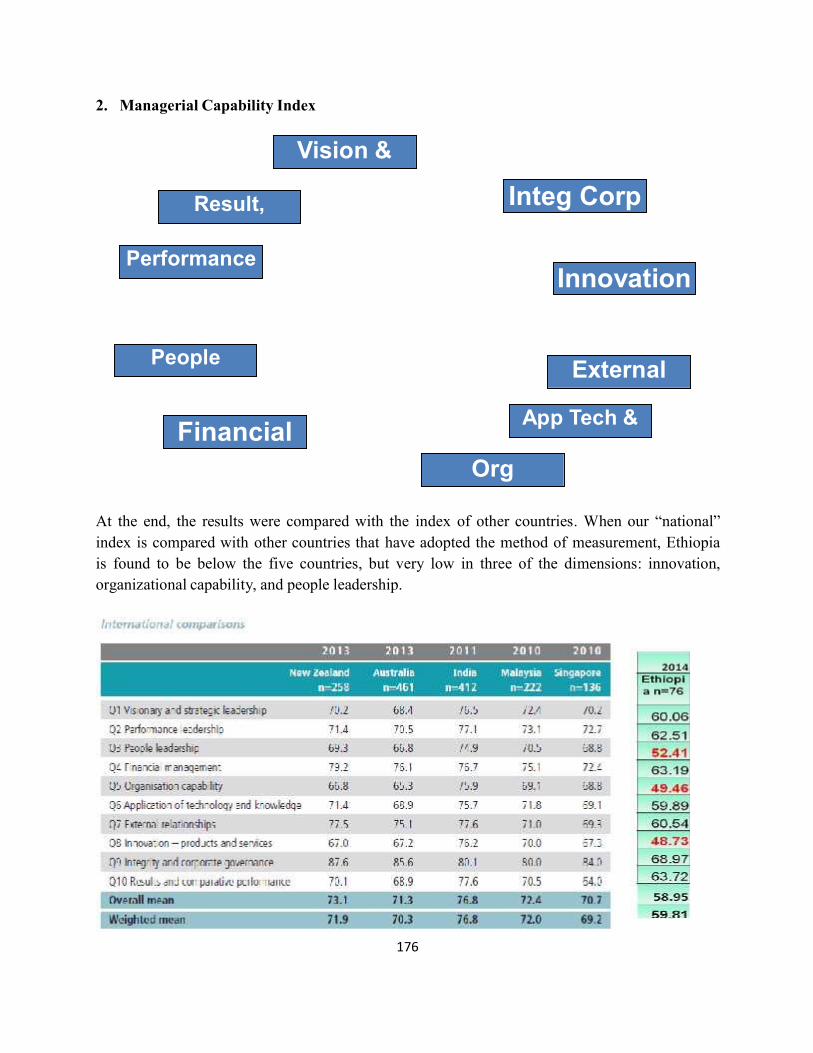
176
2. Managerial Capability Index Result,
Vision & Integ Corp Performance Innovation People Financial
Org
External App Tech &
At the end, the results were compared with the index of other countries. When our “national” index is compared with other countries that have adopted the method of measurement, Ethiopia is found to be below the five countries, but very low in three of the dimensions: innovation, organizational capability, and people leadership.
177
3. Conclusion and Future Direction Without ignoring the limitation of the study, such as limited sample size, use of convenient sampling, and lack of an attempt to establish causal relationship (answering why) and non- inclusion of capability index variation by industry, ownership and such, the research vividly indicates areas where we fell very well below other countries. It is up to all of us including the government, the business community, and development promoters, and higher education institutions, to put our maximum effort to bring about change on those areas where we are gravely deficient and improve the other dimensions.
At the same time, such index has to be done with more rigor, high commitment and involvement of executives throughout the country. It has also paramount significance to publish such index every year and examine the index in terms of industry type, ownership, educational level and type, location, and foreign affiliation among others.
,
178
The Links Between Academic Research and Economic Development in Ethiopia: The Case of Addis Ababa University
Mulu Nega1 Abstract This paper aims to examine the major issues concerning the links between academic research and economic development in Ethiopia by considering the Addis Ababa University as a case. The paper is based on two premises. The first pertains to the idea that universities being one of the actors in knowledge production play a central role in enhancing the economic development and competitiveness of a country through their missions of academic research and the formation of skilled human capital. The second concerns the argument that a strong collaborative link between universities and the industry is crucial in enhancing scientific and technological innovation process and commercialization of academic research through technology transfer that is necessary for economic development. Based on a review of the conceptual and theoretical debates, documentary evidences and key informant interviews, it argues that the university- industry link/partnership in terms of academic research and innovation is not well developed in the Ethiopian context. The findings indicate that the contribution of academic research in enhancing the country’s economic development is minimal at Addis Ababa University, in particular, and in the country, in general. The barriers to the lack of strong link between university and industry in terms of academic research and innovation are discussed and documented. Finally, implications for a strong partnership among universities, the industry and the government in enhancing the contribution of academic research and innovation to the country’s development are drawn. Keywords: academic research, economic development, industry, innovation, knowledge, linkage/partnership, technology transfer, university
1. Background In today’s world, sustainable development of a country depends to a larger extent on its ability to generate, adopt and apply knowledge. Knowledge and the know-how to use the available knowledge have now become critical for a country’s survival in the dynamic and competitive global environment.
Universities have long been recognized as one of the important sources of essential knowledge and highly skilled labor across many countries. Notably, Universities play a fundamental role in accelerating the scientific and relevant technological innovations and thereby enhancing the economic vitality and competitiveness of a nation through their basic missions of generating and disseminating knowledge - from teaching and research (Geiger, 2006). University-industry partnership is crucial in this regard. The collaborative link between universities and the industry 1 Assistant Professor, Addis Ababa University, E-mail: [email protected]
179
is necessary for technology transfer and the commercialization of academic research. Notably, any technological innovation process implies close linkages among different players - the university, industry and government, and the nature and intensity of the interactions among these actors critically influence the innovative performance of institutions/enterprises within a given innovation system (Nelson; Lundvall and Johonson cited in Schiller and Diez, 2007)
The role of the University as a strategic resource is prominent feature that brings it to the inner circles of any national development agenda. Thus, countries at different or at extremely dissimilar stages of socio-economic and political environments as well as industrial and technological development have tried to use their universities for sustainable development. Ethiopia is not an exception in this regard.
In Ethiopia, the need to accelerate economic growth through human resource development, research and innovation is evident over the past decade. In the successive phases of the country’s economic development plans and strategies, the role of universities in human resource capacity building and technological innovations has been identified as one of the key pillars in the economic and social transformation process of the country (see GTP I and II). Recently, the country’s vision of being a middle-income country by 2020-2025 is the key driving force for investing on human capital and research-intensive activities. In this regard, universities play a critical role in accelerating human development and technological capacity building and ensuring its sustainability. However, there is an increasing concern about what the universities are actually doing in terms of enhancing economic development through research and formation of human capital. Thus, necessitates for the present paper, which intends to examine what is actually happening in the universities regarding the links between academic research and economic development. A thorough understanding of the links between university research and economic development in Ethiopia requires a detailed analysis of empirical data from different sources and using different techniques and the underlying assumptions of the entire systems related to economic growth, higher education and national innovation systems, but that is beyond the scope of this paper. This paper addresses the following major questions.
1. How does academic research influence economic development (conceptual issues)? 2. How do universities and industries interact in terms of research and innovation in the
Ethiopian context? 3. Given the existing reality, what are the enablers or barriers for a positive link between
university research and the industry? 4. What can be done to strengthen the link/interaction between universities and the
industry? 2. Conceptual Considerations: Academic Research and Economic Development Universities have been identified for their potential as the key catalysts in the economic development and social transformation of a nation. Development in general and economic
180
development in particular is a multidimensional and multifaceted concept that involves both growth and change. Several economic and development theories, models and empirical studies confirm a strong relationship between universities and socio-economic development (Katharina, 2000; Barro and Sala, 1995; Colgan and Young, 2005; Lundvall, 2007, etc). Geiger and Sa Creso (2005), for example, argue that knowledge creation and technological advancement are central to economic competitiveness. Scientific and technological innovation requires new knowledge (through research), human capital (through education), infrastructure (both physical and cyber), and new policies (intellectual property, anti-trust, tax), all of which depend both on public and private investment and on the capacity of knowledge institutions such as research universities, corporate research and development, and national laboratories (Duderstadt, 2005).
The process of knowledge generation and subsequent use of it for development is at the core of new growth models. Endogenous growth theories stress the importance of innovation and technological change as a source of economic growth- a shift from material- and labor-intensive products and processes to knowledge-intensive products and services. In this perspective, innovation refers to the creation, diffusion and use of new ideas and technological advances in an economy, and can take the form of new products, new production processes, new markets and organizations (Yang, 2006). Research and development is a necessary condition for innovation- bears most directly on technological changes and thereby drive productivity.
The relationships between higher education institutions and the state, the institutions’ traditional knowledge configuration and self-regulation practices as well as their external links have changed over the past years (Gibbons, 1994; Nowotny, Scott and Gibbons, 2003). Universities are expected to respond to the demands of the different stakeholders in their environment through working in partnership with the government and industry/business sectors. Such changing nature of the role of universities has resulted in the emergence of a ‘triple helix’ model that depicts the linkage between universities, the government and the industry.
Currently, institutional arrangements that facilitate university-industry- government partnership are in place, and creating links with the industry and government has already become one of the missions and mandates of universities across many countries (the triple helix). There is, however, a major debate that a positive link between academic research and economic development is not always straight forward – it is a function of many complex and interrelated factors.
In the triple helix model, the university is viewed as an archetype of innovation and research- central actor in new knowledge production, the industry epitomizes the users of the outcomes of university research while the government plays the central legal and policy role in speeding up and strengthening the linkage (Nwagwu, 2008). For such partnership to be successful, each actor should understand the other actor’s needs and expectations. Hagen (2002) also argues that successful partnerships require a more sophisticated understanding of the complexities involved, the resources required and the adoption of a long term strategic approach if universities are to
181
achieve the objectives of their new transformational role in economic regeneration. This then, is a call for change not only of universities surface structures but also deeper structures of values, beliefs and culture intrinsic to the traditional university role as well as commitment of the participating company to change (Ibid).
3. The Rationale for University-Industry Linkage
The links between university and industry encourages the use of academic research by industries (Cohen, et al, 2002). It also enables both universities and industries to maximize capitalization of knowledge and technological innovations through knowledge spillover. The main reasons for enhancing university-industry linkage include the following (James, 2004):
Universities provide a ready pool of graduate and undergraduate students that industry may access for their work requirements
Technical opportunities exist in industry for faculty and students that may not exist in universities
Materials/facilities exist in industry for research and educational purpose that may not exist in universities
Collaborations with industry provide research funding to Universities Such collaborations can advance the service mission of Universities Collaborations provide for local and regional economic development. Universities often have research infrastructure that industry wants. Industry outsourcing to universities, to reduce the costs of doing business and
increase profits. 3.1 Mechanisms to Facilitate Technology Transfer The effect of University-Industry partnership on innovation and productivity of the economy may work through various channels. According to David, et al (2006), two principal mechanisms, among others, facilitate the spillover of knowledge from universities to industries.
The first one involves academic/scientific research published in scholarly journals. Academic research is a key ingredient in the institutional identity of universities and an indispensable prerequisite for a successful program of teaching and public service (Weiler and Guri-Rosenblit, Sawyerr, 2008). Academic research is used here to refer to a scientific or scholarly inquiry undertaken by the academia of a given university for scholarly purpose. High quality faculty committed to research and teaching, high quality graduates who want to function with advanced expertise, an intellectual climate that encourages scholarship, an atmosphere of intellectual freedom in which teaching and research can be performed effectively, adequate and dependable research funding research infrastructure, and high-quality leadership are the essential characteristics of high quality research in universities (Bienenstock in Vessuri and Teichler, 2008).
182
The second type of spillover mechanism involves human capital embodied in students graduating from universities. The research capacity of universities and research and development centers ofboth public and private sectors to a great extent depends on the quality of human resource in the areas of science and technology (Vught, 2004). Thus, the extent to which universities are able to produce graduates with marketable skills and organize their research capacities for technological innovation and transfer has a positive implication to the economic growth of a nation. The effect of University-Industry partnership on innovation and technological changes may also work through various channels viz., University and government research; research and development performed by industry/business; and foreign knowledge (knowledge generated in other countries) - through buying patents, licenses or know-how from foreign firms, observing competition (e.g. reverse engineering), hiring foreign scientists and engineers- internationalization, interacting with foreign competitors (foreign direct investment), reviewing the scientific and technological literature.
The university-industry interactions/partnerships also involve varieties of activities namely, staff exchange between universities /research institutions and the industry; provision of training to industry professionals; endowments by industrial partners; research partnerships and services including collaborative, joint and contract research projects; shared research infrastructure (labs & equipment, business incubator and technology parks); academic entrepreneurship ( start-ups, spin-off companies), and commercialization of IP (licensing patents).
3.2 Factors Influencing the University-Industry Linkage The link between university research and economic development is subject to the influence of many factors. The major contributing factors include, among others, university characteristics, industry characteristics and the legal and policy environment, which are briefly described as follows.
University characteristics: this refers to the factors that are internal to the university. These include the motivation and willingness of the university to engage in collaboration with the industry in terms of research and innovation; availability of capable and engaged academic core, competent and committed leadership and adequate funding and research infrastructure to produce relevant and quality products (research outputs and graduates). Other factors include availability of policies and supportive internal governance system and procedures for research, innovation and technology transfer; networking and capacity for knowledge transfer to other actors; entrepreneurial mind set; and a research culture.
Industry characteristics: this refers to the factors that are external to the university. In this paper, industry is conceptualized in terms of all the manufacturing and non-manufacturing stakeholders influenced by the products of the university. The extent to which the industrial sector is developed matters a lot for a meaningful and strong partnership with the universities. The major industry related factors influencing the linkage include readiness and motivation of the industrial sector to engage in partnership with university in terms of research, innovation and technology

183
transfer; availability of adequate research and development infrastructure and personnel;investment (funding) in research and development activities; the absorptive capacity of the industry.
The legal and policy environment: this refers to the legislative and regulative aspects through which governments steer the behavior and operation of organizations, in general, and universities and the industry, in particular. It includes policies, systems and regulatory bodies such as higher education policy and proclamation; Science, Technologyand Innovation (STI) policy; national research priorities and strategies; rules and regulations; incentives including national government research funding, matching funds, seed money and tax exemptions; availability of technology parks and regulatory bodies for quality and relevance of education and research. Additionally, the broader political and socio-economic environment also influences the nature of the link/partnership among the three actors viz., the university, industry and government. For example, an affective research and innovation system requires support from both political leadership and public opinion; structural conditions; research ethics and values; capability of conducting research and dependable funding. Fig: Conceptual framework: Links between academic research & economic development
Government – the broader legal and policy environment University Research & innovation Industry
184
Technology transfer 4. Methods
This study mainly employs a descriptive survey method. The necessary data regarding the role of university research in economic development are collected through reviews of the existing legal and policy documents (mainly research, technology and innovation policies and strategies), proclamations, guidelines and working papers, national development plans, published reports and meeting notes. Additionally, an attempt has been made to capture theoretical and conceptual issues regarding university-industry linkage from internationally published and unpublisheddocuments. Interviews have also been conducted with some key informants (MoE, MoSTC, senior university leadership and researchers). Due attention is given to identifying key enablers or barriers for the positive link. The collected data are properly analyzed and interpreted. The Addis Ababa University is considered as one example to discuss some of the existing experiences regarding university-industry partnership in Ethiopia. It is selected based on its age and experience in teaching, research and community service as well as the comparative advantage of its location in the capital in terms of accessing the major business and manufacturing industries concerning teaching and research.
5. Results and Discussion This section presents the results of data analyses. The major findings are organized thematically as follows.
5.1 The Institutional Environment Results of analyses of documentary evidences indicate that the vision of the country is the key driving force for investing on human capital and research-intensive activities for enhancing knowledge production capabilities of the country. As shown in the national development plans (GTP I and GTP II), a more knowledge-intensive approach to development is increasingly becoming the main route for bringing sustained and outward-oriented development and thereby bringing the country into a middle income country by 2020-2025. Currently, there is a clear shift from the agricultural-led to the industrial-led economy that demands for more quality graduates, and research and innovation activities. The universities’ role in this regard is accelerating human development and technological capacity building and ensuring its sustainability.
5.2 The Legal and Policy Frameworks The Ethiopian government has introduced and implemented successive legal frameworks, plans and strategies within the framework of the 1994 education and training policy with the purpose to steer the behavior of higher education institutes. The main national legal and policy frameworks that directly or indirectly influence the link between universities and industry in
185
terms of research and innovation are briefly discussed below: Th e 2009 H igh er E d u cation Pro clam atio n (65 0/200 9 ) - is the legal framework for the operation of the higher education system in Ethiopia. This law urges universities to define their core research areas and themes on the basis of the priority needs of the country, the institutions comparative advantages, and in consultation with the key stakeholders (Article 24, No. 2). The proclamation allows universities to conduct joint research projects with other national and international institutions, research centres, and industries (Article 24, No.3). In the proclamation, there is a clear focus on partnerships with industry in terms of research and technology transfer.
Th e Nati on al S ci en c e , Te ch n olog y an d In n ovation (S TI ) poli cy (MoS T, 201 6) - this policy, formulated in 2012, envisages the creation of a national framework that will define and support how the country will in future search for, select, adapt, and utilize appropriate and effective foreign technologies as well as addressing the establishment of national innovation system (FDRE, 2012). Research, technology transfer, human resource development, university- industry linkage and intellectual property systems are among the eleven critical policy issues considered in the STI policy directions and strategies. The policy establishes a national STI council and a forum for university-industry collaboration to regulate the national research and innovation priorities and systems.
Th e R e se arch an d T ech n ol ogy Tran s f er C on ce ptu al an d Go v ern an c e F r am ew ork of E th iopi an H igh er Learn in g In stitu tio n s (MoE , 2016 ) - is another new policy framework that defines vision, mission and objectives of research and technology transfer framework including opportunities and challenges. A framework regarding technology transfer, university-industry linkage and directions to strengthen research and technology transfer in the Ethiopian universities are among the focus areas of this national framework.
Prof essi on al an d pro gram m ix policy (Mo E , 20 08 ) - The policy clearly articulates the 70:30 undergraduate professional mix in favor of science and technology over generally speaking humanities and social sciences. This policy has implications for stimulating university- industry partnership in terms of training and research.
In telle ctu al pro pert y (IP ) righ ts s yst em (MoE , 200 8 ) - Intellectual property rights systems are considered as one of the essential mechanisms to enhance university-industry cooperation and commercialization of research and innovation. A review of the documentary evidences show that the issue of intellectual property rights policy is a recent phenomenon in the Ethiopian context, which traced back to establishment of the Ethiopian intellectual office in 2003. Since then attempts have been made to utilize the IP law as an instrument for technological innovation. However, results of the interview data show that the IP policy is not yet boiled down to the Universities. The major challenges include absence of institutional IP policies in public higher education institutions, research and development organizations as well as public enterprises, and lack of awareness of the value and importance of IP protection is also mentioned as the problem among business enterprises.
186
The findings in the preceding paragraphs show that the national legal and policy frameworks recognize the role of science and technology for development, promote research and innovation that enhance knowledge and technology transfer, and require universities to engage in research including joint research projects with industry that serves the developmental needs of the country. However, the issues on how can university-industry partnerships be stimulated and enhanced in research and technology transfer activities are not well articulated. There is a weak synergy among the legal and policy frameworks in steering the behaviour of the industry and the universities towards meaningful collaboration in research, innovation and technology transfer.
5.3 Funding Analysis of documentary evidences show that the government expenditure on education has been increasing over the past years, which is about 7% of GDP in recent years. Education expenditureaccounts for about 26% of the total public expenditure. The share of higher education budget from the total education budget has been reasonably higher compared to the lower tiers of the education system. Public universities account for about 32% of the total education expenditure. However, funding for research and innovation from the government treasury is often insignificant or totally unavailable until 2012 because of soaring student enrolment that favoured allocations to teaching instead of research, and to undergraduate instead of postgraduate training (Fisseha, 2015). In 2011/12, the research budget of all universities accounted for only 1% of their total budget (MoE, 2015). Recently, 0.62% of the annual GDP is allocated for research, which is low compared to 3% in EU, 2.59% in US and other African countries such as South Africa.
The inadequacy of research funds has been hindering the research and innovation capacity of universities in terms of research infrastructure, facilities and equipment as reported by majority of the respondents. There are no intermediary funding agencies at national level that focus in stimulating university research and linkages with industries, business sectors and the community. The contribution of the industry/business sector in funding university research is almost non- existent.
5.4 Governance Structures for Science and Innovation At national level, the Ministry of Science and Technology (MoST) has been established by proclamation No. 691/2010 as one of the most important regulatory bodies in the areas of science, technology and innovation. Preparing national science and technology research and development programmes based on the country’s development priorities; coordinating science and technology development activities and national research programmes; and facilitating interaction and collaboration among government and private higher education and research institutions and industries with a view to ensure research and technological development are among the seven duties and responsibilities of the Ministry. Similarly, the government has established national STI council and the national forum for university-industry linkage which are
187
coordinated by MoST. This shows the commitment of the Ethiopian government to facilitate the science and innovation endeavors of the country.
As one of its strategies to steer the behaviour of different actors, MoST has issued a Procedural Directive for the Linkage of Education and Training, Research Institutions and Industries in 2013. According to this directive, universities are required to interact with industries in terms of ensuring the development of students’ skills through practical trainings and to undertake need- based research that solves problems related to competitiveness of industry. To this end, many of the universities have opened university-industry linkage and technology transfer offices under the Vice President for Research and Technology Transfer to facilitate their interaction with industries in terms of training, research and innovation. This may be considered a positive step on the part of the universities.
However, results of the interview data show that the national STI council and the national forum for university-industry linkage are not well functioning and their impact in enhancing the linkbetween the industry and universities is minimal. Similarly, the university-industry linkage and technology transfer offices of the universities are not well developed to the level of attracting the industries through relevant and quality research and innovation activities.
5.5 The Status of University and Industry Interactions in Research and Innovation Results of analysis of documentary evidences and interview data indicate that the university- industry linkage was generally found to be at its beginning phase due to different reasons. Linking institutional research priorities with the priority need areas in the industry sector was marked by almost all interviewees as a new phenomenon in Ethiopia. The low level of industrialization in Ethiopia currently; shortage of capable researchers at universities (PhD holders accounts only for 11.3% of the total academic staff), and the poor attitude universities had traditionally towards the university-industry linkage and its significance are the main challenges for building strong partnerships with industries.
The fact that universities are just starting working in consultation with industries and their experience in this regard is quite immature was explained by two factors. The first was that Ethiopia just launched the scheme of industrialization very recently and there have never been many industries as such to work with. The second is the low level of awareness and experience by higher education institutions that industries play an extremely important place in the training of graduates and later in their deployment for work. One of the respondents from Addis Ababa University stressed that the development of linkage between the universities and industry in Ethiopia is an emerging one, a relationship that has yet started but initiated in a positive way. Given the low level of industrial expansion, inability to sort out needs and limited capacity to project markets on behalf of the industry and low level of awareness of universities to tie up their programs with the industry, the link between universities’ institutional research agenda and
188
needs of the industry and society is at a lower stage, currently. Respondents from the industrial sector on their part reported that the capacity of the universities in producing commercially attractive research and innovation outputs and graduates is one of the major challenges for strengthening their partnership with the universities. As one of the respondents from the industry reported, the industries prefer to import experts from abroad with lower prices compared to the local universities to address their technical and knowledge constraints. This suggests that the readiness and willingness to engage in collaboration is yet to be developed in both the universities and the industrial sector.
5.6 The Case of Addis Ababa University: The State of University-Industry Linkage Addis Ababa University, as a pioneer higher education institution, has been playing its critical role in the formation of human capital in the country. It has been articulating research undertaking as one of its missions since its establishment in 1950. Recently, engagement in mutually rewarding on-going collaboration with its stakeholders is one of the missions of the Addis Ababa University. The university has put in place policies and thematic priority areas for research and offices to coordinate and lead research, university-industry linkage and technology transfer since 2010. There is also an increasing fund allocation for research since 2012. Even though the overall scenario for collaboration and working with the industry appears to be limited, relative strengths were reported in the interviews conducted.
Many respondents from the university explained that public universities especially the Addis Ababa University engage the public in setting out their institutional research agenda and in opening up new programmes. This is possibly, they underlined, in the needs assessment academic programmes are required to carry out prior to designing new programmes of studies. Stakeholders from the public are invited to get engaged in the needs analysis process thereby articulating their needs and interests. The respondents also mentioned the opening of a director’s office in Addis Ababa University to solely address the link between the university and industry is an important step the university took to address the needs of the sector.
However, the role of academic research in terms of enhancing the productivity of the economic sector is generally dismal. Most of the research works undertaken by the academic and research institutions and PhD students are either shelved or presented in conferences or published in journals for the purpose of academic promotion. The research results are contributing in terms of ideas and policies, but do not reach the market in terms of patents and technologies for the industry. As one of the interviewees noted, no research results carried out by staff are changed into patents or technologies. For example, Addis Ababa University in its history got only one patent internationally, so far, as reported by the respondent. Hence the contribution of the Addis Ababa University in strengthening partnership with the private sector and enhancing the economic growth of the country through academic research and innovation is minimal.
189
5.7 Enablers for and Barrier to a Positive Link between University Research and Industry From the findings discussed in the preceding sections, the availability of governance structure at national and institutional levels, the existing policies science, technology and innovation and the current shift of the country towards industrialization may be considered as enablers or opportunities to strengthen the university-industry linkage in terms of research and innovation. However, the link between academic research and economic development is constrained by a multitude of factors. The major barriers for a positive link between universities and industries include.
Lack of a robust and overarching national framework that brings all actors (university, industry and government) on board to collaborate in research, innovation and technology transfer. The existing policy frameworks lack coherence and synergy to ensure strong partnership between industries and universities in terms of research and innovation.
Lack of readiness and willingness on the part of both the universities and industries to engage in meaningful partnership,
Limited attention and inadequate funds for research and innovation at national level, Absence of well-established research infrastructure and facilities dedicated for research
and innovation activities in both the industries and universities. The industrial sector is at an infantry stage and investment in research and development is yet to be developed in the sector,
Inadequate institutional commitment and support at all levels, Shortage of capacity/capable staff to undertake advanced research- Staff with PhD
qualification accounts for only 11.3% of the total academic staff of the universities, 6. Concluding remarks This paper shows that the role of university research in economic development is vital. However, a positive link between university research and economic development is subject to the influence of many factors that are internal and external to the university. The findings indicate that university-industry partnership in terms of research, innovation and technology transfer is very weak in the Ethiopian context. Many of the enabling conditions are lacking. Particularly, the contribution of the Addis Ababa University in strengthening partnership with the private sector and enhancing the economic growth of the country through research and innovation is minimal. The role of the private sector in strengthening their partnership in terms of research and development, innovation and technology transfer is yet to be developed. Thus, the university, private sector, and the government should take their share in creating strong linkages and partnerships necessary to enhance the economic growth of the country. This requires a robust national framework to enforce strong linkage among the three actors.
190
References Amare (2007). Academic Freedom at the Addis Ababa University. UK: University of East
Angelia (PhD Dissertation). Barro, R. and Sala, X. (1995). Economic Growth,Second edition. The MIT Press, Massachusetts:
London Bollinger, A and Smith, R (2001), 'Managing organizational knowledge as a strategic asset',
Journal of Knowledge Management, vol. 5, no. 1, p. 8-18. Cohen, et al. (2002). Links and Impacts.The Influence of Public Research on Industrial R&D,
Management Science 48(1). Cyert, R.M (1991). Knowledge and Economic Development. Operations research, 39(1). David, et al ((2006). University Spillovers and Enterpreneurial Location:, Entrepreneurship and
Economic Growth, Oxford University Press Duderstadt, J.J (2005). University-Indusry-Government Partnership for a 21st century Global,
Knowledge driven Economy: An American Perspective. US: University of Mitchigan. FDRE (2009). Higher Education Proclamations (No 650/2009). Addis Ababa:Negarit Gazeta. FDRE (2003). Higher Education Proclamation (No 351/2003). Addis Ababa: Negarit Gazeta. FDRE (2003b). A proclamation to provide for the establishment of the Ethiopian IP Office
proclamation No. 320/2003.Federal NegaritGazeta, Addis Ababa. FissehaMamo (2015). Revenue Generation Strategies in Sub-Saharan African
Universities.Enschede: University of Twente, Enschede Geiger, R.(2006). The Quest for Economic Relevance by US Research Universities,Higher
Education Policy, 19. Geiger, R.L, & Sa Creso (2005). Beyond Technology Transfer.Us State Policies to Harness
University Research for Economic Development. Minerva(43). Geiger, R. (1985). Research Universities: Their Role in Undergraduate Education. In Contexts
for Learning: The Major Sectors of American Higher Washington, DC: GPO. Gibbon, M and associates. (1994). The New Production of Knowledge: Science and Research in
Contemporary Societies. London: Sag Hall, H.B (2004). University-Industry Research Partnership in the United States.University of
California.Conference paper. Howells, J., McKinlay. (1999). Commercialization of University Research in Europe. Report to
the Advisory Council on Science and Technology, Ontario, Canada. Katharina, M. (2000). “Returns to Education in Low Income Countries: Evidence for Africa.”
http://www.hwwa.de/Projects/Res_Programmes/RP/Development_Processes/VfS_EL_200 0_Rev 2009/10). Education Statistics Annual Abstract. Addis Ababa: Federal Democratic Republic of Ethiopia.
Lundvall, B. (2007). Higher Education, Innovation and Economic Development. Aalborg
191
University, Denmark Ministy of Education (MoE) (2014/15). Education Statistics Annual Abstract. Addis Ababa:
Federal Democratic Republic of Ethiopia. Ministry of Education, MoE (2008). Annual Intake and Enrollment Growth and Professional and
Program Mix of Ethiopian Public Higher Education: Strategy and Conversion Plan,2008/09- 2011/12. Unpublished. Addis Ababa: Federal Democratic Republicof Ethiopia.
Ministry of Science and Technology (2012). Science, technology andInnovation policy.Addiss Ababa, Ethiopia
(2014). National Research Ethics Review Guideline. Addis Ababa,Ethiopia MoFED (2010). Growth and Transformation Plan (GTP) 2010/11-2014/15. Addis Ababa: Federal
Democratic Republic of Ethiopia. MuluNega(2012). Quality and Quality Assurance in Ethiopian Higher Education:critical issues
and practical implications. Enschede: University of Twente,Enschede. National Plan Commission (2015). The Second Growth and Transformation Plan (GTP II)
2015/61-2019/20. Addis Ababa: Federal Democratic Republic of Ethiopia. Nwagwu, W.E(2008). The Nigerian University and Triple Helix Model of Innovation systems:
adjusting the wellhead. Technology Analysis & strategic Management, 20(6). Pillay P (2008). Higher Education and Economic Development – A Review of the Literature.
Draft, unpublished. Cape Town: Centre forHigher Education Transformation. Saint, W. (2004). Higher Education in Ethiopia: The Vision and Its Challenges JHEA/RESA
Vol. 2, No. 3, 2004, pp.83–113. Schiller, D. and Diez, J.r.(2007). University-industry Linkages. Potential and realization in
developing countries: Thai experience. TECH Monitor, 38. Schultz TP (1994). The Formation of Human Capital and the Economic Development of Africa: Returns to Health and Schooling Investments. African Development Bank, Economic Research
Papers No. 37 Scot, S.(2004). Variation in Spinoff Activities Across Institutions, in Academic Entrepreneurship.
University Spinoffs and Wealth Creation. Elgar Tiwana, A (2002). The Knowledge Management Toolkit, Prentice Hall PTR, NJ, USA. UNESCO. (2004). World Bank Document: Improvement of Capacity of Higher Education
Institutions through Doctoral Training. UNESCO (2010). UNESCO Institute for Statistics. UNESCO, Paris. UNESCO (2004). Higher Education in a Globalized Society. Paris UNESCO (2000). A decade of Investment in Research and Development(R & D): 1999-2000
UIC Bulletin No1. Van Vught, F. (2006). A supranational European University Policy. An Analysis of the European
Union Higher Education and Research Policies”.
192
----------------. (2004). Closing the European Knowledge Gap: Challenges for the European Universities of the 21st Century,
(http://www.humane.eu/fileadmin/wsan_docs/ws2004/ws2004_Mon_Van_Vught_3_Closing _Knowledge_Gap.pdf).
Vessuri, H. & Teichler, U. (2008). Universities as Centers of research and Knowledge Creation: An Endangered Species. Rotterdam: Sense Publishers.
Weiler, H.N; Guri-Rosenblit, S. and Sawyerr, A. (2008) Universities as Centers of Research and Knowledge creation. In Vessuri, H. & Teichler, U. (2008). Universities as Centers of research and Knowledge Creation: An Endangered Species. Rotterdam: Sense Publishers.
World Bank (2010). Financing Higher Education in Africa. Washington, DC: WorldBank. World Bank (2000). Higher Education in Developing Countries: Peril and promise.
193
The Prospects and Challenges of Foreign Direct Investment (FDI) for the Transformation of Ethiopia
Fisseha-Tsion Menghistu1 Abstract The main objective of this article is to examine whether FDI has been effective in the transformation for Ethiopia.
The widely held belief among nearly all developed and developing countries and their respective governments is that FDI is an effective vehicle not only for transforming but also for bringing about growth, economic development as well as sustainable development. The same is true with technology transfer. Similarly, they also grant massive tax and non-tax incentives to promote and attract FDI and technology transfer for development.
Whether FDI and the transfer of technology via FDI is an effective vehicle to substantially reduce or eliminate poverty and bring about sustainable development for the people of developing countries and that of Ethiopia are some of the politically, ideologically and legally complex and controversial subjects, where there is no universal understanding and clarity among government leaders, politicians, scholars and even among the ordinary people. There is neither clarity and better understanding about the definition, concept and component aspects and elements of either FDI or technology transfer for development. The Ethiopian Government has shifted its focus from Agriculture Development Led Industrialization (ALDI) to manufacturing with the aim of becoming an industrial hub for light industries destined for exports in the hope of enabling it to become a middle-income country by 2025. In order to achieve its objective it has re-oriented its priorities; revised its tax and non-tax incentives, reorganized the structure of the governing architecture related to FDI in general, and the industrial parks in particular; introduced One Stop-Shop services in order to provide efficient and effective service delivery to foreign investors who invest in its priority projects and activities as well as in the industrial parks. It has upgraded the Ethiopian Investment Agency (EIA) to become the Ethiopian Investment Commission (EIC), restructured its institutional structure and architecture governing the investment administration and empowered it with many new tasks and responsibilities and has replaced the old staff with new faces and new blood to give it a new face and image. It has introduced a new hierarchy of decision making powers and processes related to the issuance of permits and delivery of services within and outside industrial parks as well as modalities of granting tax and investment incentives. The main aim and objective of this article is to examine, reviews and critically reflect the above issues in the context of the role of FDI in the transformation of Ethiopia. The article attempts to also briefly examine issues related to the positive and negative implications of adopting a free market and free enterprise as well as that of developmental state in the context of Ethiopia. It briefly and critically examines about the concerns of free market policies and practices and the paradoxes and contradictions that exist between some of the government policies, legal and institutional frameworks and practice in light of the concrete socio-economic, technological and political conditions of the country. Since FDI is a multi-disciplinary subject and inseparable from politics and political economy and developmental aspirations of the country, it provides some bold, concrete and rather more comprehensive recommendations on some of the ways forward and under what circumstances FDI can satisfactorily help to transform Ethiopia.
Keywords: Foreign Direct Investment, development policies, transfer of technology, industrial parks, transformation and sustainable development, Ethiopia
1 Prof. Dr. Fisseha-Tsion was a former Public Policy, Legal and Tax Adviser to the Ministry of Finance during the last years of Emperor Haile Sellassie who has no less 42 years of knowledge and experiences in National and International Taxation, International Trade and Investment, Public Financial Management, Business and Development related studies.
194
1. General Introduction The main aim of this article is to examine and analyze the prospect and challenges of direct foreign investment for the transformation of Ethiopia. A more meaningful and serious way to deal with the article is first to have a better understanding of the definition, concept, characteristics, aims and objectives of FDI and its role for the transformation of Ethiopia and what the prospects and challenges are for the transformation of Ethiopia. However, in addition to dealing with the FDI, there is also a dire need to also understand what constitutes transformation. One needs to ask transformation by whom? for whom? for whose benefit and at whose cost? Without having clarity of such issues, one cannot do justice to the title and the subject matter thereof. Moreover, a review of the Ethiopian Government policies and what has so far been achieved also remains crucial. The Ethiopian Federal Government’s strategic policy documents and national plans (MOFED,2010) often state that the overall objective and national vision of Ethiopia is. . . to become a country where democratic rule, good-governance and social justice reign, upon the involvement and free will of its peoples, and once extricating itself from poverty to reach the level of a middle-income economy as of … [2025] The 2015 World Bank Report stated that the Ethiopian economy continued its strong expansion in fiscal year 2014 with real GDP growing by 10.3 percent and stressed that growth was driven mainly by the services sector from the supply side and public investment from the demand side. The 2012 World Bank (World Bank, 2012) in its various reports however made it clear that over the past decade, the Ethiopian economy has been growing at twice the rate of the African region, averaging, 10.6 percent GDP growth per year in the last ten years compared to 5.2 percent in Sub-Saharan Africa. The Bank has also recognized that "two and a half million people in Ethiopia have been lifted out of poverty over the past five years as a result of strong economic growth, bringing the poverty rate down from 38.7 percent to 29.6 percent between 2004/05 and 2010/11". The Bank attributes this growth to “agricultural modernization, the development of new export sectors, strong global commodity demand, and government-led development investments. ”(Ibid) However, the Bank stressed that the government target to reduce poverty to 22.2 by 2015 was stated as ambitious.(ibid) According to the IMF, (2011) the government's overriding development objectives are attaining “fast, broad based and more equitable economic growth with macroeconomic stability.” In these objectives three main components are highlighted. These are, accelerated economic growth, pro- poor economic growth and macroeconomic stability. To achieve these objectives the government has implemented different policies, strategies and programs. Particularly it is trying to use foreign Direct Investment(FDI) as a vehicle to promote its objectives. FDI is, thus, seen as external investment that complement and support to achieve its objectives and its vision. The Government, among other things, has been investing heavily in economic and social infrastructure, streamlining public services, revamping the tax collection system, and supporting small and medium enterprises (SMEs). It has also prioritized key sectors such as industry
195
particularly light manufacturing and through the establishment of industrial parks and agriculture, as drivers of sustained economic growth and job creation. However, despite the variations and diversity of the statistical data about what percentage poverty has been reduced in the last few years, the harsh reality is that about 25 million people are said to be living in absolute poverty in the past fifteen years living than 0.60 USD a day. Even then, this is an optimistic figure in a country of over 90 million people. Despite the government attempt external assistance in providing basic services remains critical. (See, World Bank,2015: Executive Summary: ix) However, according to the United Nation Development Program (UNDP, 2013) Human Development Report 2013 reported Ethiopia is regarded as one of the poorest countries in the world, whose Human Development Index is one of the lowest out of 185 countries whose life expectancy at birth is also low and where millions of its population are living under poverty and in a degraded land. Given such stark realities, the Ethiopian Government and the ruling party have declared that poverty alleviation is Ethiopia’s primary development concern. It is important to stress that the role and importance of FDI to a given host country depends on the ideological bias and policies of each country and government. Similarly, the advantages and disadvantages of FDI to a country also vary depending on the circumstance of each country. What has been clear over the decades is that the pendulum in favor or against FDI varied depending on the global trends at given time and era. During the era of the Cold war and super power rivalry where capitalism and communism were competing for supremacy, FDI was seen and perceived by the Communist camp as the highest stage of domination and exploitation that leads to a permanent state of dependency and hence to be either discouraged completely or to be regulated strictly allowed very selectively. However, since the triumph of capitalist ideology over Communism and the collapse of the former Soviet Union, in post 1990s, the role of FDI came to occupy a center stage of economic policies of many developing countries including in Ethiopia. In a way, many governments have been swinging from left to right and it is not clear whether the pendulum will shift to a centre half way between left and right ideological landscape in the future. The harsh reality today is that, many developing countries are competing to attract foreign direct investment with a belief that FDI can be a tool for development. In the case of Ethiopia, unlike the Derg era, the current Ethiopian government has privatized many of the state-owned industries at relatively cheap prices; opened several economic sectors to foreign investors and issued several tax and non-tax incentives in order to attract foreign investors. As a subject and policy framework, FDI is still one of the most sensitive, complex as well as ideologically controversial and divisive not only within governments, policy makers and politicians but also within the academia. Both academic and non-academic circles still continue to be divided on the issue whether FDI leads to sustainable development, peace, stability and prosperity or to a permanent state of dependency and eventually create socio-economic and political crises for host countries? There is no doubt that allWestern Governments and capitalist countries as well as European countries, Japan, India, Turkey and many of the South east Asian and Latin and South American countries strongly believe in FDI and hence have been doing what they can to attract FDI to their respective countries.
196
The IMF, the World Bank Group including the IFC and MIGA as well as many of the global, and regional banks such as the African development bank have also played a great deal in promoting such ideology to all African countries that seek loan from them. Moreover, the IMF and the World Bank have also their own technical committees and Centers intended to provide capacity building in their areas of focus and competence. For example, the IMF has regional Technical Assistance Centers intended to build capacity in areas such as Revenue Policy and Administration; Public Financial Management; Financial Sector Regulation and Supervision; Monetary Policy Operations; Economic and Financial Statistics; Government Finance Statistics; Macro-Fiscal Analysis etc. East AFRITAC is the one responsible for East Africa region that includes Ethiopia. Through such Centers and Consultation process based on Art.IV the IMF has also the possibility of influencing and advising countries like Ethiopia to embark in new fiscal, monetary, macro-economic and other reforms. The World Bank Group such as IFC and MIGA as well as other institutions such as the European Union, WTO, WCO, WIPO, UNCTAD etc also focus on other issues such as promoting FDI, privatization, removing obstacles to international trade and investment; reduction of tariff and non-tariff barriers etc. The combined objective of all these institutions is to promote capitalism, free market and free enterprise around the world. It is perhaps mainly due to the external pressures that the Ethiopian Government have introduced many pro-free market reforms. For example, in order to promote and facilitate the role of foreign investment in Ethiopia, the government also embarked on massive privatization measures. It issued Proclamation 146 of 1998 and Proclamation 412 of 2004 with the objectives to: a) change the role of participation of the State in the economy and to implement privatization; and b) encourage the expansion of the private sector and thereby promote the economic development of the country. There is no doubt that over the last few centuries, the spread of capitalism, free enterprise, free market and individual freedoms have generated a phenomenal leap in human progress, leading to both previously unimaginable increases in material living standards and the unprecedented cultivation of all kinds of human potential. The power, creativity, innovative capacity and inventiveness of capitalism and that of the brain power is hypnotic, fascinating and breathtaking. One can only look at what the information, communication and satellite communication revolution has brought about to the world. One can observe the tens of thousands of old and new products, models and brands that have been brought up to the market around the globe. Anyone who goes to the Western Super markets and shopping streets whether in Amsterdam, London, Paris, New York, Vienna Geneva or Paris, one is bound to find tens of thousands of products and articles whether related to food and drink (soft drinks or alcoholic) or health such as medicine and pharmaceutical products or cosmetics, or clothes for men and women, jewelry, bags, shoes and huts for women or school items, hi-fi equipment or the latest luxury cars, planes, boats, motor cycles for civilian consumption or tanks, jets, ammunitions for military use etc. In short, capitalism and free enterprise has managed to help the people of developed countries particularly the rich people to live a life of luxury and comfort whether it is related to having good houses with a good lighting system, luxurious bed, mattress, blankets, furniture, sofas, tables, chair, bath room, carpets, well equipped kitchen utensils, washing machines as well as luxurious villas with beautiful gardens and swimming pools that are bought and sold between 20 to 50 million USD in places such as California and other places. Moreover, one also find thousands of products, fashion designs attractive to women including fashion clothes, shoes, huts, cosmetics, watches, eye glasses, perfumes, jewelry and now smart phones etc. As we all know, men and women love cars and many others. Hence, the ability, creativity, and the ability to

197
invent, produce different types and models of standard and luxurious cars is beyond belief. In a way, although we are living in one world, the people of the world are living in different countries with differing living standards and quality of life although there is a tendency of producing and marketing standardized and universalized products related to food such as fast foods (Macdonald, Pizza, ice cream and cakes), soft drinks such as Coca Cola and alcohol such as Whiskies etc. The same is true with computers, cameras, smart phones, tablets, cars, etc (Fisseha-Tsion Menghistu;2016:1) It should be stressed that capitalism, free enterprise and free market are also driven by: Hard work, discipline, creativity, innovation and technological advancement in ways to
satisfy the rich and the general public The desire to satisfy the never-ending desire, wishes and aspirations of human beings in
general and the rich sections of the population in particular who can afford to pay such goods and services;
The desire and dream to solve whatever technical and non-technical problems and challenges; human beings face in their daily life;
The dream of being successful, rich and celebrity in whatever activity; Knowledge based solutions in every kind of activity or sector than by blind trial and error; Using top athletes, singers, footballers, film start, artists, singers and musicians as a
marketing strategy for their name and their products (See How Samsung, Rolex and many other car and watch makers sell their products;
To explore new frontiers either on earth, under water or on the universe; To promote growth based on efficiency, effectiveness of available scarce resources; Individual curiosity, ambitions, dreams and to achieve much higher ambitions; Money, capital, technology and profit and serve those who can afford or those who have
the ability to pay; Trying to make human beings work like machines and create robots to replace and avoid
or minimize waste; Buy, use and throw of products; All the time creating new models and products and new demands that creates a new
appetite to spend and buy what is available in the market place (Fisseha-Tsion Menghistu;2016:3);
Despite the above factors, there is no doubt that free market and private enterprise are mighty engines, systems and institutions for creating wealth, and prosperity. In practice, the Western model of modernization and advancement reflect the above characteristics and features. Thus, it is right and justified on the part of Western Governments and their giant and global enterprises as well as their people to advocate free market and free enterprise. It has benefited them enormously. The question is whether such free market ideology and policies good and beneficial for the people of Ethiopia whose vast majority living in rural areas are living a life style that Europeans lived during the 19th century? Many genuinely pro-poor scholars and policy makers and governments do not think so. Despite the controversies that have been going on for a long time, foreign direct investment (FDI) has increasingly been recognized as an important factor in the economic development of many developing countries. More and more countries are, in fact, competing through various methods
198
and techniques introducing legal and tax reforms, establishing a one stop shop administrative organs and even devising various means to promote their countries by different techniques and modalities and by creating a favorable and enabling climate to attract FDI. The same is true in the case of Ethiopia. Ethiopia’s policy is currently and mainly focused on the development of the manufacturing sector through the use of industrial parks to attract FDI and to support SMEs. It is neither right nor proper to examine and discuss the prospects and challenges of Foreign Direct investment (FDI) for the transformation of Ethiopia without having a good understanding of the definition, concept and the role of Foreign Direct Investment in general and without examining the 2012 Ethiopian Investment Law and the recent policies related to industrial parks in Ethiopia in particular. Developing countries like Ethiopia cannot achieve their developmental objectives if they are unable to identify what it is they like and want to attract? and how they can achieve what they want to achieve and at what cost? Hence, in order to do justice to the title and the elements thereof and to treat the subject matter of the article in a more meaningful and constructive way, it is absolutely essential to examine and clarify the definition and concept of FDI, its component elements as well as its roles and why nearly all governments encourage and promote FDI to their respective countries? The following section of this article briefly highlights the 2012 Ethiopian Investment policy and law in the context of the title of this article. 2. Towards a Better Understanding of the Definition Foreign Direct Investment (FDI) 2.1 Definition and Concept of FDI
As stated above, foreign direct investment (FDI) is increasingly being recognized as an important factor in the economic development of many developing countries including Ethiopia. The vast majority of developing countries in fact are outcompeting each other by granting tax and non-tax incentives to create a favorable and enabling climate to attract FDI although there are not many serious, unbiased and independent researchers or studies related to the cost benefit analysis of encouraging FDI to many developing countries including Ethiopia. Sometimes, it is a matter of ideological belief than by real facts and findings of scientific research that many countries tend to grant tax and non-tax incentives to encourage FDI to their respective countries. It should be stressed that FDI is one of the highest stages of capitalism and free market policy. Only those who have a much deeper and in-depth knowledge about FDI and the victims of FDI have a much better understanding of the positive and negative aspects of FDI and capitalism. Often FDI is seen as a signal and an evidence of pro-Western, pro-investment, pro free market and pro-free enterprise as is the case with the current Ethiopian Government as opposed, for example, during the Derg era. Those governments whose policies are anti-capitalist and hence anti foreign economic exploitation seek to limit and strictly regulate the modalities of entries into their respective countries. Thus, whether FDI is beneficial or not very much depends from whose perspective or lens one looks at it. Ironically, in spite of the abundant available literature, examining the role of foreign direct private as opposed to public or state to state capital investment, and the widely held belief on the crucial role of
199
FDI by governments of developing countries, there has not been commonly shared or uniform understanding regarding even on the basic definition, concept and content of foreign investment, its precise roles as well as the aims and objectives thereof. The term "foreign capital investment" is defined, by some developed countries and their institutions, as "an investment that is made to acquire a lasting interest in an enterprise operating in an economy other than that of an investor, the investor's purpose being to have an effective voice in the management of the enterprise" (IMF, 1977; Sornarajah, 2004; Fisseha-Tsion and Tsegai, 2013). (Emphasis added) Usually, acquisition of 10% or greater voting control is prima facie treated as a direct investment although the United States Department of Commerce believes that a controlling interest exists where 25% or more of the voting shares is beneficially foreign owned or held (Sharp, 1976; Fisseha-Tsion and Tsegai, Id.,). Foreign direct investment, in its classic and general definition, is the process of transferring and moving in whole or in part the various factors of production and capital assets such as hard currency, plant machinery, equipment, technical and management know-how and even strategic raw materials and other inputs and spare parts by an individual or a company or group of companies (otherwise known as foreign investors) from one country to another country in order to acquire ownership and management control as well as voting right in a business organization or project in ways that would ensure to optimize their profit or return on their investments in sectors, areas and activities open to foreign investors. The above assets combined with land, buildings and other resources or assets owned or leased by foreign investors resources constitute the contents of direct investment (Fisseha-Tsion Menghistu, 1988:53-58). Some of the countries that have had a legal definition of FDI include such items as machinery, equipment, raw materials, tools and spare-parts as well as industrial property rights as was the case in (Brazil, 1962; Egypt, 1974; Indonesia, 1967; Saudi Arabia, 1979). These items were treated as integral component elements of foreign capital investment, in addition to foreign currency duly transferred to the host countries. In short, foreign direct investment equipment, in contrast with indirect investment such as portfolio investment constitute movable property and immovable property such as land, buildings, machinery (Graham and Barry, 2012; Fisseha-Tsion and Tsegai 2013: 62). Foreign direct investment (FDI) as opposed to portfolio investment (where investors buy stocks or bonds of a company in order to diversify their assets rather than to exercise direct control), may thus involve the acquisition of, or an increased holding in an existing enterprise or the organization of an entirely new enterprise or undertaking "Greenfield" investments such as building new factories or other facilities (Christelow, 1979; Fisseha-Tsion and Tsegai, 2013:63). In the case of the later, the technology is provided as part of a complete package (UNCTC, 1987). Foreign investment can thus be direct or indirect and can be conducted by intergovernmental or state enterprises of two or more governments or between a foreign company and the state enterprise of a host country or between private enterprises of capital exporting and importing countries as the case may be. In Ethiopia “investment” is defined as an expenditure of capital in cash or in kind or in both by an investor (including an industrial park developer, industrial park operator or industrial park enterprise as the case may be) to establish a new enterprise or to expand or upgrade one that
200
already exists or to establish a new or to expand or upgrade industrial park operation and industrial park enterprise within the industrial park in accordance with the permit issued or agreement concluded (EIP, 769/2012 cum 2015 Industrial Park Proclamation-IPP;Art.2(8) ). The word “capital” is in turn defined to mean local or foreign currency, negotiable instruments, machinery or equipment, buildings, working capital, property rights, patent rights, or other business assets (Ibid, 2012). Under Article 2(7) of the New Investment Proclamation (769/2012), “foreign capital” is also defined as capital obtained from foreign sources, and includes the re-invested profits and dividends of a foreign investor. Foreign capital investment thus generally includes not only financial resources in hard currency paid for acquisition of shares in a company but also other forms of assets such as movable and immovable property as well as intangible property rights and interests invested with the hope of deriving income or profit within or outside the industrial park by public, public-private or private entities.(Fisseha-Tsion and Tsegai:63.See also IPP:Art.2(2)).This implies that almost anything including mineral resources such as gold, oil, and many other minerals, as well as currency and shares invested for profit motive can fall within the definition of investment. It can thus be argued that FDI is any type of tangible and intangible investments contributed and organized by foreign investor such as in hard currency, plant, machinery, equipment, technology and related items for profit motive irrespective of the sector or branch of industry it is invested and the type of business organization used as a vehicle to manage such investments directly or indirectly within or outside the industrial park. It must be noted, however, that investment dealing with the 2015 Industrial Park Proclamation and Regulations issued related thereto also have some unique features. What is clear is that the content of foreign capital investment not only includes the notion of property in the traditional sense, but also intellectual property and other forms of property and rights that have a monetary and economic value (Higgins, R., 1982; Fisseha-Tsion and Tsegai:63). This is because technology, intellectual, industrial, commercial and other types of property rights have become strategic and precious business assets for foreign investors more than ever before. Sometimes direct investment also includes not only gross inflows but also retained earnings such as re-invested profits (Nwanna, 1986; Fisseha-Tsion and Tsegai: 63). In short, investment is much broader than the capital. It is for this reason that the author thinks that the use of “foreign investment” is a more appropriate terminology than “foreign capital investment”. It is also important to note that according to the Multilateral Agreement on Investment (MAI), investment is defined rather very broadly. It is defined as “every kind of asset owned or controlled, directly or indirectly, by an investor" (Sforza, 1998: 3; Fisseha-Tsion and Tsegai :63). These assets include natural resources like minerals and oil (Ibid,), portfolio investment and minority stock holdings, all forms of intellectual property rights like patents, brand names and good will as well as enterprises (Ibid). Moreover, MAI's definition of investment includes “the products of an investment”. This container type definition is intended to be broad enough to cover all possible assets of value, activities and transactions relating to international business. What distinguishes direct from indirect foreign investment is that in the case of DFI, foreign investors make tangible and physical investment assets by establishing a fixed place of business or by establishing a permanent establishment or by incorporating a business organization or body as well as manufacturing and processing facilities or by engaging in commercial farms in a host country as opposed to buying shares or in a private-equity related investment modality.
201
FDI, unlike international trade, is, therefore, more than a contract of sale to transfer goods and render services or a contract of lease to use physical plants and machinery, which is generally categorized as a trade of goods and services. FDI involves, among others, the production of goods and rendering of services either for domestic consumption or for export or both, which would otherwise not have been done either by the state or domestic private enterprises. The degree of foreign ownership, control and involvement within the economy of host countries are thus an important feature of foreign investment. The greater the commitment in the country, the greater the investment and the involvement of the foreign investor in the host country. Once foreign investment is dully granted a permit, foreign firms have the right to make many strategic plans and decisions as to what should be done next? Who should do the operational and implementing tasks and at what cost? How much should be invested including for expansion? Who shall purchase and supply machinery? Who shall service and maintain such machinery? How much of the capital cost is used to purchase foreign investments etc.? In short, the investor has to make strategic decisions on all crucial and important issues related to his investments including those related to procurement planning and management as well as risk identification and management issues. In a way at a macro level, FDI in principle can be equated with allowing foreigners to come and own as well as manage a family kitchen with all its positive and negative ramifications depending from whose perspective one looks at it. 2.2 Rational for Encouraging FDI in Developing Countries and Ethiopia: Revisiting Some
Issues Many if not all governments of developing countries lack the capacity (whether it is technology, hard currency or technical and management know-how) to produce goods and render services as well as what they require to improve the quality of life of their own people including the satisfaction of basic needs including decent health care system, good and quality education, decent work or employment as well as build the necessary infrastructural network such as roads, bridges, railways, dams, air and sea transport, good information and communication highway etc. all of which may not be met adequately by governments alone. Thus, some of the main reasons why many countries encourage foreign direct investment (FDI) is because although states have the primary obligation to bring about sustainable development for their respective citizens, foreign investors (EIP, 769/2012) are also hoped to play a vital part in such a process. They believe that FDI has strategic or catalytic role in augmenting, maximizing or optimizing many other socio-economic benefits and to achieve the developmental objectives and aspirations of governments and their people. This certainly also depends very much on what kind or type of society one seeks to have and create in a given country?
A survey (Fisseha-Tsion Menghistu, 1988) of the foreign investment laws of many developing countries in Latin America, Asia and Africa before the end of the Millennium showed that the goals which some of these countries hope to achieve include: "economic and social development" (Egypt), "increased production and productivity for national development" (Ghana), "building a self-reliant economy" (India), "accelerating...economic development" (Indonesia, Sierra Leone), "realizing sound development of a self-sustaining national economy and social welfare" (South Korea), "to stimulate a just and balanced development and consolidate the country's economic independence"
202
(Mexico and Mauritania), achieving "economic and social development" (Thailand), "accelerate the sound development of the national economy...and to promoting social justice" (Philippines), etc. The emphases of many countries appear to be on growth, industrialization and economic development and not on sustainable development. In Argentina, for example, the objectives of its series of Industrial Promotion Laws has been to promote regional development and the balanced establishment of industries, improve efficiency in industries through modernization, specialization, integration, merger, mass production, structural changes, and to discourage monopolies and oligopolies; promote new industrial activities in border zones; promote industrial development of national security and defense industries; and to facilitate the transfer of industries from denselypopulated areas to other zones (Taxation in Latin America-TLA, 1987). It is important to note that it is not only poor countries that seek to attract foreign investors. In actual fact, in 2010, the world’s highest recipients of FDI were the United States, China and India to the tune of 194bn, 85bn and 44.8bn respectively. India’s inflow of FDI has even been raised to 50.8bn in 2012 (Wikipedia.org, 2012). But the type of FDI that developed countries seek to attract is not the same as that of Ethiopia. Whatever the case may be, it is now universally accepted that many developing countries cannot bring about either economic growth or sustainable development on their own efforts and that growth can only be achieved with the assistance of foreign both private and public investment. That is why most, if not all governments now acknowledge that the private sector is the engine of their economic growth. In view of this, nearly all governments have passed general and specific measures encouraging, stimulating and supporting activities of the private sector in the economy. As stated above, many fiscal and non-fiscal incentives are also granted to foreign investors because it is believed that foreign investment would not be attracted without such incentives and because they also believe it is of great economic benefit to their respective countries and peoples. This is also generally the case with Ethiopia, although it must also be stressed that in the case of Ethiopia, it is striving to bring about economic growth and economic development by a strategy of mobilizing domestic resources. Unlike many African countries, Ethiopia seems to focus on the role of the state in the economy. It has also been officially acknowledged by the IMF and the World Bank, that in Ethiopia, a substantial part of the strategic economic sectors are in the hands of the state and state enterprises and not in private/corporate hands. Even the 2015 UNDP Human Development Report also acknowledge that the success in economic growth in Ethiopia is based on optimal role of the state and the private sector in an economy which has made significant progress under a Developmental State model. For example, most if not all the multi-million and multi-billion Dollar Mega projects that are beyond the financial and technological capacity of the Ethiopian domestic sector are financed by the Government. It is also estimated that no less than 70% of the revenues and surpluses are mobilized from such domestic resources, although the country also heavily depends on foreign loans and credits. It should, however, be stressed that the Ethiopian Government is under extreme pressure from IMF and the World Bank Group and many other countries and institutions to allow greater private sector participation and to liberalize its economy and financial institutions, privatize its strategic sectors including the banks and insurance sector and to establish stock market and introduce many other
203
reforms that would attract more FDI. Even the UNDP states that the Ethiopian Government still needs to promote a more dynamic and diversified domestic private sector that serves both local and export markets and offers more Ethiopians productive employment. There is significant scope for improvement because the share of the private sector in employment, production and investment remains low. The Government should continue investing in human capital to drive growth, innovation and productivity (UNDP, 2015: Executive Summary:1). Whatever the case may be the following paragraphs attempts to examine and briefly review the 2012 investment law of Ethiopia and what it seeks to achieve? 2.3 Objectives of the 2012 Ethiopian Investment Law and New Changes and Variations The main aims and objectives of the new Ethiopian Investment Proclamation No. 769 of 2012 are to encourage and expand investment, especially in the manufacturing sector; strengthen the domestic production capacity; further increase the inflow of capital and speed up the transfer of technology into the country; accelerate the economic development of the country and improve the living standards of its peoples; enhance and promote the equitable distribution of investments among regions and benefit the society by ensuring competitiveness among investments made by investors; and put in place a system of supervision to ensure that permits and incentives granted to investors are used for the intended purposes and to make sure that the system of administration of investment is transparent and efficient (EIP, 769/2012) See also Fisseha-Tsion and Tsegai,2013:70). One of the main reasons why it has become necessary to revise the existing law on investment, in addition to the other reasons stated above, is because the industrial sector is believed and expected to play a leading role in the development of the country’s economy and it has been considered that the establishment of Industrial Development Zone by the federal government or by a joint investment of government and private sector is one of the preferable strategies to create favorable and competitive environment for the development of manufacturing industries through their linkages and value creation (Ibid, 2012, Art. 33(1) and (2) ( See also Fisseha-Tsion and Tsegai, 2013:70). Although the Ministry of Industry is empowered to administer and supervise industrial development zones, the Ethiopian Industrial Zones Development Corporation that undertakes the development of industrial zones by the Federal Government has been established (See Regulation no.326/2014 and 2015 IPP: Art33(4)). However, in the end it is the Council of Ministers that is supposed to approve plans and agreements Ethiopia will make with respect to such industrial development zones (Art. 34(1) and (2)). The underlying rationale and philosophy is that the Federal Government of Ethiopia strongly believes that the encouragement and promotion of such investments have become necessary in order to “accelerate the economic development of the country and to improve the living standards of its peoples” (Ibid, 2012; EIP, 280/2002; SEE also Fisseha- Tsion and Tsegai:2013:70). Article 5 of Proclamation No. 769 of 2012, which is not applicable to investments in the prospecting, exploration and development of minerals and petroleum resources (EIP, 769/2012, Art. 3) states that the objectives of the investment policy of the Federal Democratic Republic of
204
Ethiopia are designed “to improve the living standards of the peoples of Ethiopia through the realization of sustainable economic and social development”, the particulars of which are to:
1) Accelerate the country’s economic development; 2) Exploit and develop the immense natural resources of the country; 3) Develop the domestic market through the growth of production, productivity, and services; 4) Increase foreign exchange earnings by encouraging expansion in volume and variety of the
country’s export products and services and the improvement of their quality as well as to save foreign exchange through production of import substituting products;
5) Encourage balanced development and integrated economic activity among the Regions and to strengthen the inter-sectoral linkages of the economy;
6) Enhance the role of the private sector in the acceleration of the development of the country’s economy;
7) Render foreign investment play its proper role in the country’s economy; 8) Create wide employment opportunities for Ethiopians and to foster the transfer of technical
know-how, managerial skills, and technology required for the progress of the country (Fisseha-Tsion and Tsegai, 201:71). The above objectives are also a restatement of Ethiopia’s Investment Proclamation (Proclamation No.280/2002. Moreover, Art. 2(11) of Proclamation 769 of 2012 and Art. 2(13) of Proclamation No. 375 of 2003
recognize what is called “Export-oriented non-equity based foreign enterprise collaboration”. It is defined to mean a 100% export-oriented contractual agreement between a domestic investor and foreign enterprise in which the foreign enterprise provides, among others, all or some of the following:
a) Guaranteed external market access; b) Production know-how of products for export market; c) Export marketing know-how; d) Export business management know-how; e) Strategies for the supply of raw materials and intermediate inputs needed for export
products (Fisseha-Tsion and Tsegai, 201:71-72). The above is intended to influence foreign investors to transfer and even guarantee to domestic enterprises certain benefits in areas related to the export sector. It is also important to note that some of the main reasons why the Ethiopian Government grants incentives is because it believes that it is necessary “to ensure economic development by accelerating industrial growth of the country and to improve the foreign exchange earning needed for development and investment;”(ETDISP, 768/2012) “to achieve transformation into industry led economy… to establish a system of reinforcing value creation in the process of production;” (ETDISP, 768/2012, Para 2) and “to create conductive environment for domestic products to become competitive in international commodity markets…” (Ibid, Para 3) (Emphasis in Italics added). In order to facilitate the realization of such objective, the government has designated certain places as” industrial development zones”. In spite of the above stated noble objectives, the 2015 World Bank Report acknowledges that the share of the manufacturing sector in GDP remained just above 4 percent of GDP for most of the past decade. Furthermore, Ethiopia has not made significant progress in pulling labor out of agriculture into more productive and industrial jobs. The share of employment in the manufacturing sector has changed only slightly and is virtually unchanged since 1999 at below 5
205
percent of total employment. (World Bank, 2015; Executive Summary:10) The World Bank Report also reiterated that foreign owned firms appear more productive than domestic, private, young firms and that cumulatively more FDI firms succeeded in moving from the investment stage to operational phase than domestic firms. Moreover, FDI has a better “conversion” rate over domestic investors. Given such realities, whether it is realistic for Ethiopian domestic enterprises to compete with foreign firms in international market at present is debatable. Optimists claim that it is possible. But critics including this author want to see Ethiopia to be the rising star of Africa and restore its old glory, looking at what is happening on the ground and beyond the statistical data, it does not appear that the optimism is founded on the concrete socio-economic, institutional, organizational and political conditions of the country. Moreover, the country’s technological base and infrastructure still remain very low and the mind set and cultural factors donot appear fertile unless a mental and cultural and ethical revolution takes place in earnest. 2.4 Areas and Activities Reserved to the State, Private Foreign and Domestic Investors Unlike many African countries, in Ethiopia all sectors and activities are not open to foreign investors. Under the new investment law, the areas open for foreign investors (EIP, 769/2012, Art. 2(17) as well as investment exclusively reserved for domestic investors are to be determined by regulation to be issued by the Council of Ministers (EIP, 769/2012, Art. 7). Areas of investment reserved exclusively for the Government are:
a) Transmission and distribution of electrical energy through the integrated national grid system; (Ibid, Art. 6(1) (a))
b) Postal services with the exception of courier services; (Ibid, Art. 6(1) (b)) c) Air transport services using aircraft with a seating capacity of more than fifty passengers;
(Ibid, Art. 6(1) (c)). Areas open to International joint venture with the government are:
a) Manufacturing of weapons and ammunitions; (Ibid, Art. 6(2) (a)) and b) Telecom services; (Ibid, Art. 6(2) (b) The Council of Ministers may whenever necessary determine by issuing regulation, areas of
investment exclusively reserved for the government or for joint investment between the government and private investors (EIP, 769/2012, Art. 6(3)). As stated above, one of the main focus of the Ethiopian government in post 2010 period is to promote manufacturing led industrialization to complement Agricultural Development Led Industrialization(ADLI). This is because; it believes that the industrial sector should play a leading role in the economy for the years ahead. However, the formation and establishment of organs responsible for administering and supervising industrial development zones, the procedures and criteria for the designation of industrial zones and the determination of their boundaries, the rights and obligations of investors operating in industrial zones, the execution and supervision of the various services that they are entitled to obtain from the Government, of the various constructions they undertake in the zones, the incentives that they are entitled to and all other matters necessary for the implementation of the industrial development zones are to be determined by regulations to be issued by the Council of Ministers (EIP, 769/2012, Art. 35). (See also Art 5(3)(6-7); Art. 9(1 and 3), Art. 13(2); art. 14(2); Art. 15(2 and 4-5); Art. 18(4); Art. 22(5),
206
Art. 23; Art. 24(3), Art. 26; Art. 27(4); Art. 28(3); Art. 29(3 and 6), Art. 31(6) and Art.32(1) Some of the main factors that attract FDI to countries like Ethiopia are diverse. They include fiscal incentives such as tax holidays, exemption from many direct and indirect taxes as well as non fiscal incentives. The Ethiopian Government offers massive tax incentives (see for example, Regulation 270 of 2012). However, whether tax incentives alone are most effective in attracting FDI is debatable. The study made by the principal author in the 1980s show that tax incentives alone are not as effective as widely believed (See Fisseha-Tsion Menghistu , 1988:157-183). This view is now being accepted even by some, if not many experts of the World Bank and the Department of Fiscal Affairs of the IMF. 3. Prospects and Opportunities of Attracting FDI to Ethiopia 3.1 Prospects and Opportunities There is no doubt that Ethiopia has a great deal of investment opportunities, among others, in: a. Agriculture and Agro-processing such as the production and processing of agricultural
crops such as cereals, pulses and oil seeds. A broad range of fruits and vegetables and cut flowers are fast-growing exports. Coffee, cotton, tobacco, sugarcane, tea and spices are the main commercial cash crops grown in Ethiopia. Since Ethiopia has the largest livestock population in Africa, there are also investment opportunities for introducing modern commercial livestock (cattle, sheep and goats) breeding and processing, plus significant fresh water fishery and livestock resources. Investment is also required in the provision of agricultural support services such as pest and disease control, agricultural machinery, cold storage, etc. A number of crops are grown organically.(EIA guide 2013: 4)
b. Manufacturing: The major manufacturing activities are in the production of food, beverages, tobacco, textiles and garments, leather goods, paper, metallic and non-metallic mineral products, cement and chemicals. Under Growth and Transformation Plan (2010/11-2014/15) of the country, production of textile and garments, leather products, cement industry, metal and engineering, chemical, pharmaceuticals and agro-processing are priority areas for investment.
c. The service sector is an important potential for investment as well d. Tourism - The country has many untapped tourism potential, particularly in the historic Northern route, with investment opportunities in hotels, lodges and international restaurants. Historic sites include the old capital of Gondar with its castles, the city of Lalibela and the island monasteries of Lake Tanaas well as many tourist sites in southern regions. Getahun Negash, 2014:52) The country is as beautiful if not more beautiful than Switzerland in terms of its scenery and natural beauty except that it has snow covered mountains and valleys.
e. New Developments related to Industrial Parks To translate the implementation of the new policy and priority objectives of the GTP –II, the Ethiopian Government has in 2015 issued Industrial Parks Proclamation no. 886/2015 and many other subsidiary laws and regulations so much so at times it is difficult for an outsider to cope up
207
with the fast-increasing regulatory laws and fast changing and amendment of even the 2012 Investment Proclamation by new law Industrial park related laws and governance architecture thereof. It would not thus be surprising if all the relevant laws and changes are not comprehensibly covered by this article. At any rate, Art. 2(1) of the 2015 Industrial Park Proclamation (IPP:2015) defines industrial Part to mean an area with distinct boundary designated by the appropriate organ to develop comprehensive, integrated, multiple or selected functions of industries, based on a planned fulfillment of infrastructure and various services such as road, electric power and water, one stop shop and have special incentive schemes, with a broad view to achieving planned and systematic, development of industries, mitigation of impacts of pollution on environment and human being and development of urban centers, and includes special economic zones, technology parks, exportprocessing zones, agro-processing zone, free trade zones and the like designated by the Investment Board. The main underlying rationale for the promotion and the establishment of industrial parks is because the Ethiopian Federal and regional Governments strongly believes that:
a) It is necessary to accelerate the economic transformation and development of the country through the establishment of industrial parks in strategic locations around the country to promote and attract productive domestic and foreign investment thereby upgrading industries and generate employment opportunity; b) There is a need to enhance export promotion, protection of environment and human wellbeing, economical land use and establishing and expanding planned urban centers and
c) It is of paramount importance to have a legal framework or legislation in respect of establishment, development, operation, management and regulation of the Industrial Parks (IPP, Preamble para.1-3 cum Art.3).
Among the main objectives of the 2015 Industrial Park Proclamation are to: 1) Regulate the designation, development and operation of industrial parks in the country; 2) Contribute towards the development of the country’s technological and industrial
infrastructure; 3) Encourage private sector participation in manufacturing industries and related investment; 4) Enhance competitiveness of the country’s economic development; and 5) Create ample job opportunities and achieve sustainable economic development (IPP: Art.
4(1-5) It is interesting to stress that by 2016, 14 local and 47 foreign investors are involved in the Industrial parks.
208
3.2 Some Factors that Attract FDI to Ethiopia 3.2.1 General Factors The factors that are deemed to attract FDI are too many and sometimes endless and can be divided into macro or general factors as well as micro or enterprise related factors. The factors that help to attract FDI to developing countries in general and Ethiopia in particular are many and vary from country to country depending on the resources endowment and; potential of a country and the type of companies that might be interested in a given country. Here the simple demand and supply principle applies. For example, mining companies will be interested to invest in countries where there is abundant commercially exploitable mineral and oil resources in addition to many other favorable factors that help to attract FDI. Similarly, agricultural and agri-based and food processing companies might be interested to invest in countries where the potential for agro based industries is the greatest and where there is plenty of fertile land, water, good climatic conditions, market potential etc. Manufacturing companies might be interested in countries where the cost of producing, manufacturing, processing products is the cheapest and where access to markets and logistical factors are attractive in addition to many other factors that help to attract FDI. The needs and pre- conditions for attracting foreign banks, insurance companies and other financial actors, agents and institutions are, however, different from investors in other sectors of the economy although the relationship and link between investment and finance are interdependent and inseparable. This is to stress that the top preconditions to attract, for example, foreign banks, insurance companies, are not one and the same as for attracting agricultural, mining and manufacturing companies although there is inseparable functional link and relationship between banks and financial institutions on one hand and the other investment community on the other. In addition to the general policy and legal framework relevant to all foreign investors, the top priority needs of agricultural, manufacturing and mining companies might be land; water; mineral and oil resources; availability of cheap labor etc whereas the needs and priorities for trading companies are different. The same is true for foreign banks and insurance companies. What the foreign banks and insurance companies might be more interested to know and be assured is whether particular favorable policy and legal framework that attracts foreign banks, insurance companies and other financial agents, actors and operators that would make them feel comfortable and safe to do with their money/currency and asset management as well as insurance related business transactions. If a country is lucky to have all the factors and conducive environment that attract FDI, all types and varieties of companies involved in different sectors of the economy, then such a country has the potential of being successful in achieving its goals, if all other conditions and factors that help to attract general and particular sectors of the economy are also put in place. However, the harsh reality of many developing countries is that their priorities, needs, resources and investment potential are different and hence their policy responses are also vary tremendously. That is why both developed and developing countries want their respective countries to be preferred investment destinations based on their comparative advantages. This implies that the type and category of investors they want to encourage vary immensely. As far as Ethiopia is concerned it
209
can be generally said that it is endowed with fertile land, water, abundant labor and many other mineral and oil resources potential. What Ethiopia lacks is mainly applied, appropriate, functional and developmental technology; adequate financial capital to finance its developmental projects and perhaps good corporate and political governance, marketing skills; smart and intelligent policy and legal framework; and efficient institutions and administration system. FDI must thus be effectively, and systematically used to fill some gaps. This implies that FDI must be seen nothing more than supplementing and complementing national efforts and development strategies. It should be stressed that the World Bank Group such as IFC, MIGA, and many other UN Agencies such as UNCTAD, and the international business communities as well as various scholars have undertaken many studies dealing with the various factors that might help to attract FDI to developing countries. The author also is aware that there have been some studies related to such issues in the context of Ethiopia. However, many of the studies that have so far been made on Ethiopia are simplistic, shallow and not sector specific. Above all, many of the studies are based on a recycled information or studies made on a copy and past mentality and fromsecondary sources, literature, reports of other studies made and on the experiences gained there from by the World Bank Group and other institutions for other developing countries. There is a simplistic and naïve notion that what works, for example, in China, South Korea, India, Turkey, Singapore, Malaysia, Nigeria, Argentina, Brazil, Mexico, Mauritius, Rwanda, Kenya and even the Netherlands might also work for Ethiopia. While there might be some lessons to be gained from the experiences of other countries, the author strongly believes that one jacket fits all mentality and policy is a wrong start and strategy to address many complex and intertwined problems that are specific to each country having different history, political, economic, legal, cultural, ethical, moral , spiritual aspects as well as with differing needs and priorities as well as with different set of problems and technological and institutional infrastructure as Ethiopia. There is no doubt a lot remains to be done. At any rate, the general factors that help to attract FDI to Ethiopia are too many to be documented here. However, according to the author, among some of the many general factors, prospects and opportunities for attracting FDI to Ethiopia include:
a) Favorable Macro Economic Policy and Economic performance b) Government commitment and capacity to implement its policies, programs and enforce its laws and programs
c) Relative peace and stability compared to other neighboring countries d) Abundant cheap and labor for labor intensive projects and activities e) Literate and trainable labor force f) Easy access to loans and local currency for foreign investors that investment in priority
sectors of the government g) The potential of having an abundant land, water, power and other infrastructural facilities
if they can be harnessed properly and made accessible and available
210
h) Huge population and market potential for import substitution related investments i) Geographical location to market destinations for exportable products j) One stop shop integrated services rendered to foreign investors from issuing of
investment and business related license to providing efficient and un interrupted access of power, water and other public services that would reduce the cost of production, transportation and marketing etc
k) Very favorable integrated, mult dimensional, and comprehensive access and one stop shop services and facilities related to industrial parks destined exclusively for exports and that would help mitigate availability of shortage of hard currency to lubricate the economy
l) Favorable climate to live and invest. It is a country with 13 months of sun shine and the origin of mankind. m) Very hospitable, and friendly people and society for foreign investors
Moreover, a better investment climate that fosters the growth of existing firms, while encouraging the creation of new firms is key to attracting and increasing private sector investments. Apparently, the business trips made by the Prime Minister to some countries with whom Ethiopia seeks to promote trade and investment do also help to encourage foreign investors to come and seek business opportunities in Ethiopia. It should be stressed that foreign investors are very much interested to go anywhere in as long as they think and believe that they will maximize their profits for their shareholders. As stated above, one of the main factors that are deemed and perceived to help in attracting FDI are tax and investment incentives. The section below attempts to provide a brief highlight the types of general tax incentives granted by Ethiopia. 3.2.2 Fiscal incentive Areas of investment that meet the investment objectives stated in Art. 5 of the new Proclamation are eligible for massive tax incentives specified by Regulation nr. 270/2012 and other amendments. The regulations determine the type and extent of the entitlement to incentives (EIP, 769/2012, Art. 23(1&2)). The following are some of the general fiscal or tax incentives offerd by the Council of Ministers.
a) Custom Duty: Foreign and domestic enterprises engaged in eligible new enterprises or expansion projects such as agriculture, manufacturing, agro-industries, construction contracting, etc. are eligible and entitled to:
1) 100% exemption from the payment of customs duties and other taxes levied on imports is granted to all capital goods, such as plant, machinery and equipment and construction materials;
2) Spare parts worth up to 15% of the total value of the imported investment capital goods, provided that the goods are also exempt from the payment of customs duties; Moreover, investment capital goods imported without the payment of custom duties and other taxes levied on imports may be transferred to another
211
investor enjoying similar privileges b) Income Tax Holidays and Exemptions: If an investor engaged in new manufacturing, agro-processing, the production of agricultural products and investment areas of information and communication technology (ICT) development or any investor who invest to establish a new enterprise is entitled to income tax exemption from 1 to 8 years for Addis Ababa and special zone of Oromia surrounding Addis Ababa and 2-9 years for Other areas such as the regional state of ( Gambela , Benshangul Gumuze, Afare(except in areas within 15 Kilo meters right and left of the Awash river), Somali, Oromia (Guji and Borena Zone), SNNPR(south Omo Zone, Segen Area peoples Zone (derashe, Amaro, Konso, and Burji), Bench-Maji zone, Sheka zone, Dawero Zone, Kefa Zone, Konta and Basketo special Woreda ). Any investor who exports or supplies to an exporter as production or service input, at least 60% of his products or services is entitled to income tax exemption for two years in addition to the exemption provided. (Investment proclamation No.769/2012). b) Deductions Any investor who invests to establish a new enterprise in the above other areas is entitled to
income tax deduction of 30% for three consecutive years after the expiry of the income tax exemption period specified. c) Loss carry forward Business enterprises that suffer losses during the income tax exemption period can carry forward
such losses, following the expiry of the exemption period, for half of the tax exemption period. 3.2.3 Non-Fiscal or Non-tax Incentives The non- fiscal incentives given to all exporters are the following: Investors who invest to produce export products are allowed to import machinery and equipment necessary for their investment projects through suppliers’ credit. Investors who invest in areas of agriculture, manufacturing and agro-industry are eligible to obtain loan up to 70 percent of their investment capital from the Development Bank of Ethiopia (DBE) if their investment is sound, feasible and commercially viable. Investors who invest in priority areas such as textiles and garments, leather products, agro-processing, chemicals and metals etc destined mainly export products are also provided land necessary for their investment at reduced lease rates. (see also Getahun Negash, 2014:58-60). It is important to stress that in addition to the general tax and non-tax incentives granted to the
priority and eligible investors, there are some special and additional tax incentives, services and facilities provided to those investing in the industrial parks. 3.3 Incentives, Guarantees and Remittances Intended to Promote FDI to Ethiopia
3.3.1 Ownership of Immovable Property by Foreign Investors in Ethiopia

212
Notwithstanding other Articles to the contrary, a foreign investor shall have the right to own a dwelling house, a car for his business and other immovable property requisite for his investment. This will also apply to those who have invested prior to the issuance of this new Investment Proclamation (EIP, 769/2012, Art. 24(1&2)).
3.3.2 Nationalization and Expropriation and Compensation The new Investment Proclamation makes it clear that no investment may be expropriated or nationalized except for public interest and then, only in conformity with the requirements of the law. If expropriated or nationalized for public interest, however, adequate compensation, corresponding to the prevailing market value, must be paid in advance (EIP, 769/2012, Art. 25(1&2)).
3.3.3 Remittances In respect of his approved investment, any foreign investor has the right to remit out of Ethiopia in convertible foreign currency at the prevailing rate of exchange on the date of remittance:
a) Profits and dividends accruing from investment; b) Principal and interest payments on external loans;
c) Payments related to a technology transfer agreement registered in accordance with Article 21 of Proclamation 769 of 2012; d) Payments related to a collaboration agreement registered in accordance with Article 22 of
the New Proclamation; e) Proceeds from the transfer of shares or of partial ownership of an enterprise to a domestic
investor. f) Proceeds from the sale or liquidation of an enterprise; and
4. g) Compensation paid to an investor pursuant to Article 25(2) of the New Proclamation. Governance Structure and Architecture Related To FDI
Issuing investment law is one thing, but creating an efficient, well equipped and capable human resources and other service rendering facilitation to implement the law is quite another. A good law is as good as it is implemented. Based on this principle the Ethiopian Investment Commission and the powers and duties of the Ministry of Industry have been revised. 4.1 Enhanced Powers and Authority of the Ethiopian Investment Commission and Related
Issues It is also important to stress that the 2012 Investment Law also attempts to restructure the administrative structure regarding the allocation of responsibilities and tasks between the Federal and the Regional investment Authorities. The Ethiopian Investment Commission has jurisdiction regarding:
a) Wholly foreign owned investment; b) Joint investment made by domestic and foreign investors; c) Investment made by a foreign national, Ethiopian by origin, treated as a domestic investor
pursuant to Article 2(5) of this Proclamation;
213
d) Investment made, in areas eligible for incentives, by a domestic investor who is required to obtain a business license from the concerned federal organ (EIP, 769/2012, Art. 4(1)). 4.2 Organs of Investment Administration and the Introduction of One Stop Shop Service The organs of investment administration comprise the EIC and regional investment organs to be
defined by the laws of the respective Regions (EIP, 769/2012, Art. 27). The powers and duties of the Commission and the Investment Board are, however, specifically laid down in Art 28(1-18) and Art 29 respectively and as amended by the Ethiopian Investment Commission Establishment Regulation Nr. 313/2014. One of the most significant and perhaps innovative developments of the New Investment Proclamation is the introduction of integrated and coordinated one stop shop service intended to provide investors an efficient and effective service they need in the whole investment processes. The types of services to be provided by the Commission representing the competent federal or regional executive organs are:
a) Providing exemption incentives from the payment of customs duty; b) Issuance of construction permit; c) Notarization of memorandum and articles of associations and amendments thereto; d) Effecting commercial registration, and renewal, amendment, replacement or cancelation
of same; e) Effecting registration of trade or firm name, and amendment, replacement or cancelation
of same; f) Issuance of work permits to expatriate employees, and renewal, replacement, suspension
or cancelation of same; g) Issuance of business license; h) Grading of construction contractors; i) Issuance of tax identification number (TIN) (EIP, 769/2012, Art. 30(2)(a-h)).(See also
Fisseha-Tsion and Tsegai, 2013:77) It should be stressed that amendments, renewal, replacement or cancelation pertaining to the services referred to in paragraphs (c) to (f) above must only be made by the Commission until the investor is issued with a business license(EIP, 769/2012, Art. 30(3)). Special procedures, however apply to industrial parks.
4.3 Specific Services provided by the Commission on Behalf of Foreign Investors Under Art. 30(4), the Ethiopian Investment Commission has the specific duty to provide certain specific services on behalf of foreign investors. These include execution of:
a) Investors’ requests for land required for their investment projects; b) Investors’ requests for loan; c) Foreign investors’ requests for residence permits; d) Investors’ requests for approval of environmental impact assessment studies conducted on
their investment projects; and
214
e) Investors’ requests to acquire water, electrical power and telecommunication services (EIP, 769/2012, Art. 30(4)). In the last few years, a great deal have changed even within the institution of EIC. It has been
restructured to address the challenges. For example, it is now being managed by a senior Management Team consisting of the Commissioner, three Vice Commissioners and two other heads of the Secretariat dealing with foreign investment promotion affairs and another one dealing with the coordination of domestic investment matters. The three vice Commissioners have also specific tasks. One deals with operational, the second deals with industrial park related and the third Vice President deals with policy related issues. The human resources deficit of the EIC is being addressed. More experts and graduates of Business Colleges are being recruited and there is even a plan to establish a new Training Institute that will provide training more or less on economic diplomacy and business leadership related issues. In order to attract prospective investors, the EIC has strengthened its research Department. Such Department has managed to undertake many feasibility studies on priority projects thereby helping to reduce the cost of investors in preparing such things as preparation of feasibility studies, business plans and other services etc. In order to bolster such activities, the former industrial Project Services Agency has been incorporated within the EIC. In order to minimize the lack of coordination that existed in the past, a number of inter- Ministerial Committees have been established to coordinate such gaps. The Commission is accountable to the Board which is chaired by the Prime Minister or his representative as the case may be. In a way, the new Board members may be seen as a mini Council of Ministers consisting of Ministers and most senior experts dealing with investment, Finance and Development related issues. It should be stressed that any serious study related to FDI involves dealing with many diverse and multidisciplinary issues and subjects involving development, socio-economic, fiscal, tax and non-tax policy, legal framework and administration as well as institutional and the architecture of governance related thereto. This is to stress issues dealing with FDI are not as easy and as simple as they appear. The complexity and the various factors that may be taken into account to improve the implementation of FDI and the various factors that must be taken into account are many as shown in figure 1 below.
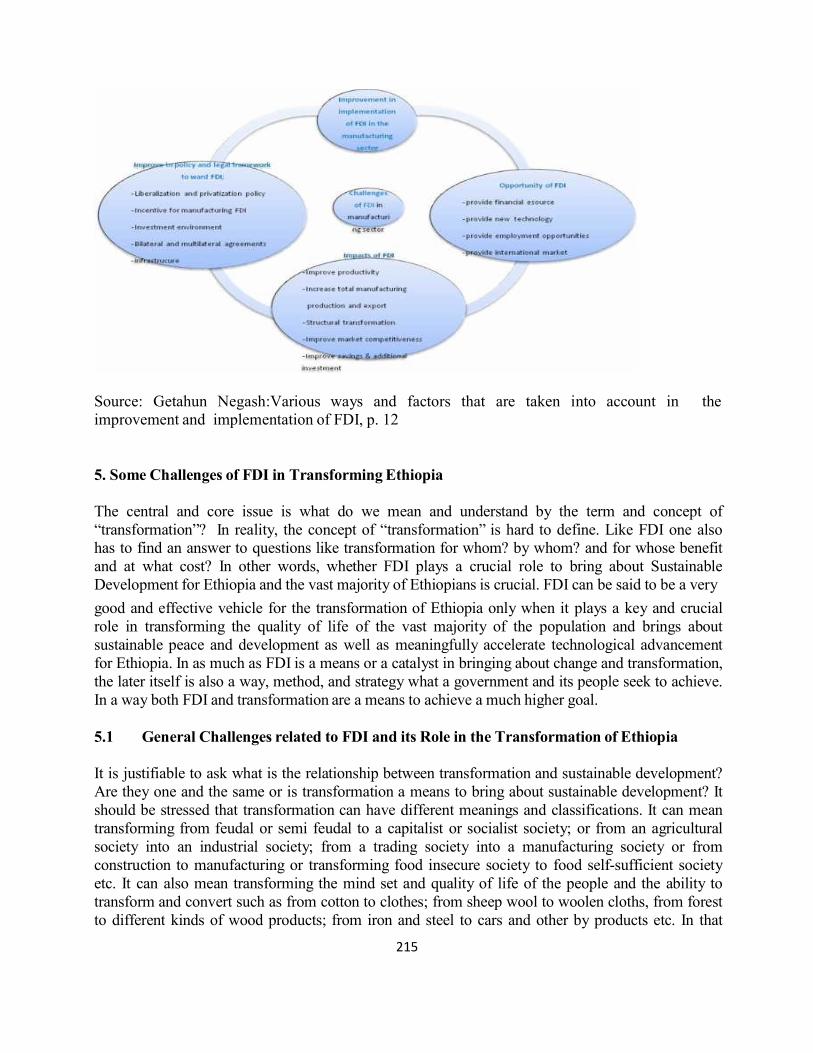
215
Source: Getahun Negash:Various ways and factors that are taken into account in the improvement and implementation of FDI, p. 12
5. Some Challenges of FDI in Transforming Ethiopia The central and core issue is what do we mean and understand by the term and concept of “transformation”? In reality, the concept of “transformation” is hard to define. Like FDI one also has to find an answer to questions like transformation for whom? by whom? and for whose benefit and at what cost? In other words, whether FDI plays a crucial role to bring about Sustainable Development for Ethiopia and the vast majority of Ethiopians is crucial. FDI can be said to be a very good and effective vehicle for the transformation of Ethiopia only when it plays a key and crucial role in transforming the quality of life of the vast majority of the population and brings about sustainable peace and development as well as meaningfully accelerate technological advancement for Ethiopia. In as much as FDI is a means or a catalyst in bringing about change and transformation, the later itself is also a way, method, and strategy what a government and its people seek to achieve. In a way both FDI and transformation are a means to achieve a much higher goal. 5.1 General Challenges related to FDI and its Role in the Transformation of Ethiopia It is justifiable to ask what is the relationship between transformation and sustainable development? Are they one and the same or is transformation a means to bring about sustainable development? It should be stressed that transformation can have different meanings and classifications. It can mean transforming from feudal or semi feudal to a capitalist or socialist society; or from an agricultural society into an industrial society; from a trading society into a manufacturing society or from construction to manufacturing or transforming food insecure society to food self-sufficient society etc. It can also mean transforming the mind set and quality of life of the people and the ability to transform and convert such as from cotton to clothes; from sheep wool to woolen cloths, from forest to different kinds of wood products; from iron and steel to cars and other by products etc. In that
216
sense, transformation is amore of a means than an end itself. Similarly, FDI is a vehicle and or a catalyst for transforming whatever a host country seeks to achieve. The question is what kind of transformation will bring about sustainable development for the vast majority of the people? Whether the anticipated socio-economic benefits of truly and in deeds benefits the vast majority of the people of developing countries in general and that of the Ethiopian people in particular is debatable where there is no consensus or agreement. It all depends on hard evidence; how the data is interpreted and the degree and extent of benefits that are regarded as positive or very positive. For example, there could be growth. But whether such growth has benefited to vast majority of the people is a question that has to be verified by a serious and independent research. As far as Ethiopia is concerned, the 2015 UNDP Human Development Report has made it clear that inclusive growth and development is occurring only slowly across the entire country and among certain socio-economic groups. Ethiopia’s rapid growth and development are thus not being evenly distributed throughout the country, nor are they spreading fast enough, with emerging regions in particular remaining relatively disadvantaged. (UNDP, 2015; Executive Summary: 2). This is also confirmed by the findings stated below. In terms of regional distribution of FDI, all regions have received foreign direct investment. But Addis Ababa and Oromia stood first and second in terms of foreign investment approvals. According to Ethiopian Investment Agency since 2004 to 2013 from the total 2143 registered Manufacturing Foreign direct investments projects, 1829 (81.6 %) are only in Addis Ababa and Oromia; 153 projects or (6.3 %) are Amhara, SNNPR, Tigeray and Dere Dawa; 20 projects (0.5 %) are for Beneshangule GuMuze, Somale, Afar, and Gambela and the other 382 projects (11.3 %) are multi regional projects established to serve for more than one region. Hence, only the two regions received 82 % of FDI (Getahun Negash, 2014:48). The Ethiopian Investment Commissions’ 10 years report acknowledges that the flow of FDI to Ethiopia has been unevenly distributed among the various regions. Even though the incentive system encourages foreign investors to invest in the developing regions (Gambela, Afar, Somali and Benishangul-Gumuz) of the country by providing especial benefits including more tax holyday exempted, allowed to import more vehicles without customs duty and provision of land with small amount of charge, their performance in attracting FDI is very poor. On the contrary, the availability of infrastructure, nature and quality of land, trained manpower, market accesses and accesses to raw materials are said to have influenced the distribution of FDI . That is why Oromia Region has attracted 822 FDI projects with respect to the amount of projects invested. Out of the total FDI registered manufacturing projects in Ethiopia during 2004-2013, 32% of the projects have been invest in Oromia. This may be due to the regions proximity to Addis Ababa, availability of natural resource (arable land and favorable climate) and large market size etc. It is interesting to note that the various incentive packages designed by the government could not change such kind of unbalanced distribution of manufacturing investment. Such situation aggravates the existed regional inequality which may hamper the future sustainable development of the country. (see, Getahun Negash, 2014:48) Main findings of recent study related to the implementation challenges of FDI in Ethiopia show
217
that: 1 There is a significant gap between the number of FDI projects licensed and those that became operational. Out of the total 3677 licensed foreign investment projects, 1534 investment projects have been canceled due to the implementation problem until December 2013, only 524 projects became operational, i.e. about 14.25 percent of from the total approved, and 24.45 present from total active projects has commenced their operation (Getahun Negash, 2014: 69).
2 The conversion rate and the implementation of investments related to manufacturing have been decreasing. The main reasons for the low conversion rate of investment projects are: a) failure of service rendering institutions to pay special attention to provide the necessary support for investors; b) inability to timely allocate land for the different types of investments at regional level; c)absence of a good system of investment promotion Agency at Federal level that enables them to provide effective one stop shop Service for investors; d) lack of full information on Ethiopian foreign investment policy and law within and outside the country; e) lack of required skilled man power in some investment areas; f) lack of competence and capacity of the EIC to support, supervise, monitor and control the investment projects in general and the manufacturing sector in particular g) prevalence of complex customs procedures and high degree of corruption
3 The number of companies engaged in operation and implementation phase is much less than the number of licenses and investment permits granted to foreign manufacturing enterprises. Only about 24% of those who got investment permits are in operation.
4 The actual permanent and temporary employment opportunities created are much less than expected and claimed. For example, the amount of permanent employment created in 2013 were only 54,666 out of 224, 113 which 24.39%. The amount of temporary jobs created were only 30,507 out of 162,027 which is 18.82%.
5 With regards to the inflow of foreign capital, the amount of real capital that entered the country was 28.7 billion Birr out of 198 billion that was expected to flow. This was only 14.49% (Getahun Negash, 2014:71) Among the challenges and problems for creating conducive investment climate are said to
include ignorance and carelessness of the implementing organization and decision making process, lack of access to finance, personal skill, prevalence of corruption, access to land, power supply, lack of good infrastructure road, water etc. all of which are also factors that help to attract FDI. Certainly, the Ethiopian government has been doing what it can to attract FDI to Ethiopia by trying to remove many of the obstacles than hamper for FDI. That is why in its 2012 Revised Investment proclamation, it has introduced and established a one Stop shop Service (OSS) whereby each service rendering governmental organization and institution has been expected to open a window or office within the premises of the building of the EIC in order to provide an effective service to foreign investors (Ibid.) However, only 60% of those who have obligation to open a desk office within the EIC premises have complied. (See id. :pp73-74) Such
218
problems are not expected to arise in the Hawassa and other future industrial Parks. Another findings of Getahun Negash related to land allocation to foreign investors around Addis Ababa and its environs is that since such land or area used to be individually or communally owned as a farm land have been sold or leased to foreign investors as a way of attracting foreign and even domestic investors, thereby displacing poor farmers with all its socio-economic ramifications, it is now creating a political problem for the government. It should be stressed that in Ethiopia the land issue is one of the most politically sensitive issues that has brought about the Ethiopian revolution. Certainly, one of the main slogans that brought about the down fall of the Imperial regime of Emperor Haile Sellassie was based on the “land to the tiller slogan”. That is why a sweeping land reform was undertaken in Ethiopia in 1975. Thousands of students and ordinary people have lost their lives in order to bring about such fundamental reforms. For example, one third of one graduating class of the author of this article have died during the revolution in order to see what they believed was right i.e. to build a fair and equitable society where land was fairly distributed to farmers and cooperatives with the aim of eliminating absent land lords and distributing land to peasants and farmers; to promote food self sufficiency; substantially reduce the gap between the rich and the poor; as well as to substantially reduce poverty. Unfortunately, after more than 40 years, most of the ultimate aims for which thousands of lives have been lost are now systematically reversed. Certainly, as stated earlier, since EPRDF came to power, there had been spectacular double digit growth in the country which together with many other factors has made the country an attractive investment destination and among the four or five fast economically growing countries of Africa. The growth and expansion of urbanization, manufacturing and the infrastructural development has been unprecedented. Addis Ababa, which used to be a big village, for example, have been transformed so much so that it looked as if it is an European city in a span of fifteen or twenty years. This is a type of growth that have not been seen since Addis was established more than 125 years. The same is true with Hawassa, Bahir Dar, Mekele and many other towns. However, this is only one side of the story. The other side of the coin is quite strikingly different. Among the negative consequences and ramifications are that such spectacular growth andincrease in FDI has not trickled down to the vast majority of the poor nor narrowed down the gap between rich and poor as desired and hoped for. As the 2015 UNDP Human Development Report stated the basic prerequisites for development include peace and security, a good governance system that is based on accountability and transparency, popular participation, and a democratic system that ensures freedom as well as human and property rights. It is understood that people must not only be beneficiaries of the development process, but also be the main actors in the design and implementation of development policies, strategies and programmes. Whether this is the case is debatable. At any rate, since FDI has not been carefully encouraged and targeted to mitigate Ethiopia’s pressing socio-economic problems and the government was more interested and focused to attract FDI than to also critically examine and undertake serious and independent studies on the socio- economic benefits of FDI in Ethiopia, its negative impacts are becoming increasingly visible. Many critics argue that contrary to the very reason that motivated some of those leaders who are now in power to go to the bush in 1975 and thereafter to fight to implement “land to the tiller
219
slogan” and to create a fair and equitable society in Ethiopia, and in total reversal of their former fundamental principles, some of them are now responsible for granting land to foreign investors. Critics argue that this is a total reversal of the very principles they fought for. Hence, they cannot find a phrase to best describe such reversal other than calling it a revolution betrayed. Critics argue that if those hundreds of thousands of innocent Ethiopians who died for what they believed was right were to miraculously rise up from their graves and see what is happening now, they would be the most angry people on earth. Getahun Negash being a civil servant did not go as far as other critics. What he has found in his study with respect to the issue of giving land to investors prior to 2014, show that local farmers and communities were also neither adequately and properly consulted nor adequately compensated thereby leading to many undesirable misunderstandings and complaints between the communities on one hand and the Government and foreign investors or manufacturers on the other. Getahun Negash (2014: 77) Even if one may not seriously object at the amount of compensation given, since they do not get training to manage their compensation, they tend to waste it in consumption rather than investing it to generate income for themselves and their families which ultimately and in the long term turn them to become jobless and penniless. Critics argue that while the overall objective of encouraging FDI is to promote and improve the quality of life of Ethiopians, in reality however, it does not appear to have achieved its intended objectives. This is even partly shared by Getahun Negash (ibid). That is also why the policy of giving fertile land that used to belong to peasants and farmers (instead of allocating land under developed land ) to foreign investors has become one among many other causes of recent uprisings in the Oromia and Amhara regions where 27 major projects worth more than 100 million have been burned down and for which the government has promised to compensate to the investors. Certainly, the riots and the burning down of property that belong to foreign investors in the Oromia region in November 2015 and in July August 2016 in the Amhara region is a manifestation or reflection of such deep rooted concerns. This also confirms that the issue of FDI is very much related to politics and that it is difficult to discuss FDI in a vacuum. Critics also argue that while ethnic and linguistic based politics and building walls between the various ethnic groups who used to live together for centuries is the main cause of dissatisfaction, there is no doubt that the alleged massive corruption that manyclaim persists from top to bottom as well as the widening gap between the rich and the poor are some of the main causes for Ethiopia´s political instability today. What ever the case may be, thanks to the recent study made by Getahun Negash, many of his honest and genuine concerns related to FDI in Addis Ababa and its environs as well as in the Oromia region have been addressed or are being addressed and many of his recommendations are being implemented. This is a positive development in the relationship between research and its positive influence in policy making. The other criticism is that there is a great deal of blind emphasis on attracting FDI without exactly and concretely quantifying the socio-economic and other benefits to the Ethiopian people. Some critics argue that this is being done without a serious and independent research examining the pros and cons of inward investments to Ethiopia. It is important to remind all concerned that many governments of developing countries have even created political crises for
220
themselves and many others have been overthrown because of their favoritism to foreign powers and investors than for their policies of promoting and protecting their national business communities and national interests. To avoid such things from happening in Ethiopia, there is a dire need to have a serious and in depth multi disciplinary research on the cost –benefit analysis of FDI to Ethiopians and in the context of whether such investments have laid the foundation for bringing about sustainable development that will also bring about a lasting peace, stability and prosperity for the vast majority of Ethiopians and minimizes future conflicts resulting from the widening gap between rich and the poor? The concrete situation on the ground appear to show otherwise.
Although there has been many new developments within the EIC and building institutions and forming Coordinating Committees in ways to make FDI effective at Federal and Regional levels, there is a great deal of scope for further improvement. Establishing such Committees is one thing, but whether such committees will perform effectively and efficiently is a different matter all together. Building sustainable institutions is much more effective than managing very crucial matters with far reaching consequences by establishing ad hoc Committees. The critics argue that the alleged corruption in all its forms and at all levels remains one of the greatest challenges for the Ethiopian Government. In a country where it is alleged that almost every one is thinking for one self and the ideology of individual success driven capitalism prevails and the interest of the nation and the vast majority of its people take a second place, it would be difficult to see how fundamental and sustainable transformation can FDI bring about ? Although there might be good intentions on the part of the Government to address the real issues that matter to the Ethiopian people, the author is still very much concerned about the new direction of on one hand the right to development ,and the policy of the right to clean environment enshrined in the Constitution on one hand and the alleged undue emphasis being given to growth driven policies and practices of the Ethiopian Government. In view of these and many other reasons, unless some drastic, political, legal and economic and other measures are taken to seriously and genuinely address the country is facing currently, the author is very much concerned about Ethiopia and its future. What is also worrying is that crime and lack of cohesion and care between at least the various major ethnic groups of Ethiopia who used to live in harmony and with mutual respect for one another is on the rise in ways not seen before. Moreover, in addition to some of the policy concerns stated above, decadent Western culture is increasingly dominating Ethiopian culture not seen in the history of the country in the past. Many of Ethiopian young generation are copying the worst of the West than the best of the West. This is deeply regrettable for a country whose vast majority are the youth and women. Hence, the author believes that without introducing a new and rigorous moral, ethical and civic education and discipline that restores selectively many of the good Ethiopian traditional norms and values and without putting the interest of the country and its people first above individual , family, tribal and ethnic interests, it may be difficult how positive transformation can come about in Ethiopia. This is to stress that in countries like Ethiopia we have seen and experienced some degree of semi capitalist system during the era of the Emperor. We have experienced the brutality and inhumanity of communism as well as the failures of a communist Party and governance during
221
the era of the Dergue. Since 1991, and particularly recently many people of Ethiopia are experiencing the ugly faces of capitalism where traders keep on increasing their prices almost every week for basic commodities and services. Similarly the prices of decent residential houses and condominiums also have become excessively high. These fundamental problems combined with other problems are seriously creating hopelessness and helplessness among the population who earn less between 2000 and 300 Birr. a month. All such problems continue to exist in what the government calls a `developmental` state but whose practices on many issues appear not much different from a full fledged Capitalist State except for its intervention in strategic sectors of the economy. Whether the EPRDF or the Ethiopian Government have successfully managed to make effective use of FDI in order to create a fair and equitable society and whether it has been able to make a fair and equitable balance between the interests of the vast majority of the Ethiopian people on one hand and that of foreign investors on the other is controversial and debatable. While there is no doubt that there had been spectacular double digit growth in the last thirteen years and there had been a massive increase in the number of schools, universities, and access to basic education and health care and many other social services, there is a growing dissatisfaction among the wide sections of the population. The question is why? Who actually has benefited from the EPRDF rule and at whose expense? Who has benefited from the spectacular growth of the last 25 years? And why are so many women and children whose origin is from Tigray begging in the streets of Addis Ababa while it is widely argued, believed and alleged that it is only Tigreans who are in power who are deemed and perceived to be the main beneficiaries of the last 25 years? Does ethnic politics wither away class distinction and does the fact that 1 to 3 % of Tigreans who might have benefited from the EPRDF rule make all Tigreans beneficiaries and therefore a target of hate? Does building ethnic walls and barriers make even economic sense in a global world where borders are increasingly becoming useless and meaningless? If foreign investors from different countries of the world can come and invest, do business and live in Ethiopia, why shouldn’t every Ethiopian go any where and to any corner of the country and live and work with all his rights protected? If foreign investors from different corners of the world can come to invest and live in Tigray regional state why can’t an Oromo or an Amahara live and work in the Regional State of Tigray? Similarly why can’t a Tigrean or Amhara work and live in Oromia regional state at will and without preconditions with all his rights protected? It is because of these and many other reasons why many Ethiopians also think and believe that the Government in power favors foreign investors than domestic investors. These are some important questions that at the outset appear quite divorced from the title of this article but no thinking and responsible person or scholar or any academic institution cannotand should not see them separately. Finding a true answer to such questions requires a very serious and independent research by independent minded and patriotic scholars and researchers. There is no doubt that some Government leaders who drive tainted and very expensive land cursers and who are not in touch with the grass roots and who do not walk on foot freely in the streets of Addis Ababa or anywhere else have no opportunity to really understand the extent and magnitude of dissatisfaction among the vast majority of the Ethiopian people. If the people have benefited as the Ethiopian Government claims, why is there massive dissatisfaction, anger and frustration among a wide sections of the population around the country? Or could we continue to accept the official view that these are caused by a handful of anti peace perpetrators and terrorists? But how true is this? Where is the concrete evidence? Where is the proof? Does
222
the fact that peace has been restored now mean that the problem has been solved or has the problem been postponed? There is a need to have clear answers to such questions without trying to deny them or without trying to be defensive about them. As far as the author is concerned honesty, constructive, genuine as well as civilized dialogue is the best way forward. It is also important to stress while the above concerns are a tip of the eyes berg, the underlying cause might also be the way capitalism , free market is being introduced to Ethiopia. The critics of FDI argue that capitalism is inherently exploitative and does not create a fair and equitable society and does not substantially reduce or eliminate poverty. However, it is also true that many statistical data provided by the Government, the IMF, World Bank show that millions of people have been lifted out of poverty. Many people also mention countries like China in support of their claim that capitalism and free enterprise is the way to go without reminding themselves that China had closed its doors for more than three decades (in an era quite different from now ) and that it was after it has managed to build a good base and infrastructure and solid political, economic and technological institutions that it has opened its doors to the West in earnest in the 1980s. This is not the case in Ethiopia. There is no way to compare China with Ethiopia. In short, what many people do not know or do not want to know is that inequality is an inevitable product of capitalist system because it has no effective machinery and institution that would ensure fair distribution to narrow the gap. Foreign investors do not often invest in activities that increase their costs. It is only after governments invest massively in infrastructure, power, roads, and many other facilities that they jump into the band wagon and be interested to be actively involved and invest in projects and activities or sectors that reward them the highest rate of return on their investments. That is also why in the case of Ethiopia, FDI in the less developed regions is very low except for companies involved in the exploitation of mineral and oil resources or for agricultural companies in search of fertile soil and water and why there is a concentration of investments around Addis Ababa and the Oromia region. That is also why after so much investment has been made by the state they also advocate privatization in order to continue making more and huge profits.
It is alleged that the various groups who otherwise are dubbed as facilitators of foreign domination and exploitation (FFDE) together with their foreign backers have been persistently putting pressure to bear on the Ethiopian Government to privatize not only Ethio-Telecom but also many other strategic industries. However, many supporters of the Developmental state, and critics of free market and private enterprise, for example, also argue that if Ethio-Telecom was privatized it would not have been able to partly finance to the tune of 6 bn Birr or more to the light railway and the profits of privatized Ethio-Telecom would have gone to the foreign telecom companies. Such an amount would have been a profit made for the shareholders of the foreign companies. It is true that there is a great deal of scope for improvements within Ethio- Telecom in rendering its services. But Ethio-Telecom is still a national enterprise owned, run and managed by Ethiopians for Ethiopians and the wider business and investment community. Many critics of FDI now argue that despite its inefficiency, Ethio-Telecome should remain in the hands of the Ethiopian people rather than in foreign powers and companies. In an era of information and communication revolution privatization of Ethiopia Telecom would have also meant putting Ethiopian national security interests and relative degree of Ethiopian sovereign independence at great risks.
223
Opponents and critics of developmental state as well as the FFDE often seek and advocate a minimum intervention by the state and would like to be left alone to do what they want to do.
In poor and developing countries like Ethiopia, leaving matters to foreign investors would have lead to more socio-economic crises than what the country is facing now. It should also be stressed that developmental state per se is not a panacea. It all depends how smart, efficient, corrupt free, and committed the leaders of the developmental state are to the cause of their people. Certainly, anti developmental state also argue that taxation and budgetary allocation of resources for pro- poor activities, programs and projects are one step in the right direction. While this is partly true, the author who has no less than 42 years of accumulated knowledge and experience, among many other studies, in tax policy, law and administration is not convinced that taxation alone helps to narrow the gap between the rich and the poor.
It should be further stressed that a true and genuine developmental state in principle is and should be more committed to solve the fundamental socio-economic, political, technological and other problems of the vast majority of its people than a capitalist state where the government and its leaders are committed to make the rich richer and the poor, poorer. So the question is not whether state intervention is good or bad per se. But whether a developmental state’s intervention is smart, intelligent, and knowledge whether the over all objective is to benefit the rich or the poor. There is no doubt that both the poor and the rich badly need each other. The rich cannot be richer without exploiting the poor. But the poor cannot also be rich without working and selling their labor to the rich. That is why they need one another. It is whether the relationship between the rich who have the capital and the poor’s labor and their relationship with the government and the rest of the society that determines whether one creates a fair and equitable society or a highly divided and polarized society. Hence, the answer to the question whether a developmental state is good or bad very much depends on its policies and practices. So the answer is tell me what kind and type of developmental state you have and I will tell you whether it is good or bad. At any rate, some of the general advantages of a smart developmental state committed to bring about sustainable development for the vast majority of its people :
a) Has more opportunities for making poverty history by allocating tax payers money to satisfy the basic as well as the higher needs of the bulk of the population
b) Can use its regulatory power and whatever resources it has at its disposal to uplift many more millions of people out of poverty and bring about meaningful, concrete and sustainable development for the vast majority of people than by free enterprise and free market Model
c) Would wipe out corruption and make sure that the misuse and abuse of FDI is reduced to the minimum and will make sure that FDI is effectively used to reduce poverty in more meaningful, visible and effective ways.
d) It would put merit, competence and capable people from top to bottom to sped up decision making process and minimize red tapes, cronyism and patrimonial relationship and equally serve the people efficiently with honesty and integrity
e) Would be very careful in trying to identify between those patriotic, honest and dedicated business men and women who managed to become rich in a fair and honest way than those newly and instantly rich individuals and groups who managed to become rich

224
through their close association with some corrupt leaders of the Government and that of EPRDF and through many other illegal and mysterious circumstances.
f) Would have the over all effect of reducing and minimizing the negative socio-economic, political and other effects of capitalism, free enterprise and free market dominated by FDI and would systematically look in wards to make effective use of its land, water, abundant human resources to bring about sustainable development for its people. The author also believes that any country cannot develop by manufacturing slogans alone.
Giving hope and good feel factor to restore confidence to the people is fine. But delivery, performance, and implementation of both the letters and spirit of the Constitution either in its current state or in its revised version as well as all other laws is also absolutely crucial. Providing simple answers to complex questions is dangerous. Doing the right things that actually benefit the vast majority of the Ethiopian people (70-80% 0f the population) in real terms is more important than benefiting few rich people consisting of 2%. Capitalism, free enterprise and free market policies have many positive aspects but many critics also argue that in many developing countries including in Ethiopia, capitalism, free enterprise and free market also tend to be misused and abused and widen the gap between rich and poor which (God forbid) could invite a permanent state of political instability and economic crisis and even trigger another revolution. They argue that what is going on in Ethiopia today is free exploitation of people in the name of free enterprise. They give many examples of the ever increasing price rise on the vast majority of consumers beyond what ordinary people can afford to pay.
5.2 Some Challenges and Concerns related to Ethiopia’s Industrial Parks Program Even if the Industrial Parks can employ one million workers the author does not think and believe that is satisfactory enough for a country with more than 90 million people. The socio- economic benefits to the people of Ethiopia may not be ultimately sustainable as expected. The history of export oriented trade is heavily influenced by external demand and supply as well as fluctuations in the world economy. Hence, although such Parks may have advantages of minimizing the shortage of hard currency, in the long term it may not be as positive as expected. It should be noted that one objective behind the industrial Park program is also to promote the transfer of technology to Ethiopia. However, foreign investors whether within the Industrial Park or outside, are not generally willing to transfer their technology to potential competitors. However, there are some un avoidable know-how and techniques as well as skills that those who work in such factories will acquire whether foreign investors like it or not in the same way as workers working in an assembly plants are able to learn how to repair and maintain cars after they get out or leave from the Assembly plants. In the case of big factories, in as long as the factories are dismantled, the people who used to work in such factories would have to be retrained to be employable in other factories. It is true that the 2015 Industrial Park Proclamation does require the industrial Park Developer, Industrial Park Operator and the Industrial Park Enterprise to replace expatriate personnel or professionals by Ethiopian nationals by transferring required knowledge and skills through specialized trainings(IPP, 2015:Art6(8); Art.8(7); Art. 10(5) respectively). In principle, such
225
provisions appear on the right direction. However, such provisions lack the detailed and specific conditions, time lines and monitoring provisions. Important lessons drawn from the IP experience around the world show that the performance of IPs is greatly dependent on how well they are designed, implemented and integrated into the local economy. The usefulness and success of IPs comes once they are entwined with the overall economy. The importance of promoting linkages and spillovers with domestic firms and the role of services in developing value chains is a key factor. Moreover, as far as the foreign investors in general and the industrial park enterprises are concerned there is no guarantee that they will not migrate to other countries in the same way they have migrated to Ethiopia from other countries. Investing in manufacturing may be useful if it leads to sustainable development, substitutes imports effectively and manages to produce competitive export products that will generate hard currency and if it helps to maximize and bring about tangible socio/economic benefits to the vast majority of the Ethiopian people and not to only 10r 2% of the population. The Author has some doubts whether the current manufacturing and industrial policy of the Ethiopian government will achieve their intended objectives. Time and the next generation will tell whether the predictions and concerns of the author has been justified or not. Many critics of the Government argue that if the government had spent the amount of money invested to develop the industrial parks and invested it in organizing, mobilizing the skill and experience that exists at least in and around Mercato, it would have had many long term socio/economic advantages to the country. Others also argue that, the Government and its agents do not value good and innovative ideas and entrepreneurship because they only focus on how much capital in terms of money one has and not how good his or her ideas and how viable his project and business plan is? In short, it is cash driven and not knowledge driven. It is alleged that the main reason why this is also the case is because it enables those who issue investment permits and provide public services to get money for themselves by corrupted practices.
6. Registration of Technology Transfer Agreements and Contracts: Some Issues of Controversy 6.1 Concern related to the Issue of Technology Transfer Agreements Where any investor concludes a technology transfer agreement related to his investment, he is
required to submit the agreement to the Agency for registration in accordance with the requirements of Art. 21(2). The Commission is only required to issue a certificate of registration to the investor and notify the relevant federal executive organs the registration of technology transfer agreement made in accordance with Art.21. The Commission is not, however, required to investigate and evaluate the relevance and developmental appropriateness as well as on the valuation and price of the technology transferred. It does not also have the right to even reject the technology transfer agreement. But a technology transfer agreement which is not registered with the Commission in accordance with Art 21 does not have legal effect (EIP, 769/2012, Art. 22(2- 4)). As stated above, foreign private capital investment is generally understood to be a significant vehicle
226
in accelerating not only the flow of scarce financial capital but also widely regarded as one of the conventional avenues for transferring technology. Although the policy of encouraging foreign private capital investment is related to technology transfer policy, and the issues related to technology transfer have been closely linked and interwoven with issues of foreign private capital investment, (UNIDO, 1985) opinions are divided as to whether they are one and the same strategy? (Fesseha-Tsion, 1988). Some scholars argue that one reason for encouraging foreign private capital investment in developing countries is "to get access to technology and knowhow and to have the use and benefit of technical equipment and assistance" (Overbeeke and Prast-Ragetly, 1987). Many governments and scholars perceive that foreign direct investment facilitates the transfer of foreign technology. For example, technology imports to the Republic of Korea were initially based on the Foreign Capital Inducement Law (FCIL), which was promulgated on January 1, 1960 (later amended on August 3, 1966) (UNCTAD, 1980). In the Philippines, technology was imported as part of foreign investment (IBID, 1980). The same is true, for example, for Mexico (TLA, 1987) and Venezuela (Ibid, 1987). Certainly, reasons for promoting the acquisition of foreign technology include: a) the creation of employment, increased foreign exchange earnings, use of local materials, and advancing industrialization (ESCAP, 1986). Imported technology is widely viewed as the major factor for technological advance and hence for development process of developing countries (UNCTAD, 1980). India also used foreign investment as a vehicle for the transfer of foreign technology to the country. Its policy towards foreign investment and technology was (a) to increase the flow of foreign capital; (b) to provide for the transfer of sophisticated technology, and (c) to supplement foreign exchange earnings (Govind, 1987). The Indian Government believed that scientific, technical and industrial knowledge and capital equipment can best be secured along with foreign capital. It welcomed foreign investment and technical collaboration in fields where such investment and/or technical collaboration would be of advantage to the diversified industrial base of India (Fisseha-Tsion Menghistu, 1988: 59-62). It therefore encouraged joint ventures and foreign collaboration agreements to achieve its industrial policy (U.N./ESCAP, Year of publication). In the past, although India encouraged foreign private capital investment it did so with the specific objective of acquiring foreign technology. As Singh pointed out:
“Deliberately, India has not been following, right from the beginning, a policy of attracting large volumes of foreign investment per se. India has, right from the beginning, always emphasized the need for importing more and more technology, rather than more and more funds.... We made this choice that, in our foreign investment policy, we will lay greater emphasis on the import of foreign technology, rather than foreign capital” (RICTF, 1985; ovind, 1987; Fisseha-Tsion and Tsegai: 2012:80).
In short, foreign investment has for a long time been seen as a vehicle for the transfer of sophisticated technology, within the framework of India’s industrial and development plans (Vaisch, 1985 in Khan ed., 1985; Aggrawal, 1986). Foreign investment was thus allowed in general, only if it was accompanied by foreign technology (TIAP1985; FCII, 1985; Govind, 1987). It is through such kinds of policies and processes of many years that India managed to acquire foreign technology and
227
have gained respectability by the beginning of the 21st century. Certainly, one should also study how India has become now a hub in the IT sector. Countries like Ethiopia might have good and noble ambitions. But the harsh reality is that Ethiopia is far behind some of the South Asian and Latin American countries as well as India. This implies that there is also a need to know and understand how best to acquire foreign but also appropriate technology? But when one looks at the Ethiopian foreign investment law related to the transfer of technology, there seems to be lack of understanding of what really constitutes technology and how best to transfer or acquire foreign technology into the country? For example, Article 18 of Investment Proclamation No. 37/1996 states: “Where an investor intends to conclude a technology transfer agreement related to his investment, he shall submit to the Authority for approval and registration” (EIP, 37/1996). But the Proclamation neither defined what technology is nor how actual and effective transfer of technology should take place? Realizing the lack of clarity on the matter, Investment (Amendment) Proclamation No. 375/2003 introduced a new sub-Article (14) of Article 2 that amended Proclamation No. 280 of 2002. Sub-Article 14 of Article 2 of Proclamation 280/2002 as amended by Article 2 of Proclamation 375 of 2003 defines “transfer of technology” to mean “the transfer of systematic knowledge for the manufacture of a product, for the application of improvement of a process or for the rendering of a service, including management and marketing technologies, but shall not extend to transactions involving the mere sale or lease of goods” (EIP, 375/2003, Art. 3(2)). It is interesting to note that the new definition of “transfer of technology” under Art. 2(10) of Proclamation 769 of 2012 is not fundamentally different from the old definition except that the words “technical knowhow” has been added between “management” and “marketing technologies”. Whether this is still a good and clear definition and whether management and marketing techniques constitute technology is also debatable. Although management and marketing are crucial components of business, the author does not believe that they can be defined as technology. This is also in line with the 1985 UNCTAD Draft Code on Transfer of technology which specifically excludes “associated management and marketing technologies”. (Fisseha-Tsion Menghistu,1988:13) Moreover, Article 9(1) of Proclamation 375 of 2003 deletes Article 18 of Proclamation No. 37 of 1996 and replaces it by a new Article 20(1) that states: “Where an investor concludes a technology transfer agreement related to his investment, he shall submit the same to the commission for approval and registration” (EIP, 375/2003, Art. 9(1)). The authors believe that a mere registration of a so-called technology transfer agreement or contract does not ensure that there is an actual transfer of technology in deeds. It could even be a sham contract. The question is what are some of the fundamental differences between Article 18 of Proclamation
228
No. 37 of 1996 and Article 20(1) of Proclamation No. 375 of 2003? What was the amendment intended to achieve if there is no fundamental change between the two provisions? The same question applies to the definition of “transfer of technology” under Article 2(10) of Proclamation 769 of 2012. What is clear is that either there is carelessness in the legal drafting or there is lack of conceptual clarity on the subject or both not only in Ethiopia but also in many other developing countries as well. In as much as one has to distinguish between tomatoes and potatoes, Ethiopia and other developing countries must know precisely what is it that they are getting and acquiring from FDI and technology transfer and how relevant and appropriate they are for implementing their developmental objectives? The inability by developing countries including Ethiopia to distinguish between financial capital on one hand and between know-how, skills and experiences embodied, among others, in technically skilled and semi-skilled persons (engineers and technicians), plant, machinery and equipment as well as in documentation or any retrieval and data storage systems and all that is needed to produce, process goods and render services on the other for each sector of the economy, and unless they know the distinction between what is often broadly described “science and technology” and the real, practical and functional type of applied technology that will solve their problems, the confusion and crisis will continue un abated. As far as the author is concerned getting access to financial assets such as hard currency, loans and credits etc., from foreign banks, financial institutions, intermediaries and micro credit enterprises is only one aspect of foreign capital investment and certainly not a real transfer of foreign technology to nationals and enterprises of developing countries. Unfortunately, many persons tend to use the word “technology” either in the context of IT and/or as a container definition to mean anything and everything that they perceive is technology. But what they think and understand is “technology” may not necessarily be real, functional and applied technology badly needed for ensuring sustainable development and minimizing foreign debt. Above all, there are different types and qualities of technology for every sector or branch of industry. What is surprising is that the definition and concept, the elements thereof and how best and effective to transfer foreign technology has been misused and abused by many scholars and government officials. Often the word technology, technique and method are used as synonymous to mean one and the same thing, which is not true. An effective transfer of foreign technology for development that is applicable to the various sectors of the economy is a complex process that requires much more than skill acquisition or even upgrading the quality of education or changing the curriculum of higher education that favors science and technology. Know-how, skills and experiences embodied in skilled and semi-skilled human beings and embodied in documentation and other retrieval systems as well as in hard ware used to transform, convert, produce and process raw materials into finished and semi-finished products and rendering of services is the core of any technology and its effective transfer implies transferring such know-how, skill and experiences of transformation and rendering of services from foreigners to nationals (Fisseha-Tsion Menghistu, 1988:25-29). A technology owned, controlled and managed by foreign investors in any sector, industry or company constitute an asset and property that belongs to foreigners and not to nationals of host countries. (For more details, See Fisseha-Tsion Menghistu;1988:8-38)
229
6.2 Some Other Challenges related to Transfer of Technology and Other Issues related to the Industrial Parks There is no doubt that the Industrial Park Program is an interesting and creative initiative but
by no means unique in the world. Such parks and Special Economic Zones as well as technology Parks have been established in many other countries such as China, South Korea, Egypt and many other countries. Many technology parks have also been established in many industrialized countries, although they differ in quality, type and aims and objectives of those established in developed countries. Critics to industrial parks can argue that industrial parks cannot be a panacea to solve Ethiopia’s complex and diverse socio-economic problems. They only help perhaps to mitigate the shortage of hard currency due to their export orientation. Even then, the Ethiopian Government and its institutions have no or little capacity to seriously monitor the transfer pricing engaged by multinational companies involved in such industrial parks. Moreover, it is hoped that industrial parks will help to transfer foreign technology. The harsh reality is that foreign companies are not willing to transfer their technology in order to create other domestic competitors whether it is state enterprise or domestic private enterprise. Moreover, the law has no detailed requirements that would compel foreign investors to train Ethiopians and at strategic levels. Nor does it specify the number of Ethiopians to be trained in a year and at specific levels. The other concern is that Industrial parks can be dismantled and leave the country when the foreign investors feel they are not achieving what they intended to achieve. In the same way as foreign investors have migrated from the United States and Europe to South east Asia and from there to China and now from China and South East Asia to Ethiopia and the rest of Africa, there is no guarantee that they would not leave and migrate from Ethiopia to other countries in due course as well. Critics of the Government argue that the investment policy of the Ethiopian Government in real terms favor foreign than promoting domestic enterprises. Instead of systematically assisting and subsidizing domestic industries and enterprises with the aim of reducing step by step the dependence of the country on FDI and minimizing foreign debts, the Government that have shortage of hard currency still continues to subsidize foreign investors in local currency to the tune of 70% of their financial needs to engage in productive investments in Ethiopia. Critics argue that a country that is short of hard currency should extract as much hard currency from foreign investors than subsidizing them through its development or commercial and other banks.
In short, one of the many challenges with respect to FDI and other international cooperation agreements is to find ways and means of creating a win-win situation and striking a balance between on one hand satisfying and meeting the interest of foreign investors and that of promoting and protecting national socio-economic interests of the Ethiopian people on the other. However, this is easier said than done. From an over view of the above analysis one can conclude that dealing with FDI related issues is not as simple and as technical as it appears. It is a multi-disciplinary and multifaceted subject matter that requires different expertise if it is to be used to bring about sustainable development
230
for the vast majority of Ethiopians. Last but least the author is very much aware that in the era of globalization, the possibility of determining once own destiny and designing and implementing once own national plan and policies is become more difficult and more challenging. He argues that finding ways and means of creating a win-win situation and striking a balance between on one hand satisfying and meeting the interest of foreign investors and that of promoting and protecting national socio-economic interests of the Ethiopian people on the other is an absolute necessity. Hence, while the author firmly believes that it is neither desirable nor wise and beneficial for Ethiopia to isolate itself, however, it can minimize the negative effects and consequences of FDI and globalization if a number of preconditions prescribed in the recommendations are met. Many other and critical observers of FDI and globalization are heard speaking that for a country and its glorious people who have kept Ethiopia independent for centuries despite all odds against it during the scramble for Africa and thereafter, it would be un forgivable betrayal if the present and future generation of leaders and scholars of this blessed country hand out foreign powers, forces, actors and investors to determine its future under the pretext that in the era of globalization it would be difficult and even impossible to live in isolation. They fully understand the challenges of the present time. But internal or national unity is crucial precondition to withstand external pressures.
7. Extended Conclusions In order to improve the socio/economic, technological and other developmental goals and aspirations of their people, governments of developing countries including that of Ethiopian have used a variety of fiscal, non-fiscal, infrastructural, institutional, financial and other policy instruments to attract foreign investors to their respective countries. Many stress that they seek to bring about growth, and economic development while others also want to bring about sustainable development for their people and respective countries.
Although some of the main reasons why many developing countries encourage FDI may vary from country to country, as far as Ethiopia is concerned, FDI is encouraged to promote, the flow of foreign capital, generate employment, transfer of technology and to utilize the country’s resources in ways to eliminate or substantially reduce poverty. Almost every country in the world now believe that development and reduction of poverty in their diverse meanings, types and interpretations. This is often stated in the development policies, programs, investment laws and other public policy documents, budget speeches and pronouncements of leaders of many developing countries including Ethiopia. In short, the popular belief among many governments of nearly all African countries was and still is to solve their multifaceted and multi-dimensional problems and challenges. Ethiopia is no exception to this. However, whether it is a matter of belief, conviction or science, there is a wide spread
231
acceptance that FDI plays a crucial role in promoting growth, and socio-economic development as well as, among others, in transferring foreign technology to developing countries. But its role in promoting sustainable development is debatable and controversial. However, despite the fact that the concept of foreign direct investment is a household term, there has been little understanding and clarity even of basic definitions and concepts of foreign investment, the principal forms thereof and the salient distinctions between foreign investment and even with technology transfer. At least there is lack of clarity on what is it that they are actually benefiting from FDI and whether FDI has been very effective in alleviating or substantially reducing poverty in developing countries in general and Ethiopia in particular. It should be stressed that the issue of FDI is one of the most politically, ideologically, emotionally psychologically and legally a divisive subject where there is no universal agreement about the positive and negative socio/economic and other consequences to host countries. Such issues are discussed from whose perspective or lens one treats the subject matter. FDI which is generally and broadly defined as an investment made to acquire a lasting interest in an enterprise operating in an economy other than that of the foreign investor whose main purpose is also to have an effective voice in the management of the enterprise is some times Compared with allowing foreigners to come to own and manage a family kitchen except that the former affects the economy of a country and the later affect one family or that FDI has consequences at macro level whereas the other deal at a micro level. What is interesting is that, irrespective of whether its positive or negative consequences, the vast majority if not all developing countries continue to grant fiscal and non-fiscal incentives and other benefits in order to attract FDI to their respective countries. This is also true for Ethiopia. Like many other developing countries, Ethiopia strongly believes that FDI has a great role in promoting and accelerating socio-economic development and thereby improve the living conditions and standards of its people. However, whether foreign investors and the relevant foreign investment laws of Ethiopia (which continue to be amended frequently and hence lack legal stability) have in reality achieved their intended objectives and alleviated poverty is a question that must be supported by convincing scientific and independent research or evidence and proof. Moreover, there are hardly many serious independent studies made to quantify the socio-economic benefits of FDI to the Ethiopian people. Nor are studies made to verify the extent to which whether foreign private investors have in actual fact and truly benefited the people of Ethiopia and helped to improve their living conditions as it is often claimed except that something is better than nothing argument. What can be said is that the optimists and the good feel factor promoters as well as the FFDEs advocate the views of classical and neo-classical economists, albeit, without strong convincing
232
evidence. Critics, however argue that the unintended consequences of FDI outweigh the benefits. In fact they go as far as saying that the outright revolt and burning of 27 projects in places where some foreign investors are located in Oromia in 2015 and in Amhara region in July-August 2016 show the reality on the ground. The other concern is whether the types of tax and non-tax incentives (forgone revenues and benefits in kind) granted by Ethiopia has been effective in attracting FDI as well as in achieving and realizing the noble goals? Here also the conclusions related to many developing countries are divided and inconclusive. Moreover, the general understanding is that foreign investors will not come without tax incentives. However, whether tax incentives are substantially more effective instruments than many other factors in attracting foreign direct investment (FDI)sector by sector in Ethiopia demands more serious and independent research. Whether FDI is a very effective and direct method of transferring technology is also an issue that where opinions are divided. Sometimes the opinion is mainly influenced by once own ideological and political beliefs than by real facts on the ground and scientific findings. The confusion that one observes is that when one looks at the old and new Ethiopian foreign investment laws that incorporate the definition and registration of transfer of technology Agreements, one cannot help but conclude that there seems to be lack of understanding of what constitutes technology and how best to transfer or acquire foreign technology into the country. Technology transfer is only one of the main eight objectives of the Ethiopian Investment laws, which implies that FDI is not one and the same thing from science as well as transfer of technology. Registration of so-called technology transfer contracts does not guarantee that an actual transfer of appropriate technology suitable and relevant for Ethiopia’s development will take place. Indeed, a survey of the relevant investment related laws of Ethiopia show that there is no clarity of science and technology policy for development and how applied and appropriate technology can be acquired through FDI. The current Ethiopian investment law badly needs a serious revisiting, reflection and re-thinking. A mere registration of technology transfer agreements entered between the parties will not guarantee and ensure the transfer of appropriate technology for development. Moreover, there is also a dire need to use the fiscal and non-fiscal incentives to facilitate the effective and efficient acquisition of appropriate technology in ways to accelerate Ethiopia’s development process. In the case of Ethiopia, there is no doubt that there are many positive and spectacular growth and developments in Ethiopia, particularly in the last thirteen years no were seen in the country´s history. This was, however, mainly due to massive public investments mainly in the area of construction, agriculture, power, roads, bridges and railways and even in the airline industry and not due to the foreign private investment although the participation of the private sector whether it is foreign and domestic is increasing at a fast pace. In an attempt to achieve its national development objectives and vision, the Ethiopian government has in the past not only embarked into agriculture development lead Industrialization IDLI but currently its main focus is to be a hub for light manufacturing industries in Africa by 2025. Since it has been regarded one of the world's five fastest-growing economies and was hoped to be the third-fastest growing economy in the world by
233
2015, after China and India. However, the harsh reality is that Ethiopia is still one of the poorest countries in the world. Thus, to some extent there is a gap between wishes and aspirations on one hand and the socio-economic and technological realities of Ethiopia on the other. At any rate, among the many other factors that attract FDI are political and legal stability, investor-friendly macroeconomic policies, availability of physical and communication infrastructure, access to finance, markets and public utilities such as land, water, electricity and absence of corruption and prevalence of bureaucratic tapes etc. In addition the Ethiopian Government massive tax and non-tax incentives in the hope of attracting FDI to Ethiopia. However, whether such tax incentives have been effective in attracting FDI on their own is debatable. The general conclusion is that tax incentives which are forgone revenues and, hence, that can undermine the revenue mobilizing potential of Ethiopia are only one of the main factors and that they are not effective instruments in attracting FDI on their own. If that was the case there should have been flow of FDI to many other regional stats that offer more tax incentives but lack many other things that foreign investors want in order to be attracted to such regional states. Some of the main obstacles to the inflow of FDI into Ethiopia include lack of availability of accesses roads, and different modality of transportation, availability of Energy supply, efficient telecommunication service, water supply and sewerage system, and availability of efficient financial institutions. Conversely, their availability also constitute factors of attraction for FDI. It is because of this factors that a great deal of FDI manufacturing projects are located and concentrated in Addis Abba and its environs as well as in the Oromia Regional State. Even in such regions, among the factors that constitute an obstacle to start the implementation of investment programs include lack of access to land, loan, lack of knowledge and experience, lack of access to power, absence of skilled personnel, corruption and delay in decision making process. However, such problems are in the process of being eliminated in the industrial parks program. Despite the arguments made by the Government that it is committed to promote and support domestic enterprises, in reality and in practice it is alleged that it favors foreign investors. As far as the Industrial Parks is concerned, what is crucial is to develop a comprehensive and systematically integrated well thought out policies that address the socio-economic and other problems of the vast majority of the Ethiopian people rather than a program of giving an opportunity of jobs for even 1 million jobs let alone for 60,000 or even 200,000 jobs ex pected from such industrial parks. Moreover, it is only when systematically selected, targeted and focused encouragement of FDI combined by a serious and effective monitoring and implementation systems that FDI can meaningfully contribute to the transformation of Ethiopia. The author believes that there cannot be sustainable development without sustainable foreign and domestic investment. What is needed is a systematic and careful and well thought-out and step by step and meticulous design of appropriate policies, plans and implementation strategies of achieving specifically targeted national goals and development vision. Rightly or wrongly the author thinks that FDI has not been carefully encouraged and
234
targeted to mitigate Ethiopia’s pressing socio-economic problems. Moreover, there is a dire need to seriously undertake research on the unintended effects and consequences of FDI in Ethiopia. Hence, there is a dire need for a serious and in depth and independent research examining the pros and cons of inward investments to Ethiopia. The author still strongly believes and recommends that a much more in depth and specific studies based on primary sources should be made in every sector, or project involving FDI than the existing recycling of information, data and literature that appears to dominate the existing studies related to FDI in the context of Ethiopia. If at all the government believes it cannot attract either FDI or the transfer of technology without granting tax and non/tax incentives, then there is a serious need for an independent research how best Ethiopia should use its fiscal and non-fiscal incentives in order to acquire foreign but also appropriate and applied technology either as integral part of FDI or via other means and avenues. The Industrial Park Program is a very good, creative and innovative initiative but by no means unique in the world. Industrial Park and Special Economic Zones have positive as well as negative consequences. There is no doubt that they can be useful for a short term. However, they cannot be a panacea for Ethiopia’s multifaceted and multi-dimensional problems. This is to stress undue emphasis is given to support industrial parks at the expenses of programs that solve the vast majority of the Ethiopian people. Giving priorities and designing programs that satisfy the basic and other higher needs of the vast majority of the Ethiopian people without in any way undermining manufacturing and export oriented sector might have been the right step in the right direction. The transition from agriculture led industrial development to manufacturing might have been too quick. Still the country is food insecure and a great deal of public services are dependent on aid and loan driven safety net programs and services. There is also concern that the type of foreign investment that exists in Ethiopia have the tendency of making such industriescaptive industries and hence make the industrialization and manufacturing industry captive because most of the Ethiopian industries very much depend on foreign inputs, plant and machinery, spare parts and technology which may lead to permanent state of dependency than relative degree of economic, industrial and technological independence. At any rate, there is a need for some reflection and rethinking on some of the ´past and current policies of the Government and EPRDF. Many of the studies that have so far been made about the role of FDI in Ethiopia are simplistic, shallow and not sector specific. Many of them focus on factors that contribute to attract FDI to Ethiopia than on the socio-economic and technological benefits to the people of Ethiopia. Above all, many of the studies are based on a recycled information or studies made on a copy and past mentality and from secondary sources, literature, reports of other studies made and on the experiences gained there from by the World Bank Group and other institutions for other developing countries. There is a simplistic and naïve notion that what works in other countries will also work in Ethiopia. While there might be some lessons to be gained from the experiences of other countries, the author strongly believes that one jacket fits all mentality and policy is a wrong start and strategy to address many complex and intertwined problems that are specific to each country having different history, political, economic, legal, cultural, ethical, moral , spiritual aspects as well as with differing needs and priorities as well as with different set of problems and technological and
235
institutional infrastructure as Ethiopia. The author is not quite sure whether there is a coherent, comprehensive and integrated Economic and fiscal, technology policy for sustainable development even within the Ministers and leaders of the Ethiopian Government itself. For example, some Ministers are heard speaking in the public media that their policy is to promote free market and free enterprise meaning neo-liberal policy whereas, some other Ministers are also heard still speaking about a “developmental state” where the state selectively and intelligently intervenes in the various aspects of the economy and where the state have a predominant role in the mega projects and where it also intervenes to limit the excesses of capitalism, free market and free enterprise and strictly regulates FDI and is genuinely committed for the poor.
In a poor country like Ethiopia with a very weak domestic private sector with little technological capacity, repeatedly advocating that “the private sector is the engine of the economic g rowth that creates wealth and prosperity” is simply a meaningless slogan. When foreign Government officials and foreign investors repeatedly state such phrases, what they mean is the domination of their private sector over the Ethiopian private sector. Hence, in order to avoid the abuse and misuse of FDI and capitalism, many patriotic scholars and citizens tend to favor and recommend having a very transparent, effective, efficient, strong and intelligent state intervention. What is worrying is that, in as much as the left of the 1970s have been indoctrinated and confused by the ideology of Communism, many scholars and Ethiopians, particularly the trading and business community as well as many of the Ethiopian youth also seem to be confused and appear to blindly follow the ideology of private enterprise, free market and neo liberal policies where me alone, individual success and individual accumulation of wealth and getting rich as quick as possible and even by illegal means have become the dominant norm and value and where patriotism and love for the country and its people is seen as naivety and foolishness. That is precisely why rent seeking and corruption has become rampant from top to bottom in Ethiopia. That is also one reason why, it is argued that there are an increasing number of individuals and firms that are dubbed as “facilitators of foreign domination and exploitation (FFDE)” never seen before in the history of this blessed country. 8. General and Specific Recommendations The Government must:
1) Rethink and revise its FDI policy more seriously and intelligently to make sure that maximum socio economic and technological benefits actually accrues in deeds to the vast majority of the Ethiopian people.
2) The widely held belief that FDI is a good vehicle for transferring and acquiring foreign technology and that by registering so-called technology transfer contracts must be abandoned and a new strategy for effectively transferring foreign but appropriate technology policy must be designed and implemented. There should be a multidisciplinary and centralized board or Committee consisting of the
236
senior experts of the EIC, the Ministry of Science and Technology, some Representatives of the Institutes of Science and technology, Senior Legal advisers and development experts etc. to recommend or reject any technology transfer contract for every sector of the economy. The author strongly believes that Ethiopia has many senior patriotic and professional experts in various disciplines relevant to all Ministries including to the Office of the Prime Minister whose vast knowledge and expertise have not been effectively and intelligently taped and utilized by the Ethiopian Government. The author strongly recommends that the Prime Minister and other Ministers should actively involve and seek advice from independent minded patriotic scholars who are not members of the EPRDF but who genuinely care for the country and its future. That is precisely why the author also strongly recommends that there should be independent Think-Tank Groups not only at every Ministry but also within the Office of the Prime Minister as well. While there is a need to employ foreign consultants and experts, every effort must also be made to make effective use of local experts and consultants except those FFDE who currently appear to have an upper hand and sympathetic ear from the government. The Government must allocate budget from its own resources for such purposes than depend on aid and loans from the World Bank.
3) Promote national and international joint ventures as a vehicle of not only the transfer of appropriate and developmental technology but also as a vehicle of promoting Public- Private partnership in more meaningful ways than as a simple slogan. Apparently, not many have clarity on the distinction between PPPs and international joint ventures. The author believes that domestic and international joint ventures between private to private, between foreign investors and Ethiopian state enterprises, and between foreign state enterprises of both contracting parties, if the contracts and agreements governing thereto are carefully, meticulously and intelligently designed and crafted could be a very good vehicle in promoting carefully selected FDI that helps to bring about meaningful transfer of foreign technology, management and marketing skills and experiences that will in deeds bring about sustainable development for Ethiopians. The problems associated with the existing joint venture projects is mainly because when such contracts and agreements are made, they were badly drafted and badly negotiated. Here, the need to involve high level legal experts in national and international contracts and agreements is crucial.
4) Make the best out FDI and extract as much hard currency as possible and not subsidize them by offering loans and credits to the tune of 70% in local currency. This is certainly the view of many domestic investors and Ethiopian business men and women.
5) Provide all round and systematic capacity building to help and assist domestic industries and regional investment offices.
6) Provide all round and systematic support to boost domestic productive enterprises and indigenous entrepreneurs in more meaningful and more effective ways.
7) Abandon its understanding that all foreign and domestic investors and all rich people are humane and responsible citizens who discharge their social and community responsibilities;
8) Make sure that those peasants, farmers and communities who have been displaced as a result of allocating their land to foreign investors whether related to general investment
237
projects or the exploitation of mineral and oil resources or in the context of industrial parks are properly cared for and assisted in more tangible and sustainable ways by a separate institution. In short, re-habilitation of displaced people due to industrial park development must be institutionalized to avoid the type of revolts, anger and riots seen since last year in Oromia Regional State and recently in the Amhara regional state. This is based on recognition and realization that not every “balahabt” whose source of wealth and capital is unknown and cannot be traced can be treated as a developmental and responsible business partner.
9) Avoid or minimize giving undue emphasis or focus to support industrial parks that are also not integrated with the national economy and focus in harnessing domestic talents, creativity. That is more sustainable of the country and its future.
10) Avoid giving emphasis and support to manufacturing at the expense of agriculture and agro processing or other sectors of the economy that support the wellbeing of more than 80% of the Ethiopian population. If more than 80% of the employment potential is dependent on sectors other than in manufacturing, then it is only logical that priority should also be given to support such other sectors that have the potential of absorbing much greater employment potential than the industrial parks or SEZs.
11) Establish new integration and coherence between Federal and regional Government policies, legal framework and practices.
12) Attempt to perhaps us an online service related to one stop Shop services and without involving face to face contacts between the investors and service providers. This might help to minimize corruption and provide a more efficient and coordinated service. At least it should be tried.
13) All Dutyfree privileges for investors must be specifically listed in ways to minimize discretionary power that might lead to corrupted practices. This implies those not in the list are not eligible for privileges.
14) All types of tax and non-tax incentives granted and the reasons for granting them either by the Board or anyone else must be done in a transparent way and based on specifically laid criteria and standard in ways to avoid discrimination and favoritism and minimize the misuse and abuse of discretionary powers to higher officials and public service providers.
15) All policies and projects must be seriously, continually and independently monitored and evaluated by genuinely independent patriotic experts with regards to their effective implementation. It is only by taking such bold measures and actions that innovative and creative ideas can flourish and good and sustainable policies that satisfy the wishes and aspirations of the vast majority of the Ethiopian people could be designed. This will also have the effect of building internal unity within the Ethiopian Government and within the Ethiopian society. Certainly, there is also a need for clarity whether the government is sticking to its developmental state policy or whether it is departing from it in favor of outright free market and free enterprise with all its consequences and ramifications?
16) Recognize that the various training offered to promote entrepreneurship at a great cost have not brought about the desired results and a new strategy must be devised and adopted how to encourage and promote genuine entrepreneurship.
17) Systematically organize and mobilize all the human resources, skill and creativity and innovative capacity that currently available in Mercato area and its environs into domestic industrial parks and offer them every assistance and incentives they need in order to
238
enhance domestic technological capacity and reduce the dependence of the country on imported products. Only then will import substitution strategy will be effective and the link and synergy between the domestic enterprises, science and technology Institutes and Universities will have positive results for the country and its people. 18) The Ethiopian Government should also build a strong, united and patriotic group of negotiators who can extract as many advantages as possible for the country and its people from its international agreements, contracts and treaties. This cannot be done by its cadres and civil servants alone because except for few of them the degree of competence, capacity and integrity and patriotism is very low. It is alleged that many of them are serving their own interests and not the interest of the vast majority of the Ethiopian people. At least, this is a widely held perception. 19) Wipe out corruption from top to bottom and avoid red tapes, cronyism, and rent seeking practices in deeds and not in words. The only way it can do is to undertake a serious and genuine research how those who were poor 25 years ago became super rich now? It can be done and it is possible to find some answers and solutions. But it requires a strong political will and commitment both on the part of the Government and the people. If there is a will there is a way. But if this cannot be done, then the Government have to accept responsibility for what goes wrong in the country and for the crises and conflicts generated there from throughout the country.
20) Create a strong, dedicated and committed group of patriotic, independent, professional multi-disciplinary experts and Think-Tank Groups within the office of the Prime Minister and all other Ministries, Agencies, Authorities and Commissions accountable to the Prime Minister to monitor, supervise, scrutinize and even review or recommend on every aspect of policy and its implementation.
21) Critically review its policy and undertake studies on the socio-economic and other impacts towards FDI that promotes capital intensive, labor displacing technologies where appropriate. The Government must also commission various researches why the One stop Shop services have not been as effective as desired. It should also commission to find out whether all sorts of advice and policy reforms provided and sponsored by the IMF, the World Bank, DIFID, the IFC, the European Union, WTO, and many other bilateral and multilateral Agencies have effectively helped to bring about the transformation of the vast majority of the people of Ethiopia? The effectiveness of development aid and its links with FDI should also be re-examined and revisited.
22) In an era of information and communication revolution where the role of traditional Ambassadors and members of Diplomatic missions have fundamentally changed; and taking into account Ethiopia’s multi-dimensional and multi-faceted problems, the main role of Ethiopian Ambassadors should be to implement Ethiopia’s socio-economic, technological, developmental and national security interests. The main pre/occupation of Ethiopia´s Ambassadors today should be economic diplomacy. This implies that what Ethiopia should have is smart, intelligent, capable and multi-purpose Ambassadors who promote the above state noble objectives rather than who keep on going from one reception to another and who are more pre–occupied with the future of their children than the future of the Ethiopian state and its people. Appointments of Ambassadors based on their ethnic origin must stop. Ambassadors are appointed to represent Ethiopia and not
239
their own ethnic groups. Hence, merit, commitment, self-confidence, dedication, performance, the ability to communicate and articulate and convince others should be the minimum criteria of appointing Ethiopian Ambassadors. Moreover, such Ambassadors must also have strong institutional links and networks not only with the Ministry of Foreign Affairs but also with the relevant Ministries, institutions, Agencies and Commissions such as the EIC and others such as ERCA etc.
23) The need to have effective, efficient and not corrupt administrative system at all levels that is committed in deeds to implement the noble objectives of good political, corporate and social governance as well as which is in tune with the wishes and aspirations of the vast majority of the Ethiopian people also remains crucial. In order to decisively deal with some of the many challenges related to investment and development, there might be a need for establishing a serious, committed and independent supreme investment and development monitoring and implementing Authority within the Office of the Prime Minister in order to supervise, coordinate and ensure the implementation of Ethiopia’s investment, technology transfer, industrial and development related programs. Even 5 high level experts are not enough to deal such issues. At any rate, this might be one step in the right direction to minimize the lack of institutional coordination that seems to exist within the relevant Ministries, Agencies and Authorities. The need to establish a number of independent and patriotic think-tank groups that identify the problems and generate knowledge and provide independent advice to the Government as well as to the political leaders and policy makers whose mandate is also to come up with alternative policy choices and implementing mechanisms and strategies at every Ministry and sector is crucial. However, it should be stressed that as long as there is rampant corruption at all levels whatever noble strategies, development plans and recommendations made will be meaningless. Hence, the need to make sure that those who are in responsible positions must be selfless, committed and dedicated to serve the people as opposed to serving themselves, their families and friends and clans and ethnic groups.
24) Certainly, there cannot be sustainable flow of FDI in as long as there is a perception that the country is suffering from political crisis. Any discussion about FDI cannot be seen in isolation from politics and peace related issues. This is because peace is a precondition for promoting trade and investment as well as sustainable development.
25) Understand and recognize that having regard to the concrete socio-economic and political conditions of the country and its technological backwardness it is an illusion for Ethiopia to catch up and outcompete with industrialized countries at least for the foreseeable future and even for the coming 50 years. They will not seat idle until we catch up with them. The technological gap between them and us is too wide. One can even see the fast technological advancement that we have witnessed in the last 25 years for which we have

240
only become consumers of what they produce. Hence, Ethiopia should accelerate its development and its best, but at its own pace. 26) In order to ensure the continuity of what has been achieved so far, the current and future leaders of this blessed country have primary responsibility to be more transparent more dedicated, committed and selfless as well as more genuine to take a stalk to revise and evaluate what has been done in the last 25 years and try to genuinely address the diverse and complex socio-economic, and political problems of the country. No government is perfect, What is expected of it is to do the right things that genuinely benefit the society and the country in deeds and not in words or on paper. This is a step in the right direction. Hence, in order to restore the trust and confidence between the Government and the people in the interest of the unity and future generation of Ethiopians. Power and money comes and goes. But what will not be forgotten and will not disappear is a good legacy. There cannot be a more important legacy for either the current or future leaders, scholars and concerned individuals of Ethiopia than trying to bring their minds and heads together that would lay stable, solid and sustainable foundation for creating a strong, united, peaceful and prosperous Ethiopia.
27) The Government and EPRDF must genuinely accept constructive criticisms made by serious, high level and responsible Ethiopian scholars and intellectuals not only about the FDI policy but also on many other policies and practices even if such criticisms might be difficult pills to swallow. They must also listen to the complaints made by their own citizens and not repeat the mistakes committed by the Dergue and some other opposition groups i.e. creating fear, insecurity and institutionalizing violence. The Government and the EPRDF should give their critics not only the space and opportunity to help them stay in power and promote their own survival but also to help them design better policies that would minimize the current tension and misunderstanding as well as absence of trust and confidence that now appears to exist and that perhaps pave the way for a smooth, peaceful, and democratic transfer of power when circumstances are ripe for it. A good, responsible government committed to good governance and to its own people will treasure, respect and listen to any constructive advice that comes from any corner and from well-meaning citizens let alone from independent minded patriotic scholars, experts and elders who have integrity and credibility. What the Government and EPRDF badly need is not yes men and women but confident, responsible and patriotic experts who provide them with good and intelligent and knowledge based advice and offer them policy choices irrespective whether they like it or not. In short, to ensure their own survival, and in the interest of the country and the future generation, the leaders of the Ethiopian Government and the EPRDF must stop being allergic to constructive criticisms and stop being blinded by power based on the army and the security services who are also the products of the Ethiopian society and hence are equally suffering from economic and other hardships as well and hence can turn against them if circumstances go out of hand.
28) Ministers and high government officials and those in power must be servants of the people rather than order givers. Knowledge, experience, integrity, hard work, discipline and performance and delivery should be the criteria for appointment. Leaders must be seen to be role models for their citizens and should not live in ivory tower secluded or isolated from their citizens. If a government is in power to serve the people, then it must do the right things and introduce the right policies that would satisfy the vast majority of
241
its citizens. What has been done can be undone. What matters at the end is that benefits the vast majority of the people. 29) Given the current state of perceived or real political crisis, the leaders of this country must understand that it is in their own interest to try to find concrete solutions to the problems they themselves have partly created. The author believes that in the era of globalization, promoting ethnic or linguistic based politics is not the best way forward. Thus, unless the leaders take concrete actions before it is too late, they should be aware of the saying that “those who make reforms impossible make revolution inevitable”. This is what one learns from history of other countries in general as well as from Ethiopian history in particular. There is a need not only a change of attitude and mind set but also a total re-organization and re-orientation of the government and society. This is an absolute necessity towards a peaceful transition to genuine transformation of the country and its people.
30) Encourage academic freedom and civilized dialogue on any issue that is at the heart of the matter to the people of Ethiopia and its future including on the role and pros and cons of FDI, development aid, the role of civil societies and about the role of higher education and on the quality of education in Ethiopia etc
31) Depoliticize the civil service, the business community and the academic institutions as well as the media.
32) Be transparent, accountable and loyal for the Ethiopian people and not succumb to the whims of foreign powers, actors and institutions. Here national unity and reconciliation as well as having a national consensus about the future of the country and its people is a precondition for withstanding external pressures and conspiracies.
33) The need to have a strong, united and decisive leadership that is genuinely committed to substantially reduce the alleged rampant corruption that is said to exist in Ethiopia in many areas is long overdue. Tinkering with the investment legislation and re-organizing the administrative structure related to FDI alone is not enough. Nor is a mere reshuffling of Ministers a real solution to solve complex problems. Unless concrete, bold, drastic political, economic and cultural surgery and actions are taken on all fronts, trying to merely find short term solutions and postponing them will only result in a much greater crises and conflict which might be difficult to imagine and comprehend. In such a case our dream of wanting and aspiring to see Ethiopia as an ever-rising star of Africa and a united, peaceful, strong, prosperous black power will remain a pipe dream for some years to come.
34) Listening to the voice, concerns of local people and their respective traditional and wise elders and trying to understand the causes of the suffering and trying to genuinely find out the real causes that give rise to such problems is the first step towards responsible politics and practices as well as an honest way of solving socio-economic problems. The active and meaningful involvement and participation of the people is a precondition in trying to identify problems and finding practical solutions. The old and traditional away of trying to be economical with the truth behaving like an ostrich does not work in an information age and communication revolution where the vast majority of the people and particularly the youth are also well informed.
35) As far as this author is concerned, promoting and encouraging an honest and genuine civilized dialogue on issues of national interest that determines the future of the country; making effective use of the knowledge and experiences of independent minded Ethiopian
242
scholars and researchers and advisers and seeking independent advise from them and local elders at grass root level; fundamentally improving the quality of the current education and training system; involving the people to genuinely participate in the affairs of their country and their government without fear and intimidation; creating the conditions for a genuine national reconciliation; building internal unity and cohesiveness in all affairs of the state and its people; pursuing policies that minimize dependence on foreign aid and foreign investment and systematically and intelligently acquiring appropriate technology that does not lead to unemployment; building a national technological infrastructure in all sectors of the economy that will help to ensure a bright future for the future generation of Ethiopians are steps in the right direction. In short, the author strongly believes that there is no better alternative than encouraging and practicing a genuine and civilize dialogue between the Government and the people, between the Government and its critical scholar and citizens, between the citizens and various ethnic groups themselves as well as between the government and responsible opposition groups who have wider followings among the population. However, the type of constructive and civilized dialogue that the author has in mind does not certainly include a dialogue with every Dick and Harry or irresponsible Sunday school politicians and idealists who write many emotionally driven articles in the Internet who spread nothing but hatred and who wish to get rid of EPRDF and the Ethiopian Government now without any viable, credible and sustainable alternative and whose only obsession is to be in power but without any alternative and realistic vision. Such individuals and groups do care if the country plunges into a deadly civil war and hence to the pleasure of the enemies of the unity of Ethiopian people. No responsible Ethiopian government should seat down to discuss or with such irresponsible elements and mercenaries. It is only when the above stated steps and actions are also taken in deeds than on paper that true and genuine national transformation and national renaissance can come about in Ethiopia. Only then will our dream and vision to see Ethiopia become a strong, united, peaceful, prosperous and a black power and a shining star and an envy for the people of Africa become a reality.
References Aghrout.A and Hodd.M (2005), Foreign Direct Investment in North Africa: A Comparative
Perspective. Alexandra Spieldoch and Sophia Murphy (2009). “Land Grab: The Race for the World's
Farmland,” Retrieved on November 3, 2010, from http://www.independent.co.uk/news/business/analysis-andfeatures/land-grab- the-race-for the- worlds-farmland-1677852.html.
Andreas Johnson and Jönköping (2005), Host country effects of foreign direct investment: The case of developing and transition economies, JIBS Dissertation Series No. 031 International Business School, Printed by ARK Tryckaren AB.
Bennett (2005), Theory and Evidence, the Determinants of FDI in Sub-Saharan Africa, Leonard N. Stern School of Business, New York University, New York, USA.
Bijit Bora (2002), Foreign Direct Investment: Research issues, edition published in the Taylor & Francis e-Library London and New York
Blomström. M, and Kokko. A (2003) The economics of foreign direct investment incentives, working Paper No. 9489, Cambridge, Mass: National Bureau of Economic Analysis.
Catherine dawson (2002). Practical research methods A user-friendly guide to mastering Research techniques and projects: Oxford, United Kingdom
243
Creswell, J. W. (2007). Qualitative Inquiry and Research Design: Choosing Among Five Approaches (2nd ed.). California, USA: Sage Publications, Inc.
Dane, F. C. (1990). Research Methods. Wadsworth, Inc David Hollam (2009). Foreign Investment in Developing Country Agriculture: Issues, Policy
Implications and International Response, Session 2.2. Promoting responsible international investment in agriculture, from, http://www.oecd.org/investment/gfi-8
Dernbach, John C. 2011. Creating the Law of Environmentally Sustainable Economic Development, Pace Environmental Law Review, Vol.28, Issue 3, pp.617-18.
Ethiopian Economic Association (RRA), (2007), Report on the Ethiopian Economy. Vol.5. 2005/2006. Addis Ababa, Ethiopia: United printers.
Family Health International Research Triangle Park (2005), Qualitative Research Methods Data Collector’s Field Guide, North Carolina 27709, USA , http://www.fhi.org
FDRE (1994). Constitution of the Federal Democratic Republic of Ethiopia. Federal Negarit Gazeta.
FDRE (2002). Re-Enactment of the Investment Proclamation. Federal Negarit Gazeta, Proclamation No. 280/2002.
FDRE (2003), Investment incentives and investment areas reserved for domestic investors, Federal Negarit Gazeta, Council of Ministers Regulation No. 84/2003.
FDRE (2005), Expropriation of land holdings for Public Purposes and Payment of Compensation Proclamation. Federal Negarit Gazeta, Proclamation No. 455/2005. Frankel,
Ernst G. 2005. Managing Development: Measures of Success and Failure in Development, New York: Palgrave Macmillan, p.xviii.
Fisseha-Tsion Menghistu, International Transfer of Technology to Developing Countries: A study on the Significance of Fiscal Policy for Technology Transfer for Development, A Ph.D. Dissertation, University of Amsterdam, November, 1988,389pp
…………………………., A Survey of the legal Definition, Objectives and Controversies of FDI in Developing countries, Amsterdam, 1988, un published manuscript 45pp.
…………………………. The Power of Capitalism and Free Enterprise and its Influence in poor Countries and the Role of the State, unpublished manuscript, August, 2016, pp.1 Getahun Negash, Implementation of Direct Foreign Investment in Ethiopia: The Case of Addis Ababa City Administration and the Oromia National Regional State, a thesis submitted to the Center of Federal Studies in partial fulfillment of the requirements for the Degree of Master of Arts in Federal Studies at Addis Ababa University, May 2014,
Getenet Astatike and Hirut Assefa (2005), Determinants of Foreign Direct Investment in Ethiopia: A time Series Analysis. London: Policy Studies Institute.
Getinet and Hirut (2006) Determinants of Foreign Direct Investment in Ethiopia: A time Series Analysis. London: Policy Studies Institute. Henok Assefa, Derk bienen, Dan Ciuriak (2012), Ethiopia investment prospects: a sectoral scan munich, 18 december 2012. Available online: http://www.bkp-development.de.
Honest Prosper Ngowi. (2005). Foreign Direct Investment Inflows into Emerging Markets: Driving Forces and Lessons for Africa, Centre for the Study of Emerging Markets Series
244
Standing Order ISBN 1–4039–9521–4, Great Britain, Antony Rowe Ltd, Chippenham and Eastbourne
IMF Press Release An International Monetary Fund (IMF) team led by Andrea Richter Hume visited Addis Ababa from June 3-17, 2015 to conduct discussions for the 2015 Article IV Consultation with Ethiopia, Press Release No. 15/286, June 19, 2015 IMF Staff Mission on the 2012 Article IV Consultation with Ethiopia, Press Release No. 12/224. (Available at, http://www.imf.org/external/np/sec/pr/2012/pr12224.htm) (Accessed on June 10, 2012)
IMF- Ethiopia-Enhanced Structural Adjustment Facility Medium-Term Economic and Financial Policy Framework Paper, 1998/99-2000/01. (http://.imf.org/external/np/pfp/eth.etp.htm#I), (Accessed on September 20, 2011)
Jacques Morisset and Kelly Andrews-Johnson,(2004). The Effectiveness of Promotion Agencies at Attracting Foreign Direct Investment: The International Bank for Reconstruction and Development / the World Bank Washington, Dc
Jones, J, and Wren, C., (2006), Foreign Direct Investment and the Regional Economy , University of Newcastle upon Tyne, UK, Ashgate Publishing. Mary-Ann Juma (2012), The effect of foreign direct investment on growth in Sub-saharan Africa. Submitted to the Department of Economics of Amherst College in partial fulfillment of the requirements for the degree of Bachelor of Arts with Honors. Miles, M. B. & Huberman, M.A. (1994).Qualitative data analysis: an expanded sourcebook, 2ndedn. Thousand Oaks, CA: Sage. MoFED (2002). Ethiopia: Sustainable development and poverty reduction program. Addis Ababa: Ministry of Finance and Economic Development (MoFED), Federal Democratic Republic of Ethiopia.
MoFED (2010). Federal Democratic Republic of Ethiopia, Growth and Transformation Plan 2010/11 – 2014/15. 2 Volumes. Addis Ababa, November 2010. MoFED,2010, p.1. N.B. The Government has amended the target date for achieving middle- income status from 2023 to 2025.
Namizinga N. (2007), The Impacts of Foreign Direct Investment on Development: Policy Challenges for Malawi: Integrated Framework Policy Analysis working paper serious No.6, Government of Malawi, Ministry of Industry, Trade and private sector development.
OECD (2005), Regulatory Environment for Foreign Direct Investment, Investment for Africa Development: Making it happen, Roundtable organized under the joint auspices of NEPD and the OECD Investment Committee, Entebbe, Uganda. ORLUA (2007), Proclamation No. 130/ 2007, Proclamation to amend the proclamation No. 56/2002, 70/2003, 103/2005 of Orontia Rural Land Use and Administration,

245
PPESA (2013). Privatization and Public Enterprises Supervising Agency, annual Magazine, November 2013.
Remla kedir (2012), the impact of foreign direct investment on poverty reduction in Ethiopia: cointegrated var approach a thesis submitted to the of Department of Economics presented in partial fulfillment of the requirements for the Degree of Master of Science in Economics . Addis Ababa University, Ethiopia. Sader. F ( 2003). “Do One-Stop Shops Work?” FIAS, Washington, D.C.
Sen, A 2000.Development as Freedom, New Delhi: Oxford University Press, p.3, 10. 18 Solomon Mamo Woldemeskel (2008). Determinants of Foreign Direct Investment in Ethiopia.
Thesis submitted to Maastricht School of Governance in partial fulfillment of the requirements for the degree of Master of Science in Public Policy Maastricht University Maastricht, the Netherlands.
Sornarajah M. (2004), The international law on foreign investment, Cambridge University, New York, Cambridge University press. Tadesse Kuma (2003), Private Investment in Commercial Agriculture in Ethiopia: Opportunities and Constraints, A paper prepared for the EDRI/IFPRI policy forum on "The State of Food Security and Agricultural Marketing in Ethiopia." Ethiopian Development Research Institute. Addis Ababa
Taxation in Latin America, IBFD, 1987 The Ethiopian Macro-Economic Hand Book (2010), Investing in Ethiopia. from www.accesscapitalsc.com
Tsegai Berhane, Industrial Pollution and Control in Ethiopia: A Case study of Almeda Textile Factory and Sheba Leather Industry in Tigray Regional State, a thesis submitted in partial fulfillment for the Doctor of Philosophy in Law, University of Warwick, 2015,
UNCTAD (1999), World Investment Report- Foreign Direct Investment and the Challenge of Development, New York and Geneva. UNCTAD (2002), Investment and Innovation Policy Review of Ethiopia. United Nations Publications, New York and Geneva.
UNCTAD (2002), World Investment Report 2002: Transnational Corporations and Export Competitiveness, United Nations publication, New York and Geneva.
UNCTAD (2010), The Least Developed Countries Report 2010. United Nations. Weissleder L. (2009), Foreign Direct Investment in the Agricultural Sector in Ethiopia in ECOFAIR trade dialogue, Discussion paper No.12, University of Bone, Germany. UNDP, 2013. Human Development Report 2013, the Rise of the South: Human Progress in Diverse World, USA: New York, pp. 143-92.
UNIDO, Africa Investor Report (2011), towards evidence-based investment promotion strategies, United Nations Industrial Development Organization, Geneva.
246
World Bank Transforming Ethiopia into a Manufacturing Powerhouse Requires Skills Development and Improved Investment Climate, Press Release, July 8, 2015 World bank; http://www.worldbank.org/en/news/press-release/2015/07/08/transforming-ethiopia- into-a-manufacturing-powerhouse-requires-skills-development-and-improved-investment- climate
World Bank, Overcoming Constraints in the Manufacturing Sector in Ethiopia, 4 th Economic update, July 8, 2015
World Bank (2012), ‘Worldwide Governance Indicators’, Available at http://info.worldbank.org/governance/wgi/index.asp (accessed 16 May 2013). World Bank, 2012. Ethiopia Economic Update-Overcoming Inflation, Raising Competitiveness. Available at; http://www.worldbank.org/en/news/2012/12/13/ethiopia-economic-update- overcoming-inflation-raising-competitiveness (Accessed on December 23, 2012)
World Economic Forum. (2007). The Global Competitiveness Report 2006/07, The World Economic Forum, Geneva.
World Economic Forum. (2013). The Global Competitiveness Report 2012/13, The World Economic Forum Geneva.
World Investment Report (2013), Global Value Chains: Investment and Trade for Development.