The UNDP Climate Change Country Profiles
10
FEBRUARY 2010 AMERICAN METEOROLOGICAL SOCIETY | 157 AFFILIATIONS : MCSWEENEY AND LIZCANO—School of Geography and Environment, Oxford University, Oxford, United Kingdom; NEW—School of Geography and Environment, Oxford University, Oxford, United Kingdom, and Tyndall Centre for Climate Change Research, Oxford University, Oxford, United Kingdom; LU— Environment and Energy Group, Bureau for Development Policy, United Nations Development Programme, New York, New York CORRESPONDING AUTHOR: Mark New, School of Geography and Environment, Oxford University, South Parks Road, Oxford OX1 3QY, United Kingdom E-mail: [email protected] DOI:10.1175/2009BAMS2826.1 ©2010 American Meteorological Society I t is widely acknowledged that developing countries will suffer some of the greatest impacts of climate change due to their greater reliance on climate- dependent natural resources, and lack of finance and infrastructure for adaptation. However, the number of analyses of climate observations, climate model experiments, climate model projections, and climate change impacts studies that are based on develop- ing countries is significantly smaller than in those which have been undertaken for more economically advanced countries. A 2006 BAMS article by Wash- ington et al. demonstrates that only 10.7% of articles in the Journal of Climate and 25.6% of articles in the International Journal of Climatology published between 2002 and 2004 deal with climate research on Africa, the Middle East, Asia, and South America, while the overwhelming majority concern North America and Canada, Europe, and Australasia. This deficit in knowledge and information doubtlessly limits capacity for climate-related risk assessment, adaptation planning, and decision making in devel- oping countries. Climate change data generated using GCMs have been made increasingly available to other research The UNDP Climate Change Country Profiles Improving the Accessibility of Observed and Projected Climate Information for Studies of Climate Change in Developing Countries BY C. MCSWEENEY, M. NEW, G. LIZCANO, AND X. LU groups outside of the major modeling centers through the progressive phases of the Coupled-Model Inter- comparison Project (CMIP). The recent effort of the World Climate Research Programme (WCRP) in the run up to the IPCCs fourth assessment report has made available an “unprecedented collection” of over 35 TB of data from coordinated experiments using 23 different GCMs. This initiative has enabled a consid- erable body of research based on this data [over 500 publications listed on the Program for Climate Model Diagnosis and Intercomparison (PCMDI) Web site to date] and, perhaps most importantly, has considerably improved the ease with which multimodel projec- tions can be assembled and used to add information about uncertainty in those projections that cannot be gained from using a single model. However, while these available data provide a rich opportunity for cli- mate research, the computing facilities and expertise required for the transfer, storage, and manipulation of multiple files as large as these global data fields still inhibit their use where facilities, resources, and/ or expertise are limited. This means that the number of analyses and applications of these climate data for developing countries still falls a long way short of those available for richer nations. The relative shortage of data, expertise, and facilities available for climate science in develop- ing countries cannot be addressed easily in the short term, but there are steps that can be taken to improve the availability of data that already exist for those countries. The objective of the United Na- tions Development Programme (UNDP) Climate Change Country Profiles project is to make use of existing data to generate a collection of country- level analyses of recent climate observations and the multimodel projections made available through the WCRP CMIP3. The project uses a consistent approach for all countries studied (listed in Table 1) to produce an “off the shelf” analysis of the
-
Upload
independent -
Category
Documents
-
view
1 -
download
0
Transcript of The UNDP Climate Change Country Profiles

February 2010aMerICaN MeTeOrOLOGICaL SOCIeTy | 157
AffiliAtions: McSweeney and Lizcano—School of Geography and Environment, Oxford University, Oxford, United Kingdom; new—School of Geography and Environment, Oxford University, Oxford, United Kingdom, and Tyndall Centre for Climate Change Research, Oxford University, Oxford, United Kingdom; Lu—Environment and Energy Group, Bureau for Development Policy, United Nations Development Programme, New York, New YorkCorresponding Author: Mark New, School of Geography and Environment, Oxford University, South Parks Road, Oxford OX1 3QY, United KingdomE-mail: [email protected]
DOI:10.1175/2009BAMS2826.1
©2010 American Meteorological Society
I t is widely acknowledged that developing countries will suffer some of the greatest impacts of climate change due to their greater reliance on climate-
dependent natural resources, and lack of finance and infrastructure for adaptation. However, the number of analyses of climate observations, climate model experiments, climate model projections, and climate change impacts studies that are based on develop-ing countries is significantly smaller than in those which have been undertaken for more economically advanced countries. A 2006 BAMS article by Wash-ington et al. demonstrates that only 10.7% of articles in the Journal of Climate and 25.6% of articles in the International Journal of Climatology published between 2002 and 2004 deal with climate research on Africa, the Middle East, Asia, and South America, while the overwhelming majority concern North America and Canada, Europe, and Australasia. This deficit in knowledge and information doubtlessly limits capacity for climate-related risk assessment, adaptation planning, and decision making in devel-oping countries.
Climate change data generated using GCMs have been made increasingly available to other research
The UNDP Climate Change Country ProfilesImproving the accessibility of Observed and Projected Climate Information for Studies of Climate Change in
Developing Countriesby c. McSweeney, M. new, G. Lizcano, and X. Lu
groups outside of the major modeling centers through the progressive phases of the Coupled-Model Inter-comparison Project (CMIP). The recent effort of the World Climate Research Programme (WCRP) in the run up to the IPCCs fourth assessment report has made available an “unprecedented collection” of over 35 TB of data from coordinated experiments using 23 different GCMs. This initiative has enabled a consid-erable body of research based on this data [over 500 publications listed on the Program for Climate Model Diagnosis and Intercomparison (PCMDI) Web site to date] and, perhaps most importantly, has considerably improved the ease with which multimodel projec-tions can be assembled and used to add information about uncertainty in those projections that cannot be gained from using a single model. However, while these available data provide a rich opportunity for cli-mate research, the computing facilities and expertise required for the transfer, storage, and manipulation of multiple files as large as these global data fields still inhibit their use where facilities, resources, and/or expertise are limited. This means that the number of analyses and applications of these climate data for developing countries still falls a long way short of those available for richer nations.
The relative shortage of data, expertise, and facilities available for climate science in develop-ing countries cannot be addressed easily in the short term, but there are steps that can be taken to improve the availability of data that already exist for those countries. The objective of the United Na-tions Development Programme (UNDP) Climate Change Country Profiles project is to make use of existing data to generate a collection of country-level analyses of recent climate observations and the multimodel projections made available through the WCRP CMIP3. The project uses a consistent approach for all countries studied (listed in Table 1) to produce an “off the shelf ” analysis of the

February 2010|158
Report on Emissions Scenarios (SRES) emis-sions scenarios (A2, A1B, and B1; see the 2000 published report by Nakicenovic et al. for further explanation of these scenarios). These time series depict the projected changes as a “plume” showing the ensemble range of the 15 models under each scenario, thereby illus-trating the magnitude of projected changes and the level of model spread (indicative of model uncertainty) relating to each SRES emissions scenario.
b) Maps depicting projected changes by 10-yr “time slices” for the 2030s, 2060s, and 2090s under SRES emissions scenario A2 on a 2.5° × 2.5° grid. For each grid box we give the en-semble median change and also the ensemble range across the 15 models.
A summary table of observed trends and projected •change, averaged over the whole country, for the 2030s, 2060s, and 2090s under SRES emissions scenarios A2, A1B, and B1.A narrative summarizing the data above and •placing it in the context of the country’s general climate and known inadequacies in climate model performance affecting that region.
data to provide basic observed and model out-put summaries, and a lso make a v a i l a b l e t h e underlying data for each country in smaller—and thus more man-a ge a ble —f i le s for each coun-try, and in text format that can ea si ly be read and used w it h widely available sof tware pack-ages or simple text editors. By undertaking and d issem i nat i ng basic a na lyses of observed data and model out-puts, this project allows institutions or individuals undertaking further studies to make use of the information without bearing the burden of resourc-ing the considerable data processing involved in extracting the required information directly from multiple global fields from large data archives. We expect that this will encourage individuals to undertake studies that otherwise might not have been feasible in terms of the resources or facilities available, and also reduce the replication of simi-lar analyses being undertaken by individuals and organizations, freeing resources for further studies and applications.
detAils of the Country profile Contents. Each of the UNDP climate change country profiles includes the following elements, for a number of climate variables.
A set of maps and diagrams demonstrating the •observed and projected climates of that country:
a) Country-average time series showing ob-served changes combined with projected changes under three of the Intergovernmen-tal Panel on Climate Change (IPCC)’s Special
Table 1. Countries included in the undp Climate Change Country profiles project.
Africa Asia CaribbeanCentral America
Angola
Benin
Cameroon
Cape Verde
Chad
Comoros
Equatorial
Guinea
Eritrea
Ethiopia
Liberia
Sierra Leone
Ghana
Gambia
Gabon
Guinea
Kenya
Malawi
Mali
Mauritania
Mauritius
Morocco
Mozambique
Sao Tome and
Principe
Senegal
Tanzania
Togo
Uganda
Zambia
Afghanistan
Armenia
Cambodia
Nepal
Pakistan
Vietnam
Yemen
Antigua and Barbuda
Barbados
Cuba
Dominica
Dominican Republic
Grenada
Jamaica
St Kitts and Nevis
St Lucia
St Vincent and the
Grenadines
The Bahamas
Trinidad and Tobago
Belize
Guyana
Mexico
Nicaragua
Suriname
February 2010aMerICaN MeTeOrOLOGICaL SOCIeTy | 159
A set of text files, held online, containing the un-•derlying data used in the report, in a simple text format that can be imported into commonly used spreadsheet software for further analysis (http://country-profiles.geog.ox.ac.uk).A technical document, included as an appendix •to each report, explaining how the data were ana-lyzed and describing the formats of the underlying data files.
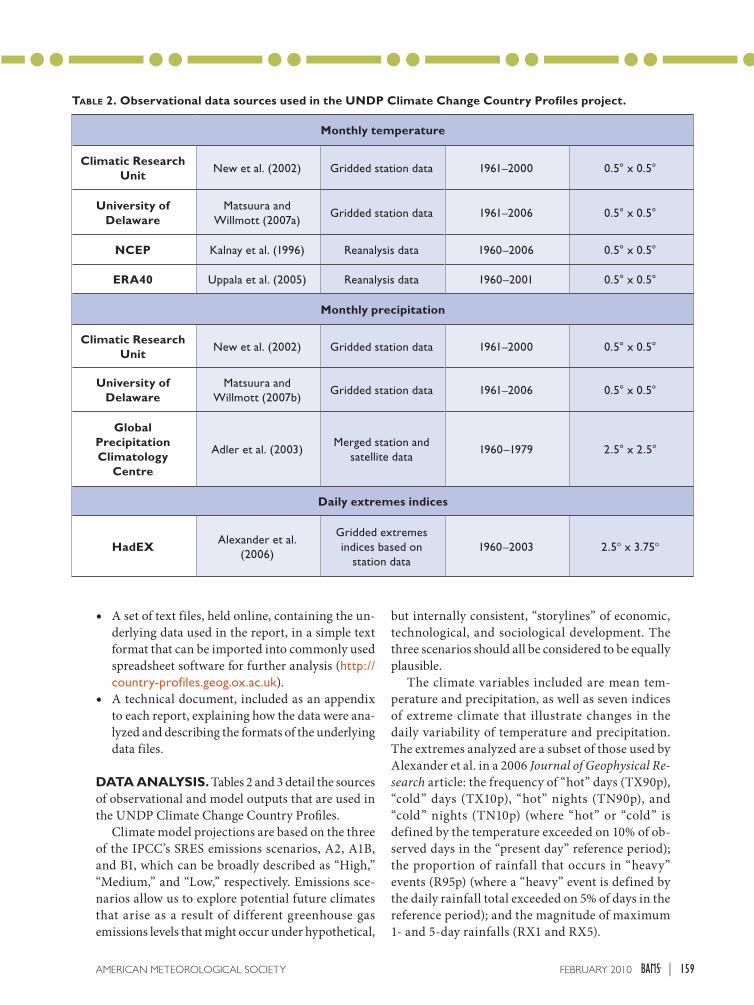
dAtA AnAlysis. Tables 2 and 3 detail the sources of observational and model outputs that are used in the UNDP Climate Change Country Profiles.
Climate model projections are based on the three of the IPCC’s SRES emissions scenarios, A2, A1B, and B1, which can be broadly described as “High,” “Medium,” and “Low,” respectively. Emissions sce-narios allow us to explore potential future climates that arise as a result of different greenhouse gas emissions levels that might occur under hypothetical,
but internally consistent, “storylines” of economic, technological, and sociological development. The three scenarios should all be considered to be equally plausible.
The climate variables included are mean tem-perature and precipitation, as well as seven indices of extreme climate that illustrate changes in the daily variability of temperature and precipitation. The extremes analyzed are a subset of those used by Alexander et al. in a 2006 Journal of Geophysical Re-search article: the frequency of “hot” days (TX90p), “cold” days (TX10p), “hot” nights (TN90p), and “cold” nights (TN10p) (where “hot” or “cold” is defined by the temperature exceeded on 10% of ob-served days in the “present day” reference period); the proportion of rainfall that occurs in “heavy” events (R95p) (where a “heavy” event is defined by the daily rainfall total exceeded on 5% of days in the reference period); and the magnitude of maximum 1- and 5-day rainfalls (RX1 and RX5).
Table 2. observational data sources used in the undp Climate Change Country profiles project.
Monthly temperature
Climatic research unit
New et al. (2002) Gridded station data 1961–2000 0.5° x 0.5°
university of delaware
Matsuura and Willmott (2007a)
Gridded station data 1961–2006 0.5° x 0.5°
nCep Kalnay et al. (1996) Reanalysis data 1960–2006 0.5° x 0.5°
erA40 Uppala et al. (2005) Reanalysis data 1960–2001 0.5° x 0.5°
Monthly precipitation
Climatic research unit
New et al. (2002) Gridded station data 1961–2000 0.5° x 0.5°
university of delaware
Matsuura and Willmott (2007b)
Gridded station data 1961–2006 0.5° x 0.5°
global precipitation Climatology
Centre
Adler et al. (2003)Merged station and
satellite data1960–1979 2.5° x 2.5°
daily extremes indices
hadeXAlexander et al.
(2006)
Gridded extremes indices based on
station data1960–2003 2.5° x 3.75°

February 2010|160
Values are expressed as anomalies from the 1970–99 mean climate (the most recent 30-yr averaging period), with the exception of the temperature extremes indices (TX10p, TX90p, TN10p, TN90p), as these values al-ready represent a relative measure. The observed extremes indices, which are derived from the HadEX gridded dataset, have already been calculated using 1961–90 as the standard climate reference period, and the nature of the data mean that reexpression us-ing a more recent reference period is not possible. However, we quote the frequency with which the percentile thresholds are exceeded in the period 1970–99 in the summary tables to indicate how much of a discrepancy this causes. Further, GCM daily data required to calculate extremes indices are only available for two periods in the future from the CMIP3 data site—2045–64 and 2080–99—so projections of changes in extremes are restricted to these two time periods.
All data are presented as annual and seasonal means, with seasons defined according to each country’s specific climate rather than limiting the study to fixed standard 3-month seasons. The observed time series are calculated as a mean of the different contributing datasets for each variable (data are provided in text files as both individual dataset time series and the multidataset-mean time series). GCM time series are created by first being regridded from their native resolution to a common 2.5° × 2.5° lat/lon grid before selecting grid boxes that lie ei-
Table 3. gCMs included in undp Climate Change Country profiles. for further details of each mode, refer to randall et al. (2007), pp. 597–599.
Model institute
bccr_bcm2_0 Bjerknes Centre for Climate Research, Norway
cccma_cgcm3_1Canadian Centre for Climate Modelling and Analysis
cnrm_cm3MeteoFrance/Centre National de Recherches Meteorologiques, France
csiro_mk3_0Commonwealth Scientific and Industrial Research Organisation (CSIRO) Atmospheric Research, Australia
csiro_mk3_5Commonwealth Scientific and Industrial Research Organisation (CSIRO) Atmospheric Research, Australia
gfdl_cm2_0U.S. Department of Commerce/ National Oce-anic and Atmospheric Sciences Geophysical Fluid Dynamics Laboratory
gfdl_cm2_1U.S. Department of Commerce/ National Oce-anic and Atmospheric Sciences Geophysical Fluid Dynamics Laboratory
giss_model_e_rNASA/ Goddard Institute for Space Studies (GISS), USA
inmcm3_0 Institute for Numerical Mathematics, Russia
ipsl_cm4 Institute Pierre Simon LaPlace, France
miub_echo_g
Meteorological Institute of the University of Bonn, Meteorological Research Institute of the Korea Meteorological Administration (KMA), and Model and Data Group, Germany/Korea
mpi_echam5 Max Plank Institute for Meteorology, Germany
mri_cgcm2_3_2a Meteorological Research Institute, Japan
ncar_ccsm3_0 National Center for Atmospheric Research, USA
ukmo_hadcm3Hadley Centre for Climate Prediction and Research/Met Office, UK
Table 4 (opposing page). example data summary table for tempera-ture and precipitation for Kenya. Asterisk indicates trend is statisti-cally significant at 95% confidence. similar tables are included in all reports for observed and projected changes in extremes indices.

February 2010aMerICaN MeTeOrOLOGICaL SOCIeTy | 161
KenyA
observed mean
1970–99
observed trend
1960–2006 sres
projected changes by the:
2030s 2060s 2090s
Min Median Max Min Median Max Min Median Max
temperature
°CChange (°C decade-1)
Change (°C) Change (°C) Change (°C)
A2 0.9 1.2 1.5 1.8 2.4 2.8 2.8 3.7 4.5Annual 23.9 0.21* A1B 0.8 1.2 1.5 1.6 2.3 2.7 2.3 3.0 4.0
B1 0.5 1.0 1.2 1.0 1.7 2.0 1.3 2.0 2.6A2 0.7 1.2 1.6 1.4 2.2 3.1 2.4 3.6 4.6
JF 25.1 0.22* A1B 0.6 1.1 1.6 1.7 2.3 2.8 2.1 3.1 4.1B1 0.4 1.0 1.3 1.0 1.5 2.2 1.1 1.9 2.6A2 1.0 1.2 1.8 1.8 2.4 2.7 2.9 3.8 4.5
MAM 24.6 0.29* A1B 0.5 1.3 1.6 1.6 2.3 2.7 2.3 3.0 3.9B1 0.5 1.0 1.5 1.1 1.6 2.0 1.4 2.1 2.8A2 0.9 1.2 1.6 1.9 2.5 2.8 3.0 3.9 4.7
JJAS 22.7 0.17* A1B 0.8 1.3 1.7 1.6 2.4 2.7 2.3 3.2 4.4B1 0.6 1.1 1.3 1.0 1.7 2.1 1.5 2.1 2.7A2 0.6 1.1 1.3 1.7 2.2 2.8 2.6 3.4 4.3
OND 23.9 0.19* A1B 0.8 1.1 1.3 1.4 2.1 2.6 2.0 2.7 3.8B1 0.2 0.9 1.2 0.8 1.5 2.0 1.2 1.8 2.5
precipitation
mm month-1 Change (mm decade-1)
Change (mm month-1) Change (mm month-1) Change (mm month-1)
A2 -1 3 11 0 5 20 3 13 27Annual 57.3 -1.5 A1B -3 4 12 0 7 16 1 10 21
B1 -3 2 10 -4 4 10 -1 5 15A2 -8 2 11 0 5 23 0 17 30
JF 29.0 -1.0 A1B -3 6 17 -2 3 25 -4 10 20B1 -11 2 17 -3 6 14 -3 5 19A2 -12 3 18 -12 9 31 -12 15 47
MAM 95.7 -3.7 A1B -8 7 21 -7 9 29 -13 12 35B1 -13 0 19 -8 2 23 -7 5 23A2 -5 0 12 -5 0 12 -2 3 22
JJAS 34.6 -0.8 A1B -8 0 6 -5 1 11 -3 1 13B1 -4 0 7 -8 0 8 -4 2 6A2 0 11 19 -3 13 33 5 29 49
OND 67.2 -0.6 A1B -6 8 29 0 9 30 6 21 32B1 -5 4 22 -8 12 19 -3 13 37
precipitation (%)
mm month-1 Change (% decade-1)
% change % change % change
A2 -2 5 14 0 8 24 5 20 48Annual 57.3 -2.6 A1B -5 6 17 0 8 26 2 15 30
B1 -3 2 12 -6 6 19 -1 10 19A2 -11 6 26 -3 11 49 0 27 89
JF 29.0 -3.5 A1B -14 11 50 -6 9 60 -7 20 58B1 -16 5 21 -4 12 43 -5 16 29A2 -16 3 14 -27 8 40 -17 19 60
MAM 95.7 -3.9 A1B -9 5 27 -7 10 37 -18 10 45B1 -17 0 26 -7 3 31 -5 4 37A2 -7 -1 26 -13 0 25 -4 11 46
JJAS 34.6 -2.4 A1B -18 1 24 -7 5 28 -6 3 27B1 -9 1 15 -17 2 27 -8 5 17A2 0 11 16 -4 13 32 6 27 48
OND 67.2 -0.8 A1B -4 8 20 0 12 29 7 19 36B1 -6 4 29 -9 12 18 -2 14 26

February 2010|162
ther wholly or partially within each country’s political boundaries to contribute to the country average, and then using the median, minimum, and maximum value for each year and each emissions scenario to create the time series “plumes.”
Further details of the methods employed in the data analysis are provided in the documentation available from the project Web site (http://country-profiles.geog.ox.ac.uk).
presentAtion of the AnAlyses. Some examples of the figures and summary tables are shown in Figs. 1–6 and Table 4, using Kenya for il-lustrative purposes. The full reports include similar figures for each season and parameter. The figures shown here include cases where climate model projections are more consistent, and where regions or particular parameters are more uncertain. For example, the precipitation changes in the time series in Fig. 3 show that both increases and decreases in precipitation are projected, depending on the model analyzed, but there is a tendency toward increases in total annual precipitation. These results are quanti-fied in Table 4, which shows that the changes in an-nual precipitation simulated for Kenya by the 2090s range from +5% to +48% under SRES-A2, +2% to +30% under SRES-A1B, and -1% to +19% under SRES-B1. Figure 4 then shows the spatial pattern of mean changes for specific 10-yr periods, again being careful to include both mean change and the range across the ensemble.
The distinct changes in daily extremes in obser-vations and projections are evident in Figs. 5 and 6. “Hot” nights tend to show the largest changes in both observations and projections in many countries. The time series for Kenya in Fig. 5 show particularly steep rates of increase in frequency since the early 1990s. Projected changes are also large, but the figures demonstrate the large range of model uncertainty associated with these daily extremes. These events, occurring approximately 10% of the time in 1970–99, are projected to occur on 77%–95% of days by the 2090s under SRES-A2, 64%–93% of days under SRES-A1B, and 40%–73% of days under SRES-B1.
Note that in the case of RX1 and RX5 we do not show the observed values overlaid on the model projection in time series plots. This is because the magnitude of rainfall extremes at observation sta-tions (points) does not compare with the magnitude of areal-average (grid cell) rainfall extremes in model simulations. In the case of the other extremes indices,
there may be disparities in the magnitudes of point and areal average represented by the different spatial scales of the information, but it is the direction and magnitude of the trend rather than the values with which we are primarily concerned.
Country dAtA files. The underlying data behind the figures and tables for each country are also made available in a text format. Observed data are provided as time series for every season in absolute as well as anomalies relative to the 1970–99 mean. For temperature and precipitation we also provide a 1970–99 climatology extracted from the CRU datasets and regridded to the same 2.5° × 2.5° lat/lon grid that is used for the model data, allowing it to be combined easily with the simulated changes. Model data are provided both as country average time series data for each season as well as 10-yr average “time slice” files with values for each 2.5° × 2.5° grid box for a rectangular area encompassing the whole country. We provide data for each individual model in the ensemble as well as the ensemble median, minimum, and maximum.
“AppropriAte” AppliCAtions. While en-couraging the use of observed and model-simulated climate projections, we also remain sensitive to the limitations of these outputs and the potential inap-propriate use and overinterpretation of such data that are inevitably facilitated via its wide circulation. We stress that these brief summaries are not a substitute for comprehensive, locally led assessments of climate change risk that should draw on a considerably wider range on information sources, including local expertise on specific social and physical vulner-abilities. These profiles should not be used as a sole information source for decision making, but instead act as a “stepping stone” in contributing to, and fa-cilitating, climate impact studies and vulnerability assessments that make up the body of information available for consideration by those involved in deci-sion making.
Appropriate applications for the UNDP climate change country profiles might include:
Provision of contributing information to those •comprehensive, locally led climate risk analyses, where the data are interpreted by local climate experts with due attention to the limitations of cli-mate model projections (discussed further below) and local contextual information.

February 2010aMerICaN MeTeOrOLOGICaL SOCIeTy | 163
Fig. 1. example temperature anomaly time series for Kenya. All values shown are in anomalies from the 1970–99 mean climate. Black curves show the mean of observed trends from 1960 to 2006. Brown curves and shading show the median and range of results from multi-gCM simulations of past climate. Colored lines and shading from 2007 onward show multimodel ensemble median and range of projected climate under three emissions scenarios. Colored bars on right hand of projections show range of model projections averaged over 2091–2100 for each emissions scenario.
Fig. 2. example maps for Kenya showing patterns of projected change in mean annual temperature (°C) for 10-yr periods in the future under sres-A2 scenario. All values are relative to the mean climate of 1970–99. in each grid box, the central value and color give the multimodel ensemble median, and the values in the upper and lower corners give the ensemble maximum and minimum.
Fig. 3. example precipitation percentage anomaly time series for Kenya. All values shown are in percentage anomalies from the 1970–99 mean climate. Black curves show the mean of observed trends from 1960 to 2006. Brown curves and shading show the median and range of results from multi-gCM simulations of past climate. Colored lines and shading from 2007 onward show multimodel ensemble median and range of projected climate under three emissions scenarios. Colored bars on right hand of projections show range of model projections averaged over 2091–2100 for each emissions scenario.

February 2010|164
Fig. 4. example maps for Kenya showing patterns of projected change in mean annual precipitation (%) for 10-yr periods in the future under sres-A2 scenario. All values are relative to the mean climate of 1970–99. in each grid box, the central value gives the multimodel ensemble median, and the values in the upper and lower corners give the ensemble maximum and minimum.
Fig. 5. example hot-night frequency time series for Kenya. Black curves show the mean of observed trends from 1960 to 2006. Brown curves and shading show the median and range of results from multi-gCM simulations of past climate. Colored lines and shading from 2007 onward show multimodel ensemble median and range of projected climate under three emissions scenarios. incomplete time series are shown for the extremes data as WCrp CMip data is only available for these two 20-yr time periods. Colored bars on right hand of projections show range of model projections averaged over 2091–2100 for each emissions scenario.
Provision of driving climate data for exploratory •climate impacts assessments that help to identify local vulnerabilities—for example, studies assess-ing potential future changes in water resource availability, or investigation of the possible re-sponses of crops to changing climate conditions.Identification of specific areas of vulnerability •that demand further investigation—for example, countries for which the GCM ensemble projects particularly large increases in extreme rainfalls may choose to direct their resources to this field, by commissioning more in-depth analyses of rain-fall regimes in observed and simulated climate, impact assessments, or hydrological modeling experiments.
Key AssuMptions And liMitAtions. Inherent in any of the proposed applications is a necessary understanding and due acknowledgment of the limitations of climate model projections. While GCMs have demonstrable skill in reproducing the large-scale characteristics of the global climate dy-namics, there remain substantial deficiencies that arise from limitations in resolution imposed by avail-able computing power, and deficiencies in scientific understanding of some processes. The IPCC provides a summary of those elements of climate models in which we can have some confidence, and those areas of remaining deficiencies, to which we would point the reader for guidance. Some key deficiencies which are particularly relevant to some of those countries

February 2010aMerICaN MeTeOrOLOGICaL SOCIeTy | 165
included in the UNDP Cli-mate Change Country Pro-files are:
The coarse spatial scale •that prevents the repre-sentation of small island land masses, such as those of the Caribbean.Difficulties in reproduc-•ing the characteristics of the El Niño/Southern Oscillation, which exerts a strong influence on the interannual and multi-year variability in climate in many regions.Deficiencies in reliably •simulating tropical pre-cipitation, particularly the position of the Inter-tropical Convergence Zone (ITCZ), which drives the seasonal rainfalls in the Tropics.
An inherent assumption made in the use of a multimodel ensemble range—as in these profiles—is that the degree of model spread is indicative of the level of uncertainty in the set of projections. While the degree of divergence between projections from different models is considered to reflect the level of confidence in model performance in some regions, variables, seasons, or particular features of the cli-mate system, users should be aware of the potential pitfalls of assuming that model consensus implies lower uncertainty in those projections. A multi-model experiment such as this reflects the level of scientific understanding and technical capabilities at one point in time; the characteristics of the projected changes, as well as the level of consensus between models, can be considered as a “snapshot” of the uncertainty that relates to the process of climate modelling rather than a “fixed” measure of total uncertainty in climate response.
We also acknowledge the limitation imposed by limited observational data coverage for many developing areas of the world, and thus their un-derrepresentation in the global gridded datasets (see Table 2) that we draw on to identify trends in recent climate. For countries where Alexander et al. (2006) were unable to gather sufficient daily data to calculate extremes indices, we are unable to include this information in our country profiles. For
some countries, these trend analyses will be based on data that provide incomplete spatial coverage of that country.
suMMAry. The UNDP Climate Change Country Profiles project contributes a source of observational climate data and model output on a country-by-country basis that can be consulted in investigations of climate impacts, risk assessments, or adaptation options and in directing resources to topics on which further exploration might be most beneficial. We provide basic analyses of these data in the form of nar-rative, data tables, and graphics as an “off the shelf” resource, as well as providing the underlying data for those analyses in an easy-to-use format in order to facilitate further analyses and application.
While this project makes available information that can be very valuable when used appropriately, it is important to note that significant limitations and caveats are involved wherever climate model projec-tions are applied. We remind users of these country profiles of the importance of (a) drawing on a wide range of information sources in investigations of climate change and its implications; (b) paying due attention to the limitations of climate model projec-tions that arise due to incomplete understanding of the climate system and coarse spatial resolution; and (c) paying due attention to the limitations of incom-plete spatial coverage of observational data in many developing regions.
A proposed second phase of the project will hope-fully extend this project to produce climate change
Fig. 6. example maps for Kenya showing patterns of projected change in hot night frequency (tn90p) for 10-yr periods in the future under sres-A2 scenario. in each grid box, the central value gives the multimodel ensemble median, and the values in the upper and lower corners give the ensemble maximum and minimum.

February 2010|166
profiles for all developing countries. All reports and data are available online at http://country-profiles.geog.ox.ac.uk.
ACKnoWledgMents. The UNDP Climate Change Country Profiles are funded jointly by the United Nations National Communications Support Program (NSCP) and the UK Department for International Development (DfID). We also acknowledge the modeling groups, the Program for Climate Model Diagnosis and Intercomparison, and the World Climate Research Program (WCRP) Working Group on Coupled Modeling for their roles in making available the WCRP Coupled Model Intercomparison Project 3 multimodel dataset.
For Further readingAdler, R. F., and Coauthors, 2003: The Version-2 Global
Precipitation Climatology Project (GPCP) monthly precipitation analysis (1979–present). J. Hydrome-teor., 4, 1147–1167.
Alexander, L., and Coauthors, 2006: Global ob-served changes in daily extremes of temperature and precipitation. J. Geophys. Res., 111, D05109, doi:10.1029/2005JD006290.
Kistler, R., and Coauthors, 2001: The NCEP–NCAR 50-year reanalysis: Monthly means CD-ROM and documentation. Bull. Amer. Meteor. Soc., 82, 247–267.
Matsuura, K., and C. J. Willmott, 2007a: Terrestrial Air Temperature: 1900–2006 Gridded Monthly Time Series (Version 1.01) [Available online at http://climate.geog.udel.edu/~climate/html_pages/Global_ts_2007/README.global.t_ts_2007.html.]
—, and —, 2007b: Terrestria l Precipitat ion: 1900–2006 Gridded Monthly Time Series (ver-sion 1.01) [Available online at http://climate.geog.udel.edu/~climate/html_pages/Global_ts_2007/README.global.p_ts_2007.html.]
Meehl, G. A., and Coauthors, 2007: The WCRP CMIP3 multi-model dataset: A new era in climate change research. Bull. Amer. Meteor. Soc., 88, 1383–1394.
Nakicenovic, N., and Coauthors, 2000: Special Re-port on Emissions Scenarios: A Special Report of Working Group III of the Intergovernmental Panel on Climate Change. Cambridge University Press, 599 pp.
New, M., D. Lister, M. Hulme, and I. Makin, 2002: A high-resolution data set of surface climate over global land areas. Clim. Res., 21, 1–25.
—, A. Lopez, S. Dessai, and R. Wilby, 2007: Challeng-es in using probabilistic climate change information for impact assessments: An example from the water sector. Phil. Trans. Roy. Soc. A, 365, 2117–2131.
Randall D., and Coauthors, 2007: Climate models and their evaluation. Climate Change 2007: The Physical Science Basis—Contribution of Working Group I to the Fourth Assessment Report of the Intergovernmental Panel on Climate Change, S. Solomon et al., Eds., Cambridge University Press, 589–662.
Uppala, S. M., and Coauthors, 2005: The ERA-40 re-analysis. Quart. J. Roy. Meteor. Soc., 131, 2961–3012.
Washington, R., and Coauthors, 2006: African climate change: Taking the shorter route. Bull. Amer. Meteor. Soc., 87, 1355–1366.