
Systems R–Fe–O ( R=Ho, Er): Thermodynamic properties of ternary oxides using differential...
19
Journal of Solid State Chemistry 179 (2006) 2212–2230 Systems R–Fe–O (R ¼ Ho, Er): Thermodynamic properties of ternary oxides using differential scanning calorimetry and solid-state electrochemical cells S.C. Parida , S.K. Rakshit, S. Dash, Ziley Singh, B.K. Sen, V. Venugopal Product Development Section, Radiochemistry and Isotope Group, Bhabha Atomic Research Centre, Trombay, Mumbai—400 085, India Received 15 February 2006; received in revised form 17 April 2006; accepted 29 April 2006 Available online 28 April 2006 Abstract The thermodynamic properties of three different types of ternary oxides RFeO 3 (s), R 3 Fe 5 O 12 (s) and RFe 2 O 4 (s) (where R ¼ Ho and Er) have been determined by calorimetric and solid-state galvanic cell methods. Heat capacities of RFeO 3 (s) and R 3 Fe 5 O 12 (s) have been determined by differential scanning calorimetry from 130 to 860 K. Heat capacity measurements from 130 to 860 K revealed l-type anomalies for RFeO 3 (s) and R 3 Fe 5 O 12 (s) compounds which are assigned due to magnetic order–disorder transitions. The oxygen chemical potentials corresponding to the three-phase equilibria involving these ternary oxides have been determined by using solid-state electrochemical cells. The standard molar Gibbs energies of formation of RFeO 3 (s), R 3 Fe 5 O 12 (s) and RFe 2 O 4 (s) have been computed from the oxygen potential data. Based on the thermodynamic information, oxygen potential diagrams have been computed for the systems R–Fe–O (R ¼ Ho and Er) at two different temperatures: T ¼ 1250 and 1450 K. Thermodynamic functions like C o p;m , S o m , H o , G o , ðH o T H o 0 Þ, ðH o T H o 298:15 K Þ, ðG o T H o 298:15 K Þ=T , D f H o m , and D f G o m have been generated for the compounds RFeO 3 (s) and R 3 Fe 5 O 12 (s) based on the experimental data obtained in this study and the available data in the literature. r 2006 Elsevier Inc. All rights reserved. Keywords: System Ho–Fe–O; System Er–Fe–O; Rare-earth orthoferrites; Rare-earth iron garnets; Heat capacity; Order–disorder transitions; Gibbs energy of formation; Oxygen chemical potential; Solid-state electrochemical technique; Differential scanning calorimetry 1. Introduction The two important classes of compounds in the systems R–Fe–O (where R ¼ rare earth element) are: the rare-earth orthoferrites RFeO 3 (s) and the rare-earth iron garnets R 3 Fe 5 O 12 (s). These two types of compounds have potential use in materials science and technology [1–5]. The practical application of these oxides and some of their substituted analogues include high temperature superconductors, magnetic bubble layers for storage devices, electrode materials for solid oxide fuel cells and materials for sensor technology. The physico-chemical properties of these ternary oxides are important for their practical applica- tions. The crystal structures and magnetic properties of these compounds have been thoroughly investigated by many researchers. However, the thermodynamic properties of these oxides have been studied to a limited extent. Quantitative information on the thermodynamic properties of these oxides will enable to predict their stability in different chemical environments. Katsura et al. [6] have established the phase diagram of the system R 2 O 3 –Fe 2 O 3 –Fe at high temperatures and reported the existence of three ternary oxides: RFeO 3 (s), R 3 Fe 5 O 12 (s) and RFe 2 O 4 (s) for R ¼ Ho and Er. It is evident from their study [6] that for the system Ho–Fe–O, the phase HoFe 2 O 4 (s) disappears below 1453 K, whereas for the system Er–Fe–O, the phase ErFe 2 O 4 (s) disappears below 1350 K. Accordingly, there are two different types of phase relations for these systems. The coexisting equilibrium phases below the decomposition temperature of RFe 2 O 4 (s) are: {RFeO 3 (s)+R 2 O 3 (s)+Fe(s)} and {R 3 Fe 5 O 12 (s)+RFeO 3 (s)+Fe 3 O 4 (s)}, whereas the coexist- ing equilibrium phases above the decomposition ARTICLE IN PRESS www.elsevier.com/locate/jssc 0022-4596/$ - see front matter r 2006 Elsevier Inc. All rights reserved. doi:10.1016/j.jssc.2006.04.024 Corresponding author. Fax: +91 22 2550 5150, +91 22 2550 5152. E-mail address: [email protected] (S.C. Parida).
-
Upload
independent -
Category
Documents
-
view
3 -
download
0
Transcript of Systems R–Fe–O ( R=Ho, Er): Thermodynamic properties of ternary oxides using differential...
ARTICLE IN PRESS
0022-4596/$ - se
doi:10.1016/j.jss
�CorrespondE-mail addr
Journal of Solid State Chemistry 179 (2006) 2212–2230
www.elsevier.com/locate/jssc
Systems R–Fe–O (R ¼ Ho, Er): Thermodynamic properties ofternary oxides using differential scanning calorimetry and
solid-state electrochemical cells
S.C. Parida�, S.K. Rakshit, S. Dash, Ziley Singh, B.K. Sen, V. Venugopal
Product Development Section, Radiochemistry and Isotope Group, Bhabha Atomic Research Centre, Trombay, Mumbai—400 085, India
Received 15 February 2006; received in revised form 17 April 2006; accepted 29 April 2006
Available online 28 April 2006
Abstract
The thermodynamic properties of three different types of ternary oxides RFeO3(s), R3Fe5O12(s) and RFe2O4(s) (where R ¼ Ho and Er)
have been determined by calorimetric and solid-state galvanic cell methods. Heat capacities of RFeO3(s) and R3Fe5O12(s) have been
determined by differential scanning calorimetry from 130 to 860K. Heat capacity measurements from 130 to 860K revealed l-typeanomalies for RFeO3(s) and R3Fe5O12(s) compounds which are assigned due to magnetic order–disorder transitions. The oxygen
chemical potentials corresponding to the three-phase equilibria involving these ternary oxides have been determined by using solid-state
electrochemical cells. The standard molar Gibbs energies of formation of RFeO3(s), R3Fe5O12(s) and RFe2O4(s) have been computed
from the oxygen potential data. Based on the thermodynamic information, oxygen potential diagrams have been computed for the
systems R–Fe–O (R ¼ Ho and Er) at two different temperatures: T ¼ 1250 and 1450K. Thermodynamic functions like Cop;m, So
m, Ho, Go,
ðHoT �Ho
0Þ, ðHoT �Ho
298:15 KÞ, �ðGoT �Ho
298:15 KÞ=T , DfHom, and DfG
om have been generated for the compounds RFeO3(s) and R3Fe5O12(s)
based on the experimental data obtained in this study and the available data in the literature.
r 2006 Elsevier Inc. All rights reserved.
Keywords: System Ho–Fe–O; System Er–Fe–O; Rare-earth orthoferrites; Rare-earth iron garnets; Heat capacity; Order–disorder transitions; Gibbs energy
of formation; Oxygen chemical potential; Solid-state electrochemical technique; Differential scanning calorimetry
1. Introduction
The two important classes of compounds in the systemsR–Fe–O (where R ¼ rare earth element) are: the rare-earthorthoferrites RFeO3(s) and the rare-earth iron garnetsR3Fe5O12(s). These two types of compounds have potentialuse in materials science and technology [1–5]. The practicalapplication of these oxides and some of their substitutedanalogues include high temperature superconductors,magnetic bubble layers for storage devices, electrodematerials for solid oxide fuel cells and materials for sensortechnology. The physico-chemical properties of theseternary oxides are important for their practical applica-tions. The crystal structures and magnetic properties ofthese compounds have been thoroughly investigated by
e front matter r 2006 Elsevier Inc. All rights reserved.
c.2006.04.024
ing author. Fax: +91 22 2550 5150, +9122 2550 5152.
ess: [email protected] (S.C. Parida).
many researchers. However, the thermodynamic propertiesof these oxides have been studied to a limited extent.Quantitative information on the thermodynamic propertiesof these oxides will enable to predict their stability indifferent chemical environments.Katsura et al. [6] have established the phase diagram of
the system R2O3–Fe2O3–Fe at high temperatures andreported the existence of three ternary oxides: RFeO3(s),R3Fe5O12(s) and RFe2O4(s) for R ¼ Ho and Er. It isevident from their study [6] that for the system Ho–Fe–O,the phase HoFe2O4(s) disappears below 1453K, whereasfor the system Er–Fe–O, the phase ErFe2O4(s) disappearsbelow 1350K. Accordingly, there are two different typesof phase relations for these systems. The coexistingequilibrium phases below the decomposition temperatureof RFe2O4(s) are: {RFeO3(s)+R2O3(s)+Fe(s)} and{R3Fe5O12(s)+RFeO3(s)+Fe3O4(s)}, whereas the coexist-ing equilibrium phases above the decomposition
ARTICLE IN PRESSS.C. Parida et al. / Journal of Solid State Chemistry 179 (2006) 2212–2230 2213
temperature are: {RFeO3(s)+RFe2O4(s)+R2O3(s)},{R3Fe5O12(s)+RFeO3(s)+Fe3O4(s)} and {RFe2O4(s)+R2O3(s)+Fe(s)}. Kimizuka et al. [7] have calculated theGibbs energies of formation of RFeO3(s), R3Fe5O12(s) andRFe2O4(s) from the measured equilibrium oxygen partialpressure over the co-existing phases using gas equilibriumtechnique in the temperature ranges: 1273pT/Kp1423,1273pT/Kp1523 and 1473pT/Kp1523, for R ¼ Ho andin the temperature ranges: 1273pT/Kp1423, 1273pT/Kp1373 and 1373pT/Kp1473, for R ¼ Er, respectively.
The heat capacity of HoFeO3(s) have been measured bySaito et al. [8] from 50 to 70K and by Bhattacharjee et al.[9] from 2.8 to 200K. Heat capacity of ErFeO3(s) havebeen measured by Saito et al. [10] from 6 to 300K. Heatcapacity of Ho3Fe5O12(s) and Er3Fe5O12(s) have beenmeasured by Harris and Meyer [11] from 1.3 to 20.6K andby Varazashvilli et al. [12] from 300 to 850K. Heatcapacity data for RFe2O4(s) compounds are not reported inthe literature.
Parida et al. [13–17] and Rakshit et al. [18] have carriedout e.m.f. and calorimetric measurements and found outthe thermodynamic properties of RFeO3(s) (for R ¼ La,Nd, Sm, Eu, Gd, Tb and Dy) and R3Fe5O12(s) (forR ¼ Sm, Eu, Gd, Tb and Dy).
In the present study, heat capacity measurements havebeen carried out for RFeO3(s) and R3Fe5O12(s) (R ¼ Ho,Er) from 130 to 860K using differential scanningcalorimetry (DSC). Solid-state electrochemical techniqueemploying oxide-ion conducting electrolytes have beenused to measure the oxygen potential over various three-phase coexisting electrodes and the standard molar Gibbsenergies of formation of RFeO3(s), R3Fe5O12(s) andRFe2O4(s) have been calculated from the measured oxygenpotentials. Other thermodynamic quantities have beencalculated from the experimental data. The principles ofheat capacity measurement by using DSC and oxygenchemical potential measurements using solid-state electro-chemical cells have been described in detail in earlierpublications [18–20].
2. Experimental
2.1. Materials preparation
The citrate–nitrate gel combustion method was followedfor the preparation of RFeO3(s) and R3Fe5O12(s). Pre-heated R2O3(s) (LEICO Industries Inc., USA, 0.999 massfraction), ferrous ammonium sulphate (Mohr’s salt;Qualigens Fine Chemicals, Mumbai, 0.99 mass fraction)were used as the starting materials. The Mohr’s salt wasdissolved in conc. HNO3 in order to oxidize Fe2+ ions toFe3+ ions and then diluted to �6M. Stoichiometricamount of preheated R2O3(s) was dissolved in diluteHNO3. Both the solutions were mixed and excess amountof citric acid (E. Merck, India, 0.995 mass fraction) wasadded to the solution to assist complete dissolution. The
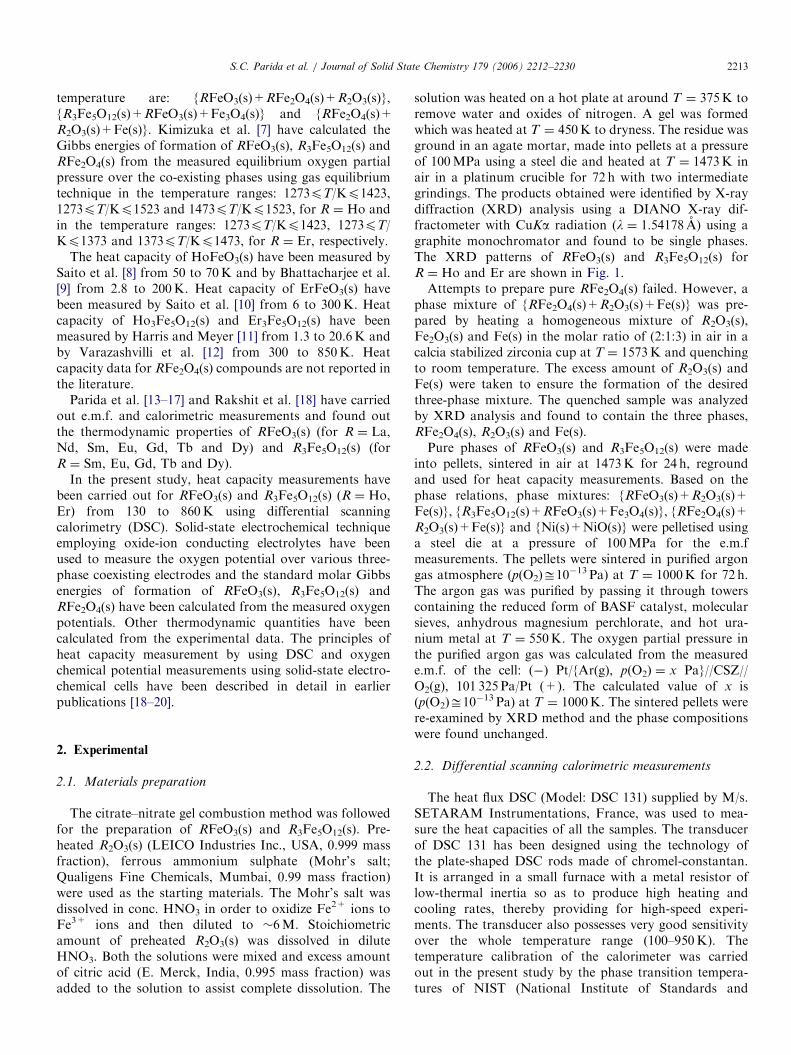
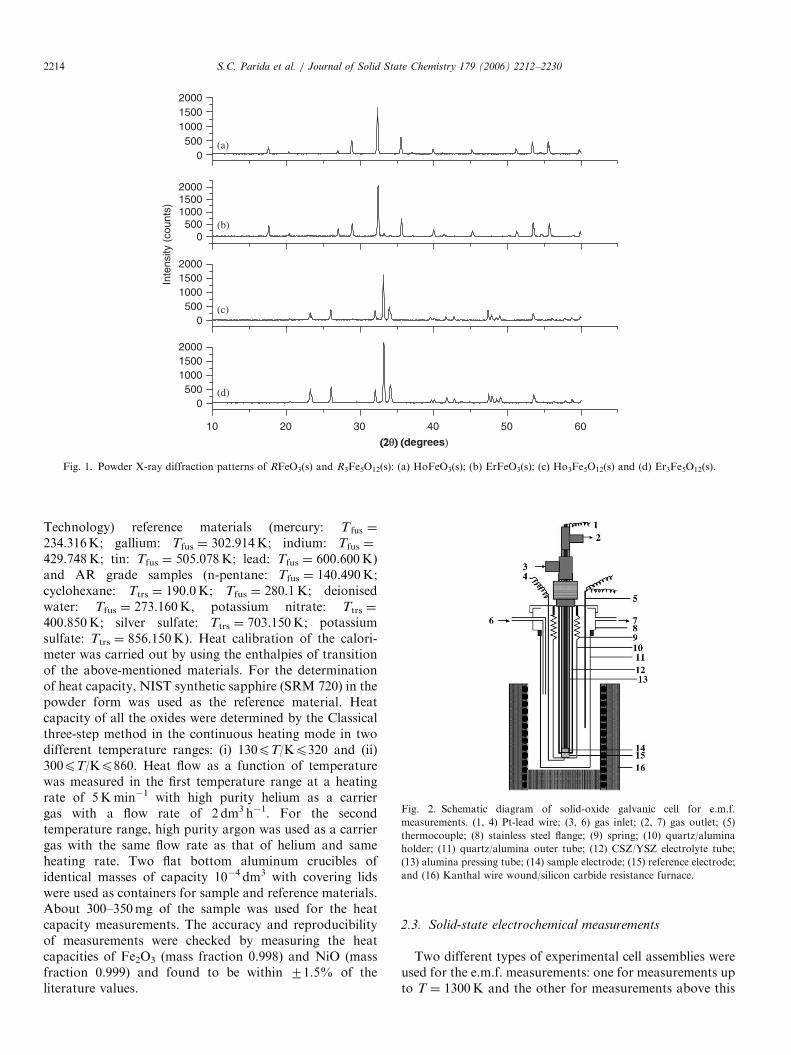
solution was heated on a hot plate at around T ¼ 375K toremove water and oxides of nitrogen. A gel was formedwhich was heated at T ¼ 450K to dryness. The residue wasground in an agate mortar, made into pellets at a pressureof 100MPa using a steel die and heated at T ¼ 1473K inair in a platinum crucible for 72 h with two intermediategrindings. The products obtained were identified by X-raydiffraction (XRD) analysis using a DIANO X-ray dif-fractometer with CuKa radiation (l ¼ 1:54178 A) using agraphite monochromator and found to be single phases.The XRD patterns of RFeO3(s) and R3Fe5O12(s) forR ¼ Ho and Er are shown in Fig. 1.Attempts to prepare pure RFe2O4(s) failed. However, a
phase mixture of {RFe2O4(s)+R2O3(s)+Fe(s)} was pre-pared by heating a homogeneous mixture of R2O3(s),Fe2O3(s) and Fe(s) in the molar ratio of (2:1:3) in air in acalcia stabilized zirconia cup at T ¼ 1573K and quenchingto room temperature. The excess amount of R2O3(s) andFe(s) were taken to ensure the formation of the desiredthree-phase mixture. The quenched sample was analyzedby XRD analysis and found to contain the three phases,RFe2O4(s), R2O3(s) and Fe(s).Pure phases of RFeO3(s) and R3Fe5O12(s) were made
into pellets, sintered in air at 1473K for 24 h, regroundand used for heat capacity measurements. Based on thephase relations, phase mixtures: {RFeO3(s)+R2O3(s)+Fe(s)}, {R3Fe5O12(s)+RFeO3(s)+Fe3O4(s)}, {RFe2O4(s)+R2O3(s)+Fe(s)} and {Ni(s)+NiO(s)} were pelletised usinga steel die at a pressure of 100MPa for the e.m.fmeasurements. The pellets were sintered in purified argongas atmosphere (p(O2)ffi10�13 Pa) at T ¼ 1000K for 72 h.The argon gas was purified by passing it through towerscontaining the reduced form of BASF catalyst, molecularsieves, anhydrous magnesium perchlorate, and hot ura-nium metal at T ¼ 550K. The oxygen partial pressure inthe purified argon gas was calculated from the measurede.m.f. of the cell: (�) Pt/{Ar(g), p(O2) ¼ x Pa}//CSZ//O2(g), 101 325 Pa/Pt (+). The calculated value of x is(p(O2)ffi10�13 Pa) at T ¼ 1000K. The sintered pellets werere-examined by XRD method and the phase compositionswere found unchanged.
2.2. Differential scanning calorimetric measurements
The heat flux DSC (Model: DSC 131) supplied by M/s.SETARAM Instrumentations, France, was used to mea-sure the heat capacities of all the samples. The transducerof DSC 131 has been designed using the technology ofthe plate-shaped DSC rods made of chromel-constantan.It is arranged in a small furnace with a metal resistor oflow-thermal inertia so as to produce high heating andcooling rates, thereby providing for high-speed experi-ments. The transducer also possesses very good sensitivityover the whole temperature range (100–950K). Thetemperature calibration of the calorimeter was carriedout in the present study by the phase transition tempera-tures of NIST (National Institute of Standards and
ARTICLE IN PRESS
10 20 30 40 50 60
0500
100015002000
Inte
nsity
(co
unts
)
0500
100015002000
0500
100015002000
0500
100015002000
(a)
(b)
(c)
(d)
(2(2θ) () (degrees)
Fig. 1. Powder X-ray diffraction patterns of RFeO3(s) and R3Fe5O12(s): (a) HoFeO3(s); (b) ErFeO3(s); (c) Ho3Fe5O12(s) and (d) Er3Fe5O12(s).
Fig. 2. Schematic diagram of solid-oxide galvanic cell for e.m.f.
measurements. (1, 4) Pt-lead wire; (3, 6) gas inlet; (2, 7) gas outlet; (5)
thermocouple; (8) stainless steel flange; (9) spring; (10) quartz/alumina
holder; (11) quartz/alumina outer tube; (12) CSZ/YSZ electrolyte tube;
(13) alumina pressing tube; (14) sample electrode; (15) reference electrode;
and (16) Kanthal wire wound/silicon carbide resistance furnace.
S.C. Parida et al. / Journal of Solid State Chemistry 179 (2006) 2212–22302214
Technology) reference materials (mercury: T fus ¼
234:316K; gallium: Tfus ¼ 302.914K; indium: Tfus ¼
429.748K; tin: Tfus ¼ 505.078K; lead: Tfus ¼ 600.600K)and AR grade samples (n-pentane: Tfus ¼ 140.490K;cyclohexane: Ttrs ¼ 190.0K; Tfus ¼ 280.1K; deionisedwater: Tfus ¼ 273.160K, potassium nitrate: Ttrs ¼
400.850K; silver sulfate: Ttrs ¼ 703.150K; potassiumsulfate: Ttrs ¼ 856.150K). Heat calibration of the calori-meter was carried out by using the enthalpies of transitionof the above-mentioned materials. For the determinationof heat capacity, NIST synthetic sapphire (SRM 720) in thepowder form was used as the reference material. Heatcapacity of all the oxides were determined by the Classicalthree-step method in the continuous heating mode in twodifferent temperature ranges: (i) 130pT/Kp320 and (ii)300pT/Kp860. Heat flow as a function of temperaturewas measured in the first temperature range at a heatingrate of 5Kmin�1 with high purity helium as a carriergas with a flow rate of 2 dm3 h�1. For the secondtemperature range, high purity argon was used as a carriergas with the same flow rate as that of helium and sameheating rate. Two flat bottom aluminum crucibles ofidentical masses of capacity 10�4 dm3 with covering lidswere used as containers for sample and reference materials.About 300–350mg of the sample was used for the heatcapacity measurements. The accuracy and reproducibilityof measurements were checked by measuring the heatcapacities of Fe2O3 (mass fraction 0.998) and NiO (massfraction 0.999) and found to be within 71.5% of theliterature values.
2.3. Solid-state electrochemical measurements
Two different types of experimental cell assemblies wereused for the e.m.f. measurements: one for measurements upto T ¼ 1300K and the other for measurements above this

ARTICLE IN PRESSS.C. Parida et al. / Journal of Solid State Chemistry 179 (2006) 2212–2230 2215
temperature. The low temperature cell described in Fig. 2was a double compartment assembly in which the innercompartment was separated from the outer compartmentby the use of electrolyte tube. The electrolyte tubeseparated the gas phase over the two electrodes so thattransport of oxygen from the higher oxygen potentialelectrode to the lower oxygen potential electrode via thegas phase is prevented. The calcia stabilized zirconia (CSZ)electrolyte tube with 15mol% CaO was supplied byNikatto Corporation, Japan. The dimensions of the CSZelectrolyte tube were; 13mm o.d., 9mm i.d., and 380mmlong with one end closed flat. It has been reported by Pratt[21] that the range of permissible oxygen partial pressuresfor purely ionic conduction for CSZ electrolyte is about10�20 Pa at T ¼ 1000K and 10�13 Pa at T ¼ 1273K. Theyttria stabilized zirconia (YSZ) electrolyte has similar rangeof oxygen partial pressure and temperature for purely ionicconduction. However, for a typical 7.5mol% yttria dopedthoria (YDT) electrolyte, measurements may normally bemade down to oxygen partial pressure of 10�32 Pa atT ¼ 1000K and 10�25 Pa at T ¼ 1273K [21]. An alter-native procedure for extending the measurement range tolow oxygen partial pressures has been discussed by Shoresand Rapp [22]. According to their experiment [22], abielectrolyte cell involving the solid electrolyte combinationof YDT/CSZ can extend the electrolytic conductiondomain over that of the single CSZ electrolyte. It has beenestimated in the present study that the oxygen partialpressure prevailing over the three-phase mixture{RFeO3(s)+R2O3(s)+Fe(s)} is about 10�17 Pa atT ¼ 1000K whereas that for the three-phase mixture{R3Fe5O12(s)+RFeO3(s)+Fe3O4(s)} is about 10�15 Pa atT ¼ 1000K. It is evident from the present estimation thatthe oxygen partial pressure over the phase mixture{RFeO3(s)+R2O3(s)+Fe(s)} is near the boundary of thepurely ionic conduction domain for CSZ or YSZ electro-lyte. It is unwise to use either CSZ or YSZ electrolyte forthe measurement of oxygen chemical potential over thisphase mixture. Hence, in the present study a bi-electrolytecell assembly involving the electrolyte combination ofYDT/CSZ has been used. The bi-electrolyte cell wasarranged in such a way that the YDT electrolyte (in theform of a disc) was adjacent to the electrode having lowoxygen chemical potential. This ensured that the transportnumber of oxygen ion was close to unity for the solidelectrolyte combination [22]. An inert environment wasmaintained over the solid electrodes throughout theexperiment by streams of purified argon gas. The argongas was purified by passing it through towers containingthe reduced form of BASF catalyst, molecular sieves,anhydrous magnesium perchlorate and hot uranium metalat T ¼ 550K. The cell temperature (71K) was measuredby a calibrated chromel/alumel thermocouple (ITS-90).
The high temperature cell (used above 1300K) wassimilar to the low temperature cell with few modifications.The outer quartz jacket was replaced by alumina tube thatwas forced air cooled near the flange joint. The Kanthal-
wire wound furnace was replaced by a (Pt–30%Rh) alloywire wound resistance furnace. The reference electrode(label 15 in Fig. 2) used was air in all measurements at hightemperatures. The measuring electrode was kept inside theelectrolyte tube over the YDT disc with a provision to passhigh purity inert gas. The temperature of the cell wasmeasured by a calibrated B-type thermocouple (71K).In both the cases, the e.m.f. (70.02mV) was measured
by a Keithely 236 Source Measure Unit (impedan-ce41014 ohms). E.m.f. measurements were carried out inthe temperature range 1050pT/Kp1250 with the lowtemperature cell assembly and in the range 1300pT/Kp1560 with the high temperature cell assembly. Thereversible e.m.f. of the following solid-state galvanic cellswere measured as a function of temperature.
Cell ðIÞ : ð�ÞPt=fRFeO3ðsÞ þ R2O3ðsÞ þ FeðsÞg
==YDT=CSZ==fNiðsÞ þNiOðsÞg=PtðþÞ
Cell ðIIÞ : ð�ÞPt=fR3Fe5O12ðsÞ þ RFeO3ðsÞ þ Fe3O4ðsÞg==
YDT=CSZ==fNiðsÞ þNiOðsÞg=PtðþÞ
Cell ðIIIÞ : ð�ÞPt=fRFe2O4ðsÞ þ R2O3ðsÞ þ FeðsÞg==
YDT=CSZ==fair; pðO2Þ ¼ 21:12 kPag=PtðþÞ
The reversibility of the solid-state electrochemical cellswas checked by micro-coulometric titration in bothdirections. A small quantity of current was passed(�100 mA for �10min) through the cell in either direction.After removal of the current source, the cell e.m.f. returnedto its original value. The e.m.f. of cells was also found to beindependent of flow rate of the inert gas passing over theelectrodes in the range from 2� 10�3 dm3min�1 to6� 10�3 dm3min�1. The XRD patterns of the pelletsbefore and after these experiments were found unchanged.
3. Results and discussion
3.1. Heat capacity measurements on RFeO3(s)
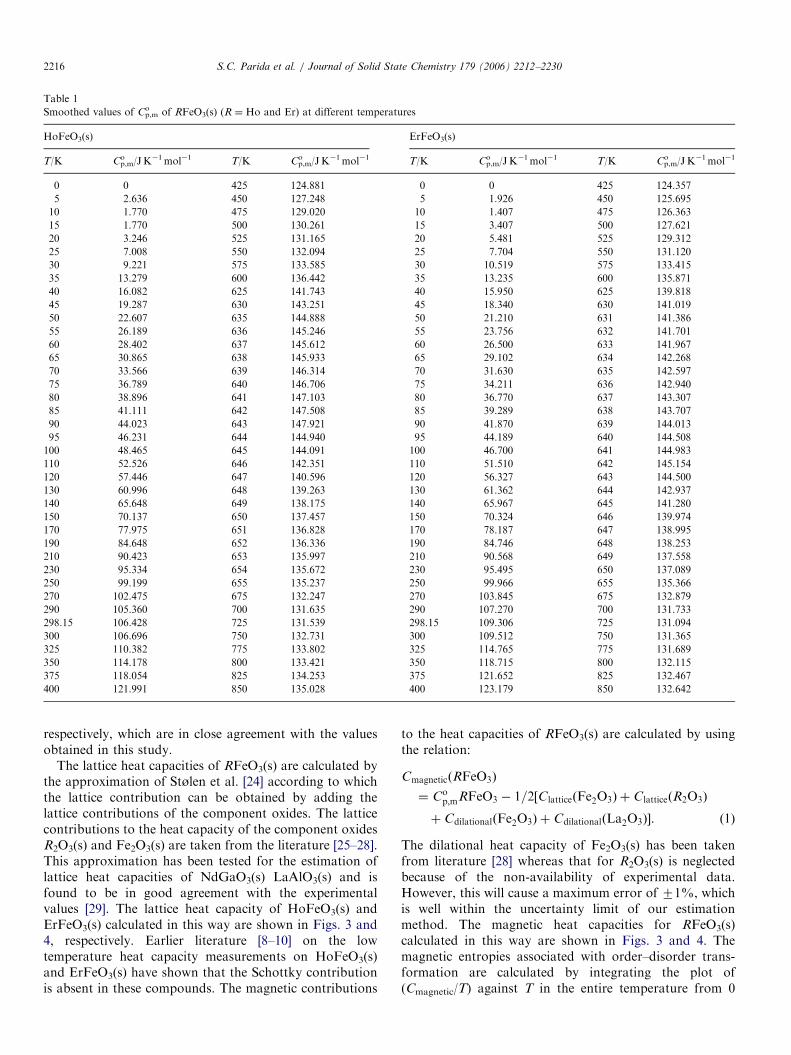
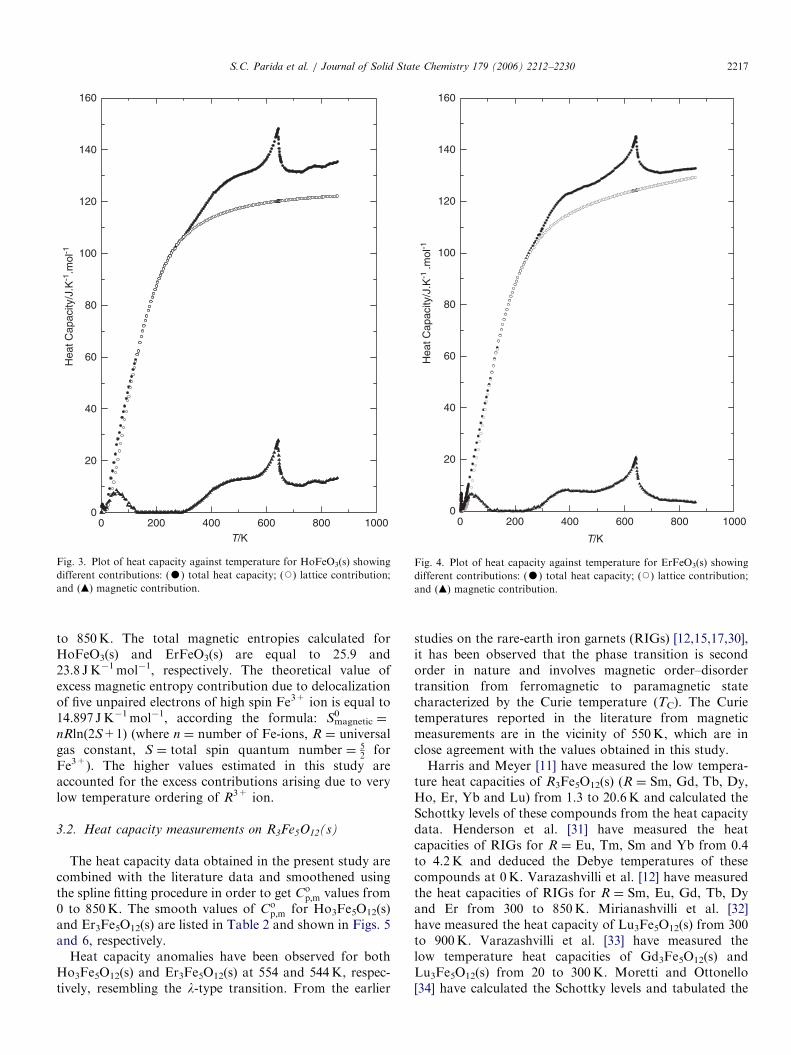
The heat capacity data for HoFeO3(s) and ErFeO3(s)obtained in the present study in the temperature rangefrom 130 to 860K are combined with the low temperatureliterature values [8–10] and smoothened using thespline fitting procedure. The smooth values of Co
p;m forHoFeO3(s) and ErFeO3(s) are given in Table 1 and shownin Figs. 3 and 4, respectively.Heat capacity anomalies have been observed for both
HoFeO3(s) and ErFeO3(s) at 644 and 642K, respectively,resembling the l-type transition. From the earlier studieson the orthoferrites [14,15,17,23], it has been observed thatthe phase transition is second order in nature and involvesmagnetic order–disorder transition from antiferromagnetic(AF) to paramagnetic state characterized by the Neeltemperature (TN). The Neel temperatures reported in theliterature [23] from high-temperature Mossbauer measure-ments are 647 and 645K for HoFeO3(s) and ErFeO3(s),
ARTICLE IN PRESS
Table 1
Smoothed values of Cp,mo of RFeO3(s) (R ¼ Ho and Er) at different temperatures
HoFeO3(s) ErFeO3(s)
T/K Cp,mo /JK�1mol�1 T/K Cp,m
o /JK�1mol�1 T/K Cp,mo /JK�1mol�1 T/K Cp,m
o /JK�1mol�1
0 0 425 124.881 0 0 425 124.357
5 2.636 450 127.248 5 1.926 450 125.695
10 1.770 475 129.020 10 1.407 475 126.363
15 1.770 500 130.261 15 3.407 500 127.621
20 3.246 525 131.165 20 5.481 525 129.312
25 7.008 550 132.094 25 7.704 550 131.120
30 9.221 575 133.585 30 10.519 575 133.415
35 13.279 600 136.442 35 13.235 600 135.871
40 16.082 625 141.743 40 15.950 625 139.818
45 19.287 630 143.251 45 18.340 630 141.019
50 22.607 635 144.888 50 21.210 631 141.386
55 26.189 636 145.246 55 23.756 632 141.701
60 28.402 637 145.612 60 26.500 633 141.967
65 30.865 638 145.933 65 29.102 634 142.268
70 33.566 639 146.314 70 31.630 635 142.597
75 36.789 640 146.706 75 34.211 636 142.940
80 38.896 641 147.103 80 36.770 637 143.307
85 41.111 642 147.508 85 39.289 638 143.707
90 44.023 643 147.921 90 41.870 639 144.013
95 46.231 644 144.940 95 44.189 640 144.508
100 48.465 645 144.091 100 46.700 641 144.983
110 52.526 646 142.351 110 51.510 642 145.154
120 57.446 647 140.596 120 56.327 643 144.500
130 60.996 648 139.263 130 61.362 644 142.937
140 65.648 649 138.175 140 65.967 645 141.280
150 70.137 650 137.457 150 70.324 646 139.974
170 77.975 651 136.828 170 78.187 647 138.995
190 84.648 652 136.336 190 84.746 648 138.253
210 90.423 653 135.997 210 90.568 649 137.558
230 95.334 654 135.672 230 95.495 650 137.089
250 99.199 655 135.237 250 99.966 655 135.366
270 102.475 675 132.247 270 103.845 675 132.879
290 105.360 700 131.635 290 107.270 700 131.733
298.15 106.428 725 131.539 298.15 109.306 725 131.094
300 106.696 750 132.731 300 109.512 750 131.365
325 110.382 775 133.802 325 114.765 775 131.689
350 114.178 800 133.421 350 118.715 800 132.115
375 118.054 825 134.253 375 121.652 825 132.467
400 121.991 850 135.028 400 123.179 850 132.642
S.C. Parida et al. / Journal of Solid State Chemistry 179 (2006) 2212–22302216
respectively, which are in close agreement with the valuesobtained in this study.
The lattice heat capacities of RFeO3(s) are calculated bythe approximation of Stølen et al. [24] according to whichthe lattice contribution can be obtained by adding thelattice contributions of the component oxides. The latticecontributions to the heat capacity of the component oxidesR2O3(s) and Fe2O3(s) are taken from the literature [25–28].This approximation has been tested for the estimation oflattice heat capacities of NdGaO3(s) LaAlO3(s) and isfound to be in good agreement with the experimentalvalues [29]. The lattice heat capacity of HoFeO3(s) andErFeO3(s) calculated in this way are shown in Figs. 3 and4, respectively. Earlier literature [8–10] on the lowtemperature heat capacity measurements on HoFeO3(s)and ErFeO3(s) have shown that the Schottky contributionis absent in these compounds. The magnetic contributions
to the heat capacities of RFeO3(s) are calculated by usingthe relation:
CmagneticðRFeO3Þ
¼ Cop;mRFeO3 � 1=2½ClatticeðFe2O3Þ þ ClatticeðR2O3Þ
þ CdilationalðFe2O3Þ þ CdilationalðLa2O3Þ�. ð1Þ
The dilational heat capacity of Fe2O3(s) has been takenfrom literature [28] whereas that for R2O3(s) is neglectedbecause of the non-availability of experimental data.However, this will cause a maximum error of 71%, whichis well within the uncertainty limit of our estimationmethod. The magnetic heat capacities for RFeO3(s)calculated in this way are shown in Figs. 3 and 4. Themagnetic entropies associated with order–disorder trans-formation are calculated by integrating the plot of(Cmagnetic/T) against T in the entire temperature from 0
ARTICLE IN PRESS
0 200 400 600 800 10000
20
40
60
80
100
120
140
160
Hea
t Cap
acity
/J.K
-1.m
ol-1
T/K
Fig. 3. Plot of heat capacity against temperature for HoFeO3(s) showing
different contributions: (K) total heat capacity; (J) lattice contribution;
and (m) magnetic contribution.
0 400 800 10000
20
40
60
80
100
120
140
160
Hea
t Cap
acity
/J.K
-1 .m
ol-1
T/K
600200
Fig. 4. Plot of heat capacity against temperature for ErFeO3(s) showing
different contributions: (K) total heat capacity; (J) lattice contribution;
and (m) magnetic contribution.
S.C. Parida et al. / Journal of Solid State Chemistry 179 (2006) 2212–2230 2217
to 850K. The total magnetic entropies calculated forHoFeO3(s) and ErFeO3(s) are equal to 25.9 and23.8 JK�1mol�1, respectively. The theoretical value ofexcess magnetic entropy contribution due to delocalizationof five unpaired electrons of high spin Fe3+ ion is equal to14.897 JK�1mol�1, according the formula: Smagnetic
0¼
nRln(2S+1) (where n ¼ number of Fe-ions, R ¼ universalgas constant, S ¼ total spin quantum number ¼ 5
2for
Fe3+). The higher values estimated in this study areaccounted for the excess contributions arising due to verylow temperature ordering of R3+ ion.
3.2. Heat capacity measurements on R3Fe5O12(s)
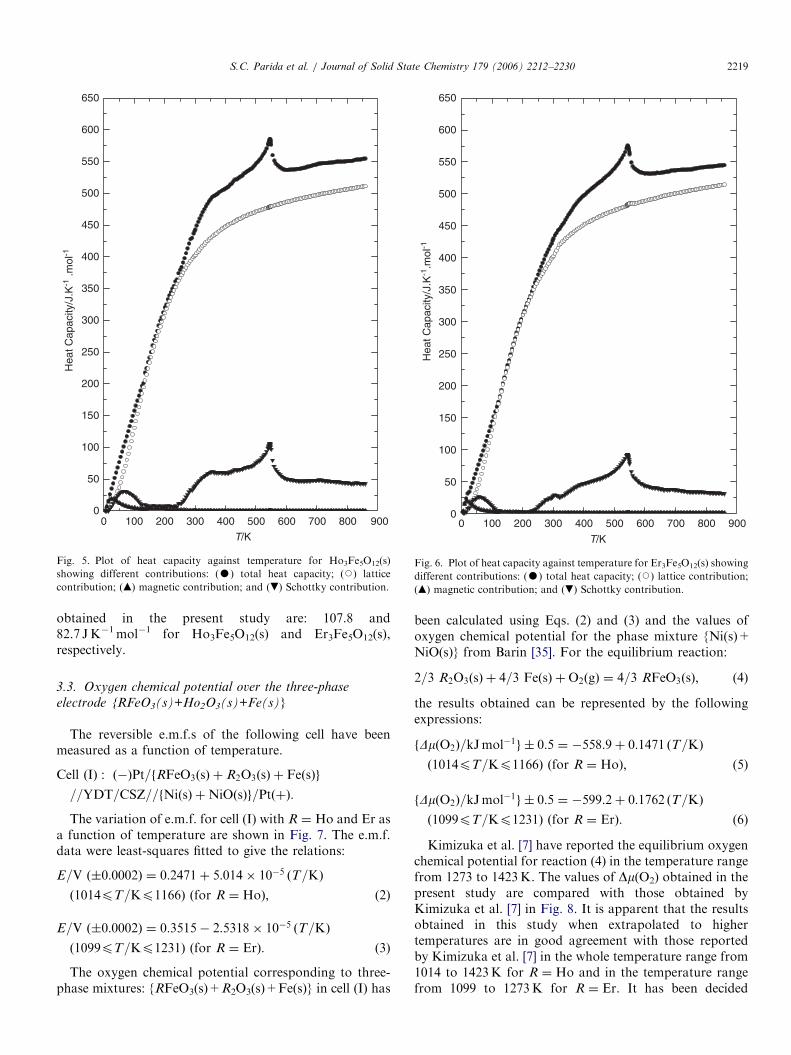
The heat capacity data obtained in the present study arecombined with the literature data and smoothened usingthe spline fitting procedure in order to get Co
p;m values from0 to 850K. The smooth values of Co
p;m for Ho3Fe5O12(s)and Er3Fe5O12(s) are listed in Table 2 and shown in Figs. 5and 6, respectively.
Heat capacity anomalies have been observed for bothHo3Fe5O12(s) and Er3Fe5O12(s) at 554 and 544K, respec-tively, resembling the l-type transition. From the earlier
studies on the rare-earth iron garnets (RIGs) [12,15,17,30],it has been observed that the phase transition is secondorder in nature and involves magnetic order–disordertransition from ferromagnetic to paramagnetic statecharacterized by the Curie temperature (TC). The Curietemperatures reported in the literature from magneticmeasurements are in the vicinity of 550K, which are inclose agreement with the values obtained in this study.Harris and Meyer [11] have measured the low tempera-
ture heat capacities of R3Fe5O12(s) (R ¼ Sm, Gd, Tb, Dy,Ho, Er, Yb and Lu) from 1.3 to 20.6K and calculated theSchottky levels of these compounds from the heat capacitydata. Henderson et al. [31] have measured the heatcapacities of RIGs for R ¼ Eu, Tm, Sm and Yb from 0.4to 4.2K and deduced the Debye temperatures of thesecompounds at 0K. Varazashvilli et al. [12] have measuredthe heat capacities of RIGs for R ¼ Sm, Eu, Gd, Tb, Dyand Er from 300 to 850K. Mirianashvilli et al. [32]have measured the heat capacity of Lu3Fe5O12(s) from 300to 900K. Varazashvilli et al. [33] have measured thelow temperature heat capacities of Gd3Fe5O12(s) andLu3Fe5O12(s) from 20 to 300K. Moretti and Ottonello[34] have calculated the Schottky levels and tabulated the

ARTICLE IN PRESS
Table 2
Smoothed values of Cp,mo for R3Fe5O12(s) (R ¼ Ho and Er) at different temperatures
Ho3Fe5O12(s) Er3Fe5O12(s)
T/K Cp,mo /JK�1mol�1 T/K Cp,m
o /JK�1mol�1 T/K Cp,mo /JK�1mol�1 T/K Cp,m
o /JK�1mol�1
0 0 425 518.3 0 0 425 508.2
5 0.7 450 526.9 5 3.0 450 517.9
10 7.0 475 535.8 10 14.8 475 528.1
15 15.7 500 546.7 15 22.8 500 539.9
20 26.2 525 562.2 20 30.8 525 556.8
25 35.0 530 566.0 25 33.4 530 560.8
30 43.4 535 570.9 30 40.2 535 565.5
35 51.8 540 576.6 35 47.2 540 571.0
40 60.2 541 578.2 40 54.2 541 572.1
45 68.5 542 579.5 45 61.3 542 573.3
50 76.8 543 581.3 50 68.5 543 574.4
55 85.1 544 583.0 55 75.7 544 575.8
60 93.4 545 584.5 60 83.1 545 574.2
65 101.6 546 585.9 65 90.5 546 573.1
70 109.7 547 585.4 70 97.9 547 571.1
75 117.6 548 583.5 75 105.4 548 568.3
80 125.6 549 580.5 80 113.0 549 565.1
85 133.7 550 576.9 85 120.6 550 562.1
90 141.7 555 560.4 90 128.2 555 549.4
95 149.8 560 551.7 95 135.8 560 543.4
100 157.9 565 547.4 100 143.5 565 540.2
110 173.7 570 544.9 110 158.8 570 538.5
120 189.2 575 542.7 120 174.2 575 536.6
130 201.4 600 537.0 130 192.8 600 531.7
140 224.7 625 537.9 140 212.4 625 532.1
150 241.3 650 539.5 150 231.9 650 532.7
170 275.5 675 542.5 170 265.5 675 534.6
190 304.6 700 545.6 190 296.5 700 537.1
210 333.3 725 547.8 210 323.0 725 537.7
230 354.2 750 548.7 230 347.2 750 538.4
250 379.7 775 550.1 250 373.7 775 540.5
270 405.8 800 550.9 270 397.6 800 542.3
290 430.1 825 552.6 290 418.2 825 543.2
298.15 440.8 850 554.2 298.15 427.0 850 544.8
300 443.2 300 430.1
325 470.6 325 448.4
350 490.6 350 467.5
375 499.8 375 484.6
400 507.6 400 497.7
S.C. Parida et al. / Journal of Solid State Chemistry 179 (2006) 2212–22302218
thermodynamic functions of all the RIGs based on theavailable literature data. Parida et al. [15,17] havemeasured the enthalpy increments of Sm3Fe5O12(s) andDy3Fe5O12(s) from 300 to 1000K and derived the heatcapacities. The lattice contributions to heat capacities forR3Fe5O12(s) (for R ¼ Ho and Er) are calculated by theprocedure similar to RFeO3(s).
Earlier measurements on the low temperature heatcapacity of these compounds show substantial Schottkycontributions. As explained by Moretti and Ottonello [34],RIGs reveal Schottky anomalies associated with magneticordering of paramagnetic Fe3+ ions which have unpairedelectrons. All possible quantum states (2S+1) and (2J+1)are energetically degenerate and as a first approximation,equally populated as long as the energy differences betweenthe several states are small compared to the thermal energy
kBT (kB being the Boltzmann constant). At sufficiently lowtemperatures, kBT attains the magnitude of the energygaps, so that the states with lower energies are selectivelypopulated, giving rise to heat capacity anomaly. For thecase of RFeO3(s), the magnetic ordering between the R3+
and Fe3+ ions is not significant to show Schottky anomaly.However, the ordering between R3+ at different crystal-lographic sites is very strong which results in l-typeanomaly in the heat capacity plots of RFeO3(s).The Schottky contribution to heat capacities for
R3Fe5O12(s) is calculated by taking the energy levels givenby Moretti and Ottonello [34]. The dilational contributionis found to be negligible and hence not included in thecalculation. The magnetic contribution to heat capacity isfound out by subtracting all other contribution from themeasured Co
p;m. The values of magnetic entropies (Somagnetic)
ARTICLE IN PRESS
0 400 500 600 700 800 9000
50
100
150
200
250
300
350
400
450
500
550
600
650
Hea
t Cap
acity
/J.K
-1 .m
ol-1
200 300100
T/K
Fig. 5. Plot of heat capacity against temperature for Ho3Fe5O12(s)
showing different contributions: (K) total heat capacity; (J) lattice
contribution; (m) magnetic contribution; and (.) Schottky contribution.
0 100 400 600 700 800 9000
50
100
150
200
250
300
350
400
450
500
550
600
650
Hea
t Cap
acity
/J.K
-1.m
ol-1
T/K
200 300 500
Fig. 6. Plot of heat capacity against temperature for Er3Fe5O12(s) showing
different contributions: (K) total heat capacity; (J) lattice contribution;
(m) magnetic contribution; and (.) Schottky contribution.
S.C. Parida et al. / Journal of Solid State Chemistry 179 (2006) 2212–2230 2219
obtained in the present study are: 107.8 and82.7 JK�1mol�1 for Ho3Fe5O12(s) and Er3Fe5O12(s),respectively.
3.3. Oxygen chemical potential over the three-phase
electrode {RFeO3(s)+Ho2O3(s)+Fe(s)}
The reversible e.m.f.s of the following cell have beenmeasured as a function of temperature.
Cell ðIÞ : ð�ÞPt=fRFeO3ðsÞ þ R2O3ðsÞ þ FeðsÞg
==YDT=CSZ==fNiðsÞ þNiOðsÞg=PtðþÞ:
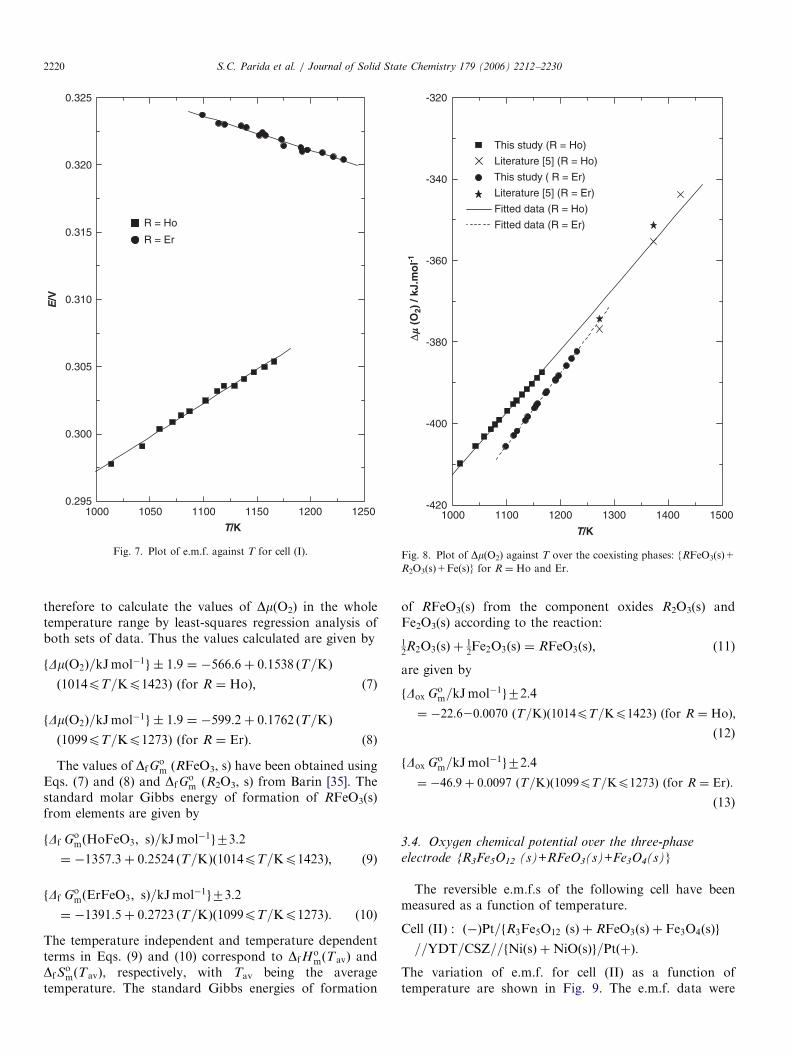
The variation of e.m.f. for cell (I) with R ¼ Ho and Er asa function of temperature are shown in Fig. 7. The e.m.f.data were least-squares fitted to give the relations:
E=V ð�0:0002Þ ¼ 0:2471þ 5:014� 10�5 ðT=KÞ
ð1014pT=Kp1166Þ ðfor R ¼ HoÞ; (2)
E=V ð�0:0002Þ ¼ 0:3515� 2:5318� 10�5 ðT=KÞ
ð1099pT=Kp1231Þ ðfor R ¼ ErÞ: (3)
The oxygen chemical potential corresponding to three-phase mixtures: {RFeO3(s)+R2O3(s)+Fe(s)} in cell (I) has
been calculated using Eqs. (2) and (3) and the values ofoxygen chemical potential for the phase mixture {Ni(s)+NiO(s)} from Barin [35]. For the equilibrium reaction:
2=3 R2O3ðsÞ þ 4=3 FeðsÞ þO2ðgÞ ¼ 4=3 RFeO3ðsÞ; (4)
the results obtained can be represented by the followingexpressions:
fDmðO2Þ=kJmol�1g � 0:5 ¼ �558:9þ 0:1471 ðT=KÞ
ð1014pT=Kp1166Þ ðfor R ¼ HoÞ; (5)
fDmðO2Þ=kJmol�1g � 0:5 ¼ �599:2þ 0:1762 ðT=KÞ
ð1099pT=Kp1231Þ ðfor R ¼ ErÞ: (6)
Kimizuka et al. [7] have reported the equilibrium oxygenchemical potential for reaction (4) in the temperature rangefrom 1273 to 1423K. The values of Dm(O2) obtained in thepresent study are compared with those obtained byKimizuka et al. [7] in Fig. 8. It is apparent that the resultsobtained in this study when extrapolated to highertemperatures are in good agreement with those reportedby Kimizuka et al. [7] in the whole temperature range from1014 to 1423K for R ¼ Ho and in the temperature rangefrom 1099 to 1273K for R ¼ Er. It has been decided
ARTICLE IN PRESS
1000 1050 1100 1150 1200 12500.295
0.300
0.305
0.310
0.315
0.320
0.325
R = Ho
R = Er
E/V
T/K
Fig. 7. Plot of e.m.f. against T for cell (I).
1000 1100 1200 1300 1400 1500-420
This study (R = Ho)
Literature [5] (R = Ho)
This study ( R = Er)
Literature [5] (R = Er)
Fitted data (R = Ho)
Fitted data (R = Er)
T/K
-400
-380
-360
-340
-320
∆� � (O
2) /
kJ.m
ol-1
Fig. 8. Plot of Dm(O2) against T over the coexisting phases: {RFeO3(s)+
R2O3(s)+Fe(s)} for R ¼ Ho and Er.
S.C. Parida et al. / Journal of Solid State Chemistry 179 (2006) 2212–22302220
therefore to calculate the values of Dm(O2) in the wholetemperature range by least-squares regression analysis ofboth sets of data. Thus the values calculated are given by
fDmðO2Þ=kJmol�1g � 1:9 ¼ �566:6þ 0:1538 ðT=KÞ
ð1014pT=Kp1423Þ ðfor R ¼ HoÞ; (7)
fDmðO2Þ=kJmol�1g � 1:9 ¼ �599:2þ 0:1762 ðT=KÞ
ð1099pT=Kp1273Þ ðfor R ¼ ErÞ: (8)
The values of DfGom (RFeO3, s) have been obtained using
Eqs. (7) and (8) and DfGom (R2O3, s) from Barin [35]. The
standard molar Gibbs energy of formation of RFeO3(s)from elements are given by
fDf GomðHoFeO3; sÞ=kJmol�1g73:2
¼ �1357:3þ 0:2524 ðT=KÞð1014pT=Kp1423Þ; (9)
fDf GomðErFeO3; sÞ=kJmol�1g73:2
¼ �1391:5þ 0:2723 ðT=KÞð1099pT=Kp1273Þ: (10)
The temperature independent and temperature dependentterms in Eqs. (9) and (10) correspond to DfH
omðTavÞ and
DfSomðTavÞ, respectively, with Tav being the average
temperature. The standard Gibbs energies of formation
of RFeO3(s) from the component oxides R2O3(s) andFe2O3(s) according to the reaction:
12R2O3ðsÞ þ
12Fe2O3ðsÞ ¼ RFeO3ðsÞ; (11)
are given by
fDox Gom=kJmol�1g72:4
¼ �22:620:0070 ðT=KÞð1014pT=Kp1423Þ ðfor R ¼ HoÞ;
(12)
fDox Gom=kJmol�1g72:4
¼ �46:9þ 0:0097 ðT=KÞð1099pT=Kp1273Þ ðfor R ¼ ErÞ:
(13)
3.4. Oxygen chemical potential over the three-phase
electrode {R3Fe5O12 (s)+RFeO3(s)+Fe3O4(s)}
The reversible e.m.f.s of the following cell have beenmeasured as a function of temperature.
Cell ðIIÞ : ð�ÞPt=fR3Fe5O12 ðsÞ þ RFeO3ðsÞ þ Fe3O4ðsÞg
==YDT=CSZ==fNiðsÞ þNiOðsÞg=PtðþÞ:
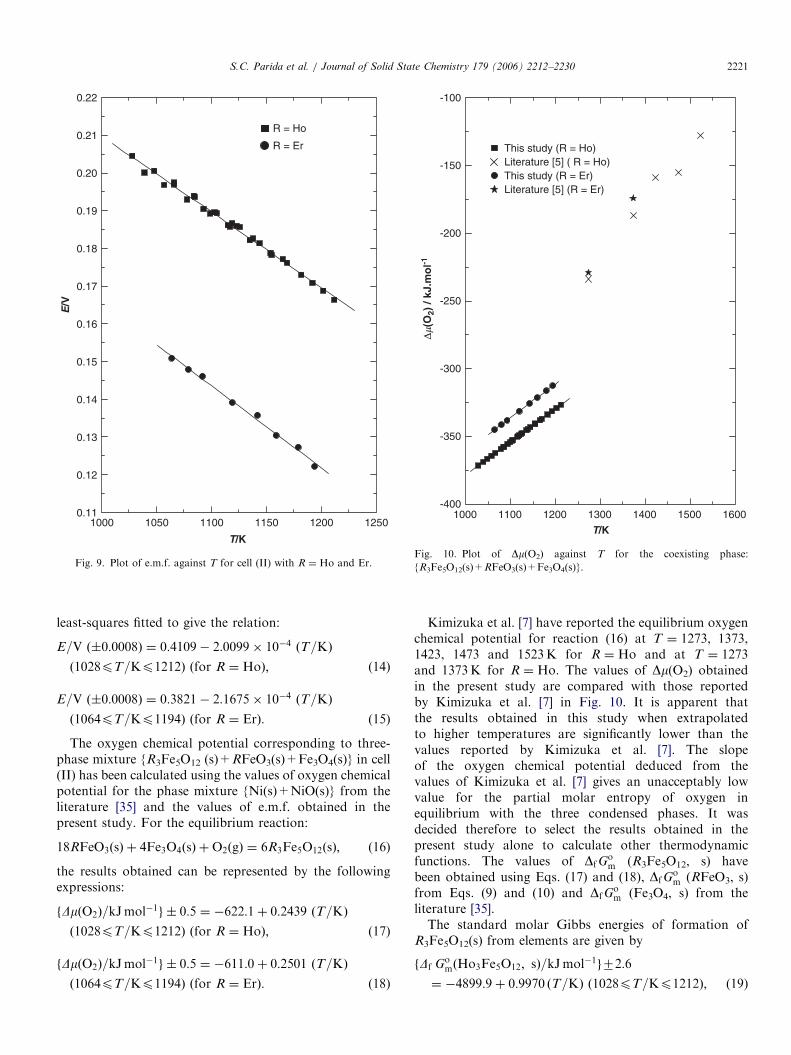
The variation of e.m.f. for cell (II) as a function oftemperature are shown in Fig. 9. The e.m.f. data were
ARTICLE IN PRESS
1000 1050 1100 1150 1200 12500.11
0.12
0.13
0.14
0.15
0.16
0.17
0.18
0.19
0.20
0.21
0.22
E/V
R = Ho
R = Er
T/K
Fig. 9. Plot of e.m.f. against T for cell (II) with R ¼ Ho and Er.
1000 1100 1200 1300 1400 1500 1600-400
-350
-300
-250
-200
-150
-100
This study (R = Ho)Literature [5] ( R = Ho)This study (R = Er)Literature [5] (R = Er)
T/K
∆�(O
2) /
kJ.m
ol-1
Fig. 10. Plot of Dm(O2) against T for the coexisting phase:
{R3Fe5O12(s)+RFeO3(s)+Fe3O4(s)}.
S.C. Parida et al. / Journal of Solid State Chemistry 179 (2006) 2212–2230 2221
least-squares fitted to give the relation:
E=V ð�0:0008Þ ¼ 0:4109� 2:0099� 10�4 ðT=KÞ
ð1028pT=Kp1212Þ ðfor R ¼ HoÞ; (14)
E=V ð�0:0008Þ ¼ 0:3821� 2:1675� 10�4 ðT=KÞ
ð1064pT=Kp1194Þ ðfor R ¼ ErÞ: (15)
The oxygen chemical potential corresponding to three-phase mixture {R3Fe5O12 (s)+RFeO3(s)+Fe3O4(s)} in cell(II) has been calculated using the values of oxygen chemicalpotential for the phase mixture {Ni(s)+NiO(s)} from theliterature [35] and the values of e.m.f. obtained in thepresent study. For the equilibrium reaction:
18RFeO3ðsÞ þ 4Fe3O4ðsÞ þO2ðgÞ ¼ 6R3Fe5O12ðsÞ; (16)
the results obtained can be represented by the followingexpressions:
fDmðO2Þ=kJmol�1g � 0:5 ¼ �622:1þ 0:2439 ðT=KÞ
ð1028pT=Kp1212Þ ðfor R ¼ HoÞ; (17)
fDmðO2Þ=kJmol�1g � 0:5 ¼ �611:0þ 0:2501 ðT=KÞ
ð1064pT=Kp1194Þ ðfor R ¼ ErÞ: (18)
Kimizuka et al. [7] have reported the equilibrium oxygenchemical potential for reaction (16) at T ¼ 1273, 1373,1423, 1473 and 1523K for R ¼ Ho and at T ¼ 1273and 1373K for R ¼ Ho. The values of Dm(O2) obtainedin the present study are compared with those reportedby Kimizuka et al. [7] in Fig. 10. It is apparent thatthe results obtained in this study when extrapolatedto higher temperatures are significantly lower than thevalues reported by Kimizuka et al. [7]. The slopeof the oxygen chemical potential deduced from thevalues of Kimizuka et al. [7] gives an unacceptably lowvalue for the partial molar entropy of oxygen inequilibrium with the three condensed phases. It wasdecided therefore to select the results obtained in thepresent study alone to calculate other thermodynamicfunctions. The values of DfG
om (R3Fe5O12, s) have
been obtained using Eqs. (17) and (18), DfGom (RFeO3, s)
from Eqs. (9) and (10) and DfGom (Fe3O4, s) from the
literature [35].The standard molar Gibbs energies of formation of
R3Fe5O12(s) from elements are given by
fDf GomðHo3Fe5O12; sÞ=kJmol�1g72:6
¼ �4899:9þ 0:9970 ðT=KÞ ð1028pT=Kp1212Þ; (19)
ARTICLE IN PRESSS.C. Parida et al. / Journal of Solid State Chemistry 179 (2006) 2212–22302222
fDf GomðEr3Fe5O12; sÞ=kJmol�1g72:6
¼ �5000:6þ 1:0579 ðT=KÞ ð1064pT=Kp1194Þ: (20)
Standard molar enthalpy DfHomðTavÞ and entropy of
formation DfSomðTavÞ at an average temperature (Tav) can
be obtained from the temperature independent andtemperature dependent terms in Eqs. (19) and (20). Thestandard molar Gibbs energy of formation of R3Fe5O12(s)from its component oxides R2O3(s) and Fe2O3(s) accordingto the reaction:
32R2O3ðsÞ þ
52Fe2O3ðsÞ ¼ R3Fe5O12ðsÞ; (21)
are given by
fDox Gom=kJmol�1g7 3:5
¼ �90:920:0261 ðT=KÞð1028pT=Kp1212Þ
ðfor R ¼ HoÞ; (22)
fDox Gom=kJmol�1g7 3:5
¼ �162:420:0252 ðT=KÞð1064pT=Kp1194Þ
ðfor R ¼ ErÞ: (23)
3.5. Oxygen chemical potential over the three-phase
electrode {RFe2O4(s)+R2O3(s)+Fe(s)}
The reversible e.m.f.s of the following cell have beenmeasured as a function of temperature.
Cell ðIIIÞ : ð�ÞPt=fRFe2O4ðsÞ þ R2O3ðsÞ þ FeðsÞg
==CSZ==fair; pðO2Þ ¼ 21:12 kPag=PtðþÞ:
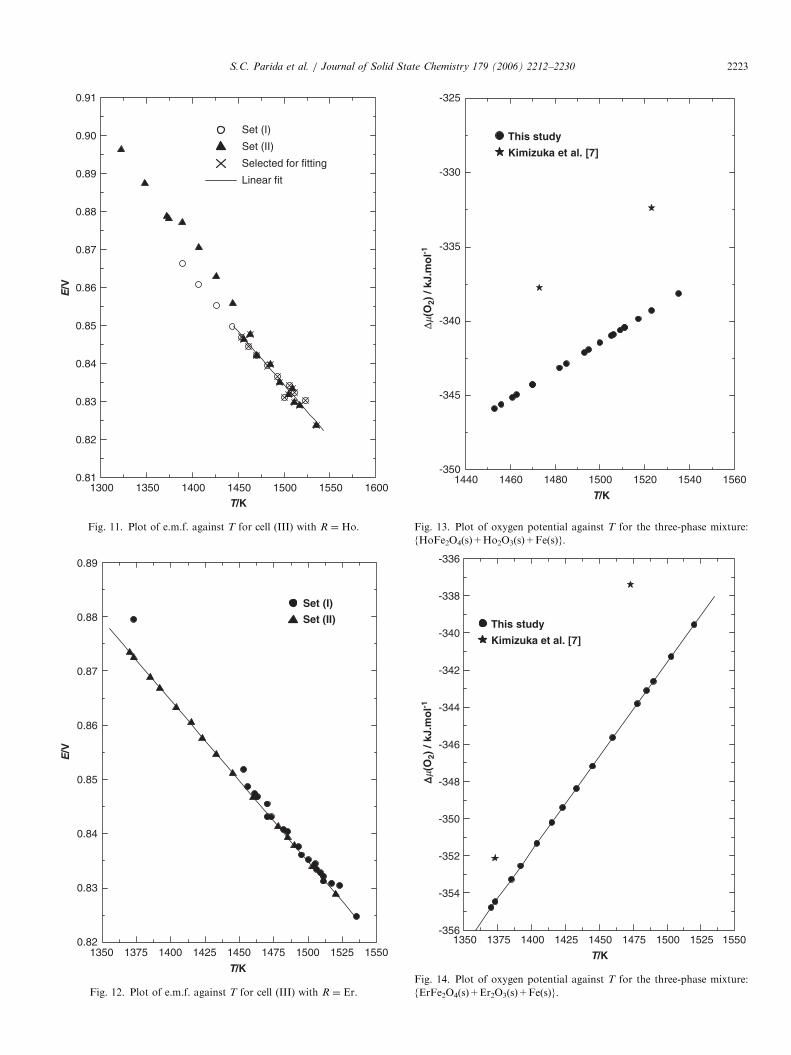
For R ¼ Ho, e.m.f. measurements were carried out in twodifferent temperature ranges: 1389–1523K (set I) and1322–1535K (set II) using the high temperature cellassembly. The values of e.m.f. for cell (III) as a functionof temperature are shown in Fig. 11. It has been observedfrom both sets of data that the e.m.f. below 1443K was notstable. This could be due to change in the coexisting three-phase field. Hence, data above 1443K are considered forfurther calculations for R ¼ Ho. Similarly, for R ¼ Er, twodifferent sets of measurements in the temperature ranges:1373–1535K (set I) and 1370–1520K (set II) were carriedout. The variation of e.m.f. with temperature is shown inFig. 12. It has been observed that the e.m.f. data obtainedin the two sets of measurements are in good agreement witheach other which indicates that the three coexisting phasesare in equilibrium in these temperature ranges. The e.m.f.data were least-squares fitted to give the relations;
E=V ð�0:0013Þ ¼ 1:2517� 2:7820� 10�4ðT=KÞ
ð1443pT=Kp1535Þ ðfor R ¼ HoÞ; (24)
E=V ð�0:0013Þ ¼ 1:2794� 2:9640� 10�4ðT=KÞ
ð1370pT=Kp1535Þ ðfor R ¼ ErÞ: (25)
The oxygen chemical potential corresponding to three-phase mixtures {RFe2O4(s)+R2O3(s)+Fe(s)} in cell (III)have been calculated using Eqs. (24) and (25) and the
values of oxygen partial pressure of air(p(O2) ¼ 21.12 kPa). For the equilibrium reaction:
25R2O3ðsÞ þ
85FeðsÞ þO2ðgÞ ¼
45RFe2O4ðsÞ; (26)
the results obtained can be represented by the followingexpressions:
fDmðO2Þ=kJmol�1g � 0:8 ¼ �483:1þ 0:0941 ðT=KÞ
ð1443pT=Kp1535Þ ðfor R ¼ HoÞ; (27)
fDmðO2Þ=kJmol�1g � 0:8 ¼ �493:8þ 0:1014 ðT=KÞ
ð1370pT=Kp1535Þ ðfor R ¼ ErÞ: (28)
The oxygen chemical potential for the three-phasemixture {RFe2O4(s)+R2O3(s)+Fe(s)} have been reportedby Kimizuka et al. [7] at two different temperatures: (1473and 1523K) for R ¼ Ho and (1373 and 1473K) forR ¼ Er. The values obtained in this study are comparedwith those of Kimizuka et al. [7] in Figs. 13 and 14.It has been observed that the oxygen potential obtained
in the present study is more negative by �6 kJmol�1 thanthe values reported by Kimizuka et al. [7] for R ¼ Ho andby �8 kJmol�1. The values of DfG
om (RFe2O4, s) have been
obtained using Eqs. (27) and (28) and DfGom (R2O3, s) from
Barin [35]. The standard molar Gibbs energies of forma-tion of RFe2O4(s) from elements are given by
fDf GomðHoFe2O4; sÞ=kJmol�1g73:2
¼ �1536:3þ 0:2550 ðT=KÞ ð1443pT=Kp1535Þ; (29)
fDf GomðErFe2O4; sÞ=kJmol�1g73:2
¼ �1559:4þ 0:2670 ðT=KÞ ð1370pT=Kp1535Þ: (30)
The temperature independent and temperature dependentterms in Eqs. (29) and (30) correspond to DfH
omðTavÞ and
DfSomðTavÞ, respectively, with Tav being the average
temperature.
3.6. Isothermal oxygen potential diagram
In oxide systems, the oxygen partial pressure is oftenestablished by the ratio of CO to CO2 or H2 to H2O in thegas phase. Therefore, it is useful to represent phaserelations as a function of partial pressure of oxygen andsuch a diagram is called oxygen potential diagram. Theoxygen potential diagram is a plot of oxygen potential as afunction of a normalized composition parameter. Thecomposition variable is the cationic fraction, ZA/(ZA+ZB),where ZA and ZB represent moles of components ‘A’ and ‘B’in the system A–B–O. Oxygen is not included in thecomposition parameter. Intermetallic phases and binaryoxides are represented by vertical lines. Nonstoichiometryin intermetallics and cation nonstoichiometry in ternaryoxides can be displayed on the diagram. However, oxygennonstoichiometry cannot be displayed since oxygen is notincluded in the normalized composition parameter. Thediagram provides useful information on the oxygenpotential range for the stability of the various phases. All
ARTICLE IN PRESS
1300 1450 1500 1550 16000.81
0.82
0.83
0.84
0.85
0.86
0.87
0.88
0.89
0.90
0.91
E/V
Set (I)
Set (II)
Selected for fitting
Linear fit
T/K14001350
Fig. 11. Plot of e.m.f. against T for cell (III) with R ¼ Ho.
1350 1375 1400 1425 1450 1475 1500 1525 15500.82
0.83
0.84
0.85
0.86
0.87
0.88
0.89
E/V
T/K
Set (I)
Set (II)
Fig. 12. Plot of e.m.f. against T for cell (III) with R ¼ Er.
1440 1460 1480 1500 1520 1540 1560-350
-345
-340
-335
-330
This study
Kimizuka et al. [7]
-325
∆�(O
2) /
kJ.m
ol-1
T/K
Fig. 13. Plot of oxygen potential against T for the three-phase mixture:
{HoFe2O4(s)+Ho2O3(s)+Fe(s)}.
1350 1375 1400 1425 1450 1475 1500 1525 1550-356
-354
-352
-350
-348
-346
-344
-342
-340
-338
-336
This study
Kimizuka et al. [7]
∆ ∆�(
O2)
/ kJ
.mo
l-1
T/K
Fig. 14. Plot of oxygen potential against T for the three-phase mixture:
{ErFe2O4(s)+Er2O3(s)+Fe(s)}.
S.C. Parida et al. / Journal of Solid State Chemistry 179 (2006) 2212–2230 2223
ARTICLE IN PRESSS.C. Parida et al. / Journal of Solid State Chemistry 179 (2006) 2212–22302224
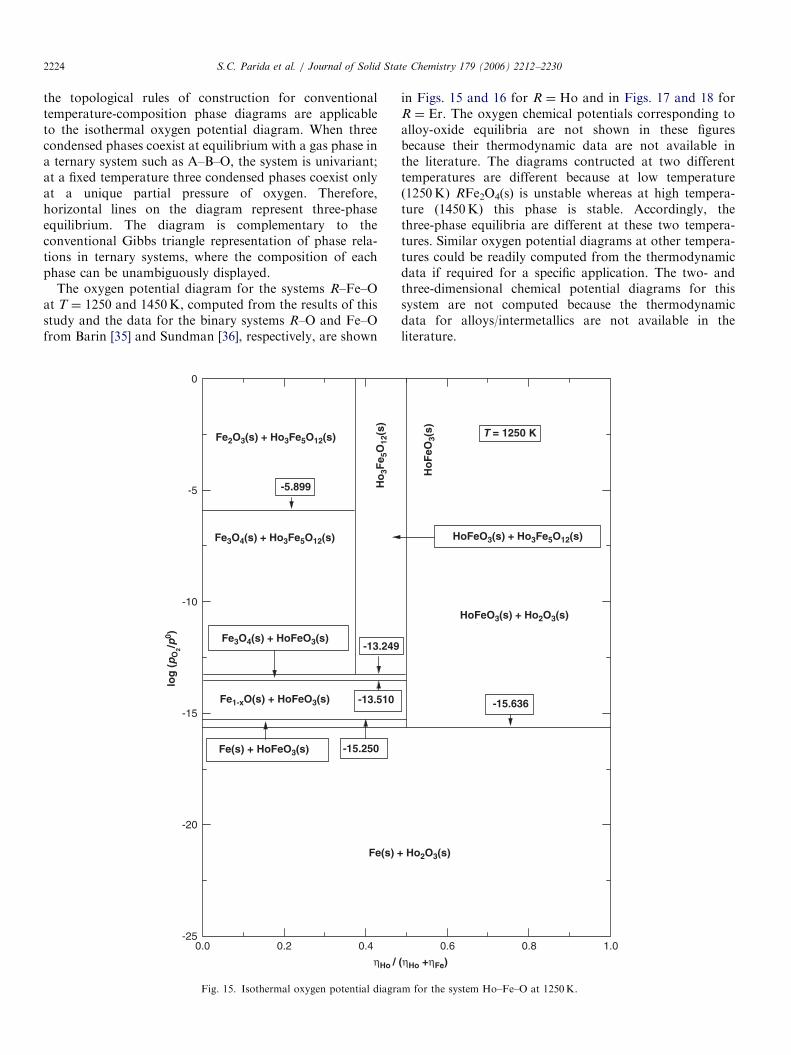
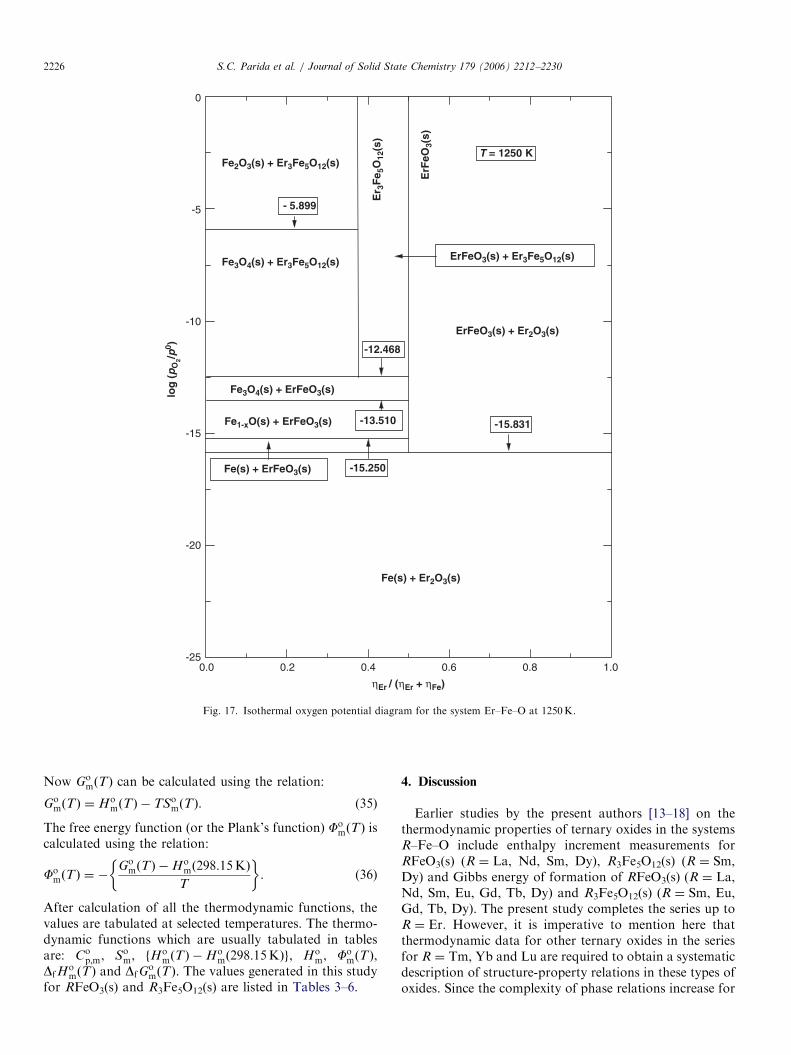
the topological rules of construction for conventionaltemperature-composition phase diagrams are applicableto the isothermal oxygen potential diagram. When threecondensed phases coexist at equilibrium with a gas phase ina ternary system such as A–B–O, the system is univariant;at a fixed temperature three condensed phases coexist onlyat a unique partial pressure of oxygen. Therefore,horizontal lines on the diagram represent three-phaseequilibrium. The diagram is complementary to theconventional Gibbs triangle representation of phase rela-tions in ternary systems, where the composition of eachphase can be unambiguously displayed.
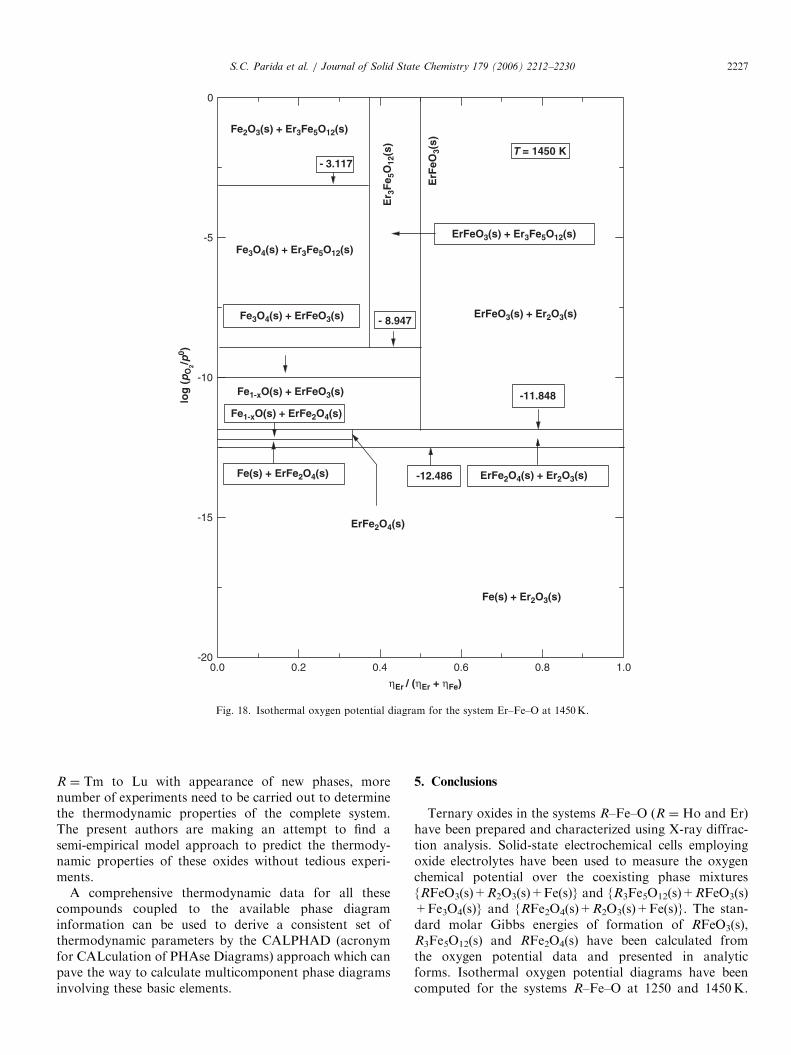
The oxygen potential diagram for the systems R–Fe–Oat T ¼ 1250 and 1450K, computed from the results of thisstudy and the data for the binary systems R–O and Fe–Ofrom Barin [35] and Sundman [36], respectively, are shown
-25
-20
-15
-10
-5
0
Fe(s) +
-5.899
Fe2O3(s) + Ho3Fe5O12(s)
log
(p
O2/p
0 )
0.0 0.2 0.4
ηHo /
Ho
3Fe 5
O12
(s)
Fe3O4(s) + Ho3Fe5O12(s)
Fe3O4(s) + HoFeO3(s)-13.249
-13.510Fe1-xO(s) + HoFeO3(s)
Fe(s) + HoFeO3(s) -15.250
Fig. 15. Isothermal oxygen potential diagra
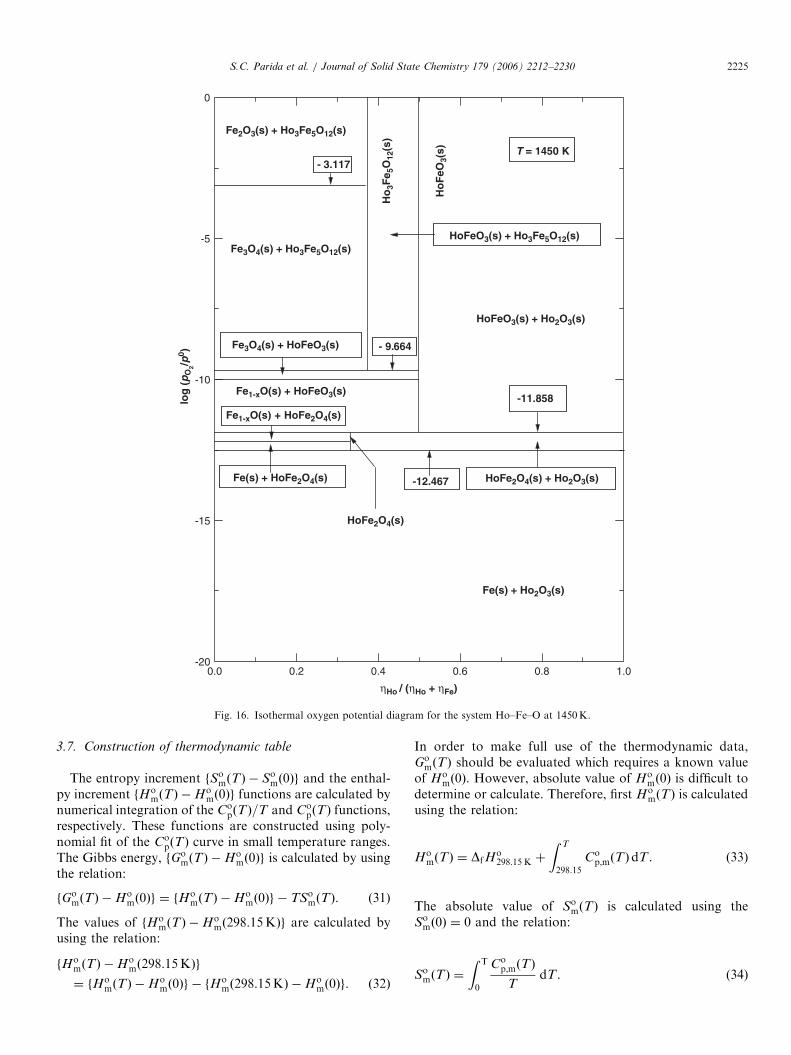
in Figs. 15 and 16 for R ¼ Ho and in Figs. 17 and 18 forR ¼ Er. The oxygen chemical potentials corresponding toalloy-oxide equilibria are not shown in these figuresbecause their thermodynamic data are not available inthe literature. The diagrams contructed at two differenttemperatures are different because at low temperature(1250K) RFe2O4(s) is unstable whereas at high tempera-ture (1450K) this phase is stable. Accordingly, thethree-phase equilibria are different at these two tempera-tures. Similar oxygen potential diagrams at other tempera-tures could be readily computed from the thermodynamicdata if required for a specific application. The two- andthree-dimensional chemical potential diagrams for thissystem are not computed because the thermodynamicdata for alloys/intermetallics are not available in theliterature.
0.8
Ho2O3(s)
-15.636
(ηHo +ηFe)
1.00.6
HoFeO3(s) + Ho2O3(s)
T = 1250 K
HoFeO3(s) + Ho3Fe5O12(s)
Ho
FeO
3(s)
m for the system Ho–Fe–O at 1250K.
ARTICLE IN PRESS
0.0 0.8-20
-15
-10
-5
0
- 9.664
- 3.117
log
(p
O2/p
0 )
Fe2O3(s) + Ho3Fe5O12(s)
Fe3O4(s) + Ho3Fe5O12(s)
Fe3O4(s) + HoFeO3(s)
Fe1-xO(s) + HoFeO3(s)
Fe1-xO(s) + HoFe2O4(s)
Fe(s) + HoFe2O4(s)
HoFe2O4(s)
Fe(s) + Ho2O3(s)
HoFe2O4(s) + Ho2O3(s)-12.467
-11.858
HoFeO3(s) + Ho2O3(s)
HoFeO3(s) + Ho3Fe5O12(s)
T = 1450 K
Ho
FeO
3(s)
Ho
3Fe 5
O12
(s)
0.2
ηHo / (ηHo + ηFe)
0.4 0.6 1.0
Fig. 16. Isothermal oxygen potential diagram for the system Ho–Fe–O at 1450K.
S.C. Parida et al. / Journal of Solid State Chemistry 179 (2006) 2212–2230 2225
3.7. Construction of thermodynamic table
The entropy increment fSomðTÞ � So
mð0Þg and the enthal-py increment fHo
mðTÞ �Homð0Þg functions are calculated by
numerical integration of the CopðTÞ=T and Co
pðTÞ functions,respectively. These functions are constructed using poly-nomial fit of the Co
pðTÞ curve in small temperature ranges.The Gibbs energy, fGo
mðTÞ �Homð0Þg is calculated by using
the relation:
fGomðTÞ �Ho
mð0Þg ¼ fHomðTÞ �Ho
mð0Þg � TSomðTÞ. (31)
The values of fHomðTÞ �Ho
mð298:15KÞg are calculated byusing the relation:
fHomðTÞ �Ho
mð298:15KÞg
¼ fHomðTÞ �Ho
mð0Þg � fHomð298:15KÞ �Ho
mð0Þg. ð32Þ
In order to make full use of the thermodynamic data,Go
mðTÞ should be evaluated which requires a known valueof Ho
mð0Þ. However, absolute value of Homð0Þ is difficult to
determine or calculate. Therefore, first HomðTÞ is calculated
using the relation:
HomðTÞ ¼ DfH
o298:15 K þ
Z T
298:15Co
p;mðTÞdT . (33)
The absolute value of SomðTÞ is calculated using the
Somð0Þ ¼ 0 and the relation:
SomðTÞ ¼
Z T
0
Cop;mðTÞ
TdT . (34)
ARTICLE IN PRESS
0.4
-5
0
-15.831
-15.250
- 5.899
ηEr / (ηEr + ηFe)
Fe(s) + Er2O3(s)
log
(p
O2/p
0 )
-10
-15
-20
-250.0 0.2 0.6 0.8 1.0
Fe(s) + ErFeO3(s)
Fe1-xO(s) + ErFeO3(s)
Fe3O4(s) + ErFeO3(s)
-13.510
-12.468
Fe3O4(s) + Er3Fe5O12(s)
Fe2O3(s) + Er3Fe5O12(s)
Er 3
Fe 5
O12
(s)
ErF
eO3(
s)
T = 1250 K
ErFeO3(s) + Er3Fe5O12(s)
ErFeO3(s) + Er2O3(s)
Fig. 17. Isothermal oxygen potential diagram for the system Er–Fe–O at 1250K.
S.C. Parida et al. / Journal of Solid State Chemistry 179 (2006) 2212–22302226
Now GomðTÞ can be calculated using the relation:
GomðTÞ ¼ Ho
mðTÞ � TSomðTÞ. (35)
The free energy function (or the Plank’s function) FomðTÞ is
calculated using the relation:
FomðTÞ ¼ �
GomðTÞ �Ho
mð298:15KÞ
T
� �. (36)
After calculation of all the thermodynamic functions, thevalues are tabulated at selected temperatures. The thermo-dynamic functions which are usually tabulated in tablesare: Co
p;m, Som, fH
omðTÞ �Ho
mð298:15KÞg, Hom, Fo
mðTÞ,DfH
omðTÞ and DfG
omðTÞ. The values generated in this study
for RFeO3(s) and R3Fe5O12(s) are listed in Tables 3–6.
4. Discussion
Earlier studies by the present authors [13–18] on thethermodynamic properties of ternary oxides in the systemsR–Fe–O include enthalpy increment measurements forRFeO3(s) (R ¼ La, Nd, Sm, Dy), R3Fe5O12(s) (R ¼ Sm,Dy) and Gibbs energy of formation of RFeO3(s) (R ¼ La,Nd, Sm, Eu, Gd, Tb, Dy) and R3Fe5O12(s) (R ¼ Sm, Eu,Gd, Tb, Dy). The present study completes the series up toR ¼ Er. However, it is imperative to mention here thatthermodynamic data for other ternary oxides in the seriesfor R ¼ Tm, Yb and Lu are required to obtain a systematicdescription of structure-property relations in these types ofoxides. Since the complexity of phase relations increase for
ARTICLE IN PRESS
0.0
-5
0
T = 1450 K- 3.117
log
(p
O2/p
0 )
-10
-15
-200.2 0.4
ηEr / (ηEr + ηFe)
0.6 0.8 1.0
Fe(s) + Er2O3(s)
Fe(s) + ErFe2O4(s)
ErFe2O4(s)
-12.486 ErFe2O4(s) + Er2O3(s)
-11.848
ErFeO3(s) + Er2O3(s)- 8.947Fe3O4(s) + ErFeO3(s)
Fe1-xO(s) + ErFeO3(s)
Fe1-xO(s) + ErFe2O4(s)
Fe3O4(s) + Er3Fe5O12(s)
Er 3
Fe 5
O12
(s)
ErF
eO3(
s)
Fe2O3(s) + Er3Fe5O12(s)
ErFeO3(s) + Er3Fe5O12(s)
Fig. 18. Isothermal oxygen potential diagram for the system Er–Fe–O at 1450K.
S.C. Parida et al. / Journal of Solid State Chemistry 179 (2006) 2212–2230 2227
R ¼ Tm to Lu with appearance of new phases, morenumber of experiments need to be carried out to determinethe thermodynamic properties of the complete system.The present authors are making an attempt to find asemi-empirical model approach to predict the thermody-namic properties of these oxides without tedious experi-ments.
A comprehensive thermodynamic data for all thesecompounds coupled to the available phase diagraminformation can be used to derive a consistent set ofthermodynamic parameters by the CALPHAD (acronymfor CALculation of PHAse Diagrams) approach which canpave the way to calculate multicomponent phase diagramsinvolving these basic elements.
5. Conclusions
Ternary oxides in the systems R–Fe–O (R ¼ Ho and Er)have been prepared and characterized using X-ray diffrac-tion analysis. Solid-state electrochemical cells employingoxide electrolytes have been used to measure the oxygenchemical potential over the coexisting phase mixtures{RFeO3(s)+R2O3(s)+Fe(s)} and {R3Fe5O12(s)+RFeO3(s)+Fe3O4(s)} and {RFe2O4(s)+R2O3(s)+Fe(s)}. The stan-dard molar Gibbs energies of formation of RFeO3(s),R3Fe5O12(s) and RFe2O4(s) have been calculated fromthe oxygen potential data and presented in analyticforms. Isothermal oxygen potential diagrams have beencomputed for the systems R–Fe–O at 1250 and 1450K.

ARTICLE IN PRESS
Table 3
Thermodynamic data for HoFeO3(s)
T/K STo /
JK�1mol�1Cp,mo /
JK�1mol�1HT
o�H0
o/
Jmol�1HT
o�H298.15
o /Jmol�1 HTo/
Jmol�1GTo/Jmol�1 �(GT
o�H298.15
o )/T/
JK�1mol�1DfHm
o /
kJmol�1DfGm
o /
kJmol�1
0 0 0 0
25 6.789 6.520 69.4050
50 16.20 22.77 432.690
75 28.08 36.51 1176.45
100 40.27 48.44 2242.51
150 63.96 70.04 5200.44
200 86.68 87.59 9169.31
250 107.6 99.22 13861.2
298.15 125.7 109.0 18822.1 0 �1364200 �1401677 125.7 �1364.2 �1279.5
300 126.3 109.3 19024.5 202.4 �1363998 �1401910 125.7 �1364.1 �1278.9
325 135.3 112.6 21808.2 2986.1 �1361223 �1405182 126.1 �1363.8 �1271.8
350 143.7 115.6 24676.0 5853.9 �1358369 �1408670 126.9 �1363.4 �1264.8
400 159.5 121.1 30628.6 11806.5 �1352449 �1416256 130.0 �1362.4 �1250.8
450 174.1 126.5 36845.9 18023.8 �1346262 �1424601 134.0 �1361.3 �1236.9
500 187.7 132.5 43344.7 24522.6 �1339792 �1433649 138.7 �1359.9 �1223.1
550 200.7 140.1 50195.4 31373.3 �1332987 �1443362 143.6 �1358.4 �1209.5
600 213.3 150.8 57521.8 38699.7 �1325734 �1453712 148.8 �1356.5 �1196.1
644 224.4 165.7 64502.1 45680.0 �1318796 �1463341 153.5 �1354.4 �1184.4
644 224.4 165.7 64502.1 45680.0 �1318796 �1463341 153.5 �1354.4 �1184.4
650 225.7 137.3 65315.1 46493.0 �1317968 �1464692 154.2 �1354.2 �1182.7
700 235.6 130.3 71977.7 53155.6 �1311309 �1476230 159.7 �1353.2 �1169.6
750 244.5 127.5 78468.3 59646.2 �1304871 �1488236 164.9 �1352.5 �1156.6
800 252.7 126.1 84827.8 66005.7 �1298534 �1500667 170.2 �1352.0 �1143.5
850 260.3 125.3 91097.2 72275.1 �1292250 �1513493 175.3 �1351.8 �1130.5
900 267.4 124.9 97317.5 78495.4 �1285996 �1526688 180.2 �1351.7 �1117.5
950 274.2 124.7 103529 84707.6 �1279758 �1540230 185.0 �1351.9 �1104.4
1000 280.6 124.5 109775 90952.6 �1273528 �1554100 189.6 �1352.5 �1091.4
Table 4
Thermodynamic data for ErFeO3(s)
T/K STo/
JK�1mol�1Cp,mo /
JK�1mol�1HT
o�H0
o/
Jmol�1HT
o�H298.15
o /
Jmol�1HT
o/Jmol�1 GTo/Jmol�1 �(GT
o�H298.15
o )/T/
JK�1mol�1DfHm
o /
kJmol�1DfGm
o /
kJmol�1
0 0 0 0
25 9.262 7.757 85.7410
50 18.78 21.21 448.534
75 29.85 34.19 1142.01
100 41.42 46.73 2154.60
150 64.91 70.37 5091.89
200 87.73 87.95 9079.50
250 108.7 100.0 13795.1
298.15 127.2 109.8 18839.5 0 �1400500 �1438424 127.2 �1400.5 �1316.8
300 127.9 110.1 19042.4 202.9 �1400296 �1438660 127.2 �1400.4 �1316.2
325 136.8 113.6 21837.6 2998.1 �1397499 �1441970 127.6 �1400.1 �1309.2
350 145.4 116.8 24720.7 5881.2 �1397618 �1445499 128.6 �1399.7 �1302.3
400 161.4 122.8 30715.7 11876.2 �1388626 �1453173 131.7 �1398.7 �1288.4
450 176.2 128.9 36993.4 18153.9 �1382334 �1461616 135.8 �1397.5 �1274.7
500 190.1 135.8 43578.9 24739.4 �1375722 �1470776 140.6 �1396.0 �1261.1
550 203.4 144.5 50557.1 31717.6 �1368726 �1480616 145.8 �1394.3 �1247.7
600 216.5 156.9 58072.2 39232.7 �1361212 �1491115 151.1 �1392.2 �1234.4
634 225.5 169.6 63590.6 44751.1 �1355673 �1498629 154.9 �1390.4 �1225.6
634 225.5 169.6 63590.6 44751.1 �1355673 �1498629 154.9 �1390.4 �1225.6
650 228.9 139.3 65821.4 46981.9 �1353419 �1502265 156.7 �1389.9 �1221.4
700 239.1 134.3 72638.2 53798.7 �1346602 �1513971 162.2 �1388.8 �1208.5
750 248.3 132.6 79298.8 60459.3 �1339936 �1526159 167.7 �1387.9 �1195.7
800 256.8 132.0 85884.3 67044.8 �1333325 �1538790 173.0 �1387.2 �1182.9
850 264.8 132.0 92452.4 73612.9 �1326726 �1551834 178.6 �1386.7 �1170.1
900 272.4 132.3 99037.4 80197.9 �1320119 �1565266 183.3 �1386.4 �1157.4
950 279.6 132.8 105650 86810.9 �1313493 �1579066 188.2 �1386.3 �1144.7
1000 286.4 133.4 112279 93439.4 �1306839 �1593216 192.9 �1386.4 �1131.9
S.C. Parida et al. / Journal of Solid State Chemistry 179 (2006) 2212–22302228

ARTICLE IN PRESS
Table 5
Thermodynamic data for Ho3Fe5O12(s)
T/K STo/
JK�1mol�1Cp,mo /
JK�1mol�1HT
o�H0
o/
Jmol�1HT
o�H298.15
o /
Jmol�1HT
o/Jmol�1 GTo/Jmol�1 �(GT
o�H298.15
o )/T/
JK�1mol�1DfHm
o /
kJmol�1DfG
om/
kJmol�1
0 0 0 0
25 47.42 34.85 336.205
50 84.57 76.81 1736.26
75 123.4 117.7 4169.64
100 162.8 156.4 7613.76
150 242.6 241.5 17601.7
200 322.7 317.1 31608.2
250 400.8 383.3 49160.4
298.15 473.1 445.7 68973.7 0 �4925600 �5066654 473.1 �4925.6 �4592.1
300 475.8 447.4 69799.6 825.9 �4924773 �5067532 473.1 �4925.4 �4590.0
325 512.4 467.4 81236.1 12262.3 �4913328 �5079889 474.7 �4923.6 �4562.1
350 547.7 483.9 93126.3 24152.5 �4901429 �5093146 478.7 �4921.4 �4534.4
400 614.1 510.0 117993.7 49020.0 �4876550 �5122216 491.6 �4916.3 �4479.4
450 675.4 531.4 144018.4 75044.7 �4850503 �5154477 508.7 �4910.5 �4425.1
500 732.5 552.6 171080.7 102107.0 �4823410 �5189695 528.3 �4904.0 �4371.6
546 782.2 577.3 197013.7 128040.0 �4797454 �5224543 547.7 �4897.5 �4322.9
546 782.2 577.3 197013.7 128040.0 �4797454 �5224543 547.7 �4897.5 �4322.9
550 786.2 548.2 199201.4 130227.6 �4795259 �5227680 549.4 �4897.0 �4318.6
600 833.7 545.1 226519.7 157545.9 �4767961 �5268197 571.1 �4891.3 �4266.3
650 877.3 546.0 253826.6 184852.8 �4740687 �5310989 592.9 �4886.2 �4214.4
700 917.9 547.7 281167.6 212193.9 �4713343 �5355884 614.7 �4881.5 �4163.0
750 955.7 549.4 308575.0 239601.2 �4685912 �5402736 636.3 �4877.3 �4111.8
800 991.2 551.0 336067.4 267093.6 �4658400 �5451421 657.4 �4873.7 �4060.9
850 1024.7 552.3 363650.1 294676.4 �4630814 �5501830 678.0 �4870.8 �4010.2
900 1056.3 553.5 391315.1 322341.4 �4603164 �5553863 698.1 �4868.8 �3959.6
950 1086.2 554.6 419040.9 350067.2 �4575457 �5607435 717.8 �4867.7 �3909.1
1000 1114.7 555.5 446792.7 377818.9 �4547702 �5662468 736.9 �4868.0 �3858.7
Table 6
Thermodynamic data for Er3Fe5O12(s)
T/K STo/
JK�1mol�1Cp,mo /
JK�1mol�1HT
o�H0
o/
Jmol�1HT
o�H298.15
o /
Jmol�1HT
o/Jmol�1 GTo/Jmol�1 �(GT
o�H298.15
o )/T/
JK�1mol�1DfHm
o /
kJmol�1DfGm
o /
kJmol�1
0 0 0 0
25 36.90 35.01 434.878
50 70.81 69.04 1708.18
75 105.6 105.2 3886.62
100 141.0 142.8 6982.72
150 214.9 232.0 16245.7
200 292.7 309.7 29865.1
250 368.9 373.3 46988.3
298.15 483.9 428.0 66294.6 0 �5023500 �5167774 483.9 �5023.5 �4694.8
300 486.6 432.1 67092.3 797.6 �5022702 �5168672 483.9 �5023.4 �4692.8
325 521.9 452.2 78147.7 11853.0 �5011640 �5181281 485.5 �5022.0 �4665.3
350 556.1 468.8 89660.2 23365.6 �5000122 �5194760 489.3 �5020.2 �4637.9
400 620.5 495.3 113786.3 47491.6 �4975992 �5224197 501.7 �5016.0 �4583.6
450 680.1 517.3 139095.8 72801.2 �4950668 �5256732 518.3 �5010.9 �4529.8
500 735.8 539.2 165479.0 99184.3 �4924266 �5292144 537.3 �5005.3 �4476.6
544 782.2 563.6 189701.4 123406.7 �4900034 �5325546 555.3 �4999.7 �4430.4
544 782.2 563.6 189701.4 123406.7 �4900034 �5325546 555.3 �4999.7 �4430.4
550 788.0 534.2 192899.2 126604.6 �4896825 �5330256 557.8 �4999.1 �4424.1
600 834.4 532.1 219543.1 153248.4 �4870200 �5370835 578.9 �4994.2 �4372.0
650 877.0 533.7 246214.9 179920.3 �4843559 �5413634 600.2 �4989.8 �4320.4
700 916.7 536.1 272957.2 206662.6 �4816813 �5458489 621.4 �4985.9 �4269.0
750 953.7 538.4 299799.6 233504.9 �4789949 �5505260 642.4 �4982.4 �4218.0
800 988.6 540.7 326759.2 260464.6 �4762970 �5553826 662.9 �4979.6 �4167.1
850 1021.4 542.7 353840.7 287546.1 �4735885 �5604084 683.1 �4977.4 �4116.4
900 1052.5 544.6 381036.0 314741.4 �4708704 �5655938 702.8 �4975.9 �4065.8
950 1081.9 546.3 408324.6 342029.9 �4681433 �5709306 721.9 �4975.4 �4015.2
1000 1110.0 547.8 435673.1 369378.5 �4654081 �5764111 740.6 �4976.2 �3964.7
S.C. Parida et al. / Journal of Solid State Chemistry 179 (2006) 2212–2230 2229
ARTICLE IN PRESSS.C. Parida et al. / Journal of Solid State Chemistry 179 (2006) 2212–22302230
Thermodynamic functions have been generated forRFeO3(s) and R3Fe5O12(s).
References
[1] G. Heane, M. Pasternak, R. Taylor, Nuovo-Cimento. D 18D (1996)
145–161.
[2] A.E. Bocquet, A. Fujimori, T. Mizokawa, T. Saitoh, H. Namatame,
S. Suga, N. Kimizuka, Y. Takeda, M. Takano, Phys. Rev. B 45
(1992) 1561–1570.
[3] H. Obayashi, Y. Sakurai, T. Gejo, J. Solid State Chem. 17 (1976)
299–303.
[4] S. Srinivasan, B.B. Dave, K.A. Murugesamoorthi, A. Parthasarathy,
A.J. Appleby, in: L.J.M.J. Blomen, M.N. Migerwa (Eds.), Fuel Cell
Systems, New York, 1999, p. 58.
[5] C.P. Khattak, F.F.Y. Wang, in: K.A. Gschneidner Jr., L. Eyring
(Eds.), Handbook of the Physics and Chemistry of Rare Earths,
North-Holland, Amsterdam, 1979, pp. 525–607.
[6] T. Katsura, T. Sekine, K. Kitayama, T. Sugihara, N. Kimizuka, N. J.
Solid State Chem. 23 (1978) 43–57.
[7] N. Kimizuka, A. Yamamoto, H. Ohashi, T. Sugihara, T. Sekine,
J. Solid State Chem. 49 (1983) 65–76.
[8] K. Saito, A. Sato, A. Bhattacharjee, M. Sorai, Solid State Commun.
120 (2001) 129–132.
[9] A. Bhattacharjee, K. Saito, M. Sorai, J. Phys. Chem. Solids 63 (2002)
569–574.
[10] K. Saito, Y. Yamamura, J. Mayer, H. Kobayashi, Y. Miyazaki, J.
Ensling, P. Gutlich, B. Lesniewska, M. Sorai, J. Magn. Magn. Mat.
225 (2001) 381–388.
[11] A.B. Harris, H. Meyer, Phys. Rev. 127 (1962) 101–118.
[12] V.S. Varazashvilli, M.S. Tsarakhov, G.D. Chachanidze, Neorgan.
Mater. 26 (1990) 602–604.
[13] S.C. Parida, S. Dash, Z. Singh, R. Prasad, V. Venugopal, J. Alloys
Compnds. 280 (1998) 94–98.
[14] S.C. Parida, S. Dash, Z. Singh, R. Prasad, K.T. Jacob, V. Venugopal,
J. Solid State Chem. 164 (2002) 527–534.
[15] S.C. Parida, K.T. Jacob, V. Venugopal, J. Phase Equilibria 25 (2003)
431–440.
[16] S.C. Parida, S.K. Rakshit, S. Dash, Z. Singh, R. Prasad, V.
Venugopal, J. Solid State Chem. 172 (2003) 370–380.
[17] S.C. Parida, K.T. Jacob, V. Venugopal, Solid State Sci. 4 (2002)
1245–1255.
[18] S.K. Rakshit, S.C. Parida, S. Dash, Z. Singh, R. Prasad, V.
Venugopal, J. Chem. Thermodynamics 35 (2003) 1793–1807.
[19] S.C. Parida, S.K. Rakshit, S. Dash, Z. Singh, R. Prasad, V.
Venugopal, J. Chem. Thermodynamics 36 (2004) 911–917.
[20] S.K. Rakshit, S.C. Parida, S. Dash, Z. Singh, R. Prasad, V.
Venugopal, Mat. Res. Bull. 40 (2005) 323–332.
[21] J.N. Pratt, Metall. Trans. A 21A (1990) 1223–1250.
[22] D.A. Shores, R.A. Rapp, J. Electrochem. Soc. 118 (1971) 1107–1111.
[23] M. Eibschutz, S. Shtrikman, D. Treves, Phys. Rev. 156 (1967) 562.
[24] S. Stølen, F. Grønvold, H. Brinks, T. Atake, H. Mori, J. Chem.
Thermodynamics 30 (1998) 365–377.
[25] E.F. Westrum Jr., B.H. Justice, J. Phys. Chem. 67 (1963) 659–665.
[26] F. Gronvold, E.F. Westrum Jr., J. Am. Chem. Soc. 81 (1959)
1780–1783.
[27] F. Gronvold, E.J. Samuelsen, Phys. Chem. Solids 36 (1975)
249–256.
[28] E.J. Samuelsen, G. Shirane, Phys. Status Solidi 42 (1970) 241–256.
[29] W. Schnelle, R. Fischer, E. Gmelin, J. Phys. D: Apply. Phys. 34
(2001) 846–851.
[30] R. Pauthenet, J. Appl. Phys. 30 (1959) 290S–292S.
[31] A.J. Henderson Jr., D.G. Onn, H. Meyer, Phys. Rev. 185 (1969)
1218–1229.
[32] B. Mirianashvili, V.S. Varazashvili, M.S. Tsarakhov, T.A. Pavle-
nishvili, Russ. J. Inorg. Chem. 42 (1997) 926–928.
[33] V.S. Varazashvili, M.S. Tsarakhov, T.B. Mirianashvili, Russ.
J. Inorg. Chem. 42 (1997) 597–599.
[34] R. Moretti, G. Ottonello, Geochim. Cosmochim. Acta 62 (1998)
1147–1173.
[35] I. Barin, Thermochemical Data of Pure Substances, vols. I & II, third
ed., VCH Publishers, New York, 1995.
[36] B. Sundman, J. Phase Equilibria 12 (1991) 127–140.