Application of chemometrics to hyperspectral imaging analysis ...
Communication
Association Equilibrium of Methylene Blue by Spectral Titration and
Chemometrics Analysis: A Thermodynamic Study
Jahan B. Ghasemia,* and M. Miladib
aChemistry Department, Faculty of Sciences, K. N. Toosi University of Technology, Tehran, IranbChemistry Department, Razi University, Kermanshah, Iran
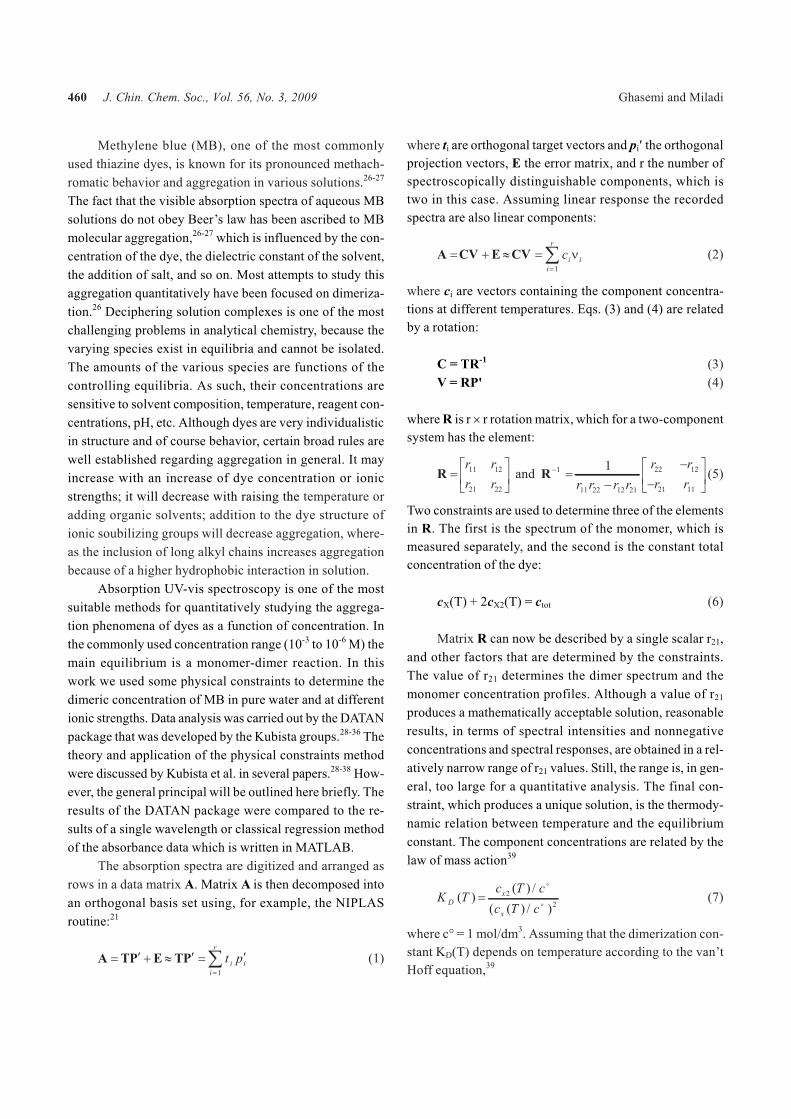
The monomer-dimer equilibrium of methylene blue (MB, Scheme I) has been investigated by means
of UV-Visible spectroscopy in aqueous solutions. The self aggregation of MB in water has been investi-
gated by recording absorption spectra in the wavelength range of 450-750 nm, and in different ionic
strengths using concentrated KCl solutions in the temperature range of 20-90 �C. Chemometrics analysis
of the spectral data gave a dimerization constant, individual spectra of the monomer and dimer forms of
the dye molecule. The quantitative analysis of the data of the undefined mixture was carried out by simul-
taneous resolution of the overlapping spectral bands in the whole set of absorption spectra. The dimeriza-
tion constants of MB determined by mathematical deconvolution of the thermometric spectral titration
data show dependency on temperature variations. The concentration range of MB was 6.00 � 10-5-3.00 �10-4 M. Utilizing the van’t Hoff relation, which describes the dependence of the equilibrium constant on
temperature, the thermodynamics parameters �H� and �S� of the aggregation process were determined.
The compensation effect was verified by the thermodynamics results of the dimerization process of the
dye.
Keywords: Thermodynamics; Dimerization; Chemometrics; Dye; Methylene blue; Titration;
Ionic strength.
1. INTRODUCTION
The aggregation of dyes, drugs, surfactants, etc. in
aqueous solutions is of extreme importance in biological,
colloid, surface, textile, photographic and analytical chem-
istry.1 In general, a wide variety of applications of pheno-
thiazine dyes have been reported, for example, as sensi-
tizers in solar energy conversion,2 redox mediators in cata-
lytic oxidation reactions,3 active species in electrochro-
mism4 and dye lasers,5 ingredients in pharmaceutical prep-
arations,6 candidates for cancer therapy by intercalating be-
tween DNA base layers7 as sensors or for probing chemical
properties at interfaces, especially in biochemistry and mo-
lecular biology.8 However, all of these applications are of-
ten complicated due to the dimerization of dye molecules in
aqueous media such as the great decrease in light sensitiv-
ity,9 which results from increased inner conversion of the
dimer exciter state. In order to determine the mode of ag-
gregation, the aggregation constant in equilibrium and the
aggregation number, the aggregation of dyes has been in-
vestigated by a variety of methods, viz. polarography,10,11
conductometry12 UV-Vis spectrophotometry,13-19 NMR,20-22
light scattering23 and electrolytic effect24 measurements.
The nature of the self-association of dyes in aqueous
solutions, aside from its intrinsic interest, is important in
the understanding and interpretation of a great variety of
problems, such as dyeing of fibers, tissue staining in biol-
ogy, spectral change and energy transfer studies, adsorp-
tion, and photography. Dye association is also one of the
simplest examples of “stacking” interactions. Many dyes
show appreciable association at concentrations as low as
10-6-10-4 M, and the qualitative evidence from many stud-
ies suggests that a series of multimers are formed.25
Journal of the Chinese Chemical Society, 2009, 56, 459-468 459
* Corresponding author. Tel: +0098-21-22853306; Fax: +0098-21-22850266; E-mail: [email protected]
S
N
NNCl
-
Scheme I
Methylene blue (MB), one of the most commonly
used thiazine dyes, is known for its pronounced methach-
romatic behavior and aggregation in various solutions.26-27
The fact that the visible absorption spectra of aqueous MB
solutions do not obey Beer’s law has been ascribed to MB
molecular aggregation,26-27 which is influenced by the con-
centration of the dye, the dielectric constant of the solvent,
the addition of salt, and so on. Most attempts to study this
aggregation quantitatively have been focused on dimeriza-
tion.26 Deciphering solution complexes is one of the most
challenging problems in analytical chemistry, because the
varying species exist in equilibria and cannot be isolated.
The amounts of the various species are functions of the
controlling equilibria. As such, their concentrations are
sensitive to solvent composition, temperature, reagent con-
centrations, pH, etc. Although dyes are very individualistic
in structure and of course behavior, certain broad rules are
well established regarding aggregation in general. It may
increase with an increase of dye concentration or ionic
strengths; it will decrease with raising the temperature or
adding organic solvents; addition to the dye structure of
ionic soubilizing groups will decrease aggregation, where-
as the inclusion of long alkyl chains increases aggregation
because of a higher hydrophobic interaction in solution.
Absorption UV-vis spectroscopy is one of the most
suitable methods for quantitatively studying the aggrega-
tion phenomena of dyes as a function of concentration. In
the commonly used concentration range (10-3 to 10-6 M) the
main equilibrium is a monomer-dimer reaction. In this
work we used some physical constraints to determine the
dimeric concentration of MB in pure water and at different
ionic strengths. Data analysis was carried out by the DATAN
package that was developed by the Kubista groups.28-36 The
theory and application of the physical constraints method
were discussed by Kubista et al. in several papers.28-38 How-
ever, the general principal will be outlined here briefly. The
results of the DATAN package were compared to the re-
sults of a single wavelength or classical regression method
of the absorbance data which is written in MATLAB.
The absorption spectra are digitized and arranged as
rows in a data matrix A. Matrix A is then decomposed into
an orthogonal basis set using, for example, the NIPLAS
routine:21
A TP E TP� � � � � � ��� t pi i
i
r
1
(1)
where ti are orthogonal target vectors and pi� the orthogonal
projection vectors, E the error matrix, and r the number of
spectroscopically distinguishable components, which is
two in this case. Assuming linear response the recorded
spectra are also linear components:
A CV E CV� � � ��� ci i
i
r
1
(2)
where ci are vectors containing the component concentra-
tions at different temperatures. Eqs. (3) and (4) are related
by a rotation:
C = TR-1 (3)
V = RP' (4)
where R is r � r rotation matrix, which for a two-component
system has the element:
R �
��
��
r r
r r
11 12
21 22
and R� �
�
�
�
��
��
1
11 22 12 21
22 12
21 11
1
r r r r
r r
r r(5)
Two constraints are used to determine three of the elements
in R. The first is the spectrum of the monomer, which is
measured separately, and the second is the constant total
concentration of the dye:
cX(T) + 2cX2(T) = ctot (6)
Matrix R can now be described by a single scalar r21,
and other factors that are determined by the constraints.
The value of r21 determines the dimer spectrum and the
monomer concentration profiles. Although a value of r21
produces a mathematically acceptable solution, reasonable
results, in terms of spectral intensities and nonnegative
concentrations and spectral responses, are obtained in a rel-
atively narrow range of r21 values. Still, the range is, in gen-
eral, too large for a quantitative analysis. The final con-
straint, which produces a unique solution, is the thermody-
namic relation between temperature and the equilibrium
constant. The component concentrations are related by the
law of mass action39
K Tc T c
c T cD
x
x
( )( ) /
( ( ) / )� 2
2
�
�
(7)
where c� = 1 mol/dm3. Assuming that the dimerization con-
stant KD(T) depends on temperature according to the van’t
Hoff equation,39
460 J. Chin. Chem. Soc., Vol. 56, No. 3, 2009 Ghasemi and Miladi

d K T
d TH RDln ( )
( / )/
1� �� � (8)
where �H� is the molar enthalpy change, R = 8.314 J mol-1
K-1 is the universal gas constant, and T the Kelvin tempera-
ture. A linear regression of equilibrium constant with re-
spect to 1/T is then performed, which determines a trial
enthalpy change of the reaction. Several studies based on
the application of this method to evaluate spectrometric
data have been reported.28-41
2. EXPERIMENTAL
2.1. Artificial Data Set
The artificial data sets were generated based on Beer-
Lambert’s law. Concentration profiles are constructed ac-
cording to mass-balance equations and the spectrum of
each species constructed by using a Gaussian formula with
respect to the physico-chemical behavior of the system
under study. To evaluate the robustness of the proposed
method, different random noise levels were superimposed
on each absorbance reading. The spectra were simulated in
the wavelength range of 540-700 nm and the temperature
range is 20-90 �C (5 �C intervals) with initial guesses of
enthalpy and entropy values. The simulated data series
have been refined by using the DATAN program.
2.2. Real Data Set
2.2.1. Instrumentation and Software
Absorption spectra were measured on a CARY 100
UV-Visible Spectrophotometer (Varian) equipped with a 1
mm quartz cell with a temperature controller and a 1 nm
bandwidth spectral bandpass, and were digitized with five
data points per nanometer. The cuvettes were treated with
repel-silane prior to measurements to avoid dye adsorp-
tion.
All absorption spectra in the wavelength range of
540-700 nm were transferred (in ASCII format) to an
Athlon 2000 XP computer for analysis by MATLAB (Math-
works, Version 6.5) and DATAN package ver 3.1.42
2.2.2. Chemical Reagents
All the chemicals used were of analytical reagent
grade. Subboiling, distilled water was used throughout.
MB (for microscopy grade) was purchased from Fluka and
used without additional purification. A stock solution of
MB (1.00 � 10-3 M) was prepared. In all experiments the
ionic strength was adjusted using KCl (Fluka).
3. RESULTS AND DISCUSSION
3.1. Absorption spectra
Two sets of simulated and experimental absorption
spectra were prepared to examine the ability of the DATAN
package in determination of dimerization constants. The
first set obtained was based on Beer-Lambert’s law and us-
ing a Gaussian formula with specifications mentioned in
the experimental section. The quantity of added noise to the
generated absorption spectra is random. The sample three
dimensional plot of the generated absorption spectra loaded
with random noise is shown in Fig. 1. The wavelength and
temperature range of the spectra were 600-700 nm and
20-90 �C temperature units, respectively. The second sets
are experimental data of MB obtained at different total dye
concentrations, and ionic strengths were recorded in the
wavelength range of 540-700 nm. The typical absorption
spectra of the MB in aqueous solution are shown in Fig. 2.
3.2. Determination the dimerization constant of simu-
lated and experimental data set
As expected, by increasing the temperature and de-
creasing the concentration, the monomer form would be
predominant over the dimer form. So, it is wise to choose
the spectrum of the dye at the highest temperature and at the
Chemometric Study of Methylene Blue Association J. Chin. Chem. Soc., Vol. 56, No. 3, 2009 461
Fig. 1. The simulated absorption spectra of methylene
blue loaded with 2% noise. (a: 6.00 � 10-5, b:
9.00 � 10-5, c: 3.00 � 10-4 M) with 5 �C intervals
from 20-90 �C.

lowest concentration as an initial estimate for the monomer
in subsequent calculations.
According to Equations (1)-(8), the DATAN program
starts with a trial value of r21, at a predefined interval, and
iterates all the calculation steps. The iteration stops when
all r21 values in the preset interval are tested. The KD, dimer
spectrum, �S� and �H�, corresponding to a minimum value
of the �2 statistics, are selected as the final results. The �2 is
the sum of squared residuals29 and generally used as a
goodness of fit criterion and its value indicates the predict-
ability of the model, i.e., how well the monomer spectrum
and r21 are determined. The general formula of the �2 is:
� 2 2
1
� ��� ( ) /exp expA A Acalc
i
n
where Aexp is the expected value and Acalc the value calcu-
lated from the experimental data over n data points.
By a rising the temperature, an absorption peak, for
MB, around 664 nm grows and an absorption shoulder
around 610 nm decreases (Fig. 2). We analyzed the tem-
perature titrations assuming monomer-dimer, monomer-
dimer-trimer and even some models including higher order
aggregates. It was found that a monomer-dimer model most
adequately describes the data in these ranges of dye con-
centrations. The presence of exactly two species is also evi-
denced by the appearance of an isosbestic point at 620 nm
(Fig. 2).
The dimerization constants of the simulated absorp-
tion spectra loaded with noise are calculated by the DATAN
program. The dimerization constant at 25 �C and different
concentrations are shown in Table 1. The general outputs of
the program involve a linear van’t Hoff plot, the spectral re-
sponses of the monomer and dimer species, their concen-
tration as a function of temperature (Fig. 3) and changes in
the �H� and �S� of the reaction (Table 2).
The dimerization constants (KD) were calculated at
different temperatures and dye concentrations in pure wa-
ter. As expected, KD decreased with increasing tempera-
ture, while it is virtually independent of total dye concen-
tration. The dimerization constant at 25 �C and at different
concentrations and thermodynamic parameters of the di-
merization reaction are listed in Table 3. It is clear from the
462 J. Chin. Chem. Soc., Vol. 56, No. 3, 2009 Ghasemi and Miladi
Fig. 2. Experimental absorption spectra of MB in wa-
ter (a: 6.00 � 10-5, b: 9.00 � 10-5, c: 3.00 � 10-4
M) with 5 �C intervals from 20-90 �C.
Fig. 3. Linear van’t Hoff plots, molar ratios as a func-
tion of temperature and spectral profiles of the
monomer and dimer species for simulated data
of MB, 9 � 10-5, with and without noise (sub-
scribes 1 and 2 for letters a to c denote absence
and the presence of noise, respectively).

result that the obtained dimerization constants obtained are
the same within the margin of the experimental errors.
From the dependence of log KD on 1/T (Fig. 4), �S�and �H� values were determined; the �H� values range
from -41.8 KJ mol-1 to -49.3 KJ mol-1 with mean -46.84 KJ
mol-1 while �S� ranges from -62 to -85 J mol-1 K-1 with
mean -76 J mol-1 K-1. As described, the above dimerization
is presumed to be the dominant form of aggregation in ap-
plied concentration ranges in aqueous MB. This is corrobo-
rated by the constancy of the apparent enthalpy of associa-
tion. In general, the extent of aggregation depends recip-
rocally on the temperature of the solution and is fully re-
Chemometric Study of Methylene Blue Association J. Chin. Chem. Soc., Vol. 56, No. 3, 2009 463
Table 1. Dimeric constant (KD) value for the simulated data loaded with noise at different
concentrations of MB
Concentration of MB
Data set 6.00 � 10-5 M 9.00 � 10-5 M 3.00 � 10-4 M
0% Noise LogKD (25� C) 21.9 � 103 19.4 � 103 13.2 � 103
2% Noise LogKD (25� C) 19.9 � 103 19.6 � 103 13.1 � 103
Table 2. Thermodynamic parameter values of MB for simulated
data loaded with noise at different concentrations
Data set Concentration �H� (KJ mol-1) �S� (J mol-1 K-1)
0% Noise 6.00 � 10-5 M -49.2 -82
9.00 � 10-5 M -49.4 -84
3.00 � 10-4 M -41.8 -61
2% Noise 6.00 � 10-5 M -48.4 -79
9.00 � 10-5 M -49.8 -85
3.00 � 10-4 M -41.2 -59
Table 3. Dimeric constant (KD) and thermodynamic parameter
values for the experimental data of MB at different
concentrations in pure water
Concentration
6.00 � 10-5 M 9.00 � 10-5 M 3.00 � 10-4 M
LogKD (25 �C) 4.31 4.26 4.13
�H� (KJ mol-1) -49.2 -49.4 -41.7
�S� (J mol-1 K-1) -82 -84 -61
Fig. 4. The van’t Hoff plot at different concentrations
of MB for experimental data in water (a: 6.00 �10-5, b: 9.00 � 10-5, c: 3.00 � 10-4 M).
Fig. 5. Molar ratio of MB dye monomer (o) and dimer
(�), compared to molar ratios predicted by the
temperature dependence of the equilibrium
constant (shown as solid line) at different con-
centrations of MB dye in water (a: 6.00 � 10-5,
b: 9.00 � 10-5, c: 3.00 � 10-4 M).
versible. The observed relationship between entropy and
enthalpy reflects an electronic nature of the dimerization
phenomenon of MB. The relative dependence of the con-
centrations of the monomer and dimer of MB on the tem-
perature in different concentrations are shown diagram-
matically in Fig. 5. The calculated absorption spectra of
MB in monomer and dimer forms are shown in Fig. 6.
For studying the effect of ionic strength on dimeriza-
tion of MB using potassium chloride, the dimerization was
investigated at different ionic strengths. Spectra of MB (5 �10-5 M) at different ionic strengths in the temperature range
of 20-90 �C with 5 �C intervals are shown in Fig. 7. Hydro-
phobic bonding, hydrophobic forces, and electrostatic in-
teractions may be all considered important for dimeriza-
tion. What effect we expected from the increasing of the
ionic strength on the dimerization constants according to
the extended Debye-Huckel equation,43-44 totally depends
on the relative charge of the dimer species with respect to
the two monomer moieties. As can be seen from the data
obtained at different ionic strengths (Table 4), the increas-
ing of the ionic strength results in an increase of the dime-
rization constants. The dimeric constant at 25 �C and ther-
modynamic parameters values of MB at different concen-
trations of ionic strengths are listed in Table 4.
One of the most interesting points of the change of the
ionic strength on the dimerization reactions of the MB is
the spectral changing of the dimer form. The dimer spectra
of MB show enhancement of the spectral band with �max’s
around 664 nm as compared with those in water. Patil et
al.45 reported a similar spectral change from the effect of
the addition of some solutes to the aqueous solution of MB.
They showed that these spectral variations depend on the
angle between the two dye molecule planes which in turn
depend on the concentration of the inert solutes. The de-
crease in dimer formation constant values with an increase
in the concentration of each on inert salts also indicates the
decreased tendency of MB molecules to undergo aggrega-
tion. The random variations in the formation constants by
changing ionic strength may be returned to the presence of
the un-accounted interactions such as anion–cation attrac-
tive type interactions, etc., in addition to monomer-dimer
equilibrium.
Despite the abovementioned variations which have a
deterministic effect on the thermodynamics parameters of
dimerization at MB, the T�S versus �H� plot, Fig. 8 shows
a fairly good linear correlation indicating the existence of
enthalpy-entropy compensation in dimeric reactions. The
linear correlation observed between T�S and �H� values
can be expressed as T�S = T�S� + � �H� with T�S� =
17.54 KJ mol-1, � = 0.82 (R2 = 0.9711) for thermodynamics
data of the dimerization process of MB. The same trends
464 J. Chin. Chem. Soc., Vol. 56, No. 3, 2009 Ghasemi and Miladi
Fig. 6. Calculated absorption spectra of MB dye
monomer (—) and dimer (---) at different con-
centrations in water (a: 6.00 � 10-5, b: 9.00 �10-5, c: 3.00 � 10-4 M).
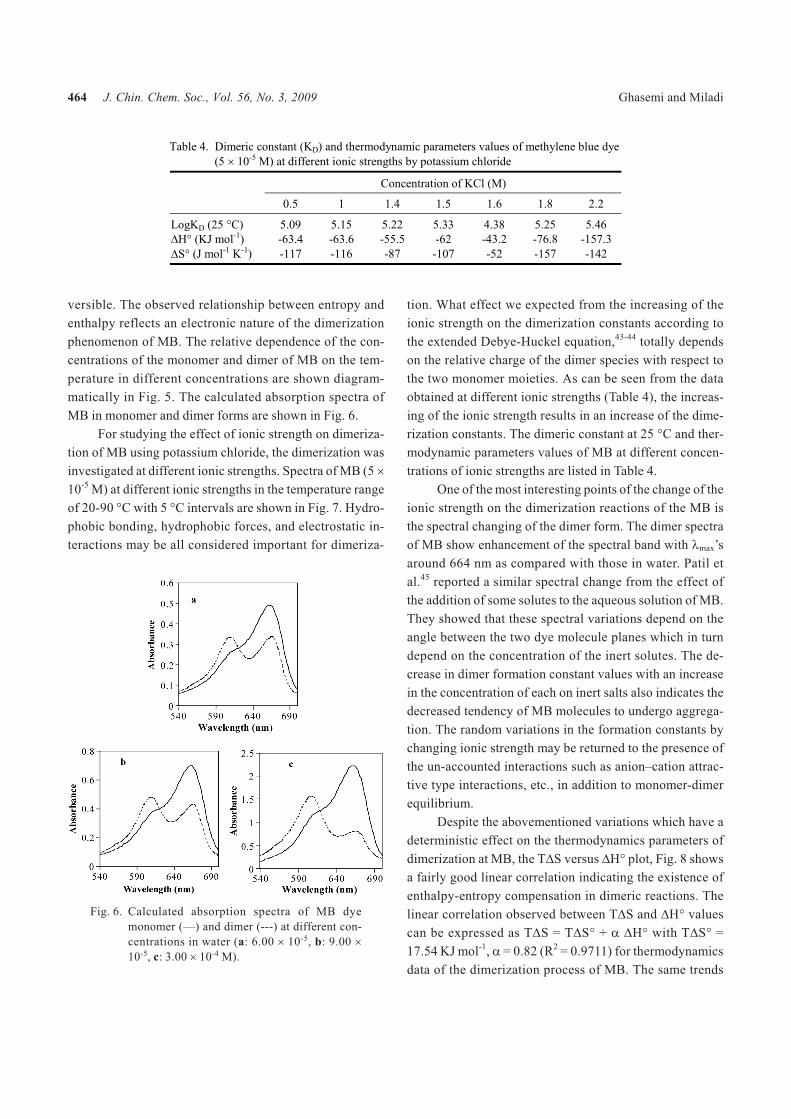
Table 4. Dimeric constant (KD) and thermodynamic parameters values of methylene blue dye
(5 � 10-5 M) at different ionic strengths by potassium chloride
Concentration of KCl (M)
0.5 1 1.4 1.5 1.6 1.8 2.2
LogKD (25 �C) 5.09 5.15 5.22 5.33 4.38 5.25 5.46
�H� (KJ mol-1) -63.4 -63.6 -55.5 -62 -43.2 -76.8 -157.3
�S� (J mol-1 K-1) -117 -116 -87 -107 -52 -157 -142
are reported from the thermodynamics study of the reac-
tions largely accompanying changes in electrostatic inter-
actions during the association reactions or host-guest phe-
nomena.46-49
The result suggests that the entropic effect consists of
two components. The first component T�S� is independent
of enthalpy change and the second is proportional to it. The
proportionality constant � might be considered as a quanti-
tative measure of the enthalpy-entropy compensation. For
MB, � = 0.82, only about 18% of the increase in �H con-
tributed to dimeric stability. The close-to-zero intercept of
T�S� KJ mol-1 reveals that the dimerization process here in
nature can be classified as enthalpy driven. These results
can be supported by the fact that the dimerization constant
is increased by the increase of the ionic strengths of the me-
dium which in turn show the increasing of the charge of the
dimer that are more solvated by the solvents molecules, and
entropic change would have less positive values. Another
point that appears to be true about Fig. 8 which indicates
the compensation effect is that the linear plot shows that a
single mechanism is most likely to dominate the range of
ionic strengths investigated. The ionic strength will affect
the solubility such as salt-in and salt-out effects. Recently
there have been some reports on the kinetic and thermody-
Chemometric Study of Methylene Blue Association J. Chin. Chem. Soc., Vol. 56, No. 3, 2009 465
(Continued)

namic study on adsorption and desorption of MB on differ-
ent activated charcoals.50-53 These papers report that the as-
sociation of the MB have a pronounced effect on the ad-
sorption desorption phenomena.
4. CONCLUSION
In this study we reported, for the first time to our
knowledge, dimerization constants, concentration profiles,
and spectral responses of monomer and dimers obtained by
computer refinement of temperature photometric titrations.
We also report a thermodynamic study of the dimerization
466 J. Chin. Chem. Soc., Vol. 56, No. 3, 2009 Ghasemi and Miladi
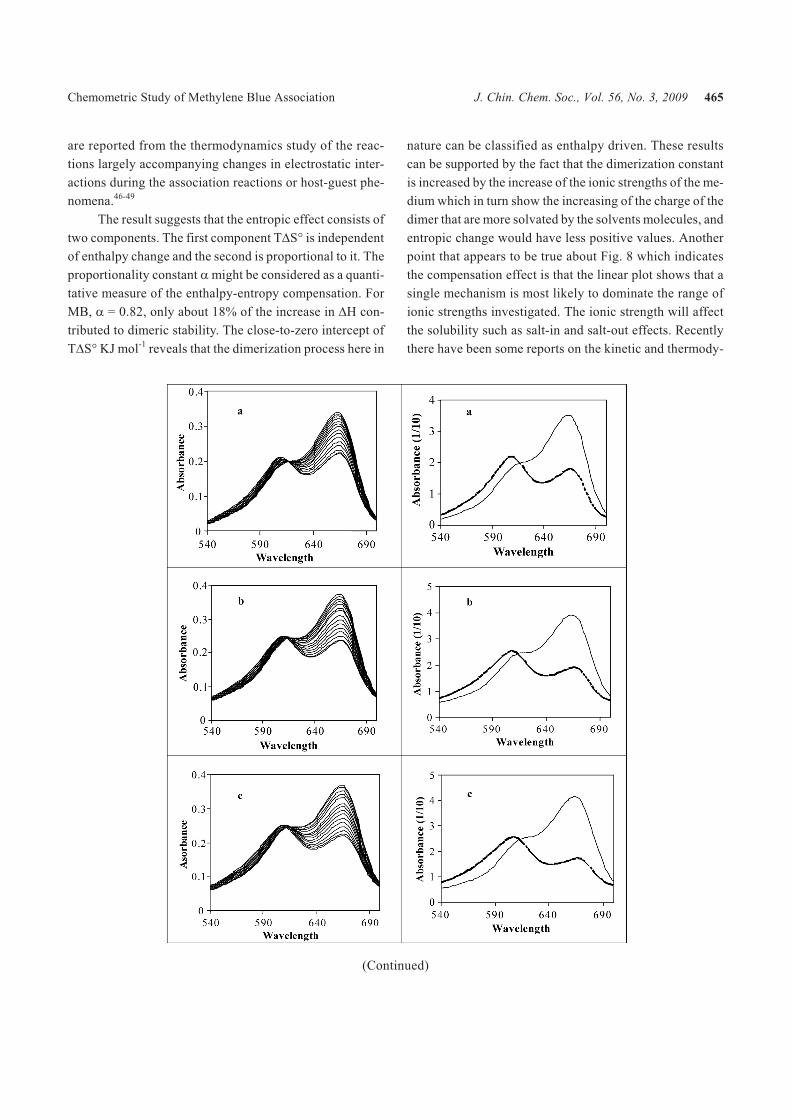
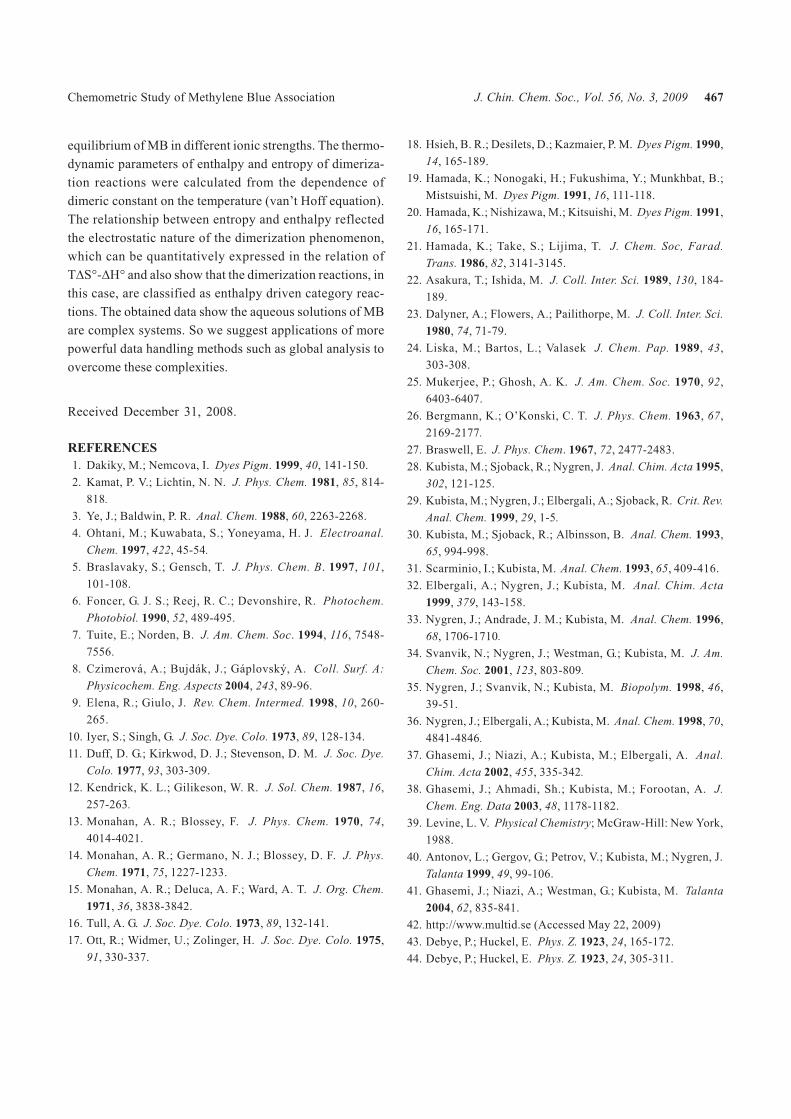
Fig. 7. Experimental traces (left) absorption spectra of MB (5.00 � 10-5 M) with 5� interval between 20-90 �C at different
ionic strengths (a: 0.5, b: 1, c: 1.4, d: 1.5, e: 1.6, f: 1.8 M of KCL). The right side indicates monomer (—) and dimer
(---) of MB at corresponding concentrations and ionic strengths.
Fig. 8. Plot of T�S vs. �H� for dimerization of MB of
different concentrations in various ionic strengths
media.
equilibrium of MB in different ionic strengths. The thermo-
dynamic parameters of enthalpy and entropy of dimeriza-
tion reactions were calculated from the dependence of
dimeric constant on the temperature (van’t Hoff equation).
The relationship between entropy and enthalpy reflected
the electrostatic nature of the dimerization phenomenon,
which can be quantitatively expressed in the relation of
T�S�-�H� and also show that the dimerization reactions, in
this case, are classified as enthalpy driven category reac-
tions. The obtained data show the aqueous solutions of MB
are complex systems. So we suggest applications of more
powerful data handling methods such as global analysis to
overcome these complexities.
Received December 31, 2008.
REFERENCES
1. Dakiky, M.; Nemcova, I. Dyes Pigm. 1999, 40, 141-150.
2. Kamat, P. V.; Lichtin, N. N. J. Phys. Chem. 1981, 85, 814-
818.
3. Ye, J.; Baldwin, P. R. Anal. Chem. 1988, 60, 2263-2268.
4. Ohtani, M.; Kuwabata, S.; Yoneyama, H. J. Electroanal.
Chem. 1997, 422, 45-54.
5. Braslavaky, S.; Gensch, T. J. Phys. Chem. B. 1997, 101,
101-108.
6. Foncer, G. J. S.; Reej, R. C.; Devonshire, R. Photochem.
Photobiol. 1990, 52, 489-495.
7. Tuite, E.; Norden, B. J. Am. Chem. Soc. 1994, 116, 7548-
7556.
8. Czìmerová, A.; Bujdák, J.; Gáplovský, A. Coll. Surf. A:
Physicochem. Eng. Aspects 2004, 243, 89-96.
9. Elena, R.; Giulo, J. Rev. Chem. Intermed. 1998, 10, 260-
265.
10. Iyer, S.; Singh, G. J. Soc. Dye. Colo. 1973, 89, 128-134.
11. Duff, D. G.; Kirkwod, D. J.; Stevenson, D. M. J. Soc. Dye.
Colo. 1977, 93, 303-309.
12. Kendrick, K. L.; Gilikeson, W. R. J. Sol. Chem. 1987, 16,
257-263.
13. Monahan, A. R.; Blossey, F. J. Phys. Chem. 1970, 74,
4014-4021.
14. Monahan, A. R.; Germano, N. J.; Blossey, D. F. J. Phys.
Chem. 1971, 75, 1227-1233.
15. Monahan, A. R.; Deluca, A. F.; Ward, A. T. J. Org. Chem.
1971, 36, 3838-3842.
16. Tull, A. G. J. Soc. Dye. Colo. 1973, 89, 132-141.
17. Ott, R.; Widmer, U.; Zolinger, H. J. Soc. Dye. Colo. 1975,
91, 330-337.
18. Hsieh, B. R.; Desilets, D.; Kazmaier, P. M. Dyes Pigm. 1990,
14, 165-189.
19. Hamada, K.; Nonogaki, H.; Fukushima, Y.; Munkhbat, B.;
Mistsuishi, M. Dyes Pigm. 1991, 16, 111-118.
20. Hamada, K.; Nishizawa, M.; Kitsuishi, M. Dyes Pigm. 1991,
16, 165-171.
21. Hamada, K.; Take, S.; Lijima, T. J. Chem. Soc, Farad.
Trans. 1986, 82, 3141-3145.
22. Asakura, T.; Ishida, M. J. Coll. Inter. Sci. 1989, 130, 184-
189.
23. Dalyner, A.; Flowers, A.; Pailithorpe, M. J. Coll. Inter. Sci.
1980, 74, 71-79.
24. Liska, M.; Bartos, L.; Valasek J. Chem. Pap. 1989, 43,
303-308.
25. Mukerjee, P.; Ghosh, A. K. J. Am. Chem. Soc. 1970, 92,
6403-6407.
26. Bergmann, K.; O’Konski, C. T. J. Phys. Chem. 1963, 67,
2169-2177.
27. Braswell, E. J. Phys. Chem. 1967, 72, 2477-2483.
28. Kubista, M.; Sjoback, R.; Nygren, J. Anal. Chim. Acta 1995,
302, 121-125.
29. Kubista, M.; Nygren, J.; Elbergali, A.; Sjoback, R. Crit. Rev.
Anal. Chem. 1999, 29, 1-5.
30. Kubista, M.; Sjoback, R.; Albinsson, B. Anal. Chem. 1993,
65, 994-998.
31. Scarminio, I.; Kubista, M. Anal. Chem. 1993, 65, 409-416.
32. Elbergali, A.; Nygren, J.; Kubista, M. Anal. Chim. Acta
1999, 379, 143-158.
33. Nygren, J.; Andrade, J. M.; Kubista, M. Anal. Chem. 1996,
68, 1706-1710.
34. Svanvik, N.; Nygren, J.; Westman, G.; Kubista, M. J. Am.
Chem. Soc. 2001, 123, 803-809.
35. Nygren, J.; Svanvik, N.; Kubista, M. Biopolym. 1998, 46,
39-51.
36. Nygren, J.; Elbergali, A.; Kubista, M. Anal. Chem. 1998, 70,
4841-4846.
37. Ghasemi, J.; Niazi, A.; Kubista, M.; Elbergali, A. Anal.
Chim. Acta 2002, 455, 335-342.
38. Ghasemi, J.; Ahmadi, Sh.; Kubista, M.; Forootan, A. J.
Chem. Eng. Data 2003, 48, 1178-1182.
39. Levine, L. V. Physical Chemistry; McGraw-Hill: New York,
1988.
40. Antonov, L.; Gergov, G.; Petrov, V.; Kubista, M.; Nygren, J.
Talanta 1999, 49, 99-106.
41. Ghasemi, J.; Niazi, A.; Westman, G.; Kubista, M. Talanta
2004, 62, 835-841.
42. http://www.multid.se (Accessed May 22, 2009)
43. Debye, P.; Huckel, E. Phys. Z. 1923, 24, 165-172.
44. Debye, P.; Huckel, E. Phys. Z. 1923, 24, 305-311.
Chemometric Study of Methylene Blue Association J. Chin. Chem. Soc., Vol. 56, No. 3, 2009 467

45. Patil, K.; Pawar, R.; Talap, P. Phys. Chem. Chem. Phys.
2000, 2, 4313-4317.
46. Laitinen, H. A.; Harris, W. E. Chemical Analysis; McGraw-
Hill: London, 1975.
47. Inoue, Y.; Hakushi, T. J Chem. Soc. Perkin Trans. II 1985,
935-939.
48. Ghasemi, J.; Shamsipur, M. J. Coord. Chem. 1995, 36,
183-194.
49. Ghasemi, J.; Meibody, Z. A. J. Sci. Iran 1999, 32, 158-165.
50. Ghasemi, J.; Assadpour, S. J. Chem. Thermodyn. 2007, 39,
967-971.
51. Bangash, F. K.; Manaf, A. J. Chin. Chem. Soc. 2005, 52,
489-494.
52. Wang, W. K. J. Chin. Chem. Soc. 2003, 50, 403-406.
53. Wang, W. K.; Zhou, W. Z.; Huang, W. L. J. Chin. Chem. Soc.
2003, 49, 999-1002.
468 J. Chin. Chem. Soc., Vol. 56, No. 3, 2009 Ghasemi and Miladi
Copyright © 2022 FDOKUMEN