Removal of Methylene Blue from Aqueous Solution Using Cotton Stalk: As a Bioadsorbent
21
Copyright © 2013 by Modern Scientific Press Company, Florida, USA International Journal of Modern Organic Chemistry, 2013, 2(2): 150-170 International Journal of Modern Organic Chemistry Journal homepage: www.ModernScientificPress.com/Journals/IJOrgChem.aspx ISSN: 2166-0174 Florida, USA Article Removal of Methylene Blue from Aqueous Solution Using Some New Pyrazole Derivatives Yaser A. Soliman a , M. A. Gouda b, c , Ammar N. Harmal a,* a Department of Chemistry, Faculty of Education, Amran University, Yemen b Department of Chemistry, Faculty of Science, Mansoura University, El-Gomhoria Street, Mansoura, 35516, Egypt. c Department of Chemistry, Faculty of Science and Arts, Ulla, Taibah University, KSA. * Author to whom correspondence should be addressed; E-Mail: [email protected] Article history: Received 16 September 2013, Received in revised form 30 September 2013, Accepted 3 October 2013, Published 8 October 2013. Abstract: A series of superabsorbent heterocyclic compound s based on pyrazole derivatives Incorporated Antipyrine moiety were tested for the removal of methylene blue (MB) from aqueous solutions via batch adsorption experiments. Studies concerning the factors influencing the adsorption capacities of pyrazole derivatives such as pH, adsorbent dosage, initial dye concentration, contact time, ionic strength and temperature were systematically investigated and discussed. Results of batch experiments showed that theses adsorbents exhibited high sorption capacities toward basic dyes. Experimental data were analyzed using first order kinetics, pseudo-second order kinetics and intra-particle diffusion models. It was found that kinetics followed a pseudo-second order equation. Equilibrium isotherm data were analyzed according to Langmuir and Freundlich equations. The characteristic parameters for each model have been determined. The thermodynamic parameters including ΔG°, ΔH° and ΔS° for the adsorption processes of MB on the pyrazole derivatives were also calculated, and the negative value of ΔG° indicated the spontaneous nature of adsorption. Key words: removal of methylene blue, pyrazole derivatives, Antipyrine moiety.
Transcript of Removal of Methylene Blue from Aqueous Solution Using Cotton Stalk: As a Bioadsorbent

Copyright © 2013 by Modern Scientific Press Company, Florida, USA
International Journal of Modern Organic Chemistry, 2013, 2(2): 150-170
International Journal of Modern Organic Chemistry
Journal homepage: www.ModernScientificPress.com/Journals/IJOrgChem.aspx
ISSN: 2166-0174
Florida, USA
Article
Removal of Methylene Blue from Aqueous Solution Using Some
New Pyrazole Derivatives
Yaser A. Soliman a, M. A. Goudab, c, Ammar N. Harmala,*
aDepartment of Chemistry, Faculty of Education, Amran University, Yemen
bDepartment of Chemistry, Faculty of Science, Mansoura University, El-Gomhoria Street, Mansoura,
35516, Egypt.
cDepartment of Chemistry, Faculty of Science and Arts, Ulla, Taibah University, KSA.
* Author to whom correspondence should be addressed; E-Mail: [email protected]
Article history: Received 16 September 2013, Received in revised form 30 September 2013, Accepted
3 October 2013, Published 8 October 2013.
Abstract: A series of superabsorbent heterocyclic compound s based on pyrazole derivatives
Incorporated Antipyrine moiety were tested for the removal of methylene blue (MB) from
aqueous solutions via batch adsorption experiments. Studies concerning the factors
influencing the adsorption capacities of pyrazole derivatives such as pH, adsorbent dosage,
initial dye concentration, contact time, ionic strength and temperature were systematically
investigated and discussed. Results of batch experiments showed that theses adsorbents
exhibited high sorption capacities toward basic dyes. Experimental data were analyzed using
first order kinetics, pseudo-second order kinetics and intra-particle diffusion models. It was
found that kinetics followed a pseudo-second order equation. Equilibrium isotherm data
were analyzed according to Langmuir and Freundlich equations. The characteristic
parameters for each model have been determined. The thermodynamic parameters including
ΔG°, ΔH° and ΔS° for the adsorption processes of MB on the pyrazole derivatives were also
calculated, and the negative value of ΔG° indicated the spontaneous nature of adsorption.
Key words: removal of methylene blue, pyrazole derivatives, Antipyrine moiety.
Int. J. Modern Org. Chem. 2013, 2(2): 150-170
Copyright © 2013 by Modern Scientific Press Company, Florida, USA
151
1. Introduction
In recent years, pollution from dye wastewater has become a serious environmental problem due
to the vast and increasing uses of a variety of dyes [1-4]. Methylene blue (MB) is the most commonly
used substance for dying cotton, wood and silk. It can cause eye burns which may be responsible for
permanent injury to the eyes of human and animals. On inhalation, it can give rise to short periods of
rapid or difficult breathing while ingestion through the mouth produces a burning sensation and may
cause nausea, vomiting, profuse sweating, mental confusion and methemoglobinemia [5–7]. Numerous
approaches have been applied for removal of dyes from wastewater such as biological treatment [8],
coagulation/flocculation [9], ozone treatment [10], chemical oxidation [11], membrane filtration [12],
ion exchange [13], photo catalytic degradation [14] and adsorption [15], have been developed to remove
these compound s from colored effluents. Amongst the numerous techniques of dye removal, adsorption
is a well-known equilibrium separation process and an effective method for water decontamination
applications [16–19].
Nowadays, development of new adsorbents having superior properties such as high adsorption
capacity, fast adsorption rate, and mechanical strength has generated great interests for wastewater
treatment. Using of several heterocyclic compound s having different functional groups has gained great
importance due to their high adsorption capacities, especially regeneration abilities and reuse for
continuous processes. Pyrazole derivatives is chemically known as 4-((3-amino-5-methyl-1H-pyrazol-
4-yl)diazenyl)-1,5-dimethyl-2-phenyl-1H-pyrazol-3(2H)-one.[20],1,5-dimethyl-4-((E)-(5-methyl-3-
((E)-(2-oxo-2-phenyl-1-thiocyanatoethyl) diazenyl)-1H-pyrazol-4-yl)diazenyl)-2-phenyl-1H-pyrazol-
3(2H)-one [20] and 4-((3-(5-Benzoyl-2-imino-1,3,4-thiadiazol-3(2H)-yl)-5-methyl-1H-pyrazol-4-
yl)diazenyl)-1,5-dimethyl-2-phenyl-1H-pyr-azol-3(2H)-one [20] in scheme (1). It are used in the
treatment of antitumor, cytotoxic and antioxidant [20].
The official method [21-23] recommends UV-spectrophotometric measurement of aqueous
solution of (MB) at about 662nm, Ultra-violet spectrophotometry[24,25], fluorimetry [26], chemi-
luminescence spectrometry [27], ion-selective electrode-based potentiometry [28], polarography [29],
high-performance liquid chromatography (HPLC)[30–22], gas chromatography (GC)[33], liquid
chromatography–mass spectrophotometry [34], gas chromatography–mass spectrophotometry[35]and
affinity chromatography[36] have been employed for determining (MB) in Aqueous Solutions. Many of
these techniques are deficient in simplicity, cost-effectiveness and easy access.
The most widely used technique for the assay of (MB) in Aqueous Solutions has been UV-Vis
spectrophotometry. To our best knowledge, there is no literature focusing on the use of pyrazoles
attached to antipyrine moiety for the removal of MB from aqueous solutions so the objective of this
work is to develop ring of pyrazoles that contain different amounts of azo groups as a potential effective
Int. J. Modern Org. Chem. 2013, 2(2): 150-170
Copyright © 2013 by Modern Scientific Press Company, Florida, USA
152
adsorbents to remove MB from aqueous solution attributing to their following unique properties: (i) azo
groups increase mechanic strength to enhance the usable life. Moreover, the ring pyrazoles provide much
larger specific surface area. The raw materials are low-cost and the synthetic approach is simple, which
make these heterocyclic compounds potential commercializable. (iii) These heterocyclic compounds do
not cause environmental pollution during the course of treatment. Indicating that pyrazoles attached to
antipyrine moiety can be used as effective and practical heterocyclic compound s adsorbents.
2. Experimental
2.1. Materials and Instruments
The pH measurements were made using a pH meter (Model 744, Metrohm). The concentrations
of methylene blue were analyzed using UV-Vis spectrophotometer (SHIMADZUE, Japan) provided
with 1-cm matched quartz cells were used for absorbance measurements. The adsorbents were weighed
using analytical balance. Water bath shaker was used for adsorption experiments. All chemicals used in
the experiment were of analytical reagent grade and distilled water was used to prepare the solutions.
All chemicals were of analytical grade and used as received, compound (1) is: 4-((3-amino-5-
methyl-1H-pyrazol-4-yl)diazenyl)-1,5-dimethyl-2-phenyl-1H-pyrazol-3(2H)-one.[20], compound (2)
is: 1,5-dimethyl-4-((E)-(5-methyl-3-((E)-(2-oxo-2-phenyl-1-thiocyanatoethyl) diazenyl)-1H-pyrazol-4-
yl)diazenyl)-2-phenyl-1H-pyrazol-3(2H)-one. [20] and compound (3) is: 4-((3-(5-Benzoyl-2-imino-
1,3,4-thiadiazol-3(2H)-yl)-5-methyl-1H-pyrazol-4-yl)diazenyl)-1,5-dimethyl-2-phenyl-1H-pyr-azol-
3(2H)-one prepared in Chemistry department, Faculty of science, Mansoura University, Mansoura,
Egypt [20].
Methylene blue was purchased from Nile-Aldrich. A stock solution of methylene blue was
prepared by dissolving the powder in distilled water. The working solutions of different initial
concentrations of methylene blue were prepared by appropriate dilution of the stock solution. The
required pH adjustments were made with buffer solutions. For pH 2–3, H3PO4/NaOH buffer solutions
were used. The CH3COOH/CH3COONa buffer solutions were used to adjust pH in the range of 4–6,
while Na2HPO4/NaH2PO4 buffer solutions were used for pH 7–10. All required solutions were prepared
using deionized water, provided from a Milli-Q (Millipore, Bedford, MA, USA) purification system.
CH3COOH, Na2HPO4, NaH2PO4, H3PO4, NaCl, HCl and NaOH were purchased from nile-Aldrich and
used without further purification. Other chemicals such as NaOH are commercially available and used
without further purification.
2.2. Procedure

Int. J. Modern Org. Chem. 2013, 2(2): 150-170
Copyright © 2013 by Modern Scientific Press Company, Florida, USA
153
Batch sorption experiments were done by shaking 0.02 g of pyrazole derivatives with 50 ml
aqueous solution of methylene blue in 250 ml-Erlenmeyer flasks placed in a temperature controlled
shaking water bath at concentrations (1000 ppm), pHs (between 2 and 12), ionic strength (between 0.005
and 0.3 mole/l) and temperatures (between 25 and 45 ºC) at a constant shaking rate of 125 rpm. The
absorbance of the resulting color was measured against the reagent blank at 662nm.
2.3. Adsorption Equilibrium Studies
The amounts of dye removed by sorbents qe and percent extracted %E can be calculated using
the following equations:
𝑞𝑒 = (𝐶ₒ−𝐶𝑒)𝑉
𝑚 (1)
% 𝐸 = (𝐶ₒ−𝐶𝑒)
𝐶ₒ × 100 (2)
Where qe is the amount of dye adsorbed (mg/g). Cₒ and Ce are the initial and equilibrium liquid-phase
concentrations of dye (mg/g), respectively. V is the volume of the solution (l), and m is the weight of
the sorbent used (g).
2.4. Adsorption Kinetic Studies
The adsorption kinetics of methylene blue onto pyrazole derivatives were measured at one
initial concentrations of MB, (1000 ppm) for pyrazole derivatives. 50 ml of aqueous methylene blue
solutions was introduced into a 100 ml conical flask and mixed with 0.02 g of the adsorbents. The
solution was stirred continuously at 25 °C and samples were taken from the solution by fast filtration at
different time intervals. The concentration of methylene blue in the residual solution was analyzed
spectrophotometrically using UV-Vis spectrophotometer at wavelength 662 nm and the amount of
adsorption qt was calculated according to equation (1).
3. Results and Discussion
3.1. Effect of Contact Time on Adsorption
Contact time is an important parameter of adsorption which can reflect the adsorption kinetics of
pyrazole derivatives for MB solution. Figure 1 shows the effect of contact time on the adsorption
capacity of pyrazole derivatives for MB. It is clear that the adsorption capacity of pyrazole derivatives
increased rapidly with the increase of contact time from 0 to 35 min and more than 90% of the equilib-
rium adsorption capacity for MB occurred within 30 min. After 60 min, the adsorption capacity became

Int. J. Modern Org. Chem. 2013, 2(2): 150-170
Copyright © 2013 by Modern Scientific Press Company, Florida, USA
154
constant and the adsorption reached equilibrium. Therefore, 60 min was selected as the contact time for
the adsorption of MB onto the composites under our experimental conditions.
Fig. 1. Effect of the contact time on adsorption capacity of Compound (1), Compound (2) and
Compound (3) at one concentrations 1000 ppm for MB. (Conditions: T=25°C; adsorbent dose = 0.02
g/50 ml; pH= 7).
As shown, the adsorption process was divided into three stages: (1) an initial stage with
adsorption occurring instantly, (2) subsequently slow adsorption, and (3) a final stage with adsorption
reaching equilibrium and remaining constant. The first stage can be attributed to the rapid attachment of
MB to the rings of the pyrazole derivatives by surface mass transfer, high electric density in rings and
high resonance in compound s. At this stage, more than 80% of MB adsorption was found in all cases.
The second stage was slower, possibly because many of the available external sites was already occupied
and because of the slow diffusion of MB molecules into the network of the pyrazole derivatives. An
asymptotic trend was found after approximately 30 min regardless of the initial MB concentration
applied to the adsorption system. The amount adsorbed did not vary significantly at contact times longer
than the equilibrium time (60 min). The kinetics of the adsorption process indicates that the adsorption
of MB onto the pyrazole derivatives can be considered as a fast adsorption process because more than
80% of MB was adsorbed within 30 min especially at MB concentration lower than the maximum
adsorbed. Such finding reveals the benefits of using this low-cost adsorbent or so-called eco-adsorbent,
for the treatment of wastewaters rich in dyes in general and MB in particular.
3.2. Effect of Ionic Strength
Int. J. Modern Org. Chem. 2013, 2(2): 150-170
Copyright © 2013 by Modern Scientific Press Company, Florida, USA
155
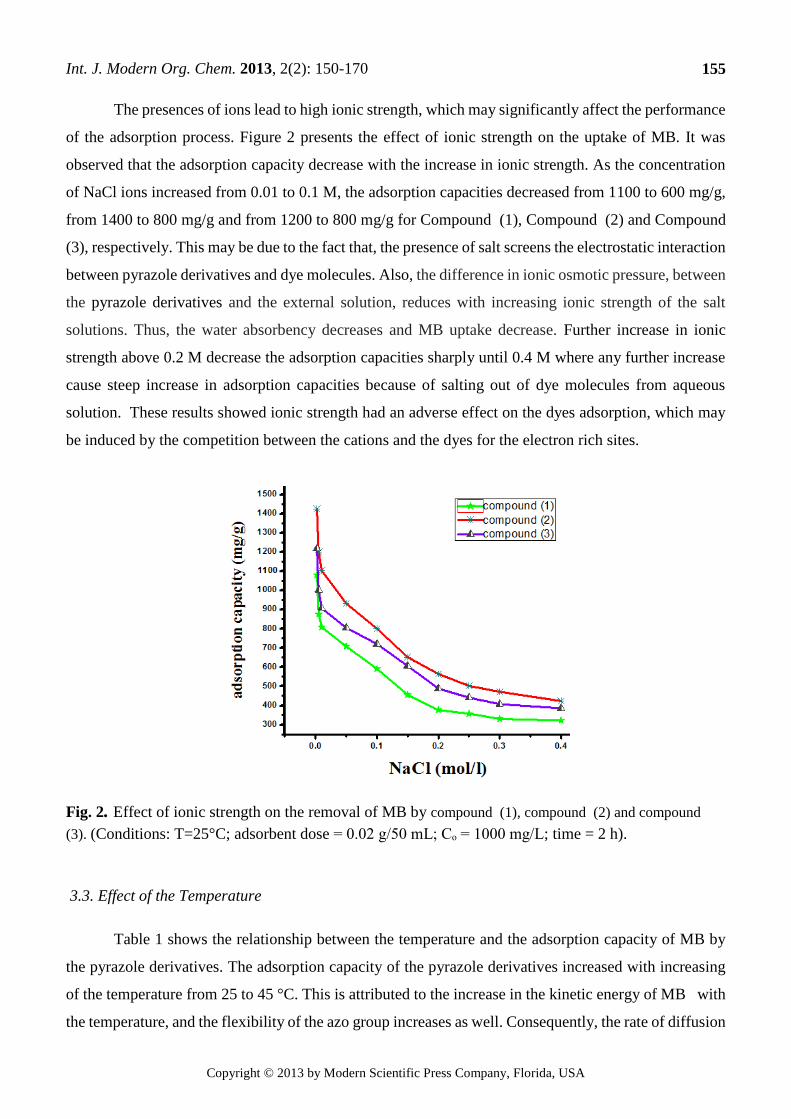
The presences of ions lead to high ionic strength, which may significantly affect the performance
of the adsorption process. Figure 2 presents the effect of ionic strength on the uptake of MB. It was
observed that the adsorption capacity decrease with the increase in ionic strength. As the concentration
of NaCl ions increased from 0.01 to 0.1 M, the adsorption capacities decreased from 1100 to 600 mg/g,
from 1400 to 800 mg/g and from 1200 to 800 mg/g for Compound (1), Compound (2) and Compound
(3), respectively. This may be due to the fact that, the presence of salt screens the electrostatic interaction
between pyrazole derivatives and dye molecules. Also, the difference in ionic osmotic pressure, between
the pyrazole derivatives and the external solution, reduces with increasing ionic strength of the salt
solutions. Thus, the water absorbency decreases and MB uptake decrease. Further increase in ionic
strength above 0.2 M decrease the adsorption capacities sharply until 0.4 M where any further increase
cause steep increase in adsorption capacities because of salting out of dye molecules from aqueous
solution. These results showed ionic strength had an adverse effect on the dyes adsorption, which may
be induced by the competition between the cations and the dyes for the electron rich sites.
Fig. 2. Effect of ionic strength on the removal of MB by compound (1), compound (2) and compound
(3). (Conditions: T=25°C; adsorbent dose = 0.02 g/50 mL; Cₒ = 1000 mg/L; time = 2 h).
3.3. Effect of the Temperature
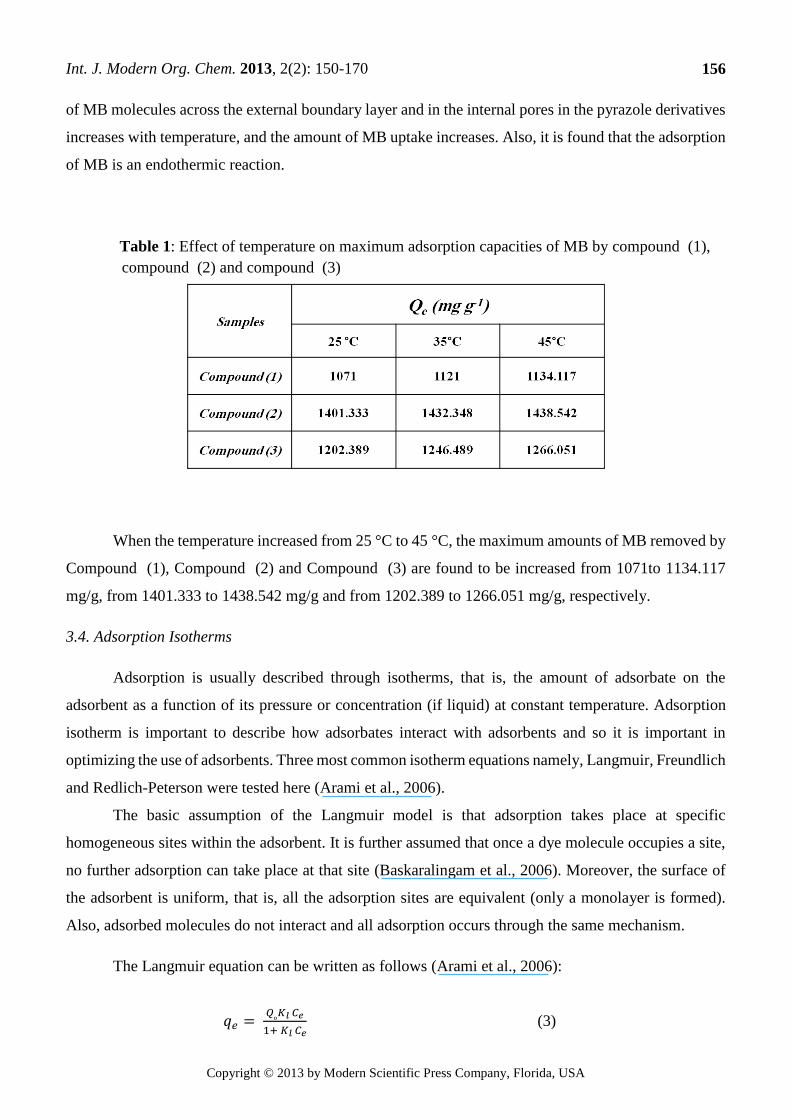
Table 1 shows the relationship between the temperature and the adsorption capacity of MB by
the pyrazole derivatives. The adsorption capacity of the pyrazole derivatives increased with increasing
of the temperature from 25 to 45 °C. This is attributed to the increase in the kinetic energy of MB with
the temperature, and the flexibility of the azo group increases as well. Consequently, the rate of diffusion
Int. J. Modern Org. Chem. 2013, 2(2): 150-170
Copyright © 2013 by Modern Scientific Press Company, Florida, USA
156
of MB molecules across the external boundary layer and in the internal pores in the pyrazole derivatives
increases with temperature, and the amount of MB uptake increases. Also, it is found that the adsorption
of MB is an endothermic reaction.
Table 1: Effect of temperature on maximum adsorption capacities of MB by compound (1),
compound (2) and compound (3)
When the temperature increased from 25 °C to 45 °C, the maximum amounts of MB removed by
Compound (1), Compound (2) and Compound (3) are found to be increased from 1071to 1134.117
mg/g, from 1401.333 to 1438.542 mg/g and from 1202.389 to 1266.051 mg/g, respectively.
3.4. Adsorption Isotherms
Adsorption is usually described through isotherms, that is, the amount of adsorbate on the
adsorbent as a function of its pressure or concentration (if liquid) at constant temperature. Adsorption
isotherm is important to describe how adsorbates interact with adsorbents and so it is important in
optimizing the use of adsorbents. Three most common isotherm equations namely, Langmuir, Freundlich
and Redlich-Peterson were tested here (Arami et al., 2006).
The basic assumption of the Langmuir model is that adsorption takes place at specific
homogeneous sites within the adsorbent. It is further assumed that once a dye molecule occupies a site,
no further adsorption can take place at that site (Baskaralingam et al., 2006). Moreover, the surface of
the adsorbent is uniform, that is, all the adsorption sites are equivalent (only a monolayer is formed).
Also, adsorbed molecules do not interact and all adsorption occurs through the same mechanism.
The Langmuir equation can be written as follows (Arami et al., 2006):
𝑞𝑒 = 𝑄ₒ𝐾𝑙 𝐶𝑒
1+ 𝐾𝑙 𝐶𝑒 (3)

Int. J. Modern Org. Chem. 2013, 2(2): 150-170
Copyright © 2013 by Modern Scientific Press Company, Florida, USA
157
Where qe is the amount of dye adsorbed on pyrazoles at equilibrium (mg/g), Q0 is the maximum
adsorption capacity (mg/g), KL is the Langmuir constant, and Ce is the concentration of dye solution at
equilibrium (mg/L).
The linear form of Langmuir equation is:
𝐶𝑒
𝑞𝑒=
1
𝑄ₒ𝐾𝑙+
𝐶𝑒
𝑄ₒ (4)
The monolayer adsorption capacity, Q and the Langmuir constant Kl can be obtained from the linear plot
of Ce/qe against Ce.
An essential characteristic of Langmuir isotherm can be expressed by a dimensionless constant
called equilibrium parameter, RL (Webi and Chakravort, 1974), defined by:
𝑅𝑙 = 1
1 + 𝐾𝑙𝐶ₒ
Where C0 is the highest initial dye concentration (mg/L), RL values indicate the type of isotherm to be
either unfavorable (RL> 1), linear (Rl= 1), favorable (0<RL< 1) or irreversible (RL = 0) (McKay, 1982).
The Freundlich equation is basically empirical equation and employed to describe heterogeneous
systems. The isotherm assumes that adsorbent surface sites have a spectrum of different binding energies
(Baskaralingam et al., 2006).
The Freundlich equation is given by (Arami et al., 2006):
𝑞𝑒 = 𝐾𝑓 𝐶𝑒
1𝑛
Where KF is the Freundlich constant which is a comparative measure of the adsorption capacity of the
adsorbent, and n is an empirical constant which gives valuable information about the isotherm shape.
1/n values indicate the type of isotherm to be irreversible (1/n = 0), favorable (0< 1/n< 1) and unfavorable
(1/n> 1).
The Freundlich parameters can be obtained from the following linearized equation:
ln 𝑞𝑒 = ln 𝐾𝑓 + 1
𝑛ln 𝐶𝑒
By linear plotting ln qe as the function of ln Ce, the values of Kf and n can be obtained from the
slope and the intercept of the plot.
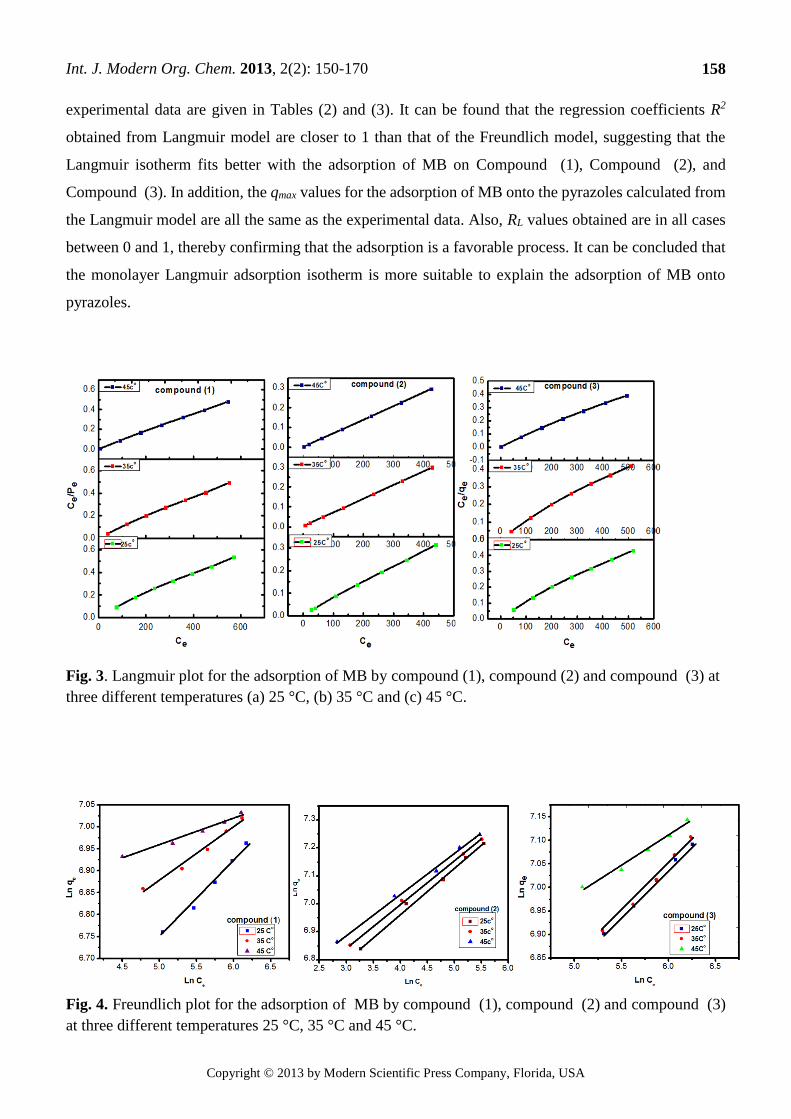
Figures (3) and (4) shows the linear plot of Langmuir and Freundlich isotherms for adsorption of
MB on pyrazoles. The model parameters obtained by applying Langmuir and Freundlich models to the
Int. J. Modern Org. Chem. 2013, 2(2): 150-170
Copyright © 2013 by Modern Scientific Press Company, Florida, USA
158
experimental data are given in Tables (2) and (3). It can be found that the regression coefficients R2
obtained from Langmuir model are closer to 1 than that of the Freundlich model, suggesting that the
Langmuir isotherm fits better with the adsorption of MB on Compound (1), Compound (2), and
Compound (3). In addition, the qmax values for the adsorption of MB onto the pyrazoles calculated from
the Langmuir model are all the same as the experimental data. Also, RL values obtained are in all cases
between 0 and 1, thereby confirming that the adsorption is a favorable process. It can be concluded that
the monolayer Langmuir adsorption isotherm is more suitable to explain the adsorption of MB onto
pyrazoles.
Fig. 3. Langmuir plot for the adsorption of MB by compound (1), compound (2) and compound (3) at
three different temperatures (a) 25 °C, (b) 35 °C and (c) 45 °C.
Fig. 4. Freundlich plot for the adsorption of MB by compound (1), compound (2) and compound (3)
at three different temperatures 25 °C, 35 °C and 45 °C.
Int. J. Modern Org. Chem. 2013, 2(2): 150-170
Copyright © 2013 by Modern Scientific Press Company, Florida, USA
159
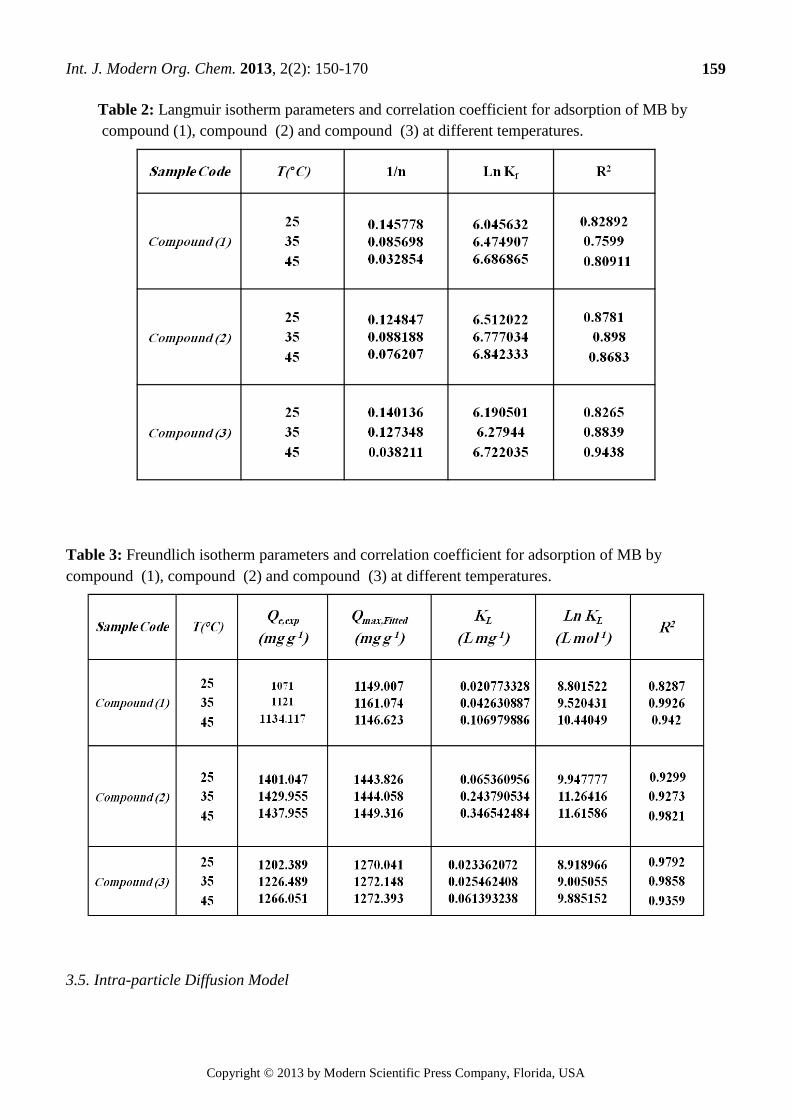
Table 2: Langmuir isotherm parameters and correlation coefficient for adsorption of MB by
compound (1), compound (2) and compound (3) at different temperatures.
Table 3: Freundlich isotherm parameters and correlation coefficient for adsorption of MB by
compound (1), compound (2) and compound (3) at different temperatures.
3.5. Intra-particle Diffusion Model
Int. J. Modern Org. Chem. 2013, 2(2): 150-170
Copyright © 2013 by Modern Scientific Press Company, Florida, USA
160
Adsorption is a multi-step process involving transport of solute molecules from the aqueous
phase to the surface of the solid particles of adsorbent, and then diffusion of the solute molecules into
the interior of the pores, which is likely to be a slow process, and is therefore, rate determining. The
intra-particle diffusion parameter, 𝐾𝑝 (mmol.g-1 h-0.5) is defined by equation
𝑞𝑡 = 𝐾𝑝 𝑡0.5 + 𝐶 (5)
Where kp is the intra-particle diffusion rate constant (mmol.g-1 h-0.5) and C is a constant. According to
this model qt versus t0.5 should be linear if intra-particle diffusion is involved in the adsorption process
[50]. From Eq. (5), if pore diffusion is the rate limiting step, then a plot of qt against t0.5 must give a
straight line with a slope that equals kp and the intercept value c represents the resistance to mass transfer
in the external liquid film.
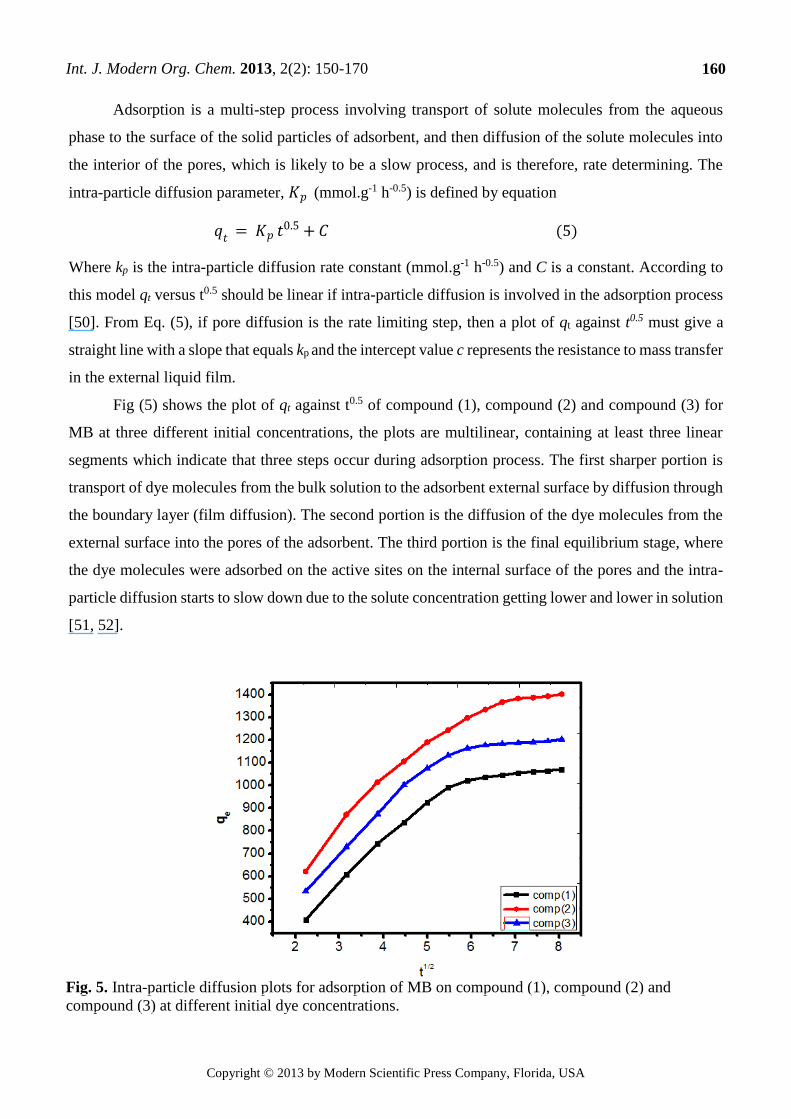
Fig (5) shows the plot of qt against t0.5 of compound (1), compound (2) and compound (3) for
MB at three different initial concentrations, the plots are multilinear, containing at least three linear
segments which indicate that three steps occur during adsorption process. The first sharper portion is
transport of dye molecules from the bulk solution to the adsorbent external surface by diffusion through
the boundary layer (film diffusion). The second portion is the diffusion of the dye molecules from the
external surface into the pores of the adsorbent. The third portion is the final equilibrium stage, where
the dye molecules were adsorbed on the active sites on the internal surface of the pores and the intra-
particle diffusion starts to slow down due to the solute concentration getting lower and lower in solution
[51, 52].
Fig. 5. Intra-particle diffusion plots for adsorption of MB on compound (1), compound (2) and
compound (3) at different initial dye concentrations.

Int. J. Modern Org. Chem. 2013, 2(2): 150-170
Copyright © 2013 by Modern Scientific Press Company, Florida, USA
161
Also, the linear portions of curves did not pass through the origin, suggesting that pore diffusion
is not the step controlling the overall rate of mass transfer at beginning of adsorption.
In Table (4), the correlation coefficients (R2) for the linear segment intra-particle diffusion
model were between 0.9286 and 0.9939, indicating that the intra-particle diffusion was not the only rate
controlling step, other process could control the rate of adsorption. The boundary layer effect may
control the rate of mass transfer in the time period of the first linear segment. This conclusion could be
corroborated by the analysis of data from Boyd's model [53-55].
Table 4: Intraparticle diffusion parameters for adsorption of MB (1), compound (2) and compound (3)
at different concentrations.
The model of Boyd is expressed as:
𝐹 = 1 −6
𝜋2 exp (1 − 𝐵𝑡) (6)
Where F is the fractional attainment of equilibrium, at different times, t, and Bt is a function of F
𝐹 = 𝑞𝑡
𝑞𝑒
Where qt and qe are the dye uptake (mmol g−1) at time (t) and at equilibrium, respectively.
Eq. (6) can be rearranged to
𝐵𝑡 = −0.4977 − ln (1 − 𝐹) (7)
Fig. 6 shows the values of Bt were calculated from Eq. (7) and plotted against time t. The linearity of
this plot can provide available information to distinguish intra-particle diffusion and boundary layer
effect (film diffusion) rates of adsorption. If a plot of Bt versus t is a straight line passing through the
origin, then adsorption will fit layer effect. The plots are linear only in the initial period of adsorption

Int. J. Modern Org. Chem. 2013, 2(2): 150-170
Copyright © 2013 by Modern Scientific Press Company, Florida, USA
162
and do not pass through the origin, indicating that external mass transfer is the rate limiting process in
the beginning of adsorption and then is the intra-particle diffusion.
Fig. 6. Bt versus t plot for MB adsorption onto compound (1), compound (2) and compound (3) at
three different initial dye concentrations.
3.5. Adsorption Kinetics
3.5.1. The pseudo-first order equation and the pseudo-second order equation
In order to investigate the controlling mechanism of adsorption process of compound (1),
compound (2) and compound (3) for MB, the pseudo-first order and the pseudo-second order kinetic
models were cited to evaluate the experimental data obtained from batch MB removal experiments. The
pseudo-first order kinetic model has been widely used to predict metal adsorption kinetics. It was
suggested by Lagergren [48] for the adsorption of solid/liquid systems and its linear form can be
formulated as
log(𝑞𝑒 − 𝑞𝑡) = log 𝑞𝑒 − 𝐾1𝑡
2.303
Where qe is the adsorption uptake of copper at time t (mol g-1) and k1 (min-1) is the rate constant of the
pseudo-first-order adsorption. A plot of log (qe - qt) versus t should be linear; the parameters k1 and R2
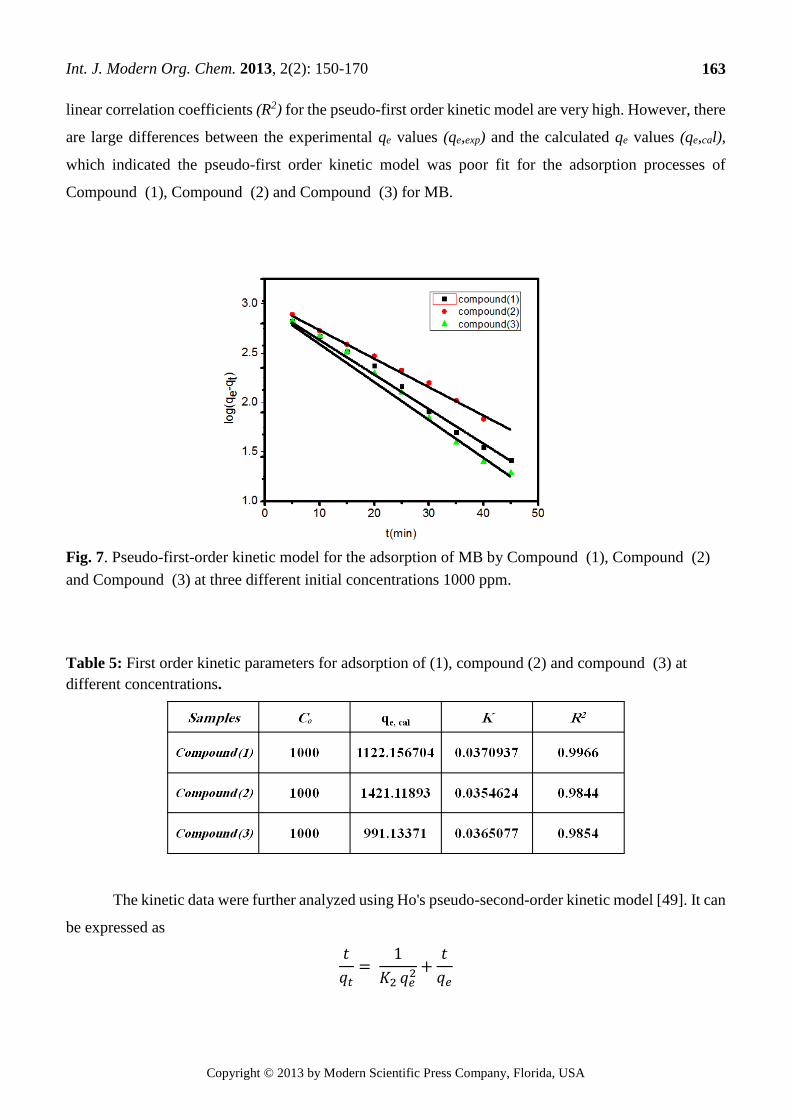
(correlation coefficient) calculated from the data (Fig. 7) are listed in Table 5. It can be seen that the
Int. J. Modern Org. Chem. 2013, 2(2): 150-170
Copyright © 2013 by Modern Scientific Press Company, Florida, USA
163
linear correlation coefficients (R2) for the pseudo-first order kinetic model are very high. However, there
are large differences between the experimental qe values (qe,exp) and the calculated qe values (qe,cal),
which indicated the pseudo-first order kinetic model was poor fit for the adsorption processes of
Compound (1), Compound (2) and Compound (3) for MB.
Fig. 7. Pseudo-first-order kinetic model for the adsorption of MB by Compound (1), Compound (2)
and Compound (3) at three different initial concentrations 1000 ppm.
Table 5: First order kinetic parameters for adsorption of (1), compound (2) and compound (3) at
different concentrations.
The kinetic data were further analyzed using Ho's pseudo-second-order kinetic model [49]. It can
be expressed as
𝑡
𝑞𝑡=
1
𝐾2 𝑞𝑒2 +
𝑡
𝑞𝑒

Int. J. Modern Org. Chem. 2013, 2(2): 150-170
Copyright © 2013 by Modern Scientific Press Company, Florida, USA
164
Where k2 (g mol-1 min-1) is the rate constant of pseudo-second-order adsorption. Fig. 8 shows the plot
of t/q versus t for MB onto compound (1), compound (2) and compound (3). It can be observed from
Table 6 that R2 for the pseudo-second order kinetic model are all over 0.9994. These suggested that the
adsorption processes of compound (1), compound (2) and compound (3) for MB can be well described
by the pseudo-second order kinetic model.
Fig. 8. Pseudo-second-order kinetic model for the adsorption of MB by compound (1), compound (2)
and compound (3) at three different initial concentrations 1000 ppm.
Table 6: Second order kinetic parameters for adsorption of MB by compound (1), compound (2) and
compound (3) at different concentrations.
3.6. Thermodynamic Study
The data obtained from the temperature study were used for thermodynamic analysis.
Thermodynamics analysis focused on the Gibbs free energy, which is presented in Eq. (8). The Gibbs
Int. J. Modern Org. Chem. 2013, 2(2): 150-170
Copyright © 2013 by Modern Scientific Press Company, Florida, USA
165
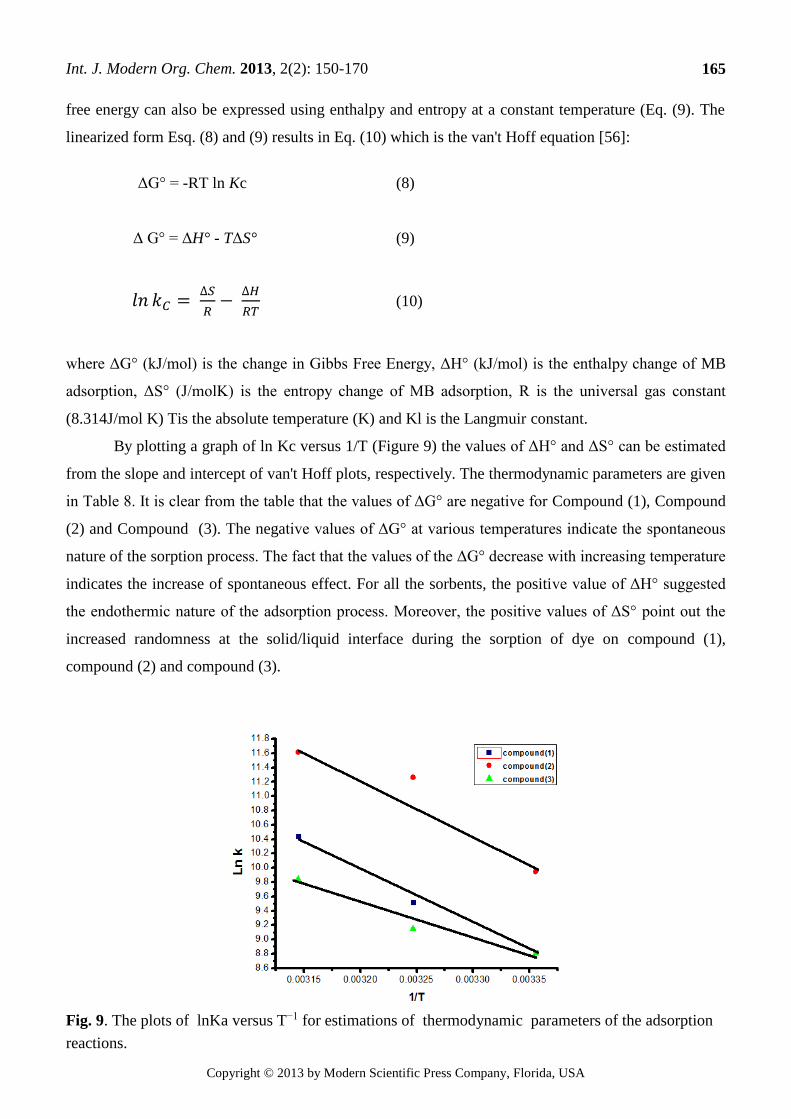
free energy can also be expressed using enthalpy and entropy at a constant temperature (Eq. (9). The
linearized form Esq. (8) and (9) results in Eq. (10) which is the van't Hoff equation [56]:
ΔG° = -RT ln Kc (8)
Δ G° = ΔH° - TΔS° (9)
𝑙𝑛 𝑘𝐶 = ∆𝑆
𝑅−
∆𝐻
𝑅𝑇 (10)
where ΔG° (kJ/mol) is the change in Gibbs Free Energy, ΔH° (kJ/mol) is the enthalpy change of MB
adsorption, ΔS° (J/molK) is the entropy change of MB adsorption, R is the universal gas constant
(8.314J/mol K) Tis the absolute temperature (K) and Kl is the Langmuir constant.
By plotting a graph of ln Kc versus 1/T (Figure 9) the values of ΔH° and ΔS° can be estimated
from the slope and intercept of van't Hoff plots, respectively. The thermodynamic parameters are given
in Table 8. It is clear from the table that the values of ΔG° are negative for Compound (1), Compound
(2) and Compound (3). The negative values of ΔG° at various temperatures indicate the spontaneous
nature of the sorption process. The fact that the values of the ΔG° decrease with increasing temperature
indicates the increase of spontaneous effect. For all the sorbents, the positive value of ΔH° suggested
the endothermic nature of the adsorption process. Moreover, the positive values of ΔS° point out the
increased randomness at the solid/liquid interface during the sorption of dye on compound (1),
compound (2) and compound (3).
Fig. 9. The plots of lnKa versus T−1 for estimations of thermodynamic parameters of the adsorption
reactions.

Int. J. Modern Org. Chem. 2013, 2(2): 150-170
Copyright © 2013 by Modern Scientific Press Company, Florida, USA
166
4. Conclusion
The result of the present study reveals that some new pyrazole derivatives attached to antipyrine
moiety can be used as effective and practical heterocyclic compounds adsorbents based on polarization
of carbonyl groups, the ring pyrazoles provide much larger specific surface area and azo groups increase
mechanic strength to enhance the usable life may be an extremely viable adsorbent for application in the
treatment of water and industrial wastewater contaminated with dyes. The amount of MB adsorbed was
found to increase with increasing the carbonyl groups and azo groups. Moreover, the adsorption of MB
was dependent on initial concentration, reaction temperature and pH. The MB adsorption capacity
increased with the increase of pH in the range of 3–8, where ionization of carbonyl group occurs. The
adsorption of MB onto the pyrazole derivatives reached equilibrium within about 60 min. The adsorption
equilibrium could be well described by Langmuir adsorption isotherms, namely monolayer adsorption
on a homogenous surface. The adsorption kinetics followed a pseudo-second order kinetic model and
intra-particle diffusion was involved in the adsorption process. Thermodynamic results indicated that
the adsorption process was spontaneous and endothermic in nature.
References
[1] R. Sanghi, B. Bhatttacharya, V. Singh, Cassia angustifolia seed gum as an effective natural
coagulant for decolourisation of dye solutions. Green. Chem. 2002, 4: 252-254.
[2] C. Namasivayam, D. Arasi, Removal of congo red from wastewater by adsorption onto waste red
mud. Chemosphere. 1997, 34: 401- 417.
[3] A.U. Moozyckine, D.M. Davies, Green S as a prototype for an environmentally-degradable dye:
the concept of a ‘green dye’in future Green Chemistry. Green. Chem. 2002, 4: 452-458.
[4] S. Akhtar, A.A. Khan, Q. Husain, Potential of immobilized bitter gourd (Momordica charantia)
peroxidases in the decolorization and removal of textile dyes from polluted wastewater and dyeing
effluent. Chemosphere. 2005, 60: 291- 301.
[5] D. Ghosh, K.G. Bhattacharyya, Adsorption of methylene blue on kaolinite. Appl. C. Sci. 2002, 20:
295- 300.
[6] I. Tan, A.L. Ahmad, B. Hameed, Adsorption of basic dye on high-surface-area activated carbon
prepared from coconut husk: Equilibrium, kinetic and thermodynamic studies. J. haza. mate. 2008,
154: 337- 346.
[7] I. Tan, A. Ahmad, B. Hameed, and adsorption of basic dye using activated carbon prepared from
oil palm shell: batch and fixed bed studies. Desalination. 2008: 13-28.
Int. J. Modern Org. Chem. 2013, 2(2): 150-170
Copyright © 2013 by Modern Scientific Press Company, Florida, USA
167
[8] M. Kornaros, G. Lyberatos, Biological treatment of wastewaters from a dye manufacturing
company using a trickling filter. J. haza. mate. 2006, 136: 95-102.
[9] E. Guibal, J. Roussy, Coagulation and flocculation of dye-containing solutions using a biopolymer
(Chitosan). Reac. Func. poly. 2007, 67: 33- 42.
[10] W. Zhao, Z. Wu, D. Wang, Ozone direct oxidation kinetics of Cationic Red X-GRL in aqueous
solution. J .haza. mate. 2006, 137: 1859-1865.
[11] K. Dutta, S. Mukhopadhyay, S. Bhattacharjee, B. Chaudhuri, Chemical oxidation of methylene
blue using a Fenton-like reaction. J .haza. mate. 2001, 84: 57- 71.
[12] G. Capar, U. Yetis, L. Yilmaz, Membrane based strategies for the pre-treatment of acid dye bath
wastewaters. J .haza. mate. 2006, 135: 423- 430.
[13] C.H. Liu, J.S. Wu, H.C. Chiu, S.Y. Suen, K.H. Chu, Removal of anionic reactive dyes from water
using anion exchange membranes as adsorbers, Wat. rese. 2007, 41: 1491- 1500.
[14] M. Muruganandham, M. Swaminathan, TiO2-UV photocatalytic oxidation of Reactive Yellow.
14: Effect of operational parameters. J .haza. mate. 2006, 135: 78-86.
[15] R. De Lisi, G. Lazzara, S. Milioto, N. Muratore, Adsorption of a dye on clay and sand. Use of
cyclodextrins as solubility-enhancement agents. Chemosphere. 2007, 69: 1703- 1712.
[16] A. Dabrowski, Adsorption--from theory to practice, Adv. Coll. Inter. Sci. 2001, 69: 135- 224.
[17] A. Ahmad, M. Rafatullah, M. Danish, Sorption studies of Zn (II)-and Cd (II) ions from aqueous
solution on treated sawdust of sissoo wood, European Journal of Wood and Wood Products. 2007,
65: 429- 436.
[18] A. Ahmad, M. Rafatullah, O. Sulaiman, M.H. Ibrahim, Y.Y. Chii, B.M. Siddique, Removal of Cu
(II) and Pb (II) ions from aqueous solutions by adsorption on sawdust of Meranti wood,
Desalination. 2009, 247: 636-646.
[19] M. Rafatullah, O. Sulaiman, R. Hashim, A. Ahmad, Adsorption of copper (II), chromium (III),
nickel (II) and lead (II) ions from aqueous solutions by meranti sawdust, J .haza. mate. 2009, 170:
969- 977.
[20] B.F. Senkal, E. Yavuz, Preparation of poly (vinyl pyrrolidone) grafted sulfonamide based
polystyrene resin and its use for the removal of dye from water, Polymers for advanced
technologies. 2006, 17: 928- 931.
[21] A. Hashem, E. Abdel-Halim, H. Sokker, Bi-functional starch composites prepared by γ-irradiation
for removal of anionic and cationic dyes from aqueous solutions, Polymer-Plastics Technology
and Engineering. 2007, 46: 71-77.
[22] R.B. Thompson, V.V. Ginzburg, M.W. Matsen, A.C. Balazs, Predicting the mesophases of
copolymer-nanoparticle composites, Science. 2001, 292: 2469-2472.
Int. J. Modern Org. Chem. 2013, 2(2): 150-170
Copyright © 2013 by Modern Scientific Press Company, Florida, USA
168
[23] A.C. Balazs, T. Emrick, T.P. Russell, Nanoparticle polymer composites: where two small worlds
meet, Science. 2006, 314: 1107-1110.
[24] S.A. Meenach, K.W. Anderson, J.Z. Hilt, Hydrogel Nanocomposites: Biomedical Applications,
Biocompatibility, and Toxicity Analysis, Safety of Nanoparticles. 2009: 1-27.
[25] N. Degirmenbasi, D.M. Kalyon, E. Birinci, Biocomposites of nanohydroxyapatite with collagen
and poly (vinyl alcohol), Colloids and Surfaces B: Biointerfaces.2006, 48:42-49.
[26] R.A. Frimpong, S. Fraser, J. Zach Hilt, Synthesis and temperature response analysis of magnetic‐
hydrogel nanocomposites, Journal of Biomedical Materials Research Part A. 2007, 80: 1-6.
[27] S.A. Meenach, A.A. Anderson, M. Suthar, K.W. Anderson, J.Z. Hilt, Biocompatibility analysis of
magnetic hydrogel nanocomposites based on poly (N‐isopropylacrylamide) and iron oxide,
Journal of Biomedical Materials Research Part A. 2009, 91: 903-909.
[28] A. Okada, A. Usuki, Twenty Years of Polymer‐Clay Nanocomposites, Macromolecular Materials
and Engineering. 2006, 291: 1449-1476.
[29] D. Zhang, M.A. Kandadai, J. Cech, S. Roth, S.A. Curran, Poly (L-lactide)(PLLA)/multiwalled
carbon nanotube (MWCNT) composite: characterization and biocompatibility evaluation, The
Journal of Physical Chemistry B. 2006, 110: 12910-12915.
[30] N.S. Satarkar, D. Biswal, J.Z. Hilt, Hydrogel nanocomposites: a review of applications as remote
controlled biomaterials, Soft Matter. 2010, 6: 2364- 2371.
[31] G. Xie, Q. Zhang, Z. Luo, M. Wu, T. Li, Preparation and characterization of monodisperse
magnetic poly (styrene butyl acrylate methacrylic acid) microspheres in the presence of a polar
solvent, Journal of applied polymer science. 2003, 87: 1733- 1738.
[32] S. Sieben, C. Bergemann, A. Lubbe, B. Brockmann, D. Rescheleit, Magn Mater, ChemPort, Web
of Science® Times Cited. 2001, 40:175-225.
[33] D. Tanyolaç, A.R. Özdural, BSA adsorption onto magnetic polyvinylbutyral microbeads, Journal
of applied polymer science. 2001, 80: 707-715.
[34] B.H. Pyle, S.C. Broadaway, G.A. McFeters, Sensitive Detection of Escherichia coliO157: H7 in
Food and Water by Immunomagnetic Separation and Solid-Phase Laser Cytometry, Applied and
Environmental Microbiology. 1999, 65: 1966-1972.
[35] I. Avital, Inderbitzin D, Aoki T, Tyan DB, Cohen AH, Ferraresso C, Rozga J, Arnaout WS,
Demetriou AA. Isolation, characterization, and transplantation of bone marrow-derived hepatocyte
stem cells, Biochem Biophys Res Commun. 2001, 288: 156-164.
[36] L. Cumbal, J. Greenleaf, D. Leun, A.K. SenGupta, Polymer supported inorganic nanoparticles:
characterization and environmental applications, Reactive and functional polymers. 2003, 54: 167-
180.
Int. J. Modern Org. Chem. 2013, 2(2): 150-170
Copyright © 2013 by Modern Scientific Press Company, Florida, USA
169
[37] Y. Lee, J. Rho, B. Jung, Preparation of magnetic ion‐exchange resins by the suspension
polymerization of styrene with magnetite, Journal of applied polymer science. 2003, 89: 2058-
2067.
[38] B. Hameed, Removal of cationic dye from aqueous solution using jackfruit peel as non-
conventional low-cost adsorbent, J .haza. mate. 2009, 162: 344- 350.
[39] Y. Bulut, H. Aydın, A kinetics and thermodynamics study of methylene blue adsorption on wheat
shells, Desalination. 2006, 194: 259-267.
[40] Y.S. Ho, T.H. Chiang, Y.M. Hsueh, Removal of basic dye from aqueous solution using tree fern
as a biosorbent, Process Biochemistry. 2005, 40: 119-124.
[41] M. Doğan, M. Alkan, Ö. Demirbaş, Y. Özdemir, C. Özmetin, Adsorption kinetics of maxilon blue
GRL onto sepiolite from aqueous solutions, Chemical Engineering Journal. 2006, 124: 89-101.
[42] V. Garg, M. Amita, R. Kumar, R. Gupta, Basic dye (methylene blue) removal from simulated
wastewater by adsorption using Indian Rosewood sawdust: a timber industry waste, Dyes and
pigments. 2004, 63: 243-250.
[43] A. Özer, G. Akkaya, M. Turabik, Biosorption of Acid Blue 290 (AB 290) and Acid Blue 324 (AB
324) dyes on Spirogyra rhizopus, J .haza. mate. 2006, 135: 355-364.
[44] M. Arami, N.Y. Limaee, N.M. Mahmoodi, N.S. Tabrizi, Equilibrium and kinetics studies for the
adsorption of direct and acid dyes from aqueous solution by soy meal hull, J .haza. mate. 2006,
135: 171-179.
[45] P. Baskaralingam, M. Pulikesi, V. Ramamurthi, S. Sivanesan, Equilibrium studies for the
adsorption of acid dye onto modified hectorite, J .haza. mate. 2006, 136: 989-992.
[46] T.W. Webi, R.K. Chakravort, Pore and solid diffusion models for fixed‐bed adsorbers, AIChE
Journal. 1974, 20: 228-238.
[47] G. McKay, Adsorption of dyestuffs from aqueous solutions with activated carbon I: Equilibrium
and batch contact‐time studies, Journal of Chemical Technology and Biotechnology. 1982, 32:
759-772.
[48] S. Lagergren, Zur theorie der sogenannten adsorption geloster stoffe, Kungliga Svenska
Vetenskapsakademiens, Handlingar. 1898, 1: 1-39.
[49] Y. Ho, G. McKay, A comparison of chemisorption kinetic models applied to pollutant removal on
various sorbents, Process safety and environmental protection,Transactions of the Institution of
Chemical Engineers, part B. 1998, 76: 332-340.
[50] I. Kiran, T. Akar, A.S. Ozcan, A. Ozcan, S. Tunali, Biosorption kinetics and isotherm studies of
Acid Red 57 by dried Cephalosporium aphidicola cells from aqueous solutions, Biochemical
engineering journal. 200, 316: 197-203.

Int. J. Modern Org. Chem. 2013, 2(2): 150-170
Copyright © 2013 by Modern Scientific Press Company, Florida, USA
170
[51] Q. Sun, L. Yang, The adsorption of basic dyes from aqueous solution on modified peat-resin
particle, Water research. 2003, 37: 1535-1544.
[52] B. Hameed, M. El-Khaiary, Kinetics and equilibrium studies of malachite green adsorption on rice
straw-derived char, J .haza. mate. 2008, 153: 701-708.
[53] B. Koumanova, P. Peeva, S. Allen, Variation of intraparticle diffusion parameter during adsorption
of p‐chlorophenol onto activated carbon made from apricot stones, Journal of Chemical
Technology and Biotechnology. 2003, 78: 582-587.
[54] A. Özcan, E.M. Öncü, A.S. Özcan, Adsorption of Acid Blue 193 from aqueous solutions onto
DEDMA-sepiolite, J .haza. mate. 2006, 129: 244-252.
[55] G. Boyd, A. Adamson, L. Myers Jr, The Exchange Adsorption of Ions from Aqueous Solutions by
Organic Zeolites. II. Kinetics1, Journal of the American Chemical Society.1947, 69: 2836-2848.
[56] B. Hameed, A. Ahmad, Batch adsorption of methylene blue from aqueous solution by garlic peel,
an agricultural waste biomass, J .haza. mate. 2009, 164: 870-875.